Water cooled minichannel heat sinks for microprocessor cooling: Effect of fin spacing
Upload
khangminh22Category
view
0download
0
Design Manual for Roads and Bridges
DrainageDesign
CD 526Spacing of road gullies(formerly HA 102/17)
Revision 3
SummaryThis document provides the requirements and advice for determining the length of road that canbe drained by grating and kerb outlets.
Application by Overseeing OrganisationsAny specific requirements for Overseeing Organisations alternative or supplementary to those given in this documentare given in National Application Annexes to this document.
Feedback and EnquiriesUsers of this document are encouraged to raise any enquiries and/or provide feedback on the content and usageof this document to the dedicated Highways England team. The email address for all enquiries and feedback is:[email protected]
This is a controlled document.

CD 526 Revision 3 Contents
Contents
Release notes 3
Foreword 4Publishing information . . . . . . . . . . . . . . . . . . . . . . . . . . . . . . . . . . . . . . . . . . . . . . . . 4Contractual and legal considerations . . . . . . . . . . . . . . . . . . . . . . . . . . . . . . . . . . . . . . . . 4
Introduction 5Background . . . . . . . . . . . . . . . . . . . . . . . . . . . . . . . . . . . . . . . . . . . . . . . . . . . . . . 5Assumptions made in the preparation of this document . . . . . . . . . . . . . . . . . . . . . . . . . . . . . 5
Abbreviations and symbols 6
Terms and definitions 8
1. Scope 9Aspects covered . . . . . . . . . . . . . . . . . . . . . . . . . . . . . . . . . . . . . . . . . . . . . . . . . . . 9Implementation . . . . . . . . . . . . . . . . . . . . . . . . . . . . . . . . . . . . . . . . . . . . . . . . . . . . 9Use of GG 101 . . . . . . . . . . . . . . . . . . . . . . . . . . . . . . . . . . . . . . . . . . . . . . . . . . . . 9
2. Design principles 10
3. Types of gully grating 12
4. Types of kerb inlet 13
5. Factors affecting hydraulic design 16Effect of performance reduction . . . . . . . . . . . . . . . . . . . . . . . . . . . . . . . . . . . . . . . . . . . 16Types of gully . . . . . . . . . . . . . . . . . . . . . . . . . . . . . . . . . . . . . . . . . . . . . . . . . . . . . 16Rainfall . . . . . . . . . . . . . . . . . . . . . . . . . . . . . . . . . . . . . . . . . . . . . . . . . . . . . . . . 17Catchment width . . . . . . . . . . . . . . . . . . . . . . . . . . . . . . . . . . . . . . . . . . . . . . . . . . . 18
6. Normative references 19
7. Informative references 20
Appendix A. Determining the grating type 21A1 Introduction . . . . . . . . . . . . . . . . . . . . . . . . . . . . . . . . . . . . . . . . . . . . . . . . . . . . 21
Appendix B. Use of tables for determining flow capacity of gullies 22B1 Introduction . . . . . . . . . . . . . . . . . . . . . . . . . . . . . . . . . . . . . . . . . . . . . . . . . . . . 22B2 Hydraulic parameters . . . . . . . . . . . . . . . . . . . . . . . . . . . . . . . . . . . . . . . . . . . . . . 22B3 Maximum spacings for gully gratings . . . . . . . . . . . . . . . . . . . . . . . . . . . . . . . . . . . . . . 22B4 Maximum spacings for kerb inlets . . . . . . . . . . . . . . . . . . . . . . . . . . . . . . . . . . . . . . . . 23B5 Terminal gullies . . . . . . . . . . . . . . . . . . . . . . . . . . . . . . . . . . . . . . . . . . . . . . . . . . 23
Appendix C. Use of equations for determining the flow capacity of gullies 25C1 Introduction . . . . . . . . . . . . . . . . . . . . . . . . . . . . . . . . . . . . . . . . . . . . . . . . . . . . 25C2 Flow capacity of kerb channel . . . . . . . . . . . . . . . . . . . . . . . . . . . . . . . . . . . . . . . . . . 25C3 Flow collection efficiency of gully grating . . . . . . . . . . . . . . . . . . . . . . . . . . . . . . . . . . . . 25C4 Maximum design spacing of gully gratings . . . . . . . . . . . . . . . . . . . . . . . . . . . . . . . . . . . 25C5 Flow collection efficiency of kerb inlet . . . . . . . . . . . . . . . . . . . . . . . . . . . . . . . . . . . . . 26C6 Maximum design spacing for kerb inlets . . . . . . . . . . . . . . . . . . . . . . . . . . . . . . . . . . . . 26C7 Effect of longitudinally varying gradient . . . . . . . . . . . . . . . . . . . . . . . . . . . . . . . . . . . . . 26C8 Flow capacity of gully pots . . . . . . . . . . . . . . . . . . . . . . . . . . . . . . . . . . . . . . . . . . . . 27C9 Redesign . . . . . . . . . . . . . . . . . . . . . . . . . . . . . . . . . . . . . . . . . . . . . . . . . . . . . 27
Appendix D. Design tables 28
1

CD 526 Revision 3 Contents
Appendix E. Rainfall depth 65
2

CD 526 Revision 3 Release notes
Release notesVersion Date Details of amendments3 Jan 2020 Revision 3 (January 2020) corrects typographical errors in Equation C.7 in
Appendix C. Revision 2 (October 2019) corrects typographical errors inEquation 5.14.1N2b, B5 1) in Appendix B and Equation C.7 in Appendix C.Revision 1 (October 2018) corrects a number of equation typographic errors inSection 5, Appendix A and Appendix B. It also rectifies an incorrect unit ofmeasure stated in the Symbols table. Revision 0 (August 2018) CD 526replaces HA 102/17. This full document has been re-written to make itcompliant with the new Highways England drafting rules.
3

CD 526 Revision 3 Foreword
Foreword
Publishing informationThis document is published by Highways England.
This document supersedes HA 102/17, which is withdrawn.
Contractual and legal considerationsThis document forms part of the works specification. It does not purport to include all the necessaryprovisions of a contract. Users are responsible for applying all appropriate documents applicable totheir contract.
4

CD 526 Revision 3 Introduction
Introduction
BackgroundThis document sets out the requirements and advice for determining the spacing of road grating andkerb inlets for removing surface water from the carriageway within an acceptable width of channel flow.The research upon which the design methodologies described in Appendix B and C are based isdetailed in HRW SR 533 [Ref 7.I].
Assumptions made in the preparation of this documentThe assumptions made in GG 101 [Ref 4.N] apply to this document.
The limiting factor determining the spacing between road gullies is normally taken to be the inletcapacity of the overlying grating rather than the underlying gully pot or associated pipework. See alsoAppendix C8.
The hydraulic design method in this document assumes that the gap between the kerb and the firstslot(s) of a gully grating is not greater than 50mm.
Road profiling and gradients determine gully locations on roundabouts; refer to CG 501 [Ref 1.N] forfurther information.
5

CD 526 Revision 3 Abbreviations and symbols
Abbreviations and symbols
AbbreviationsAbbreviation Definition
HRW Hydraulics Research Wallingford
TRL Transport Research Laboratory
Symbol Definition
Aa As Adr but for actual rainfall intensity, performance factor and channel roughness (m2)
AdrMaximum area which can be drained by a kerb channel for a rainfall intensity of I = 50mm/hr, a performance factor of m = 1.0, and a channel roughness of n = 0.017 (m2)
Af Cross-sectional area of flow in channel just upstream of grating (m2)
AgArea of smallest rectangle with two sides parallel to kerb that contains all the slots in thegrating (m2)
B Maximum allowable width of flow in channel upstream of grating (m)
Cb Coefficient for grating bar pattern
G Grating parameter (s/m2)
Gd Design value of G for grating type (s/m2)
H Water depth at kerb (m)
I Design rainfall intensity (mm/h)
kn Roughness and grating efficiency factor
kL Kerb inlet length factor
L Length of opening provided by kerb inlet (m)
Li Overall length of opening in kerb provided by angled kerb inlet (m)
m Performance factor
mus Performance factor for upstream grating
N Return period of design storm (years)
n Manning roughness coefficient
p Waterway area as a percentage of grating area (%)
Q Flow rate in channel approaching grating (m3/s)
Qus Flow rate in channel approaching upstream grating (m3/s)
R Hydraulic radius of channel (m)
Sc Crossfall
Si Longitudinal slope at distance Zi from upstream gully (m)
Sp Maximum allowable spacing between adjacent gullies (m)
SL Longitudinal gradient
T Critical storm duration (minutes)
6

CD 526 Revision 3 Abbreviations and symbols
(continued)
Symbol Definition
tg Time for water to travel along kerb to gully grating (minutes)
ts Time for water to travel from furthest point on road surface to kerb (minutes)
V Flow velocity along kerb (m/s)
We Effective catchment width draining to channel (m)
η Flow collection efficiency of grating (%)
ηus Flow collection efficiency of upstream grating (%)
2minM5Rainfall depth occurring at a location in a period of 2 minutes with an average returnperiod of 5 years (mm)
Z Distance between adjacent gullies (m)
Zi Distance from upstream gully measured in downstream direction (m)
7

CD 526 Revision 3 Terms and definitions
Terms and definitions
TermsTerm DefinitionCritical storm duration A storm duration equal to the time of concentration.
FrameFor a gully, the fixed part of the gully top that receives and supports thegrating.
Grating The removable part(s) of a gully top that permits the passage of water tothe gully.
Gully An assembly to receive water for discharge into a drainage system.
Gully pot A device installed below a grating to collect settleable solids and preventthem entering the piped drainage system.
Gully top That part of a gully which is placed on the gully pot.
Intermediate gulliesGullies for which some calculated portion of the approaching flow may bepermitted to continue past the grating, to be picked up by the next gratingdownstream.
Kerb channel The channel formed by the surface of a carriageway and the kerb.
Kerb inlet
Kerb inlets are units that when installed along the line of a kerb provide aseries of openings parallel to the direction of flow and through each ofwhich water can be discharged via a gully pot to the below-ground pipesystem.
Return period The average period between successive exceedances of a specified stormevent.
Surface water channelA triangular or other cross-section channel near the edge of thecarriageway specially constructed to collect and convey water.
Terminal gullies Gullies for which no significant portion of the approaching flow may bepermitted to pass the grating.
Time of concentrationThe sum of the time taken for water to travel from the furthest point on theroad surface to the kerb, and then along the kerb to the gully.
Transverse bars Part of the grating which is at 90º ± 10º to the direction of flow.
Waterway area The total area of all the slots in a grating through which water can pass.
8

CD 526 Revision 3 1. Scope
1. Scope
Aspects covered1.1 The requirements, advice and design methodologies contained within this document shall apply for
determining the spacing of road grating and kerb inlets to the range of longitudinal gradients between0.33% (1/300) and 6.67% (1/15).
1.1.1 The requirements, advice and design methodologies for determining the spacing of road grating andkerb inlets may be extended to a longitudinal gradient of 8.0% (1/12.5) in accordance with HRW SR533 [Ref 7.I].
NOTE 1 Flat longitudinal gradients are unavoidable in some situations and road gullies can offer advantagesover surface water channels in this situation as the gradient to carry road runoff from a gully to anoutfall is not dependent on the gradient of the road.
NOTE 2 For long lengths of flat gradient, grating and kerb outlets do not always provide the optimum drainagesolution.
NOTE 3 Further information on the design of gully spacings for the drainage of level or nearly level roads isgiven in TRL LR602 [Ref 3.I].
NOTE 4 Kerb drainage system having continuous slots or closely-spaced holes that discharge into alongitudinal pipe or channel formed within the kerb unit (combined kerb and drain unit) are outside thescope of this document.
Implementation1.2 This document shall be implemented forthwith on all schemes involving the use of gully gratings and
kerb outlets to remove runoff from the carriageway on the Overseeing Organisations' motorway andall-purpose trunk roads according to the implementation requirements of GG 101 [Ref 4.N].
Use of GG 1011.3 The requirements contained in GG 101 [Ref 4.N] shall be followed in respect of activities covered by
this document.
1.4 Safety risk mitigation measures shall follow the ERIC hierarchy - Eliminate, Reduce, Isolate andControl for each identified safety risk.
9

CD 526 Revision 3 2. Design principles
2. Design principles2.1 The hydraulic design of road gratings and kerb inlets shall fulfil the requirements set out in this section.
2.2 The flow of water parallel to the kerb shall not exceed an allowable flow width (see reference to B inFigures 2.2 and 2.4).
Figure 2.2 Flow width of water against kerb
2.3 When checked for a 1 in 5 year storm as described in CG 501 [Ref 1.N] the allowable flow width B shallnot exceed 1.5m for the hard shoulder or 1.0m for the hard strip.
NOTE An excessive flow width can be a danger to traffic.
2.4 The grating of the gully or kerb inlet shall collect as much of the approaching flow as possible.Efficiency η (%) is expressed as the water flow down the grating or inlet as a percentage of theapproaching flow (Figure 2.4).
10

CD 526 Revision 3 2. Design principles
Figure 2.4 Flow of water along kerb and by-passing gully grating
NOTE Any water not collected flows past the grating, augmenting the flow in the next downstream section.
2.5 No flow shall bypass a terminal gully.
2.6 The overall hydraulic capacity of a system of road gratings and kerb inlets shall capture any water thatby-passes any single grating in the system.
11

CD 526 Revision 3 3. Types of gully grating
3. Types of gully grating3.1 Gully gratings shall comply with the requirements outlined in BS EN 124 [Ref 2.N].
NOTE The hydraulic capacity of a gully grating depends on its overall size, the number and orientation of theslots and the total waterway area provided by the slots.
3.2 Gully gratings shall be rectangular or triangular with one side adjacent to the kerb.
3.2.1 The kerb face of the frame should be hard against the kerb.
3.2.2 The portion of the total waterway area within 50mm of the kerb should not be less than 45 cm2, inaccordance with BS 7903 [Ref 5.I].
NOTE The hydraulic design method in this document assumes that the gap between the kerb and the firstslot(s) of a gully grating is not greater than 50mm.
3.3 Circular gully gratings, and any shapes that are highly asymmetric in a direction transverse to the kerb,shall not be used.
3.4 Grating slots shall be orientated so as not to pose a hazard to cyclists riding over them in the directionof travel.
NOTE BS EN 124 [Ref 2.N] allows grating slots parallel to the kerb which can present a serious hazard tocyclists.
3.5 Classification of gratings shall be determined by the method of calculation in Appendix A, based uponthe geometric characteristics of the grating.
NOTE 1 In order to deal with the large number of possible designs that can be produced, Appendix A sets out amethod of classifying gratings based on their hydraulic characteristics - Types P, Q, R, S or T indecreasing hydraulic capacity. The advantage of this approach is that a grating type can be specifiedduring design, ensuring the required hydraulic performance whatever type of conforming grating ischosen during construction.
NOTE 2 If a manufacturer wishes to carry out hydraulic tests to determine the classification of a grating, asuitable test procedure is described in HRW SR 533 [Ref 7.I].
3.5.1 Where a gully grating is under performing hydraulically, it may be more cost effective to install a moreefficient grating than install an additional gully.
12

CD 526 Revision 3 4. Types of kerb inlet
4. Types of kerb inlet4.1 Kerb inlet covers and frames shall be Class D400 or stronger, in accordance with BS EN 124 [Ref 2.N].
NOTE 1 Kerb inlets tend to have lower flow collection capacity than a gully grating of similar length. This isbecause the lower velocity of flow along a kerb channel limits the proportion of total flow that is able toturn into the opening provided by the kerb inlet.
NOTE 2 A method of increasing the efficiency of a kerb inlet is to create a longer opening parallel to thedirection of flow by recessing the upstream kerb line and setting the kerb inlet at a greater angle to theflow (see Figure 4.1.1).
4.1.1 To prevent flow separating from the recessed section of kerb, the angle β in Figure 4.1.1 should be nogreater than 14º, corresponding to an expansion angle of 1:4.
13

CD 526 Revision 3 4. Types of kerb inlet
Figure 4.1.1 Layout of kerb inlets
4.2 To minimise the risk to errant vehicles, angled kerb inlets of the type shown in Figure 4.1.1 shall only beused where the direction of water flow is opposite to that of the traffic in the carriageway adjacent to the
14

CD 526 Revision 3 4. Types of kerb inlet
kerb.
NOTE Angled kerb inlets can be more prone to blockage. Debris decreases performance and increases therisk of flooding.
15

CD 526 Revision 3 5. Factors affecting hydraulic design
5. Factors affecting hydraulic design5.1 The hydraulic parameters of channels, gratings and inlets shall be evaluated in accordance with this
section before commencing the design procedure.
5.2 An initial assumption about the most suitable grating type (P to T) for a particular scheme shall bemade, and upgraded if it does not prove satisfactory.
5.3 The Manning roughness coefficient of the channel (n) shall be taken as no less than 0.017 for anasphalt surface.
NOTE Values for Manning's n for different drainage channel materials are given in Table 5.3N.
Table 5.3N Values of Manning's n
Surface Condition n
Concrete Average 0.013
Concrete Poor 0.016
Asphalt Average 0.017
Asphalt Poor 0.021
5.4 The location of specific gullies shall first be fixed by the requirements and advice given in this section.
5.4.1 The location and spacing for any intermediate gullies may be determined by the design methods givenin Appendix B and Appendix C.
5.5 Calculations shall commence at the crests or highest point of the scheme and proceed downhill.
NOTE Design storm return periods are given in CG 501 [Ref 1.N].
Effect of performance reduction5.6 A performance factor 'm' shall be included to allow for reduced grating efficiency.
NOTE 1 Reduced efficiency can be caused by the accumulation of debris that reduces the hydraulic area andtherefore the efficiency.
NOTE 2 The performance factor m has a value of 1.0 for no effect, and decreasing values for increasing levelsof risk.
NOTE 3 Values for m are given in Table 5.6N4.
NOTE 4 Site specific characteristics can determine the grating efficiency factor m to be used in the design.
Table 5.6N4 Values of performance factor
Situation Maintenance factor (m)
Baseline condition 1.0
Roads subject to substantial leaf falls or vehiclespillages (e.g. at sharp roundabouts) 0.8
Sag points on road gradients 0.7
Types of gully5.7 The type of gully, intermediate or terminal, shall be determined by the distinction between their two
modes of hydraulic operation.
NOTE 1 Intermediate gullies are those for which some calculated proportion of the approaching flow can bepermitted to continue past the gully, to be picked up by the next gully downstream as shown in Figure2.4. This is known as by-pass flow.
16

CD 526 Revision 3 5. Factors affecting hydraulic design
NOTE 2 Terminal gullies are those for which no significant proportion of the approaching flow is permitted topass the gully, either because there is no downstream gully or because the passing flow will interferewith traffic.
5.8 Gully design shall allow future maintenance to be carried out safely and effectively.
5.9 Gully design shall not affect the safety of cyclists and other road users and will not impact upon trafficflow.
5.10 Gullies shall be located so as not to pose a hazard to users of pedestrian, cycle or equestrian crossings.
5.11 Gullies shall be located so that there is no standing water at pedestrian, cycle or equestrian crossings.
NOTE 1 A particular problem occurs at sag points in gradients, both because floating debris will tend toaccumulate at this point, and because any water not entering a gully at this point cannot pass toanother gully.
NOTE 2 Where the crest along a length of road with changing longitudinal gradient is well defined, a gully is notrequired at this point.
5.11.1 Where there is a slow transition from negative to positive gradient, a gully may be placed at the crest toprevent any ponding of water.
NOTE In cases such as the following it can be beneficial to install an additional upstream gully, designed to actas a terminal gully:
1) Transitions to superelevations.2) A pedestrian, cycle or equestrian crossing.3) For steeply angled road junctions.
5.12 Kerb inlets shall not be used as terminal gullies at sag points unless it is in combination with gratings.
Rainfall5.13 The design rainfall intensity I (mm/h) shall be determined in accordance with the requirements
described in CG 501 [Ref 1.N].
5.13.1 Design rainfall intensity may also be determined from the formula given in CD 521 [Ref 3.N],reproduced below:
Equation 5.13.1
I = 32.7(N − 0.4)0.223{(T − 0.4)0.565
2minM5
T
}NOTE 1 The term 2minM5 describes the depth of rainfall (in mm) falling at a site over a period of 2 minutes, and
with an average return period of 5 years (i.e. an annual exceedance probability of 20%). This is ameasure of the rainfall characteristics at any given site and is reproduced in Figure E.1 in Appendix E.
NOTE 2 Design values of the storm return period are given in CG 501 [Ref 1.N].
NOTE 3 Records indicate East Anglia and the South East experience lower Average Annual Rainfall than otherparts of the UK. However, these regions experience higher intensity and more frequent short durationstorms, particularly during summer months as demonstrated by the 2minM5 values shown in FigureE.1.
NOTE 4 The critical storm duration T (in minutes) is the time of concentration of flow for the area served by thegully.
NOTE 5 The critical storm duration T used for simple modelling purposes is generally recognised as 5 minutes.
NOTE 6 T can be significantly less than 5 minutes for gullies spaced at less than 10m intervals, and withmoderate to severe longitudinal gradients (more than 4%).
17

CD 526 Revision 3 5. Factors affecting hydraulic design
NOTE 7 T can be significantly greater than 5 minutes for gullies spaced at greater than 50m intervals, and withflatter longitudinal gradients (less than 0.5%).
5.14 The value of T shall be checked for the shortest and longest drainage lengths between gullies.
5.14.1 The sum of the time taken for water to travel from the furthest point on the road surface to the kerb, ts,and then along the kerb to the gully, tg, should be approximately equal to T, i.e.:
Equation 5.14.1
T = ts + tg
NOTE 1 A value of ts of 3 minutes is generally recommended. The Wallingford Procedure [Ref 2.I](see section7.10) provides information on non-standard cases.
NOTE 2 For a reasonably uniform gradient, tg (in minutes) can be calculated from the flow velocity, V (in m/s)and gully spacing:
Equation 5.14.1N2a
tg =Sp
60V
Equation 5.14.1N2b
V =2Q
B2Sc
5.14.2 If Equation 5.14.1 shows T to be outside the range 4 to 7 minutes, the design procedure should berepeated using the recalculated value of critical storm duration (T) rounded to the nearest minute.
Catchment width5.15 All paved areas draining to the kerb shall be included in the catchment width.
NOTE Paved areas can include hard shoulders, paved central reserves, footways, emergency refuge areasand maintenance hard-standing. Roof drainage from buildings can also be included where itdischarges to road gullies.
5.15.1 The effective catchment width draining to the kerb channel, We (in m), may be determined from a planarea of the site.
5.16 If the unpaved area exceeds the paved area then the methodology outlined in CD 521 [Ref 3.N] shallbe used to determine the effective catchment width draining to the kerb channel.
5.16.1 Where the unpaved area does not exceed the paved area, it may be accepted that runoff contributionfrom unpaved areas equates to 20% that of an equivalent paved area.
18

CD 526 Revision 3 6. Normative references
6. Normative referencesThe following documents, in whole or in part, are normative references for this document and areindispensable for its application. For dated references, only the edition cited applies. For undatedreferences, the latest edition of the referenced document (including any amendments) applies.
Ref 1.N Highways England. CG 501, 'Design of highway drainage systems'
Ref 2.N BSI. BS EN 124, 'Gully tops and manhole tops for vehicular and pedestrian areas.Definitions, classification, general principles of design, performance requirements andtest methods'
Ref 3.N Highways England. CD 521, 'Hydraulic design of road edge surface water channelsand outlets'
Ref 4.N Highways England. GG 101, 'Introduction to the Design Manual for Roads andBridges'
19

CD 526 Revision 3 7. Informative references
7. Informative referencesThe following documents are informative references for this document and provide supportinginformation.
Ref 1.I British Standards Institution. BS 6367, 'Code of practice for drainage of roofs andpaved areas'
Ref 2.I National Water Council. The Wallingford Procedure, 'Design and analysis of urbanstorm drainage – Volume 1, Principles, methods and practice'
Ref 3.I Transport and Road Research Laboratory. Whiffin, A.C. and Young, C.P.. TRLLR602, 'Drainage of level or nearly level roads'
Ref 4.I British Standards Institute. BS EN 12056, 'Gravity drainage systems inside buildings.Roof drainage, layout and calculation'
Ref 5.I BSI. BS 7903, 'Guide to selection and use of gully tops and manhole covers forinstallation within the highway'
Ref 6.I HR Wallingford. Forty, E.J.. HRW SR 508, 'Performance of gully pots for roaddrainage'
Ref 7.I HR Wallingford. Spaliviero, F., May, R.W.P. and Escarameia, M.. HRW SR 533,'Spacing of road gullies: Hydraulic performance of BS EN 124 gully gratings and kerbinlets'
20

CD 526 Revision 3 Appendix A. Determining the grating type
Appendix A. Determining the grating type
A1 IntroductionWhen determining the grating type, the following three geometrical properties are determined first.
1) The area Ag (in m2) of the smallest rectangle parallel to the kerb that just includes all the slots.
2) The waterway area as a percentage (p) of the grating area Ag.
3) The coefficient Cb determined from Table A1 below.
Bars more than 10mm below the surface of the grating are treated as part of the waterway area whencalculating the value of p. If a grating has a combination of bar alignments, the number of transverseslots and the number of slots with other alignments are calculated. If there are more transverse slotsthan other slots, Cb is be taken as 1.75; otherwise Cb is taken as 1.5.
Table A.1 Grating bar pattern
Grating bar pattern Cb
Transverse bars 1.75
Other bar alignments - (i.e. longitudinal, diagonal and bars curved in plan) 1.5
The category into which a grating falls may then be determined from the value of the grating parameterG (in s/m2):
Equation A.1
G =69Cb(
A0.75g
)√p
The grating type and the corresponding design value Gd of the grating parameter is then determinedfrom Table A2. The value of Gd should be used to calculate the maximum spacing between gullies,rather than the actual value of G from Equation (A.1).
Table A.2 Determination of grating type
Grating type P Q R S T
Range of G (s/m2) <30 30.1 - 45 45.1 - 60 60.1 - 80 80.1 - 110
Design value Gd (s/m2) 30 45 60 80 110
21

CD 526 Revision 3 Appendix B. Use of tables for determining flow capacity ...
Appendix B. Use of tables for determining flow capacity of gullies
B1 IntroductionA series of design tables is given in Appendix D of this document. These can be used, subject to thelimitations indicated, to determine gully spacings with the minimum of calculation.
Alternatively the equations on which they are based are given in Appendix C of this document, andthese equations can be used directly.
It should be noted that the tables refer to spacing of intermediate gullies. The design of terminal gulliesis described at the end of this appendix.
B2 Hydraulic parametersThe following parameters are required:
1) Values of the longitudinal gradient, SL, at points along the length of the scheme (expressed asfractions in the design tables and calculations). For an individual length drained by a gully, SL shouldbe taken as the average gradient over a 3m distance upstream of the gully.
2) The cross-fall, Sc, also expressed as a fraction in the tables and calculations. It is measured 0.5mupstream of the leading edge of the gully and for the maximum permissible width of flow.
3) The Manning roughness coefficient, n.
4) The maximum allowable flow width against the kerb (B in m, see Figure 2.2).
5) The grating type (P, Q, R, S or T), or the size and angle of kerb inlet.
Table D1 in Appendix D can be used to determine the discharge at the kerb immediately upstream ofthe grating if required. For intermediate values of cross-fall and gradient, the flow may be eitherinterpolated or taken as the nearest higher value. For values of n other than 0.017, the flow should bemultiplied by 0.017/n.
B3 Maximum spacings for gully gratingsTables D2 to D6 in Appendix D give the area of road that may be drained (Adr in m2) by an intermediategully for a rainfall intensity of 50mm/h, performance factor m = 1.0, and n = 0.017. Each of tables D2 toD6 corresponds to one of grating types P to T. The actual area (Aa) that can be drained is then given by:
Equation B.1
Aa = Adr
(50
I
)mkn
It is sufficiently accurate, where the grating efficiency η at n = 0.017 is more than about 80%, to set kn to0.017/n. The exact solution is:
Equation B.2
kn =
(0.017n
)−((
1−(
η100
))((0.017n
)2))η
100
The maximum design spacing between adjacent intermediate gratings (Sp in m) is then given by:
22

CD 526 Revision 3 Appendix B. Use of tables for determining flow capacity ...
Equation B.3
Sp =Aa
We
where:
We Effective catchment width
These tables also give the flow collection efficiency η of the grating in % (in brackets). If η is belowabout 60%, the grating is not very efficient, and the design should be reconsidered (see Appendix C).The design method is intended to be applied over a range of η between 100 and 50%. Below 50%, itbecomes increasingly conservative.
Tables D2 to D6 are for intermediate gullies on a uniform gradient, and become inaccurate for gradientswhich vary greatly over short distances. As a general guide, errors become significant if the gradientsbetween adjacent gullies change by more than two of the increments in the tables, and also if thegrating efficiency η is less than 80%. A more accurate calculation for this case is given in Appendix C.
B4 Maximum spacings for kerb inletsValues of the catchment area (Adr in m2) that can be drained by 0.5m long and 1.5m long inlets installedin the line of the kerb are given in tables D7 and D8 respectively. Table D9 applies to the case of a0.5m long inlet installed at angles α=50º and β=14º as shown in Figure 4.1.1; this arrangement isequivalent in performance to an in-line inlet providing a 1.85m long opening in the kerb. The values ofAdr given in the tables assume a rainfall intensity of I = 50 mm/h, a performance factor of m = 1.0 and achannel roughness of n = 0.017. If other values of I or m apply, the actual area, Aa , that can be drainedwill be different from Adr and may be calculated from Equation (B.1). If tables D7 to D9 show that theflow collection efficiency, η, would be less than 60%, the use of either a longer kerb inlet or a suitablegully grating is recommended. For a given length, a gully grating will usually be more efficient than akerb inlet.
The maximum allowable spacing between intermediate kerb inlets, Sp (in m), is calculated fromEquation (B.3) using the value of Aa (in m2) and the effective catchment width, We (in m).
The effect on the allowable drained area and spacing of assuming a different value of channelroughness, n, may be estimated approximately by setting kn in Equation (B.1) to 0.017/n, provided theflow collection efficiency given for n = 0.017 in the appropriate tables D7 to D9 exceeds η = 80%. If theefficiency is lower the more accurate formula given in Equation (B.2) should be used.
The drained areas and spacings for other lengths of kerb inlet may be determined by applying anappropriate factor kL to the values obtained from tables D7 to D9. Firstly the table for which the inletlength, Li1 (in m), is closest to the required length, Li2 (in m) should be chosen. From the table, the flowcollection efficiency, η, corresponding to the length Li1 should be found, and the value of the factor kLcalculated from the formula:
Equation B.4
kL =1.0−
((1.0−
(η
100
))(Li1
Li2
))η
100
kL =The actual drained area (Aa) and the maximum spacing distance (Sp) corresponding to the inletlength Li1 should then be multiplied by the factor kL to find the corresponding values for the requiredinlet length Li2.
B5 Terminal gulliesThe procedure for designing different arrangements of terminal gullies is as follows:
23

CD 526 Revision 3 Appendix B. Use of tables for determining flow capacity ...
1) Single gully at sag point. There will be flow into the gully from both directions. Table D1 or Equation(C.4) are used to determine which direction gives the greater flow. This flow is then doubled, andEquation (C.5) or (C.8) is used to determine the flow collection efficiency η. For effective drainagethis is greater than 95%. The maximum allowable spacings upstream of the gully is then checkedusing Equation (C.6) or (C.7).
2) Twin gullies at sag point (the more efficient arrangement, possibly requiring fewer gullies upstream).Use the tables or equations to determine the design spacing and η for each gully. η will be greaterthan 95% for both gullies.
3) Other terminal gullies (where it is not desirable for the flow to bypass the grating) The designspacing upstream of the gully should be determined from the tables or equations. To avoidexcessive flow past the gully, η should be greater than 95%.
24

CD 526 Revision 3 Appendix C. Use of equations for determining the flow ca...
Appendix C. Use of equations for determining the flow capacity of gullies
C1 IntroductionAppendix C describes the equations used in the design procedure described in this document. Theywere used in compiling the design tables in Appendix D, and may also be used for direct calculation ofgully spacings. These equations may readily be programmed, and in this form are very easy to use forexploring the effects of changing the drainage parameters.
C2 Flow capacity of kerb channelThe water depth against the kerb (H, in m) as shown in Figure 2.2 is given by:
Equation C.1
H = BSc
The cross-sectional area of flow, Af (in m2), just upstream of the grating is given by:
Equation C.2
Af =BH
2
The hydraulic radius of the channel, R (in m), is given by:
Equation C.3
R =Af
H +√B2 +H2
The flow rate, Q (in m3/s) approaching the grating is calculated from Manning's equation:
Equation C.4
Q =AfR
23S
12L
n
C3 Flow collection efficiency of gully gratingThe flow collection efficiency, η (in %) is given by:
Equation C.5
η = 100−Gd
(Q
H
)Gd is the grating parameter and its value is determined by the grating type - see Appendix A.
The acceptable range of values for η is discussed in Appendix B3.
C4 Maximum design spacing of gully gratingsFor intermediate gratings along a uniform longitudinal gradient, the maximum allowable spacingbetween adjacent gratings (Sp) may be calculated from the equation:
25
CD 526 Revision 3 Appendix C. Use of equations for determining the flow ca...
Equation C.6
Sp =
(3.6 · 106Qmη
100
)WeI
For non-uniform gradients, the grating spacings are calculated going downstream for each pair ofgratings, and Equation (C.6) is replaced by:
Equation C.7
Sp =3.6 · 106
[Q−Qus
(1− musηus
100
)]WeI
where Qus, mus and ηus refer to the upstream grating. Calculations using this equation shouldcommence at the upstream end. If the upstream end is at the top of a crest with no gully, Qus becomeszero.
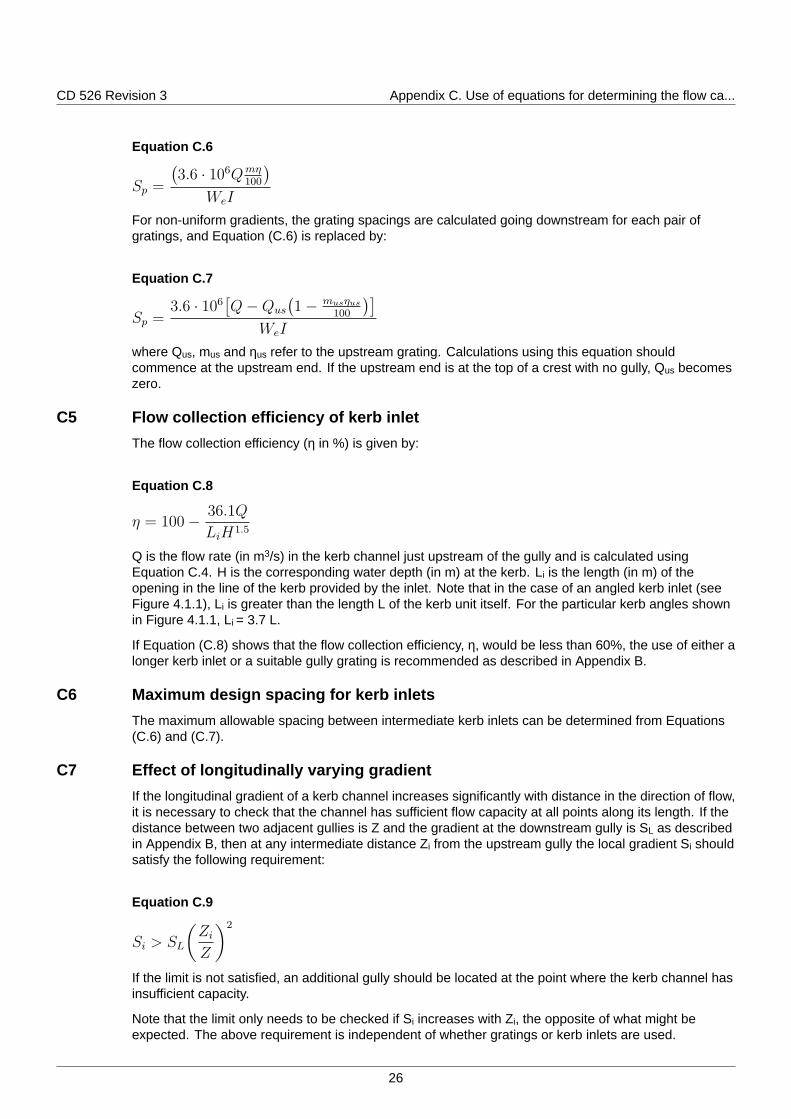
C5 Flow collection efficiency of kerb inletThe flow collection efficiency (η in %) is given by:
Equation C.8
η = 100− 36.1Q
LiH1.5
Q is the flow rate (in m3/s) in the kerb channel just upstream of the gully and is calculated usingEquation C.4. H is the corresponding water depth (in m) at the kerb. Li is the length (in m) of theopening in the line of the kerb provided by the inlet. Note that in the case of an angled kerb inlet (seeFigure 4.1.1), Li is greater than the length L of the kerb unit itself. For the particular kerb angles shownin Figure 4.1.1, Li = 3.7 L.
If Equation (C.8) shows that the flow collection efficiency, η, would be less than 60%, the use of either alonger kerb inlet or a suitable gully grating is recommended as described in Appendix B.
C6 Maximum design spacing for kerb inletsThe maximum allowable spacing between intermediate kerb inlets can be determined from Equations(C.6) and (C.7).
C7 Effect of longitudinally varying gradientIf the longitudinal gradient of a kerb channel increases significantly with distance in the direction of flow,it is necessary to check that the channel has sufficient flow capacity at all points along its length. If thedistance between two adjacent gullies is Z and the gradient at the downstream gully is SL as describedin Appendix B, then at any intermediate distance Zi from the upstream gully the local gradient Si shouldsatisfy the following requirement:
Equation C.9
Si > SL
(Zi
Z
)2
If the limit is not satisfied, an additional gully should be located at the point where the kerb channel hasinsufficient capacity.
Note that the limit only needs to be checked if Si increases with Zi, the opposite of what might beexpected. The above requirement is independent of whether gratings or kerb inlets are used.
26

CD 526 Revision 3 Appendix C. Use of equations for determining the flow ca...
C8 Flow capacity of gully potsOn steeper sections of road, the maximum allowable spacing between gullies may not be determinedby the collection efficiency of the grating but by the flow capacity of the gully pot beneath it.Experimental tests in HRW SR 508 [Ref 6.I] indicate that the maximum flow rate that can be acceptedby a gully pot without surcharge is about 10 litres/s if the outlet pipe has a diameter of 100mm, and 15litres/s if it has a diameter of 150mm. Table D1 in Appendix D gives estimated discharges at the kerb,under a rainfall intensity of 50 mm/h, for combinations of flow width, crossfall and longitudinal gradient.
C9 RedesignThe design gully spacings determined from the design tables in Appendix C or by calculation are themaximum spacings: good practice would aim to reduce this distance. If the design shows the gullyspacing or grating efficiency to be inadequate for the scheme, then redesign using one or more of thefollowing options.
1) If the grating efficiency η is less than about 80% for an intermediate gully, the most effective solutionis likely to be redesign with an improved grating type.
2) If the grating efficiency η of a terminal grating is less than 95%, redesign is essential. The first stepshould be to redesign with an improved grating type. If the required efficiency is still not achieved,the permitted width of kerb flow B should be replaced by a lesser design width. This will have theeffect of reducing the design flow approaching the grating and increasing the grating efficiency, butmay require the use of additional intermediate gullies.
Alternatively it may be more practical to adjust other parameters , e.g. changes in the road profile or thecatchment width.
27

CD 526 Revision 3 Appendix D. Design tables
Appendix D. Design tablesThe following tables are derived from research, see HRW SR 533 [Ref 7.I].
28

CD526
Revision
3Appendix
D.D
esigntables
Table D.1 Discharge at the kerb in litres/s
Flow width (B in m)Crossfall %(Sc) Gradient %(SL)
0.5 0.75 1 1.5
1.67%(1/60)
0.33% (1/300)0.67% (1/150)1.0% (1/100)1.33% (1/80)1.67% (1/60)2.0% (1/50)2.5% (1/40)3.33% (1/30)5.0% (1/20)6.67% (1/15)
0.180.260.310.350.410.440.500.570.700.81
0.530.760.931.031.191.311.461.692.072.39
1.151.631.992.232.572.823.153.644.465.14
3.394.805.876.577.588.319.2910.7313.1415.17
2.0%(1/50)
0.33% (1/300)0.67% (1/150)1.0% (1/100)1.33% (1/80)1.67% (1/60)2.0% (1/50)2.5% (1/40)3.33% (1/30)5.0% (1/20)6.67% (1/15)
0.240.350.420.470.550.600.670.770.951.10
0.721.021.251.401.621.771.982.282.803.23
1.562.202.693.013.483.814.264.926.026.96
4.596.497.948.8810.2511.2312.5614.5017.7620.51
2.5%(1/40)
0.33% (1/300)0.67% (1/150)1.0% (1/100)1.33% (1/80)1.67% (1/60)2.0% (1/50)2.5% (1/40)3.33% (1/30)5.0% (1/20)6.67% (1/15)
0.350.500.610.690.790.870.971.121.371.58
1.041.481.812.022.332.562.863.304.044.67
2.253.183.894.355.035.516.167.118.7110.06
6.639.3811.4812.8414.8316.2418.1620.9725.6829.65
29

CD526
Revision
3Appendix
D.D
esigntables
Table D.1 Discharge at the kerb in litres/s (continued)
Flow width (B in m)Crossfall %(Sc) Gradient %(SL)
0.5 0.75 1 1.5
3.33%(1/30)
0.33% (1/300)0.67% (1/150)1.0% (1/100)1.33% (1/80)1.67% (1/60)2.0% (1/50)2.5% (1/40)3.33% (1/30)5.0% (1/20)6.67% (1/15)
0.570.800.991.101.271.391.561.802.202.54
1.682.372.913.253.754.114.595.306.507.50
3.615.116.266.998.088.859.8911.4213.9916.15
10.6515.0618.4520.6223.8126.0929.1733.6841.2547.63
4.0%(1/25)
0.33% (1/300)0.67% (1/150)1.0% (1/100)1.33% (1/80)1.67% (1/60)2.0% (1/50)2.5% (1/40)3.33% (1/30)5.0% (1/20)6.67% (1/15)
0.771.091.331.491.721.882.102.432.973.43
2.263.203.924.385.065.546.207.168.7610.12
4.876.898.449.4410.9011.9413.3515.4118.8721.79
14.3720.3224.8827.8232.1335.1939.3545.4355.6464.25
5.0%(1/20)
0.33% (1/300)0.67% (1/150)1.0% (1/100)1.33% (1/80)1.67% (1/60)2.0% (1/50)2.5% (1/40)3.33% (1/30)5.0% (1/20)6.67% (1/15)
1.111.561.922.142.472.713.033.504.284.95
3.264.615.656.317.297.998.9310.3112.6314.58
7.029.9312.1613.6015.7017.2019.2322.2027.1931.40
20.7029.2835.8640.0946.2950.7156.6965.4680.1892.58
30

CD526
Revision
3Appendix
D.D
esigntables
Table D.1 Discharge at the kerb in litres/s (continued)
Flow width (B in m)Crossfall %(Sc) Gradient %(SL)
0.5 0.75 1 1.5
6.67%(1/15)
0.33% (1/300)0.67% (1/150)1.0% (1/100)1.33% (1/80)1.67% (1/60)2.0% (1/50)2.5% (1/40)3.33% (1/30)5.0% (1/20)6.67% (1/15)
1.772.503.063.423.954.334.845.596.847.90
5.217.379.0210.0911.6512.7614.2616.4720.1723.29
11.2215.8619.4321.7225.0827.4730.7235.4743.4450.16
33.0746.7757.2864.0473.9481.0090.56104.57128.07147.89
31

CD 526 Revision 3 Appendix D. Design tables
Manning's coefficient is n = 0.017.
For other values of Manning's n, multiply the discharge by (0.017/n)
32

CD526
Revision
3Appendix
D.D
esigntables
Table D.2 Type P
Flow width (B in m)Crossfall (Sc) Gradient % (SL)
0.5 0.75 1.0 1.5
1.67%(1/60)
0.33%(1/300)0.67%(1/150)1.0% (1/100)1.33%(1/80)1.67%(1/60)2.0%(1/50)2.5%(1/40)3.33%(1/30)5.0%(1/20)6.67%(1/15)
13182225293135404957
(99)(99)(99)(99)(99)(98)(98)(98)(97)(97)
385365738491102117142162
(99)(98)(98)(98)(97)(97)(96)(96)(95)(94)
81114138154177193214245295336
(98)(97)(96)(96)(95)(95)(94)(93)(92)(91)
234325393436496539594673797893
(96)(94)(93)(92)(91)(90)(94)(87)(84)(82)
2.0%(1/50)
0.33%(1/300)0.67%(1/150)1.0%(1/100)1.33%(1/80)1.67%(1/60)2.0%(1/50)2.5%(1/40)3.33%(1/30)5.0%(1/20)6.67%(1/15)
18253034394247546676
(99)(99)(99)(99)(98)(98)(98)(98)(97)(97)
51728898113123137157190218
(99)(98)(97)(97)(97)(96)(96)(95)(94)(94)
109153186207237259287328395449
(98)(97)(96)(95)(95)(94)(94)(93)(91)(90)
31543752658366371879189310521174
(95)(94)(92)(91)(90)(89)(87)(85)(82)(79)
2.5%(1/40)
0.33%(1/300)0.67% (1/150)1.0% (1/100)1.33% (1/80)1.67% (1/60)2.0% (1/50)2.5% (1/40)3.33% (1/30)5.0% (1/20)6.67%( 1/15)
253644495661687896110
(99)(99)(99)(98)(98)(98)(98)(97)(97)(96)
74104126141162177196225272311
(98)(98)(97)(97)(96)(96)(95)(95)(94)(93)
158220267297340370411468562637
(97)(96)(95)(95)(94)(93)(93)(91)(90)(88)
45262475182994110171117125614691628
(95)(92)(91)(90)(88)(87)(85)(83)(79)(76)
33

CD526
Revision
3Appendix
D.D
esigntables
Table D.2 Type P (continued)
Flow width (B in m)Crossfall (Sc) Gradient % (SL)
0.5 0.75 1.0 1.5
3.33%(1/30)
0.33% (1/300)0.67% (1/150)1.0% (1/100)1.33% (1/80)1.67% (1/60)2.0% (1/50)2.5% (1/40)3.33% (1/30)5.0% (1/20)6.67% (1/15)
415770788998109125152175
(99)(99)(98)(98)(98)(97)(97)(97)(96)(95)
118166202225258281312358431491
(98)(97)(97)(96)(95)(95)(94)(94)(92)(91)
252351425472539586649738880994
(97)(95)(94)(94)(93)(92)(91)(90)(87)(85)
71898611811301147015841732193522352449
(94)(91)(89)(88)(86)(84)(83)(80)(75)(71)
4.0%(1/25)
0.33% (1/300)0.67% (1/150)1.0% (1/100)1.33% (1/80)1.67% (1/60)2.0% (1/50)2.5% (1/40)3.33% (1/30)5.0% (1/20)6.67% (1/15)
557794105120132147168204234
(99)(98)(98)(98)(97)(97)(97)(96)(96)(95)
159223271302346377419478576655
(98)(97)(96)(96)(95)(94)(94)(93)(91)(90)
33847156963172078286598111671313
(96)(95)(94)(93)(92)(91)(90)(88)(86)(84)
960131415691725194220882276252828923140
(93)(90)(88)(86)(84)(82)(80)(77)(72)(68)
5.0%(1/20)
0.33% (1/300)0.67% 1/150)1.0% (1/100)1.33% (1/80)1.67% (1/60)2.0% (1/50)2.5% (1/40)3.33% (1/30)5.0% (1/20)6.67% (1/15)
79110135150173189210241293335
(99)(98)(98)(97)(97)(97)(96)(96)(95)(94)
229320388432494538597681817927
(97)(96)(95)(95)(94)(94)(93)(92)(90)(88)
484672812899102411111225138616381835
(96)(94)(93)(92)(91)(90)(88)(87)(84)(81)
1367186122112423271629103156347939214197
(92)(88)(86)(84)(81)(80)(77)(74)(68)(63)
34

CD526
Revision
3Appendix
D.D
esigntables
Table D.2 Type P (continued)
Flow width (B in m)Crossfall (Sc) Gradient % (SL)
0.5 0.75 1.0 1.5
6.67%(1/15)
0.33% (1/300)0.67% (1/150)1.0% (1/100)1.33% (1/80)1.67% (1/60)2.0% (1/50)2.5% (1/40)3.33% (1/30)5.0% (1/20)6.67% (1/15)
125176214239274299333382462528
(98)(98)(97)(97)(96)(96)(96)(95)(94)(93)
363507614682780848939106912761443
(97)(96)(95)(94)(93)(92)(91)(90)(88)(86)
767106112761411160217341906214625162796
(95)(93)(91)(90)(89)(88)(86)(84)(80)(77)
2145289534153725414344154749516756785924
(90)(86)(83)(81)(78)(76)(73)(69)(62)(56)
35

CD 526 Revision 3 Appendix D. Design tables
Drained area of road in m2 under a rainfall intensity of 50mm/h and collection efficiency in % (inbrackets)
Manning's coefficient is n = 0.017.
For others values of rainfall intensity I, multiply the area by (50/I).
36

CD526
Revision
3Appendix
D.D
esigntables
Table D.3 Type Q
Flow width (B in m)Crossfall (Sc) Gradient % (SL)
0.5 0.75 1.0 1.5
1.67% (1/60)
0.33%(1/300)0.67% (1/150)1.0% (1/100)1.33% (1/80)1.67% (1/60)2.0% (1/50)2.5% (1/40)3.33% (1/30)5.0% (1/20)6.67% (1/15)
13182225293135404956
(99)(99)(98)(98)(98)(98)(97)(97)(96)(96)
385364728290100114138157
(98)(97)(97)(96)(96)(95)(95)(94)(93)(91)
80112136151172187208236282319
(97)(96)(95)(94)(93)(92)(91)(90)(88)(86)
229316378417472509557623722794
(94)(91)(89)(88)(86)(85)(83)(81)(76)(73)
2.0%(1/50)
0.33% (1/300)0.67% (1/150)1.0% (1/100)1.33% (1/80)1.67% (1/60)2.0% (1/50)2.5% (1/40)3.33% (1/30)5.0% (1/20)6.67% (1/15)
17253033384247546575
(99)(98)(98)(98)(98)(97)(97)(97)(96)(95)
51718796111121134153185210
(98)(97)(96)(96)(95)(95)(94)(93)(92)(90)
108151182202231251277315375422
(97)(95)(94)(93)(92)(91)(90)(89)(86)(84)
3074225045546256737348179381022
(93)(90)(88)(87)(85)(83)(81)(78)(73)(69)
2.5%(1/40)
0.33%(1/300)0.67% (1/150)1.0% (1/100)1.33% (1/80)1.67% (1/60)2.0% (1/50)2.5% (1/40)3.33% (1/30)5.0% (1/20)6.67% (1/15)
253543485561677794108
(99)(98)(98)(98)(97)(97)(97)(96)(95)(94)
73103125139159173192219263299
(97)(96)(96)(95)(94)(94)(93)(92)(90)(89)
155216261289329357394446529593
(96)(94)(93)(92)(91)(90)(89)(87)(84)(82)
4395997137828789411022113012791375
(92)(89)(86)(85)(82)(81)(78)(75)(69)(64)
37

CD526
Revision
3Appendix
D.D
esigntables
Table D.3 Type Q (continued)
Flow width (B in m)Crossfall (Sc) Gradient % (SL)
0.5 0.75 1.0 1.5
3.33%(1/30)
0.33%(1/300)0.67% (1/150)1.0% (1/100)1.33% (1/80)1.67% (1/60)2.0% (1/50)2.5% (1/40)3.33% (1/30)5.0% (1/20)6.67% (1/15)
405769778897107123149171
(98)(98)(97)(97)(97)(96)(96)(95)(94)(93)
117163198220252274303345413467
(97)(96)(95)(94)(93)(93)(92)(90)(88)(86)
247342412456518561617696817909
(95)(93)(92)(91)(89)(88)(87)(85)(81)(78)
69393711081209134714371549169018671959
(90)(86)(83)(81)(79)(77)(74)(70)(63)(57)
4.0%(1/25)
0.33%(1/300)0.67% (1/150)1.0% (1/100)1.33% (1/80)1.67% (1/60)2.0% (1/50)2.5% (1/40)3.33% (1/30)5.0% (1/20)6.67% (1/15)
547693103119130144165200228
(98)(98)(97)(97)(96)(96)(95)(95)(93)(92)
157219266295337366405460548618
(97)(95)(94)(93)(92)(92)(91)(89)(87)(85)
33245855060768874481791710701184
(95)(92)(91)(89)(88)(87)(85)(83)(79)(75)
923124014571585175618651997215723342397
(89)(85)(81)(79)(76)(74)(70)(66)(58)(52)
5.0%(1/20)
0.33% (1/300)0.67% (1/150)1.0% (1/100)1.33% (1/80)1.67% (1/60)2.0% (1/50)2.5% (1/40)3.33% (1/30)5.0% (1/20)6.67% (1/15)
78109133148170186206236285324
(98)(97)(97)(96)(96)(95)(95)(94)(92)(91)
226314379420479520574650771866
(96)(94)(93)(92)(91)(90)(89)(88)(85)(83)
47465178085997110471145127914791622
(94)(91)(89)(88)(86)(85)(83)(80)(76)(72)
130517382026219224072540269328622996Not eff.
(88)(82)(78)(76)(72)(70)(66)(61)(52)(44)
38

CD526
Revision
3Appendix
D.D
esigntables
Table D.3 Type Q (continued)
Flow width (B in m)Crossfall (Sc) Gradient % (SL)
0.5 0.75 1.0 1.5
6.67%(1/15)
0.33% (1/300)0.67%(1/150)1.0% (1/100)1.33% (1/80)1.67% (1/60)2.0% (1/50)2.5% (1/40)3.33% (1/30)5.0% (1/20)6.67% (1/15)
124174211235269293326372447508
(98)(97)(96)(95)(95)(94)(93)(92)(91)(89)
357496597660751813895101011891325
(95)(93)(92)(91)(90)(89)(87)(85)(82)(79)
746102012151335150016111753194222112389
(92)(89)(87)(85)(83)(81)(79)(76)(71)(66)
20272659306132823552370638633986Not eff.
(85)(79)(74)(71)(67)(64)(59)(53)(42)
39

CD 526 Revision 3 Appendix D. Design tables
Drained area of road in m2 under a rainfall intensity of 50mm/h and collection efficiency in % (inbrackets)
Manning's coefficient is n = 0.017.
For others values of rainfall intensity I, multiply the area by (50/I).
40

CD526
Revision
3Appendix
D.D
esigntables
Table D.4 Type R
Flow width (B in m)Crossfall(Sc)
Gradient(SL) 0.5 0.75 1.0 1.5
1.67%(1/60)
0.33% (1/300)0.67%(1/150)1.0% (1/100)1.33% (1/80)1.67% (1/60)2.0% (1/50)2.5% (1/40)3.33% (1/30)5.0% (1/20)6.67% (1/15)
13182225283134404855
37526471818898112134152
(97)(96)(96)(95)(94)(94)(93)(92)(90)(89)
79110133148168182201228269302
(96)(94)(93)(92)(91)(90)(89)(87)(84)(81)
224306363398447479520573648695
(92)(88)(86)(84)(82)(80)(78)(74)(68)(64)
2.0%(1/50)
0.33% (1/300)0.67% (1/150)1.0% (1/100)1.33% (1/80)1.67% (1/60)2.0% (1/50)2.5% (1/40)3.33% (1/30)5.0% (1/20)6.67% (1/15)
17243033384246536474
51718695109118131149179203
(97)(96)(95)(94)(94)(93)(92)(91)(89)(87)
107148178197224243268302355396
(95)(93)(92)(91)(90)(89)(87)(85)(82)(79)
300406481526587627677741825871
(91)(87)(84)(82)(79)(78)(75)(71)(64)(59)
2.5%(1/40)
0.33% (1/300)0.67% (1/150)1.0% (1/100)1.33% (1/80)1.67% (1/60)2.0% (1/50)2.5% (1/40)3.33% (1/30)5.0% (1/20)6.67% (1/15)
253543485560677692105
73101123136156169187213253286
(97)(95)(94)(94)(93)(92)(91)(89)(87)(85)
153211254281318344378425496549
(95)(92)(91)(90)(88)(87)(85)(83)(79)(76)
427574675735814865928100310891122
(89)(85)(82)(79)(76)(74)(71)(66)(59)(53)
41

CD526
Revision
3Appendix
D.D
esigntables
Table D.4 Type R (continued)
Flow width (B in m)Crossfall(Sc)
Gradient(SL) 0.5 0.75 1.0 1.5
3.33%(1/30)
0.33% (1/300)0.67% (1/150)1.0% (1/100)1.33% (1/80)1.67% (1/60)2.0% (1/50)2.5% (1/40)3.33% (1/30)5.0% (1/20)6.67% (1/15)
405668768795106121146166
16161195216246267294333395443
(96)(94)(93)(92)(91)(90)(89)(87)(84)(82)
243334400440497536585653754825
(93)(91)(89)(87)(85)(84)(82)(79)(75)(71)
6698881034111712251290136514451500Not eff.
(87)(82)(78)(75)(71)(69)(65(60)(51)(43)
4.0%(1/25)
0.33% (1/300)0.67% (1/150)1.0% (1/100)1.33% (1/80)1.67% (1/60)2.0% (1/50)2.5% (1/40)3.33% (1/30)5.0% (1/20)6.67% (1/15)
47692102117128142162195222
156216260288327355391441520581
(95)(94)(92)(91)(90)(89)(88)(86)(82)(80)
3254455315836567067698539741056
(93)(90)(87)(86)(84)(82)(80)(77)(72)(67)
8861166134614461570164217181785Not eff.
(86)(80)(75)(72)(68)(65)(61)(55)(44)
5.0%(1/20)
0.33%(1/300)0.67% (1/150)1.0% (1/100)1.33% (1/80)1.67% (1/60)2.0% (1/50)2.5% (1/40)3.33% (1/30)5.0% (1/20)6.67% (1/15)
78108132146167182202231277314
222307370409464502551620725805
(95)(93)(91)(90)(88)(87)(86)(84)(80)(77)
4636307488199179831065117313191409
(92)(88)(85)(84)(81)(79)(77)(73)(67)(62)
1244161418411961209921702231Not eff.
(83)(77)(71)(68)(63)(59)(55)(48)
42

CD526
Revision
3Appendix
D.D
esigntables
Table D.4 Type R (continued)
Flow width (B in m)Crossfall(Sc)
Gradient(SL) 0.5 0.75 1.0 1.5
6.67%(1/15)
0.33% (1/300)0.33%(1/300)0.67% (1/150)1.0% (1/100)1.33% (1/80)1.67% (1/60)2.0% (1/50)2.5% (1/40)3.33% (1/30)5.0% (1/20)6.67% (1/15)
123172208231264287318362432488
35248357963872177885195111011208
(94)(91)(89)(88)(86)(85)(83)(80)(76)(72)
72697911541258139814891600173919051981
(90)(86)(83)(80)(77)(75)(72)(68)(61)(55)
190924222707283929622998Not eff.
(80)(72)(66)(62)(56)(51)(46)
43

CD 526 Revision 3 Appendix D. Design tables
Drained area of road in m2 under a rainfall intensity of 50mm/h and collection efficiency in % (inbrackets)
Manning's coefficient is n = 0.017.
For others values of rainfall intensity I, multiply the area by (50/I).
44

CD526
Revision
3Appendix
D.D
esigntables
Table D.5 Type S
Flow width (B in m)Crossfall(Sc)
Gradient(SL) 0.5 0.75 1.0 1.5
1.67% (1/60) 0.33%(1/300)0.67%(1/150)1.0% (1/100)1.33% (1/80)1.67% (1/60)2.0% (1/50)2.5% (1/40)3.33% (1/30)5.0% (1/20)6.67% (1/15)
13182224283134394754
(98)(98)(97)(97)(96)(96)(95)(94)(93)(92)
37526370798695108129146
(97)(95)(94)(93)(92)(92)(91)(89)(87)(85)
78108130143162175193216252279
(94)(92)(90)(89)(88)(86)(85)(83)(79)(75)
218292343374414439470507548562
(89)(85)(81)(79)(76)(73)(70)(66)(58)(51)
2.0%2.0%(150) 0.33%(1/300)0.67% (1/150)1.0% (1/100)1.33% (1/80)1.67% (1/60)2.0% (1/50)2.5% (1/40)3.33% (1/30)5.0% (1/20)6.67% (1/15)
17243033384146526372
(98)(97)(97)(96)(96)(95)(95)(94)(92)(91)
50708493106115127144171193
(96)(95)(93)(93)(91)(91)(89)(88)(85)(83)
105144173191216233254284329361
(94)(91)(89)(88)(86)(85)(83)(80)(76)(72)
290386451488536567601640673
Not eff.
(88)(83)(79)(76)(73)(70)(67)(61)(53)(45)
2.5%(1/40) 0.33%(1/300)0.67% (1/150)1.0% (1/100)1.33% (1/80)1.67% (1/60)2.0% (1/50)2.5% (1/40)3.33% (1/30)5.0% (1/20)6.67% (1/15)
253542475459657590102
(98)(97)(96)(96)(95)(94)(94)(93)(91)(90)
72100120133151164181204241269
(96)(94)(92)(91)(90)(89)(88)(86)(83)(80)
150206245270304327356395452491
(93)(90)(88)(86)(84)(82)(80)(77)(72)(68)
410540624671730764801834
Not eff.
(86)(80)(76)(73)(68)(65)(61)(55)(45)
45

CD526
Revision
3Appendix
D.D
esigntables
Table D.5 Type S (continued)
Flow width (B in m)Crossfall(Sc)
Gradient(SL) 0.5 0.75 1.0 1.5
3.33%(1/30) 0.33% (1/300)0.67% (1/150)1.0% (1/100)1.33% (1/80)1.67% (1/60)2.0% (1/50)2.5% (1/40)3.33% (1/30)5.0% (1/20)6.67% (1/15)
405668758694104118142161
(97)(96)(95)(95)(94)(93)(93)(91)(89)(88)
114158190210238257282317370410
(95)(92)(91)(90)(88)(87)(85)(83)(79)(76)
238323383419469502543597669712
(91)(88)(85)(83)(81)(79)(76)(73)(66)(61)
636823936995106110941120Not eff.
(83)(76)(70)(67)(62)(58)(53)(46)
4.0%(1/25) 0.33% (1/300)0.67% (1/150)1.0% (1/100)1.33% (1/80)1.67% (1/60)2.0% (1/50)2.5% (1/40)3.33% (1/30)5.0% (1/20)6.67% (1/15)
547591101115125139158189213
(97)(96)(95)(94)(93)(92)(92)(90)(88)(86)
153211253279315340372417484532
(94)(91)(90)(88)(87)(85)(83)(81)(77)(73)
317428505551614654704768846885
(90)(86)(83)(81)(78)(76)(73)(69)(62)(56)
83610671197126013221345Not eff.
(81)(73)(67)(63)(57)(53)(48)
5.0%(1/20) 0.33% (1/300)0.67% (1/150)1.0% (1/100)1.33% (1/80)1.67% (1/60)2.0% (1/50)2.5% (1/40)3.33% (1/30)5.0% (1/20)6.67% (1/15)
77107129144164178197224266300
(96)(95)(94)(93)(92)(91)(90)(89)(86)(84)
218299358393443477520579664723
(93)(90)(88)(87)(84)(83)(81)(78)(73)(69)
44960170576684689895910311106Not eff.
(89)(84)(81)(78)(75)(72)(69)(64)(56)(50)
11611450159416521687Not eff.
(78)(69)(62)(57)(51)(46)
46

CD526
Revision
3Appendix
D.D
esigntables
Table D.5 Type S (continued)
Flow width (B in m)Crossfall(Sc)
Gradient(SL) 0.5 0.75 1.0 1.5
6.67%(1/15) 0.33% (1/300)0.67% (1/150)1.0% (1/100)1.33% (1/80)1.67% (1/60)2.0% (1/50)2.5% (1/40)3.33% (1/30)5.0% (1/20)6.67% (1/15)
122169204226257279308348412461
(96)(94)(93)(92)(91)(90)(88)(87)(84)(81)
3444685566096827317938739841052
(92)(88)(86)(84)(81)(80)(77)(74)(68)(63)
699925107311561262132613961467Not eff.
(87)(81)(77)(74)(70)(67)(63)(57)(48)
175121072234Not eff.
(74)(63)(54)(49)
47

CD 526 Revision 3 Appendix D. Design tables
Drained area of road in m2 under a rainfall intensity of 50mm/h and collection efficiency in % (inbrackets)
Manning's coefficient is n = 0.017.
For others values of rainfall intensity I, multiply the area by (50/I).
48

CD526
Revision
3Appendix
D.D
esigntables
Table D.6 Type T
Flow width (B in m)Cross fall (Sc)
Gradient(SL) 0.5 0.75 1.0 1.5
1.67% (1/60)
0.33%(1/300)0.67% (1/150)1.0% (1/100)1.33% (1/80)1.67% (1/60)2.0% (1/50)2.5% (1/40)3.33% (1/30)5.0% (1/20)6.67% (1/15)
13182224283033384652
(98)(97)(96)(95)(95)(94)(93)(92)(91)(89)
37516168778392104122136
(95)(93)(92)(91)(89)(88)(87)(85)(82)(79)
77105125137154165180199226245
(92)(89)(87)(85)(83)(81)(79)(76)(71)(66)
208272314336364380395408
Not eff.
(85)(79)(74)(71)(67)(63)(59)(53)(42)
2.0%2.0%(1/50)
0.33%(1/300)0.67% (1/150)1.0% (1/100)1.33% (1/80)1.67% (1/60)2.0% (1/50)2.5% (1/40)3.33% (1/30)5.0% (1/20)6.67% (1/15)
17242932374045516169
(97)(96)(95)(95)(94)(93)(93)(91)(90)(88)
49688290103111122137160177
(95)(93)(91)(90)(88)(87)(85)(83)(79)(76)
102139165181203217235258290309
(91)(88)(85)(83)(81)(79)(77)(73)(67)(62)
275356405431461476488
Not eff.
(83)(76)(71)(67)(62)(59)(54)(47)
2.5%(1/40)
0.33%(1/300)0.67% (1/150)1.0% (1/100)1.33% (1/80)1.67% (1/60)2.0% (1/50)2.5% (1/40)3.33% (1/30)5.0% (1/20)6.67% (1/15)
25344246535864738798
(97)(96)(95)(94)(93)(92)(91)(90)(88)(86)
7197116128145157171192222244
(94)(91)(89)(88)(86)(85)(83)(81)(76)(73)
146197232253282300323352387404
(90)(86)(83)(81)(78)(76)(73)(69)(62)(56)
385489548576603612
Not eff.
(81)(72)(66)(62)(57)(52)(47)
49

CD526
Revision
3Appendix
D.D
esigntables
Table D.6 Type T (continued)
3.33%(1/30)
0.33%(1/300)0.67% (1/150)1.0% (1/100)1.33% (1/80)1.67% (1/60)2.0% (1/50)2.5% (1/40)3.33% (1/30)5.0% (1/20)6.67% (1/15)
395566748491101114136152
(96)(95)(93)(93)(92)(91)(90)(88)(85)(83)
112153182200225242264293334362
(93)(90)(87)(86)(83)(82)(80)(77)(71)(67)
229306357387427451480512542
Not eff.
(88)(83)(79)(77)(73)(71)(67)(62)(54)(47)
587725789811
Not eff.
(77)(67)(59)(55)(48)
4.0%(1/25)
0.33%(1/300)0.67% (1/150)1.0% (1/100)1.33% (1/80)1.67% (1/60)2.0% (1/50)2.5% (1/40)3.33% (1/30)5.0% (1/20)6.67% (1/15)
53738998112121134151179200
(96)(94)(93)(92)(91)(90)(88)(87)(84)(81)
149203242265297318345380428458
(92)(88)(86)(84)(81)(80)(77)(74)(68)(63)
304402467503549577608639
Not eff.
(87)(81)(77)(74)(70)(67)(63)(58)(48)
762918974
Not eff.
(74)(63)(54)(49)
5.0%(1/20)
0.33%(1/300)0.67% (1/150)1.0% (1/100)1.33% (1/80)1.67% (1/60)2.0% (1/50)2.5% (1/40)3.33% (1/30)5.0% (1/20)6.67% (1/15)
76105126140159172189213250279
(95)(93)(92)(91)(89)(88)(87)(85)(81)(78)
212287339370413440474518572601
(90)(86)(83)(81)(79)(77)(74)(70)(63)(57)
427559641686740770799818
Not eff.
(85)(78)(73)(70)(65)(62)(58)(51)(40)
10381203Not eff.
(70)(57)(47)
50

CD526
Revision
3Appendix
D.D
esigntables
Table D.6 Type T (continued)
6.67%(1/15)
0.33%(1/300)0.67% (1/150)1.0% (1/100)1.33% (1/80)1.67% (1/60)2.0% (1/50)2.5% (1/40)3.33% (1/30)5.0% (1/20)6.67% (1/15)
120165198218247267293328381420
(94)(92)(90)(89)(87)(86)(84)(82)(77)(74)
332444521565624661705756808
Not eff.
(89)(84)(80)(78)(74)(72)(69)(64)(56)(49)
658843950100310581081Not eff.
(81)(74)(68)(64)(59)(55)(49)
1515Not eff.
(64)(49)
51

CD 526 Revision 3 Appendix D. Design tables
Drained area of road in m2 under a rainfall intensity of 50mm/h and collection efficiency in % (inbrackets)
Manning's coefficient is n = 0.017.
For others values of rainfall intensity I, multiply the area by (50/I).
52

CD526
Revision
3Appendix
D.D
esigntables
Table D.7 Kerb inlet with opening length equal to 0.5m
Flow width (B in m)Cross fall (Sc)
Gradient(SL) 0.5 0.75 1.0
1.67% (1/60)
0.33%(1/300)0.67% (1/150)1.0% (1/100)1.33% (1/80)1.67% (1/60)2.0% (1/50)2.5% (1/40)3.33% (1/30)5.0% (1/20)6.67% (1/15)
11141617181819
Not eff.
(83)(76)(70)(67)(62)(58)(53)(46)
283335
Not eff.
(72)(61)(52)(46)
51Not eff.
(61)(45)
2.0%2.0%(1/50)
0.33%(1/300)0.67% (1/150)1.0% (1/100)1.33% (1/80)1.67% (1/60)2.0% (1/50)2.5% (1/40)3.33% (1/30)5.0% (1/20)6.67% (1/15)
15192122242425
Not eff.
(82)(75)(69)(66)(60)(57)(52)(44)
384446
Not eff.
(72)(60)(51)(45)
68Not eff.
(60)(44)
2.5%(1/40)
0.33%(1/300)0.67% (1/150)1.0% (1/100)1.33% (1/80)1.67% (1/60)2.0% (1/50)2.5% (1/40)3.33% (1/30)5.0% (1/20)
21273032343435
Not eff.
(82)(74)(68)(64)(59)(55)(50)(42)
5362
Not eff.
(71)(58)(49)
95Not eff.
(59)(42)
53

CD526
Revision
3Appendix
D.D
esigntables
Table D.7 Kerb inlet with opening length equal to 0.5m (continued)
3.33%(1/30)
0.33%(1/300)0.67% (1/150)1.0% (1/100)1.33% (1/80)1.67% (1/60)2.0% (1/50)2.5% (1/40)3.33% (1/30)5.0% (1/20)6.67% (1/15)
334247505254
Not eff.
(81)(73)(67)(63)(57)(52)(47)
8497
Not eff.
(69)(57)(47)
149Not eff.
(57)(39)
4.0%(1/25)
0.33%(1/300)0.67% (1/150)1.0% (1/100)1.33% (1/80)1.67% (1/60)2.0% (1/50)2.5% (1/40)3.33% (1/30)5.0% (1/20)6.67% (1/15)
445663666970
Not eff.
(80)(72)(66)(62)(56)(52)(46)
112128
Not eff.
(68)(56)(46)
196Not eff.
(56)(38)
5.0%(1/20)
0.33%(1/300)0.67% (1/150)1.0% (1/100)1.33% (1/80)1.67% (1/60)2.0% (1/50)2.5% (1/40)3.33% (1/30)5.0% (1/20)6.67% (1/15)
648090949898
Not eff.
(80)(71)(65)(61)(55)(50)(45)
159180
Not eff.
(68)(54)(44)
276Not eff.
(55)(36)
54

CD526
Revision
3Appendix
D.D
esigntables
Table D.7 Kerb inlet with opening length equal to 0.5m (continued)
6.67%(1/15)
0.33%(1/300)0.67% (1/150)1.0% (1/100)1.33% (1/80)1.67% (1/60)2.0% (1/50)2.5% (1/40)3.33% (1/30)5.0% (1/20)6.67% (1/15)
100126140146151
Not eff.
(79)(70)(64)(59)(53)(49)
249278Not eff.
(66)(52)(42)
427Not eff.
(53)(33)
55

CD 526 Revision 3 Appendix D. Design tables
Drained area of road in m2 under a rainfall intensity of 50mm/h and collection efficiency in % (inbrackets)
Manning's coefficient is n = 0.017.
For others values of rainfall intensity I, multiply the area by (50/I).
56

CD526
Revision
3Appendix
D.D
esigntables
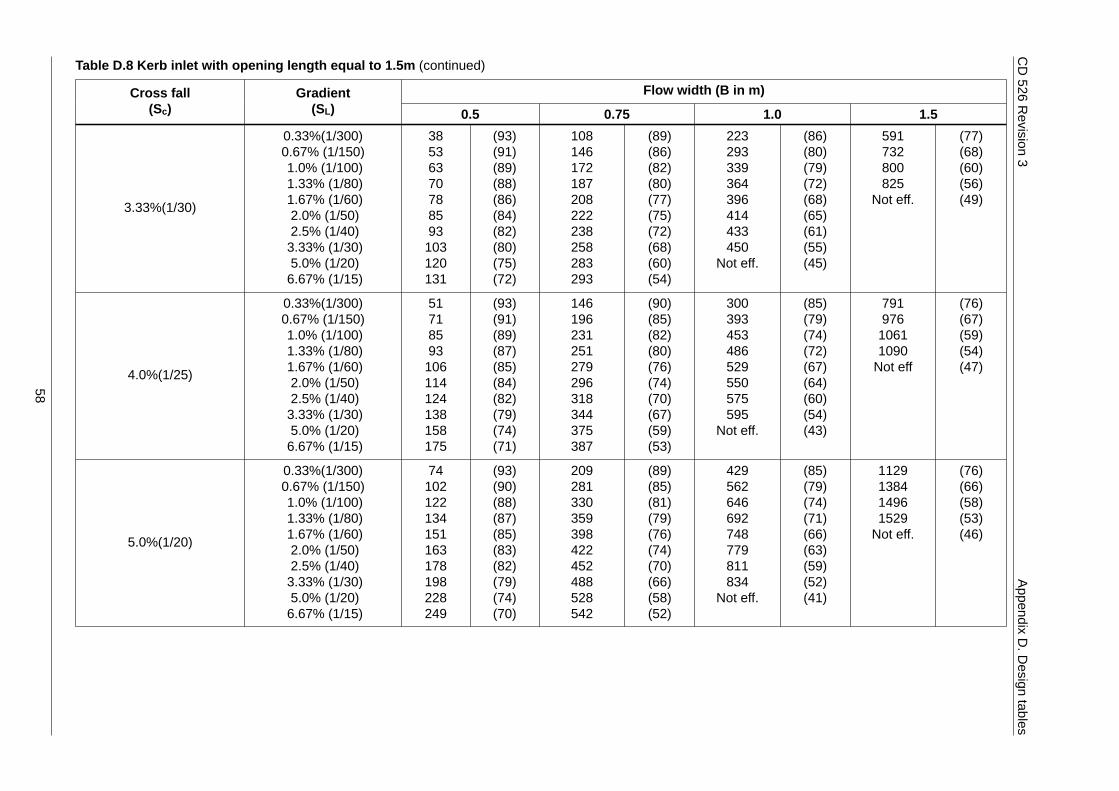
Table D.8 Kerb inlet with opening length equal to 1.5m
Flow width (B in m)Cross fall(Sc)
Gradient(SL) 0.5 0.75 1.0 1.5
1.67% (1/60)
0.33%(1/300)0.67%(1/150)1.0% (1/100)1.33% (1/80)1.67% (1/60)2.0% (1/50)2.5% (1/40)3.33% (1/30)5.0% (1/20)6.67% (1/15)
12172022252730343943
(94)(92)(90)(89)(87)(86)(84)(82)(78)(74)
354756616873798696101
(91)(87)(84)(82)(79)(77)(75)(71)(64)(59)
7296111121132139147155161
Not eff.
(87)(82)(78)(75)(71)(68)(65)(59)(50)(42)
194244272284294
Not eff.
(79)(71)(64)(60)(54)(49)
2.0%2.0%(1/50)
0.33% (1/300)0.67% (1/150)1.0% (1/100)1.33% (1/80)1.67% (1/60)2.0% (1/50)2.5% (1/40)3.33% (1/30)5.0% (1/20)6.67% (1/15)
17232730343740455358
(94)(92)(90)(89)(87)(86)(84)(81)(77)(74)
476475829298105115128134
(90)(87)(84)(82)(79)(77)(74)(70)(63)(58)
97129149161176185195206
Not eff.
(87)(81)(77)(74)(70)(68)(64)(58)(49)
260326361376387
Not eff.
(79)(70)(63)(58)(52)(48)
2.5%(1/40)
0.33%(1/300)0.67% (1/150)1.0% (1/100)1.33% (1/80)1.67% (1/60)2.0% (1/50)2.5% (1/40)3.33% (1/30)5.0% (1/20)6.67% (1/15)
24334044495358667583
(94)(91)(89)(88)(86)(85)(83)(81)(76)(73)
6892108118131140150164181189
(90)(86)(83)(81)(78)(76)(73)(69)(62)(56)
140185214230251263277291
Not eff.
(86)(81)(76)(73)(69)(66)(62)(57)(47)
32465512531540
Not eff.
(78)(69)(62)(57)(51)(46)
57
CD526
Revision
3Appendix
D.D
esigntables
Table D.8 Kerb inlet with opening length equal to 1.5m (continued)
Flow width (B in m)Cross fall(Sc)
Gradient(SL) 0.5 0.75 1.0 1.5
3.33%(1/30)
0.33%(1/300)0.67% (1/150)1.0% (1/100)1.33% (1/80)1.67% (1/60)2.0% (1/50)2.5% (1/40)3.33% (1/30)5.0% (1/20)6.67% (1/15)
38536370788593103120131
(93)(91)(89)(88)(86)(84)(82)(80)(75)(72)
108146172187208222238258283293
(89)(86)(82)(80)(77)(75)(72)(68)(60)(54)
223293339364396414433450
Not eff.
(86)(80)(79)(72)(68)(65)(61)(55)(45)
591732800825
Not eff.
(77)(68)(60)(56)(49)
4.0%(1/25)
0.33%(1/300)0.67% (1/150)1.0% (1/100)1.33% (1/80)1.67% (1/60)2.0% (1/50)2.5% (1/40)3.33% (1/30)5.0% (1/20)6.67% (1/15)
51718593106114124138158175
(93)(91)(89)(87)(85)(84)(82)(79)(74)(71)
146196231251279296318344375387
(90)(85)(82)(80)(76)(74)(70)(67)(59)(53)
300393453486529550575595
Not eff.
(85)(79)(74)(72)(67)(64)(60)(54)(43)
79197610611090Not eff
(76)(67)(59)(54)(47)
5.0%(1/20)
0.33%(1/300)0.67% (1/150)1.0% (1/100)1.33% (1/80)1.67% (1/60)2.0% (1/50)2.5% (1/40)3.33% (1/30)5.0% (1/20)6.67% (1/15)
74102122134151163178198228249
(93)(90)(88)(87)(85)(83)(82)(79)(74)(70)
209281330359398422452488528542
(89)(85)(81)(79)(76)(74)(70)(66)(58)(52)
429562646692748779811834
Not eff.
(85)(79)(74)(71)(66)(63)(59)(52)(41)
1129138414961529Not eff.
(76)(66)(58)(53)(46)
58

CD526
Revision
3Appendix
D.D
esigntables
Table D.8 Kerb inlet with opening length equal to 1.5m (continued)
Flow width (B in m)Cross fall(Sc)
Gradient(SL) 0.5 0.75 1.0 1.5
6.67%(1/15)
0.33%(1/300)0.67% (1/150)1.0% (1/100)1.33% (1/80)1.67% (1/60)2.0% (1/50)2.5% (1/40)3.33% (1/30)5.0% (1/20)6.67% (1/15)
118162194213240240282313359391
(93)(90)(88)(86)(84)(83)(81)(78)(73)(69)
333446523568628666711765821
Not eff.
(89)(84)(81)(78)(75)(72)(69)(64)(56)(49)
68188810181088117112611286Not eff.
(84)(77)(72)(68)(63)(55)(50)(39)
1781216823242361Not eff.
(75)(64)(56)(51)(44)
59

CD 526 Revision 3 Appendix D. Design tables
Drained area of road in m2 under a rainfall intensity of 50mm/h and collection efficiency in % (inbrackets)
Manning's coefficient is n = 0.017.
For others values of rainfall intensity I, multiply the area by (50/I).
60

CD526
Revision
3Appendix
D.D
esigntables
Table D.9 Kerb inlet with opening length equal to 1.85m
Flow width (B in m)Cross fall(Sc)
Gradient(SL) 0.5 0.75 1.0 1.5
1.67%(1/60)
0.33%(1/3000.67%(1/150)1.0% (1/100)1.33% (1/80)1.67% (1/60)2.0% (1/50)2.5% (1/40)3.33% (1/30)5.0% (1/20)6.67% (1/15)
12172123262832354146
(95)(93)(92)(91)(90)(89)(87)(85)(82)(79)
3649586472778493106115
(92)(89)(87)(86)(83)(82)(80)(76)(71)(67)
74100118128142151162175191197
(90)(85)(82)(80)(77)(74)(71)(67)(60)(53)
203264300319341353362
Noteff.
(83)(76)(71)(68)(62)(59)(54)(47)
2.0%(1/50)
0.33% (1/300)0.67% (1/150)1.0% (1/100)1.33% (1/80)1.67% (1/60)2.0% (1/50)2.5% (1/40)3.33% (1/30)5.0% (1/20)6.67% (1/15)
17232831353842475662
(95)(93)(92)(91)(89)(88)(87)(85)(81)(79)
4866788596103112124142153
(92)(89)(87)(86)(83)(81)(79)(76)(70)(66)
100134158172190202216234253260
(89)(85)(81)(79)(76)(74)(70)(66)(58)(52)
273353402426454467477
Noteff.
(83)(76)(70)(67)(61)(58)(53)(45)
2.5%(1/40)
0.33% (1/300)0.67% (1/150)1.0% (1/100)1.33% (1/80)1.67% (1/60)2.0% (1/50)2.5% (1/40)3.33% (1/30)5.0% (1/20)6.67% (1/15)
24344045515560688089
(95)(93)(91)(90)(89)(88)(86)(84)(81)(78)
6994112123138148161178202217
(92)(89)(86)(85)(82)(80)(78)(75)(69)(64)
144193226246272289308332357364
(89)(84)(81)(78)(75)(73)(70)(65)(60)(50)
392505571605642658668
Not eff.
(82)(75)(69)(65)(60)(56)(51)(44)
61

CD526
Revision
3Appendix
D.D
esigntables
Table D.9 Kerb inlet with opening length equal to 1.85m (continued)
Flow width (B in m)Cross fall(Sc)
Gradient(SL) 0.5 0.75 1.0 1.5
3.33%(1/30)
0.33%(1/300)0.67% (1/150)1.0% (1/100)1.33% (1/80)1.67% (1/60)2.0% (1/50)2.5% (1/40)3.33% (1/30)5.0% (1/20)6.67% (1/15)
39546571818896108127141
(95)(93)(91)(90)(88)(87)(86)(84)(80)(77)
111151179196220236256282318340
(91)(88)(86)(84)(81)(80)(77)(74)(68)(63)
230308360390431456486521555
Not eff.
(88)(84)(80)(76)(74)(72)(68)(63)(55)(48)
62479990095010011022Not eff.
(81)(74)(68)(64)(58)(54)(49)
4.0%(1/25)
0.33%(1/300)0.67% (1/150)1.0% (1/100)1.33% (1/80)1.67% (1/60)2.0% (1/50)2.5% (1/40)3.33% (1/30)5.0% (1/20)6.67% (1/15)
52728796109118129145170188
(95)(92)(90)(90)(88)(87)(85)(83)(79)(76)
149203241264295316342377423451
(92)(88)(85)(84)(81)(79)(77)(73)(67)(62)
309413482523576609648692732
Not eff
(88)(83)(79)(77)(73)(71)(67)(62)(54)(47)
83710681199126313261349Not eff
(81)(73)(67)(63)(57)(53)(48)
5.0%(1/20)
0.33%(1/300)0.67% (1/150)1.0% (1/100)1.33% (1/80)1.67% (1/60)2.0% (1/50)2.5% (1/40)3.33% (1/30)5.0% (1/20)6.67% (1/15)
75104125138156169185208243269
(95)(92)(90)(89)(88)(87)(85)(83)(79)(76)
215291345377422452488536600638
(91)(88)(85)(83)(80)(78)(76)(72)(66)(61)
4445916907468208669199791028Not eff
(88)(83)(79)(76)(72)(70)(66)(61)(52)(45)
119715211701178618661890Not eff
(80)(72)(66)(62)(56)(52)(46)
62

CD526
Revision
3Appendix
D.D
esigntables
Table D.9 Kerb inlet with opening length equal to 1.85m (continued)
Flow width (B in m)Cross fall(Sc)
Gradient(SL) 0.5 0.75 1.0 1.5
6.67%(1/15)
0.33%(1/300)0.67% (1/150)1.0% (1/100)1.33% (1/80)1.67% (1/60)2.0% (1/50)2.5% (1/40)3.33% (1/30)5.0% (1/20)6.67% (1/15)
120165199219248268294330384424
(94)(92)(90)(89)(87)(86)(84)(82)(78)(75)
341462547598668714771845941995
(91)(87)(84)(82)(80)(78)(75)(71)(65)(59)
705936109011781292144115261586Not eff
(87)(82)(78)(75)(72)(65)(60)(51)(43)
18952395266527872893Not eff
(80)(71)(65)(60)(54)(44)
63

CD 526 Revision 3 Appendix D. Design tables
Drained area of road in m2 under a rainfall intensity of 50mm/h and collection efficiency in % (inbrackets)
Manning's coefficient is n = 0.017.
For others values of rainfall intensity I, multiply the area by (50/I).
64

CD 526 Revision 3 Appendix E. Rainfall depth
Appendix E. Rainfall depth
Figure E.1 Values of 2MinM5 rainfall depth for the UK
Reproduced from BS 6367 [Ref 1.I] (now BS EN 12056 [Ref 4.I]) as amended, by permission of theBritish Standards Institution.
65

© Crown copyright 2020.You may re-use this information (not including logos) free of charge in any format or medium, under the terms of the
Open Government Licence. To view this licence:visit www.nationalarchives.gov.uk/doc/open-government-licence/,
write to the Information Policy Team, The National Archives, Kew, London TW9 4DU,or email [email protected].
Copyright © 2022 FDOKUMEN