Determining the optimum spacing and arrangement for commercial wind towers for ventilation...
28
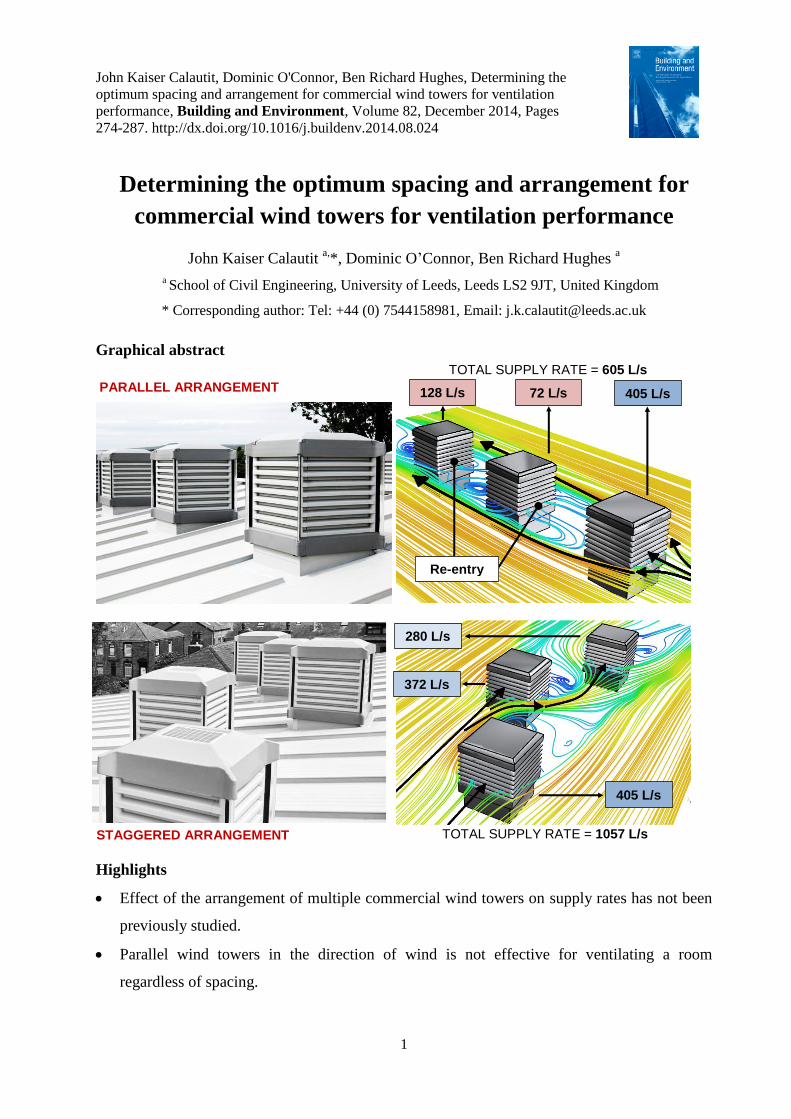
John Kaiser Calautit, Dominic O'Connor, Ben Richard Hughes, Determining the optimum spacing and arrangement for commercial wind towers for ventilation performance, Building and Environment, Volume 82, December 2014, Pages 274-287. http://dx.doi.org/10.1016/j.buildenv.2014.08.024 1 Determining the optimum spacing and arrangement for commercial wind towers for ventilation performance John Kaiser Calautit a, *, Dominic O’Connor, Ben Richard Hughes a a School of Civil Engineering, University of Leeds, Leeds LS2 9JT, United Kingdom * Corresponding author: Tel: +44 (0) 7544158981, Email: [email protected] Graphical abstract Highlights Effect of the arrangement of multiple commercial wind towers on supply rates has not been previously studied. Parallel wind towers in the direction of wind is not effective for ventilating a room regardless of spacing. PARALLEL ARRANGEMENT STAGGERED ARRANGEMENT 405 L/s 72 L/s 128 L/s Re-entry 405 L/s 280 L/s 372 L/s TOTAL SUPPLY RATE = 605 L/s TOTAL SUPPLY RATE = 1057 L/s
Transcript of Determining the optimum spacing and arrangement for commercial wind towers for ventilation...
John Kaiser Calautit, Dominic O'Connor, Ben Richard Hughes, Determining the
optimum spacing and arrangement for commercial wind towers for ventilation
performance, Building and Environment, Volume 82, December 2014, Pages
274-287. http://dx.doi.org/10.1016/j.buildenv.2014.08.024
1
Determining the optimum spacing and arrangement for
commercial wind towers for ventilation performance
John Kaiser Calautit a,*, Dominic O’Connor, Ben Richard Hughes
a
a School of Civil Engineering, University of Leeds, Leeds LS2 9JT, United Kingdom
* Corresponding author: Tel: +44 (0) 7544158981, Email: [email protected]
Graphical abstract
Highlights
Effect of the arrangement of multiple commercial wind towers on supply rates has not been
previously studied.
Parallel wind towers in the direction of wind is not effective for ventilating a room
regardless of spacing.
PARALLEL ARRANGEMENT
STAGGERED ARRANGEMENT
405 L/s 72 L/s 128 L/s
Re-entry
405 L/s
280 L/s
372 L/s
TOTAL SUPPLY RATE = 605 L/s
TOTAL SUPPLY RATE = 1057 L/s
2
Driving forces for parallel wind towers in the direction of wind are not sufficient to provide
regulatory supply rates.
Greater indoor air distribution and movement is observed inside the room with staggered
wind towers.
Staggered arrangement effectively minimised the re-entry of exhaust air into fresh air supply
Abstract
CFD analysis of multiple wind towers located on the same building was performed following
validation of a benchmark model against wind tunnel data. The positioning of the wind towers
was varied in six different cases, two different arrangements with three different spacing lengths
between wind towers. All analysis was compared against the benchmark (isolated) wind tower.
The ability of the wind towers, particularly the leeward wind tower, to ventilate the space below
was determined for a set occupancy against current guidelines for air supply rates. Furthermore,
the effect of the spacing and arrangement on CO2 concentration within rooms ventilated by the
leeward wind tower was investigated (re-entry of exhaust air pollutants into fresh supply).
It was found that a parallel arrangement of wind towers was not effective for ventilating an
occupied volume, regardless of the spacing between the two wind towers when incident wind
direction was parallel to the arrangement. The maximum supply rate for the leeward wind tower
in parallel arrangement at a spacing of 5 m was just over 50% of the regulation rate (10
L/s/occupant) and 40% of the supply rate of an isolated wind tower. Decreasing the spacing
between the parallel wind towers to 3 m further reduces the supply rate to 2.4 L/s/occupant and
the device was observed to be operating in reverse (airflow entering from leeward opening). As
the angle of wind increased, an improvement of air supply rates was seen. For a staggered
arrangement of wind towers, the leeward wind tower was capable of supplying the
recommended ventilation rates at all tested spacing lengths.
The average indoor CO2 concentration of the space with the leeward wind tower was higher in
the parallel arrangement than the staggered arrangement at 0˚ wind angle. For the parallel
arrangement, the average CO2 concentration was 28–50 ppm higher than the outdoor air. The
staggered arrangement effectively minimised the re-entry of pollutants, with the indoor CO2
concentration 1–3 ppm higher than the outdoor.
Keywords: arrangement; CFD; CO2 concentration; commercial wind tower; contamination;
indoor air quality; natural ventilation; pollutant re-entry; spacing; wind tunnel
3
1. Introduction
Passive ventilation is a strategy for providing buildings with adequate ventilation for occupants
without mechanical processes [1]. Commercial wind towers are a passive ventilation technology
that provides adequate ventilation by utilising pressure differences created by wind forces and
temperature differences between the indoor and outdoor climates [2]. Commercial wind towers
are based on traditional designs known as baud-geer which were developed in the Middle-East
as a means of ventilating buildings in hot and arid climates [3]. These traditional towers
extended at a height above the building to maximise the influence of wind forces and buoyancy
effects [4]. Modern commercial wind towers are based on the same principles but have been
adapted for contemporary use. The use of commercial wind towers is now widespread,
particularly for buildings with high occupant numbers such as schools and office buildings [5].
Sufficient ventilation is required to maintain safe concentrations of pollutants for occupants. By
replacing indoor air with fresh outdoor air, the build-up of pollutants can be controlled and
prevent sick building syndrome [6]. Current guidelines state the range of acceptable pollutant
levels in buildings for a variety of conditions [7]. Failure to maintain good indoor air quality
(IAQ) can result in poor performance and illness for occupants under prolonged exposure [8].
Commercial wind towers have been subject to a significant amount of research. The optimal
design of various components of wind towers have been conducted including louvre angle,
number of louvers, louvre spacing [4, 9]. Computational fluid dynamics (CFD) played a major
role in development of wind towers due to the low computation resources required for design
and simulation of prototypes [10]. High quality simulations provide designers with an
understanding of the effect changes in the design of a wind tower can make on a quicker scale
than previously possible.
In addition to CFD analysis, wind tunnel testing provides scale model testing of designs,
validating the CFD simulations to improve reliability [10, 11]. In-situ testing of wind towers has
been undertaken to understand the real world application and how successful natural and
passive ventilation is in delivering ventilation compared to mechanical processes [12].
Furthermore, the ability of wind towers to remove pollutants from an occupied space has been
tested and compared to other ventilation strategies [13].
However, previous work has been completed with reference to a single wind tower device, with
no thought to the influence a wind tower has on subsequent wind towers. No work has been
4
completed with regard to the effect the arrangement of multiple wind towers has on the
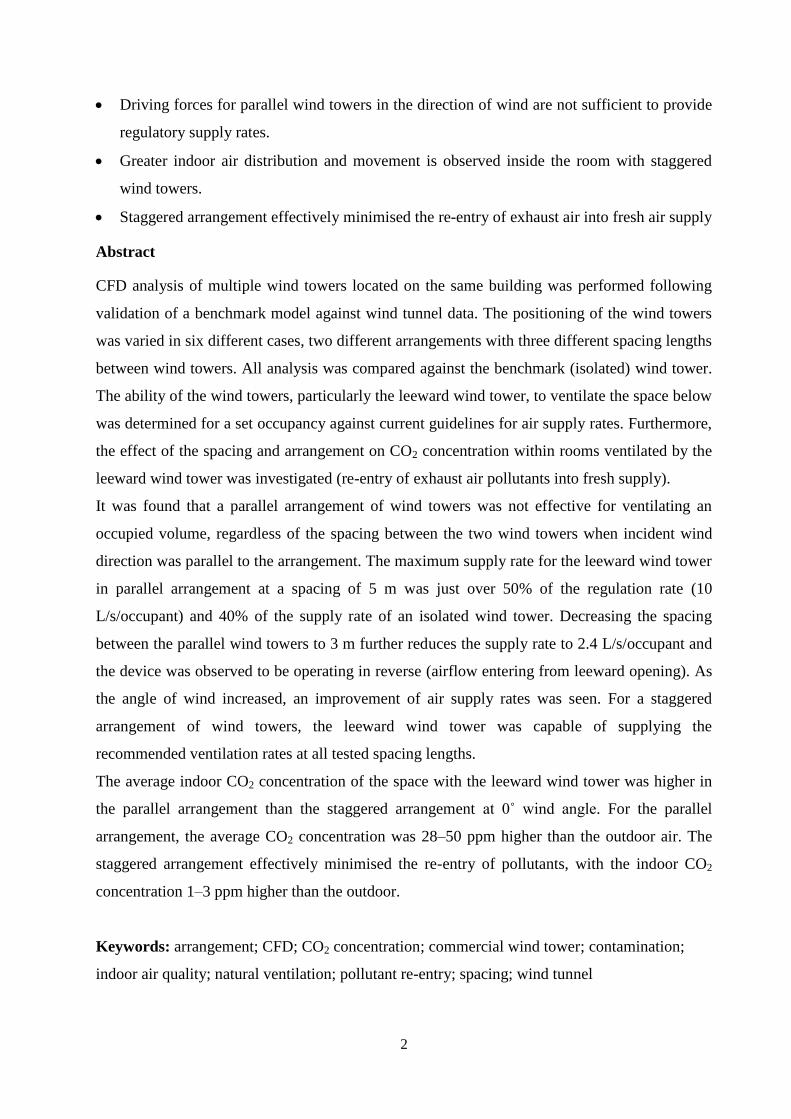
ventilation performance of a single building. Figure 1 shows a common situation where multiple
wind towers are installed on a building to provide ventilation. By analysing the arrangement
between wind towers in terms of spacing and staggering multiple units, better understanding can
be gained on the influence of a wind tower on another. An optimal arrangement can then be
designed to maintain desired performance.
Figure 1 Roof mounted wind tower (a) parallel arrangement (b) staggered arrangement [14].
As wind towers act as a method of removing polluted air from an occupied space, the exhaust
air will contain a higher concentration of pollutants than the inlet air. With multiple wind towers
installed on a single building, the re-entry of this exhaust air into the inlet of a secondary wind
tower is likely, thereby offsetting the pollutant removal. This condition has not previously been
explored by CFD simulation or in-situ testing.
This study uses CFD analysis to determine the effect of spacing and arrangement of multiple
wind towers on ventilation rates and indoor airflow distribution for occupied spaces. An
experimental model is created using a rapid prototyping machine and tested in a closed-circuit
low speed wind tunnel to validate the benchmark CFD model (isolated wind tower).
Furthermore, the effect of wind tower spacing on the indoor air quality is investigated by
determining the CO2 concentration. A recommended spacing and arrangement for wind towers
for effective ventilation and removal of pollutant is given.
2. CFD model
A validated CFD methodology presented in an earlier study [10] is used to study the ventilation
performance of an isolated commercial wind tower (benchmark model) and also multiple
5
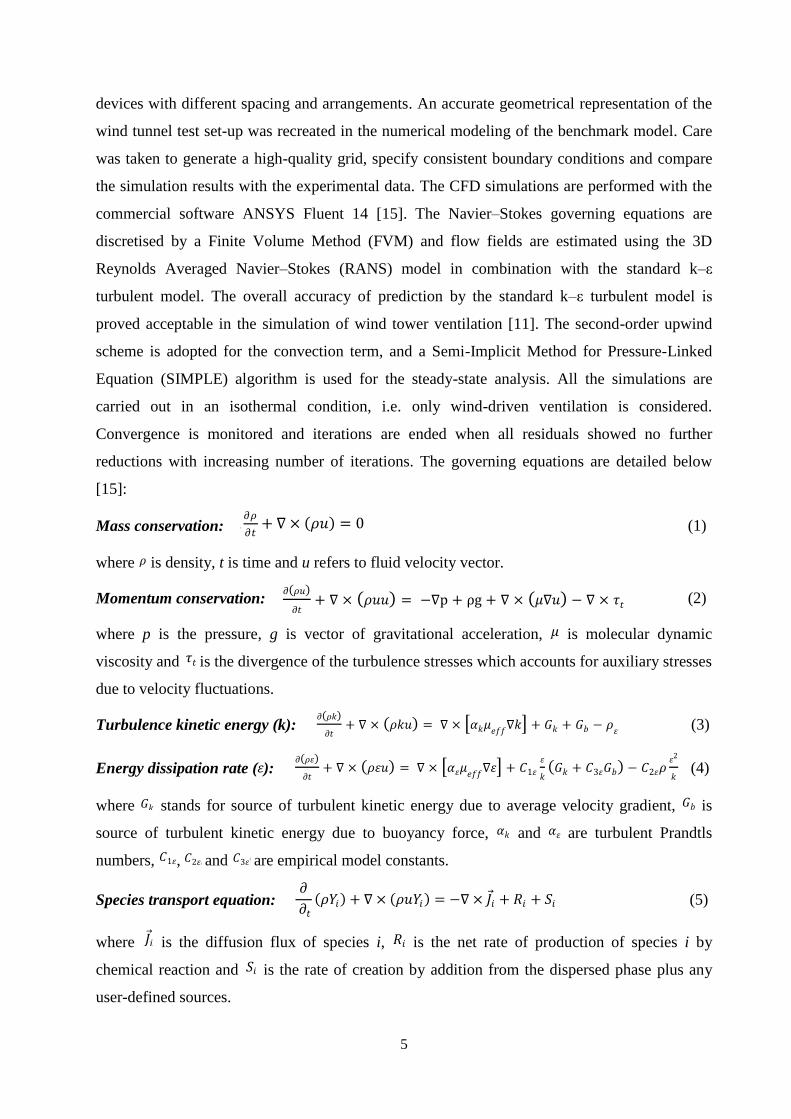
devices with different spacing and arrangements. An accurate geometrical representation of the
wind tunnel test set-up was recreated in the numerical modeling of the benchmark model. Care
was taken to generate a high-quality grid, specify consistent boundary conditions and compare
the simulation results with the experimental data. The CFD simulations are performed with the
commercial software ANSYS Fluent 14 [15]. The Navier–Stokes governing equations are
discretised by a Finite Volume Method (FVM) and flow fields are estimated using the 3D
Reynolds Averaged Navier–Stokes (RANS) model in combination with the standard k–ε
turbulent model. The overall accuracy of prediction by the standard k–ε turbulent model is
proved acceptable in the simulation of wind tower ventilation [11]. The second-order upwind
scheme is adopted for the convection term, and a Semi-Implicit Method for Pressure-Linked
Equation (SIMPLE) algorithm is used for the steady-state analysis. All the simulations are
carried out in an isothermal condition, i.e. only wind-driven ventilation is considered.
Convergence is monitored and iterations are ended when all residuals showed no further
reductions with increasing number of iterations. The governing equations are detailed below
[15]:
Mass conservation:
(1)
where is density, t is time and u refers to fluid velocity vector.
Momentum conservation:
(2)
where p is the pressure, g is vector of gravitational acceleration, is molecular dynamic
viscosity and is the divergence of the turbulence stresses which accounts for auxiliary stresses
due to velocity fluctuations.
Turbulence kinetic energy (k):
(3)
Energy dissipation rate ( ):
(4)
where stands for source of turbulent kinetic energy due to average velocity gradient, is
source of turbulent kinetic energy due to buoyancy force, and are turbulent Prandtls
numbers, , and are empirical model constants.
Species transport equation:
(5)
where is the diffusion flux of species i, is the net rate of production of species i by
chemical reaction and is the rate of creation by addition from the dispersed phase plus any
user-defined sources.
4.1.1.1 𝜕𝜌
𝜕𝑡+ ∇ × 𝜌𝑢 = 0
𝜌
4.1.1.1 𝜕 𝜌𝑢
𝜕𝑡+ ∇ × 𝜌𝑢𝑢 = −∇p + ρg + ∇ × 𝜇∇𝑢 − ∇ × 𝜏𝑡
4.1.1.1
𝜕 𝜌𝑢
𝜕𝑡+ ∇ × 𝜌𝑢𝑢 = −∇p + ρg + ∇ × 𝜇∇𝑢 − ∇ × 𝜏𝑡
4.1.1.1
𝜕 𝜌𝑢
𝜕𝑡+ ∇ × 𝜌𝑢𝑢 = −∇p + ρg + ∇ × 𝜇∇𝑢 − ∇ × 𝜏𝑡
4.1.1.1 𝜕 𝜌𝑘
𝜕𝑡+ ∇ × 𝜌𝑘𝑢 = ∇ × 𝛼𝑘𝜇𝑒𝑓𝑓
∇𝑘 + 𝐺𝑘 + 𝐺𝑏 − 𝜌𝜀
𝜀 4.1.1.1 𝜕 𝜌𝜀
𝜕𝑡+ ∇ × 𝜌𝜀𝑢 = ∇ × 𝛼𝜀𝜇𝑒𝑓𝑓
∇𝜀 + 𝐶1𝜀
𝜀
𝑘 𝐺𝑘 + 𝐶3𝜀𝐺𝑏 − 𝐶2𝜀𝜌
𝜀2
𝑘
4.1.1.1 𝜕 𝜌𝑘
𝜕𝑡+ ∇ × 𝜌𝑘𝑢 = ∇ × 𝛼𝑘𝜇𝑒𝑓𝑓
∇𝑘 + 𝐺𝑘 + 𝐺𝑏 − 𝜌𝜀 4.1.1.1
𝜕 𝜌𝑘
𝜕𝑡+ ∇ × 𝜌𝑘𝑢 = ∇ × 𝛼𝑘𝜇𝑒𝑓𝑓
∇𝑘 + 𝐺𝑘 + 𝐺𝑏 − 𝜌𝜀
4.1.1.1 𝜕 𝜌𝑘
𝜕𝑡+ ∇ × 𝜌𝑘𝑢 = ∇ × 𝛼𝑘𝜇𝑒𝑓𝑓
∇𝑘 + 𝐺𝑘 + 𝐺𝑏 − 𝜌𝜀 4.1.1.1
𝜕 𝜌𝜀
𝜕𝑡+ ∇ × 𝜌𝜀𝑢 = ∇ × 𝛼𝜀𝜇𝑒𝑓𝑓
∇𝜀 + 𝐶1𝜀
𝜀
𝑘 𝐺𝑘 + 𝐶3𝜀𝐺𝑏 − 𝐶2𝜀𝜌
𝜀2
𝑘
4.1.1.1 𝜕 𝜌𝜀
𝜕𝑡+ ∇ × 𝜌𝜀𝑢 = ∇ × 𝛼𝜀𝜇𝑒𝑓𝑓
∇𝜀 + 𝐶1𝜀
𝜀
𝑘 𝐺𝑘 + 𝐶3𝜀𝐺𝑏 − 𝐶2𝜀𝜌
𝜀2
𝑘 4.1.1.1
𝜕 𝜌𝜀
𝜕𝑡+ ∇ × 𝜌𝜀𝑢 = ∇ × 𝛼𝜀𝜇𝑒𝑓𝑓
∇𝜀 + 𝐶1𝜀
𝜀
𝑘 𝐺𝑘 + 𝐶3𝜀𝐺𝑏 − 𝐶2𝜀𝜌
𝜀2
𝑘 4.1.1.1
𝜕 𝜌𝜀
𝜕𝑡+ ∇ × 𝜌𝜀𝑢 = ∇ × 𝛼𝜀𝜇𝑒𝑓𝑓
∇𝜀 + 𝐶1𝜀
𝜀
𝑘 𝐺𝑘 + 𝐶3𝜀𝐺𝑏 − 𝐶2𝜀𝜌
𝜀2
𝑘
𝜕
𝜕𝑡
𝜌𝑌𝑖 + ∇ × 𝜌𝑢𝑌𝑖 = −∇ × 𝐽 𝑖 + 𝑅𝑖 + 𝑆𝑖
𝜕
𝜕𝑡
𝜌𝑌𝑖 + ∇ × 𝜌𝑢𝑌𝑖 = −∇ × 𝐽 𝑖 + 𝑅𝑖 + 𝑆𝑖 𝜕
𝜕𝑡
𝜌𝑌𝑖 + ∇ × 𝜌𝑢𝑌𝑖 = −∇ × 𝐽 𝑖 + 𝑅𝑖 + 𝑆𝑖 𝜕
𝜕𝑡
𝜌𝑌𝑖 + ∇ × 𝜌𝑢𝑌𝑖 = −∇ × 𝐽 𝑖 + 𝑅𝑖 + 𝑆𝑖
6
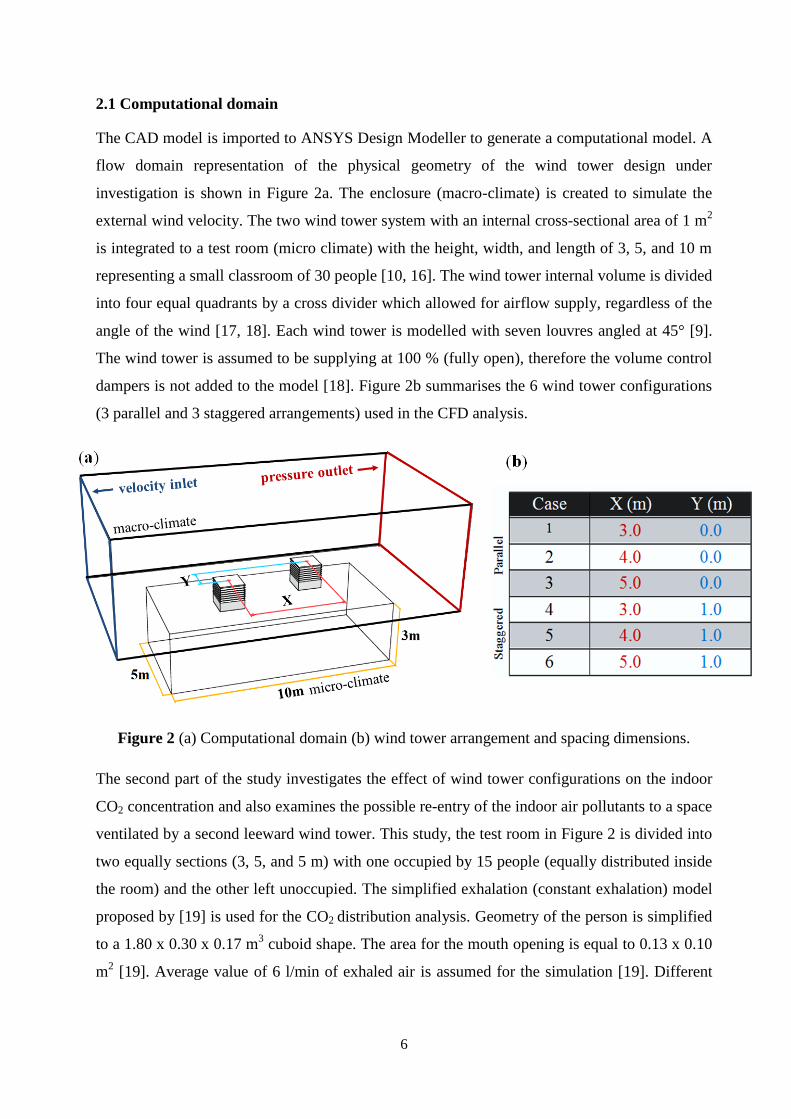
2.1 Computational domain
The CAD model is imported to ANSYS Design Modeller to generate a computational model. A
flow domain representation of the physical geometry of the wind tower design under
investigation is shown in Figure 2a. The enclosure (macro-climate) is created to simulate the
external wind velocity. The two wind tower system with an internal cross-sectional area of 1 m2
is integrated to a test room (micro climate) with the height, width, and length of 3, 5, and 10 m
representing a small classroom of 30 people [10, 16]. The wind tower internal volume is divided
into four equal quadrants by a cross divider which allowed for airflow supply, regardless of the
angle of the wind [17, 18]. Each wind tower is modelled with seven louvres angled at 45° [9].
The wind tower is assumed to be supplying at 100 % (fully open), therefore the volume control
dampers is not added to the model [18]. Figure 2b summarises the 6 wind tower configurations
(3 parallel and 3 staggered arrangements) used in the CFD analysis.
Figure 2 (a) Computational domain (b) wind tower arrangement and spacing dimensions.
The second part of the study investigates the effect of wind tower configurations on the indoor
CO2 concentration and also examines the possible re-entry of the indoor air pollutants to a space
ventilated by a second leeward wind tower. This study, the test room in Figure 2 is divided into
two equally sections (3, 5, and 5 m) with one occupied by 15 people (equally distributed inside
the room) and the other left unoccupied. The simplified exhalation (constant exhalation) model
proposed by [19] is used for the CO2 distribution analysis. Geometry of the person is simplified
to a 1.80 x 0.30 x 0.17 m3 cuboid shape. The area for the mouth opening is equal to 0.13 x 0.10
m2 [19]. Average value of 6 l/min of exhaled air is assumed for the simulation [19]. Different
7
external wind speeds (1 – 5 m/s) are also simulated to assess the reduction of the CO2
concentration from an occupied space ventilated with a wind tower.
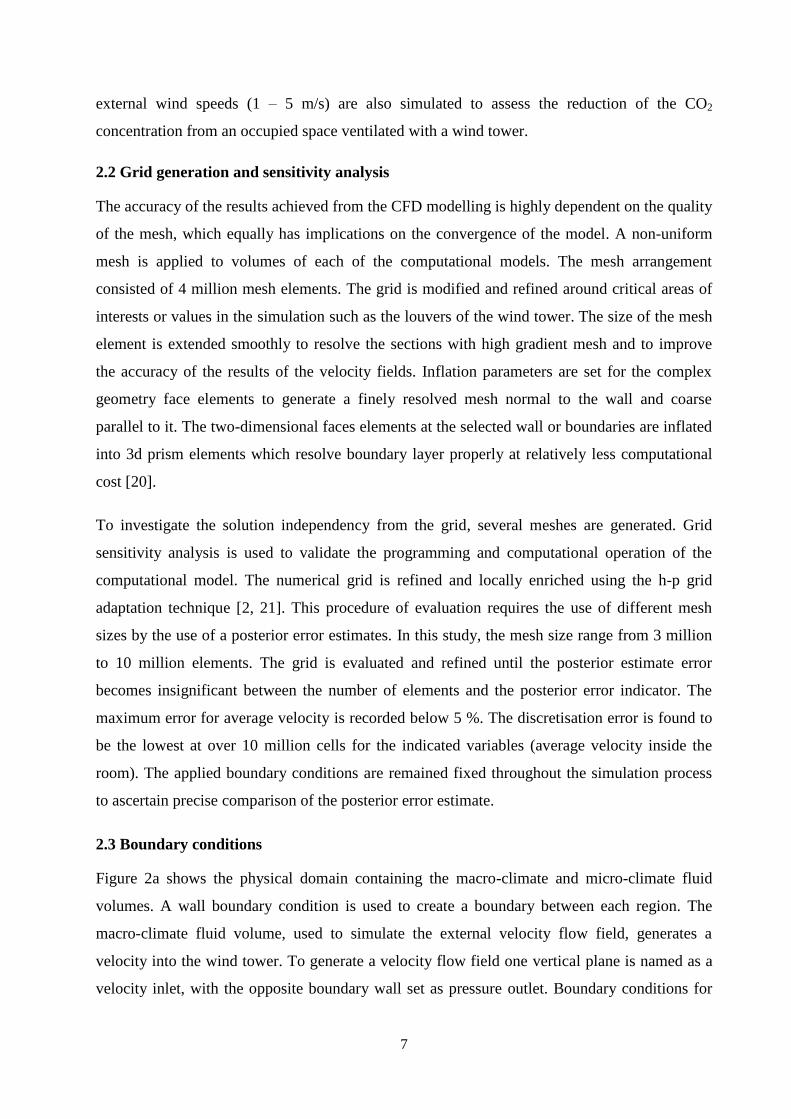
2.2 Grid generation and sensitivity analysis
The accuracy of the results achieved from the CFD modelling is highly dependent on the quality
of the mesh, which equally has implications on the convergence of the model. A non-uniform
mesh is applied to volumes of each of the computational models. The mesh arrangement
consisted of 4 million mesh elements. The grid is modified and refined around critical areas of
interests or values in the simulation such as the louvers of the wind tower. The size of the mesh
element is extended smoothly to resolve the sections with high gradient mesh and to improve
the accuracy of the results of the velocity fields. Inflation parameters are set for the complex
geometry face elements to generate a finely resolved mesh normal to the wall and coarse
parallel to it. The two-dimensional faces elements at the selected wall or boundaries are inflated
into 3d prism elements which resolve boundary layer properly at relatively less computational
cost [20].
To investigate the solution independency from the grid, several meshes are generated. Grid
sensitivity analysis is used to validate the programming and computational operation of the
computational model. The numerical grid is refined and locally enriched using the h-p grid
adaptation technique [2, 21]. This procedure of evaluation requires the use of different mesh
sizes by the use of a posterior error estimates. In this study, the mesh size range from 3 million
to 10 million elements. The grid is evaluated and refined until the posterior estimate error
becomes insignificant between the number of elements and the posterior error indicator. The
maximum error for average velocity is recorded below 5 %. The discretisation error is found to
be the lowest at over 10 million cells for the indicated variables (average velocity inside the
room). The applied boundary conditions are remained fixed throughout the simulation process
to ascertain precise comparison of the posterior error estimate.
2.3 Boundary conditions
Figure 2a shows the physical domain containing the macro-climate and micro-climate fluid
volumes. A wall boundary condition is used to create a boundary between each region. The
macro-climate fluid volume, used to simulate the external velocity flow field, generates a
velocity into the wind tower. To generate a velocity flow field one vertical plane is named as a
velocity inlet, with the opposite boundary wall set as pressure outlet. Boundary conditions for
8
the numerical modelling of the flow are chosen to be the same as the conditions in the wind
tunnel during the experiment. Due to the limitations of the experimental setup, the effect of the
atmospheric boundary layer on the ventilation performance is not investigated in the study and a
uniform velocity inlet profile is used. Additionally, the adopted wall boundary conditions are
based on the numerical model of the actual wind tunnel test section [22]. The boundary
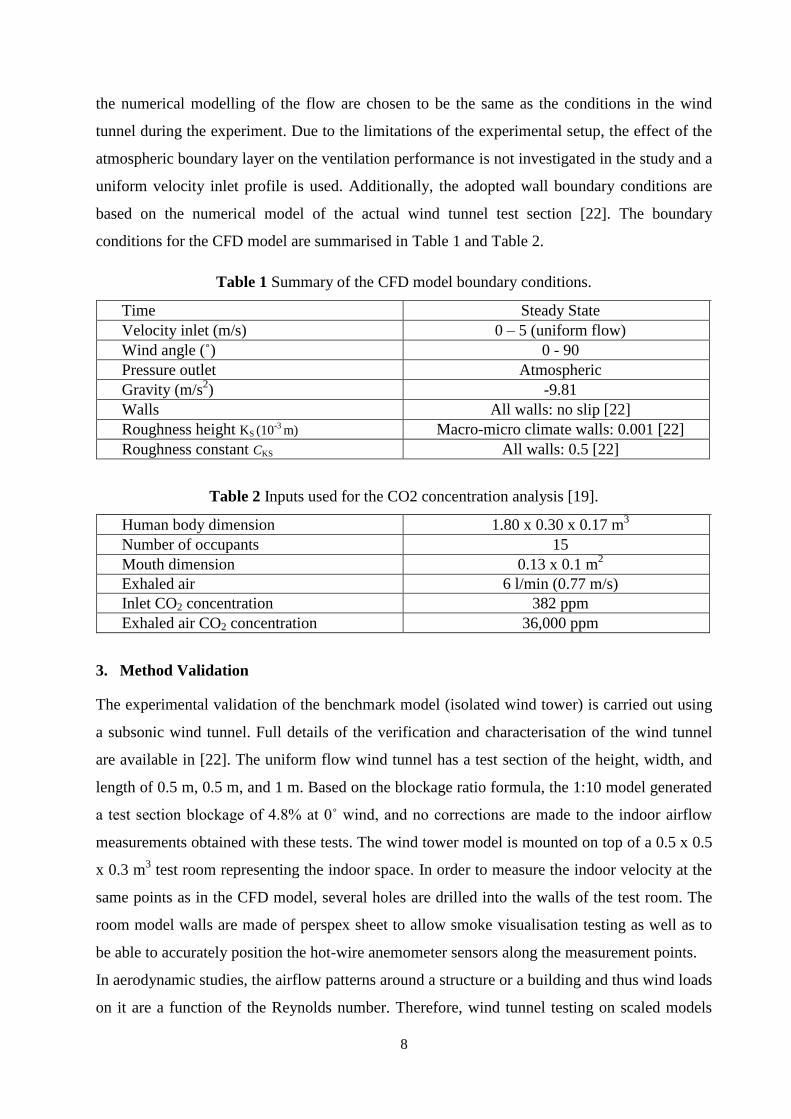
conditions for the CFD model are summarised in Table 1 and Table 2.
Table 1 Summary of the CFD model boundary conditions.
Time Steady State
Velocity inlet (m/s) 0 – 5 (uniform flow)
Wind angle (˚) 0 - 90
Pressure outlet Atmospheric
Gravity (m/s2) -9.81
Walls All walls: no slip [22]
Roughness height KS (10-3
m) Macro-micro climate walls: 0.001 [22]
Roughness constant CKS All walls: 0.5 [22]
Table 2 Inputs used for the CO2 concentration analysis [19].
Human body dimension 1.80 x 0.30 x 0.17 m3
Number of occupants 15
Mouth dimension 0.13 x 0.1 m2
Exhaled air 6 l/min (0.77 m/s)
Inlet CO2 concentration 382 ppm
Exhaled air CO2 concentration 36,000 ppm
3. Method Validation
The experimental validation of the benchmark model (isolated wind tower) is carried out using
a subsonic wind tunnel. Full details of the verification and characterisation of the wind tunnel
are available in [22]. The uniform flow wind tunnel has a test section of the height, width, and
length of 0.5 m, 0.5 m, and 1 m. Based on the blockage ratio formula, the 1:10 model generated
a test section blockage of 4.8% at 0˚ wind, and no corrections are made to the indoor airflow
measurements obtained with these tests. The wind tower model is mounted on top of a 0.5 x 0.5
x 0.3 m3 test room representing the indoor space. In order to measure the indoor velocity at the
same points as in the CFD model, several holes are drilled into the walls of the test room. The
room model walls are made of perspex sheet to allow smoke visualisation testing as well as to
be able to accurately position the hot-wire anemometer sensors along the measurement points.
In aerodynamic studies, the airflow patterns around a structure or a building and thus wind loads
on it are a function of the Reynolds number. Therefore, wind tunnel testing on scaled models
9
should ideally be performed at the same Reynolds number as would be experience by the full
scale model, thus satisfying Reynolds number similarity [23]. Strict scaling of wind and
turbulence Reynolds number for the simulated flow is generally not possible for wind tunnel
model testing of building and structures, even in the largest, high speed and most expensive
wind tunnels. However, the equality of model and full-scale Reynolds number, based on the
mean wind speed and a characteristic dimensions of the structure, is not necessary for sharp
edged structure, provided that the model Reynolds number is not less than 10,000 [23]. The
flow separation points are fixed at these sharp corner locations regardless of Reynolds number,
so that wind responses tend to be less sensitive to Reynolds number.
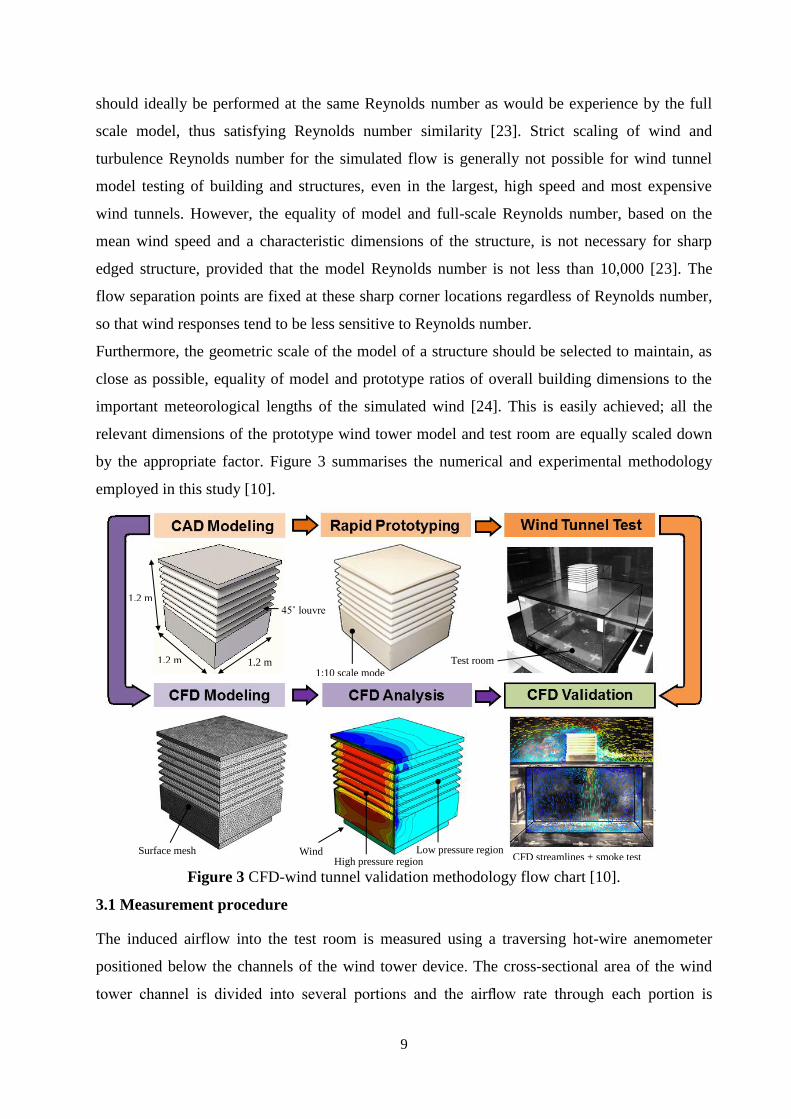
Furthermore, the geometric scale of the model of a structure should be selected to maintain, as
close as possible, equality of model and prototype ratios of overall building dimensions to the
important meteorological lengths of the simulated wind [24]. This is easily achieved; all the
relevant dimensions of the prototype wind tower model and test room are equally scaled down
by the appropriate factor. Figure 3 summarises the numerical and experimental methodology
employed in this study [10].
Figure 3 CFD-wind tunnel validation methodology flow chart [10].
3.1 Measurement procedure
The induced airflow into the test room is measured using a traversing hot-wire anemometer
positioned below the channels of the wind tower device. The cross-sectional area of the wind
tower channel is divided into several portions and the airflow rate through each portion is
1.2 m 1.2 m
1.2 m 45˚ louvre
1:10 scale mode
Test room
CFD streamlines + smoke test Wind
High pressure region Low pressure region Surface mesh
10
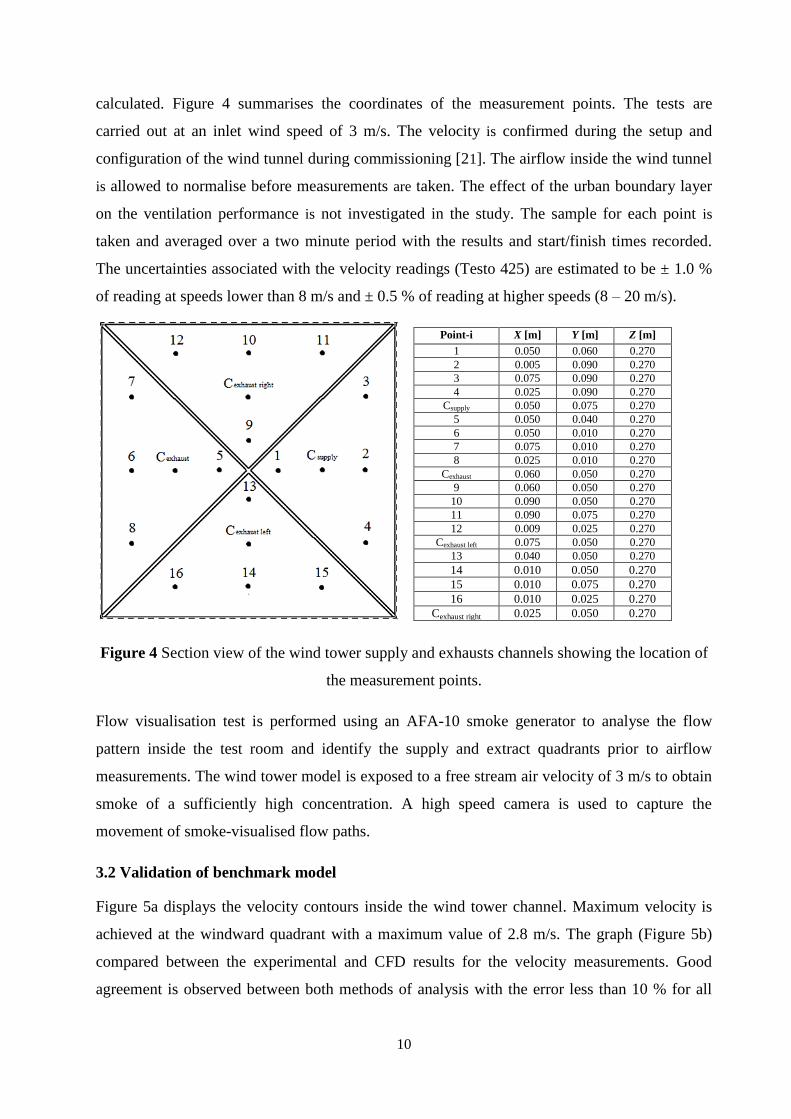
calculated. Figure 4 summarises the coordinates of the measurement points. The tests are
carried out at an inlet wind speed of 3 m/s. The velocity is confirmed during the setup and
configuration of the wind tunnel during commissioning [21]. The airflow inside the wind tunnel
is allowed to normalise before measurements are taken. The effect of the urban boundary layer
on the ventilation performance is not investigated in the study. The sample for each point is
taken and averaged over a two minute period with the results and start/finish times recorded.
The uncertainties associated with the velocity readings (Testo 425) are estimated to be ± 1.0 %
of reading at speeds lower than 8 m/s and ± 0.5 % of reading at higher speeds (8 – 20 m/s).
Figure 4 Section view of the wind tower supply and exhausts channels showing the location of
the measurement points.
Flow visualisation test is performed using an AFA-10 smoke generator to analyse the flow
pattern inside the test room and identify the supply and extract quadrants prior to airflow
measurements. The wind tower model is exposed to a free stream air velocity of 3 m/s to obtain
smoke of a sufficiently high concentration. A high speed camera is used to capture the
movement of smoke-visualised flow paths.
3.2 Validation of benchmark model
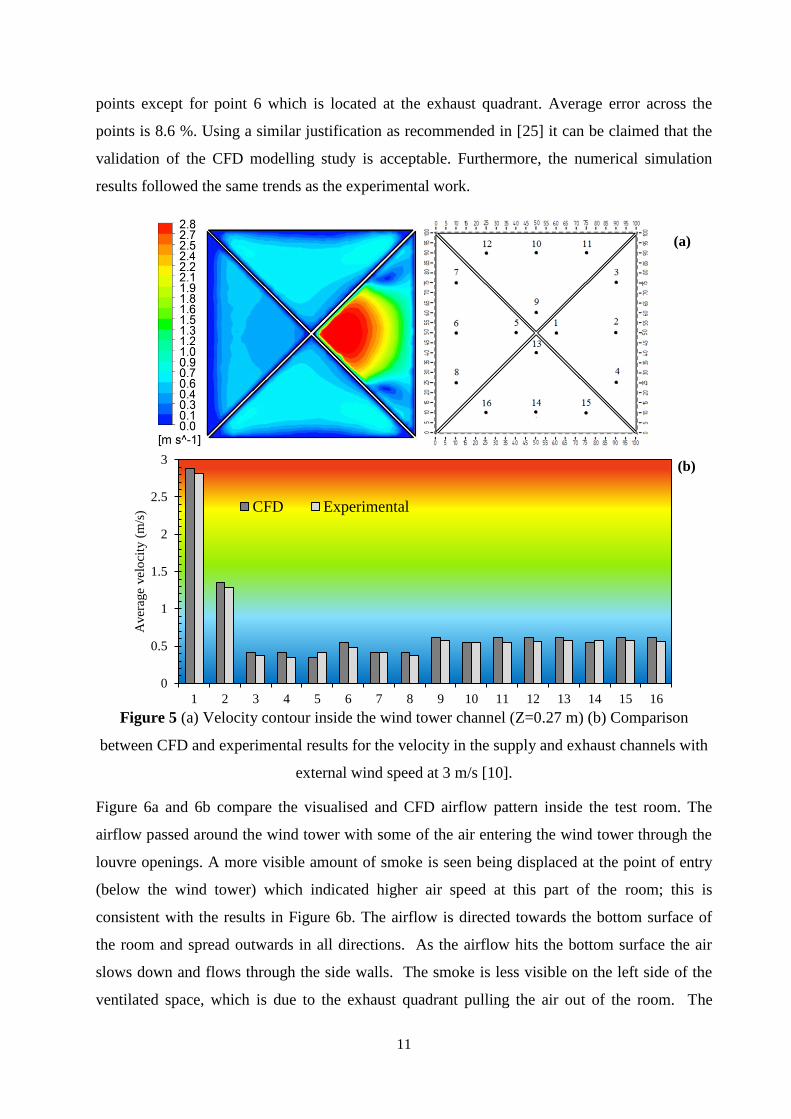
Figure 5a displays the velocity contours inside the wind tower channel. Maximum velocity is
achieved at the windward quadrant with a maximum value of 2.8 m/s. The graph (Figure 5b)
compared between the experimental and CFD results for the velocity measurements. Good
agreement is observed between both methods of analysis with the error less than 10 % for all
Point-i X [m] Y [m] Z [m]
1 0.050 0.060 0.270
2 0.005 0.090 0.270
3 0.075 0.090 0.270
4 0.025 0.090 0.270
Csupply 0.050 0.075 0.270
5 0.050 0.040 0.270
6 0.050 0.010 0.270
7 0.075 0.010 0.270
8 0.025 0.010 0.270
Cexhaust 0.060 0.050 0.270
9 0.060 0.050 0.270
10 0.090 0.050 0.270
11 0.090 0.075 0.270
12 0.009 0.025 0.270
Cexhaust left 0.075 0.050 0.270
13 0.040 0.050 0.270
14 0.010 0.050 0.270
15 0.010 0.075 0.270
16 0.010 0.025 0.270
Cexhaust right 0.025 0.050 0.270
11
points except for point 6 which is located at the exhaust quadrant. Average error across the
points is 8.6 %. Using a similar justification as recommended in [25] it can be claimed that the
validation of the CFD modelling study is acceptable. Furthermore, the numerical simulation
results followed the same trends as the experimental work.
Figure 5 (a) Velocity contour inside the wind tower channel (Z=0.27 m) (b) Comparison
between CFD and experimental results for the velocity in the supply and exhaust channels with
external wind speed at 3 m/s [10].
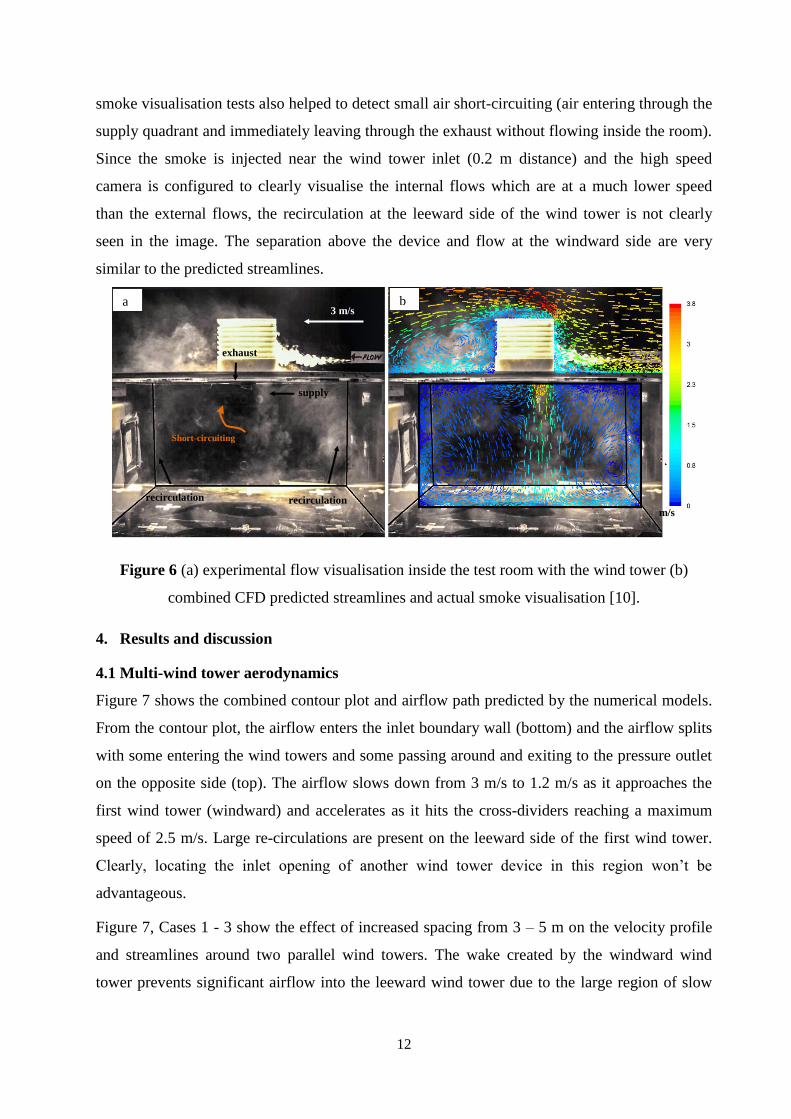
Figure 6a and 6b compare the visualised and CFD airflow pattern inside the test room. The
airflow passed around the wind tower with some of the air entering the wind tower through the
louvre openings. A more visible amount of smoke is seen being displaced at the point of entry
(below the wind tower) which indicated higher air speed at this part of the room; this is
consistent with the results in Figure 6b. The airflow is directed towards the bottom surface of
the room and spread outwards in all directions. As the airflow hits the bottom surface the air
slows down and flows through the side walls. The smoke is less visible on the left side of the
ventilated space, which is due to the exhaust quadrant pulling the air out of the room. The
0
0.5
1
1.5
2
2.5
3
1 2 3 4 5 6 7 8 9 10 11 12 13 14 15 16
Aver
age
vel
oci
ty (
m/s
) CFD Experimental
(a)
(b)
12
smoke visualisation tests also helped to detect small air short-circuiting (air entering through the
supply quadrant and immediately leaving through the exhaust without flowing inside the room).
Since the smoke is injected near the wind tower inlet (0.2 m distance) and the high speed
camera is configured to clearly visualise the internal flows which are at a much lower speed
than the external flows, the recirculation at the leeward side of the wind tower is not clearly
seen in the image. The separation above the device and flow at the windward side are very
similar to the predicted streamlines.
Figure 6 (a) experimental flow visualisation inside the test room with the wind tower (b)
combined CFD predicted streamlines and actual smoke visualisation [10].
4. Results and discussion
4.1 Multi-wind tower aerodynamics
Figure 7 shows the combined contour plot and airflow path predicted by the numerical models.
From the contour plot, the airflow enters the inlet boundary wall (bottom) and the airflow splits
with some entering the wind towers and some passing around and exiting to the pressure outlet
on the opposite side (top). The airflow slows down from 3 m/s to 1.2 m/s as it approaches the
first wind tower (windward) and accelerates as it hits the cross-dividers reaching a maximum
speed of 2.5 m/s. Large re-circulations are present on the leeward side of the first wind tower.
Clearly, locating the inlet opening of another wind tower device in this region won’t be
advantageous.
Figure 7, Cases 1 - 3 show the effect of increased spacing from 3 – 5 m on the velocity profile
and streamlines around two parallel wind towers. The wake created by the windward wind
tower prevents significant airflow into the leeward wind tower due to the large region of slow
supply
exhaust
m/s
recirculation recirculation
3 m/s
Short-circuiting
a b
13
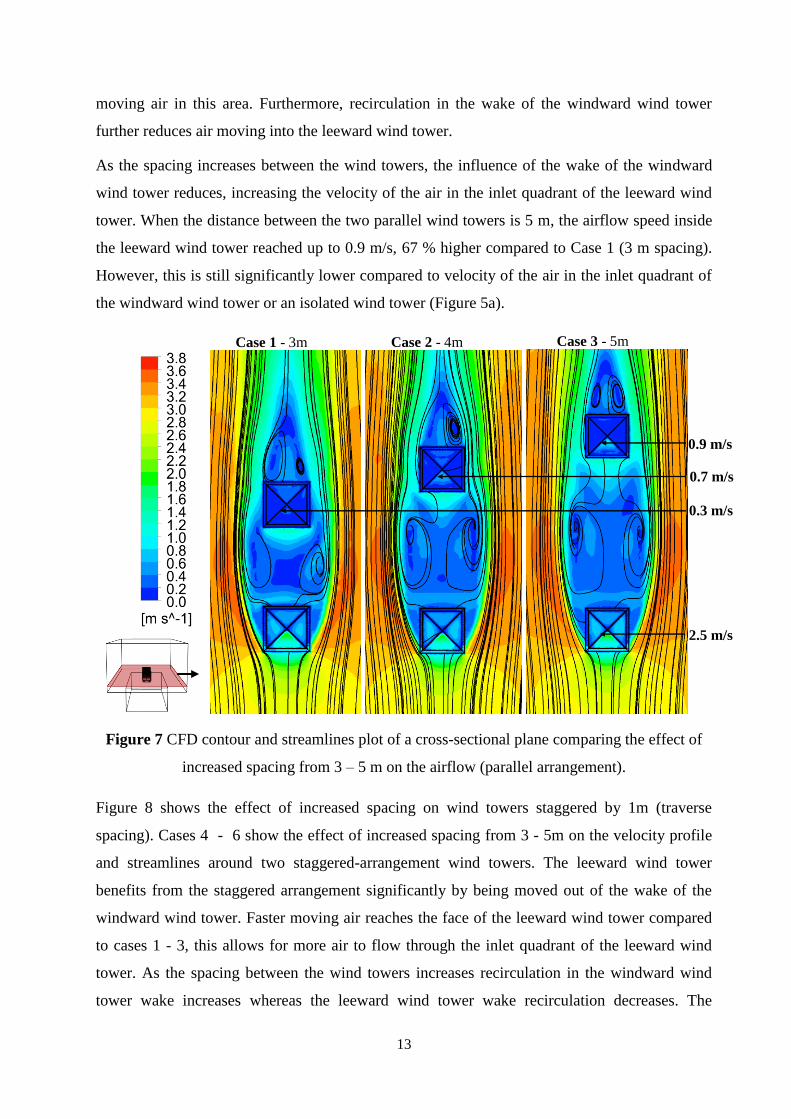
moving air in this area. Furthermore, recirculation in the wake of the windward wind tower
further reduces air moving into the leeward wind tower.
As the spacing increases between the wind towers, the influence of the wake of the windward
wind tower reduces, increasing the velocity of the air in the inlet quadrant of the leeward wind
tower. When the distance between the two parallel wind towers is 5 m, the airflow speed inside
the leeward wind tower reached up to 0.9 m/s, 67 % higher compared to Case 1 (3 m spacing).
However, this is still significantly lower compared to velocity of the air in the inlet quadrant of
the windward wind tower or an isolated wind tower (Figure 5a).
Figure 7 CFD contour and streamlines plot of a cross-sectional plane comparing the effect of
increased spacing from 3 – 5 m on the airflow (parallel arrangement).
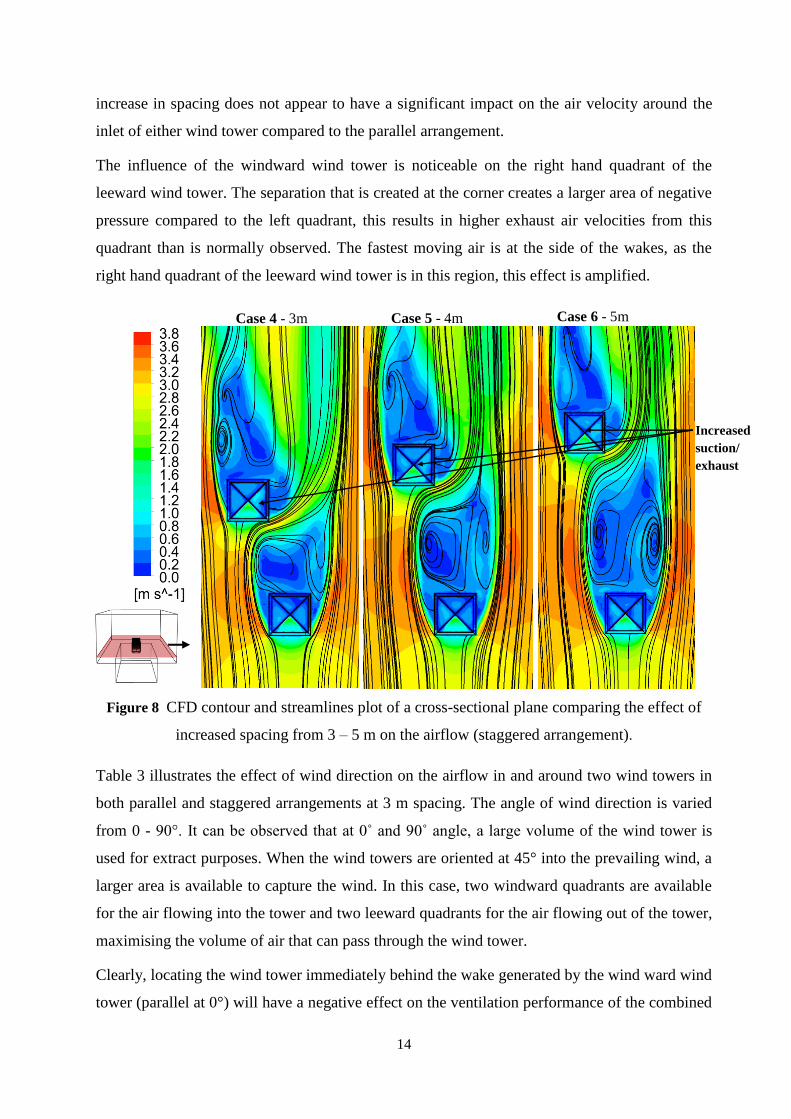
Figure 8 shows the effect of increased spacing on wind towers staggered by 1m (traverse
spacing). Cases 4 - 6 show the effect of increased spacing from 3 - 5m on the velocity profile
and streamlines around two staggered-arrangement wind towers. The leeward wind tower
benefits from the staggered arrangement significantly by being moved out of the wake of the
windward wind tower. Faster moving air reaches the face of the leeward wind tower compared
to cases 1 - 3, this allows for more air to flow through the inlet quadrant of the leeward wind
tower. As the spacing between the wind towers increases recirculation in the windward wind
tower wake increases whereas the leeward wind tower wake recirculation decreases. The
Case 1 - 3m Case 2 - 4m
Case 3 - 5m
0.9 m/s
0.7 m/s
0.3 m/s
2.5 m/s
14
increase in spacing does not appear to have a significant impact on the air velocity around the
inlet of either wind tower compared to the parallel arrangement.
The influence of the windward wind tower is noticeable on the right hand quadrant of the
leeward wind tower. The separation that is created at the corner creates a larger area of negative
pressure compared to the left quadrant, this results in higher exhaust air velocities from this
quadrant than is normally observed. The fastest moving air is at the side of the wakes, as the
right hand quadrant of the leeward wind tower is in this region, this effect is amplified.
Figure 8 CFD contour and streamlines plot of a cross-sectional plane comparing the effect of
increased spacing from 3 – 5 m on the airflow (staggered arrangement).
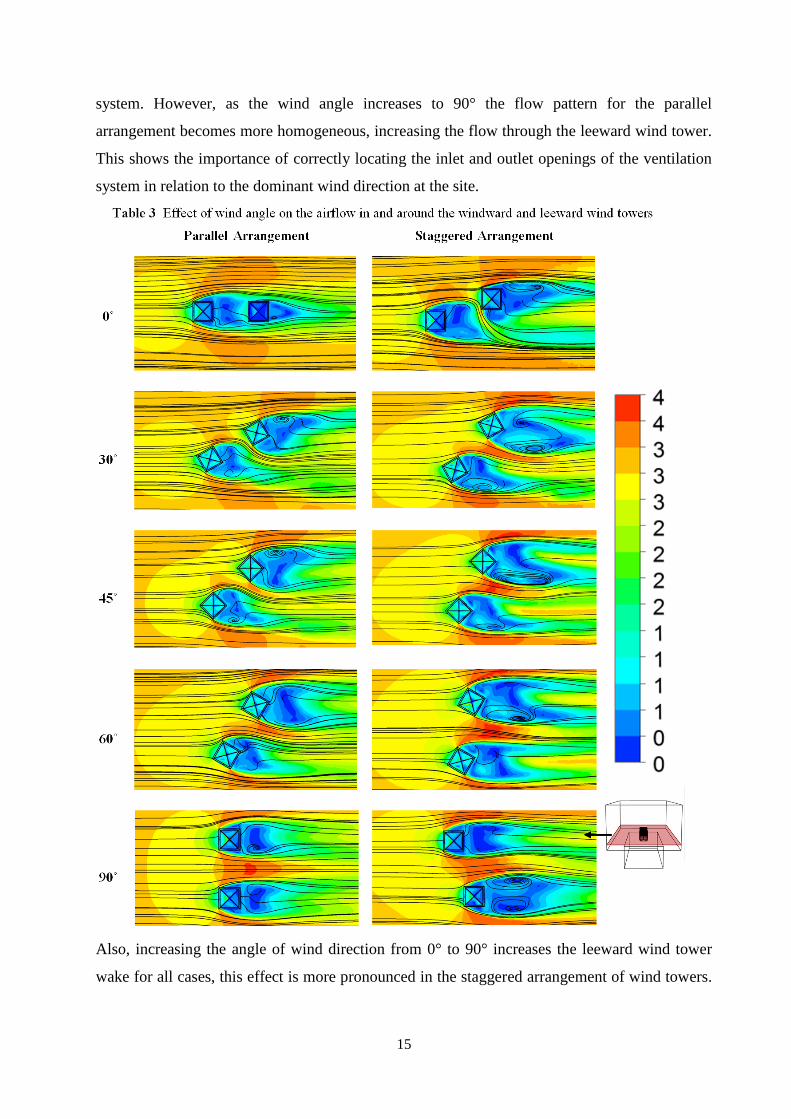
Table 3 illustrates the effect of wind direction on the airflow in and around two wind towers in
both parallel and staggered arrangements at 3 m spacing. The angle of wind direction is varied
from 0 - 90°. It can be observed that at 0˚ and 90˚ angle, a large volume of the wind tower is
used for extract purposes. When the wind towers are oriented at 45° into the prevailing wind, a
larger area is available to capture the wind. In this case, two windward quadrants are available
for the air flowing into the tower and two leeward quadrants for the air flowing out of the tower,
maximising the volume of air that can pass through the wind tower.
Clearly, locating the wind tower immediately behind the wake generated by the wind ward wind
tower (parallel at 0°) will have a negative effect on the ventilation performance of the combined
Case 4 - 3m Case 5 - 4m
Case 6 - 5m
Increased
suction/
exhaust
15
system. However, as the wind angle increases to 90° the flow pattern for the parallel
arrangement becomes more homogeneous, increasing the flow through the leeward wind tower.
This shows the importance of correctly locating the inlet and outlet openings of the ventilation
system in relation to the dominant wind direction at the site.
Also, increasing the angle of wind direction from 0° to 90° increases the leeward wind tower
wake for all cases, this effect is more pronounced in the staggered arrangement of wind towers.
16
For the staggered arrangement, the negative effect of the windward on the leeward wind tower
is minimal for all wind directions as compared to the parallel arrangement.
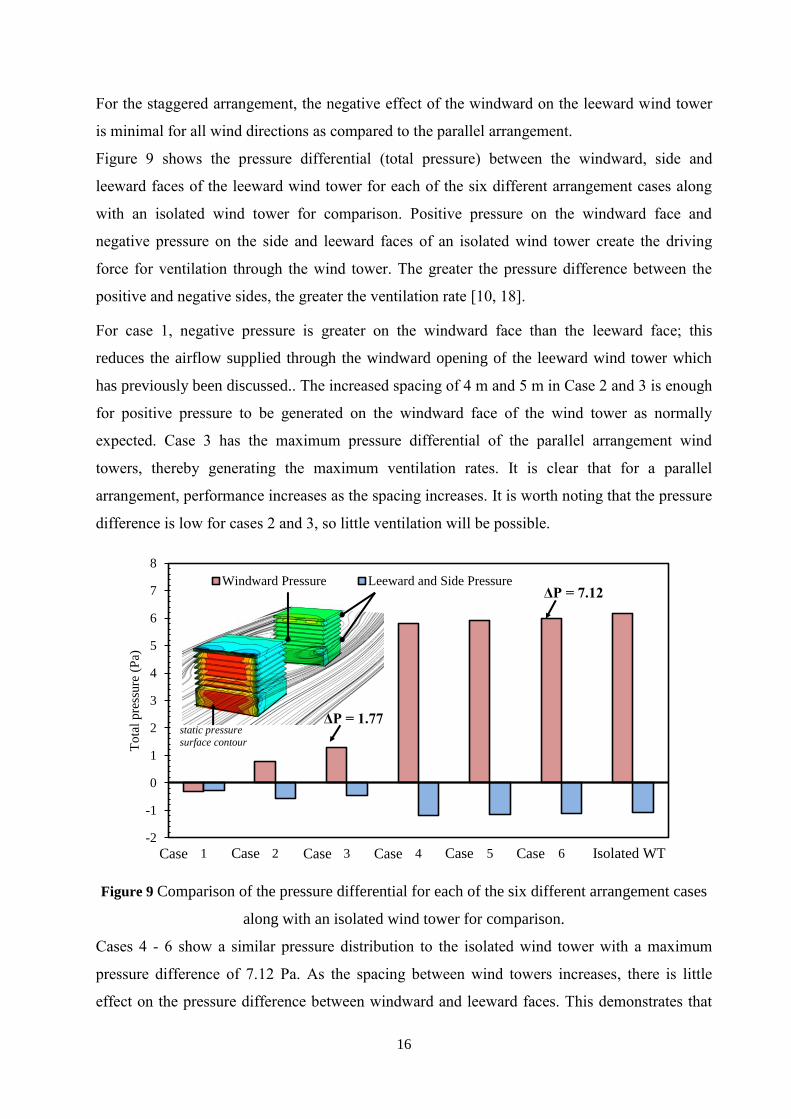
Figure 9 shows the pressure differential (total pressure) between the windward, side and
leeward faces of the leeward wind tower for each of the six different arrangement cases along
with an isolated wind tower for comparison. Positive pressure on the windward face and
negative pressure on the side and leeward faces of an isolated wind tower create the driving
force for ventilation through the wind tower. The greater the pressure difference between the
positive and negative sides, the greater the ventilation rate [10, 18].
For case 1, negative pressure is greater on the windward face than the leeward face; this
reduces the airflow supplied through the windward opening of the leeward wind tower which
has previously been discussed.. The increased spacing of 4 m and 5 m in Case 2 and 3 is enough
for positive pressure to be generated on the windward face of the wind tower as normally
expected. Case 3 has the maximum pressure differential of the parallel arrangement wind
towers, thereby generating the maximum ventilation rates. It is clear that for a parallel
arrangement, performance increases as the spacing increases. It is worth noting that the pressure
difference is low for cases 2 and 3, so little ventilation will be possible.
Figure 9 Comparison of the pressure differential for each of the six different arrangement cases
along with an isolated wind tower for comparison.
Cases 4 - 6 show a similar pressure distribution to the isolated wind tower with a maximum
pressure difference of 7.12 Pa. As the spacing between wind towers increases, there is little
effect on the pressure difference between windward and leeward faces. This demonstrates that
-2
-1
0
1
2
3
4
5
6
7
8
1 2 3 4 5 6 7
To
tal
pre
ssure
(P
a)
Windward Pressure Leeward and Side PressureΔP = 7.12
ΔP = 1.77
Isolated WT Case Case Case Case Case Case
static pressure
surface contour
17
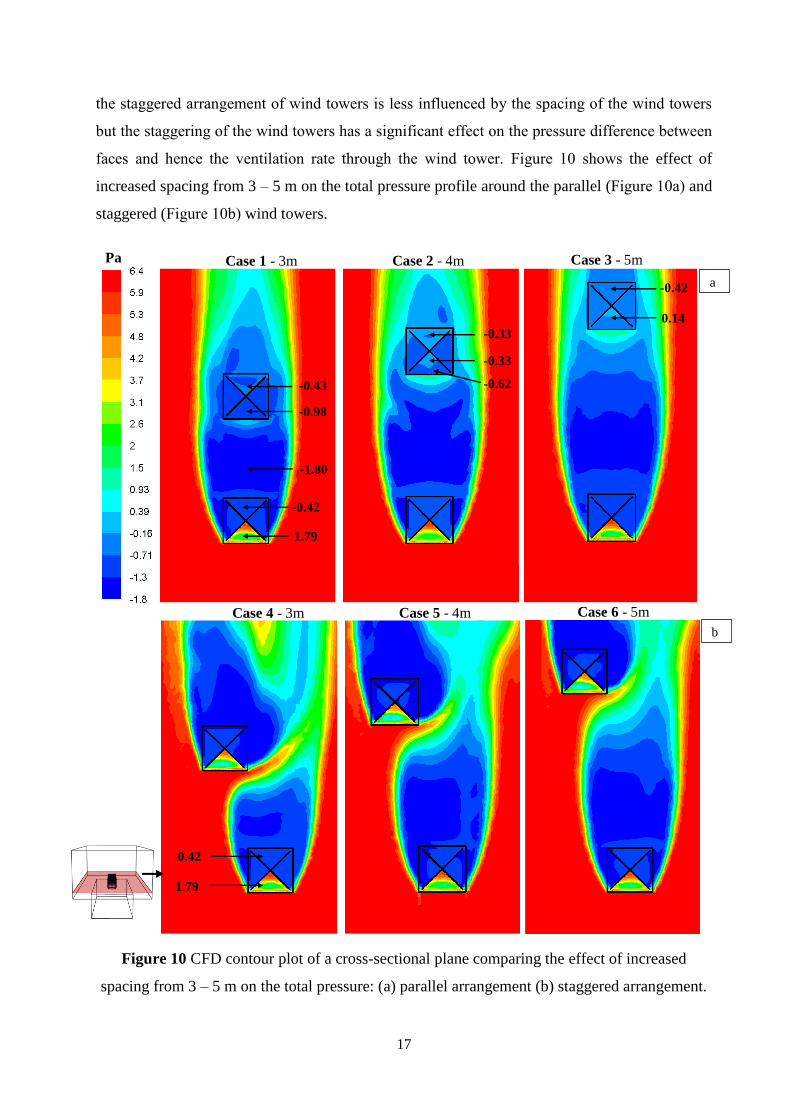
the staggered arrangement of wind towers is less influenced by the spacing of the wind towers
but the staggering of the wind towers has a significant effect on the pressure difference between
faces and hence the ventilation rate through the wind tower. Figure 10 shows the effect of
increased spacing from 3 – 5 m on the total pressure profile around the parallel (Figure 10a) and
staggered (Figure 10b) wind towers.
Figure 10 CFD contour plot of a cross-sectional plane comparing the effect of increased
spacing from 3 – 5 m on the total pressure: (a) parallel arrangement (b) staggered arrangement.
-0.43
-0.98
1.79
-0.42
-0.33
-0.33
-0.62
-0.42
0.14
Case 1 - 3m Case 2 - 4m
Case 3 - 5m
Pa
1.79
-0.42
Case 4 - 3m Case 5 - 4m
Case 6 - 5m
a
b
-1.80
18
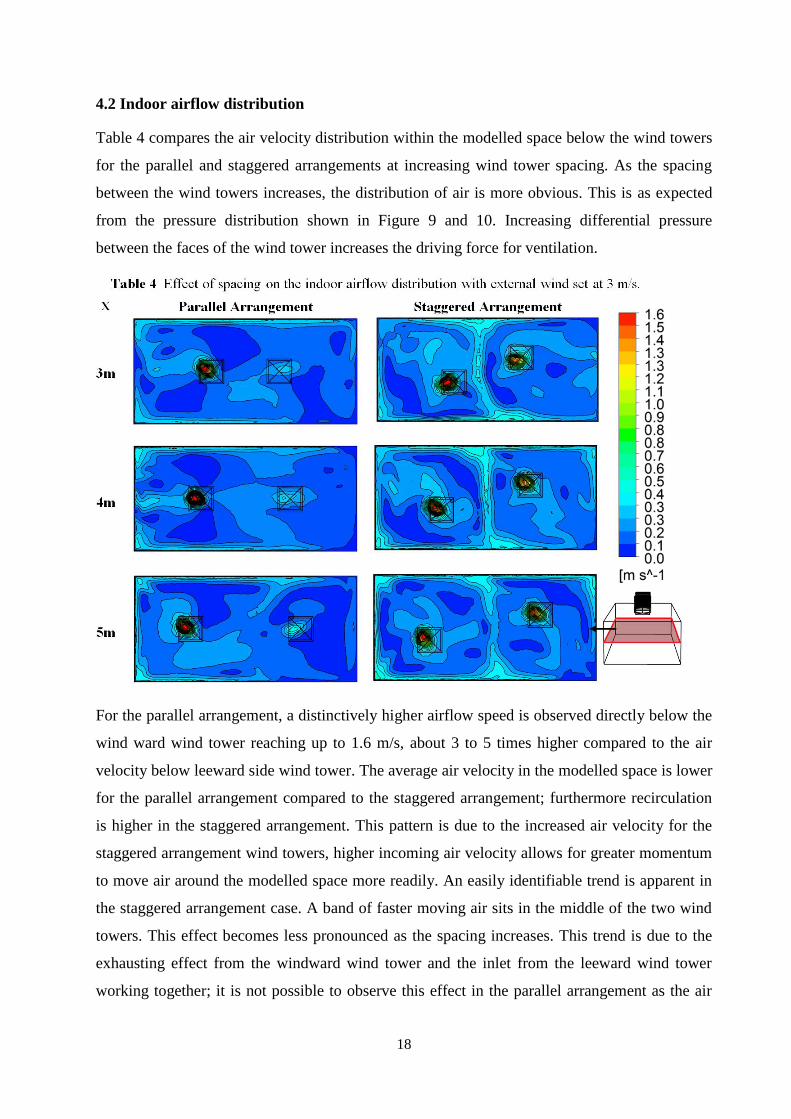
4.2 Indoor airflow distribution
Table 4 compares the air velocity distribution within the modelled space below the wind towers
for the parallel and staggered arrangements at increasing wind tower spacing. As the spacing
between the wind towers increases, the distribution of air is more obvious. This is as expected
from the pressure distribution shown in Figure 9 and 10. Increasing differential pressure
between the faces of the wind tower increases the driving force for ventilation.
For the parallel arrangement, a distinctively higher airflow speed is observed directly below the
wind ward wind tower reaching up to 1.6 m/s, about 3 to 5 times higher compared to the air
velocity below leeward side wind tower. The average air velocity in the modelled space is lower
for the parallel arrangement compared to the staggered arrangement; furthermore recirculation
is higher in the staggered arrangement. This pattern is due to the increased air velocity for the
staggered arrangement wind towers, higher incoming air velocity allows for greater momentum
to move air around the modelled space more readily. An easily identifiable trend is apparent in
the staggered arrangement case. A band of faster moving air sits in the middle of the two wind
towers. This effect becomes less pronounced as the spacing increases. This trend is due to the
exhausting effect from the windward wind tower and the inlet from the leeward wind tower
working together; it is not possible to observe this effect in the parallel arrangement as the air
19
velocity inlet of the leeward wind tower is not high enough. Evidently, the spacing and
arrangement of the wind towers does not only influence the airflow pattern in and around the
wind tower but also the indoor airflow distribution.
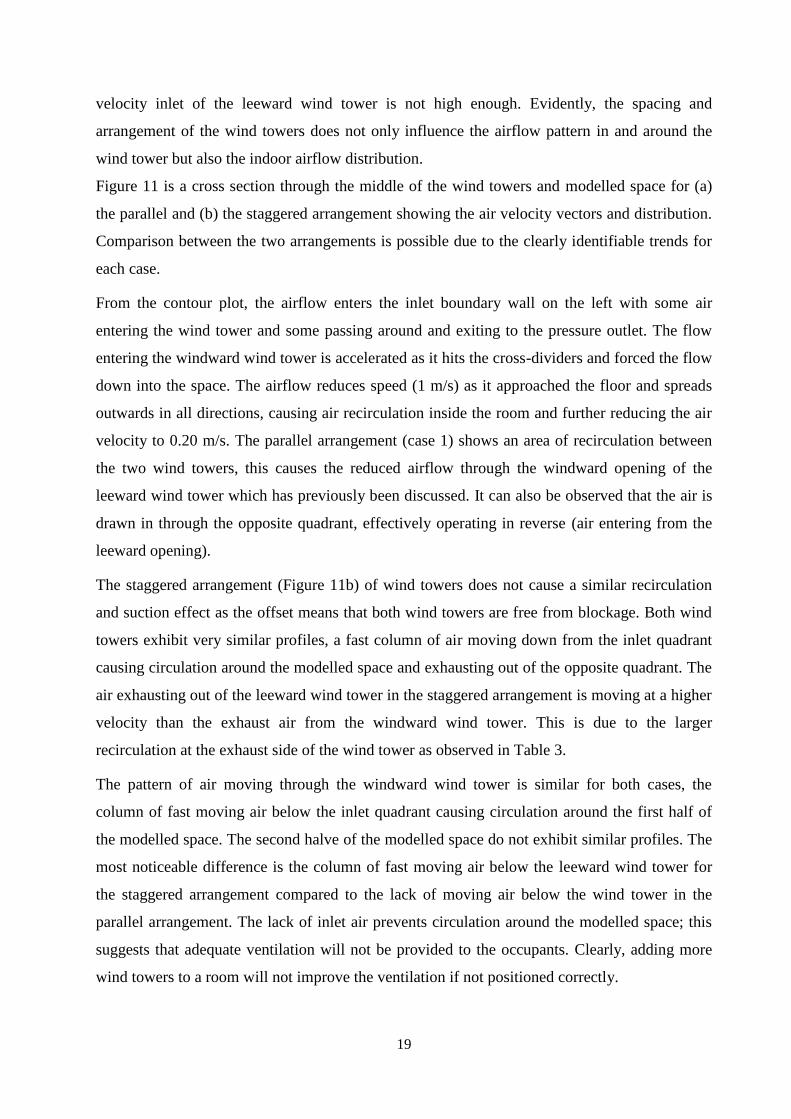
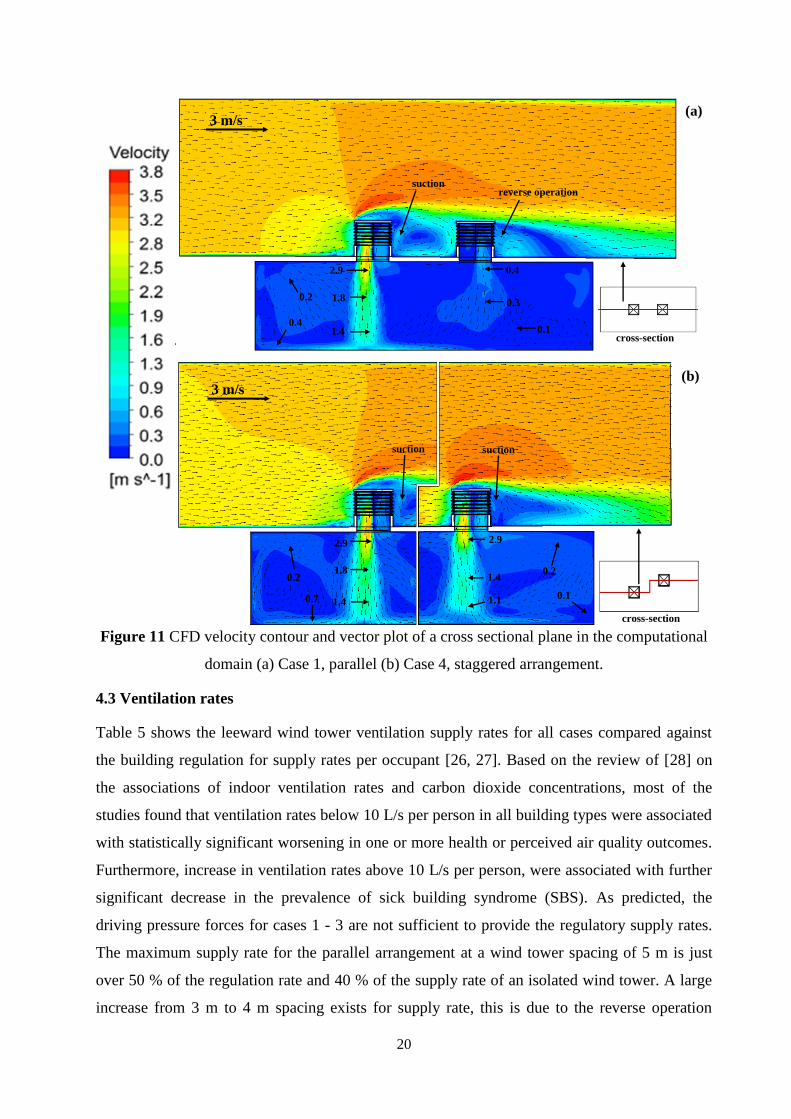
Figure 11 is a cross section through the middle of the wind towers and modelled space for (a)
the parallel and (b) the staggered arrangement showing the air velocity vectors and distribution.
Comparison between the two arrangements is possible due to the clearly identifiable trends for
each case.
From the contour plot, the airflow enters the inlet boundary wall on the left with some air
entering the wind tower and some passing around and exiting to the pressure outlet. The flow
entering the windward wind tower is accelerated as it hits the cross-dividers and forced the flow
down into the space. The airflow reduces speed (1 m/s) as it approached the floor and spreads
outwards in all directions, causing air recirculation inside the room and further reducing the air
velocity to 0.20 m/s. The parallel arrangement (case 1) shows an area of recirculation between
the two wind towers, this causes the reduced airflow through the windward opening of the
leeward wind tower which has previously been discussed. It can also be observed that the air is
drawn in through the opposite quadrant, effectively operating in reverse (air entering from the
leeward opening).
The staggered arrangement (Figure 11b) of wind towers does not cause a similar recirculation
and suction effect as the offset means that both wind towers are free from blockage. Both wind
towers exhibit very similar profiles, a fast column of air moving down from the inlet quadrant
causing circulation around the modelled space and exhausting out of the opposite quadrant. The
air exhausting out of the leeward wind tower in the staggered arrangement is moving at a higher
velocity than the exhaust air from the windward wind tower. This is due to the larger
recirculation at the exhaust side of the wind tower as observed in Table 3.
The pattern of air moving through the windward wind tower is similar for both cases, the
column of fast moving air below the inlet quadrant causing circulation around the first half of
the modelled space. The second halve of the modelled space do not exhibit similar profiles. The
most noticeable difference is the column of fast moving air below the leeward wind tower for
the staggered arrangement compared to the lack of moving air below the wind tower in the
parallel arrangement. The lack of inlet air prevents circulation around the modelled space; this
suggests that adequate ventilation will not be provided to the occupants. Clearly, adding more
wind towers to a room will not improve the ventilation if not positioned correctly.
20
Figure 11 CFD velocity contour and vector plot of a cross sectional plane in the computational
domain (a) Case 1, parallel (b) Case 4, staggered arrangement.
4.3 Ventilation rates
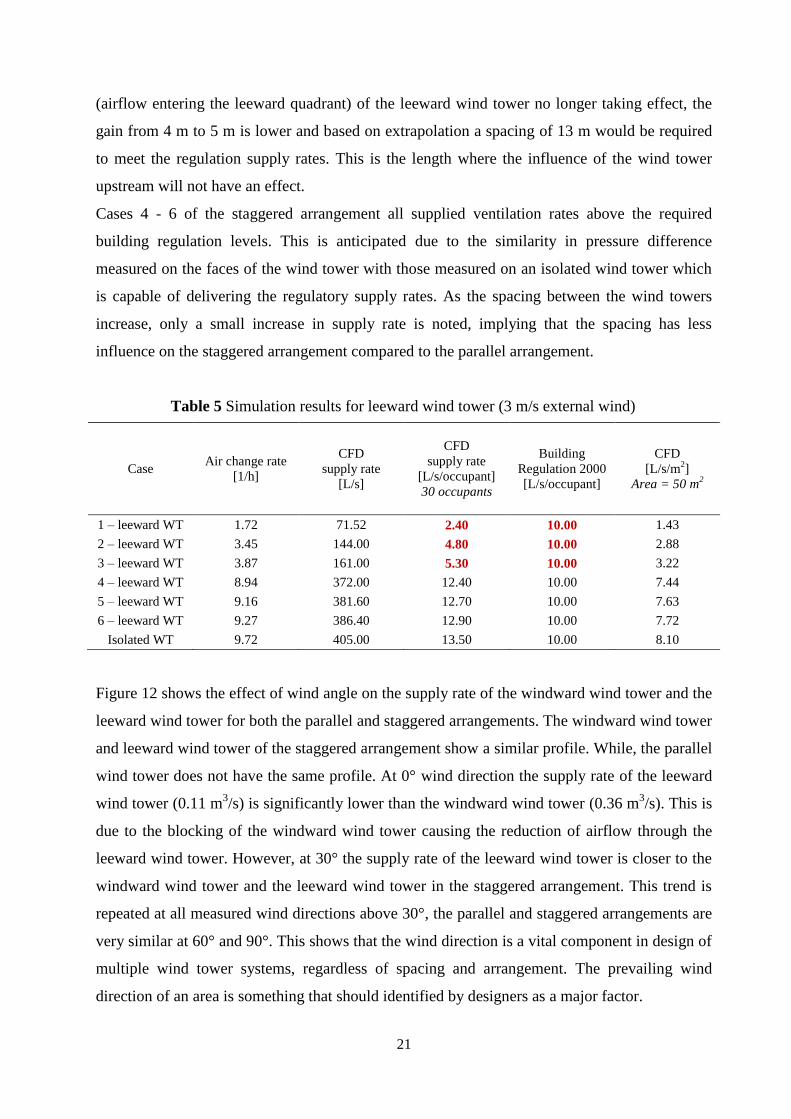
Table 5 shows the leeward wind tower ventilation supply rates for all cases compared against
the building regulation for supply rates per occupant [26, 27]. Based on the review of [28] on
the associations of indoor ventilation rates and carbon dioxide concentrations, most of the
studies found that ventilation rates below 10 L/s per person in all building types were associated
with statistically significant worsening in one or more health or perceived air quality outcomes.
Furthermore, increase in ventilation rates above 10 L/s per person, were associated with further
significant decrease in the prevalence of sick building syndrome (SBS). As predicted, the
driving pressure forces for cases 1 - 3 are not sufficient to provide the regulatory supply rates.
The maximum supply rate for the parallel arrangement at a wind tower spacing of 5 m is just
over 50 % of the regulation rate and 40 % of the supply rate of an isolated wind tower. A large
increase from 3 m to 4 m spacing exists for supply rate, this is due to the reverse operation
`
3 m/s
2.9
1.8
1.4 0.4
0.2
0.4
0.3
0.1
reverse operation suction
0.2
0.7
1.4
2.9
1.8
1.4
2.9
0.2
1.1 0.1
cross-section
cross-section
(a)
(b) 3 m/s
suction suction
21
(airflow entering the leeward quadrant) of the leeward wind tower no longer taking effect, the
gain from 4 m to 5 m is lower and based on extrapolation a spacing of 13 m would be required
to meet the regulation supply rates. This is the length where the influence of the wind tower
upstream will not have an effect.
Cases 4 - 6 of the staggered arrangement all supplied ventilation rates above the required
building regulation levels. This is anticipated due to the similarity in pressure difference
measured on the faces of the wind tower with those measured on an isolated wind tower which
is capable of delivering the regulatory supply rates. As the spacing between the wind towers
increase, only a small increase in supply rate is noted, implying that the spacing has less
influence on the staggered arrangement compared to the parallel arrangement.
Table 5 Simulation results for leeward wind tower (3 m/s external wind)
Case Air change rate
[1/h]
CFD
supply rate
[L/s]
CFD
supply rate
[L/s/occupant]
30 occupants
Building
Regulation 2000
[L/s/occupant]
CFD
[L/s/m2]
Area = 50 m2
1 – leeward WT 1.72 71.52 2.40 10.00 1.43
2 – leeward WT 3.45 144.00 4.80 10.00 2.88
3 – leeward WT 3.87 161.00 5.30 10.00 3.22
4 – leeward WT 8.94 372.00 12.40 10.00 7.44
5 – leeward WT 9.16 381.60 12.70 10.00 7.63
6 – leeward WT 9.27 386.40 12.90 10.00 7.72
Isolated WT 9.72 405.00 13.50 10.00 8.10
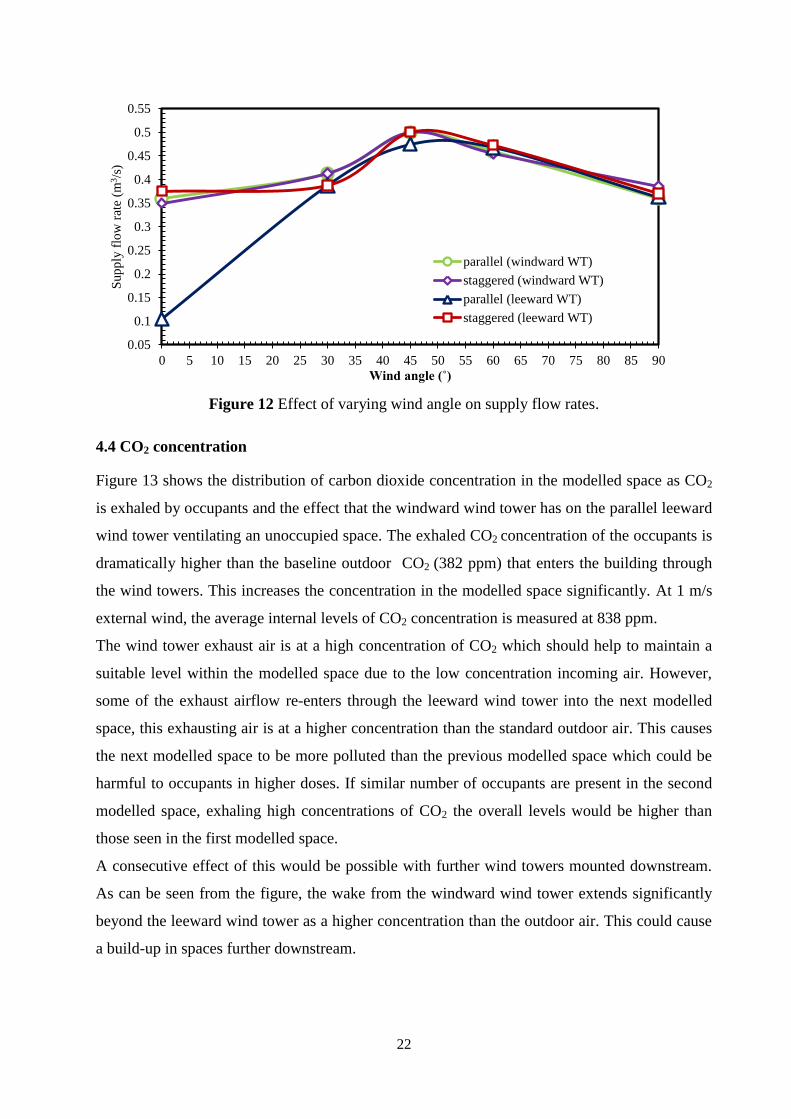
Figure 12 shows the effect of wind angle on the supply rate of the windward wind tower and the
leeward wind tower for both the parallel and staggered arrangements. The windward wind tower
and leeward wind tower of the staggered arrangement show a similar profile. While, the parallel
wind tower does not have the same profile. At 0° wind direction the supply rate of the leeward
wind tower (0.11 m3/s) is significantly lower than the windward wind tower (0.36 m
3/s). This is
due to the blocking of the windward wind tower causing the reduction of airflow through the
leeward wind tower. However, at 30° the supply rate of the leeward wind tower is closer to the
windward wind tower and the leeward wind tower in the staggered arrangement. This trend is
repeated at all measured wind directions above 30°, the parallel and staggered arrangements are
very similar at 60° and 90°. This shows that the wind direction is a vital component in design of
multiple wind tower systems, regardless of spacing and arrangement. The prevailing wind
direction of an area is something that should identified by designers as a major factor.
22
Figure 12 Effect of varying wind angle on supply flow rates.
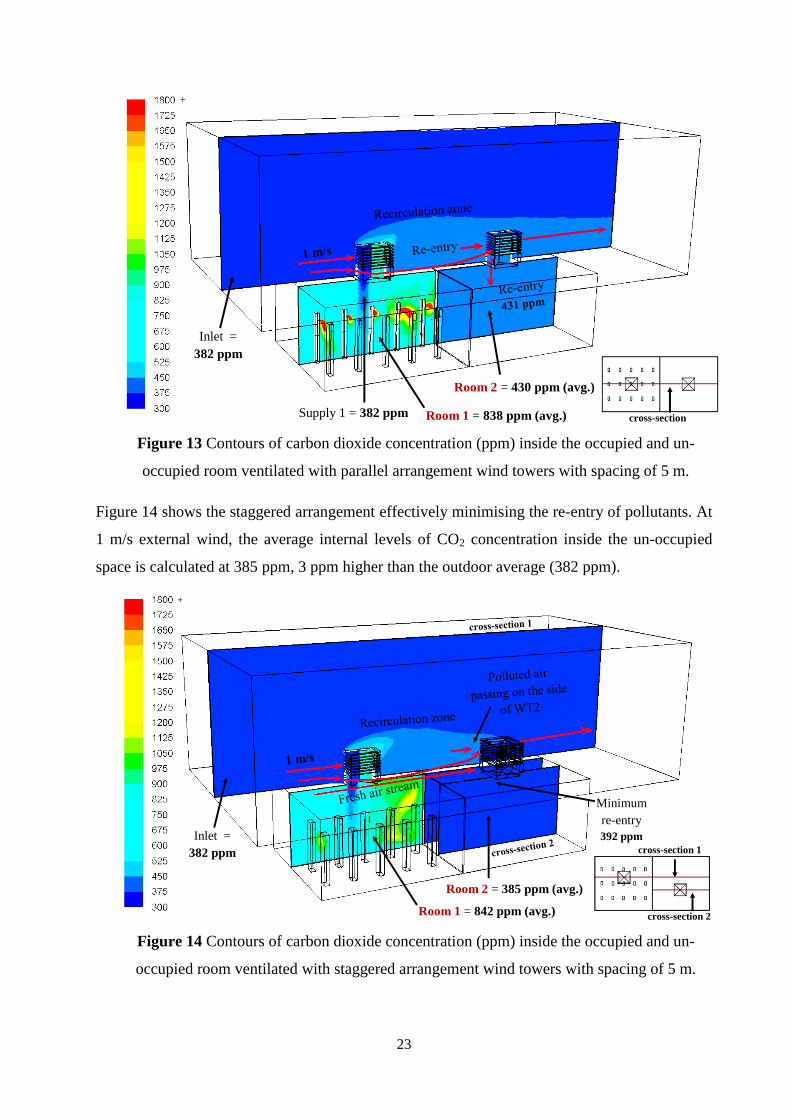
4.4 CO2 concentration
Figure 13 shows the distribution of carbon dioxide concentration in the modelled space as CO2
is exhaled by occupants and the effect that the windward wind tower has on the parallel leeward
wind tower ventilating an unoccupied space. The exhaled CO2 concentration of the occupants is
dramatically higher than the baseline outdoor CO2 (382 ppm) that enters the building through
the wind towers. This increases the concentration in the modelled space significantly. At 1 m/s
external wind, the average internal levels of CO2 concentration is measured at 838 ppm.
The wind tower exhaust air is at a high concentration of CO2 which should help to maintain a
suitable level within the modelled space due to the low concentration incoming air. However,
some of the exhaust airflow re-enters through the leeward wind tower into the next modelled
space, this exhausting air is at a higher concentration than the standard outdoor air. This causes
the next modelled space to be more polluted than the previous modelled space which could be
harmful to occupants in higher doses. If similar number of occupants are present in the second
modelled space, exhaling high concentrations of CO2 the overall levels would be higher than
those seen in the first modelled space.
A consecutive effect of this would be possible with further wind towers mounted downstream.
As can be seen from the figure, the wake from the windward wind tower extends significantly
beyond the leeward wind tower as a higher concentration than the outdoor air. This could cause
a build-up in spaces further downstream.
0.05
0.1
0.15
0.2
0.25
0.3
0.35
0.4
0.45
0.5
0.55
0 5 10 15 20 25 30 35 40 45 50 55 60 65 70 75 80 85 90
Sup
ply
flo
w r
ate
(m3/s
)
Wind angle (˚)
parallel (windward WT)
staggered (windward WT)
parallel (leeward WT)
staggered (leeward WT)
23
Figure 13 Contours of carbon dioxide concentration (ppm) inside the occupied and un-
occupied room ventilated with parallel arrangement wind towers with spacing of 5 m.
Figure 14 shows the staggered arrangement effectively minimising the re-entry of pollutants. At
1 m/s external wind, the average internal levels of CO2 concentration inside the un-occupied
space is calculated at 385 ppm, 3 ppm higher than the outdoor average (382 ppm).
Figure 14 Contours of carbon dioxide concentration (ppm) inside the occupied and un-
occupied room ventilated with staggered arrangement wind towers with spacing of 5 m.
4.1.1.1
`
Inlet =
382 ppm
Supply 1 = 382 ppm Room 1 = 838 ppm (avg.)
Room 2 = 430 ppm (avg.)
cross-section
+
4.1.1.1
4.1.1.2
4.1.1.3
4.1.1.4
4.1.1.5
cross-section 2
cross-section 1
Room 1 = 842 ppm (avg.)
Room 2 = 385 ppm (avg.)
Minimum
re-entry
392 ppm Inlet =
382 ppm
+
24
In the external airflow analysis in Table 3 (0˚ parallel), the accelerated air stream passing
between the two wind towers creates a boundary or separation between the recirculation region
(high concentration of CO2) generated by the windward wind tower and the fresh air stream
approaching the leeward wind tower which effectively minimises the exhaust pollutants
entering the air stream of the leeward wind tower.
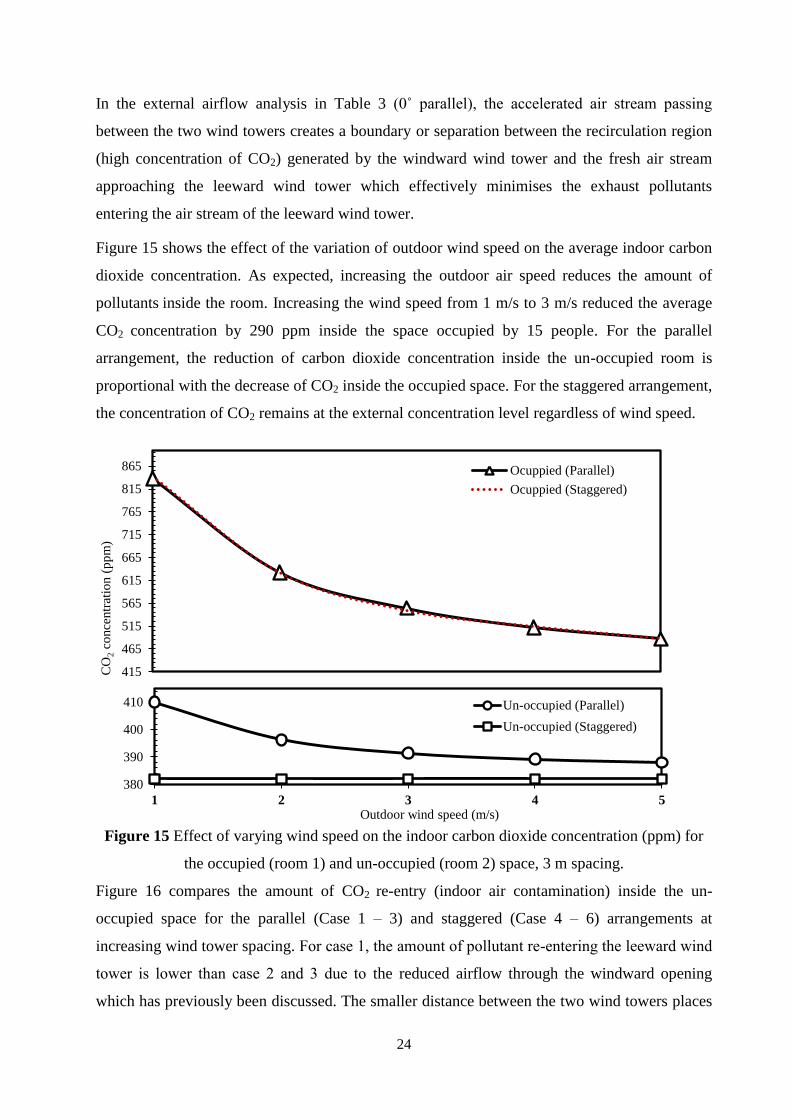
Figure 15 shows the effect of the variation of outdoor wind speed on the average indoor carbon
dioxide concentration. As expected, increasing the outdoor air speed reduces the amount of
pollutants inside the room. Increasing the wind speed from 1 m/s to 3 m/s reduced the average
CO2 concentration by 290 ppm inside the space occupied by 15 people. For the parallel
arrangement, the reduction of carbon dioxide concentration inside the un-occupied room is
proportional with the decrease of CO2 inside the occupied space. For the staggered arrangement,
the concentration of CO2 remains at the external concentration level regardless of wind speed.
Figure 15 Effect of varying wind speed on the indoor carbon dioxide concentration (ppm) for
the occupied (room 1) and un-occupied (room 2) space, 3 m spacing.
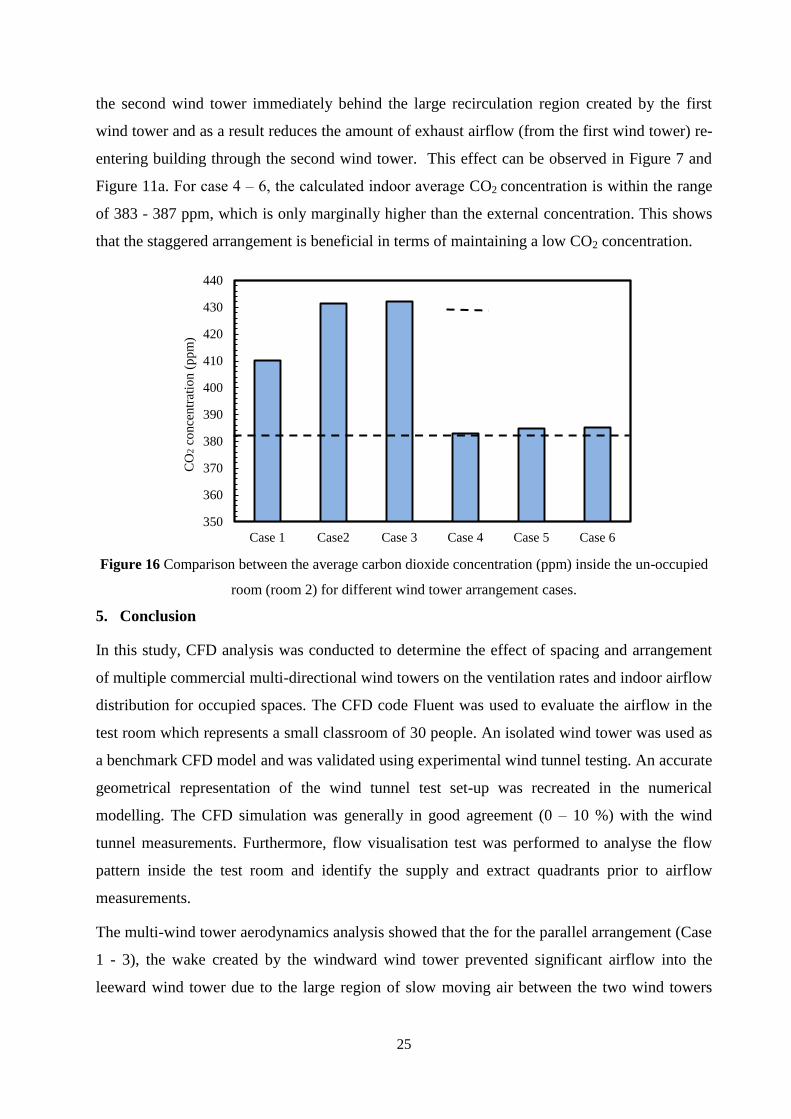
Figure 16 compares the amount of CO2 re-entry (indoor air contamination) inside the un-
occupied space for the parallel (Case 1 – 3) and staggered (Case 4 – 6) arrangements at
increasing wind tower spacing. For case 1, the amount of pollutant re-entering the leeward wind
tower is lower than case 2 and 3 due to the reduced airflow through the windward opening
which has previously been discussed. The smaller distance between the two wind towers places
415
465
515
565
615
665
715
765
815
865
CO
2 c
once
ntr
atio
n (
pp
m)
Ocuppied (Parallel)
Ocuppied (Staggered)
380
390
400
410
1 2 3 4 5Outdoor wind speed (m/s)
Un-occupied (Parallel)
Un-occupied (Staggered)
25
the second wind tower immediately behind the large recirculation region created by the first
wind tower and as a result reduces the amount of exhaust airflow (from the first wind tower) re-
entering building through the second wind tower. This effect can be observed in Figure 7 and
Figure 11a. For case 4 – 6, the calculated indoor average CO2 concentration is within the range
of 383 - 387 ppm, which is only marginally higher than the external concentration. This shows
that the staggered arrangement is beneficial in terms of maintaining a low CO2 concentration.
Figure 16 Comparison between the average carbon dioxide concentration (ppm) inside the un-occupied
room (room 2) for different wind tower arrangement cases.
5. Conclusion
In this study, CFD analysis was conducted to determine the effect of spacing and arrangement
of multiple commercial multi-directional wind towers on the ventilation rates and indoor airflow
distribution for occupied spaces. The CFD code Fluent was used to evaluate the airflow in the
test room which represents a small classroom of 30 people. An isolated wind tower was used as
a benchmark CFD model and was validated using experimental wind tunnel testing. An accurate
geometrical representation of the wind tunnel test set-up was recreated in the numerical
modelling. The CFD simulation was generally in good agreement (0 – 10 %) with the wind
tunnel measurements. Furthermore, flow visualisation test was performed to analyse the flow
pattern inside the test room and identify the supply and extract quadrants prior to airflow
measurements.
The multi-wind tower aerodynamics analysis showed that the for the parallel arrangement (Case
1 - 3), the wake created by the windward wind tower prevented significant airflow into the
leeward wind tower due to the large region of slow moving air between the two wind towers
350
360
370
380
390
400
410
420
430
440
Case 1 Case2 Case 3 Case 4 Case 5 Case 6
CO
2 c
once
ntr
atio
n (
pp
m)
26
and in some cases caused the leeward to operate in reverse (airflow entering the leeward side).
As the spacing increased between the parallel wind towers, the influence of the wake of the
windward wind tower reduces, increasing the velocity of the air in the inlet quadrant of the
leeward wind tower. The leeward wind tower benefitted from the staggered arrangement (Case
4 - 6) significantly by being moved out of the wake of the windward wind tower. Additionally,
the large separation created at the corner of the right hand quadrant of the leeward wind tower in
staggered arrangement, generated a larger area of negative pressure which resulted in higher
exhaust air velocities from this quadrant.
The simulation of various wind directions showed that as the angle increased to 90° the flow
pattern for the parallel arrangement become more homogeneous, increasing the flow through the
leeward wind tower. The wind direction is a vital component in design of multiple wind tower
systems, regardless of spacing and arrangement. The prevailing wind direction of an area is a
major factor that should identified by designers. The indoor airflow distribution analysis
highlighted the importance of correctly locating the wind tower diffusers for maximum natural
ventilation performance. The spacing and arrangement of the wind towers does not only
influence the outdoor airflow pattern around the device but it also affects the indoor airflow
pattern. The leeward wind tower ventilation supply rates for all cases were compared against the
building regulations. The driving pressure forces for cases 1 - 3 were not sufficient to provide
the regulatory supply rates of 10 L/s per occupant at an external wind speed of 3 m/s. While the
supply ventilation rates for cases 4 – 6 were all above the required building regulation levels.
The second part of the study investigated the effect of wind tower configurations on the indoor
CO2 concentration and also examined the possible re-entry of the indoor air pollutants to a
space ventilated by a second leeward wind tower, thereby offsetting the pollutant removal. The
CO2 analysis of the indoor space with parallel wind towers at 0˚ wind angle confirmed that the
exhaust airflow from the windward wind tower re-enters into the next modelled space, this
exhausting air was at a higher concentration than the standard outdoor air. While the staggered
arrangement effectively minimised the re-entry of pollutants.
Acknowledgement
The support by the School of Civil Engineering, University of Leeds is gratefully
acknowledged. The statements made herein are solely the responsibility of the authors.

27
References
[1] Demokritou P, Yang C, Chen Q, Spengler J. An experimental method for contaminant
dispersal characterization in large industrial buildings for indoor air quality (IAQ) applications.
Building and Environment 2002;37:305-312.
[2] Hughes BR, Mak CM. A Study of wind and buoyancy driven flows through commercial
wind towers. Building and Environment 2011;43:1784-1791.
[3] Montazeri H. Experimental and numerical study on natural ventilation performance of
various multi-opening wind catchers. Building and Environment 2011;46:370-378.
[4] Liu S, Mak CM, Niu J. Numerical evaluation of louver configuration and ventilation
strategies for the windcatcher system. Building and Environment 2011;46:1600-1616.
[5] Jones BM, Kirby R. The Performance of Natural Ventilation Windcatchers in Schools - A
Comparison between Prediction and Measurement. International Journal of Ventilation
2010;9:273-286
[6] Dimitroulopoulou C. Ventilation in European dwellings: A review. Building and
Environment 2012;47:109-125.
[7] Mumovic D, Palmer J, Davies M, Orme M, Ridley I, Oreszczyn T, Judd C, Critchlow R,
Medina HA, Pilmoor G, Pearson C, Way P. Winter indoor air quality, thermal comfort and
acoustic performance of newly built secondary schools in England. Building and Environment
2009;44:1466-1477.
[8] Clements-Croome DJ, Awbi HB, Bakó-Biró Z, Kochhar N, Williams M. Ventilation rates in
schools. Building and Environment 2008;43:362-367.
[9] Hughes BR, Ghani SA. A numerical investigation into the effect of Windvent louver
external angle. Building and Environment 2010;44:237– 248.
[10] Calautit JK, Hughes BR. Wind tunnel and CFD study of the natural ventilation
performance of a commercial multi-directional wind tower. Building and Environment
2014;80:71-83.
[11] Hughes BR, Calautit JK, Ghani SA. The Development of Commercial Wind Towers for
Natural Ventilation: A Review. Applied Energy 2012;92:606-627.
[12] Elmaualim AA. Verification of design calculations of a wind catcher/tower natural
ventilation system with performance testing in a real building. International Journal of
Ventilation 2006: 4;393-404.
[13] Woods AW, Fitzgerald S, Livermore S. A comparison of winter pre-heating requirements
for natural displacement and natural mixing ventilation. Energy and Buildings: 2009;41:1306-
1312.
[14] Monodraught, Natural Ventilation – Windcatcher Classic (Square) [online], 2014, available
from: http://www.monodraught.com. [15] ANSYS® Academic Research. ANSYS FLUENT User’s Guide Release 14.0.
Pennsylvania: ANSYS, Inc; 2014 .
[16] Building Bulletin. Briefing framework for secondary school projects. Annesley, UK:
Department for Education and Skills; 2004.
[17] Calautit JK, Chaudhry HN, Hughes BR, Ghani SA. Comparison between evaporative
cooling and heat pipe assisted thermal loop for a commercial wind tower in hot and dry climatic
conditions. Applied Energy 2013;101:740-755.
28
[18] O’Connor D, Calautit JK, Hughes BR. A Study of Passive Ventilation Integrated with Heat
Recovery. Energy and Buildings 2014; http://dx.doi.org/10.1016/j.enbuild.2014.05.050.
[19] Bulińska A, Popiołek Z, Buliński Z. Experimentally validated CFD analysis on sampling
region determination of average indoor carbon dioxide concentration in occupied space.
Building and Environment 2014;72:319-331.
[20] Calautit JK, Hughes BR, Ghani SA. A Numerical Investigation into the Feasibility of
Integrating Green Building Technologies into Row Houses in the Middle East. Architectural
Science Review 2013;56:279-296.
[21] Calautit JK, Hughes BR, Ghani SA. Numerical investigation of the integration of heat
transfer devices into wind towers. Chemical Engineering Transactions 2013;34:43-48.
[22] Calautit JK, Chaudhry HN, Hughes BR, Sim LF. A validated design methodology for a
closed-loop subsonic wind tunnel. Journal of Wind Engineering and Industrial Aerodynamics
2014;125:180-194.
[23] Cermak J, Isyumov N. Wind tunnel studies of buildings and structure. US: ASCE
Publications; 1999.
[24] Cermak J. Applications of Fluid Mechanics to Wind Engineering. Journal of Fluids
Engineering 1975;97:9-38.
[25] Zhang Z, Zhang W, Zhai Z, Chen Q. Evaluation of Various Turbulence Models in
Predicting Airflow and Turbulence in Enclosed Environments by CFD: Part 2—Comparison
with Experimental Data from Literature. HVAC and R Research 2007;13:871-886.
[26] Building Regulations. Approved Document F1A: Means of Ventilation. NBS: London;
2010
[27] Calautit JK, Hughes BR, Chaudhry HN, Ghani SA. CFD analysis of a heat transfer device
integrated wind tower system for hot and dry climate. Applied Energy 2013;112:576-591.
[28] Seppänen OA, Fisk WJ, Mendell MJ. Association of ventilation rates and CO2
concentrations with health and other responses in commercial and institutional buildings. Indoor
Air 1999;9:226-252.
Nomenclature
u velocity magnitude (m/s)
X, Y, Z Cartesian co-ordinates (m)
Re Reynolds number
air density (kg/m3)
kinematic viscosity (m2/s)
Q volume flow rate (m3/s)
g gravitational acceleration (m/s2)
A cross-sectional area (m2)
total pressure loss (Pa)
P pressure (Pa)
Po total pressure (Pa)
L length (m)
W width (m)
H height (m)
t time (sec)
𝜌
4.1.1.1 𝜕 𝜌𝑢
𝜕𝑡+ ∇ × 𝜌𝑢𝑢 = −∇p + ρg + ∇ × 𝜇∇𝑢 − ∇ × 𝜏𝑡
∆𝑃