The spacing of mature forest habitat in relation to species-specific scales in managed boreal...
13
Ann. Zool. Fennici 37: 79–91 ISSN 0003-455X Helsinki 29 June 2000 © Finnish Zoological and Botanical Publishing Board 2000 The spacing of mature forest habitat in relation to species-specific scales in managed boreal forests in NE Finland Sakari Mykrä, Sami Kurki & Ari Nikula Mykrä, S. & Kurki, S., Section of Ecology, Department of Biology, University of Turku, FIN-20014 Turku, Finland Nikula, A., Finnish Forest Research Institute, Rovaniemi Research Station, P.O. Box 16, FIN-96301 Rovaniemi, Finland Received 13 September 1999, accepted 16 May 2000 Mykrä, S., Kurki, S. & Nikula, A. 2000: The spacing of mature forest habitat in relation to species-specific scales in managed boreal forests in NE Finland. — Ann. Zool. Fennici 37: 79–91. Modern forestry alters the structure of boreal forest landscapes, and this affects several forest species with different habitat requirements. Quantitative analyses of the structure of real landscapes are scarce, although this information will be needed in landscape- level planning and management applications. We investigated the occurrence and con- figuration of mature forest (> 80–100 year) in relation to five different extents (ranging from 20 to 7 854 ha) of circular landscapes around random points in managed forest environment in NE Finland. The habitat type was coarsely chosen according to require- ments of certain resident birds and mammals. We present an approach where species- specific home-range scales are related to the observed environmental heterogeneity pattern for assessing the potential of actual landscapes to maintain these species. As a result we found that there is a minority of landscapes where total area of mature forest was comparable to species’ home ranges. Irrespective of the scale examined, the aver- age proportion of habitat in a landscape was approximately 15%. Besides that the ma- ture forest was physically fragmented already on a scale relevant to individual animals, the variation in habitat proportion between landscapes decreased rapidly when the land- scape extent was increased. This decrease of variation occurs on surprisingly small scales; the forest landscape structure is unintentionally altered due to small-patterned land ownership, even age distribution of managed stands, and small variation in regen- eration patch size. In terms of related landscape metrics, we also compare our results with patterns achieved in randomly generated neutral landscape models.
-
Upload
independent -
Category
Documents
-
view
2 -
download
0
Transcript of The spacing of mature forest habitat in relation to species-specific scales in managed boreal...
Ann. Zool. Fennici 37: 79–91 ISSN 0003-455XHelsinki 29 June 2000 © Finnish Zoological and Botanical Publishing Board 2000
The spacing of mature forest habitat in relation tospecies-specific scales in managed boreal forests inNE Finland
Sakari Mykrä, Sami Kurki & Ari Nikula
Mykrä, S. & Kurki, S., Section of Ecology, Department of Biology, University of Turku,FIN-20014 Turku, FinlandNikula, A., Finnish Forest Research Institute, Rovaniemi Research Station, P.O. Box 16,FIN-96301 Rovaniemi, Finland
Received 13 September 1999, accepted 16 May 2000
Mykrä, S., Kurki, S. & Nikula, A. 2000: The spacing of mature forest habitat in relationto species-specific scales in managed boreal forests in NE Finland. — Ann. Zool. Fennici37: 79–91.
Modern forestry alters the structure of boreal forest landscapes, and this affects severalforest species with different habitat requirements. Quantitative analyses of the structureof real landscapes are scarce, although this information will be needed in landscape-level planning and management applications. We investigated the occurrence and con-figuration of mature forest (> 80–100 year) in relation to five different extents (rangingfrom 20 to 7 854 ha) of circular landscapes around random points in managed forestenvironment in NE Finland. The habitat type was coarsely chosen according to require-ments of certain resident birds and mammals. We present an approach where species-specific home-range scales are related to the observed environmental heterogeneitypattern for assessing the potential of actual landscapes to maintain these species. As aresult we found that there is a minority of landscapes where total area of mature forestwas comparable to species’ home ranges. Irrespective of the scale examined, the aver-age proportion of habitat in a landscape was approximately 15%. Besides that the ma-ture forest was physically fragmented already on a scale relevant to individual animals,the variation in habitat proportion between landscapes decreased rapidly when the land-scape extent was increased. This decrease of variation occurs on surprisingly smallscales; the forest landscape structure is unintentionally altered due to small-patternedland ownership, even age distribution of managed stands, and small variation in regen-eration patch size. In terms of related landscape metrics, we also compare our resultswith patterns achieved in randomly generated neutral landscape models.
Mykrä et al. • ANN. ZOOL. FENNICI Vol. 3780
1. Introduction
The central task in the conservation of biologicaldiversity is to comprehensively maintain viablepopulations of naturally existing species in theforeseeable future. This applies also to managedforest environments; although, inevitably, in man-aged forests, solutions must acknowledge intrin-sic characteristics of areas and diverge spatially(Mykrä & Kurki 1998).
Even though forest structure at stand level andits alteration seem to be most important for themajority of boreal forest species (e.g. Esseen etal. 1992, Raivio 1992, Haila 1994, Siitonen &Martikainen 1994, Petterson 1997, Wikars 1997),the population viability of a number of species isalso critically connected to the structure of forestlandscapes (Angelstam 1992, Hansson 1992,Andrén 1994, Kurki et al. 2000). Composition andconfiguration of forest landscape may affect thesespecies either directly, through distribution of re-sources and habitats, or indirectly by altering in-ter-specific interactions in communities modifiedby changed landscape structure (e.g. Angelstam1992, Dunning et al. 1992, Wiens et al. 1993,Kurki et al.1998).
Although the ecological effects of boreal for-est management were studied intensively inFennoscandia during the past two decades, quan-titative information on present forest landscapestructure and also reliable estimates of naturallarge scale variation in former forest landscapesseem to be scarce. The characteristics of naturalforest landscapes in Fennoscandia are well de-scribed in the recent review of Esseen et al. (1997).However, they also state that there is no quantita-tive data available regarding landscape level het-erogeneity in the past. The knowledge of naturalstand level characteristics has accumulated splen-didly during recent years, but it is also necessaryto understand the larger scale conditions to whichforest species have adapted. The best documentedchanges in Fennoscandian forests caused by com-mercial forestry are the loss and fragmentation ofnatural old-growth forests together with the si-multaneous proportional increase of younger suc-cessional stages, and the rarity of forests with asignificant old deciduous component (Hansson1992, Östlund et al. 1997). In Finland at present,
about 20.3% of productive forest land are forestsolder than 100 years, and 9.1% are older than 140years. When the two northern provinces of Ouluand Lappi (which represent 42.6% of forest landin the country) are excluded, the correspondingpercentages for southern Finland are 12.5 and 1.6,respectively (Anon. 1996).
The loss of forests with old-growth character-istics has been shown to have deleterious effectson many forest-dwelling species in different taxain Fennoscandia (Helle & Järvinen 1987, Virkkala1987, 1991, Rassi et al. 1992, Angelstam & Miku-sinski 1994, Siitonen & Martikainen 1994,Edenius & Elmberg 1996, see also Esseen et al.1997). In this paper, we examine the managed for-est landscape structure in relation to coarsely de-fined requirements of certain resident forest dwell-ing mammals and birds. For this purpose, we wantto draw a distinction between natural old-growthforests of long continuity and a broader class ofmature managed stands. Natural old-growth for-ests are nowadays rare, and being an obligatoryhabitat for many specialist species they alwayshave a high conservation value as such. In spiteof that, and regarding the occurrence of some ofthe declining species in relation to conditions pre-vailing particularly in managed forest landscapes,there is a positive statistical relationship betweenthe fulfilment of habitat requirements and cover-age of mature stands. This division between natu-ral old-growth forests and mature or ‘old’ man-aged forests is partly congruent with the differ-ence in mentioned direct and indirect mechanismsthat are behind population declines of forest spe-cies. Threatened and declining species are eithertightly dependent on some particular resourcecombination materialising itself nowadays onlyin sparse natural forests, or their population de-clines are due to altered inter-specific interactionsfollowing structural changes in communities atlarger scales (Kurki et al. 1997). Although, this isa rather broad generalisation because both thedegree of specialisation and ability to respond toand compensate community changes variesgreatly from species to species. It is also probablethat most of the population declines result fromboth direct and indirect reasons.
We investigated the occurrence and configu-ration of mature forest (growing stock volume
ANN. ZOOL. FENNICI Vol. 37 • Mature forest and scale in NE Finland 81
> 100 m3 ha–1) in relation to spatial scale in a man-aged forest region in north-eastern Finland. Thehabitat type definition and this approach are basedon Finnish and Scandinavian literature, whichemphasises the positive relationship between theoccurrence of mature forests and several forestdwelling vertebrates (Helle 1985, Rolstad &Wegge 1987a, 1989, Virkkala 1987, 1991, Angel-stam 1992). In this study, we obtained a generalpicture of the distribution and abundance of ma-ture forest habitat in managed forest landscapesin that region, and we interpret our results in rela-tion to literature-based information concerninghome range scales of flying squirrel (Pteromysvolans), siberian tit (Parus cinctus), siberian jay(Perisoreus infaustus), three-toed woodpecker(Picoides tridactylus) and capercaillie (Tetraourogallus) (Haftorn 1973, Kokhanov 1982, Haila1983a, Rolstad & Wegge 1987a, 1987b, Virkkala& Liehu 1990, Helle et al. 1994, Mönkkönen etal. 1997, Reunanen & Nikula 1998, Hanski 1998).On the individual level the home ranges of all thesespecies contain certain specific resources (Rolstad& Wegge 1987b, Hågvar et al. 1990, Virkkala &Liehu 1990, Virkkala et al. 1991, Stenberg 1996,Hanski 1998, Reunanen & Nikula 1998), whichon the one hand are not prevalently present in thisartificially pooled > 100 m3 ha–1 habitat, and onthe other hand, certainly occur to some extent inthe matrix, too. Moreover, as it is evident that in-dividuals do not require area per se, but that arearequirements of individuals are a function of theoccurrence of relevant resources (Haila et al.1989), we do not claim that the examined habitatexclusively represents the requirements of thediscussed species. Nevertheless, the occurrenceof these species can be assumed to be at least con-centrated on the examined habitat class in the studyarea. Furthermore, irrespective of theoretical prob-lems falling on the term “area requirements”, it isevident that individual level operational scale dif-fers between these species. Our aim is to portrayan approach where information on species-spe-cific scales is related to the observed environmen-tal heterogeneity pattern for assessing the poten-tial of actual landscapes to maintain these spe-cies. In the discussion we also compare our re-sults with patterns achieved in randomly gener-ated neutral landscape models.
2. Material and methods
2.1. Study area
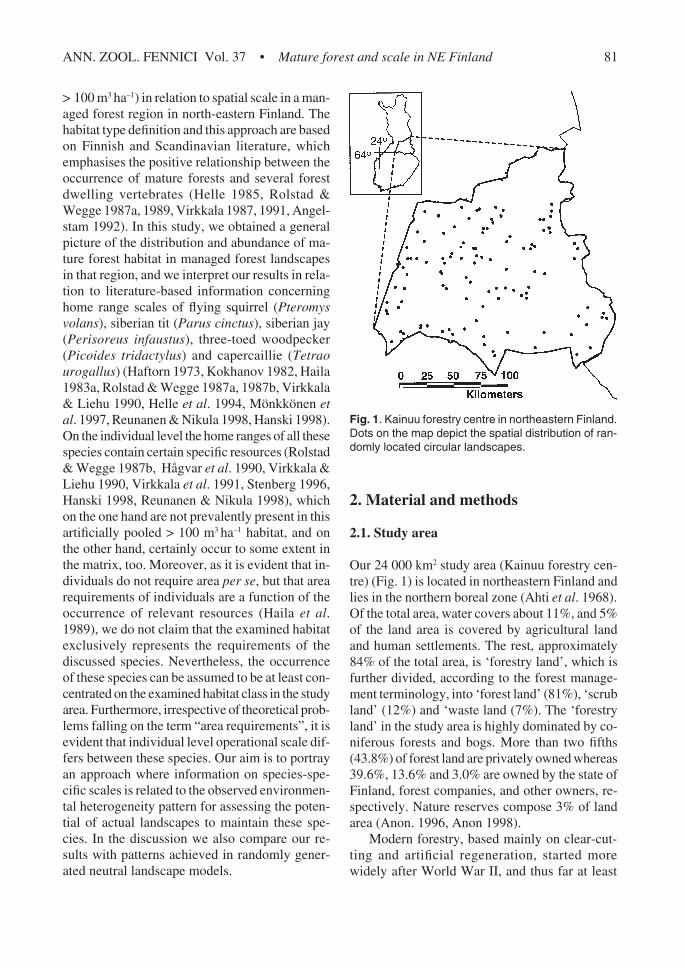
Our 24 000 km2 study area (Kainuu forestry cen-tre) (Fig. 1) is located in northeastern Finland andlies in the northern boreal zone (Ahti et al. 1968).Of the total area, water covers about 11%, and 5%of the land area is covered by agricultural landand human settlements. The rest, approximately84% of the total area, is ‘forestry land’, which isfurther divided, according to the forest manage-ment terminology, into ‘forest land’ (81%), ‘scrubland’ (12%) and ‘waste land (7%). The ‘forestryland’ in the study area is highly dominated by co-niferous forests and bogs. More than two fifths(43.8%) of forest land are privately owned whereas39.6%, 13.6% and 3.0% are owned by the state ofFinland, forest companies, and other owners, re-spectively. Nature reserves compose 3% of landarea (Anon. 1996, Anon 1998).
Modern forestry, based mainly on clear-cut-ting and artificial regeneration, started morewidely after World War II, and thus far at least
Fig. 1. Kainuu forestry centre in northeastern Finland.Dots on the map depict the spatial distribution of ran-domly located circular landscapes.
Mykrä et al. • ANN. ZOOL. FENNICI Vol. 3782
65% of the ‘forest land’ has been regenerated once.During this period there has been a decreasingtrend in the size of regeneration areas. Their typi-cal size has varied from one hectare to some tensof hectares, and nowadays more than 80% of cut-ting areas are smaller than 10 ha. The rotation timein the study area averages 100 years.
2.2. Landscape data and analyses
We used classified Landsat images produced bythe National Forest Inventory (NFI) (Tomppo1993, 1996) to examine the occurrence of matureforest. For each pixel on forested land (25 m × 25m land element) NFI produces an estimate ofgrowing stock volume separately for Scots pine(Pinus sylvestris), Norway spruce (Picea abies),birches (Betula spp.) and other species as a com-bined class. Digital maps of non-forest lands (peatland, water area, agricultural land, roads and set-tlements) are used to separate non-forest areasfrom forest land (Tomppo 1993, 1996).
We reclassified the landscape data by sum-ming the growing stock volume of different treespecies for each pixel and defining pixels that hadtimber volume over 100 m3 ha–1 as ‘mature for-est’. In other words, the data were bisected to ma-ture forest and everything else. The 100 m3 ha–1
division limit refers approximately to class mid-point of the average total volume of young thin-ning forests (58 m3 ha–1) and advanced thinningforests (131 m3 ha–1) in the study area (Tomppo etal. 1998). Furthermore, timber volume correlateswell with the age of the forest stand and the crite-ria used in our study is about in the class mid-point of the average timber volumes of age classes61–80 years (80 m3 ha–1) and 81–100 years (113m3 ha–1) (Tomppo et al. 1998).
After reclassifying the landscape data, we ran-domly selected 120 points (Fig. 1) avoiding onlylarge lakes and towns in the study area, and formedcircular landscapes around them using five dif-ferent radii: 250, 500, 1 000, 2 000 and 5 000metres. Corresponding areas covered were ap-proximately 20, 79, 314, 1 257 and 7 854 hec-tares. In seven cases landscape data did not coverthe whole area inside the largest radius. They weretherefore omitted, and the data were only usedfrom 113 points. The area of mature forest (CA),
number of mature forest patches (NP), mean patchsize (MPS; ha), mean nearest neighbour distance(MNN; m) and largest patch index (LPI; (arealargest
patch/arealandscape) × 100) were computed for eachlandscape using FRAGSTATS (McGarigal &Marks 1995).
2.3. Individual level operational scale of spe-cies
The information on territory sizes and individuallevel home range scale of flying squirrel, siberiantit, capercaillie, siberian jay and three-toed wood-pecker were surveyed mainly from Fennoscandianliterature, which makes it applicable also in thisparticular study area. The information on terri-tory size of flying squirrel is based on recent ra-dio-tracking data from southern Finland (Hanski1998), and from studies conducted in the sameregion that we used in this study (Mönkkönen etal. 1997, Reunanen & Nikula 1998). Accordingto these studies, flying squirrels require some 0.5–3 ha of favourable habitat to be able to establish aterritory. Total activity areas of an individual,however, may be even 5 to 10 times greater. Ac-cording to Hanski (1998) the average for this is6.5 ha. The territory size of siberian tit is reportedto range from 15 to 20 ha in coniferous foresthabitats (Haftorn 1973, Virkkala & Liehu 1990).The home range size of an individual capercaillievaries from some tens of hectares to more than100 ha, but in the case of this species more im-portant is that a minimum requirement for a vi-able lek is around 300 ha of suitable habitat (seeRolstad & Wegge 1987a, 1987b, Helle et al.1994). Comparable published information onsiberian jay and three-toed woodpecker seems tobe surprisingly hard to find. In the case of theformer, we rely on Kokhanov (1982). The meansize for five studied territories in the Kola Penin-sula was 52 ha and the range varied from 45 to 57ha. For the latter species, the only piece of infor-mation concerning the home range scale seems tobe the one presented by Haila (1983a) in his studyon colonisation of islands by land birds in the lakeInari in northern Finland. He conducted land birdcensuses on 41 islands with a size range of 0.5–885 ha. The three-toed woodpecker occurred onlyon three islands, the smallest of them being 99 ha.
ANN. ZOOL. FENNICI Vol. 37 • Mature forest and scale in NE Finland 83
The other two were 680 and 885 ha. Habitat typescomparable with these ‘woodpecker islands’,however, occurred in substantial proportions onmany of the smaller sized islands. Also, in thecase of other species his results were in accord-ance with the abovementioned studies. The small-est islands from where siberian tit, siberian jayand capercaillie were found, were 17, 67 and 290ha, respectively. Haila observed individual caper-caillies also on islands sized 22 and 54 ha, but theone with 290 ha area was smallest with more thanone (3) individual. This may indicate lekking and/or nesting.
The three smallest landscape extents used inthis study (20, 79 and 314 hectares) are almostequivalent with the home range scale hierarchyamong these species. In the examination, land-scape extents were associated to species opera-tional scales and the fulfilment of each species’requirements in terms of mature forest occurrencewas estimated on landscape extent that was onelevel up from its home range scale. The largestscales (1 257 and 7 854 hectares) would be morepertinent in population level considerations, whichare beyond the scope of this paper. Only thecapercaillie lek is associated to 1 257 ha extent.
3. Results
Since we pooled all the other land cover classes(including water and artifactitious classes), the habi-tat proportions are given in relation to total land-scape area on each scale, not relative to ‘forest land’area. The average proportion of mature forest habi-tat in landscapes was about 15% throughout allexamined scales (Table 1). The landscapes around
randomly selected points seem to represent aver-age forest and they are congruent with the fact that65% of the ‘forest land’ have been regenerated sincethe 1950s; on 31% of ‘forest land’ (21% of totalarea of forestry centre) forests are older than 81years, and approximately 35% of ‘forest land’ (24%of total area of forestry centre) belong to develop-mental classes V (advanced thinning stands), VI(mature forests) and to low-yielding forests (Anon.1996). This last class includes also the majority ofnatural old-growth forests in Kainuu area.
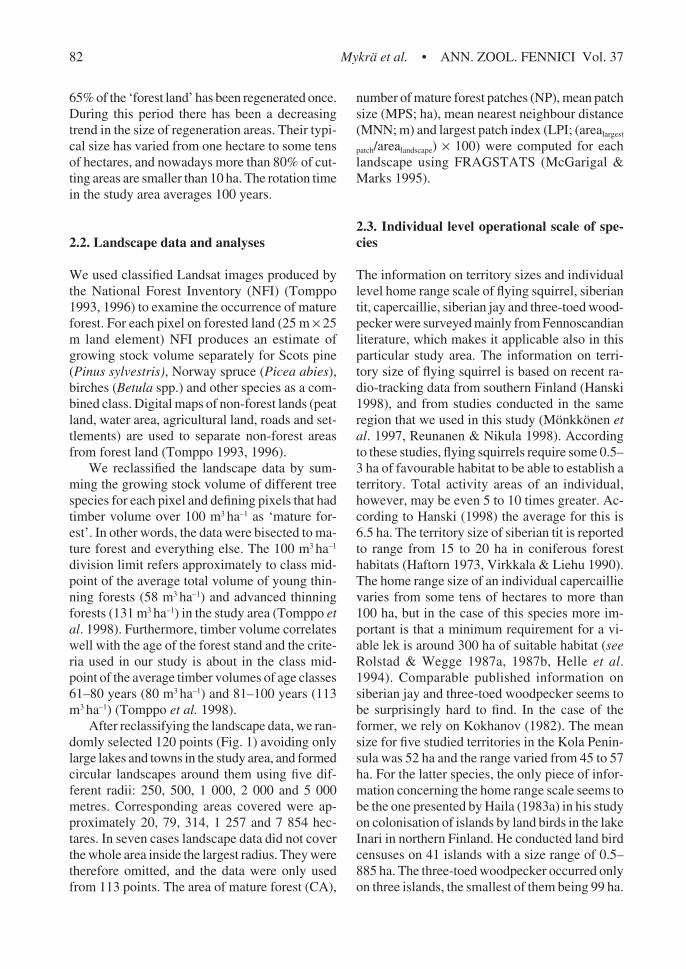
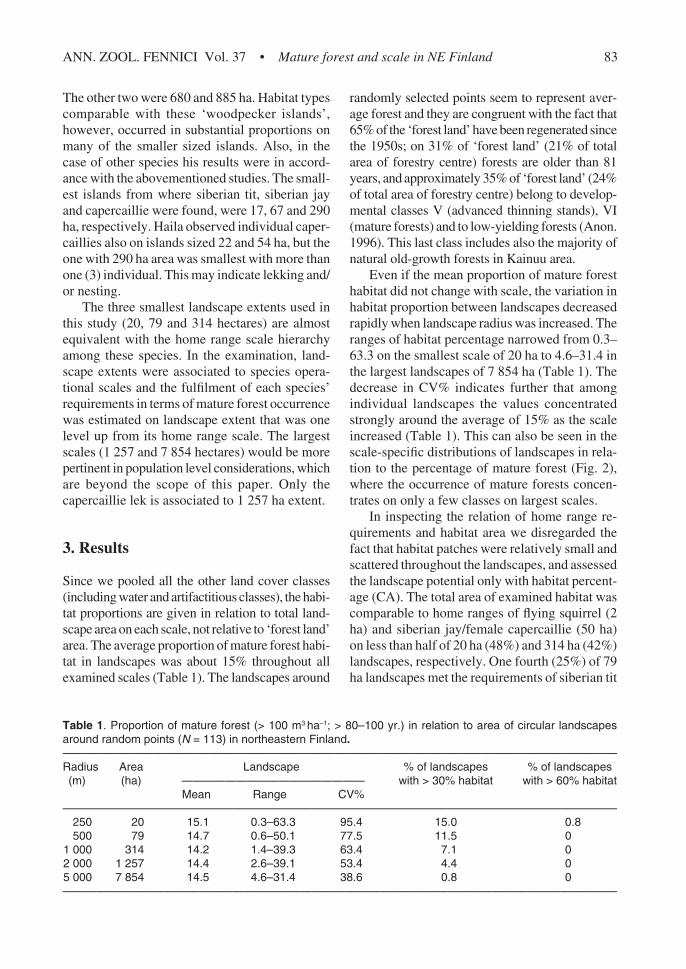
Even if the mean proportion of mature foresthabitat did not change with scale, the variation inhabitat proportion between landscapes decreasedrapidly when landscape radius was increased. Theranges of habitat percentage narrowed from 0.3–63.3 on the smallest scale of 20 ha to 4.6–31.4 inthe largest landscapes of 7 854 ha (Table 1). Thedecrease in CV% indicates further that amongindividual landscapes the values concentratedstrongly around the average of 15% as the scaleincreased (Table 1). This can also be seen in thescale-specific distributions of landscapes in rela-tion to the percentage of mature forest (Fig. 2),where the occurrence of mature forests concen-trates on only a few classes on largest scales.
In inspecting the relation of home range re-quirements and habitat area we disregarded thefact that habitat patches were relatively small andscattered throughout the landscapes, and assessedthe landscape potential only with habitat percent-age (CA). The total area of examined habitat wascomparable to home ranges of flying squirrel (2ha) and siberian jay/female capercaillie (50 ha)on less than half of 20 ha (48%) and 314 ha (42%)landscapes, respectively. One fourth (25%) of 79ha landscapes met the requirements of siberian tit
Table 1. Proportion of mature forest (> 100 m3 ha–1; > 80–100 yr.) in relation to area of circular landscapesaround random points (N = 113) in northeastern Finland.—————————————————————————————————————————————————Radius Area Landscape % of landscapes % of landscapes(m) (ha) ————————————————— with > 30% habitat with > 60% habitat
Mean Range CV%—————————————————————————————————————————————————
250 20 15.1 0.3–63.3 95.4 15.0 0.8500 79 14.7 0.6–50.1 77.5 11.5 0
1 000 314 14.2 1.4–39.3 63.4 7.1 02 000 1 257 14.4 2.6–39.1 53.4 4.4 05 000 7 854 14.5 4.6–31.4 38.6 0.8 0—————————————————————————————————————————————————
Mykrä et al. • ANN. ZOOL. FENNICI Vol. 3784
(20 ha) in this respect, and regarding three-toedwoodpecker/capercaillie male home ranges (100ha) the percentage in 314 ha landscapes was 7%.Habitat area adequate for a viable capercaillie lek(300 ha) was found on 8% of 1 257 ha landscapes.These summed proportions are also illustrated inFig. 2; arrows on relevant scales (see figure textfor further explanation) indicate the subset of dis-tribution, where total habitat area/landscape equalsor exceeds the area of home ranges.
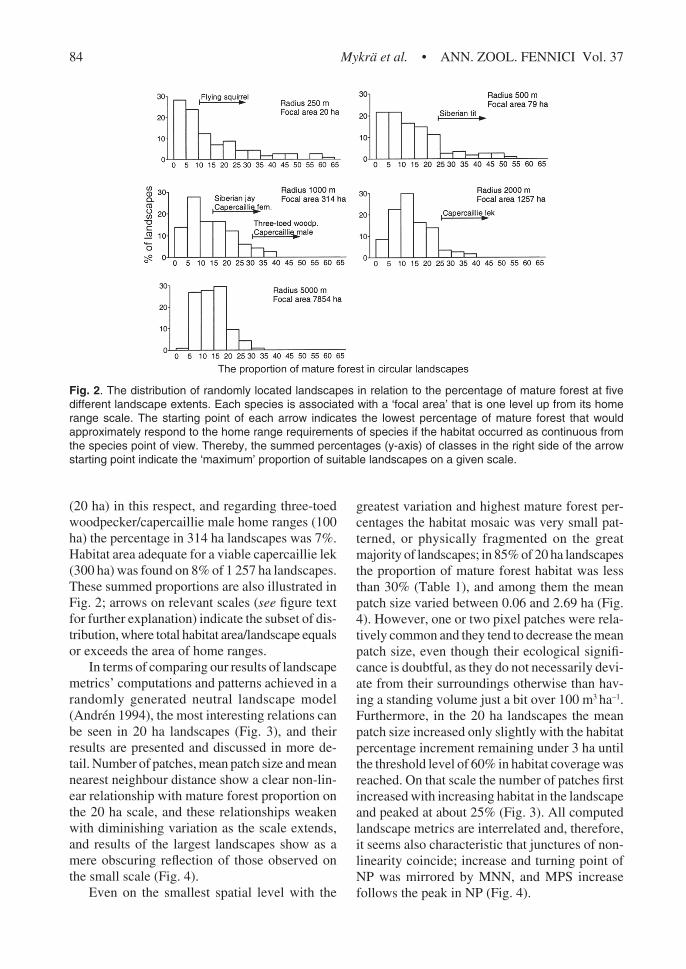
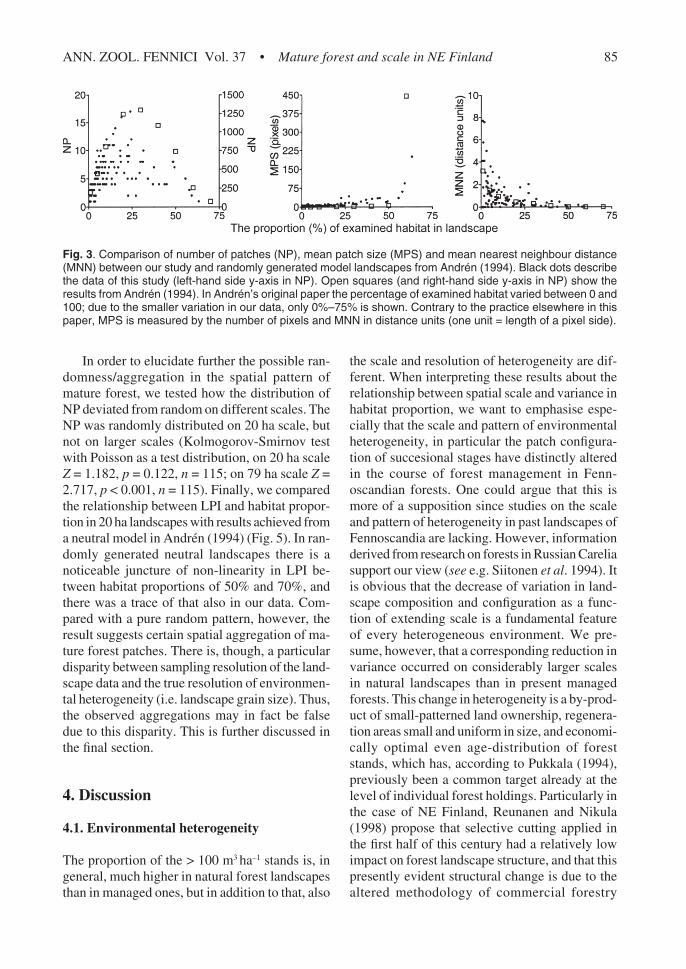
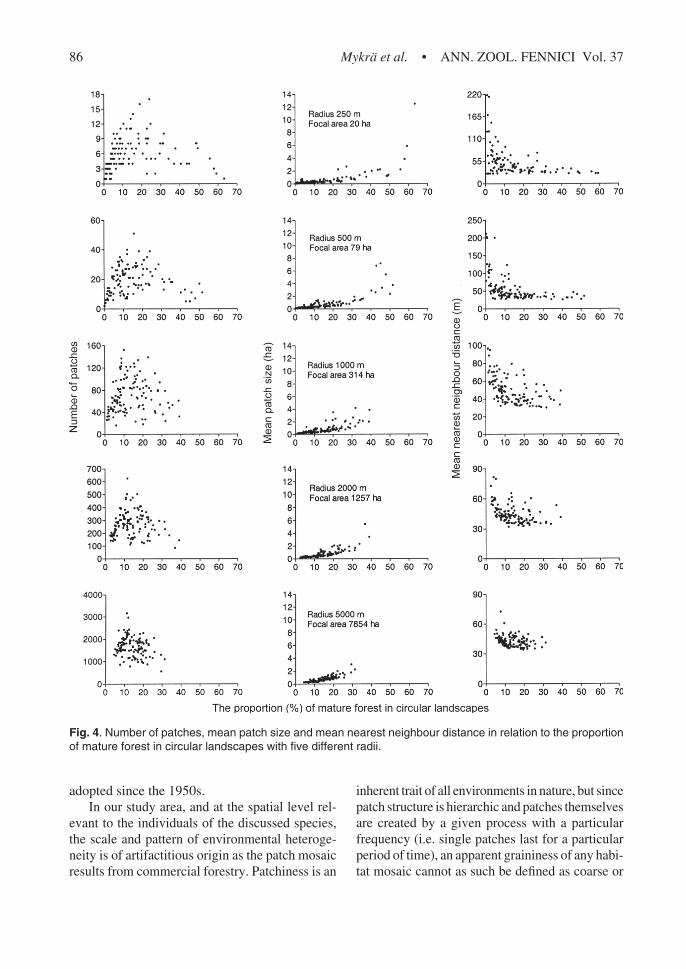
In terms of comparing our results of landscapemetrics’ computations and patterns achieved in arandomly generated neutral landscape model(Andrén 1994), the most interesting relations canbe seen in 20 ha landscapes (Fig. 3), and theirresults are presented and discussed in more de-tail. Number of patches, mean patch size and meannearest neighbour distance show a clear non-lin-ear relationship with mature forest proportion onthe 20 ha scale, and these relationships weakenwith diminishing variation as the scale extends,and results of the largest landscapes show as amere obscuring reflection of those observed onthe small scale (Fig. 4).
Even on the smallest spatial level with the
greatest variation and highest mature forest per-centages the habitat mosaic was very small pat-terned, or physically fragmented on the greatmajority of landscapes; in 85% of 20 ha landscapesthe proportion of mature forest habitat was lessthan 30% (Table 1), and among them the meanpatch size varied between 0.06 and 2.69 ha (Fig.4). However, one or two pixel patches were rela-tively common and they tend to decrease the meanpatch size, even though their ecological signifi-cance is doubtful, as they do not necessarily devi-ate from their surroundings otherwise than hav-ing a standing volume just a bit over 100 m3 ha–1.Furthermore, in the 20 ha landscapes the meanpatch size increased only slightly with the habitatpercentage increment remaining under 3 ha untilthe threshold level of 60% in habitat coverage wasreached. On that scale the number of patches firstincreased with increasing habitat in the landscapeand peaked at about 25% (Fig. 3). All computedlandscape metrics are interrelated and, therefore,it seems also characteristic that junctures of non-linearity coincide; increase and turning point ofNP was mirrored by MNN, and MPS increasefollows the peak in NP (Fig. 4).
Fig. 2. The distribution of randomly located landscapes in relation to the percentage of mature forest at fivedifferent landscape extents. Each species is associated with a ‘focal area’ that is one level up from its homerange scale. The starting point of each arrow indicates the lowest percentage of mature forest that wouldapproximately respond to the home range requirements of species if the habitat occurred as continuous fromthe species point of view. Thereby, the summed percentages (y-axis) of classes in the right side of the arrowstarting point indicate the ‘maximum’ proportion of suitable landscapes on a given scale.
ANN. ZOOL. FENNICI Vol. 37 • Mature forest and scale in NE Finland 85
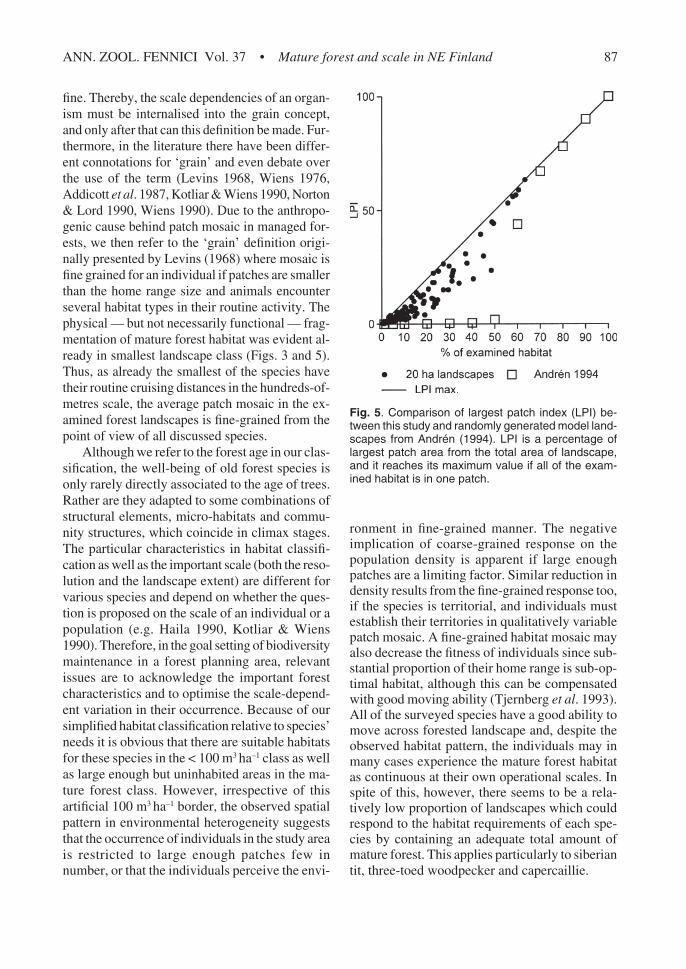
In order to elucidate further the possible ran-domness/aggregation in the spatial pattern ofmature forest, we tested how the distribution ofNP deviated from random on different scales. TheNP was randomly distributed on 20 ha scale, butnot on larger scales (Kolmogorov-Smirnov testwith Poisson as a test distribution, on 20 ha scaleZ = 1.182, p = 0.122, n = 115; on 79 ha scale Z =2.717, p < 0.001, n = 115). Finally, we comparedthe relationship between LPI and habitat propor-tion in 20 ha landscapes with results achieved froma neutral model in Andrén (1994) (Fig. 5). In ran-domly generated neutral landscapes there is anoticeable juncture of non-linearity in LPI be-tween habitat proportions of 50% and 70%, andthere was a trace of that also in our data. Com-pared with a pure random pattern, however, theresult suggests certain spatial aggregation of ma-ture forest patches. There is, though, a particulardisparity between sampling resolution of the land-scape data and the true resolution of environmen-tal heterogeneity (i.e. landscape grain size). Thus,the observed aggregations may in fact be falsedue to this disparity. This is further discussed inthe final section.
4. Discussion
4.1. Environmental heterogeneity
The proportion of the > 100 m3 ha–1 stands is, ingeneral, much higher in natural forest landscapesthan in managed ones, but in addition to that, also
the scale and resolution of heterogeneity are dif-ferent. When interpreting these results about therelationship between spatial scale and variance inhabitat proportion, we want to emphasise espe-cially that the scale and pattern of environmentalheterogeneity, in particular the patch configura-tion of succesional stages have distinctly alteredin the course of forest management in Fenn-oscandian forests. One could argue that this ismore of a supposition since studies on the scaleand pattern of heterogeneity in past landscapes ofFennoscandia are lacking. However, informationderived from research on forests in Russian Careliasupport our view (see e.g. Siitonen et al. 1994). Itis obvious that the decrease of variation in land-scape composition and configuration as a func-tion of extending scale is a fundamental featureof every heterogeneous environment. We pre-sume, however, that a corresponding reduction invariance occurred on considerably larger scalesin natural landscapes than in present managedforests. This change in heterogeneity is a by-prod-uct of small-patterned land ownership, regenera-tion areas small and uniform in size, and economi-cally optimal even age-distribution of foreststands, which has, according to Pukkala (1994),previously been a common target already at thelevel of individual forest holdings. Particularly inthe case of NE Finland, Reunanen and Nikula(1998) propose that selective cutting applied inthe first half of this century had a relatively lowimpact on forest landscape structure, and that thispresently evident structural change is due to thealtered methodology of commercial forestry
Fig. 3. Comparison of number of patches (NP), mean patch size (MPS) and mean nearest neighbour distance(MNN) between our study and randomly generated model landscapes from Andrén (1994). Black dots describethe data of this study (left-hand side y-axis in NP). Open squares (and right-hand side y-axis in NP) show theresults from Andrén (1994). In Andrén’s original paper the percentage of examined habitat varied between 0 and100; due to the smaller variation in our data, only 0%–75% is shown. Contrary to the practice elsewhere in thispaper, MPS is measured by the number of pixels and MNN in distance units (one unit = length of a pixel side).
Mykrä et al. • ANN. ZOOL. FENNICI Vol. 3786
Fig. 4. Number of patches, mean patch size and mean nearest neighbour distance in relation to the proportionof mature forest in circular landscapes with five different radii.
adopted since the 1950s.In our study area, and at the spatial level rel-
evant to the individuals of the discussed species,the scale and pattern of environmental heteroge-neity is of artifactitious origin as the patch mosaicresults from commercial forestry. Patchiness is an
inherent trait of all environments in nature, but sincepatch structure is hierarchic and patches themselvesare created by a given process with a particularfrequency (i.e. single patches last for a particularperiod of time), an apparent graininess of any habi-tat mosaic cannot as such be defined as coarse or
ANN. ZOOL. FENNICI Vol. 37 • Mature forest and scale in NE Finland 87
fine. Thereby, the scale dependencies of an organ-ism must be internalised into the grain concept,and only after that can this definition be made. Fur-thermore, in the literature there have been differ-ent connotations for ‘grain’ and even debate overthe use of the term (Levins 1968, Wiens 1976,Addicott et al. 1987, Kotliar & Wiens 1990, Norton& Lord 1990, Wiens 1990). Due to the anthropo-genic cause behind patch mosaic in managed for-ests, we then refer to the ‘grain’ definition origi-nally presented by Levins (1968) where mosaic isfine grained for an individual if patches are smallerthan the home range size and animals encounterseveral habitat types in their routine activity. Thephysical — but not necessarily functional — frag-mentation of mature forest habitat was evident al-ready in smallest landscape class (Figs. 3 and 5).Thus, as already the smallest of the species havetheir routine cruising distances in the hundreds-of-metres scale, the average patch mosaic in the ex-amined forest landscapes is fine-grained from thepoint of view of all discussed species.
Although we refer to the forest age in our clas-sification, the well-being of old forest species isonly rarely directly associated to the age of trees.Rather are they adapted to some combinations ofstructural elements, micro-habitats and commu-nity structures, which coincide in climax stages.The particular characteristics in habitat classifi-cation as well as the important scale (both the reso-lution and the landscape extent) are different forvarious species and depend on whether the ques-tion is proposed on the scale of an individual or apopulation (e.g. Haila 1990, Kotliar & Wiens1990). Therefore, in the goal setting of biodiversitymaintenance in a forest planning area, relevantissues are to acknowledge the important forestcharacteristics and to optimise the scale-depend-ent variation in their occurrence. Because of oursimplified habitat classification relative to species’needs it is obvious that there are suitable habitatsfor these species in the < 100 m3 ha–1 class as wellas large enough but uninhabited areas in the ma-ture forest class. However, irrespective of thisartificial 100 m3 ha–1 border, the observed spatialpattern in environmental heterogeneity suggeststhat the occurrence of individuals in the study areais restricted to large enough patches few innumber, or that the individuals perceive the envi-
ronment in fine-grained manner. The negativeimplication of coarse-grained response on thepopulation density is apparent if large enoughpatches are a limiting factor. Similar reduction indensity results from the fine-grained response too,if the species is territorial, and individuals mustestablish their territories in qualitatively variablepatch mosaic. A fine-grained habitat mosaic mayalso decrease the fitness of individuals since sub-stantial proportion of their home range is sub-op-timal habitat, although this can be compensatedwith good moving ability (Tjernberg et al. 1993).All of the surveyed species have a good ability tomove across forested landscape and, despite theobserved habitat pattern, the individuals may inmany cases experience the mature forest habitatas continuous at their own operational scales. Inspite of this, however, there seems to be a rela-tively low proportion of landscapes which couldrespond to the habitat requirements of each spe-cies by containing an adequate total amount ofmature forest. This applies particularly to siberiantit, three-toed woodpecker and capercaillie.
Fig. 5. Comparison of largest patch index (LPI) be-tween this study and randomly generated model land-scapes from Andrén (1994). LPI is a percentage oflargest patch area from the total area of landscape,and it reaches its maximum value if all of the exam-ined habitat is in one patch.
Mykrä et al. • ANN. ZOOL. FENNICI Vol. 3788
4.2. Thresholds in non-linear population re-sponses
The importance of critical thresholds in the pro-portion of suitable habitat has been emphasisedin studies modelling the direct effects of habitatfragmentation on populations (Turner & Gardner1991, Gustafson & Parker 1992, Andrén 1994).Above the threshold, the effects are caused solelyby the decrease in habitat area, as predicted bythe random sampling hypothesis (Haila 1983b).At the threshold and below, however, populationdensity or community richness may respond dra-matically to only minor reduction in habitat areadue to abrupt decrease in habitat connectivity andincreasing significance of fragmentation effects.Later modelling has suggested further that thresh-old proportion is sensitive to habitat specificityand dispersal abilities of the target species (With& Crist 1995, Andrén 1996). The knowledge ofnon-linearities in relations between species viabil-ity and environmental gradients (measured, forexample, by resource occurrence, habitat area,physical landscape structure etc.), and criticalthreshold stages in them would be useful in im-proving the precision of practical guidelines forbiodiversity maintenance in managed forests(Mykrä & Kurki 1998). Haila (1995) assessed thepracticability of using natural dynamics as a modelfor management and he also gave a correspond-ing approach of such threshold values. He em-phasised the identification of critical ‘qualitativejunctures’ in natural non-linear processes, i.e.stages in which change is qualitatively importantwith only a slight change in system parameters,and addressed that an assessment is needed to re-veal whether these junctures occur or are lackingin silvicultural forests.
In his review of literature on mammals andbirds in mosaic landscapes, Andrén (1994) con-cluded that for these taxa, critical threshold levelsare between 10% and 30% of suitable habitat. Inspite of a probable species-specificity in thresholdvalues, the fifteen per cent proportion of matureforest habitat in our study area is so low that habi-tat spacing can be argued to be important from anecological standpoint. In terms of NP, MPS andMNN, the relations between landscape metrics andhabitat proportion in the landscapes with a 250 m
radius resembled the results achieved from ran-domly generated neutral landscapes (Andrén 1994,With & King 1997) (Fig. 3). This would suggest arandom spatial distribution of habitat patches onthe smallest examined scale. However, examina-tion of LPI (Fig. 5) reveals that as compared withthe random pattern the > 100 m3 ha–1-pixels areindeed aggregated to a certain degree also on thesmallest scale, and the values of single landscapesare closer to the LPI maximum. Maximal LPI(solid line in Fig. 5) is the level of utmost aggre-gation, because in that case NP is one. Compari-son between natural landscapes and the modelledrandom pattern, however, is complicated with thefact that in real landscapes the grain size is deter-mined ‘from the outside’ — random landscapesare a result of single pixels emerging or disappear-ing in a random fashion, but for example in ourcase the aggregation was partly due to the differ-ence between pixel size (25 m × 25 m) and aver-age area of forest regeneration (1–10 ha). Withthis resolution a five-hectare patch emerging ordisappearing in landscape is innately an 80-pixelaggregation. Comparable to the random spacingpattern of habitat within landscapes was also thefact that NP distributed randomly between circu-lar landscapes on 20 ha scale, but not on largerscales. Furthermore, in the only landscape wherethe proportion of mature forest habitat exceeded60%, the habitat formed one percolating, yet con-tinuous patch (NP = 1) (Fig. 3). This is in accord-ance with the percolation theory (e.g. Gardner &O’Neill 1991), which predicts that when the pro-portion of habitat in a randomly generated land-scape decreases below about 60%, one continu-ous habitat cluster breaks into discrete patches andsize and connectivity of habitat patches can be-come an important feature of the landscape.
4.3. Conclusions
Since the extraction of natural resources by hu-mans is indispensable in Finnish managed forests,the implementation of biodiversity maintenancemust begin with precisely targeted area level andregional level management applications, even ifmany of the components of biodiversity once oc-curred prevalently in the forest landscape mosaic.
ANN. ZOOL. FENNICI Vol. 37 • Mature forest and scale in NE Finland 89
Instead of applying moderate and standardisedimprovements extensively in managed forests, itwould be more effective to systematically allo-cate various biodiversity maintenance responsibili-ties between forest planning areas by aggregatingrelevant resources spatially (Mykrä & Kurki 1998).Similarly, in a recent discussion on critical thresh-olds as management guidelines, caution in apply-ing any generalised threshold values was empha-sised (Andrén 1999, Mönkkönen & Reunanen1999), since connectivity is a species-specific char-acteristic of a landscape, and average thresholdvalues derived from the responses of a suite ofspecies might be far below the habitat area needsof the most demanding ones. Future strategies andtheir application must be far better tailored accord-ing to varying objectives, and this also requiresknowledge of local particularities at differentscales. Guided by this thinking, we presented herea simple tool for assessing the possibility to main-tain sufficient amount of suitable habitat for dif-ferent forest dwelling mammals and birds.
The spatial scale of our study covered areasfrom tens of hectares to several thousands of hec-tares. The planned cut in commercially managedforests is relatively fixed already at those small-est scales due to economical constraints. Even ifthe most important efforts in conservation biol-ogy are to stop habitat loss and to restore degradedhabitats (Fahrig 1997), a really significant increasein the proportions of economically inferior butecologically beneficial features in managed for-ests seems impossible without a truly profoundchange from a pure volume based thinking inwood production to strategies that rely more onproduct quality. Until this kind of change hap-pens, the most important question is: how shouldthis fixed habitat composition of managed forestsbe spatially configured?
ACKNOWLEDGEMENTS: This study was financially sup-ported by the Academy of Finland and the Maj and TorNessling and Kone foundations. We thank Erkki Tomppoand the staff of the NFI for providing the inventory data,and Paavo Kumpu for his assistance in the landscape datareclassification. Pekka Helle, Harto Lindén and Otso Suomi-nen have given valuable comments on earlier versions ofthis manuscript. Final improvements that rendered the pub-lishing of this paper possible are due to comments of twoanonymous referees Yrjö Haila and Mikko Mönkkönen. MsMarja Vieno revised the English of the manuscript.
References
Addicott, J. F., Aho, J. M., Antolin, M. F., Padilla, D. K.,Rickhardson, J. S. & Soluk, D. A. 1987: Ecologicalneighborhoods: scaling environmental patterns. —Oikos 49: 340–346.
Ahti, T., Hämet-Ahti, L. & Jalas, J. 1968: Vegetation zonesand their sections in northwestern Europe. — Ann. Bot.Fennici 5: 169–211.
Andrén, H. 1994: Effects of habitat fragmentation on birdsand mammals in landscapes with different proportionsof suitable habitat: a review. — Oikos 17: 355–366.
Andrén, H. 1996: Population responses to habitat fragmen-tation: statistical power and the random sample hypoth-esis. — Oikos 76: 235–246.
Andrén, H. 1999: Habitat fragmentation, the random sam-ple hypothesis and critical thresholds. — Oikos 84: 306–308.
Anon. 1996: Statistical Yearbook of Forestry 1996. — TheFinnish Forest Research Institute. 352 pp.
Anon. 1998: Finnish Statistical Yearbook of Forestry 1998.— The Finnish Forest Research Institute. 343 pp.
Angelstam, P. 1992: Conservation of communities — theimportance of edges, surroundings and landscape mo-saic structure. — In: Hansson, L. (ed.), Ecological prin-ciples of nature conservation: 9–70. Elsevier AppliedScience, London.
Angelstam, P. & Mikusinski, G. 1994: Woodpecker assem-blages in natural and managed boreal and hemiborealforest — a review. — Ann. Zool. Fennici 31: 157–172.
Dunning, J. B., Danielson, B. J. & Pulliam, H. R. 1992:Ecological processes that affect populations in com-plex landscapes. — Oikos 65: 169–175.
Edenius, L. & Elmberg, J. 1996: Landscape level effects ofmodern forestry on bird communities in North Swed-ish boreal forests. — Landscape Ecology 11: 325–338.
Esseen, P.-A., Ehnström, B., Ericson, L. & Sjöberg, K. 1992:Boreal forests — the focal habitats of Fennoscandia.— In: Hansson, L. (ed.), Ecological principles of na-ture conservation: 252–325. — Elsevier Applied Sci-ence, London.
Esseen, P.-A., Ehnström, B., Ericson, L. & Sjöberg, K. 1997:Boreal forests. — Ecological Bulletins 46: 16–47.
Fahrig, L. 1997: Relative effects of habitat loss and frag-mentation on population extinction. — Journal of Wild-life Management 61: 603–610.
Franklin, J. F. & Forman, R. T. 1987: Creating landscapepatterns by forest cutting: ecological consequences andprinciples. — Landscape Ecology 1: 5–18.
Gardner, R. H. & O’Neill, R. V. 1991: Pattern, process, andpredictability: The use of neutral models for landscapeanalysis. — In: Turner, M. G. & Gardner, R. H. (eds.),Quantitative methods in landscape ecology: 289–307.Springer-Verlag New York, New York, USA.
Gustafson, E. J. & Parker, G. R. 1992: Relationships be-tween landcover proportion and indices of landscapespatial pattern. — Landscape Ecology 7: 101–110.
Mykrä et al. • ANN. ZOOL. FENNICI Vol. 3790
Haftorn, S. 1973: A study of the siberian tit (Parus cinctus)during the breeding season. — Sterna 12: 91–155. [InNorwegian with English Summary].
Haila, Y. 1983a: Colonization of islands in a north-borealFinnish lake by land birds. — Ann. Zool. Fennici 20:179–197.
Haila, Y. 1983b: Land birds on northern islands: a sam-pling metaphor for insular colonization. — Oikos 41:334–351.
Haila, Y. 1990: Toward an ecological definition of an is-land: a north-west European perspective. — J.Biogeogr. 17: 561–568.
Haila, Y. 1994: Preserving ecological diversity in borealforests: ecological background, research, and manage-ment. — Ann. Zool. Fennici 31: 203–217.
Haila, Y. 1995: Natural dynamics as a model for manage-ment: is the analogue practicable? — Arctic Centre Pub-lications 7: 9–26.
Haila, Y., Hanski, I. K. & Raivio, S. 1989: Methodologyfor studying the minimum habitat requirements of for-est birds. — Ann. Zool. Fennici 26: 173–180.
Hanski, I. K. 1998: Home ranges and habitat use in the de-clining flying squirrel (Pteromys volans) in managedforests. — Wildlife Biology 4: 33–46.
Hansson, L. 1992: Landscape ecology of boreal forests. —TREE 7: 299–302.
Helle, P. 1985: Effects of forest fragmentation on bird den-sities in northern boreal forests. — Ornis Fennica 62:35–41.
Helle, P., Helle, T. & Lindén, H. 1994: Capercaillie (Tetraourogallus) lekking sites in fragmented Finnish forestlandscape. — Scand. J. For. Res. 9: 386–396.
Helle, P. & Järvinen, O. 1986: Population trends of NorthFinnish land birds in relation to their habitat selectionand changes in forest structure. — Oikos 46: 107–115.
Hågvar, S., Hågvar, G. & Mønness, E. 1990: Nest site se-lection in Norwegian woodpeckers. — Holarctic Ecol-ogy 13: 156–165.
Kokhanov, V. D. [Kohanov, V. D.] 1982: [On the ecologyof siberian Jay in the Murmansk region]. — In:Zabrodin, V. A. [Zabrodin, V. A.] (ed.), [Ecology andmorphology of birds in far north-east]: 124–137. Mos-cow. [In Russian].
Kotliar, N. B. & Wiens, J. A. 1990: Multiple scales of patchi-ness and patch structure: a hierarchical framework forthe study of heterogeneity. — Oikos 59: 253–260.
Kurki, S., Helle, P., Lindén, H. & Nikula, A. 1997: Breed-ing success of black grouse and capercaillie in relationto mammalian predator densities on two spatial scales.— Oikos 79: 301–310.
Kurki, S., Nikula, A., Helle, P. & Lindén, H. 1998: Abun-dances of red fox and pine marten in relation to thecomposition of boreal forest landscapes. — Journal ofAnimal Ecology 67: 874–886.
Kurki, S., Nikula, A., Helle, P. & Lindén, H. 2000: Effectsof forest fragmentation and composition on breedingsuccess of grouse. — Ecology 81. [In press.]
Levins, R. 1968: Evolution in changing Environments. —
Princeton University Press, Princeton, New Jersey.Li, H., Franklin J. F., Swanson, F. J. & Spies, T. A. 1993:
Developing alternative forest cutting patterns: A simu-lation approach. — Landscape Ecology 8: 63–75.
McGarigal, K. & Marks, B. J. 1995: FRAGSTATS: spatialpattern analysis program for quantifying landscapestructure. — U.S. Forest Service General TechnicalReport PNV 351.
Mykrä, S. & Kurki, S. 1998: ESC-Strategy for RationalOperationalization of Forest Biodiversity Maintenancein Finland. — Silva Fennica 32: 389–399.
Mönkkönen, M., Reunanen, P., Nikula, A., Inkeröinen, J.& Forsman, J. 1997: Landscape characteristics associ-ated with the occurrence of the flying squirrel (Pteromysvolans) in old-growth forests of northern Finland. —Ecography 20: 634–642.
Mönkkönen, M. & Reunanen, P. 1999: On critical thresh-olds in landscape connectivity: a management perspec-tive. — Oikos 84: 302–305.
Norton, D. A. & Lord, J. M. 1990: On the use of ‘grain-size’ in ecology. — Functional Ecology 4: 719–720.
Östlund, L., Zackrisson, O. & Axelsson, A.-L. 1997: Thehistory and transformation of a Scandinavian borealforest landscape since the 19th century. — CanadianJournal of Forest Research 27: 1198–1206.
Petterson, R. B. 1997: Lichens, invertebrates and birds inspruce canopies: impacts of forestry. — Doctoral the-sis, University of Umeå, Sweden.
Pukkala, T. 1994: Metsäsuunnittelun perusteet. —Gummerus kirjapaino Oy. Jyväskylä.
Raivio, S. 1992: Bird communities in fragmented conifer-ous forests: the importance quantitative data and ad-equate scaling. — Ph.D. thesis. University of Helsinki,Finland.
Rassi, P., Kaipiainen, H., Mannerkoski, I. & Ståhls, G. 1992:Uhanalaisten eläinten ja kasvien seurantatoimikunnanmietintö [Report on monitoring of threatened animalsand plants in Finland]. — Committee report, Ministryof Environment, 328 pp. [In Finnish with English Sum-mary].
Reunanen, P. & Nikula, A. 1998: Liito-oravan elinympä-ristöt ja maiseman rakenne Koillismaalla. — Metsä-hallituksen luonnonsuojelujulkaisuja, Sarja A, No. 93.
Rolstad, J. & Wegge, P. 1987a: Distribution and size ofCapercaillie leks in relation to old forest fragmenta-tion. — Oecologia 72: 389–394.
Rolstad, J. & Wegge, P. 1987b: Capercaillie habitat: a criti-cal assessment of the role of old forests. — Proc. Int.Grouse Symp. No 4: 235–250.
Rolstad, J. & Wegge, P. 1989: Capercaillie (Tetrao urogallusL.) populations and modern forestry — a case for land-scape ecological studies. — Finnish Game Research46: 43–52.
Siitonen, J. & Martikainen, P. 1994: Occurrence of rare andthreatened insects living on decaying Populus tremula:a comparison between Finnish and Russian Karelia. —Scand. J. For. Res. 9: 185–191.
Siitonen, J. & Martikainen, P., Kaila, L., Nikula, A. &
ANN. ZOOL. FENNICI Vol. 37 • Mature forest and scale in NE Finland 91
Punttila, P. 1995: Kovakuoriaislajiston monimuotoisuuseri tavoin käsitellyillä metsäalueilla Suomessa jaKarjalan tasavallassa. — In: Niemelä, P. & Hannelius,S. (eds.), Monimuotoisuus metsien hoidossa: 43–63.Metsäntutkimuslaitoksen tiedonantoja. Vantaa.
Stenberg, I. 1996: Nest site selection in six woodpecker spe-cies. — Fauna Norvegica, Ser. C, Cinclus 19: 21–38.
Tjernberg, M., Johnsson, K. & Nilsson, S. G. 1993: Den-sity variation and breeding success of the Black Wood-pecker (Dryocopus martius) in relation to forest frag-mentation. — Ornis Fennica 70: 155–162.
Tomppo, E. 1993. Multi-source National Forest Inventoryof Finland. — In: Nyyssönen, A., Poso, S. & Rautala,J. (eds.), Proceedings of Ilvessalo Symposium on Na-tional Forest Inventories, Finland 17–21 August 1992:52–59. The Finnish Forest Research Institute. ResearchPapers 444.
Tomppo, E. 1996: Multi-source National Forest Inventoryof Finland. — In: Päivinen, R., Vanclay, J. & Miina, S.(eds.), New thrusts in forest inventory. Proceedings ofthe Subject Group S4.02-00 ‘Forest Resource Inven-tory and Monitoring’ and Subject Group S4.12-00 ‘Re-mote Sensing Technology’. Volume I. IUFRO XXWorld Congress, 6–12 August 1995, Tampere, Finland.EFI, EFI Proceedings 7: 27–41.
Tomppo, E., Katila, M., Moilanen, J., Mäkelä, H. &Peräsaari, J. 1998: Kunnittaiset metsävaratiedot 1990–1994. Metsätieteen aikakauskirja. Folia Forestalia 4B/1998: 619–839.
Turner, M. G. & Gardner, R. H. 1991: Quantitative meth-ods in landscape ecology: an introduction. — In: Turner,M. G. & Gardner, R. H. (eds.), Quantitative methods inlandscape ecology: 3–14. Springer-Verlag New York,
New York, USA.Virkkala, R. 1987: Effects of forest management on birds
breeding in northern Finland. — Ann. Zool. Fennici24: 281–294.
Virkkala, R. & Liehu, H, 1990: Habitat selection by thesiberian tit (Parus cinctus) in virgin and managed for-ests in northern Finland. — Ornis Fennica 67: 1–12.
Virkkala, R. 1991: Population trends of forest birds in Finn-ish Lapland in a landscape of large habitat blocks: con-sequences of stochastic environmental variation or re-gional habitat alteration? — Biol. Conservation 56:223–240.
Virkkala, R., Heinonen, M. & Routasuo, P. 1991: The re-sponse of northern taiga birds to storm disturbance inthe Koilliskaira National Park, Finnish Lapland. —Ornis Fennica 68: 123–126.
Wiens, J. A. 1976: Population responses to patchy environ-ments. — Annual Review of Ecology and Systematics7: 81–120.
Wiens, J. A. 1990: On the use of ‘grain’ and ‘grain size’ inecology. — Functional Ecology 4: 720.
Wiens, J. A., Stenseth, N. Chr., van Horne, B. & Ims, R. A.1993: Ecological mechanisms and landscape ecology.— Oikos 66: 369–380.
Wikars, L.-O. 1997: Effects of forest fire and the ecology offire-adapted insects. — Ph.D. thesis. University ofUppsala. Sweden.
With, K. A. & Crist, T. O. 1995: Critical thresholds in spe-cies’ responses to landscape structure. — Ecology 76:2446–2439.
With, K. A. & King A. W. 1997: The use and misuse ofneutral landscape models in ecology. Oikos 79: 219–229.