Cattle Pestilence in England and Wales, 1319-1330 © Phil ...
46
1 On Dying Cattle, Starving Humans and Never-Dying Money: Cattle Pestilence in England and Wales, 1319-1330 © Phil Slavin The present paper aims at exploring the extent, impact and nature of the Great Cattle Plague of the early Fourteenth Century, which decimated the bovine population of northern Europe. This was also the first quantifiable cattle panzootic in history. Because of exceptional abundance of quantitative material, England is chosen as a case-study. The sources in question include over 1,800 ‘manorial accounts’ from all over the country, between c.1310 and 1330. Manorial accounts are annual financial and farming accounts, compiled by demesne (=the seigniorial part of a manor) officials, reeves. These accounts include annual revenue and expenditure, as well as data on arable farming and livestock husbandry. Like the Black Death thirty years later, the Cattle Plague seems to have originated in the East, most likely on the plains of Mongolia. According to the ‘official’ fourteenth- century Chinese chronicle Yuan-Shi, there were recurrent outbreaks of cattle plague among the cattle of Mongol nomads between 1288 and 1331. There were also similar outbreaks of panzootics in northern China in 1288, 1301, 1306 and 1335. The mortality was accompanied by exceptionally cold winters with heavy snowstorms. Similarly, the Cattle Plague prevailed in other parts of the Mongolian Empire. In the Ilkhanate, the cattle mortality emptied the royal treasury of Gaykhatu-Khan (1291-5). Two Persian chroniclers, Al-Makrizi and Badr ad-Din al-‘Aini relate that all cattle died in the days of Tohtu Khan, the Khan of the Golden Horde (1291-1312). The written evidence is supported by other proxy data, most notably dendrochronology. A sample from Siberian
-
Upload
khangminh22 -
Category
Documents
-
view
1 -
download
0
Transcript of Cattle Pestilence in England and Wales, 1319-1330 © Phil ...
1
On Dying Cattle, Starving Humans and Never-Dying Money: Cattle Pestilence in
England and Wales, 1319-1330
© Phil Slavin
The present paper aims at exploring the extent, impact and nature of the Great
Cattle Plague of the early Fourteenth Century, which decimated the bovine population of
northern Europe. This was also the first quantifiable cattle panzootic in history. Because
of exceptional abundance of quantitative material, England is chosen as a case-study. The
sources in question include over 1,800 ‘manorial accounts’ from all over the country,
between c.1310 and 1330. Manorial accounts are annual financial and farming accounts,
compiled by demesne (=the seigniorial part of a manor) officials, reeves. These accounts
include annual revenue and expenditure, as well as data on arable farming and livestock
husbandry.
Like the Black Death thirty years later, the Cattle Plague seems to have originated
in the East, most likely on the plains of Mongolia. According to the ‘official’ fourteenth-
century Chinese chronicle Yuan-Shi, there were recurrent outbreaks of cattle plague
among the cattle of Mongol nomads between 1288 and 1331. There were also similar
outbreaks of panzootics in northern China in 1288, 1301, 1306 and 1335. The mortality
was accompanied by exceptionally cold winters with heavy snowstorms. Similarly, the
Cattle Plague prevailed in other parts of the Mongolian Empire. In the Ilkhanate, the
cattle mortality emptied the royal treasury of Gaykhatu-Khan (1291-5). Two Persian
chroniclers, Al-Makrizi and Badr ad-Din al-‘Aini relate that all cattle died in the days of
Tohtu Khan, the Khan of the Golden Horde (1291-1312). The written evidence is
supported by other proxy data, most notably dendrochronology. A sample from Siberian
2
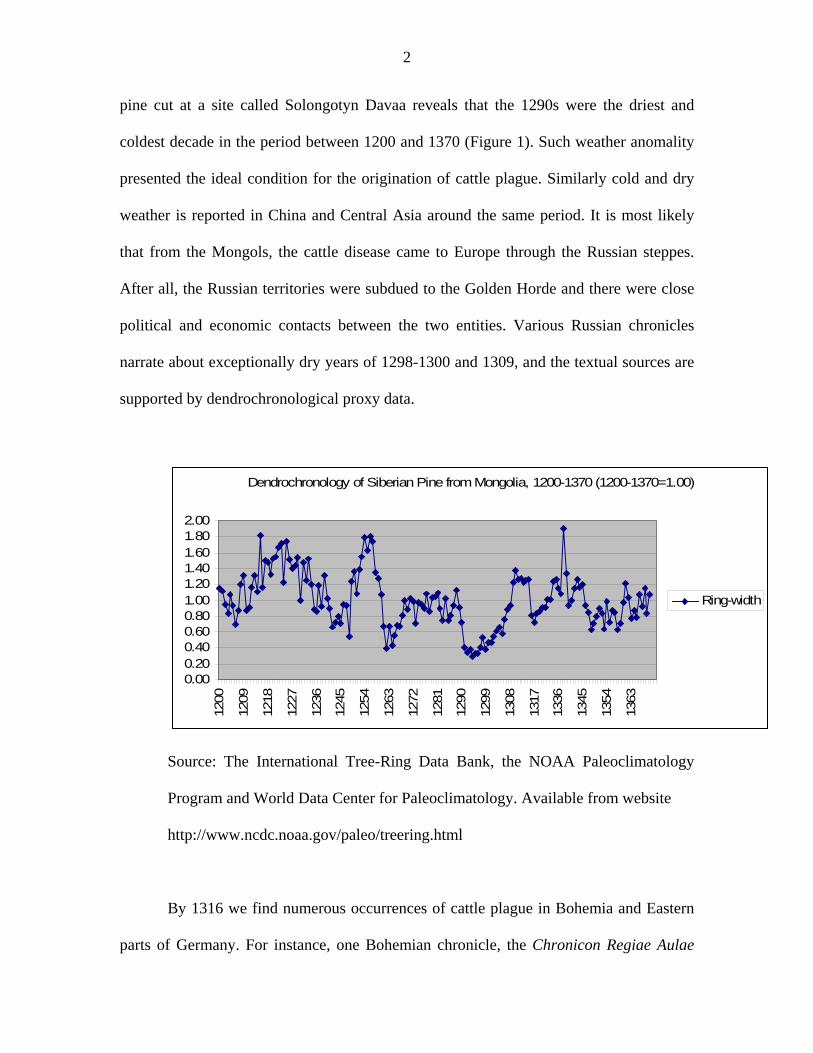
pine cut at a site called Solongotyn Davaa reveals that the 1290s were the driest and
coldest decade in the period between 1200 and 1370 (Figure 1). Such weather anomality
presented the ideal condition for the origination of cattle plague. Similarly cold and dry
weather is reported in China and Central Asia around the same period. It is most likely
that from the Mongols, the cattle disease came to Europe through the Russian steppes.
After all, the Russian territories were subdued to the Golden Horde and there were close
political and economic contacts between the two entities. Various Russian chronicles
narrate about exceptionally dry years of 1298-1300 and 1309, and the textual sources are
supported by dendrochronological proxy data.
Dendrochronology of Siberian Pine from Mongolia, 1200-1370 (1200-1370=1.00)
0.000.200.400.600.801.001.201.401.601.802.00
1200
1209
1218
1227
1236
1245
1254
1263
1272
1281
1290
1299
1308
1317
1336
1345
1354
1363
Ring-width
Source: The International Tree-Ring Data Bank, the NOAA Paleoclimatology
Program and World Data Center for Paleoclimatology. Available from website
http://www.ncdc.noaa.gov/paleo/treering.html
By 1316 we find numerous occurrences of cattle plague in Bohemia and Eastern
parts of Germany. For instance, one Bohemian chronicle, the Chronicon Regiae Aulae
3
relates that the pestilence killed a very large number of horny beasts. It is important to
note that the epizootics occurred here in the time of continual torrential rainfall, harsh
agrarian crisis and famine. From Germany the pestilence spread into the Low Countries
and France, where its presence is attested by 1318. For instance, one later Brabant
chronicler, Edmond de Dynter, reports that the epizootics were of such catastrophic
proportions that hardly one cow in ten survived. In the same year, the pestilence ravaged
Denmark. In England the cattle plague appeared around Easter 1319 and the first region
to be affected was Essex, according to the contemporary John de Trokelowe. The plague
seems to have been imported from the Low Countries, not France: Essex was, after all
and to a certain degree, England’s window to the Netherlands. Had it appeared from
France, then one would expect the southern counties, especially Kent to be the first
victim of the plague, but there is no evidence that the epizootics reached this county
before February 1320. From Essex the plague disseminated, in a fast pace, in three main
directions: northwards, southwards and westwards. The pathogen reached the Scottish
border as early as late August 1319. According to John of Tynemouth’s Historia Aurea
dealing with the Anglo-Scottish relations, nearly all oxen driven to the Siege of Berwick
in August 1319 suddenly died. From Berwick the epidemic penetrated into Scotland
proper, where it ravaged its bovine population to such extent that a local chronicler noted
that ‘nearly all the cattle died’. Sometime before the Michaelmas of the same year, the
plague attacked and killed some stocks in Buckinghamshire, Hampshire, Surrey,
Somerset, and Middlesex. Among these were the bishop of Winchester’s demesnes of
Bentley, Bitterne, Ecchinswell, Hambledon, Havant, Overton, Sutton and Wield (Hants),
Poundisford Park (Somerset) and Farnham (Surrey), the Middlesex demesne of Le Neyte,
4
part of Westminster Abbey’s estate. Between fall 1319 and summer 1320, the pestilence
ravaged all of England and by July of the same year it came to Wales. Ireland was spared
only temporarily: a handful of Irish chronicles speak about the cattle plague sub anno
1321.
The dissemination of the plague pathogen coincided with a period of ecological
and socio-economic crisis, the so-called ‘Great European Famine of 1315-22’. By the
time it reached the Western Europe, torrential rains and harvest failures seem to have
been over, yet there are some clear indications about continuous bad weather. In England,
both chroniclers and manorial accounts report summer draught in 1318 and 1319, as well
as very wet autumn in 1319. To be sure, as much as today, the weather in medieval
England could vary from region to region, and sometimes from village to village. But the
evidence from various parts of the country, including Eastern England, Kent, Wiltshire,
Berkshire, Buckinghamshire, Hampshire and Hertfordhire suggests that the climatic
situation was equally bad all over the country. Various entries in Winchester Pipe Rolls
of 1318 and 1319 indicate that both the summer draught and autumn rain deprived the
livestock of its pasturage resources and, consequently, left the animals hungry. But even
worse situation prevailed during the peak years of the Great Famine (1315-6), when the
torrential floods destroyed fodder crops, legumes and hay, all important components of
the bovine diet. In other words, the bovids suffered malnutrition for at least five years.
There can be little doubt, then, that these animals were weak and easily prone to various
diseases, when the cattle pestilence reached England.
5
How did the plague pathogen disseminate? As far as our sources can tell, there
were at least three potential modes of dissemination. The inter-manorial transfer was one
of them. Sending cattle from one manor to another was a commonplace in late medieval
seigniorial farming. After all, such wealthy lords as Bishop of Winchester, Westminster
Abbey, Canterbury and Norwich Cathedrals controlled a network of manors and to
ensure a good control of such network, an inter-manorial cooperation and transaction was
required. Each year, some manors sent a certain part of their grain and livestock to other
estates belonging to the same lord. This was also true in the years of the cattle plague,
when unaffected manors sent their (in the meantime) healthy cattle to infected demesnes.
There is no doubt that this inter-manorial migration of the animals assisted in spreading
the pathogen.
The second trend was sales of cattle. This, again, was a commonplace in late
medieval agriculture and it represented an important source of seigniorial income. As the
manorial accounts indicate, there were cattle sales during the cattle plague – which is
only natural, since it was to the best of the interest of the lords to get rid of potentially
infected and contagious animals. For instance, on the demesne of Langley-Marsh (Bucks)
seven bovine animals were purchased and nine cattle were sold, while no less than 39
animals died from murrain (out of the total 61). At Teddington (Mdsx), four cows were
transferred from the manor and twenty animals (out of the total 26) succumbed. By
Michaelmas 1319 the demesne of Troy (Monm) had fourteen bovine animals; throughout
the year its lord purchased 36 animals and sold further 22, while the death toll was
twenty. Many more examples can be sited here. One might argue with some confidence
that frequent transfers of animals from herd to herd and, consequently, frequent contacts
6
between beasts would facilitate the murrain. Late medieval stocks were not isolated, as
our manorial accounts record many instances of trade and, thus, hint into a permanent
movement of the animals.
The third mode of dissemination was the ongoing warfare between England and
Scotland. Although the link between war and epidemic disease should not always be
taken as granted, it is obvious that the warfare played an important role in dissemination
of the cattle plague in our case. As we have already seen, a large number of cattle were
sent to Berwick, to provision the English garrisons in August 1319. Furthermore, as the
account book of Bolton Priory indicates, the Scots conducted frequent cattle raids into
Yorkshire. A similar situation is likely to have prevailed in other Northern counties,
directly affected by the Anglo-Scottish war. It is likely that the raiders were motivated
not only by the desire for loot, but also by need: after all, the cattle plague ravaged their
country, too. Furthermore, Scotland depended on pastoral husbandry more than most
parts of England.
Our sources, both textual and statistical, indicate the fast speed of the
dissemination of the pathogen. Having arrived at Essex on or around the Easter Day of
1319 (8 April), it took the pathogen just five months to traverse the distance of about 563
miles (=906 km) and to reach the Siege of Berwick which began on 7 September. It is
perhaps worth to recall that the Black Death pathogen moved considerably slower: it
arrived at Melcombe Regis (Dorset) at the end of June 1348, and has not reach London
until November of the same year. The distance between the two towns would have been
about 136 miles (=219 km).
7
According to the almost contemporary Lanercost Chronicle, the pestilence among
the horny beasts was so bad that ‘very few animals of that kind remained, so that men had
to plough together with horses in that year [1320]’. Thomas Walsingham mentioned that
‘the plague prevailed for one year and infected almost all cattle of the region’. Various
chroniclers spoke about ‘greatest’, ‘miraculous’, ‘unheard’ mortality / murrain /
destruction of cattle (mortalitas / morina / lues). The quasi-mantric rhetoric of these
passages, no mater how exaggerated it might be, gives a sense of the proportion of the
catastrophe. The exact proportion of losses, through both death and transfer, is provided
by manorial accounts. For the purpose of the present article, I have consulted and
analyzed over 1000 accounts for the period between c. 1310 and 1328, from over 150
demesnes. The distribution of the places whose accounts were consulted is represented on
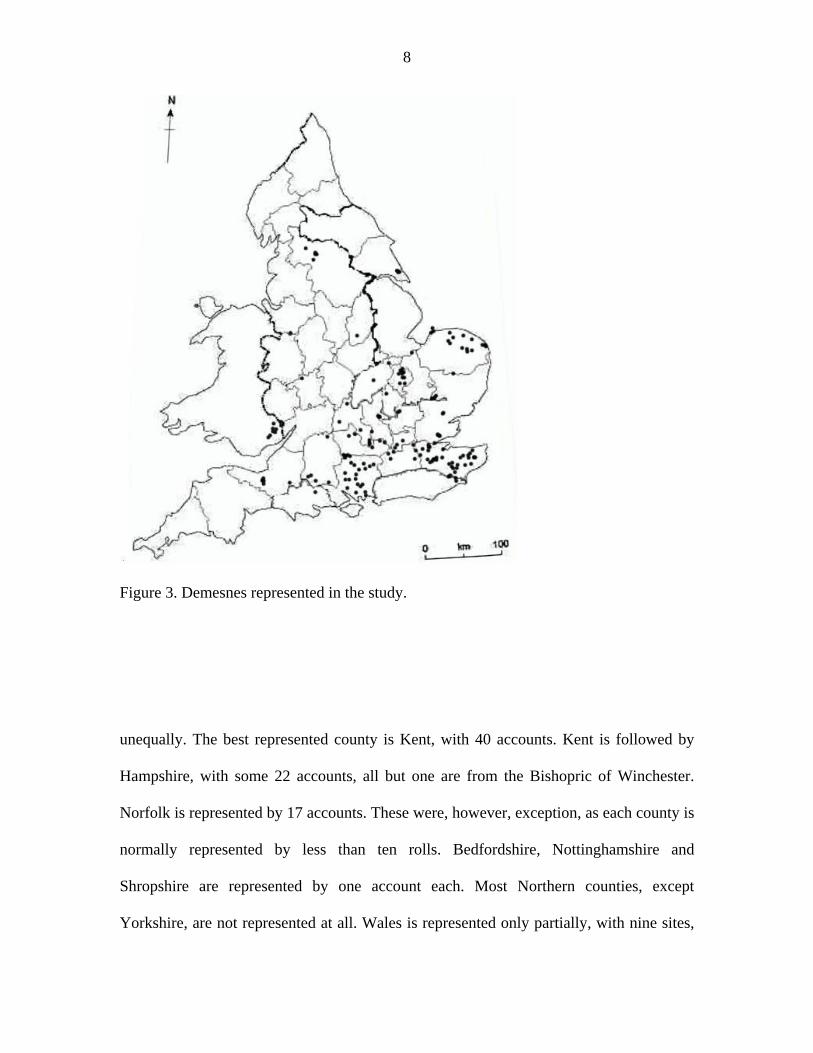
Figure 3. As the figure suggests, each county is represented
8
Figure 3. Demesnes represented in the study.
unequally. The best represented county is Kent, with 40 accounts. Kent is followed by
Hampshire, with some 22 accounts, all but one are from the Bishopric of Winchester.
Norfolk is represented by 17 accounts. These were, however, exception, as each county is
normally represented by less than ten rolls. Bedfordshire, Nottinghamshire and
Shropshire are represented by one account each. Most Northern counties, except
Yorkshire, are not represented at all. Wales is represented only partially, with nine sites,
9
all in Monmouthshire. This uneven distribution derives from two main factors. First, the
lordship. The best preserved accounts, with the fewest gaps and widest coverage, are
from the demesnes belonging to large and wealthy ecclesiastical lords. Canterbury
Cathedral, Norwich Cathedral Priory and Bishopric of Winchester are the best examples.
These houses had post-medieval and post-Dissolution continuity, when they were turned
into secular establishment, ran by Dean and Chapter. The new Anglican authorities
inherited, quite often, the landed properties of their religious predecessors and kept their
ancient records. The lay lords, with some notorious exceptions, did not hold more than a
couple of manors. Because lay estates moved from hand to hand more frequently than
those religious ones, fewer accounts were preserved, over the time. There are quite a few
cases, when the chain of surviving accounts suddenly interrupts at certain chronological
point (say, around 1310) and there are several decades of gaps. Some lay accounts are
especially patchy, with just one or two surviving account for the entire late Middle Ages.
Similarly, many accounts for the cattle plague period simply did not come down to us. It
is because of that patchiness that the regions are represented unevenly. Second, there are
regional differences in farming methods and strategies. Unlike the South, practicing, in
most cases, direct demesne farming up until the Black Death and beyond, the Northern
counties tended to rely more on farm leasing. The tenants, unlike manorial lords, did not
keep track of their farming by compiling annual accounts. Hence, it is hardly surprising
that the North is under-represented.
I have divided the surviving accounts, used in this study, into three categories: (1)
accounts from manors known to have been infected; (2) accounts from manors known to
have evaded the plague (of which there are very few); (3) accounts from manors, for
10
which no 1319-20 has survived, yet the ‘adjacent’ rolls (that is, from 1318-9 and 1320-1)
provide an indirect clue about the losses. For the purpose of calculating the death toll, let
us stick to the first two. Samples from 100 demesnes suggest that during the plague years,
England lost about 60 per cent of its bovine population. In other words, every six in ten
animals succumbed to the plague and eventually died. Obviously, 60 per cent is only an
average number and the mortality rates varied from demesne to demesne. There were
some astonishing cases, when some manors lost all of their bovine animals. For example,
the manor of Culham (Berks) lost all its oxen and cattle, 41 heads in total. The situation
at West Wycombe (Bucks) was even worse: all 61 cattle heads died. Similarly, North
Waltham (Hants) and Gravesend (Kent) lost all of their cattle and oxen, 9 and 24,
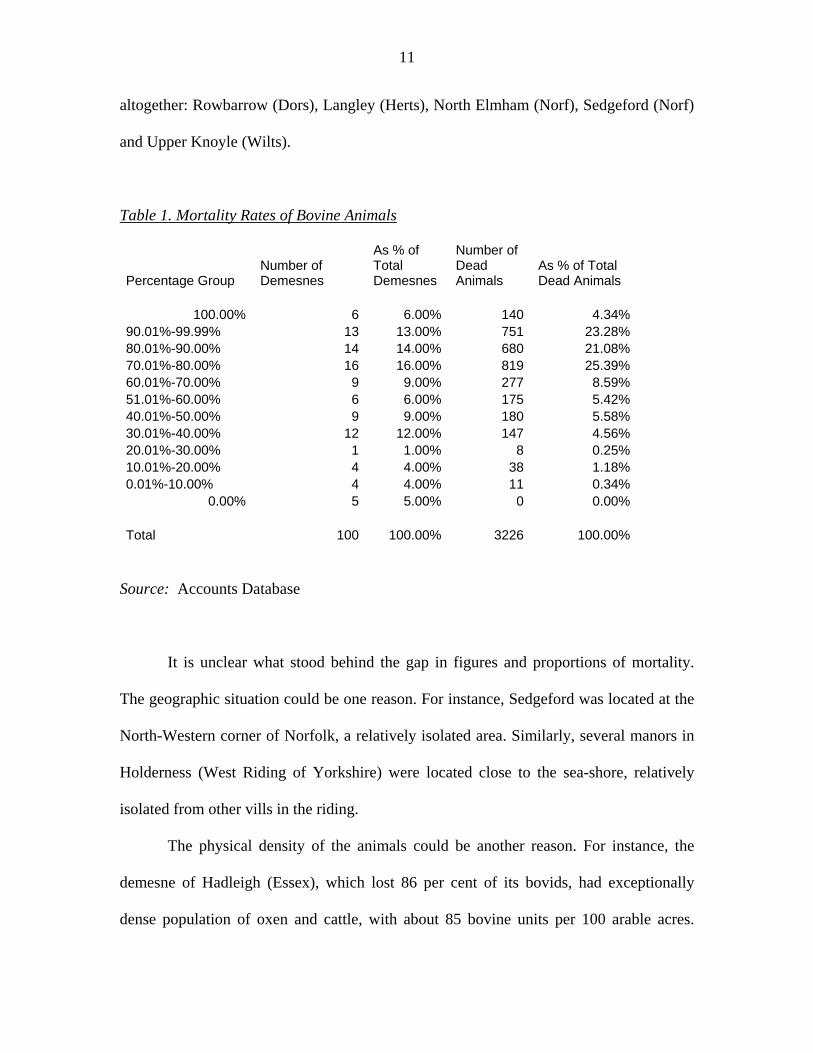
respectively. Exceptionally high death rates, accounting for the top decile (90.01 – 99.99
per cent) are recorded on 14 manors, while the number of dead animals on these manors
represented as much as around 23 per cent of the overall deaths, from all sampled
demesnes (Table 1). Further 13 demesnes fall within the second highest decile (80.01 –
90.00 per cent); these manors lost 662 animals, which accounts for almost 22 per cent of
the total dead livestock. The largest number of vills, 16 in number, fell into the second
highest decile (70.01-80.00 per cent). These were 746 animals, representing almost one
quarter of the total. On the other hand, there were some instances, when some demesnes
got away with the crisis rather lightly. There are only four observations within the second
lowest decile (that is, 10.01-19.99 per cent), representing 1.18 per cent of all dead cattle
and oxen. Further four manors fall into the lowest decile (0.01-10.00), with about 0.34
per cent of the total. There were six lucky demesnes, that were spared by the murrain
11
altogether: Rowbarrow (Dors), Langley (Herts), North Elmham (Norf), Sedgeford (Norf)
and Upper Knoyle (Wilts).
Table 1. Mortality Rates of Bovine Animals
Percentage Group Number of Demesnes
As % of Total Demesnes
Number of Dead Animals
As % of Total Dead Animals
100.00% 6 6.00% 140 4.34%
90.01%-99.99% 13 13.00% 751 23.28% 80.01%-90.00% 14 14.00% 680 21.08% 70.01%-80.00% 16 16.00% 819 25.39% 60.01%-70.00% 9 9.00% 277 8.59% 51.01%-60.00% 6 6.00% 175 5.42% 40.01%-50.00% 9 9.00% 180 5.58% 30.01%-40.00% 12 12.00% 147 4.56% 20.01%-30.00% 1 1.00% 8 0.25% 10.01%-20.00% 4 4.00% 38 1.18% 0.01%-10.00% 4 4.00% 11 0.34%
0.00% 5 5.00% 0 0.00% Total 100 100.00% 3226 100.00%
Source: Accounts Database
It is unclear what stood behind the gap in figures and proportions of mortality.
The geographic situation could be one reason. For instance, Sedgeford was located at the
North-Western corner of Norfolk, a relatively isolated area. Similarly, several manors in
Holderness (West Riding of Yorkshire) were located close to the sea-shore, relatively
isolated from other vills in the riding.
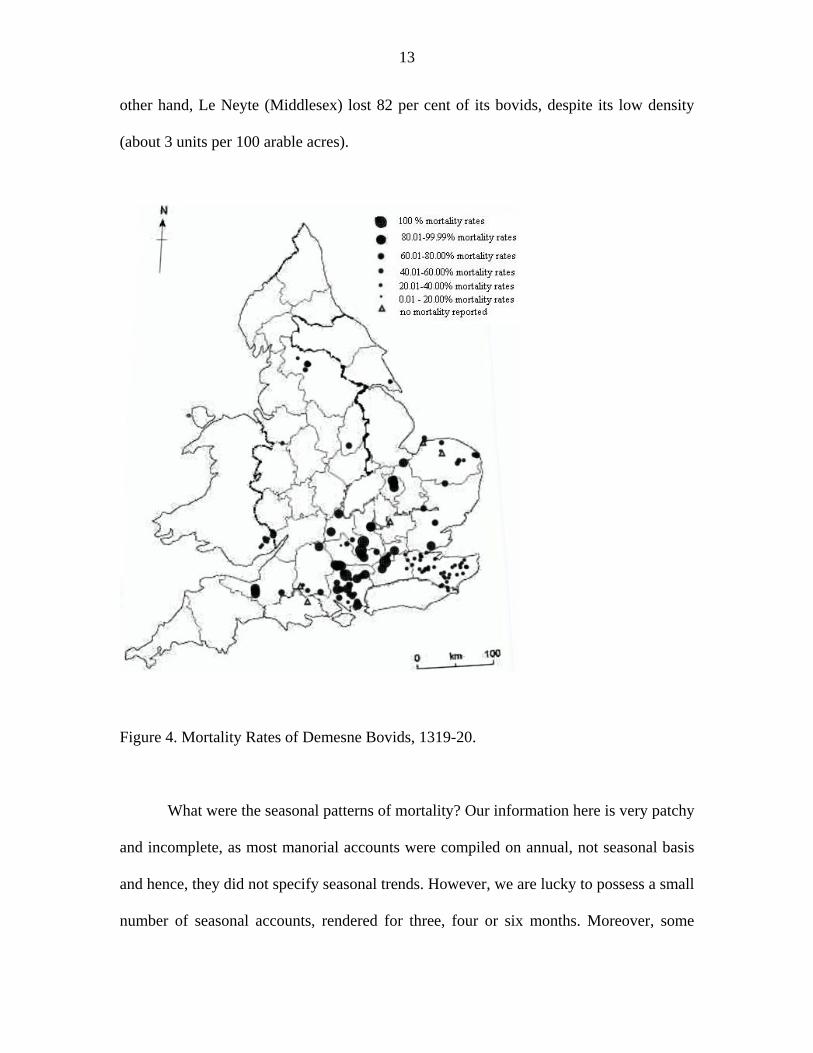
The physical density of the animals could be another reason. For instance, the
demesne of Hadleigh (Essex), which lost 86 per cent of its bovids, had exceptionally
dense population of oxen and cattle, with about 85 bovine units per 100 arable acres.
12
Gateley, on the other hand, had some 2 bovine units per acre and it lost only four per cent
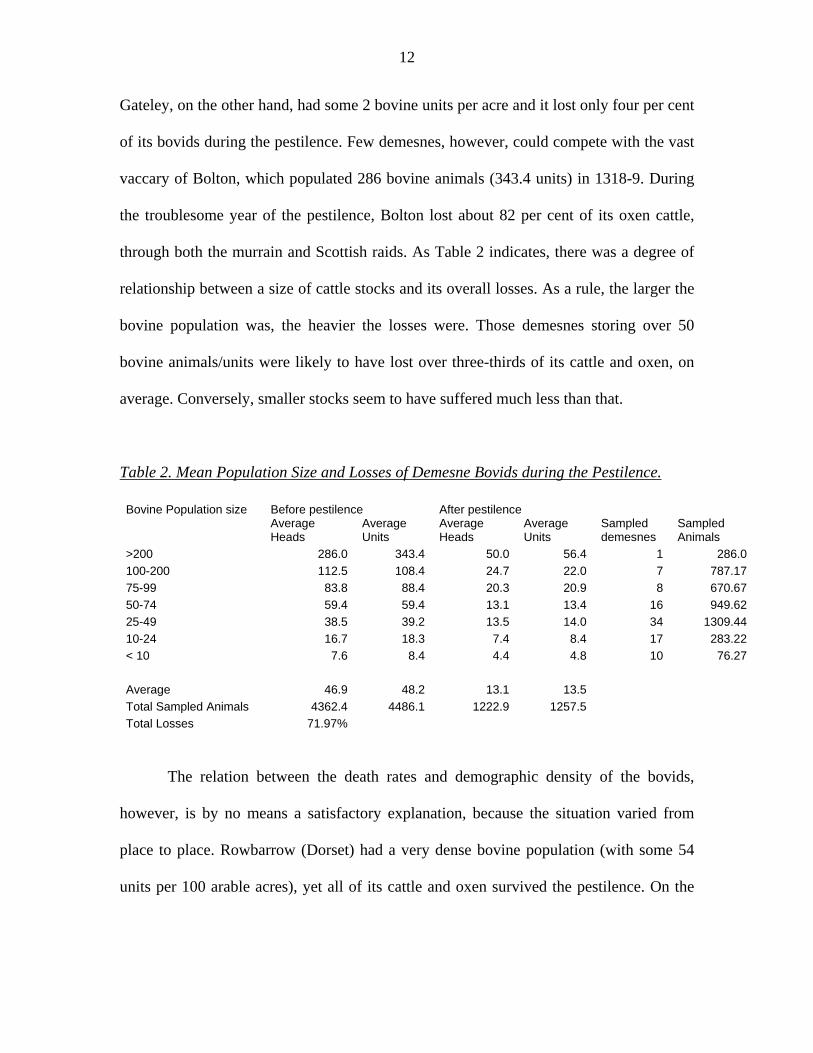
of its bovids during the pestilence. Few demesnes, however, could compete with the vast
vaccary of Bolton, which populated 286 bovine animals (343.4 units) in 1318-9. During
the troublesome year of the pestilence, Bolton lost about 82 per cent of its oxen cattle,
through both the murrain and Scottish raids. As Table 2 indicates, there was a degree of
relationship between a size of cattle stocks and its overall losses. As a rule, the larger the
bovine population was, the heavier the losses were. Those demesnes storing over 50
bovine animals/units were likely to have lost over three-thirds of its cattle and oxen, on
average. Conversely, smaller stocks seem to have suffered much less than that.
Table 2. Mean Population Size and Losses of Demesne Bovids during the Pestilence.
Bovine Population size Before pestilence After pestilence
Average Heads
Average Units
Average Heads
Average Units
Sampled demesnes
Sampled Animals
>200 286.0 343.4 50.0 56.4 1 286.0 100-200 112.5 108.4 24.7 22.0 7 787.17 75-99 83.8 88.4 20.3 20.9 8 670.67 50-74 59.4 59.4 13.1 13.4 16 949.62 25-49 38.5 39.2 13.5 14.0 34 1309.44 10-24 16.7 18.3 7.4 8.4 17 283.22 < 10 7.6 8.4 4.4 4.8 10 76.27 Average 46.9 48.2 13.1 13.5 Total Sampled Animals 4362.4 4486.1 1222.9 1257.5 Total Losses 71.97%
The relation between the death rates and demographic density of the bovids,
however, is by no means a satisfactory explanation, because the situation varied from
place to place. Rowbarrow (Dorset) had a very dense bovine population (with some 54
units per 100 arable acres), yet all of its cattle and oxen survived the pestilence. On the
13
other hand, Le Neyte (Middlesex) lost 82 per cent of its bovids, despite its low density
(about 3 units per 100 arable acres).
Figure 4. Mortality Rates of Demesne Bovids, 1319-20.
What were the seasonal patterns of mortality? Our information here is very patchy
and incomplete, as most manorial accounts were compiled on annual, not seasonal basis
and hence, they did not specify seasonal trends. However, we are lucky to possess a small
number of seasonal accounts, rendered for three, four or six months. Moreover, some
14
accounts specify the dates of the panzootics’ arrival. A closer analysis of the available
data suggests that upon its arrival in Essex on around Easter of 1319, the pathogen moved
rapidly to the north and reached the Scottish border by September of the same year. The
pathogen was spread there by the bovids driven to the Siege of Berwick to provision the
English garrisons. It should be noted that beef meat was an important component in an
English soldier’s diet during the Scottish War of Independence and there are surviving
accounts specifying the exact amounts allocated to sustain the garrisons. It is unclear
through what counties did the pathogen, together with the contagious cattle, travel from
Essex to Berwick, but there are hints that it did not traverse through the eastern parts of
East Anglia (that is, Suffolk and Norfolk). As far as our accounts can tell, there is no
evidence about the advent of the panzootic to that region prior to Michaelmas of that
year. Hence, one might speculate that the cattle were driven through the Midlands, rather
than East Anglia. For instance, the 1318-9 roll from Langley-Marish (Buckinghamshire)
states that its cows died in July and August of 1319. Similarly, the pestilence started
killing the bovids of Clipston (Nottinghamshire) before Michaelmas 1319. At the same
time, the pathogen decimated the cattle of Bishop of Winchester in Buckinghamshire,
Hampshire, Surrey and Somerset. The first place in Norfolk to be infected seems to have
been Martham, three miles from the North Sea. Its animals succumbed shortly after
Michaelmas. From Martham, the pathogen went on ravaging other Norfolk manors. By
All Saints’ Day (1 November) the pathogen reached Hinderclay, in northern Suffolk. The
cattle of Le Neyte, Middlesex, were attacked some time after Michaelmas. Between
November 1319 and the spring of 1320 the pathogen decimated the cattle in various
demesnes, all over the country. For instance, the royal demesne of Clipston
15
(Nottinghamshire) 39 heads, shortly before the Purification of Virgin Mary (2 February
1320) and 59 further animals shortly after the feast. It was not until the summer of 1320,
however, that the panzootic reached the Welsh territories. The stocks of Trelleck and
Troy, both in Monmouthshire, succumbed and died between 3 July and 29 September
1320. From all these patchy data we might conclude that (1) there were no particular
seasonal patterns of mortality; (2) the first counties to have been affected were Essex and
Buckinghamshire; (3) although the plague arrived in England around the Easter 1319 and
reached the Scottish border by early September, many demesnes were spared until at least
Michaelmas of the same year.
Now that we have established the mortality rates of the infected cattle, it is
equally important to consider the overall losses of the demesne bovids during the period
of the panzootic. The sudden arrival of the pestilence and the mass mortality of the cattle
prompted the reeves to get rid of the potentially contagious and morbid animals. This
gave rise to mass ‘panic sales’ of cattle in 1319-20. It is hardly surprising that the cattle
prices were abnormally low in 1320, with an ox selling for merely 4.50 shillings (as
opposed to 18.75 in 1318 and 13.17 in 1319), while a cow could be purchased for as little
as 5.39 shillings (as opposed to 10.72 in 1318 and 8.53 in 1319) (Figure Cattle Prices).
There can be little doubt that it was the physical condition of the cattle herds that
accounted for these exceedingly low prices. In 1320, the surviving animals must have
been weakened by the pestilence and could potentially die any minute. Moreover, many
animals might well have been contagious. Buying such animals would be highly risky,
since the farmers neither knew whether the animal would survive, nor how to heal it, in
case it was infected. Setting very low prices, on the other hand, would minimize the risk
16
evasion, and allow the transactions to carry on. The following year, however, when the
pestilence seems to have ended, the prices soared to exceedingly high levels. This can be
understood in the light of shortage of healthy animals, the survivors of the plague. There
is no doubt that having lost large numbers of cattle, the lords were in a desperate need for
the replacement. The fact that the plague was over and the animals must have been
healthy decreased, or even eliminated, the risk factor in carrying on the transactions. In
some instances, the animals were sold en masse. For instance, 34 out of 36 oxen were
diseased and sold in grosso for £10 4s. 6d at Wisbech Barton (Cambridgeshire).
Similarly, 52 out of 62 animals were sold at Llantrissent (Monmouthshire) in the summer
of 1320.
The panic sales contributed to a further reduction in cattle numbers. As we have
seen, before the panzootic, an average demesne stocked around 46.9 cattle heads (48.2
cattle units), while after the pestilence the average figure fell to 13.1 animals (13.5 units).
In other words, an average demesne cattle stock shrank by about 72 per cent, through
either mortality and raids, or sales and inter-manorial transfers. Such heavy losses
undoubtedly meant harsh economic shocks that the lords and their reeves had to face and
struggle with in order to maintain their manorial husbandry, on the one hand, and
continue generating a steady income, on the other.
The mass bovine mortality bore a series of negative consequences in a number of
agro-pastoral sectors. The one sector to be considered is the grain production. The
17
agricultural year of 1320-1 was especially bad in terms of crop yields and harvests, which
were below average compared to ‘non-crisis’ years, on the one hand, and well
comparable with the disastrous years of torrential rain, failed harvests and famine (1314-
17), on the other. The bad harvests of 1320-1, however, were brought about not only by
heavy rainfall and prolonged draught, but also by the oxen mortality. Oxen played most
vital role in the demesne farming, as the principal plowing beast. Although in many cases
both the lords and the peasants happily switched to horses, because of their versatilities,
the ox was still an omnipresent animal in late-medieval English countryside. Besides its
essential plowing force, oxen also served as important fertilizing agents, and this is can
be said about all other bovids. In the night, the peasants would let their livestock graze on
the post-harvest portion of the arable fields, where the animals would, in turn, deposit
their manure. Livestock waste, in turn, would mix with the soil and restore nitrogen, the
most essential natural fertilizer. In addition, manure would keep down growing weeds,
competing with cereals. This was the very essence of the ‘mixed husbandry’, which made
grains and animals connected one with the other, and which characterized late-medieval
England and other parts of Northern Europe. In other words, the cattle murrain meant
heavy losses in terms of plowing force and fertilizing agents. This would inevitably lead
to reduced yields and bad harvests.
To begin with, one can regard late-medieval England as ‘backward’ agrarian
region compared to the Low Countries, France and the Mediterranean basin, let alone the
Far East, in terms of crop yields. If a fourteenth-century French or Catalan farmer would
expect the yield-to-seed ratio of 14.0:1.0 for wheat in a non-crisis year, their English
counterpart would hope for at least 3.75:1.0 for the same grain. This was lower
18
expectation than the figure of 5.0:1.0, proposed by Walter of Henley in his agricultural
treatise Husbandry, written towards the end of the thirteenth century. In fact, the rate of
5.0:1.0 was considered a successful harvest; 7.5:1.0 was seen as an excellent yield; while
10.0:1.0 was exceptionally rare. In fact, the highest wheat yield ever recorded in the
manorial accounts was 11.8:1.0, achieved on a Hampshire demesne of Ashmansworth in
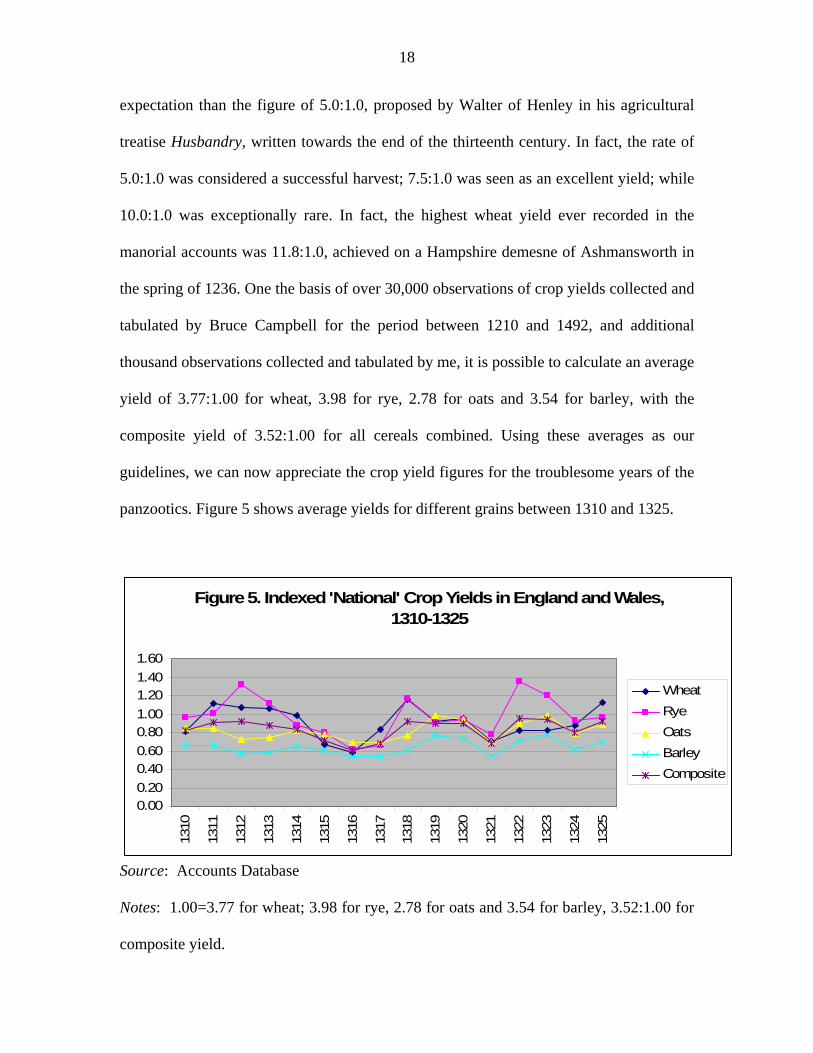
the spring of 1236. One the basis of over 30,000 observations of crop yields collected and
tabulated by Bruce Campbell for the period between 1210 and 1492, and additional
thousand observations collected and tabulated by me, it is possible to calculate an average
yield of 3.77:1.00 for wheat, 3.98 for rye, 2.78 for oats and 3.54 for barley, with the
composite yield of 3.52:1.00 for all cereals combined. Using these averages as our
guidelines, we can now appreciate the crop yield figures for the troublesome years of the
panzootics. Figure 5 shows average yields for different grains between 1310 and 1325.
Figure 5. Indexed 'National' Crop Yields in England and Wales, 1310-1325
0.000.200.400.600.801.001.201.401.60
1310
1311
1312
1313
1314
1315
1316
1317
1318
1319
1320
1321
1322
1323
1324
1325
WheatRyeOatsBarleyComposite
Source: Accounts Database
Notes: 1.00=3.77 for wheat; 3.98 for rye, 2.78 for oats and 3.54 for barley, 3.52:1.00 for
composite yield.
19
As the figure demonstrates, the entire period between 1310 and 1325 yielded
lower than average harvests. Relatively good years were 1311-13, 1318-20, 1322-23 and
1325, when the indexed yields averaged at least or over 90 per cent of normally expected
harvests. Particularly bad were the harvests of 1315-17 and 1321. The indexed composite
crop yields were only 0.71, 0.61, 0.68 and 0.68 for 1315, 1316, 1317 and 1321,
respectively. To be more specific, in the farming year of 1320-1, running from
Michaelmas to Michaelmas, the average yields were as low as 2.67:1.00 for wheat,
3.10:1.00 for rye, 1.91:1.00 for oats and 3.00:1.00 for barley (2.67:1.00 for composite
grain). These figures were close and comparable to those of 1315-17, which, in turn,
points out that the English population, or at least its rural component, may have
experienced a subsistence crisis. As some agricultural historians consider, the figures
below 3.00:1.00 mean below minimal requirements to sustain human life (with 2.00:1.00
indicating no profit, since half of it is to be sown), while only 5.00:1.00 or higher
represents surplus.
Naturally, the figures varied from demesne to demesne and from grain to grain.
Wheat, the most intolerant grain, seems to have suffered the most. For instance, a
Gloucestershire demesne of Sutton-under-Brailes achieved only 1.02:1.00 for wheat
(compared to 3.42 in 1320) and 0.83:1.00 for oats (compared to 2.77 in 1320). Similarly,
a Middlesex demesne of Hendon had exceptionally low yields of 0.96:1.00 for wheat
(compared to 2.98 in 1319), 1.06:1.00 for rye (compared to 2.98 in 1320) and merely
0.70:1.00 for oats (compared to 2.56 in 1319). Some demesnes, where death tolls were
low or which were spared by the pestilence altogether, do not seem to exhibit low yields.
20
Thus, on Sedgeford the figures are 4.58 for wheat (compared to 4.23 in 1319-20), 3.05
for rye (compared to 3.87 in 1319-20), 3.76 for peas (compared to 2.29 in 1319-20), 3.14
for oats (compared to 2.67 in 1319-20) and 4.61 for barley (compared to 4.35 in 1319-
20).
On the other hand, the relationship between the mortality rates and low crop
yields should not always be seen as given. In some instances, mass losses of oxen and
cattle did not necessarily mean low yields. For instance, Wisbech Barton
(Cambridgeshire) lost 32 out of 34 oxen (through murrain and ‘panic sales’), yet it was
able to achieve comparatively high wheat yields of 4.97:1.00 (nevertheless, lower than
7.07:1.00 in 1313-14 and 8.20 in 1325-6). Hemsby (Norfolk) lost 76 per cent of its
bovids, yet it was able to achieve relatively high yields: 5.25 for wheat, 2.75 for peas,
3.00 for oats and 4.33 for barley. Both Wisbech Barton and Hemsby devoted
comparatively large proportions of their arable to legumes, which were yet another vital
fertilizing agent in the pre-Industrial society. As Bruce Campbell has shown, Norfolk
lords succeeded in achieving high crop yields, when they relied on legumes rather than
animal manure. At the same time, the importance of legumes as nitrogen-fixing agents
should not be too overstated: after all, their capacities were rather limited compared to
more powerful agents, such as clover, not introduced until the seventeenth century.
Moreover, much nitrogen would be wasted during the following year, when the spring
fields are converted into fallow (given that it was a three-field system). Conversely,
Gateley (Norfolk), where no animals perished in the pestilence, exhibits rather low yields
for wheat and oats compared to ‘normal’ years (3.11 and 1.38 respectively). These three
examples, however, may have been anomalities rather than a rule and in the majority of
21
cases, there seems to be a clear relationship between the proportions of the disaster and
the level of crop yields.
Another sector of productivity to have been affected by the crisis was milk yields.
Again, late-medieval milk yields were considerably lower compared to those achieved
after the Industrial Revolution. Although the rates differed from region to region, it is
now established that an average late-medieval English cow would produce between 100
and 130 gallons of milk on annual basis, while figures higher than 150 gallons were
considered exceptional and outstanding. The manorial data agrees with the figures
proposed by the late thirteenth-century treatises. As Gregory Clark estimates, between the
thirteenth and nineteenth century, the milk production per cow increased four-fold. It
should be noted that unlike crop yields, found in virtually every grange account, milk
yields were recorded rather seldom and indirectly. The figures can be interpolated from
the amount of row milk, cheese and butter produced by cows and recorded by the
auditors. Patchy as they may be, the available data suggest that bovine mortality
decreased the lactage rates both nationwide and per animal.
Manorial accounts from seven Winchester demesnes (Ivinghoe, Adderbury, West
Wycombe, Morton, Wargrave, Culham and Brightwell) provide a comprehensive and
clear picture. On average, each demesne cow would produce approximately 134 gallons
of milk every year in the 1310s. These figures differed from place to place: for instance,
in 1315, every cow yielded 187 gallons at West Wycombe, while in 1316 the Adderbury
cows produced merely 104 gallons each. The year of 1320 saw a catastrophic shortage of
milk, when surviving cows produced around 39 gallons each. In that year no cheese was
22
produced in the winter and no raw milk was collected in the same season. Some
demesnes, which lost all of their bovines, did not produce any milk or dairy products.
These included Ivinghoe, Morton, Wargrave and Culham. Milk yields were still very low
in the following year, with an average cow producing about 79 gallons of milk. There are
no accounts for 1322-4, but the 1325 account indicates that milk yields were high again
and they indeed exceeded their pre-1320 levels. From that year onwards, the accounts
demonstrate ‘normal’ milk yields, ranging between 100 and 200 gallons of milk a year.
At Wellingborough (Northamptonshire) there is no surviving account for 1319-20
(in fact, there is a gap between 1314-5 and 1322-3), but it is evident that this demesne
suffered some losses during the murrain period, since there were nine cows in 1322, as
opposed to 15 in 1315. Here, too, the lactage rates increased after the pestilence and in
1322-3 they exceeded the 1314-5 levels (about 129 gallons in the former, compared to
about 92 gallons in the latter).
The decline or termination in milk production is one of the most common
symptoms of any major bovine panzootics, including Anthrax, Foot-and-Mouth Disease
(FMD), Contagious Bovine Pleuropneumonia (CBPP) and Rinderpest. The peasants and
reeves were undoubtedly aware of the connection between the pestilence and low milk
yields. Many accounts state that low milk yields were achieved on the account of the
murrain; the most common formula used by the scribes was et non plus pro morina
earum (and no more [milk] because of their [cows’] murrain). What is perhaps somewhat
striking is the fact that the milk production level actually boosted after the pestilence.
One possible explanation lies in the change in landscape after the murrain. Mass bovine
mortality created a sudden surplus of pasturage, with less grazing animals per acre of
23
arable. Namely, more grassland was available per bovid to graze upon. That there is a
direct correlation between the available grass resources and lactage levels has now long
been established. Thus, more ready and abundant grassland resources, used as pasturage,
may have improved cows’ nutrition and, accordingly, increased milk yields. This,
however, may not have been the case in every demesne, since some of reeves, as we shall
see later, chose to augment the arable portion of the demesne, at the expense of pasturage.
More indirect evidence about the impact of the cow mortality on dairy production
is the weight of cheese produced on demesnes. Here we have to distinguish between the
so-called ‘winter cheese’ (caseus hiemalis) and ‘fall cheese’ (caseus estimalis). On the
estates of Bishopric of Winchester, ‘winter cheese’ weighed about 0.25 stones (3.5 lb)
each, while the weight of ‘fall cheese’ varied in ‘normal’ years between 0.14 and 0.80
stones, averaging at 0.50 stones each (7 lb) each. As far as the available evidence goes, an
average weight of cheese declined by about 70 per cent, from 0.50 to 0.16 stones (7 lb
and 2.28 lb) per unit, in 1320. In some cases, the weight decreased even more. For
instance, at High Clere an average unit of cheese was 0.73 stones (10.22 lb) before the
pestilence, while in 1320 and 1321 it was merely 0.13 and 0.14 stones (1.82 and 1.96 lb),
respectively. It took several decades to restock the vaccine stocks of Winchester
Bishopric, because its manorial authorities, similarly to their counterparts from
Canterbury Cathedral demesnes, worked to replenish the ox numbers first. It is hardly
surprising, then, that cheese weight remained exceedingly low until the 1340s: the low
weight of cheese reflected the low number of its producers, cows.
24
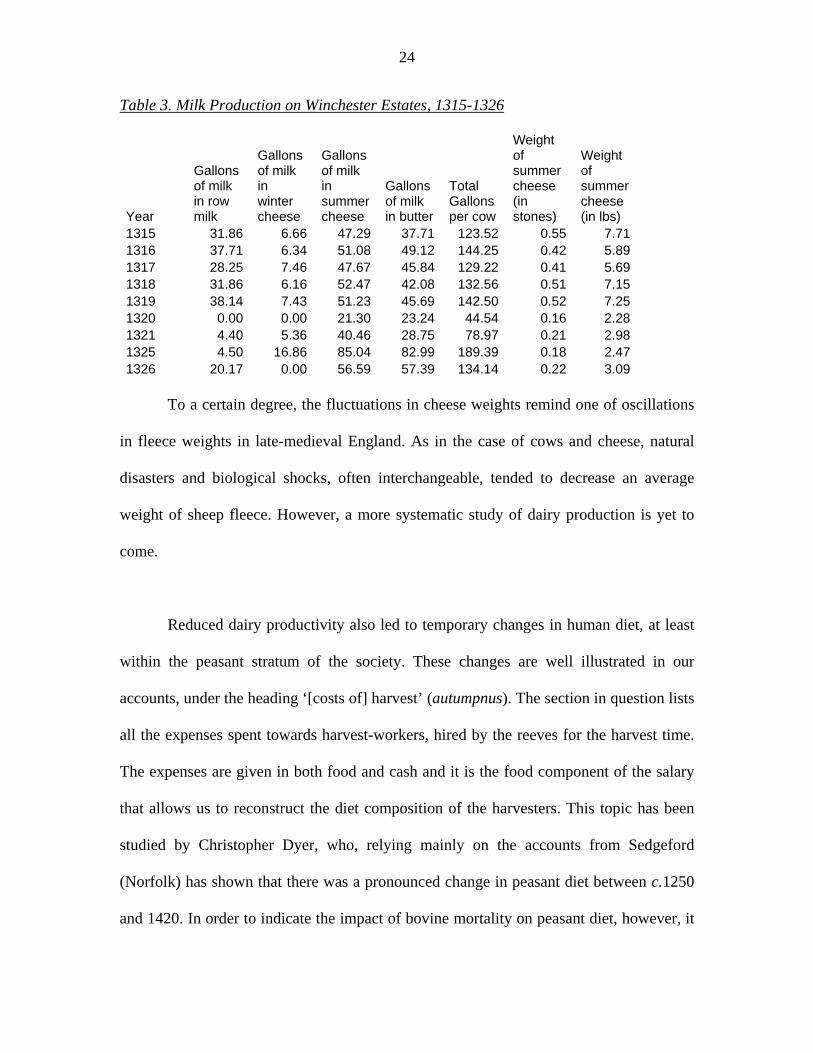
Table 3. Milk Production on Winchester Estates, 1315-1326
Year
Gallons of milk in row milk
Gallons of milk in winter cheese
Gallons of milk in summer cheese
Gallons of milk in butter
Total Gallons per cow
Weight of summer cheese (in stones)
Weight of summer cheese (in lbs)
1315 31.86 6.66 47.29 37.71 123.52 0.55 7.71 1316 37.71 6.34 51.08 49.12 144.25 0.42 5.89 1317 28.25 7.46 47.67 45.84 129.22 0.41 5.69 1318 31.86 6.16 52.47 42.08 132.56 0.51 7.15 1319 38.14 7.43 51.23 45.69 142.50 0.52 7.25 1320 0.00 0.00 21.30 23.24 44.54 0.16 2.28 1321 4.40 5.36 40.46 28.75 78.97 0.21 2.98 1325 4.50 16.86 85.04 82.99 189.39 0.18 2.47 1326 20.17 0.00 56.59 57.39 134.14 0.22 3.09
To a certain degree, the fluctuations in cheese weights remind one of oscillations
in fleece weights in late-medieval England. As in the case of cows and cheese, natural
disasters and biological shocks, often interchangeable, tended to decrease an average
weight of sheep fleece. However, a more systematic study of dairy production is yet to
come.
Reduced dairy productivity also led to temporary changes in human diet, at least
within the peasant stratum of the society. These changes are well illustrated in our
accounts, under the heading ‘[costs of] harvest’ (autumpnus). The section in question lists
all the expenses spent towards harvest-workers, hired by the reeves for the harvest time.
The expenses are given in both food and cash and it is the food component of the salary
that allows us to reconstruct the diet composition of the harvesters. This topic has been
studied by Christopher Dyer, who, relying mainly on the accounts from Sedgeford
(Norfolk) has shown that there was a pronounced change in peasant diet between c.1250
and 1420. In order to indicate the impact of bovine mortality on peasant diet, however, it
25
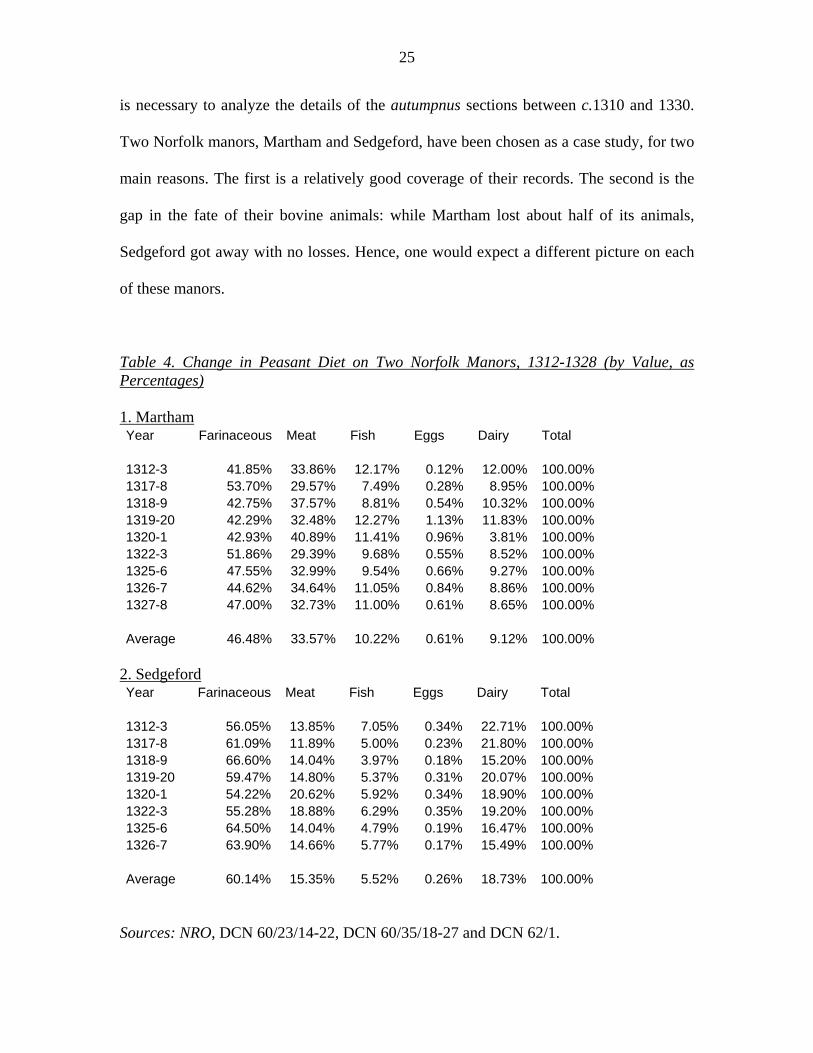
is necessary to analyze the details of the autumpnus sections between c.1310 and 1330.
Two Norfolk manors, Martham and Sedgeford, have been chosen as a case study, for two
main reasons. The first is a relatively good coverage of their records. The second is the
gap in the fate of their bovine animals: while Martham lost about half of its animals,
Sedgeford got away with no losses. Hence, one would expect a different picture on each
of these manors.
Table 4. Change in Peasant Diet on Two Norfolk Manors, 1312-1328 (by Value, as Percentages) 1. Martham Year Farinaceous Meat Fish Eggs Dairy Total 1312-3 41.85% 33.86% 12.17% 0.12% 12.00% 100.00% 1317-8 53.70% 29.57% 7.49% 0.28% 8.95% 100.00% 1318-9 42.75% 37.57% 8.81% 0.54% 10.32% 100.00% 1319-20 42.29% 32.48% 12.27% 1.13% 11.83% 100.00% 1320-1 42.93% 40.89% 11.41% 0.96% 3.81% 100.00% 1322-3 51.86% 29.39% 9.68% 0.55% 8.52% 100.00% 1325-6 47.55% 32.99% 9.54% 0.66% 9.27% 100.00% 1326-7 44.62% 34.64% 11.05% 0.84% 8.86% 100.00% 1327-8 47.00% 32.73% 11.00% 0.61% 8.65% 100.00% Average 46.48% 33.57% 10.22% 0.61% 9.12% 100.00%
2. Sedgeford Year Farinaceous Meat Fish Eggs Dairy Total 1312-3 56.05% 13.85% 7.05% 0.34% 22.71% 100.00% 1317-8 61.09% 11.89% 5.00% 0.23% 21.80% 100.00% 1318-9 66.60% 14.04% 3.97% 0.18% 15.20% 100.00% 1319-20 59.47% 14.80% 5.37% 0.31% 20.07% 100.00% 1320-1 54.22% 20.62% 5.92% 0.34% 18.90% 100.00% 1322-3 55.28% 18.88% 6.29% 0.35% 19.20% 100.00% 1325-6 64.50% 14.04% 4.79% 0.19% 16.47% 100.00% 1326-7 63.90% 14.66% 5.77% 0.17% 15.49% 100.00% Average 60.14% 15.35% 5.52% 0.26% 18.73% 100.00%
Sources: NRO, DCN 60/23/14-22, DCN 60/35/18-27 and DCN 62/1.
26
Notes: All food components paid in kind were converted into their financial equivalent,
using local, rather than ‘national’, prices.
On Martham, the dairy allowances of the harvesters fell from 11 percent in the
1310s to below four per cent in 1321. In terms of financial equivalent, the total value of
dairy products given to the harvesters fell from approximately 19.56s to 6.62s (0.34d and
0.12d per man-day). Also, in 1320 the manorial authorities were unable to provision the
harvest-workers with their regular supply of beef and had to substitute a usual bovine
carcass with two pigs. In 1323, however, the dairy component increased again and it
reached nearly its pre-1320 level. There was nothing similar at Sedgeford, which was
lucky to hot suffer any losses. In both 1320 and 1321 the harvesters received their regular
quantities of dairy allowances, which included 48 stones of cheese (672 lbs) and
unspecified amount of butter and milk, produced on the demesne. Furthermore, the
reeves were able to provide the workers with a carcass of a bull in 1320.
Although two demesnes can by no means provide a comprehensive picture, there
is clear evidence that a similar situation prevailed elsewhere. Let us look at the case of
Hinderclay (Suffolk), where the picture was a bit more complicated. The autumpnus
section here made a clear distinction between the diet of hired workers (servientes) and
customary labourers (customarii). Between 1310 and 1319, the manorial authorities had
spent, on average, 5s 8d on cheese for customary workers (0.27d per one boom-work)
and an unspecified amount on dairy products for hired-labourers, in the course of harvest
time. In 1320 and 1321, on the other hand, the customarii did not receive any cheese at
27
all, which was substituted with herrings. Similarly, in 1320 and 1321 the authorities
allocated, respectively, only 2s 7d and 2s 3d for cheese and butter to be distributed
among the servientes, while in 1322 they spent 5s 3.5d to provision the hired workers
with the same articles.
In other words, the availability of live and healthy bovids dictated the structure of
the labourers’ diet. When the pestilence hit the demesnes, the authorities could not longer
afford the same quantities of dairy products and beef to be distributed among the
harvesters. Once the panzootics were over, however, the pre-1320 proportions were
restored.
The bovine crisis, which reduced productivity and supply of vaccine milk,
increased mortality rates among demesne lambs. To a certain degree, the survival of new-
born lambs depended on the amount of milk given to them by dairy-maids. On the estates
of Bishop of Winchester, average mortality rates of lambs in non-crisis years would be
about 10-15 per cent. During the outbreak of ovine panzootics, perhaps liverfluke, in
1315-6, the lamb mortality there increased to over 18 per cent. Yet, the mortality had yet
to reach its peak in 1319-20, when 1,451 out of total 6,805 lambs did not survive their
first year (that is, over 21 per cent). Some places, however, show even higher figures. On
Knoyle (Wiltshire), Alresford, Droxford, Hambledon, Mardon and Waltham
(Hampshire), mortality rates varied between one-quarter and one-half of all new-born
lambs. These demesnes lost all or nearly all their cows in the pestilence, likely before
Michaelmas of 1319, and hence they were deprived of their milk supply. Thus, there was
28
undoubtedly a clear relationship between vaccine population and their milk supply, on
the one hand, and lamb survival, on the other.
The consequences of lamb mortality were felt especially within the ovine sector.
Losing lambs meant having fewer adult ovids, because there were fewer young animals
to grow into the mature ones. On 36 demesnes of Winchester Bishopric there were
14,011 mature ovine animals, namely muttons, rams and ewes, in 1318-9; while the year
after there were 11,482 sheep. Namely, the ovine population shrank by about 15 per cent.
Clearly, on some manors the losses were much higher. For instance, Knoyle lost 28 per
cent (1,187 in 1319-20 and 1,655 in 1318-9); Downton lost 36 per cent (898 in 1319-20
and 1,404 in 1318-9); Twyford lost 27 per cent (675 in 1319-20 and 922 in 1318-9). It
should be noted, however, that the ovine population declined not only because of low
replacement rates, but also because of sales, which carried on despite reduced supply of
sheep. In some cases, the consequences were far reaching. Ivinghoe (Buckinghamshire)
lost all of its 174 sheep and then stocked only one ewe in the 1320s. Similar situation is
found at West Wycombe (Buckinghamshire) and Farnham (Surrey), which lost all of
their ovids through lamb mortality, lower replacement rates and sales.
29
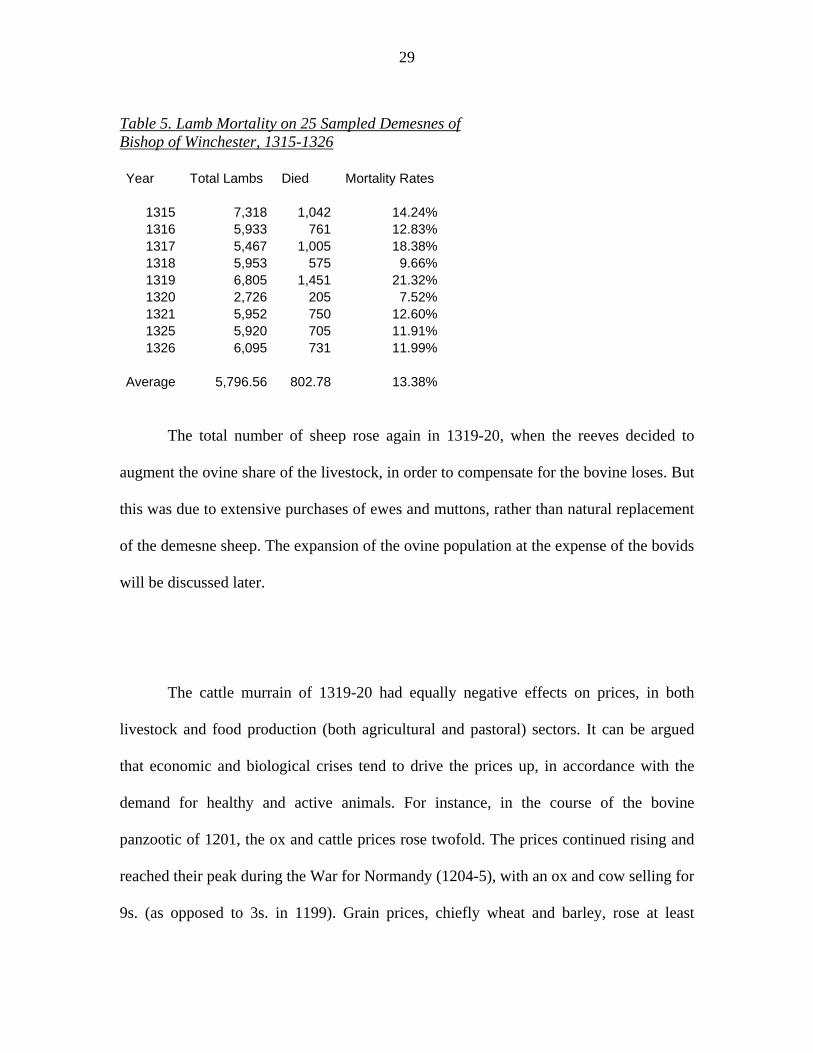
Table 5. Lamb Mortality on 25 Sampled Demesnes of Bishop of Winchester, 1315-1326 Year Total Lambs Died Mortality Rates
1315 7,318 1,042 14.24%1316 5,933 761 12.83%1317 5,467 1,005 18.38%1318 5,953 575 9.66%1319 6,805 1,451 21.32%1320 2,726 205 7.52%1321 5,952 750 12.60%1325 5,920 705 11.91%1326 6,095 731 11.99%
Average 5,796.56 802.78 13.38%
The total number of sheep rose again in 1319-20, when the reeves decided to
augment the ovine share of the livestock, in order to compensate for the bovine loses. But
this was due to extensive purchases of ewes and muttons, rather than natural replacement
of the demesne sheep. The expansion of the ovine population at the expense of the bovids
will be discussed later.
The cattle murrain of 1319-20 had equally negative effects on prices, in both
livestock and food production (both agricultural and pastoral) sectors. It can be argued
that economic and biological crises tend to drive the prices up, in accordance with the
demand for healthy and active animals. For instance, in the course of the bovine
panzootic of 1201, the ox and cattle prices rose twofold. The prices continued rising and
reached their peak during the War for Normandy (1204-5), with an ox and cow selling for
9s. (as opposed to 3s. in 1199). Grain prices, chiefly wheat and barley, rose at least
30
fourfold. But the 1201-5 crisis was nothing compared to the situation of 1319-20.
England’s economy was weakened not only by the bovine pestilence, but also by
inclement weather, coastal inundations, the agrarian crisis, a recent sheep murrain (1315-
7) and violent war with Scotland, which meant high provision, transportation and
ammunition costs, as well as constant Scottish raids into the Northern counties.
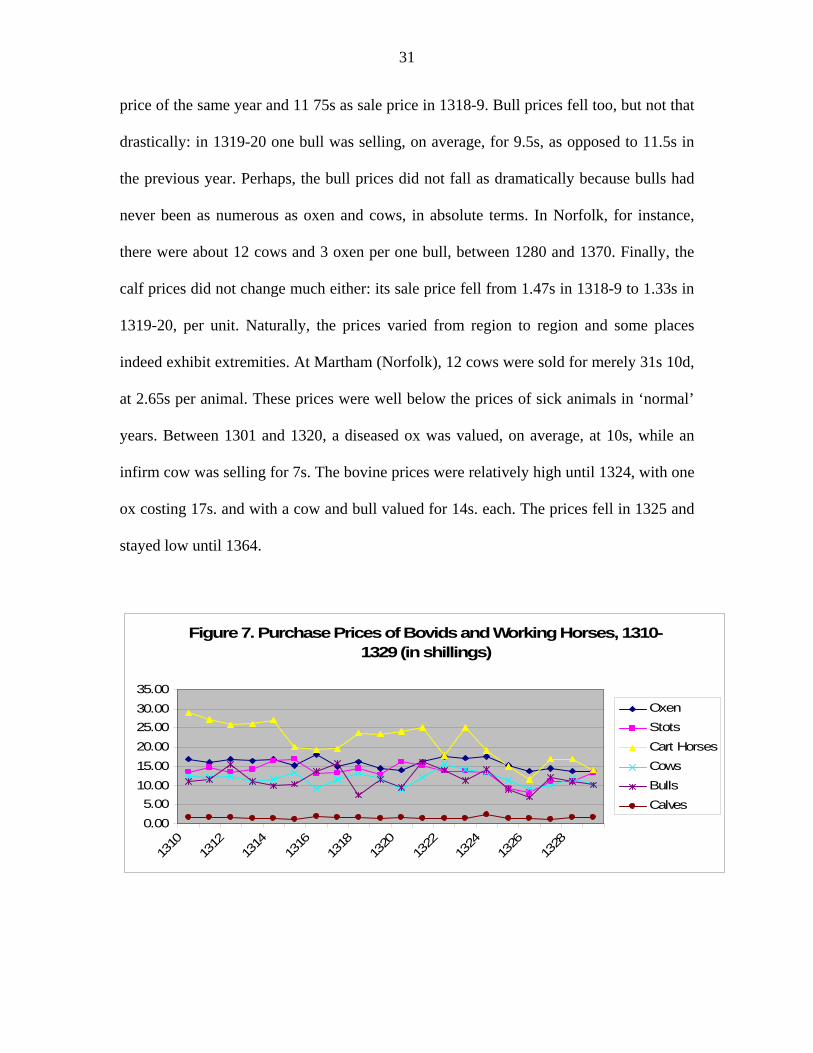
The panzootic crisis left its pronounced mark upon the prices of bovine animals
(Figure 7). Reading and analyzing the livestock prices as indicated in the manorial
accounts is tricky by itself, because the prices varied not only geographically, but also
seasonally. Moreover, they were often dictated by age and physical condition of an
animal. Unfortunately, far not every account distinguishes between healthy and diseased
animals, and very few, in fact, indicate the seasonal patterns of the prices. There were
also visible differences between the sale and purchase prices. As a rule, manorial reeves
did their best to sale older, sterile or sick animals, in order to ensure healthy and fertile
stocks. The obvious exception was calves, which were sold to get rid of a potential
animal surplus. As far as purchases are concerned, these were mostly young and firm
beasts, ready to serve the peasants several more years. Thus, purchase prices tended to be
somewhat higher than the purchase ones. The gap between the purchase and sale prices
was never as apparent and deep as during the panzootic of 1319-20. What is interesting
here is the fact that the sale prices of bovine animals did not rise, but actually fell. During
that year, an ox was selling for as low as 4.5s per beast (in contrast with 14.50s as
purchase price of that same year and 13s as sale price of 1318-9). Cow prices fell
similarly, with an animal selling for as low as 6s, compared with about 9s as purchase
31
price of the same year and 11 75s as sale price in 1318-9. Bull prices fell too, but not that
drastically: in 1319-20 one bull was selling, on average, for 9.5s, as opposed to 11.5s in
the previous year. Perhaps, the bull prices did not fall as dramatically because bulls had
never been as numerous as oxen and cows, in absolute terms. In Norfolk, for instance,
there were about 12 cows and 3 oxen per one bull, between 1280 and 1370. Finally, the
calf prices did not change much either: its sale price fell from 1.47s in 1318-9 to 1.33s in
1319-20, per unit. Naturally, the prices varied from region to region and some places
indeed exhibit extremities. At Martham (Norfolk), 12 cows were sold for merely 31s 10d,
at 2.65s per animal. These prices were well below the prices of sick animals in ‘normal’
years. Between 1301 and 1320, a diseased ox was valued, on average, at 10s, while an
infirm cow was selling for 7s. The bovine prices were relatively high until 1324, with one
ox costing 17s. and with a cow and bull valued for 14s. each. The prices fell in 1325 and
stayed low until 1364.
Figure 7. Purchase Prices of Bovids and Working Horses, 1310-1329 (in shillings)
0.005.00
10.0015.0020.0025.0030.0035.00
1310
1312
1314
1316
1318
1320
1322
1324
1326
1328
OxenStotsCart HorsesCowsBullsCalves
32
What is truly striking is that the manorial authorities continued to sell carcasses
and meat of the dead animals. This is despite the fact that post-mortem, skin and flesh of
contagious bovines are rendered useless. Clearly, some reeves undoubtedly realized that
and there are numerous references to that in our accounts. For instance, the 1319-20
account from Teddington (Middlesex) indicates that two vaccine carcasses were sold for
just 2s, because their ‘flesh was of no value’ (carnes nullius valoris). Nevertheless, the
trade in carcasses carried on, albeit contagious carrions were selling cheaper than corpses
of healthy animals. On average, an ox carrion was selling for 15d (=1s 3d), while a cow
carcass was valued at 18d (=1s 6d) apiece. For comparison, in the 1300s and 1310s
bovine and vaccine corpses cost 31s (=2s 7d) and 36s (=3s), respectively. Whenever
possible, the reeves attempted to sell carcasses with flesh. Here, they could expect to
receive about 30d (=2s 6d) for a dead ox and 36d (=3s) for a succumbed cow, compared
with about 60d (=5s) and 48d (=4s) for normally butchered animals. It is unclear whether
the bovine carrions made their way into hungry mouths of humans, because the chronicle
evidence is contradictive. On the one hand, the contemporary John de Trokelowe stated
that ‘there was none among humans, who would dare to taste bovine flesh, so that no one,
God forbid, would succumb intoxicated by their carrions’. At the same time, Trokelowe
noted that dogs and ravens devoured bovine carrions and miraculously stayed alive. A
later Thomas de Walsingham, himself relying on Trokelowe, has a similar statement. The
Chronicon de Lanercost, on the other hand, reports that ‘humans ate from dead cattle
and, with God ordaining, did not sense anything bad’. In the next sentence, however, the
chronicle continues: ‘Also, at the same time, sea-fishes were found dead on sea-shores in
a great magnitude; and neither the man, nor any animal or bird ate them’. The gloomy
33
sight of dead creatures must have become an omnipresent reality. Just like cannibalism,
eating carrion was forbidden in all Monotheistic religions. Despite the religious
prohibition, however, instances of both cannibalism and carrion eating were not unheard
of during famine times in the Middle Ages. The fact alone that carcasses were sold hints
that there may have been cases of carrion eating among humans.
It is equally unclear if bovine carcasses were used for hides or vellum parchments.
Scribes and clerks still compiled their codices, accounts and deeds using vellum, and
there is no codicological evidence on decline of that type of parchment during the
pestilence or shortly after. It should be noted, however, that those books and documents
proven to have been written in 1319-20 were not necessarily written on skins of calves
butchered in the same year. There is, nevertheless, some data suggesting that parchment
prices went up during and in aftermath of the pestilence. In 1318-9, dozen skins cost
about 1.14s; the following year the same amount of parchment was selling for 1.33s,
while a year after, that is, 1320-1, parchment was valued at 1.44s per dozen. By 1324-5,
when the crisis was over, the prices returned to their pre-1318 level (0.94s per dozen, as
compared with 0.83s in 1316-7).
The mass bovine mortality and the subsequent scarcity of ploughing and carting
power drove up the demand for horses, both plough- (stots) and cart-horses. This
increased demand is well reflected in the price levels of stots. Within the stot sector, the
1319-20 prices were exceedingly high, with one beast selling, on average, for 16s 1d
(compared with 12.79 in 1318-9). The prices were still high in the following year and
they marked one of the highest points in this sector before 1366-7, when the stot prices
rose to 17.50s per beast. Similarly, the prices of cart-horses were higher than usual:
34
between 1319-0 and 1321-2, an average price stood at 24.50s per animal; in 1322-3 the
prices fell to about 18s, only to rise anew a year later, when an average beast cost 25s.
These were, however, only average prices and there were some considerable differences
on a regional level. For instance, at Hemsby (Norfolk) in 1320-1, two horses were
purchased for overwhelming 66s. Similarly, at Gnatingdon in 1319-20, a horse was
bought for as much as 33s 5d. Unlike stots, however, it is unclear to what degree it was
bovine mortality that stood behind the fluctuations in cart-horse prices. Fluctuations in
cart-horse prices were common in the early fourteenth-century and it was completely
unrelated of bovine health and numbers. For instance, between 1310 and 1315 an average
cart-horse was valued at about 27s per head, yet it is known that there was neither bovine
shortage, nor scarcity of carting power in England.
Dairy prices exhibit an expected trend (Figure 7). Within the cheese sector, the
prices were actually low in 1319-20, with one stone (=14 lb) selling for 8.25d, compared
with 11.28d in the year before. In 1320-1, however, the prices rose and by 1321-2 they
reached an unprecedented level of 12.38d per stone. One way to explain the low prices of
1319-20 is the fact that many lactating cows may have been sick and contagious, before
their eventually died. This fact might have increased the risk of buying spoiled products.
As far as the butter sector goes, there was a similar rising trend, with the exception that
here the prices started climbing in 1319-20 and continued to rise until 1322-3, when a
stone of butter cost nearly 22d. per stone. Once the panzootic crisis was, more or less,
over and the bovine stocks were gradually replenishing, the dairy prices returned to their
pre-1319 level. The exceedingly high prices of 1320-3 were unmatched until the 1520s,
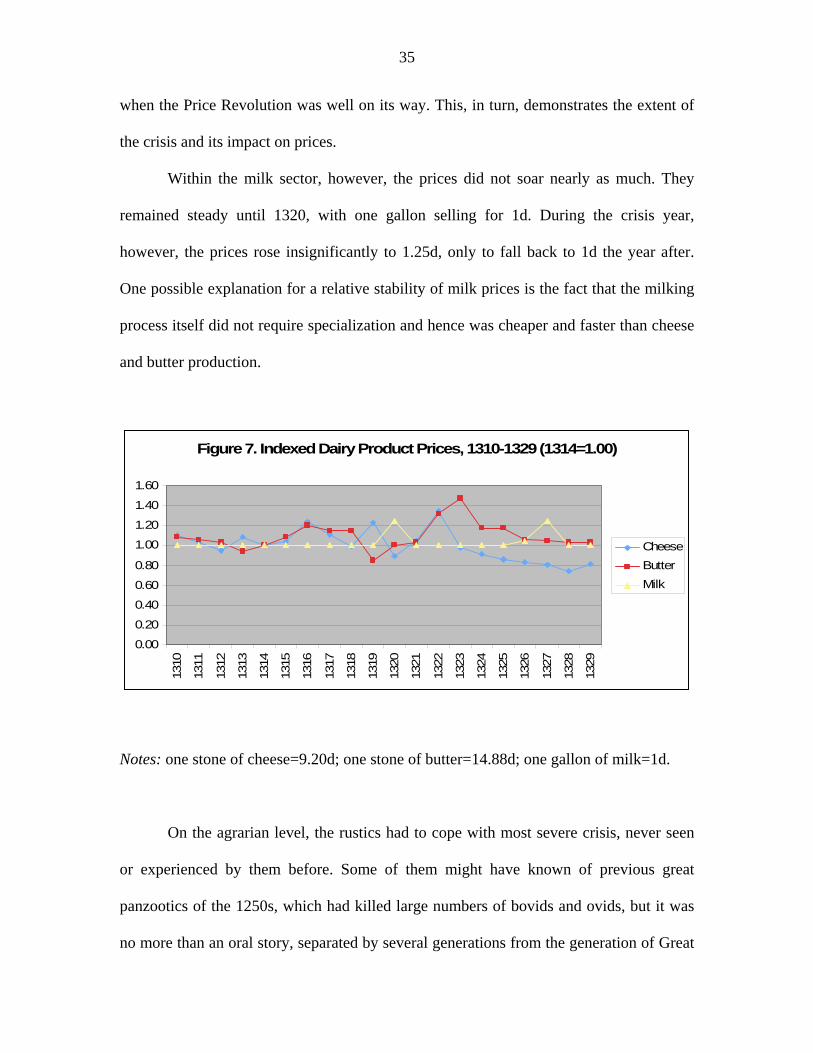
35
when the Price Revolution was well on its way. This, in turn, demonstrates the extent of
the crisis and its impact on prices.
Within the milk sector, however, the prices did not soar nearly as much. They
remained steady until 1320, with one gallon selling for 1d. During the crisis year,
however, the prices rose insignificantly to 1.25d, only to fall back to 1d the year after.
One possible explanation for a relative stability of milk prices is the fact that the milking
process itself did not require specialization and hence was cheaper and faster than cheese
and butter production.
Figure 7. Indexed Dairy Product Prices, 1310-1329 (1314=1.00)
0.00
0.20
0.40
0.60
0.80
1.00
1.20
1.40
1.60
1310
1311
1312
1313
1314
1315
1316
1317
1318
1319
1320
1321
1322
1323
1324
1325
1326
1327
1328
1329
CheeseButterMilk
Notes: one stone of cheese=9.20d; one stone of butter=14.88d; one gallon of milk=1d.
On the agrarian level, the rustics had to cope with most severe crisis, never seen
or experienced by them before. Some of them might have known of previous great
panzootics of the 1250s, which had killed large numbers of bovids and ovids, but it was
no more than an oral story, separated by several generations from the generation of Great
36
Famine. Perhaps the most burning issue to deal with was the fate of the sudden pasturage
surplus, created by massive depletion of bovine stocks. In theory, the optimal thing to do
would be to convert some pasturage into arable, at least until the animals are restocked to
their pre-1319 numbers. This option certainly was on some reeves’ mind, because some
demesnes indeed increased their arable portion, previously used as pasturage. But far not
every manor could afford this, because sowing larger arable fields meant recruiting even
more ploughing force than before the crisis. This was an unlikely task, because the
murrain decimated the chief ploughing force, the ox.
This ambiguous situation created two visible trends: (1) the augmentation of
arable at the expense of pasturage; (2) the shrinkage of arable, as a result of insufficient
ploughing force. The first trend was possible mostly on smaller to mediocre demesnes,
which housed smaller bovine stocks, and where the economic shock, created by the
bovine crisis was less apparent. Also, the availability of stots mattered here. For instance,
West Wycombe (Buckinghamshire) lost all of its 61 bovids in the murrain. Yet, it was
able to augment its arable from 165.88 to 210 acres, chiefly the oat portion, which
increased from 61 acres in 1318-9 to 96 acres in 1320-1. The oat proportion was
augmented, undoubtedly, to sustain the increased number of affers (there were 12 affers
in 1320 and 18 stots in 1321). A similar situation prevailed on Langley (70 per cent
increase), Stevenage (35 per cent increase) in Hertfordshire, Cippenham in
Buckinghamshire (60 per cent increase), Waltham in Berkshire (24 per cent increase),
Adderly in Shropshire (31 per cent increase), Bentley (16 per cent increase), and Wield
(15 per cent increase), in Hampshire. On some demesnes, such as Hindringham, Martham
and Monks’ Granges (Norfolk), as well as Alresford (Hampshire) the augmentation of
37
arable was of more modest proportions, that is around ten percent. In particular, the
legume and oat portions were augmented, the former being an important fertilizing agent,
and the latter being a vital source of feed and nutrient for stots. Thus, Morton
(Buckinghamshire) increased its legume part from 37 per cent in 1318-9 to 67 per cent in
1320-1. Similarly, Fareham (Hampshire) the proportions of legume fields rose from 11
per cent in 1318-9 to 31 per cent in 1320-1. These, however, were more an exception
than a rule and in most cases the legume portion was augmented on a smaller scale. For
instance, Crawley increased its legume share by ten per cent, with peas and vetches
occupying over 14 per cent of its total arable in 1320-1, compared with just 5 per cent in
1318-9. Other demesnes included Downton, Harwell, Witney, Waltham, Cheriton,
Hambledon and Twyford, all belonging to Bishop of Winchester.
Most demesnes, however, could not afford this temporary conversion of pasturage
into arable, because of lack of sufficient ploughing force. This echoes with the
chronicler’s lament that ‘very few animals of that kind remained, so that men had to
plough together with horses’. As a result, the overall arable acreage declined. This
situation is especially visible on the demesnes of Winchester Bishopric. In 1317-8, there
were about 13,500 acres under tillage; in 1318-9 the figure rose to overwhelming 17,770;
in 1320-1, however, the total acreage amounted below 9,100. The pre-1319 acreage was
never seen again. Similar tendency can be identified on some Huntingdonshire-
Cambridgeshire estates of Ramsey Abbey. Although its manorial accounts do not specify
acreage, it does record sowing rates, in terms of quarters and bushels. At Warboys, the
total quarters fell from 75 to 61 quarters; at Broughton the figure declined from 94.50 to
56 quarters. Bolton and Burstwick, both belonging to Bolton Priory (Yorkshire), which
38
suffered from both the panzootics and frequent Scotish raids, cut its arable portion too,
having decreased the total amount of grain from nearly 300 to 215 quarters each.
Langley-Marish (Buckinghamshire), which suffered heavy losses and did not rely much
on stots, diminished its arable portion from 300 to 218 acres. Similar situation prevailed
on numerous other demesnes, including Hadleigh and Thundersleigh (Essex), Teddington
and La Neyte (Misslesex), Llangwm, Trelleck and Usk (Monmouthshire) and Sheen
(Surrey).
Another response to the murrain and vacuum created by bovine mortality was to
expand the numbers of non-bovine animals. The most obvious choice was stots, the
immediate alternative to oxen. As a result, the ratio of stots to acreage increased on some
demesnes. On Winchester Bishopric demesnes there were, on average, about 1.10
plough-horses per 100 acres in the 1310s. In 1320-1, however, there were, on average,
nearly 4 stots per 100 acres. Some of Winchester demesnes exhibit truly impressive
figures, well exceeding the ‘national’ average of ? per 100 acres. For instance, High Clere
did not stock any stots in 1318-9, while in 1320-1 there were as many as 20.45 stots per
100 acres. Beauworth increased its stot population from 3.57 to 17.86 stots per 100 acres.
Similar figures are found on Bishop’s Stoke, East Meon Church, Bitterne, Esher,
Overton, Rimpton, Ebbesbourne, Ashmansworth, Woodhay and Morton, all belonging to
Bishop of Winchester.
It should be kept in mind, however, that Bishop of Winchester was one of the
wealthiest and most powerful lords at that time. Expanding the horse herds, to take up the
slack, was by no means an impossible task for him, financially speaking. But far not
every lord in need could actually afford the same luxury. First, stots themselves were
39
rather costly animals, in terms of both unit prices and maintenance costs. Second, the
bovine crisis coincided with general financial crisis, created by military campaigns of
Edward II against Scotland and France, which, in turn, caused supply shocks and, hence,
high prices and low real wages. The warfare was costly affair, whose financing derived,
inter alia, from heavy taxes affecting virtually all strata of the English society. This crisis
did not spare even some of the wealthiest lords, such as Canterbury Cathedral Priory,
which faced a pronounced financial deficit in the early fourteenth-century. Therefore, this
house could purchase plough-horses in rather modest numbers, compared to large-scale
purchases of Winchester Bishopric (Figure 8). Bolton Priory, which suffered from both
the murrain and ongoing warfare, did not augment its horse stock until 1324 (there were
fourteen horses from 1319 and 1322, seventeen in 1323, thirty in 1324 and thirty-one in
1325). But then again, it is unclear whether the belated horse augmentation at Bolton
Priory was, in fact, a reaction to the bovine crisis.
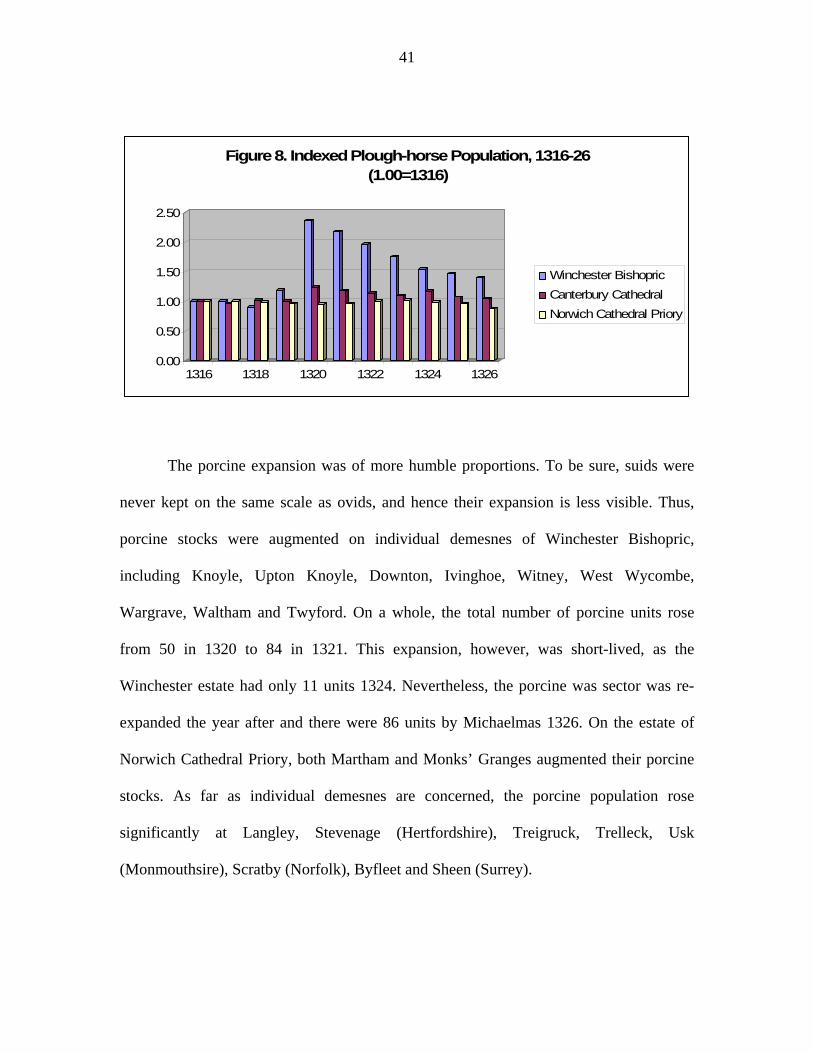
Although the expansion of plough-horses was a commonplace, it should by no
means be seen as ubiquitous. Again, some lords could not afford it, while some others did
not simply have to do it. For instance, most manors of Norwich Cathedral Priory either
suffered comparatively light losses, or were spared by the pestilence. Therefore, it is
hardly surprising that the total number of their stots remained, to a large degree, stable
between 1317 and 1325 (Figure 8). On the other hand, Hinderclay (Suffolk), Byfleet and
Horsley (Surrey) have all lost substantial numbers of bovids; yet, they did not expand the
stot sector at slightest.
Stots were, moreover, only a temporary solution to the crisis. Once the lords and
their reeves realized that the bovine mortality ended, they started cutting back the
40
numbers of plough-horses on the one hand, and increasing the ox stocks on the other. By
the end of the 1320s the stot numbers returned to their pre-1319 levels.
Another approach to the vacuum created by the depletion of the bovine stocks
was to populate more non-working animals, namely sheep and pigs (Figures 9 and 10).
Clearly, it was cows and bulls, and not oxen, that ovids and suids came to replace
temporarily. In other words, some demesnes attempted to cope with the crisis by
increasing their wool-, meat- and lard industry. In terms of milk production, however,
ewe is a rather poor substitute for cow. Late-medieval English farmers would expect an
ewe to produce ten times less than a cow. In any case, the sheep expansion is evident on
the demesne part of Bolton Priory (Yorkshire), which increased its mature ovine stock
from 113 to 207 units between 1319 and 1324. Consequently, the revenue from wool
sales increased from £32 8s 8d to £107 13d in the same years. Bolton Priory was an
important centre of wool production and trade and hence, it was only natural for its
authorities to increase the sheep stocks. Two Norfolk manors, Eaton and Monks Granges,
each losing about half of their bovids, increased their sheep stocks, too. Kentish
demesnes of Canterbury Cathedral Priory increased the share of their ovids by some
thirty per cent. Other demesnes expanding their sheep numbers included Langley
(Hertfordshire), Trelleck (Monmouthshire), Byfleet (Surrey) and Oldington
(Worcestershire). Winchester Bishopric, on the other hand, does not show this tendency,
for two reasons. First, as we have seen, the bovine mortality and scarcity of vaccine milk
are likely to have contributed to higher lamb mortality, which, in turn, decimated the
overall ovine numbers. Second, its manorial authorities chose to expand the stot sector
instead.
41
0.00
0.50
1.00
1.50
2.00
2.50
1316 1318 1320 1322 1324 1326
Figure 8. Indexed Plough-horse Population, 1316-26 (1.00=1316)
Winchester BishopricCanterbury CathedralNorwich Cathedral Priory
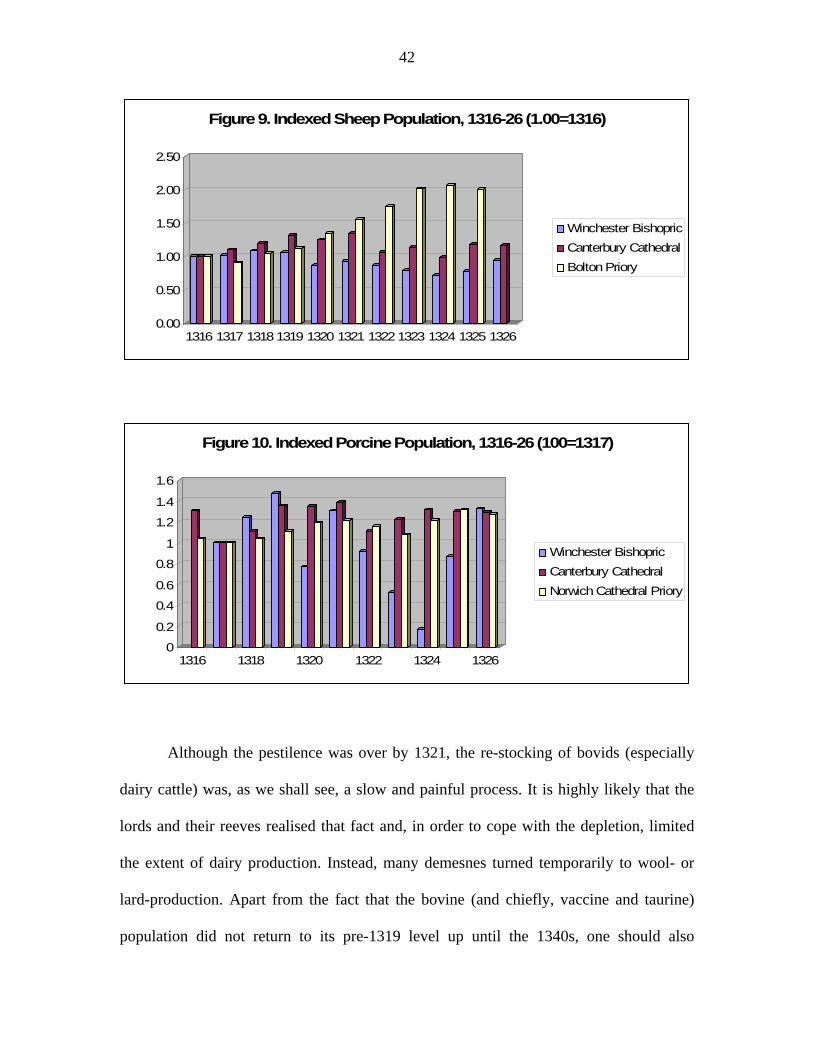
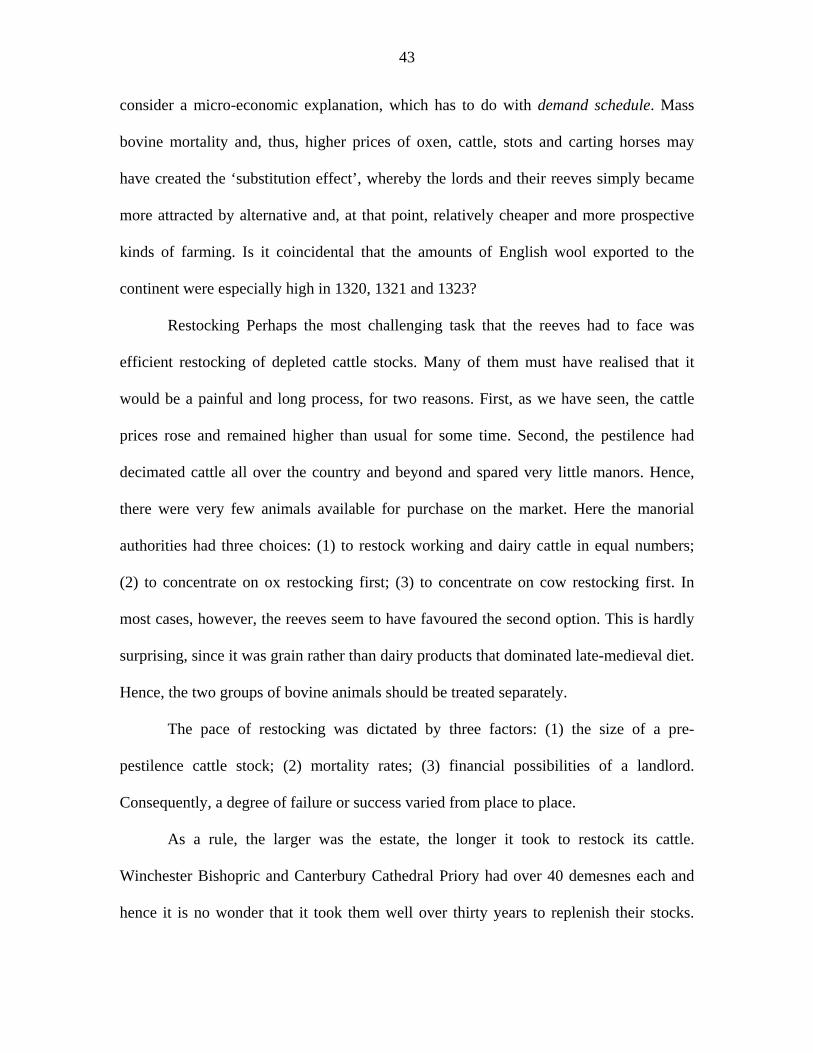
The porcine expansion was of more humble proportions. To be sure, suids were
never kept on the same scale as ovids, and hence their expansion is less visible. Thus,
porcine stocks were augmented on individual demesnes of Winchester Bishopric,
including Knoyle, Upton Knoyle, Downton, Ivinghoe, Witney, West Wycombe,
Wargrave, Waltham and Twyford. On a whole, the total number of porcine units rose
from 50 in 1320 to 84 in 1321. This expansion, however, was short-lived, as the
Winchester estate had only 11 units 1324. Nevertheless, the porcine was sector was re-
expanded the year after and there were 86 units by Michaelmas 1326. On the estate of
Norwich Cathedral Priory, both Martham and Monks’ Granges augmented their porcine
stocks. As far as individual demesnes are concerned, the porcine population rose
significantly at Langley, Stevenage (Hertfordshire), Treigruck, Trelleck, Usk
(Monmouthsire), Scratby (Norfolk), Byfleet and Sheen (Surrey).
42
0.00
0.50
1.00
1.50
2.00
2.50
1316 1317 1318 1319 1320 1321 1322 1323 1324 1325 1326
Figure 9. Indexed Sheep Population, 1316-26 (1.00=1316)
Winchester BishopricCanterbury CathedralBolton Priory
0
0.2
0.4
0.6
0.8
1
1.2
1.4
1.6
1316 1318 1320 1322 1324 1326
Figure 10. Indexed Porcine Population, 1316-26 (100=1317)
Winchester BishopricCanterbury CathedralNorwich Cathedral Priory
Although the pestilence was over by 1321, the re-stocking of bovids (especially
dairy cattle) was, as we shall see, a slow and painful process. It is highly likely that the
lords and their reeves realised that fact and, in order to cope with the depletion, limited
the extent of dairy production. Instead, many demesnes turned temporarily to wool- or
lard-production. Apart from the fact that the bovine (and chiefly, vaccine and taurine)
population did not return to its pre-1319 level up until the 1340s, one should also
43
consider a micro-economic explanation, which has to do with demand schedule. Mass
bovine mortality and, thus, higher prices of oxen, cattle, stots and carting horses may
have created the ‘substitution effect’, whereby the lords and their reeves simply became
more attracted by alternative and, at that point, relatively cheaper and more prospective
kinds of farming. Is it coincidental that the amounts of English wool exported to the
continent were especially high in 1320, 1321 and 1323?
Restocking Perhaps the most challenging task that the reeves had to face was
efficient restocking of depleted cattle stocks. Many of them must have realised that it
would be a painful and long process, for two reasons. First, as we have seen, the cattle
prices rose and remained higher than usual for some time. Second, the pestilence had
decimated cattle all over the country and beyond and spared very little manors. Hence,
there were very few animals available for purchase on the market. Here the manorial
authorities had three choices: (1) to restock working and dairy cattle in equal numbers;
(2) to concentrate on ox restocking first; (3) to concentrate on cow restocking first. In
most cases, however, the reeves seem to have favoured the second option. This is hardly
surprising, since it was grain rather than dairy products that dominated late-medieval diet.
Hence, the two groups of bovine animals should be treated separately.
The pace of restocking was dictated by three factors: (1) the size of a pre-
pestilence cattle stock; (2) mortality rates; (3) financial possibilities of a landlord.
Consequently, a degree of failure or success varied from place to place.
As a rule, the larger was the estate, the longer it took to restock its cattle.
Winchester Bishopric and Canterbury Cathedral Priory had over 40 demesnes each and
hence it is no wonder that it took them well over thirty years to replenish their stocks.
44
Most Winchester oxen were replenished by the late 1330s, while dairy cattle, cows and
bulls, were not restocked until the late 1350s. Consequently, Bury St Edmunds, with a
dozen of demesnes, had most of its stocks replenished by the mid-1330s. In some cases,
the bovine numbers never returned to their pre-pestilence levels. This was a case of
Norwich Cathedral Priory. While it managed to restock its dairy cattle by the late 1340s,
the pre-pestilence oxen figures were never achieved. Instead, oxen were replaced with
horses.
Some scholars have pointed out that when the Black Death came to Northern
Europe in 1348, it found a weak human population, malnourished and weakened by the
Great Famine of 1314-22. This may indeed be true and there is no doubt that a long-term
deprivation of food in pre-adult humans can bear severe implications in the future.
However, the issue of malnutrition should by no means be ascribed to the agrarian crisis
of 1314-22. As our manorial accounts hint, the Great Cattle Pestilence of the 1310s must
have had even more devastating effects on human populations. A sudden mortality and a
very slow replenishment of dairy cattle (cows, bulls and heifers) inevitably meant
deprivation of dairy products, which are vital sources of protein and calcium. Unlike with
the Great Famine, where the humans may have starved for three years, the Great Cattle
Pestilence severely decreased the availability of dairy products for at least one
generation. As we have seen, the estates of Canterbury Cathedral Priory did not replenish
its cow stocks until at least 1358. Is that possible, then, that it was the Cattle Plague that
weakened the humans more than any other exogenous crisis? This likely link between the
Great Famine, the Cattle Plague and the Black Death is yet to be studied, but it should by
no means be disregarded.
45
Finally, what kind of disease was this cattle plague? Three speculations have been
offered, without relying on primary sources: Anthrax, Foot-and-Mouth-Disease (FMD)
and Rinderpest. Anthrax, however, should be ruled out immediately, as it is mostly
human and pig disease, while there is no evidence in our sources about either human or
porcine mortality. So, we are left with two possibilities: Rinderpest and FMD. So which
one fits better? It is important to distinguish between the two waves of plague here. Let’s
begin with the first one, that of 1319-20. According to some literary sources, the cattle
died after a short period of sickness. For example, a Middle English poem on the Evil
Times of Edward II states that “The orf deiede al bidene, and maden the lond al bare
so faste” (the cattle died right away and its death made the land all desolate so fast).
Similarly, the Lanercost Chronicle reports that “boves et vaccae post modicam
infirmitatem quasi subito moriebantur” (oxen and cows suddenly died after a short
disease). The short period of sickness, fast speed of the pathogen dissemination,
appearance of the disease in the context of bad weather and malnutrition, high mortality
rates and the fact that no other ruminants or humans died - all these point to Rinderpest.
This pathogen incubates from three to nine days and gets transmitted through variety of
means, including respiratory and sexual ones. The disease is characterized by
hemorrhaging, fever, erosion of lower intestine, debilitating diarrhea and nasal and ocular
discharge. Animals succumb to Rinderfest between six and twelve days. Both during the
epidemic and post-mortem, succumbed animals tend to contaminate fodder, pasture and
source of water.

46