National Water Resources Council - DOST ScINet-Phil
188
Fll.(B) TD201.P6 P4&1.10B 1983
-
Upload
khangminh22 -
Category
Documents
-
view
1 -
download
0
Transcript of National Water Resources Council - DOST ScINet-Phil

Fll.(B) TD201.P6 P4&1.10B
1983

REPUBLIC OF THE PHILIPPINES
NATIONAL WATER RESOURCES COUNCIL 8th FLOOR, NIA BLDG., E. DELOS SANTOS AVENUE, 0. C.
JESUS S. HIPOLITO, Chairman Minister
Ministry of Public Works and Highways
MADAME IMELDA ROMUALDEZ-MARCOS Minister
Human Settlements
ARTURO R. TANCO, JR.
TEODORO 0. PENA Minister
Ministry of Natural Resources
VICENTE VALDEPENAS Minister Minister
Ministry of Agriculture National Economic and Development Authority
GERONIMO Z. VELASCO Minister
Ministry of Energy
GABRI EL P. ITCHON President
National Power Corporation
ABER P. CANLAS Gen era! Manager
Metropolitan Waterworks and Sewerage System
CESAR L. TECH Administrator
National lrriga ti on Administration
ANGEL A. ALEJANDRINO Executive Director
FILE NO. 07/-fJ -\j~'f _3 SCANNED BY------Q.A BY _______ _ ANALSBY _______ _
EXTRACTED BY------UPLOADED BY _____ _
The National Water Resources Council (NWRC) is the body responsible for coordinating and integrating all activities related to water resources development and management. Its principal objective is to achieve a scientific and orderly development and management of all the water resources of the country consistent with the principles of optimum utilization, conservation and protecttion to meet present and future needs.
.... .. ii! -·

-
~ Cl£ARmGtfOUS£ ANO OOCUMD'ffATIOft S[fMtU rJrvmmr ltltr.•C• •ltQMOTIQtl '"'•fH"fll' . -
NORTHERN MINDANAO PHl/77 /S03 - UNITED NATIONS DEVELOPMENT PROGRAMME ASSISTANCE TO THE NATIONAL WATER RESOURCES COUNCIL
fd<.~) TJ)Wi .PG p~/;n .. JD6
J'J 8.;:)
.
1111//lll lllll llll Ill llllli llll/ 11// lllll/ lllll lllll 1/lll llll /11/
"- _ . STI-10-8665 .
REPUBLIC OF THE PHILIPPINES
L
NATIONAL WATER RESOURCES COUNCIL REPORT NO. 24 • 10 B DECEMBER 1983

... in cooperation with the REWARDS/MPW and NEDA

FOREWORD
The development and utilization of the country's water resources has evolved over a long period in a setting of abundant natural resources and practically without the benefit of a broad planning framework considering available resource supply and existing regional needs. With fixed water resources to serve the changing growth patterns and increasing use of water among a rapidly expanding population, the past trend of development should now be reoriented to a broader perspective, if we are to avoid longrun water problems in the future.
Against this backdrop the National Water Resources Council (NWRC) was created under Presidential Decree 424, to carry out the policy of the government in encouraging the conservation, development, and optimum utilization of water and related land resources on comprehensive and coordinated basis in order to meet the present and future water needs of the country.
In pursuing its task the Council undertakes comprehensive river basin and regional framework studies, which serve as guide to detailed planning of water resources development by concerned line agencies, and help determine a reasonable starting point together with the factors and linkages which will have to be considered to make a reasonably correct and meaningful decision. The framework plan on Misamis Oriental Basins forms a part of the Council's efforts to establish the water and land resources relationship on a basin wide approach for the framework study of Water Resource Region 10.
v
-Jk-o ANGEL A. ALEJANDRINO
Executive Director

TABLE OF CONTENTS
PAGE
FOREWORD v
LIST OFT ABLES . . . . . . . . . . . . . . . . . . . . . . . . . . . . . . . . . . . . . . . . . . . . . . . . . . . . xiii
LIST OF FIGURES . . . . . . . . . . . . . . . . . . . . . . . . . . . . . . . . . . . . . . . . . . . . . . . . . . . xv
CHAPTER I - SUMMARY AND RECOMMENDATIONS..................... 1
A. General Characteristics . . . . . . . . . . . . . . . . . . . . . . . . . . . . . . . . . . . . . . . . 1
B. Framework for Development . . . . . . . . . . . . . . . . . . . . . . . . . . . . . . . . . . . 4
B.1 Water Resources . . . . . . . . . . . . . . . . . . . . . . . . . . . . . . . . . . . . . . . . . 4 B.2 Land Resources . . . . . . . . . . . . . . . . . . . . . . . . . . . . . . . . . . . . . . . . . . 4 B.3 Socio-Economic . . . . . . . . . . . . . . . . . . . . . . . . . . . . . . . . . . . . . . . . . 5 B.4 Environmental Considerations . . . . . . . . . . . . . . . . . . . . . . . . . . . . . . . 5
C. Sectoral Recommendations . . . . . . . . . . . . . . . . . . . . . . . . . . . . . . . . . . . . . 6
C.1 Water Supply and Sewerage . . . . . . . . . . . . . . . . . . . . . . . . . . . . . . . . . 6 C.2 Irrigation . . . . . . . . . . . . . . . . . . . . . . . . . . . . . . . . . . . . . . . . . . . . . . . 6 C.3 Flood Control . . . . . . . . . . . . . . . . . . . . . . . . . . . . . . . . . . . . . . . . . . . 6 C.4 Land Use Management .............................. : . . . . . 6 C.5 Power . . . . . . . . . . . . . . . . . . . . . . . . . . . . . . . . . . . . . . . . . . . . . . . . . 7 C.6 Fisheries . . . . . . . . . . . . . . . . . . . . . . . . . . . . . . . . . . . . . . . . . . . . . . . 7 C.7 Transportation . . . . . . . . . . . . . . . . . . . . . . . . . . . . . . . . . . . . . . . . . . 7
CHAPTER II - INTRODUCTION . . . . . . . . . . . . . . . . . . . . . . . . . . . . . . . . . . . . . . . 9
A. Background . . . . . . . . . . . . . . . . . . . . . . . . . . . . . . . . . . . . . . . . . . . . . . . . . 9
B. Objective of the Study . . . . . . . . . . . . . . . . . . . . . . . . . . . . . . . . . . . . . . . . 9
C. Scope of the Study . . . . . . . . . . . . . . . . . . . . . . . . . . . . . . . . . . . . . . . . . . . 9
CHAPTER Ill -OBJECTIVES OF DEVELOPMENT . . . . . . . . . . . . . . . . . . . . . . . . . 11
A. Regional Development Objectives and Strategies . . . . . . . . . . . . . . . . . . . . . 11
B. Development Objectives of the Basin . . . . . . . . . . . . . . . . . . . . . . . . . . . . . 12
CHAPTER IV -- AREA PROFILE . . . . . . . . . . . . . . . . . . . . . . . . . . . . . . . . . . . . . . . 13
A. Location and Description . . . . . . . . . . . . . . . . . . . . . . . . . . . . . . . . . . . . . . 13
B. Archaeological, Historical and Cultural Characteristics . . . . . . . . . . . . . . . . 13
C. Settlements System . . . . . . . . . . . . . . . . . . . . . . . . . . . . . . . . . . . . . . . . . . . 13
D. Climate . . . . . . . . . . . . . . . . . . . . . . . . . . . . . . . . . . . . . . . . . . . . . . . . . . . . 16
D.1 Climate Type . . . . . . . . . . . . . . . . . . . . . . . . . . . . . . . . . . . . . . . . . . . . 16 D.2 Temperature and Humidity ........................ '........ 16
CHAPTER V - WATER AND RELATED LAND RESOURCES . . . . . . . . . . . . . . . 19
A. Water Resources . . . . . . . . . . . . . . . . . . . . . . . . . . . . . . . . . . . . . . . . . . . . . 19
A.1 Rainfall ................................................. 19
vii

A.2 Surface Runoff .......... · · · · · · · · · · · · · · · · · · · · · · · · · · · · · · · ·
A.2.1 Data Availability .......... · · · · · · · · · · · · · · · · · · · · · · · · · A.2.2 Surface Water Availability ..... · · · · · · · · · · · · · · · · · · · · · · · A.2.3 Dependability Analysis · · · · · · · · · · ·A· · ·
1 • ·: • • • • • • • • • • • • •
Flood and Minimum Flow Frequency na ys1s ...... · · · · · · A.2.4
A.2.4.1 Flood Frequency Analysis ........... · . · · · · · · · A.2.4.2 Minimum Flow Frequency Analysis ............ .
A.2.5 Flood Control ................ · · · · · · · · · · · · · · · · · · · · ·
A.3 Groundwater ...................... · · · · · · · · · · · · · · · · · · · · · ·
A.3.1 Data Availability ................... · · · · · · · · · · · · · · · · A.3.2 Groundwater Assessment .................. · · · · · · · · · ·
A.4 Water Quality and Sedimentation ...................... · · · . · ·
A.4.1 Sedimentation ............................ · .... · · · · A.4.2 Water Quality ............................ · .... · · · ·
A.4.2.1 Groundwater ............................. . A.4.2.2 Surface Water ............................. .
A.5 Evapotranspiration ...................................... .
B. Land Resources ............................................. . B.1 Topography and Drainage ................................. . B.2 Slope Complex ......................................... . B.3 Geology ............................................... . B.4 Soils and Capabilities ..................................... .
B.4.1 Soils ........................................... . B.4.2 Land Capability ................................... .
20
20 21 21 21
21 21
23
23
23 24
24
24 24
24 24
28
28 28 28 45 46
46 46
B.5 Soil Erosion Susceptibility . . . . . . . . . . . . . . . . . . . . . . . . . . . . . . . . . 49 B.6 Land Use . . . . . . . . . . . . . . . . . . . . . . . . . . . . . . . . . . . . . . . . . . . . . . . 49
B.6.1 Existing Land Use . . . . . . . . . . . . . . . . . . . . . . . . . . . . . . . . . . 49 B.6.2 Special Land Use . . . . . . . . . . . . . . . . . . . . . . . . . . . . . . . . . . . 50
B.6.2.1 Natural Historical Attractions/ National Parks . . . . . . . . . . . . . . . . . . . . . . . . . . . . . 50
B.6.2.2 Forest Reserves . . . . . . . . . . . . . . . . . . . . . . . . . . . . 50
B.6.3 Proposed Land Use . . . . . . . . . . . . . . . . . . . . . . . . . . . . . . . . . 51
CHAPTER VI -PRESENT AND FUTURE DEVELOPMENT AND RESOURCE NEEDS 59
A. Social Environment . . . . . . . . . . . . . . . . . . . . . . . . . . . . . . . . . . . . . . . . . . . 59
A.1 Demographic Characteristics . . . . . . . . . . . . . . . . . . . . . . . . . . . . . . . . 59
A.1.1 Population . . . . . . . . . . . . . . . . . . . . . . . . . . . . . . . . . . . . . . . . 59 A.1.2 Population Density . . . . . . . . . . . . . . . . . . . . . . . . . . . . . . . . . 59 A.1.3 Urban-Rural Population Structure . . . . . . . . . . . . . . . . . . . . . . 59 A.1.4 Age-Sex Structure and Dependency Ratio . . . . . . . . . . . . . . . . 59 A.1.5 Household/Family Size . . . . . . . . . . . . . . . . . . . . . . . . . . . . . . 60 A.1.6 Demographic Projections . . . . . . . . . . . . . . . . . . . . . . . . . . . . . 60
viii

A.2 Income . . . . . . . . . . . . . . . . . . . . . . . . . . . . . . . . . . . . . . . . . . . . . . . . 60
A.2.1 Income Levels . . . . . . . . . . . . . . . . . . . . . . . . . . . . . . . . . . . . . 60 A.2.2 Per Capita Income . . . . . . . . . . . . . . . . . . . . . . . . . . . . . . . . . . 61 A.2.3 Income Profiles . . . . . . . . . . . . . . . . . . . . . . . . . . . . . . . . . . . . 61 A.2.4 Farm Income . . . . . . . . . . . . . . . . . . . . . . . . . . . . . . . . . . . . . 61
A.3 Labor Force and Employment Structure . . . . . . . . . . . . . . . . . . . . . . . 62
A.3.1 Labor Force . . . . . . . . . . . . . . . . . . . . . . . . . . . . . . . . . . . . . . 62 A.3.2 Employment . . . . . . . . . . . . . . . . . . . . . . . . . . . . . . . . . . . . . . 62 A.3.3 Employment Projections . . . . . . . . . . . . . . . . . . . . . . . . . . . . . 62
A.4 Domestic and Municipal Water Use . . . . . . . . . . . . . . . . . . . . . . . . . . . 62
A.5 Water Supply Facilities . . . . . . . . . . . . . . . . . . . . . . . . . . . . . . . . . . . . 64 .
A.5.1 Water Supply Facilities and Sources . . . . . . . . . . . . . . . . . . . . 64 A.5.2 Water Supply Infrastructure . . . . . . . . . . . . . . . . . . . . . • . . . . 64
A.6 Sewerage and Waste Disposal Facilities . . . . . . . . . . . . . . . . . . . . . . . . 65
8. Economic Sector . . . . . . . . . . . . . . . . . . . . . . . . . . . . . . . . . . . . . . . . . . . . . 65
8.1 General Economic Structure . . . . . . . . . . . . . . . . . . . . . . . . . . . . . . . . 67
8.1.1 8.1.2
Gross Domestic Product and Employment .............. . Sectoral Highlights ................................ .
8.1.2.1 Agriculture, Fishery and Forestry ............. . 8.1.2.2 Industry ................................ . 8.1.2.3 Services ................................. .
67 69
69 69 70
8.2 Agriculture . . . . . . . . . . . . . . . . . . . . . . . . . . . . . . . . . . . . . . . . . . . . . 71
8.2.1 General ................. , ..................... ·. . . 71 8.2.2 Agricultural Area Distribution . . . . . . . . . . . . . . . . . . . . . . . . . 71 8.2.3 Farm Features . . . . . . . . . . . . . . . . . . . . . . . . . . . . . . . . . . . . . 71 8.2.4 Land Ownership and Distribution . . . . . . . . . . . . . . . . . . . . . . 71 8.2.5 Cropland Distribution . . . . . . . . . . . . . . . . . . . . . . . . . . . . . . . 74 8.2.6 Production . . . . . . . . . . . . . . . . . . . . . . . . . . . . . . . . . . . . . . . 75
8.2.6.1 Temporary Crops . . . . . . . . . . . . . . . . . . . . . . . . . . 75
Palay . . . . . . . . . . . . . . . . . . . . . . . . . . . . . . . . . . . . 75 Corn . . . . . . . . . . . . . . . . . . . . . . . . . . . . . . . . . . . . . 77 Sugarcane . . . . . . .. . . . . . . . . . . . . . . . . . . . . . . . . . . 79 Tobacco . . . . . . . . . . . . . . . . . . . . . . . . . . . . . . . . 80 Vegetables . . . . . . . . . . . . . . . . . . . . . . . . . . . . . . . . 80 Rootcrops . . . . . . . . . . . . . . . . . . . . . . . . . . . . . . . . 80
8.2.6.2 Permanent Crops . . . . . . . . . . . . . . . . . . . . . . . . . . . 81
Coconut . . . . . . . . . . . . . . . . . . . . . . . . . . . . . . . . . 81 Coffee . . . . . . . . . . . . . . . . . . . . . . . . . . . . . . . . . . . 81 Fruits . . . . . . . . . . . . . . . . . . . . . . . . . . . . . . . . . . . 81
8.2.7 Irrigation . . . . . . . . . . . . . . . . . . . . . . . . . . . . . . . . . . . . . . . . . 81 B.2.8 Livestock and Poultry . . . . . . . . . . . . . . . . . . . . . . . . . . . . . . . 83
ix
B.2.8.1 B.2.8.2
Population ............................... · Demand ................................. .
B.2.9 Agricultural Water Requirement .................... · . ·
B.3 Fishery ............................................ · · · ·
B.4 Industry ................................ · . · · · · · · · · · · · · · B.4.1 Mining .....•..................................... B.4.2 Manufacturing .................................... . B.4.3 Construction and Electricity ......................... . B.4.4 Industrial Water Requirements ....................... .
B.5 Transportation ......................................... .
B.5.1 Highways and Road Transport ....................... . B.5.2 Water Transport .................................. . B.5.3 Air Transport .................................... .
B.6 Power
B.6.1 B.6.2
Power Generation and Consumption ................... . Power Generation Facilities .......................... .
83 84
85
85
86 86 88 90 90
91
91 91 91
92
92 93
CHAPTER VII - WATER RESOURCE DEVELOPMENT FRAMEWORK . . . . . . . . . 97
A. Sectoral Indicators of Development . . . . . . . . . . . . . . . . . . . . . . . . . . . . . . 97
A.1 Water Resources . . . . . . . . . . . . . . . . . . . . . . . . . . . . . . . . . . . . . . . . . 97
A.1.1 Water Requirements . . . . . . . . . . . . . . . . . . . . . . . . . . . . . . . . 97 A.1.2 Water Availability . . . . . . . . . . . . . . . . . . . . . . . . . . . . . . . . . . 97
A.2 Land Resources . . . . . . . . . . . . . . . . . . . . . . . . . . . . . . . . . . . . . . . . . . 97
A.3 Agricultural Self-Sufficiency . . . . . . . . . . . . . . . . . . . . . . . . . . . . . . . . 99
A.4 Social Indicators......................... . . . . . . . . . . . . . . . . . 100
A.4.1 Income . . . . . . . . . . . . . . . . . . . . . . . . . . . . . . . . . . . . . . . . . . 100 A.4 .2 Heal th . . . . . . . . . . . . . . . . . . . . . . . . . . . . . . . . . . . . . . . . . . . 100 A.4.3 Education . . . . . . . . . . . . . . . . . . . . . . . . . . . . . . . . . • . . . . . . 105
B. Project Profiles . . . . . . . . . . . . . . . . . . . . . . . . . . . . . . . . . . . . . . . . . . . . . . 105
B.1 Potential Multi-Purpose Projects . . . . . . . . . . . . . . . . . . . . . . . . . . . . . 105
B.2 Irrigation Projects . . . . . . . . . . . . . . . . . . . . . . . . . . . . . . . . . . . . . . . . 106
B.3 Water Supply Projects . . . . . . . . . . . . . . . . . . . . . . . . . . . . . . . . . . . . . 106
B.3.1 Agency Proposals and Activities . . . . . . . . . . . . . . . . . . . . . . . 106
B.3 .2 Study Proposals . . . . . . . . . . . . . . . . . . . . . . . . . . . . . . . . . . . . 106
B.4 Data Collection System . . . . . . . . . . . . . . . . . . . . . . . . . . . . . . . . . . . . 108
B.4.1 Water Resource Data . . . . . . . . . . . . . . . . . . . . . . . . . . . . . . . . 108
B.4.1.1 B.4.1.2 B.4.1.3
Rainfall Data . . . . . . . . . . . . . . . . . . . . . . . . . . . . . . 108 Stream flow Data. . . . . . . . . . . . . . . . . . . . . . . . . . . . 108 Evaporation and Other Climatic Data . . . . . . . . . . . 108
x

B.4.1.4 Groundwater Data ........................ · · 109
B.4.2 Land Resources Data ................................ 109
C. Development Impact Evaluation . . . . . . . . . . . . . . . . . . . . . . . . . . . . . . . . . 110
C.1 Socio-Economic Impact Evaluation . . . . . . . . . . . . . . . . . . . . . . . . . . . 110
C.1.1 General . . . . . . . . . . . . . . . . . . . . . . . . . . . . . . . . . . . . . . . . . . 110 C.1.2 Effects in Basin Incomes . . . . . . . . . . . . . . . . . . . . . . . . . . . . . 110 C.1.3 Possible Effects on Income Inequality . . . . . . . . . . . . . . . . . . . 11 O C.1.4 Spin-Off Impact on Land Reform Development . . . . . . . . . . . 111 C.1.5 Effects on Employment Generation in the
Agricultural Sector . . . . . . . . . . . . . . . . . . . . . . . . . . . . . . . . . 112
C.2 Environmental Impact Evaluation . . . . . . . . . . . . . . . . . . . . . . . . . . . . 114
C.2.1 Natural Vegetation and Wildlife . . . . . . . . . . . . . . . . . . . . . . . 114 C.2.2 Water Quality and Fisheries . . . . . . . . . . . . . . . . . . . . . . . . . . . 115 C.2.3 Soils . . . . . . . . . . . . . . . . . . . . . . . . . . . . . . . . . . . . . . . . . . . . 116 C.2.4 Mineral Resources . . . . . . . . . . . . . . . . . . . . . . . . . . . . . . . . . . 117 C.2.5 Historical and Archaeological Aspects . . . . . . . . . . . . . . . . . . . 117 C.2.6 Vectors and Public Health . . . . . . . . . . . . . . . . . . . . . . . . . . . . 118 C.2.7 Socio-CulturalAspects .............................. 119
D. Institutions . . . . . . . . . . . . . . . . . . . . . . . . . . . . . . . . . . . . . . . . . . . . . . . . . 119
D.1 National Organizations . . . . . . . . . . . . . . . . . . . . . . . . . . . . . . . . . . . . 119 D.2 Regional Organizations . . . . . . . . . . . . . . . . . . . . . . . . . . . . . . . . . . . . 124 D.3 Local'Governments . . . . . . . . . . . . . . . . . . . . . . . . . . . . . . . . . . . . 125
APPENDICES . . . . . . . . . . . . . . . . . . . . . . . . . . . . . . . . . . . . . . . . . . . . . . . . . . . . . . . 127
Appendix A - Water Resources .......................... ; . . . . . . . . . 129
Appendix B - Land Use ........................................... 151
Appendix C - Economics . . . . . . . . . . . . . . . . . . . . . . . . . . . . . . . . . . . . . . . . . 157
Appendix D - Social . . . . . . . . . . . . . . . . . . . . . . . . . . . . . . . . . . . . . . . . . . . . . 167
Appendix E - Power . . . . . . . . . . . . . . . . . . . . . . . . . . . . . . . . . . . . . . . . . . . . . 173
REFERENCES . . . . . . . . . . . . . . . . . . . . . . . . . . . . . . . . . . . . . . . . . . . . . . . . . . . . . . 179
xi
DIGITIZATION UNIT
Sticky Note
xii - Blank page

TABLE NO.
UST OF TABLES
TITLE
1-1
Y·A-1 V-A-2 V-A-3 V-A-4
V-A-5 V-A-6 V-A-7 V-B-1 V-B-2 V-B-3 V-B-4 V-B-5 V-B-6 V-B-7 Vl-A-1 Vl-A-2
Vl-A-3 Vl-A-4 Vl-A-5 Vl-A-6 Vl-A-7 Vl-A-8 Vl-A-9 Vl-B-1
Vl-B-2 Vl-B-3
Vl-B-4 Vl-B-5 Vl-B-6 Vl-B-7 Vl-B-8 Vl-B-9 Vl-B-10 Vl-B-11 Vl-B-12 Vl-B-13 Vl-B-14
Vl-B-15
Summary of Current and Future <.asin Characteristics ................ .
Historical Rainfall Records .................................... . Historical Streamflow Records ................................. . Frequency Analysis of Peak Discharge of Rivers .................... . Minimum Flow Frequency Analysis of Rivers in Misamis Oriental Basins ....................................... . Groundwater Statistical Data .................................. . Physical and Chemical Constituents of Water Samples ............... . Evapotranspiration Estimates by Blaney Method ................... . Slope Complex Categories, Characteristics and Area Coverage ......... . Geologic Formation, Characteristics and Area Coverage .............. . Major Groups of Soils, Characteristics and Area Coverage ............. . Land Capability Classes, Characteristics and Area Coverage ........... . Erosion Class, Description and Area Coverage ...................... . Existing Land Use Pattern and Area Coverage ...................... . Identified Forest Reserve ..................................... . Actual and Projected Population, Density and Structure .............. . Estimated Total Income and Per Capita Income Classified into Urban and Rural, 1975 ................................... . Income Profile of the Basin (1971) ............................. . Farm Income Statistics ....................................... . Labor Force Projection, 1975-2000 .............................. . Employment Distribution by Industry Group, 1975 and 2000 ......... . Projected Water Withdrawals for Domestic Use ..................... . Number of Households by Source of Water ........................ . Inventory of Water Supply Facilities ............................. . Gross Domestic Product and Gross Value-Added by Industry Group, 1975 and 2000 .................... · · · · · · · · · · · · · · · · · · · · · Summary Statistics for Selected Industries ........................ . Various Measures on Land-Ownership and Distribution by Farm Size, All Crops, 1971 ................................. . Cropland Distribution, 1971 ................................... . Palay Productivity, 1975-2000 ................................. . Rice Production-Sufficiency Analysis (2000) ...................... . Feed Grain Requirements, 1975-2000 ............................ . Summary of Corn Demand and Supply ........................... . Existing Irrigation Systems .................................. · . Proposed Irrigation Projects ................................... . Livestock and Poultry Production Inventory ....................... . Agricultural Water Requirements, 1975 and 2000 ................... . Mineral Resources, 1978 ...................................... . Summary Statistics for Large-Scale Manufacturing Establishments, 1967 and 1972 ................................. . Summary Statistics for Small-'jcale Manufacturing Establishments, 1967 and 1972 ................................. .
xiii
PAGE
2 19 20 22
23 25 26 29 44 45 47 48 49 50 51 59
60 61 61 62 63 63 64 66
69 70
74 75 76 77 79 79 83 83 84 85 87
89
89

Vl-B-16
Vl-B-17 Vll-A-1 Vll-A-2 Vll-A-3 Vll-A-4 VI l-A-5
Vll-A-6
Vll-A-7
Vll-A-8
Vll-A-9
Vll-A-10 Vll-B-1 VI l-C-1 .;11-e-2
Gross-Value Added in Manufacturing by Industry Group, 1975 and 2000 .................................. · · . · · · • Industrial Water Requirement ......................... · . · . · . · · · . Water Demand in MCM/Year, 1980 and 2000 ..................•.... Estimated Water Resources .................................... . Level of Land Resource Utilization .............................. . Food Self-Sufficiency, 1975 and 2000 ...........................• Morbidity and Mortality of Water-Borne Diseases, 1975 and 1977, M isam is Oriental ............................... . Morbidity and Mortality of Water-Borne Diseases, 1975 and 1977, Camiguin ..................................... . Morbidity and Mortality of Water-Borne Diseases, 1975 and 1977, Agusan del Norte ............................... . Morbidity and Mortality of Water-Borne Diseases, 1975-1977, Bukidnon ........................................ . Population (1975) and Estimated Number of Schistosomiasis Cases by Municipality Including Estimated Snail Areas as of December, 1980 ........................................ . Educational Attainment ...................................... . Water Impounding Reservoir Projects ....•........................ Per Cent of Families by Income Class and Censal Years .............. . Selected Income Measures, 1961, 1965, 1971, and 1975 ............. .
xiv
90 91 97 97 99
100
101
102
103
104
105 105 107 111 111

LIST OF FIGURES
FIGURE NO. TITLE PAGE
IV-A-1 IV-A-2 IV-D-1 V-A-1 V-A-2 V-A-3 V-A-4 V-A-5 V-A-6 V-A-7 V-A-8 V-A-9 V-A-10
V-A-11 V-A-12 V-A-13 V-A-14 V-A-15
V-A-16
V-A-17 V-A-18 V-B-1 V-B-2 V-B-3 V-B-4 V-B-5 V-B-6 V-B-7 Vl-B-1 Vl-B-2
Vl-B-3 Vl-B-4 Vl-B-5 Vl-B-6
Vl-B-7
Vll-A-1 Vll-B-1 Vll-C-1
Location Map . . . . . . . . . . . . . . . . . . . . . . . . . . . . . . . . . . . . . . . . . . . . . . . 14 Provincial and Municipal Coverage . . . . . . . . . . . . . . . . . . . . . . . . . . . . . . . 15 Climate Map . . . . . . . . . . . . . . . . . . . . . . . . . . . . . . . . . . . . . . . . . . . . . . . . 17 Hydrologic Map . . . . . . . . . . . . . . . . . . . . . . . . . . . . . . . . . . . . . . . . . . . . . . 30 Rainfall in the Basin, lmpasugong, 8ukidnon . . . . . . . . . . . . . . . . . . . . . . . 31 Rainfall in the Basin, lmpalutao, lmpasugong, Bukidnon . . . . . . . . . . . . . . 32 Rainfall in the Basin, Damilag, Manolo Fortich, Bukidnon . . . . . . . . . . . . . 32 Rainfall in the Basin, Philips, Manolo Fortich, Bukidnon . . . . . . . . . . . . . . 33 Rainfall in the Basin, Cagayan de Oro, Misamis Oriental . . . . . . . . . . . . . . . 33 Mean Annual Rainfall Map . . . . . . . . . . . . . . . . . . . . . . . . . . . . . . . . . . . . . 34 Rainfall Intensity Chart for Cagayan de Oro City . . . . . . . . . . . . . . . . . . . . 35 Mean Annual Runoff Map . . . . . . . . . . . . . . . . . . . . . . . . . . . . . . . . . . . . . . 36 Flow Duration Curves, Cagayan River, lponan Riv.er, Alubijid River . . . . . . . . . . . . . . . . . . . . . . . . . . . . . . . . . . . . . . . . . . . . . . . 37 Dependable Streamflow Map . . . . . . . . . . . . . . . . . . . . . . . . . . . . . . . . . . . . 38 Flood Frequency Curve, Cagayan River . . . . . . . . . . . . . . . . . . . . . . . . . . . 39 Flood Frequency Curve, lponan River . . . . . . . . . . . . . . . . . . . . . . . . . . . . 40 Flood Frequency Curve, Alubijid River . . . . . . . . . . . . . . . . . . . . . . . . . . . . 40 Minimum Flow Frequency Curve, lponan River at Pagatpat, Cagayan de Oro . . . . . . . . . . . . . . . . . . . . . . . . . . . . . . . . . . . . . . 41 Minimum Flow Frequency Curve, Alubijid River at Munoy, Misamis Oriental . . . . . . . . . . . . . . . . . . . . . . . . . . . . . . . . . . . . . . . 41 Cyclograni Map . . . . . . . . . . . . . . . . . . . . . . . . . . . . . . . . . . . . . . . . . . . . . . 42 Groundwater Mining Picture . . . . . . . . . . . . . . . . . . . . . . . . . . . . . . . . . . . . 43 General Slopes ........... : . . . . . . . . . . . . . . . . . . . . . . . . . . . . . . . . . . . 52 Geologic Formations . . . . . . . . . . . . . . . . . . . . . . . . . . . . . . . . . . . . . . . . . . 53 Major Groups of Soils . . . . . . . . . . . . . . . . . . . . . . . . . . . . . . . . . . . . . . . . . 54 Land Capability . . . . . . . . . . . . . . . . . . . . . . . . . . . . . . . . . . . . . . . . . . . . . . 55 Soil Erosion Susceptibility . . . . . . . . . . . . . . . . . . . . . . . . . . . . . . . . . . . . . 56 Existing Land Use . . . . . . . . . . . . . . . . . . . . . . . . . . . . . . . . . . . . . . . . . . . . 57 Forest Reserves, Game Refuge and Bird Sanctuaries . . . . . . . . . . . . . . . . . . 58 GVA-Employment Distribution by Major Sector . . . . . . . . . . . . . . . . . . . . 68 Lorenz Curve for Land Ownership Distribution in the Misamis Oriental Basins, All Crops 1971 . . . . . . . . . . . . . . . . . . . . . . . . . . 72 Agricultural Area Distribution . . . . . . . . . . . . . . . . . . . . . . . . . . . . . . . . . . . 73 Irrigated Palay Area Demand VS. Supply . . . . . . . . . . . . . . . . . . . . . . . . . . 78 Proposed National Irrigation System . . . . . . . . . . . . . . . . . . . . . . . . . . . . . . 82 Increase in Total System Kilowatt Demand Relative to Increase in Number of Consumers and Average Consumption . . . . . . . . . . . 95 Increase in House Connection Level and Number of Consumers from 1980 to 2000 ................ · . · .. · · · · · · · · · · · · · 96 Water Picture ......................... · · · · · · · · · · · · · · · · · · · · · · · 98 Water Impounding Reservoir Projects .... , . . . . . . . . . . . . . . . . . . . . . . . . 113 Major Areas of Significant Ecological Interest ............. '.......... 120
xv
DIGITIZATION UNIT
Sticky Note
xvi - Blank page
CHAPTER I
SUMMARY AND RECOMMENDATION
A. General Characteristics
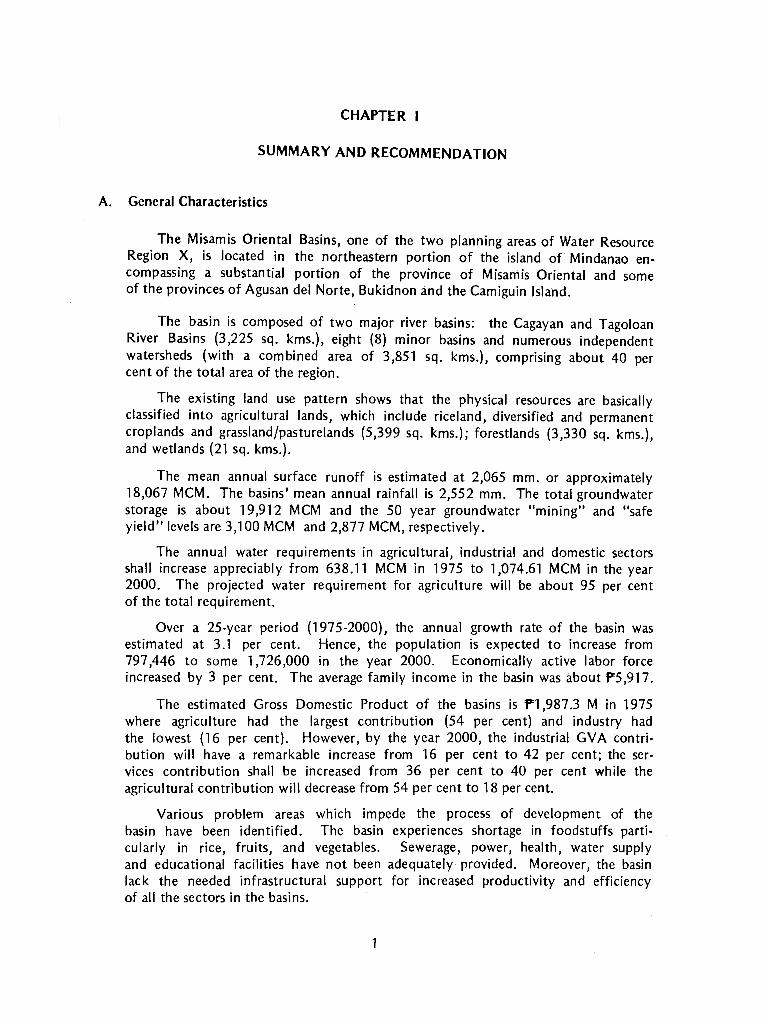
The Misamis Oriental Basins, one of the two planning areas of Water Resource Region X, is located in the northeastern portion of the island of Mindanao encompassing a substantial portion of the province of Misamis Oriental and some of the provinces of Agusan del Norte, Bukidnon and the Camiguin Island.
The basin is composed of two major river basins: the Cagayan and Tagoloan River Basins (3,225 sq. kms.), eight (8) minor basins and numerous independent watersheds (with a combined area of 3,851 sq. kms.), comprising about 40 per cent of the total area of the region.
The existing land use pattern shows that the physical resources are basically classified into agricultural lands, which include riceland, diversified and permanent croplands and grassland/pasturelands (5,399 sq. kms.); forestlands (3,330 sq. kms.), and wetlands (21 sq. kms.).
The mean annual surface runoff is estimated at 2,065 mm. or approximately 18,067 MCM. The basins' mean annual rainfall is 2,552 mm. The total groundwater storage is about 19 ,912 MCM and the 50 year groundwater "mining" and "safe yield" levels are 3,100 MCM and 2,877 MCM, respectively.
The annual water requirements in agricultural, industrial and domestic sectors shall increase appreciably from 638.11 MCM in 1975 to 1,074.61 MCM in the year 2000. The projected water requirement for agriculture will be about 95 per cent of the total requirement.
Over a 25-year period (1975-2000), the annual growth rate of the basin was estimated at 3.1 per cent. Hence, the population is expected to increase from 797 ,446 to some 1,726,000 in the year 2000. Economically active labor force increased by 3 per cent. The average family income in the basin was about 'P'5,917.
The estimated Gross Domestic Product of the basins is 'P'1,987.3 M in 1975 where agriculture had the largest contribution (54 per cent) and industry had the lowest (16 per cent). However, by the year 2000, the industrial GVA contribution will have a remarkable increase from 16 per cent to 42 per cent; the services contribution shall be increased from 36 per cent to 40 per cent while the agricultural contribution will decrease from 54 per cent to 18 per cent.
Various problem areas which impede the process of development of the basin have been identified. The basin experiences shortage in foodstuffs particularly in rice, fruits, and vegetables. Sewerage, power, health, water supply and educational facilities have not been adequately provided. Moreover, the basin lack the needed infrastructural support for increased productivity and efficiency of all the sectors in the basins.

However with the basins' resources which have productive potentials, a bright future 'which promises growth and development shall await the basin. Food production will continue to expand or increase as the area for agricultural use will be expanded. It has a large labor force which could meet the manpower requirements of the basin. Some of its mineral resources are still to be fully tapped. The water resources of the basin are adequate to meet the demand of the various sectors in the basin and of all potentials, electric power is continually promising for the basins' industrialization because of its proximity to the Agus hydropower systems. (Please refer to Table 1-1 for the basins' characteristics).
Table 1 - 1 SUMMARY OF
CURRENT AND FUTURE BASIN CHARACTERISTICS Misamis Oriental Basins
Basin Area (Sq. km.)
Water Resources
Total Mean Annual Runoff {MCM)
Dependable Flow (80% MCM/day)
Groundwater (MCM/Year) Total Groundwater Storage Groundwater Recharge 50 year Groundwater "mining" "Safe Yield" Level
Temperature and Humidity Temperature (0 c Mean) Relative Humidity (%Mean)
Mean Annual Basin Rainfall (mm)
Social Environment Population
Urban Rural
Labor Force (Econ. Active)
Employment
Agriculture Industry Service
Income
Average Family Income ('P') Per Capita Income ('P)
Economic Structure (GVA in 'PM) Agriculture Industry Services
2
1975 2000
8,750
2,065 MM or 180.67 MCM
797,400 159,400 638,100
219,400
209,900
126,400 22,800 60,700
5,917 1,004
1,064.6 320.0 721.3
26 19,912
2,877 3,100 2,877
26°c to 28°c 80
2,552
1,725,800 404,900
1,320,900
499,700
489,700
176,300 129,800 183,600
4,002 9,325 8,971

Table 1-1 (cont.) SUMMARY OF
CURRENT AND FUTURE BASIN CHARACTERISTICS Misamis Oriental Basins
Food Demand Requirement (MT) Rice Corn Sugar Vegetables Rootcrops Fruits Pork Beef /Carabeef Poultry Meat Fish
Agricultural Production (MT)
Rice Corn Sugar Vegetables Rootcrops Fruits Pork Beef /Carabeef Poultry Meat Fish
Water Requirements (MCM/Year) Domestic and Municipal Agricultural Industrial
Land Use (Sq. Km.) Riceland (irrigated) Riceland (non-irrigated)
TOTAL Riceland Diversified Cropland Fruit Bearing Trees Pasture/Rangeland Forest Wetland
3
1975
78,200 40,000 16,500 44,800 18,100 44,600
7,700 3,200 4,100
28,900
77,100 71,700
100 900
6,300 10,000 3,300 3,800
143 8,596
12.52 MCM 625.46
0.13
322 787 873
3,417 3,300
21
2000
171,400 110,800
57,300 133,000
37,500 129,900
30,000 12,600
114,100 87,600
267,600 391,362
636 5,100
36,500 59,600 30,000 ~5,000 14,000
47.4 MCM 1,015.70
11.51
472* 866
1,047 3,894 2,450
21

Power
Table 1-1 (cont.) SUMMARY OF
CURRENT AND FUTURE BASIN CHARACTERISTICS Misamis Oriental Basins
1975 2000
Peak Demand (MW) Generated Power (MW)
314 (1980) 217
Transportation Road Kilometerage Kilometer/1000 population Kilometer/1000 hectares Port (national)
(municipal)
Airport (Secondary) (Feeder) Trunkline
*Land Capability Figures.
B. Framework for Development
B.1 Water Resources
926.335
1 1
1 1 1
The requirement for water is primarily dictated by the irrigation of agricultural land, the direct use of domestic, municipal, industrial and other related economic activities; the requirement of water-based activities like fisheries and navigation; and the special requirement of hydropower, recreation and wildlife.
By properly utilizing water resources and exploring other sources of water, especially in areas where the supply is scarce, the basin will be ensured of increasing productivity in all these activities which will make the basin stable over a long period of time. Moreover, to be ensured of adequate supply during the time of deficient flows, water impounding and distribution systems are also essential for storing water.
Flood problems in the basins are generally minor and localized. Nevertheless, there is a need to improve, expand or even to rehabilitate flood control structures in order to prevent flood problems in the future.
Efficient water resources management ·require adequate and accurate water and land related data. These data should be representative of local variations which could only be attained by strict adherence to minimum standards and proper maintenance of existing facilities. These should be complimented by training of personnel and implementation of water resources data bank to assimilate, process and store relevant data for the achievement of objectives.
4

B.2 Land Resources
Agricultural land, as shown by the land capability analysis, can be increased from 5,399 sq. kms. to 6,279 sq. kms. In this expansion, about 26 per cent of the forestlands, with favorable terr'ain condition and soil types, have to be sacrificed, in order to augment the existing agricultural land, thereby maximizing the production of crops which are presently defieient, most especially rice.
Improving cultivation methods, applying appropriate technology and applying soil protection measures will make the basin attain self-sufficiency in food crops by the year 2000.
B.3 Socio-Economic
The development of water and related land resources is closely interrelated with the objectives of economic growth through increase in the basins' income and its equitable distribution, and social development. Significant strategy for development lies on the allocation of land resources for optimal use and the provision of water for the basin requirements.
Increase in income shall be based on the present income sources, notably farming and other land-based activities. Hence, the increase in income will be attributed to the advances in technology which will help push cropping intensities and land utilization to higher levels, effect a better water management and control.
The implementation of education and manpower development programs are a must in order to develop the manpower resources of the basin. Moreover, health services/facilities should be expanded and/or improved to provide the health needs of the people.
B.4 Environmental Consideration
Any development activity will have adverse effects upon the environment, directly and/or indirectly. The implementation of irrigation projects is accompanied by the increased application of pesticides and herbicides which will adversely affect the animal life. Therefore, sufficient information regarding the application of this technology should be disseminated in order for the farmers to be well-informed and well-assisted.
Construction activities related to drainage and irrigation may cause · erosion and sedimentation. Nevertheless, this will temporarily be minimized if construction is done during dry season.
Untreated domestic sewage from domestic and industrial establishments disposed in the river system contributes to changes in the quality of water of the basin.
Serious consideration should be taken into the preservation of historical and archaeological sites. More so, ethnic groups should be reconciled to the government programs on relocation without serious economic adaptation if relocation is provided for in the implementation.
5

Disease outbreaks can be arrested through proper sewage and waste disposal, treatment of water supply, adequate health facilities and servic.-!s and health education of the inhabitants.
C. Sectoral Recommendation
C.1 Water Supply and Sewerage
The NWRC, through the Rural Waterworks Development Corporation (RWDC) has recognized three levels of service namely: Level 1, 11 and Ill. Level I service which is intended for rural centers is most basic. Level 11 service is also intended for rural centers where houses are dense and clustered. Level 111 is intended for urban communities where the population is dense.
The projections on population distribution and settlement indicate that although there will be increasing urbanization, majority of the population will stay rural. Hence there is a need to enhance Levels I and 11 services.
Since most of the basins' population wili reside in rural areas, modern sewerage facilities particularly the use of flush-type toilets should be promoted. Furthermore, people should be informed well regarding sanitation practices in order to promote higher standards of household sanitation.
C.2 Irrigation
The National Irrigation Administration (NIA) has identified and proposed 5,695 hectares for irrigation. This could boost the agricultural production of the basin. At present, there are 20 communal systems serving an area of 2,261 hectares and 16 private systems serving 44 hectares. There is no national irrigation system existing in the basin.
The successful implementation of the project should consider not only the technical feasibility of construction but also the vigilant maintenance of the structures, adequate training of technicians, and the attitudes of the benefactors to ensure the desirable long-term benefits.
C.3 Flood Control
There are no major flood prone areas in the basin are generally minor and localized. usually adopted to situation existing in the place.
the basin. Flood problems in The protective measures are
How:ver, i~ order not to defeat the very purpose of development, programs ~avmg an integrated scheme of construction and the continuous appraisal and maintenance of existing structures should be implemented.
C.4 Land Use Management
The allocation of land to its best use for maximizing productivity as well as for environmental protection is important in water-resources development. The economic exploitation of the land is designed to bridge the gap between the resource potentials of the land and the low level of socio-economic development of its inhabitants.
6

The basins' potential for agriculture is favorably high as shown by the land capability assessment .• Some portions of the forestlands having favorable terrain and soil types should be converted into productive croplands in order to augment the existing ones, thereby reducing deficiency in food.
The protection of forest areas from indiscriminate developmental acti· vities is the main concern of the basin to preserve these areas for present and future generations. Also, a considerable focus must be placed on watersheds and forest reserves which serve special functions for the ecological life of the basin.
C.5 Power
The basins' power needs for the future will be sourced mainly from the Agus hydro-electric power generation, and the Pulangi hydropower systems. The development of the industries particularly the small-and-medium scale industries will be enhanced if cheap power are made available. Since the basin is fast becoming an industrial center in the south, industrial dispersal from Metro Manila and other regions will have effects on the basins' development in which power availability is very much of importance.
C.6 Fisheries
Inasmuch as the basins' demand requirement for fish is much higher than its supply, then there is a great need of converting the basins' wetlands (mangroves, swamps, etc.) into fishpond to be able to augment the existing fish catch from deep sea or coastal fishing.
C. 7 Transportation
As of 1980, the basin contained within its municipal boundaries an approximate road kilometerage of 926.335 kilometers. As a whole, the road condition in the basin is nearly good having 38 per cent ·of the total kilometerage as concrete and asphalt roads.
At present, the basin is served by three airports: the trunkline airport in Cagayan de Oro City; the feeder type airport in Mambajao, Camiguin, and an airport located in Malaybalay, Bukidnon.
According to the 1978 PPA report, the sub-port in Nasipit is the only sub-port which is accessible to the basin.
To improve the efficiency in transporting the goods and services in the basin, roads, airports and port facilities should be expanded and/or improved. In addition farm-to-market roads have to be built to increase the productivity , of the agricultural sector. Lastly, road linkages between basins and/or major business centers are indispensable in increasing the productivity in various
sectors of the basin.
7
DIGITIZATION UNIT
Sticky Note
Page 8 - Blank page

CHAPTER 11
INTRODUCTION
A. Background
The growing importance of water resources as a key sector in the national development effort has dictated the need for a nationwide water resource development framework plan that is both integrated and integrable into the national and regional development programs of the country. This is one of the basic purposes for which the National Water Resources Council was created by virtue of Presidential Decree No. 424.
To achieve its mandated objective, the council continually evolves planning approaches and conducts studies relevant to the preparation of water resource development plans. The initial step in the planning process adopted by the council is the preparation of framework plans for the country's twelve water resource regions. Each regional plan consists of the integration of the multi-sectoral development framework of the major basins, sub-basins or contiguous basin areas of the region. The basin then, or in some instances important sub-basins or an integrated group of minor basins, is the adopted unit of analysis and planning of the water needs and potentials of the region.
Water Resource Region X consists of two river basins in Mindanao Island, namely, Misamis Oriental and Agusan.
As a planning area, Misamis Oriental Basins covers twenty-six municipalities of Misamis Oriental, five municipalities of Camiguin, four for Agusan del Norte and seven for the province of Bukidnon.
B. Objective of the Study
The study hopes to establish a sufficient analytical framework on which to base concrete recommendations for the development of the basin area including, where necessary, measures to improve the data base for subsequent planning efforts for the basinwide water resource development.
C. Scope of the Study
As a long-range development planning exercise, this study covers the following areas of analysis:
1. Existing situation and trends in water resources and related development;
2. Potentials in terms of land and water resources;
3. Projection of demand for water and related resources up to 2000 A.D.;
4. Water supply projections and evaluation of capacity to meet future demands;
5. Identification and profiling of water resource development projects;
6. Environmental and social impact assessment of future development;
7. Determination of development thrust of sectors with high potentials; and
8. Determination of areas of improvement in basic data.
9
DIGITIZATION UNIT
Sticky Note
Page 10 - Blank page

CHAPTER Ill
OBJECTIVES OF DEVELOPMENT
A. Regional Development Objectives and Strategies
The development of water resources is of vital importance as a support in the pursuit of long-range objectives of development of the region. These objectives are spelled out in the Five and Ten-Year Development Plans of Northern Mindanao (Region X) prepared by the National Economic and Development Authority and adopted by the Regional Development Council. The objectives include:
1. Attainment of a sustained maximum feasible growth by accelerating the pace of industrialization;
2. Optimum exploitation of resources through accelerate production of food and food items to attain self- sufficiency, expand and diversify production of commercial crops and other agricultural products, especially those that will boost industrial expansion and expand the production volume and coverage of extractive industries;
3. Promote social development as a consequence of improved rural income, expanded employment opportunities, equalized distribution of income, wealth and social services;
4. Rationalize the physical-geographic distribution of growth centers, economic activities, social services, and infrastructure;
5. Promote the integrated development of areas inhabited by cultural communities through the provision of more infrastructure support and social services;
6. Accelerate the provision and improvement of agricultural, industrial and social infrastructure such as irrigation systems, highways, farm to market roads, seaports and airports, power and electricity, and water supply;
7. Control rising prices and inflation through increased production in agriculture and industry and realistic support policies;
8. Promote the establishment of viable institutions to strengthen local development planning, financial and credit support, and the machineries of public administration and rural mobilization, and
9. Bring the region's high annual population growth rate and fertility ratio to a level within the effective support of the productive capacities of the region.
To achieve the above-mentioned objectives as well as the targets for the next five and ten years, the plan has likewise drawn up the following broad regional stra-
tegies: 1. Industrial development of the region will be appreciated through develop
ment of agri-based industries, optimum utilization of natural resources, promotion of steel and metal related industries and development of small and medium scale industries;
11

2. Thrust in agricultural development so as to '!1eet food requirement_ of its increasing population, supply the raw materials needed by th~ agn-based industries and increase rural income to develop the countryside market for its industrial output;
3. Tourism development through construction of tourist facilities and development of tourist spots and ultimately stimulate the inclusion of the region as a tourist destination of visiting foreigners;
4. A land use policy will be evolved where there will be an optimal plan of industrial location, central business districts, residential and resettlement areas, educational and cultural centers, agricultural lands, forest, pasture ranges and wildlife reserves;
5. Installment of physical infrastructure that will support the region's economic development such as farm to market roads, irrigation, marketing facilities and others, and
6. To promote a higher quality of life and sustain the region's agro-industrial development. The social services sector will pursue a dynamic program of efficient and equitable distribution of essential social services between the urban and rural communities.
B. Development Objectives of the Basin
The development of the Misamis Oriental Basins is dictated by the desire to optimize resource development and upgrade the general socio-economic condition of the area's population. This is spelled out in the following specific objectives:
1. To achieve self-sufficiency in food crops for the basin population;
2. To increase per capita and family income by exploiting to the fullest extent feasible the basin's natural, industrial and human resources;
3. To improve and expand infrastructure facilities to promote higher production and mobility of goods and services, and
4. To raise the levels of social services and facilities particularly those related to health and nutrition and domestic water supply.
12

CHAPTER IV
AREA PROFILE
A. Location and Description
The Misamis Oriental Basins, one of the sub-regions of Water Resource Region X is located in the northern part of Mindanao Island embracing almost the whole province of Misamis Oriental, the whole of Camiguin Island, three of Agusan's municipalities and seven municipalities of Bukidnon. It has an approximate area of 8,750 square kilometers.
The basins generally lie between 7°56' and 9°16' north latitude and between 124°15' and 125°32' east longitude. It is bounded on the north by the Bohol Sea, on the south by Pulangi Basins, on the east by the Agusan Basins, and on the southwest by the Agus Basins.
The main drainageways of the basins are the Alubijid, Baltocan, lponan and Tagoloan Rivers, most of which drain towards the Macajalar Bay on the north.
The river basins are predominantly covered by forests, and broad grassland/ pasturelands. Only thirteen per. cent of the total area is devoted to rice and other diversified crops.
B. Archaeological, Historical and Cultural Characteristics
The original inhabitants of Misamis Oriental were the Bukidnons and the Manobos, but they were driven into the interior when the Visayans arrived. Although Misamis is part of Mindanao, the dialect spoken by the natives is Cebuano.
Camiguin, another part of the planning area, was once a part of the vast empire of Sultan Cadril Corralat (Sultan Dipotuan Kudarat), the powerful ruler of Mindanao and Sulu during the seventeenth century.
Similar to Misamis Oriental, Camiguin was originally inhabited by the Bukidnons who retreated to the hinterlands of Mindanao or settled in the other parts of the island where the Visayans came.
The effects of the in-migration of the Visayans to this area can be seen in the fact that about 93 per cent of the basin population are Cebuano-speaking and 89 per cent are Roman Catholics.
C. Settlement System
Misamis Oriental Basins is composed mostly of coastal municipal organizations. Each is made up of barangays and sitios with total population ranging from a high of 165,000 inhabitants to a low of 3,900. As of 1975, Cagayan de Oro City is · the most densely populated area while the municipality of Benuangan is the least dense.
It is characterized by a rural population distribution of about 80 per cent, six municipalities of which are completely rural.
Fairly efficient transport system provides a link to the town centers and provincial capitals. As of 1980, the total kilometerage of the basin reached 926.335
13

0
0
:z:
0
,:D {J
u u
REPUBLIC of the PHILIPPINES ~
f)dO p
SUl.~
.. H D
14
. '
A 0
Figure IV-A-1 LOCATION MAP
MISAMIS ORIENTAL BASINS
5 0 5 IO 15 20
Scole 1n K1lome1ers

124°15' 124°30' 124°45'
8°45'
8°30'
Lugait
8°15'
124°15' 124°30' 124°45' -
15
125°00·
Balangoan Magsaysay
LEGEND: ---- REGIONAL BOUNDARY -··- MAJOR BASIN BOUNDARY -·- MINOR BASIN BOUNDARY --- PROVINCIAL BOUNDARY
----- MUNICIPAL BOUNDARY ~ RIVER, CREEK
@ PROVINCIAL CAPITAL e CHARTERED CITY 0 MUNICIPALITY
Figure IV-A-2 PROVINCIAL AND MUNICIPAL COVERAGE
MISAMIS ORIENTAL BASINS
SCALE IN KILOMETER F-"li""""'I-~ 5 0 5 10 15 20 25 30KMS
8°30'
8°15'
125°00· 125°15' 125°30'
kilometers. It is being served by one sub-port which is found in the ~unicipali~ of Nasipit and three airports which are found in Cagayan de Oro Crty, Mambaiao, Camiguin and Bukidnon.
D. Climate
D.1 Climate Type
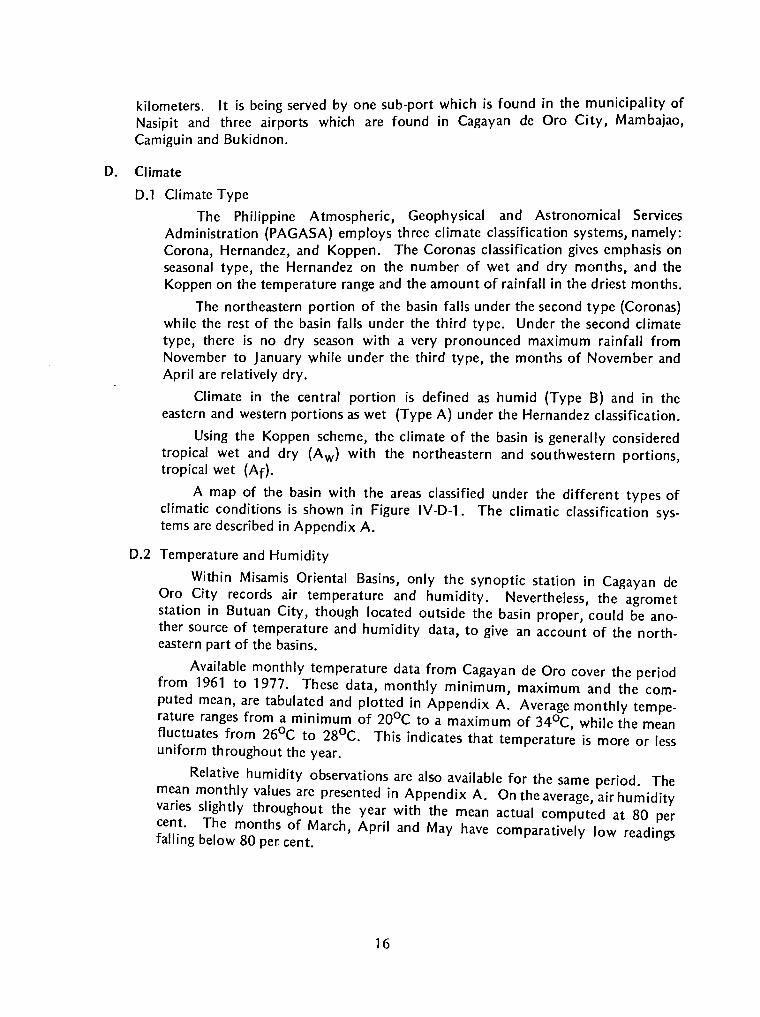
The Philippine Atmospheric, Geophysical and Astronomical Services Administration (PAGASA) employs three climate classification systems, namely: Corona, Hernandez, and Koppen. The Coronas classification gives emphasis on seasonal type, the Hernandez on the number of wet and dry months, and the Koppen on the temperature range and the amount of rainfall in the driest months.
The northeastern portion of the basin falls under the second type (Coronas) while the rest of the basin falls under the third type. Under the second climate type, there is no dry season with a very pronounced maximum rainfall from November to January while under the third type, the months of November and April are relatively dry.
Climate in the central portion is defined as humid (Type B) and in the eastern and western portions as wet (Type A) under the Hernandez classification.
Using the Koppen scheme, the climate of the basin is generally considered tropical wet and dry (Aw) with the northeastern and southwestern portions, tropical wet (Af).
A map of the basin with the areas classified under the different types of climatic conditions is shown in Figure IV-D-1. The climatic classification systems are described in Appendix A.
D.2 Temperature and Humidity
Within Misamis Oriental Basins, only the synoptic station in Cagayan de Oro City records air temperature and humidity. Nevertheless, the agromet station in Butuan City, though located outside the basin proper, could be another source of temperature and humidity data, to give an account of the northeastern part of the basins.
Available monthly temperature data from Cagayan de Oro cover the period from 1961 to 1977. These data, monthly minimum, maximum and the computed mean, are tabulated and plotted in Appendix A. Average monthly temperature ranges from a minimum of 20°c to a maximum of 34°c, while the mean fluctuates from 26°C to 28°C. This indicates that temperature is more or less uniform throughout the year.
Relative humidity observations are also available for the same period. The me~n m?nthly values are presented in Appendix A. On the average, air humidity vanes slightly throughout the year with the mean actual computed at 80 per cent. The months of March, April and May have comparatively low readings falling below 80 per cent.
16

CLIMATIC CLASSIFICATION (Island of Mindanao) MISAMIS ORIENTAL BASIN
0 Oo ~
o• o 0
cP 0 •
0
0
0.
• •• • •• • -
17
KOPP EN'S CLASSIFICATION
0Af -Arn -Aw 0 Ct
--- RIVER BASIN BOUNDARY
CORONA'S CLASSIFICATION
- 2nd Type
B 3rd Type
- 4th Type --- RIVER BASIN
BOUNDARY
HERNANDEZ CLASSIFICATION
E:1ifij Type A
0 TypeB
-TypeC
Ellllllilil Type D
--- RIVER BASIN BOUNDARY
Figure IV-D-1
DIGITIZATION UNIT
Sticky Note
Page 18 - Blank page

CHAPTER V
WATER AND RELATED LAND RESOURCES
A. Water Resources
The development of a region's water resources requires the scientific and orderly management of its resources consistent with the principles of optimum utilization, conservation and protection to meet present and future needs. Proper utilization and management of water resources, however, is highly dependent on the availability and accuracy of water related data. In line with this, an appraisal of the basin's resources is present in this Chapter.
Contained herein are information on the source, extent, quantity and quality of water and its availability and dependability for future exploitation. Current and past utilization of water supplies and existing control measures are evaluated. However, the acquisition of water data for the area started only recently. Thus, the analysis is performed and the results should be taken within the framework and and re-evaluated as more data becomes available.
A.1 Rainfall
Rainfall in the basins has been observed by PAGASA since 1956. At present time ten (1 O) rainfall stations are operating within the area. About four (4) have started operations only in 1977. Table V-A-1 lists with coordinates and periods of record of these stations, while Figure V-A-1 shows their approximate point locations.
Table V-A-1 HISTORICAL RAINFALL RECORDS
Misamis Oriental Basins
STATION LOCATION LATITUDE LONGITUDE TYPE1'
PERIOD OF ID RECORD
]08 Liborna, Baungon, Bukidnon 8°20'00" 124°40'00" CR 1977-1979 ]09 lmpasugong, Bukidnon 8°20'00" 125°00'00" CR 1974-1979 ]10 lmpalutao, lmpasugong, Bukidnon 8°16'00" 125°02'00" RMM 1966-1977 J 11 Libona, Bukidnon 8°20'00" 124°44'00" CR 1977 ]12 Anuel M. Fortich, Bukidnon 8°25'00" 124°59'00" CR 1977 J 13 Damilag, M. Fortich, Bukidnon 8°21 '00" 124°49'00" cc 1966-1979 ]14 Maluko, M. Fortich, Bukidnon 8°22'00" 124°57'00" CR 1956-65' 76-77 ]15 Philips, M. Fortich, Bukidnon 8°20'00" 124°49'00" cc 1966-1980 J 16 Talakag, Bukidnon 8°14'00" 124°36'00" CR 1977 ]17 Cagayan de Oro City, Misamis Oriental 8°24'00" 124°36'00" SYN OP 1961-1980
11 Rainfall station type classification CR - Cooperative Rain Station
RMM - Pre-war classification of Rain Station CC - Cooperative Climatologic Station
SYNOP - Synoptic Station
19

The mean, minimum, and maximum monthly rainfall values of the lmpasugong, lmpalutao, Damilag, Philips and Cagayan de Oro stations are plotted in Figures V-A-2 to V-A-6, and tabulated in Appendix A. (Liboran has fragmentary data available and was excluded in the analysis). Based from the given figures, it could be noted that much rainfall occurs from May to October.
The reciprocal distance method of interpolation was applied to the rainfall data of the Misamis Oriental Basins and in the adjacent basins to get the spatial variation of the basin annual rainfall. Figure V-A-7 exhibits the rainfall map of the basin. Based on the mapped values, the mean annual basin rainfall is placed at 2,552 millimeters.
Using Gumbel's method, PAGASA prepared rainfall-depth-frequencyduration analysis (5, 15 and 30 minutes and 1, 6, 12 and 24 hours) on rainfall records of Cagayan de Oro City. Results of the analysis are illustrated in Figure V-A-8 and summarized in Appendix A.
A.2 Surface Runoff
A.2.1 data availability
The Misamis Oriental Basins are composed of two (2) major river basins namely the Cagayan RB (1,521 sq. km.) and Tagoloan RB (1,704 sq. km.), eight (8) sub-basins and numerous small watersheds. The former Bureau of Public Works (BPW) had established five (5) streamflow gaging stations specifically at Balatocan, Tagoloan, Cagayan, lponan and Alubijid Rivers. Their coordinates and period of records are listed in Table V-A-2, and their approximate point locations are shown in Figure V-A-1. Daily streamflow records for these stations are available from the BPW Water Supply Bulletin. However, data for Tagoloan is fragmentary while for Balatocan cover only three (3) years (1968-1970). Hence, only data from Cagayan, lponan and Alubijid Rivers were used in the analysis.
STATION io!J
1019
1020
1022
1023
1024
Table V-A-2 HISTORICAL STREAMFLOW RECORDS
Misamis Oriental Basins
LOCATION LATITUDE LONGITUDE
Balatocan R : Napaliran, Balingasag, Misamis Oriental 8°47'10" 124°48'53"
Tagoloan R: Sta. Cruz Tagoloan, Misamis Oriental 8°32'02" 124°47'45"
Cagayan R : Tinib, Cagayan de 8°28'06" 124°38'00" Oro City, Misamis Oriental
lponan R : Pagatpat, Cagayan de Oro City, Misamis Oriental 8°28'42" 124°20'00"
Alubijid R: Munay, Alubijid, Misamis Oriental 8°34'15" 124°27'48"
V Station ID Nos. are based on Reg. 10 NWRC listing.
20
DRAINAGE PERIOD OF AREA RECORD
(sq. km.)
114 1968-70
1656 1960-63, 1968-70
1331 1954-64, 1968-69
351 1957-70
94 1950-53, 1955-70

The statistical parameters (i.e. mean, standard deviation, skewness, etc.) of the monthly and annual runoff data are tabulated in Appendix A.
A.2.2 surface water availability
The mean annual runoff volumes observed at the gaging stations were converted to equivalent depths of runoff. These runoff depths served as input in plotting the areal variation of the basin runoff (shown in Figure V-A-9) using the reciprocal distance method of interpolation. The basin has a mean annual runoff depth estimated at 2,065 millimeters or approximately 18,067 million cubic meters (MCM) with major contributions from the Cagayan-Tagoloan and Mandulog River Basins supplying 6,659 MCM and 1,633 MCM, respectively.
A.2.3 dependability analysis
The daily streamflow records of the gaging stations in and around the basins were subjected to flow duration analysis. Flow duration curves (Figure V-A-10) provide the percentage of time, a certain flow is equalled or exceeded. Dependable streamflow can be derived from these curves by reading off values for a particular percentage of time, say eighty (80) per cent. Then, by applying the reciprocal distance method of interpolation to the values read, the spatial variation of the basins' dependability is obtained. On Figure V-A-11 is the basins' 80 per cent dependable flow map indicating an average flow of 26 MCM/day. Eighty (80) per cent dependability is adopted by the NWRC as the limit for the granting of water rights.
A.2.4 flood and minimum flow frequency analysis
A.2.4.1 flood frequency analysis
The annual peak discharges of the Cagayan, lponan and Alubijid rivers (details shown in Appendix A) were subjected to frequency analysis assuming a Log Pearson Type Ill Distribution.1' The analysis was based on the length and acceptability of available streamflow records.
The results of the flood frequency analysis are shown in Table V-A-3. The computed frequency curves together with the 5 per cent and 95 per cent confidence limit curves are drawn in Figures V-A-12 to V-A-14. Alubijid River, with 17 years of record, exhibits a higher reliability of flood estimates compared to Cagayan and lponan Rivers, both with 9 years of record. This is shown by the narrower range of probable values in the estimated peaks as defined by the 90 per cent confidence band.
A.2.4.2 minimum flow frequency analysis
The annual minimum flows of the rivers were likewise subjected to frequency analysis assuming a Type 111 Extremal Distribution (details shown in Appendix A). The data for Cagayan river did not show a good statistical fit and was not included in the analysis.
1/ Method used recommended by the U.S. Water Resources Council in Bulletin No. 37, March 1976.
21

Table V-A-3 FREQUENCY ANALYSIS OF PEAK DISCHARGE OF RIVERS
Misamis Oriental Basins Discharge in CMS
Return Cagayan River lponan River Alubijid River Period:
5%1/ 5425.15 71.54 33.97 100 years 2749.56 57.13 19.86 95% 21
1393.53 46.62 11.61
5% 3910.23 64.53 24.57 50 years 2224.56 53.52 15.82 95% 1265.57 44.39 10.19
5% 2494.56 55.84 15.78 25 years 1627.19 48.36 11.40 95% 1061.83 41.88 8.24
5% 1744.30 49.64 11.11 10 years 1238.79 44.03 8.62 95% 879.78 39.04 6.70
5% 1189.73 43.57 7.64 5 years 896.07 39.12 6.25 95% 674.89 35.12 5.10
5% 632.59 34.26 4.19 2 years 491.58 30.74 3.53 95% 382.00 27.58 2.97
Scale Parameter, 0.05 0.04 0.12 ALPHA
Characteristic Drought, BETA 177.483 49.90 28.96 Power Limit, GAMMA -3.10287 1.30 -2.12
11 Expected flow is less than or equal to the indicated flow in 5 out of 100 observations. 21 Expected flow is greater than or equal to the indicated flow in 95 out of 100 observations.
Table V-A-4 shows the result of the frequency analysis while Figures V-A-15 and Y-A-16 plot the computed values.
22

Table V-A-4 MINIMUM FLOW FREQUENCY ANALYSIS OF RIVERS
in the Misamis Oriental Basins (Discharge in CMS)
RETURN PERIOD IPONAN
X +SE 3.36 100 Years 1.59 X-SE -0.18 X+SE 3.27 50 Years 1.64 X-SE 0.02 X +SE 3.10 20 Years 1.79 X-SE 0.48 X +SE 2.97. 10 Years 2.02 X-SE 1.07 X+SE 3.08 5 Years 2.47 X-SE 1.86 X+SE 5.13 2 Years 4.03 X-SE 2.94
Scale, Parameter, Alfa 1.16 Characteristic Drought, Beta 4.96 Lower Limit, Gamma 1.52 Function A (Alfa) 0.06
Function B (Alfa) 1.22
A.2.5 flood control
ALUBIJID
0.12 0.04
-0.04 0.12 0.05
-0.02 0.12 0.07 0.01 0.14 0.10 0.06 0.18 0.14 0.11 0.33 0.28 0.22
1.53 0.35 0.02 0.17 1.67
There are no identified major flood prone areas within the basin. Flood problems are generally minor and extremely localized in nature. Protective measures are usually adopted to situations in the area.
At present, there are twelve ( 12) existing flood control infrastructure projects in the area. Shown in Appendix A, Table A-13 is the inventory of existing flood damage protection measures within the basin. The largest project is the Dangoan River Control situated in the municipality of Medina. It consists of dikes/leeves, revetment/bank protections, cut-off channels and dredging that incur a total length of 1.025 km., 1.030 km., 0.125 km. ahd 0.055 km., respectively.
A.3 Groundwater
A.3.1 data availability
The extent of a groundwater development in the basin can hardly be quantified. As of this writing, only the groundwater exploitation by the go-
23

vernment sectors can be described. Despite the NWRC's rigorous campaign to register water users, the response of the private sector has been far from sufficient.
According to a survey conducted by the National Water Resources Council (NWRC), there are at present 54 7 wells developed by the former BPW Wells and Springs in the area.
A.3.2 groundwater assessment
A macropicture of the groundwater resources of the basin is shown in a cyclogram map in Figure V-A-17. Specific yields of 5 per cent for permeable and 3 per cent for semi-permeable aquifer system were assumed. It was also assumed that 10 per cent of the average annual rainfall penetrates to the water bearing formation.
The average static water level in the basin is approximately 11.28 meters below ground surface (mbgs), while specific capacity is around 0.94 liters/second per meter (lps/m) as determined from 547 wells with an average drilling depth of 34.71 meters. Of the wells considered, 274 have static water level less than or equal to 6 mbgs (Table V-A-5).
The groundwater mining picture for the entire basin is provided in Figure V-A-18 showing the graphicaf relationship between withdrawal and estimated period of exhaustion. The basin has a total groundwater storage estimated at 19,912 MCM, with an inflow of 2,877 MCM per year. A total of 3,100 MCM per year is available for 50-year mining withdrawal. If the total groundwater exploitation in the basin is set at safe yield level, about 0.23 MCM per square kilometer may be alloted for concession to water users. Recommended safe yield is set at 2,877 MCM/Year
Figure A-3 to 11 (Appendix A) represents the groundwater mining picture of the contributing basins.
A.4 Sedimentation and Water Quality
A.4.1 sedimentation
No sediment data are available up to the time of this writing.
A.4.2 water quality
A.4.2.1 groundwater
No data are available to determine the quality of groundwater in the area.
A.4.2.2 surface water
The Nation~I Pollution Control Commission (NPCC) established some twenty (~O) stations along the seven (7) rivers within the basin to determine the physic.al, chemical and biological properties of surface water. Results of the ana_lys1s made by NPCC as evaluated according to the limits set forth by the National Standards for Drinking Water (NSDW) are presented in Table V-A-6.
24

Table V-A-5 GROUNDWATER STATISTICAL DATA
Misamis Oriental Basins
Average Average Average No. of Well Normal Static Specific Capacity
No. TOWNS Wells Depth Water Level (L/S/M) Considered (M) (MBGS)
1 Talisayan 27 32.79 23.65 1.07 2 Alubijid 65 44.94 28.55 0.35 3 Balingasag 24 27.14 3.37 1.13 4 Balingo_an 6 34.2 6.0 0.39 5 Cagayan de Oro City 53 70.6 11.88 0.92 6 Claveria 7 50.48 26.17 0.45 7 El Salvador 33 46.75 18.44 0.78 8 Gingoog City 20 29.13 2.17 0.61 9 Gitagum 3 63.72 25.30 0.11
10 lnitao 57 50.97 8.50 0.83 11 Jasaan 11 17.24 2.72 1.21
12 Kinogitan 4 21.43 13.2 0.41
13 Lagong-long 14 17.59 3.22 2.75
14 Libertad 2 40.39 32.01 0.52
15 Magsaysay 21 15.92 5.20 0.93 16 Manticao 35 27.3 4.83 1.16
17 Medina 11 14.97 6.74 1.05
18 Naawan 10 24.1 11.46 1.02
19 Opol 13 28.6 8.74 1.04
20 Salay 2 11.13 1.68 0.62
21 Tagoloan 20 13.58 4.48 3.53
22 Baungon 6 31.3 10.11 1.09
23 lmpasogong 2 34.52 17.6 0.4
24 Li bona 21 36.83 14.56 0.749
25 Manolo Fortich 12 68.4 10.73 0.45
26 Sum ii aw 1 42.68 7.62 2.07
27 Talakag 8 38.76 17.16 0.71
28 Buena vista 29 33.39 3.63 0.48
29 Carmen 12 39.46 4.57 0.71
30 Nasipit 18 33.03 3.99 0.64
Based on the results, Solana, Adiongan, Gingoog and Cabulig Rivers satisfy the criteria for Class A water classification.21 They can be sources for domestic water supply and any other best usage requiring water of lower quality if sub-jected to approved treatment equal to coagulation, sedimentation, filtration and disinfection.
2/ NPCC water classification based on usage of water.
25

w IC
~ c River
.J
~a> Ore
and Location i :ro w "'c ~ ll!o w :r t- t-
(Permissible Limits)** (7.0 (3) -8.5)
Cabulig: 26.3 8.4 1.2 San Nicolas
tv :Bobuntugan 27.3 8.2 1.2 O"I beside Resin plant
: J usaan town 27.6 8.1 1.4 near mouth of river
Cagayan: Uguiaban bridge 26.02 7.49 near Talakag, Bukidnon
: Cagayan de Oro City near City Hall 26.14 7.37
mouth of river 26.30 7.38
Gingoog : Kasingpitan 27.3 7.90 1.8
Santiago 27.9 7.84 2.0
lponan: Bo. 25.60 7.40 Pagatpat
near highway bridge 25.82 7.50 going to lligan
Bo. Barr .i near Mouth of river 25.94 7.58
Tilble V-A-6 PHYSICAL AND CHEMICAL CONSTITUENTS OF WATER SAMPLES11
MiSilmis Oriental River Basins
0 "' .JZ Cll c ~ ~ c << Cll c ::; Cll
25~ wz u::!: w w ::; 0
§~ !:::: :'j~:::: i~~ c
~~ ljlc::: "'-«:::: w-8~ :;!E ~E' ~>- .. ~15 E ge _. E' :E x E :..: .J < t-:::> -0 ~~ :::>
t- .... c :r Cl) t- :s < () 0 ID)( t- 0
0 >
(15) (5) (not (not (200) (200) 500 5) 5)
24.2* 3.0 59.6 8.0 0.54 5.2 45.8 129.5 48.0
25.8* 5.3* 61.3 7.8 0.54 14.8 50.2 147.2 41.6
27.5* 5.2* 63.6 7.6 0.80 43.8 59.8 159.3 35.8
56.4 8.04 0.94 7.00 57.13
53.80 7.95 1.29 9.30 33.20
63.60 7.58 0.64 5.18 21.43
14.2 5.3* 90.0 6.11 0.47 140.47 44.96 407.0 84.33
21.6* 6.6* 94.0 6.15 0.55 518.88 82.40 1079.0* 254.66
175.20 8.00 0.78 9.00 25.98
171.60 7.66 0.65 14.20 20.23
175.40 7.47 0.65 21.76 26.53
c 0 "' - .. ~ ::;;: ::;;;n ~ 'b WCI) WCI) ::;;: :::> Cc- ~Q:::. <-- :!<::: Ri~ 25s-;; z-c. ZtiX <zc::: ~se &ls e b~e () "' 1§ E !:::: :t: g; E ~ _. E
< .J IS. ~ "'"' Cl)CI) f-<( :::> 0 ~ j :r () < 8e! Cl) ::;;:
a. -
(75.0) (50.0)
8.2 121.3 5.7 72.6 11.4 10.7 3.1
11.7 135.5 5.1 47.9 13.5 3.4 3.2
5.8 153.5 6.3 61.6 13.8 6.6 9.8
46.80 24 24.83
40.40 44.41 30.25
112.60 50.50 58.00*
12.5 394.5 5.9 150.4 18.9 25.1 7.02
17.8 1061.3 6.4 218.9 23.0 39.4 8.74
178.80 92.58* 91.50*
182.60 96.58* 79.08*
193.40 92.91* 128.25*-

Table V-A-6 (cont.) PHYSICAL AND CHEMICAL CONSTITUENTS OF WATER SAMPLES,,
Misamis Oriental River Basins
c Cll
w .... ~ Cll c IC c
~ ~ c Cll c :::i c Cll - ~ 2et .... ~2 w Cll :::i I!!~ .... ~ :::> IC en wz w g w.,, 2 River I- Oic Cic:: ~'a. ~~'a. ~l!l-a,
c ~r g- car "' - 9r ~r ~§';;
~16 ::c :co 01- ~r ~r z- ::c""" <zr and Location "' "'c 8~ ~~ ~E ~~E ::cZ E .... ]' w..J ~~ ,,. Bi~! t-c
w ~o :..: (,JW .... .... < 5 ~g ~~ < " --!
... ::c :::> .... -0 oci ::c :::> I- !i! 1 < 8b 2 I- c <.> Cll Ci ::c (,J
I- < ->- ~ Cll 2 w °'><
... -I-
0 0 >
Odiongan: Barangay 27.5 8.3 1.3 20.0*
Pandakdakan 10.2* 57.0 7.4 0.40 4.5 36.5 150.3 52.5 32.7 129.6 5.5 46.1 12.8 3.4 5.6
Odiongan 27.9 7.9 1.5 25.0* 10.5* 74.3 7.2 0.50 272.0* 55.3 972.2* 255.3 17.8 953.3 6.2 208.3 20.3 38.5 49.6
" Solana: Kungab, 2 km. 27.8 8.7* 1.7 20.8* 7.'1* 121.6 7.9 0.37 6.5 32.3 210.6 51.4 14.1 196.6 9.6 94.6 25.1 7.8 4.4
from Solana
tV New Solana ........ Bridge 28.6 8.6* 1.6 25.0* 9.2* 126.0 7.9 0.75 6.9 28.2 223.5 61.6 11.4 211.9 11.3 98.7 35.9 12.0 8.9
Old Solana 29.6 8.4 1.9 35.0* Bridge 14.0* 133.0 7.5 0.98 2999.6* 67.7 1235.6* 305.6 30.3 1205.3 10.3 265.4 39.4 40.7 10.7
Tagoloan: Bo. Maluko, 25.06 7.54 1.00 76.66 8.07 1.07 9.58 21.12 74.40 26.25 37.55
Manolo Fortich, Bukidnon
Bo. Sta. Ana, Tagoloan: 25.42 8.24 1.00 80.50 7.87 1.01 11.05 18.64 81.40 35.58 44.25
Misamis Oriental
Highway Bridge 25.64 7.91 1.00 80.50 7.96 0.88 10.50 16.30 77.65 39.9 36.4
in Tagolo~n
Near point of 21.60 7.93 82.15 8.21 10.30 21.01 83.SS
discharge
• Exceeds permissible limits •• Permissible limits a ... el by the National Standards for Drinking Water (NSOW)
I/ Source: National Population Control Commission
H for Cagayan de Oro lponan, and Tagoloan Rivers, analysis done owever, • 1 • h th th
on their water samples are insufficient so as to draw any cone us.ion w e er . e water is fit for human consumption. Its domestic usage are mainly for bathing and laundry purposes, aside from transportation purposes.
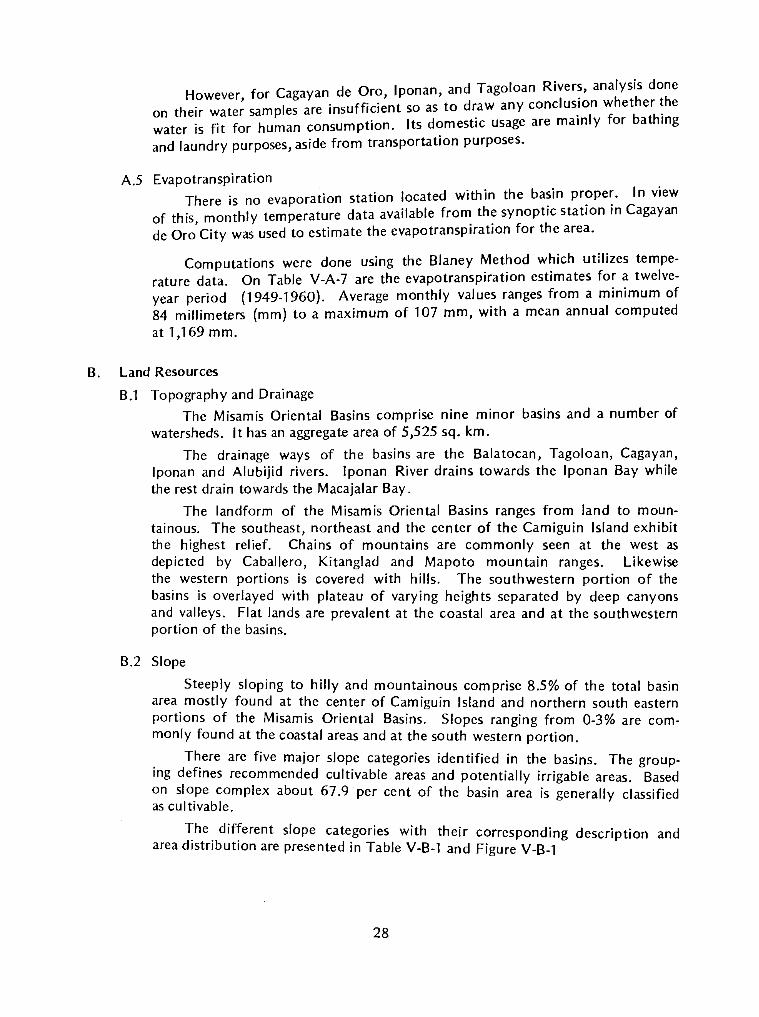
A.5 Evapotranspiration There is no evaporation station located within the ba~in pr?pe~. In view
of this, monthly temperature data available fro~ th~ synoptic station in Cagayan de Oro City was used to estimate the evapotranspirat1on for the area.
Computations were done using the Blaney Method which utilizes temperature data. On Table V-A-7 are the evapotranspiration estimates for a twelveyear period (1949-1960). Average monthly values ranges from a minimum of 84 millimeters (mm) to a maximum of 107 mm, with a mean annual computed atl,169mm.
B. Land Resources
B.1 Topography and Drainage
The Misamis Oriental Basins comprise nine minor basins and a number of watersheds. It has an aggregate area of 5,525 sq. km.
The drainage ways of the basins are the Balatocan, Tagoloan, Cagayan, lponan and Alubijid rivers. lponan River drains towards the lponan Bay while the rest drain towards the Macajalar Bay.
The landform of the Misamis Oriental Basins ranges from land to mountainous. The southeast, northeast and the center of the Camiguin Island exhibit the highest relief. Chains of mountains are commonly seen at the west as depicted by Caballero, Kitanglad and Mapoto mountain ranges. Likewise the western portions is covered with hills. The southwestern portion of the basins is overlayed with plateau of varying heights separated by deep canyons and valleys. Flat lands are prevalent at the coastal area and at the southwestern portion of the basins.
B.2 Slope
Steeply sloping to hilly and mountainous comprise 8.5% of the total basin area mostly found at the center of Camiguin Island and northern south eastern portions of the Misamis Oriental Basins. Slopes ranging from 0-3% are commonly found at the coastal areas and at the south western portion.
There are five major slope categories identified in the basins. The grouping defines recommended cultivable areas and potentially irrigable areas. Based on slope complex about 67.9 per cent of the basin area is generally classified as cultivable.
The different slope categories with their corresponding description and area distribution are presented in Table V-8-1 and Figure V-B-1
28

Table V-A-7 EVAPOTRANSPIRATION (MM) ESTIMATES BY BLANEY METHOD
STATION ID: CAGAYAN DE ORO YEARS OF RECORD: 12
YEAR JAN FEB MAR APR MAY JUN JUL AUG SEP OCT NOV DEC TOTAL
1949 90.16 83.35 96.71 99.29 106.21 103.30 103.87 103.30 97.01 98.67 92.36 92.13 1,166.36 1950 91.95 84.98 98.91 99.65 107.73 104.04 103.87 101.79 97.37 97.58 91.67 90.71 1, 170.25
IV 1951 91.59 85.63 96.71 101.46 107.35 104.04 104.63 102.54 98.09 96.85 93.05 93.91 1,175.86 l.D 1952 89.09 84.33 95.24 100.38 109.25 104.78 105.01 102.92 97.73 98.30 92.36 94.26 1,173.66 1953 91.95 85.31 96.34 100.01 108.11 105.16 104.63 105.18 97.37 98.67 93.75 93.91 1,180.37 1954 92.30 85.96 100.01 99.65 106.21 106.64 105.01 104.05 97.73 97.58 92.36 92.13 1,179.63 1955 93.37 85.63 98.54 99.65 109.25 104.04 103.48 102.17 97.37 99.03 93.40 102.79 1,188.73 1956 90.52 85.63 97.81 101.46 106.21 102.19 103.48 102.54 96.30 97.21 91.67 93.91 1,168.94 1957 93.37 84.33 97.81 98.93 107.35 104.78 105.39 103.30 97.37 97.21 89.93 91.42 1,171.20 1958 91.95 84.00 94.14 99.29 110.38 105.53 104.25 102.54 95.58 96.85 89.93 88.58 1,163.03 1959 85.17 79.76 98.18 98.20 106.59 103.67 103.87 100.29 94.86 96.85 90.63 91.07 1,149.14 1960 89.45 84.33 93.78 97.84 104.31 101.08 102.72 101.42 94.86 94.67 88.89 88.58 1,141.94
AVE. 90.91 84.44 97.02 99.65 107.41 104.11 104.18 102.67 96.80 97.45 91.67 92.78 1,169.09

124°15' 124045'
8°45'
8°15'
124045'
30
LEGEND: EXISTING
• GAG~~!{'FALL STATION
A GAG?J~EAM STATION
Figure V-A-1 HYDROLO
MISAMIS ORI GIC MAP ENTAL HASINS
SCALE IN ~ KILOMETER
5'/i ~ 125000; 5 10 15 2r--1 1 25
125015' 30KMS
8°45'
8°:30
8"00'
7°45'
125030'

600
'E ..§.
500 ~ c:
·;;; O!
400
Figure V-A-2 RAINFALL IN THE BASIN
(Ml LLI METERS)
J09 IMPASUGONG, BUKIDNON
PERIOD OF RECORD: 1974 - 79
.r:=J.MINIMUM _._MEAN J_MAXIMUM
3il

1,000
900
800
700
600
500
400
300
200
100
0
JlO IMPALUTAO, IMPASUGONG, BUKIDNON
PERIOD OF RECORD: 1966 · 77
.c:J.. MINIMUM _._MEAN _LMAXIMUM
JI J F M
Figure V-A4
RAINFALL IN THE BASIN (MILLIMETERS)
11 A M J J A
--
~
s 0 N D
)13 DAMI LAG, MANOLO FORTICH, BUKIDNON
l'E RIOD OF RECORD: 1966 · 79
.c:J.. MINIMUM _._MEAN _LMAXIMUM

e .§.
~ w ;;! w
figure Y A·S
RAINFALL IN THE BASlr-.; (MILLIMETERS)
1,000---~-~-..,.--.--.---.--.-,.--~-.-1:---1
soo-l--+--+--l---i---1f----+--t---r-t--r----i-1
16()()
500
400
300
100- ,__
0-1:: J ~ F M A M A S 0 N D
JOS PHILLIPS, MANOLO FORTICH, BUKIDNON
PERIOD OF RECORD: 1966 -80
r:::L MINIMUM _._ MEAN -1. MAXIMUM
1,000
900
800
700
600
500
400 ·-
300
200
100
o-11 11
J f M
Figure Y-A-6
RAINFALL IN THE BASIN (MILLIMETERS)
i A M I " A s 0
J17 CAGAYAN DE ORO, MISA"llS ORIENTAL
PERIOD OF RECORD: 1961 -1980
..CJ.MINIMUM _._MEAN
'
N D

BALATOCAN RB
8°45'
Luga it
8°15'
124°30'
34
.-1 .. cu1 '°
Magf.aysay
' \
LEGEND:
c:J (2300
~ 2300-2400
lilllllll] 2400-2500
~ 2500-2600
~ 2600-2700
F~:-:-:&J )2700
Figure V-A-7 MEAN ANNUAL RAINFALL (m.m.)
MISAMIS ORIENTAL BASINS
SCALE IN KILOMETER I ~ ____, tM*Wl 5 0 5 10 15 20 25 30KMS
8°45'
8"30'
8°00'
125°00· 125°15· 125°30"

600 ~---..----.~--~---.....---~-~~---------------
500 t--~-+--1r-----t-----+---~ Figure V-A-8 RAINFALL INTENSITY CHART FOR
CAGA YAN DE ORO CITY 300 r-----+--1r-----t-----+-----+11 BASED ON
1949. 1974
100 '§' 90 _g 80 ~ .._
Cl) ...... Cl)
E
E c:
>-I-Ul z UJ I-z _J _J
< u.. z <( ~
70
60
50
40 ----
30
20
10.._---1----1-----+----1-----1---+----4-~,--~~~t:T-"'""1
9.._ __ -1----1-----+----+-----l---+----+--~--''t-"~~1('1 81-----+----1-----+----J.----+-----+----+--__;~~-Y~~
71-----1---+----t----t----+---4----+----3t--~~~
61-----1-~--1-----+----1-----1---+----4----~r-~"'1
3'-__ _._ _ _... ___ ~-~-.._ __ _._ _ __.. ___ ....._ ___ .__ __ _ 5 minutes 10 15 20 60 2hours 3 6 12 24
DURATION
35
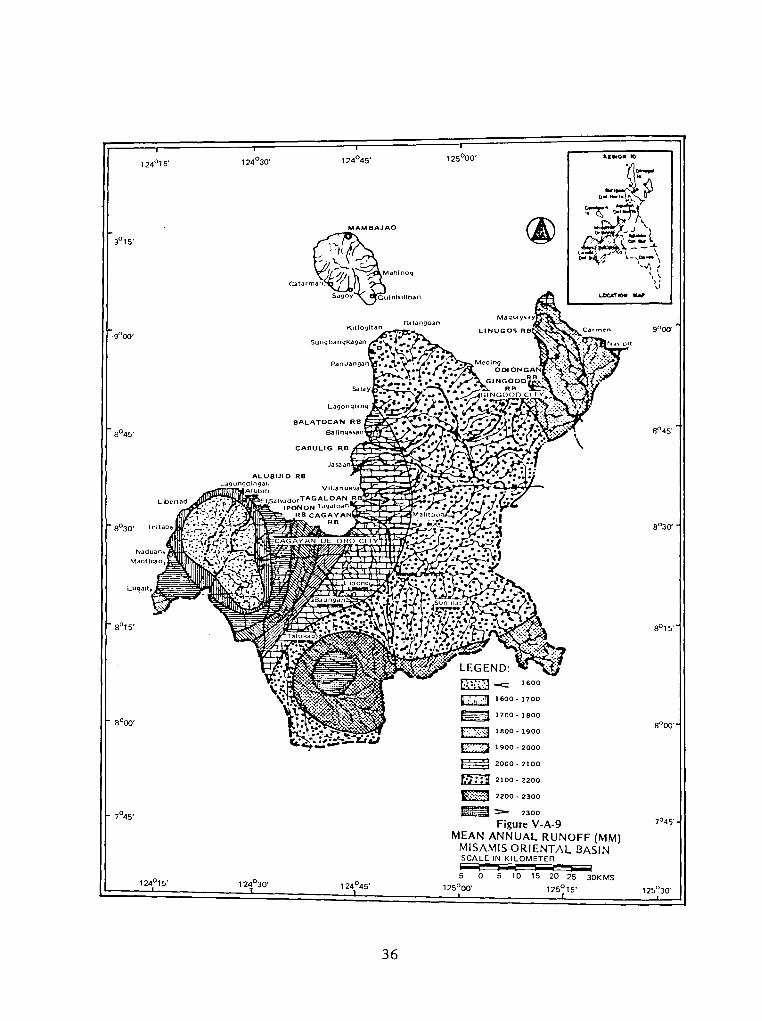
124015'
MAMBAJAO
8°45'
ALUSIJID RB
8°30'
8°15'
36
LEGEND:
l~.:i ~-J -=::: ~ 1600-1700
~ 1700-1800
~ 1800-1900
E.:J) 1900 - 2000
~ 2000-2100
mm 2100 _ 2200
~ 2200-2300
~ ::::- 2300
Figure V-A-9 MEAN ANNUAL RUNOFF (MM)
MISAMIS ORIENTAL BASIN SCALE IN KILOMETER __,,........... ;:;;;;;;q....., 5 0 5 10 15 20 25 30K MS
125°00'
fl"45·
8°:30'

Vl :E u z
1,000 900 800 700
600 500
400
300
200
100 90 80 70 60
50
40
30
.
20
10 9 8 7 6
5
4
3
2
1 . 9 .8 .7 .6 . 5
. 4
.3
.2
1
I I
I I
Figure V-A-10 FLOW DURATION
CURVES -
\
' ~ ~ MISAMIS ORIENTAL BASINS ..........._
I / ~ I
>-. -- I / ----( CAGAYAN RIVER (1955 - 1963)
I .- -.. l L at Cagayan de Oro City, Misamis Oriental '""-I\ D.A. = 1,331 Sq. Km. '\ T T ' l
·'\. \ • ~ IPONAN RIVER (1957 -1970)
' I ., v at Pagatpat, Cagayan de Oro City D.A. = 351 Sq. Km. ·-I
~ I ' ............... I I - . I ........:.. I !"'.....
\ ...... \_ ·" \ ' •,II..
\ ALUBIJID RIVER (1950 -1953, '55 - '70)
~ i' .. v at Mu nay, Alubijid, Misamis Oriental D.A. = 94 Sa. Km.
' K ~ ,
........ ........
'-
--- -.... .........
......... ....... -..... ~-
'·~ ' \
\ 0 10 w ~ 40 ~ ro m w ~ 100
PERCENT OF TIME FLOW IS EQUAL OR GREATER THAN Q
37

124°15' 124°30' 124°45' a1..0N IO
riJ!'\MBAJAO
.. ''·, '':\ .\: . ~ :.
1 • .°'Mahinog
, \ , I Catarman"'~·~ . · .. l
Sagoy '"'\..._~G~1nisiliban
Balangoan
8°45' 8°45'
8°30'
Luga it
8°15'
lillTI . 32-34
s0 oo· ~ 34-36 s0 oo· ErEJ 36-38
~ 38-40
LEGEND: IIIrr:J 40-42
UNIT: LPS/SQ. KM. ~==-42 i::;~y.] -<:: 24 Figure V-A-11
7°45' m::::::::J 24-26 DEPENDABLESTREAMFLOW 7o45· ®a 26- 28 (80PERCENn
C3 28- 30 MISAMIS ORIENTAL BASIN
G:] SCALE IN KILOMETER 30-32 ~ ......... ____,, I
5 0 5 10 15 20 25 30KMS 124°15· 124°30' 124°45' 125°00· 125°15' 125°30"'
38

w \0
104
9
8
6
4
3
3
6
5
4
3
2
10 2
1
L _//
7 I - #11'
• l#I" ..... ~ _/ _ _.,,.
....-' ~ ~ ,1, ~I/ _.__--i.,, •
:,.. 1-
i...i.,. i... l.--"' _,
l'I ~ 1
0 "" .... ~
""" . ,_
/ ~.,
~""" l/ ~.,.
~ .........
l./o / /
u ...
0 )
ll LEGEND:
0 OBSERVED ANNUAL COMPUTED FREQUENCY CURVE (CFC)
----- C. F.C. + S.E. -- C. F. C. - S.E.
1.1 1.2 1.3 1.4 1.5 3 4 5 6 7 8 9 10
RECURRENCE INTERVAL (in years) 1022CAGAYAN RIVERATTINIB,CAGAYAN DE OROCITY
20 30 40 50 100
Figure V-A-12
DA. 1331 Sq. Km. Period OF Period Of Record 9 Yrs. FLOOD FREQUENCY CURVE
Misamis Oriental Basins
0
0

• 8
~ 1 Lo- ... --• ---• i.- - :..U..- -- - '--•
~ c:g..- ------ --1-
~ 0 -
0 ~
2 D
1
•
LEGEND:
0 OBSERVE ANNUAL ---- COMPUTED FREQUENCY CURVE (CFC) ----- C.F.C.+ S.E. --- C.F.C.• S.E.
1.1 1.2 1.3 1.4 1.6 3 • • • 1 8 810 RECURRENCE INTERVAL (in ye.us)
1023 IPONAN RIVER AT PAGATPAT, CAGAYAN DE ORO
20 30 4() "° 100
Figure V-A-13 DA• 351 Sq. Km. Period Of Record 9 Yrs. FLOOD FREQUENCY CURVE
Misamis Oriental Ba.sins
'
10 • • LEGEND:
7 0 OBSERVE ANNUAL PEAK FLOW
• --- COMPUTED FREQUENCY CURVE (ere)
• ----- C.F.C.+ S.E.
---- C.F.C.-S.E. • .
.L.
!/ .......... 2 ~
,,,,,,. ..... l------I .,,,,,--; ........ --v o1 ·~.......... .J<" -• - - - 1
a ,. - --7 - ...... - --6 -" 1 ...... ) ,_ ... 5 .....:"'g,,. ....... t..,...1-
v/;:,, -4
3 0 0' ¥ 0
, 0 c
0
00 0
1.1 1.2 1.3 1.4 1.5 2 3 • 5 • 7 8 9 10 20 RECURRENCE INTERVAL (in years) 1024 ALUBIJID RIVER AT MUNAY, MISAMIS ORIENTAL DA • 94 Sq. Km Period Of Record 17 yrs.
30 40 50 100
Figure V-A-14 FLOOD FREQUENCY CURVE
Misamis Oriental Basins
40
10

... "' "' <(
~ 0
, LEGEND:
0 OBSERVED ANNUAL MINIMUM FLOW I~ - COMPUTED FREQUENCY CURVE (CFC)
:> ---- C.F.C.+ S.E.
0 "- ---- C.F.C.- S.E.
,,~~ - ----· -- _,_ ..,._ ............... .......
!""-.. "'. ...... .... c """"" "'
' (
'"' :"I'" 10
" " '\. '
\ \
\ ,
\ j 1.1 1,2 1.3 1.411.5 3 4 5 6 7 B 9 10 20 30 40 50 100
RECURRENCE INTERVAL (in years)
1023 IPONAN RIVER AT PAGATPAT,CAGAYAN DE ORO Figure V-A-15
DA• 351 Sq. Km. Period Of Record 9 Yrs. MINIMUM FLOW FREQUENCY CURVE MiYmis Orienul Bisins
10•
• 8
10 2
, LEGEND: - - 0 OBSERVEIANNUAL MINIMUM FLOW
- COMPUTED FREQUENCY CURVE (CFC)
' ---- C.F.C.+ S.E. ---- C.F.C.-S.E.
c c ) 0 0
~: ~ ....
' I~ .... ... ', r-...... ~ . .. .. r-.... :-~-
" r-... r-.. --. .. __ ---' ,__ - 1
..... ......_
' ..........
• ' '11.. ~
\ .............
\ -::::::
\ ' \
1.1 1.2 1.31.41.5 3 4 5 6 7 8 910 RECURRENCE INTERVAL (in years)
20 30 40 50 100
1024 ALUBIJID RIVER AT MUNAY, MISAMIS ORIENTAL DA. Sq. Km. Period Of Record 17 Yrs.
41
Figure V-A-16
MINIMUM FLOW FREQUENCY CURVE Misamis Oriental Basins
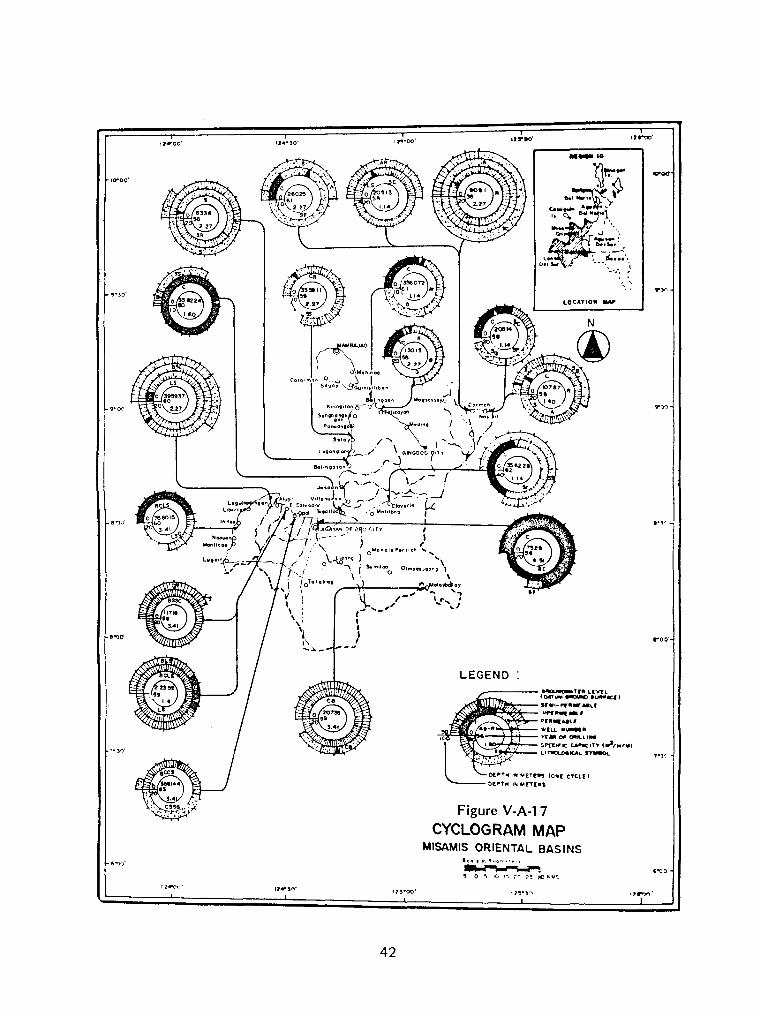
10"'00'
e-oo·
··10·
12.-01·'
42
-'-:: ... I • 't ... ,,
IJt-00'
·· ... : LOC.&TIOW ........
Figure V-A-17
CYCLOGRAM MAP MISAMIS ORIENTAL BASINS
Stole I•. II: •lo..-•'~·'
~~....., , 0 "i 10 ,., :~ ;>~ jll()lllri'"..
,,..,,.,.
..,. 1

6,000
ci >~ 5,000 u ::2: z 0
:;;! 4,000 3: <( 0:: 0 :c I-
~ 3,000 z z ::2:
2,000
1,000
0 0
Figure V-A-18 GROUNDWATER MINING PICTURE
MISAMIS ORIENTAL BASINS
I I I I
/ 1-..' Q= 10,912 2 877 [ t + ,
v ESTIMATED GWSTORAGE = 10.912 MCM ESTIMATED SAFE YI ELD = 2.877 MCM ESTIMATED 50.YR GWM YIELD = 3.100 MCM \/ ESTIMATED 50.YR GWM
= 0.23 MCM/KM2 WELL DENSITY
' "'---
20 40 60
PERIOD OF EXHAUSTION Tin years
43
80 100

Table V-B-1 SLOPE COMPLEX CATEGORIES, CHARACTERISTICS AND AREA COVERAGE
Misamis Oriental Basins
Slope Category
A
B
c
D
E
Description
Includes all level or flat to nearly level lands with slope ranging from 0 to 3 per cent. Areas belonging to this category are most suitable for irrigation because of their flat terrain. Depending on soils' physical condition, the maximum slope to be used for lowland rice production is 3 per cent.
Consists of gently sloping and gently undulating lands with slopes ranging from 3 to 8%. Gently sloping lands are suitable for irrigation but require slight terrain modification in terms of contouring or terracing. Depending on soil and climate condition in the area, 8 per cent is about the maximum slope for upland crop production that will require more complex and expensive conservation practices.
Consists df moderately sloping and moderately undulating lands with slope ranging from 8 to 15 per cent. Due to terrain restrictions, irrigation for purposes of lowland rice production will not be feasible. Intensive soil conservation measures are necessary to keep the soil in place when cultivated.
Includes steeply sloping, rolling and undulating lands between 15 to 25 per cent slope. On these lands, cultivated crops cannot be produced continously over an extended period of time. Tree crops, however can be grown.
Includes those that are steeply sloping to hilly and mountainous terrain. It includes all lands with slopes greater than 25 per cent. This slope category is not suited to any type of cultivated crops and should be covered with primary and secondary forest.
TOTAL
44
Area (Sq. Km.)
2695
1155
2091
2065
744
8,750
Percentage %
31
13
24
24
8
100%
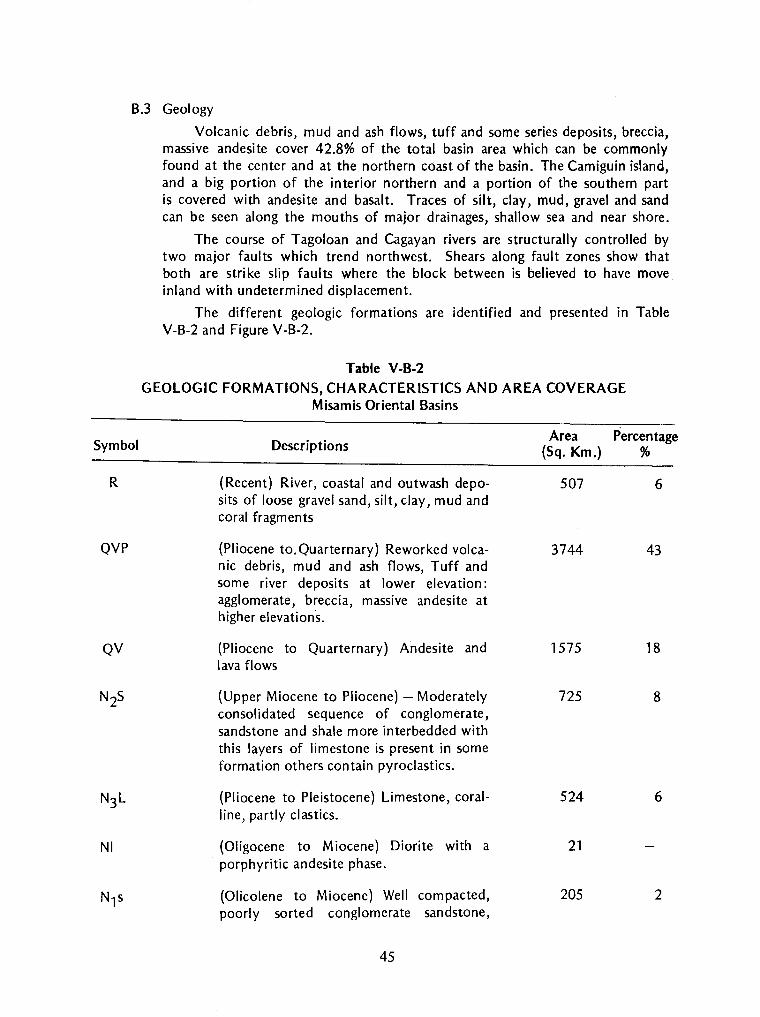
B.3 Geology
Symbol
R
QVP
QV
NI
Volcanic debris, mud and ash flows, tuff and some series deposits, breccia, massive andesite cover 42.8% of the total basin area which can be commonly found at the center and at the northern coast of the basin. The Camiguin island, and a big portion of the interior northern and a portion of the southern part is covered with andesite and basalt. Traces of silt, clay, mud, gravel and sand can be seen along the mouths of major drainages, shallow sea and near shore.
The course of Tagoloan and Cagayan rivers are structurally controlled by two major faults which trend northwest. Shears along fault zones show that both are strike slip faults where the block between is believed to have move inland with undetermined displacement.
The different geologic formations are identified and presented in Table V-B-2 and Figure V-B-2.
Table V-B-2
GEOLOGIC FORMATIONS, CHARACTERISTICS AND AREA COVERAGE Misamis Oriental Basins
Descriptions Area
(Sq. Km.) Percentage
(Recent) River, coastal and outwash deposits of loose gravel sand, silt, clay, mud and coral fragments
(Pliocene to.Quarternary) Reworked volcanic debris, mud and ash flows, Tuff and some river deposits at lower elevation: agglomerate, breccia, massive andesite at higher elevations.
(Pliocene to Quarternary) Andesite and lava flows
(Upper Miocene to Pliocene) - Moderately consolidated sequence of conglomerate, sandstone and shale more interbedded with this layers of limestone is present in some formation others contain pyroclastics.
(Pliocene to Pleistocene) Limestone, coralIi ne, partly cl as tics.
(Oligocene to Miocene) Diorite with a porphyritic andesite phase.
(Olicolene to Miocene) Well compacted, poorly sorted conglomerate sandstone,
45
507
3744
1575
725
524
21
205
%
6
43
18
8
6
2

KPG
BC
vc
shale, and thin lenses of impure limestone and intercalated with basalt flow.
{Cretaceous-Paleogene) Metavolcanics and metasedimentary rocks. Metamorphosed conglomerate, schistose sandstone slaty shore and marbolized limestone, metaandesite, metabasalt and metadiabase.
(Precreataceous) Low grade schists, marbles other metamorphic rocks.
(Pliocene to Pleistocene) Series of semiconsolidated conglomerate, sandstone and shale. The sandstone are frequently in tegrated with shales.
(Cretaceous-Paleogene) Essentially serpentinite perioditites, pyroxenites and dunite.
(Early Miocene) Mostly fine-grained, hard coralline, limestone, locally interbedded with limy shales and arkoses. Typically milky white with some buff and gray varieties.
TOTAL
B.4 Soils and Capabilities
B.4.1 Soil Classification
611 7
245 3
300 4
285 3
8
8,750 100%
Soils in the basins are classified to show the different types of soil resources in order to determine the suitability of land for crop production. Classification was primarily based on the origin, profile, texture, relief and drainage characteristics. There are 22 soil series identified in the basin and are classified into major classes based on the development of soil profile and parent materials, drainage characteristics and other physical attributes.
Soil groups identified in the basin with the corresponding areas are presented in Table V-B-3 and Figure V-B-3.
B.4.2 land capability
Land capability classes are designated by letter symbols. These symbols indicate progressively the extent and limitations for crops production. The capability classification of the province are based principally on the natural characteristics, soil types, slopes, present land use and degree of soil erosion.
46

Soils
A
18
D
E
F
G
H
Table V-B-3 MAJOR GROUPS OF SOILS, CHARACTERISTICS AND AREA COVERAGE
Misamis Oriental Basins
Description
The soils under this class were developed from recent alluvial deposits. They have medium to coarse texture from A to the C horizons. The relief is generally level or nearly so. Drainage condition is good to partly excessive. Permeability is very rapid to moderately rapid.
The soils under this class were developed from older alluvial forms or terraces having fine to very fine texture. It is generally flat with whole plain in A 0 to 3 per cent tilt which favors very easily external drainage. The internal drainage is poor and permeability is very slow.
The soils under this class are soils of upland areas developed from hard igneous rocks, such as andesites and basalts. The soils developed are deeply weathered fairly friable, reddish brown, dark brown to red. Internal drainage is good while permeability is moderate. The relief is usually rolling to steeply rolling.
The soils under this class are upland areas developed from shales. The relief is rolling to hilly. The soil is very sticky and pl a tic when wet and harpens upon drying. Permeability is very slow.
The soils under this class are soil of older terraces or upland developed from the weathering of I imestone of Calcareous shale and sandstone. The relief is from undulating to steeply rolling.
The soils under this class were developed from sandstone. It occupies also older terraces or upland areas ranging in relief from undulating to hilly.
Hydrosol. This type of soil is under water most of the time. It is found in swamps, Nipa, and Mangrove areas, fishponds, and salt beds.
The soils under this class include soils in mountainous, rugged terrain. They have not been classified because of terrain restrictions.
Area (Sq. Km.)
635.0
156.0
4349.0
436.0
667.0
386.0
21.0
2,100
Percentage %
7.3
2.8
50
5
8
4
24
TOTAL 8,750.0 100.0%
47

Class
A
B
c
D
E
F
The different capability classes with the corresponding recommendations for general use are presented in Table V-B-4 and Figure V-B-4.
A vast area in the southwestern, western and portions at the center are highly suitable for rice and diversified crops. The coastal areas are favorable for permanent crops while those in the northern and south eastern have a slope ranging from steeply sloping to mountainous and are therefore suitable for grasslands and forest.
Table V-B-4
LAND CAPABILITY CLASSES, CHARACTERISTICS AND AREA COVERAGE Misamis Oriental Basins
Description
Good cropland. It is highly suited to paddy rice production which requires simple but good farm management practices. Soils in this class are adopted to almost any crop common in the area.
Moderately good cropland. Soils in this class is suited for cultivation of diversified crops. It has some slight limitations which may include effects of gentle slopes. Moderate susceptibility to erosion and slight salinity.
Fairly good cropland. Soils in this class have moderate restriction that limits the choice of crops. However, when used for cultivation of crops, it requires careful management and complex conservation practices.
This type of land have severe limitations which include among others steep slopes severe susceptibility to erosion and shallow soils that limit its use largely to pasture.
Very steep land, excessively erodes, shallow, rough and dry for cultivation, hence it is best suited for forest.
This type of land is wet most of the time. It cannot be economically drained. It is best suited to fishpond and wildlife preservation.
TOTAL
48
Area (Sq. Km.)
472
866
1047
3894
2450
21
8,750
Percentage %
5
10
12
45
28
100%

Class
2
3
4
B.5 Soil Erosion Susceptibility
Soil erosion is defined as the process of soil detachment and transportation either by water or by wind. This condition is brought about by several factors such as the slope of the land, vegetation intensity of rainfall and farm management practices. It has presently become a major concern in development especially in terms of agriculture, water resources development and land use management in general.
Erosion classes are based on the soil survey report and maps prepared by the Bureau of Soils and are presented in Table V-B-5 and Figure V-B-5.
Based from the map and data available, the western, south eastern part and the areas where Cagayan and Tagoloan River Basins can be found are very susceptible to erosion and it covers 20.8% of total land area, while those which are not susceptible cover 29.1 % and can be commonly seen at the southern part of Camiguin. At the northern, southeastern tip and somewhere at the southwestern part of the basins, a vast area in the southern part is moderately susceptible to erosion.
Table V-B-5
EROSION CLASS, DESCRIPTION AND AREA COVERAGE Misamis Oriental Basins
Description
Not susceptible to erosion
Moderately Susceptible to erosion
Susceptible to erosion
Very susceptible to erosion
TOTAL .............. .
B.6 Land Use
B.6.1 existing land use
Area (Sq. Km.)
2546
1313
3071
1820
8750
Percent (%)
29
15
35
21
100%
The land use covers which dominate the Misamis Oriental Basins are the pasture/grasslands and forest lands. Forest lands cover the interior of the northern, western, southern and center part of Camiguin island while areas whose soils were developed from hard igneous rock are commonly pasture/grasslands. Coconuts cover most of the coastal areas of the basin. Pineapple and corn are grown in the basin and are commonly cultivated in the municipalities of Manolo Fortich Sumilao and Libona. A small area of wetland can be found in
' the municipality of Carmen and at the southeastern and northern part of Camiguin.
Present land use distribution and areal extent are presented in Table V-B-6 and Figure V-B-6.
49

Table V-B-6
EXISTING LAND USE PATTERN AND AREA COVERAGE Misamis Oriental Basins
Area (Sq. Km.)
Percentage
General Land Use
Riceland
Temporary Crops (Pineapple, corn)
Permanent Crops (Coconut)
Pasture/Grasslands
Forest
Wetlands (Fishponds, Mangrove etc.)
B.6.2 special land use
322
787
873
3,417
3,330
21
8,750
B.6.2.1 natural historical attractions/ national parks
(%)
4
9
10
39
38.0
100%
The basin is bestowed with natural scenic attractions such as caves, white beaches, mountain ranges, springs, waterfalls and other sites of aesthetic/cultural significance.
The municipality of Carmen is known for its white sandy beaches and it is where vinapor cave, a grotto like cave can be seen. Like Carmen, the municipality of Buenavista is endowed with sandy beach with privately owned huts around it.
Palaopao mountain is famous for its huge caves which can be seen in the municipality of Sumilao. One of the caves that perched on the white side of the mountain contains materials like tables and sewing machines made of stone. Another cave which was named after the mountain was used as the burial ground for the natives of Sumilao.
lnitao National Forest Park is located at the foot of a mountain. Its farm caves form part of its major attraction, one of which is the abode of the unique, split nose bats said to be the only kind in the Philippines. Another is the Mt. Malindang National Forest. It is a virgin forest and known to be the home of Philippine eagle.
Other interesting sites are the following: Macahambus cave, Huluga cave, Kitanglad mountain range, friendship island, Lapinig Island, the mountain municipality or claveria and others.
B.6.2.2 forest reserves
The Bureau of forest development has identified several forest reserves. A number of them are located within the basin with an aggregate area of
50

88,522.4. They are enumerated in Table V-B-7. Its approximate locations are shown in Figure V-B-7.
Table V-B-7 IDENTIFIED FOREST RESERVES
Misa.mis Oriental Basins
1. Malisbilisan Watershed Forest Reserves 2. Mt. Paiyak Forest Reserve 3. Cagayan Forest Reserve 4. Libertad Spring Forest Reserve 5. lnitao.Forest Reserve 6. Ayo Matigol Forest Reserve 7. Magobo-Tagabola Forest Reserve 8. Punta Diwata Forest Reserve 9. Lianga Hinatuan Forest Reserve
10. Mahaganao Forest Reserve 11. Mahaganao Forest Reserve 12. Central lmpasog-ung Forest Reserve
Areas in Hectares
1,182 6,482
4.4 52 57
20,326 1,132 1,248
20,335 106
6,722 30,876
TOTAL ...... 88,522.4
B.6.3 proposed land use
Based from the land capability analysis, the basin has approximately 6279 sq. km of potential agricultural area, comprising almost 71.8 per cent of the basin. The rest of the areas are recommended for forest use and wetlands.
Approximately 10% of forest lands exhibiting better potentials shall be converted into agricultural area and should be devoted to land uses such as rice, permanent crops, temporary crops and pasture/grasslands.
The area for grasslands shall increase by approximately 5.4% while that of rice by 17%, permanent crops 2%, and 9% for temporary crops. Wetland areas should be developed and rationally exploited to augment commercial catch from the water bodies surrounding the Misamis Oriental Basins.
Close to 7.5 per cent of the basins' total agricultural land is highly recommended for rice, while 13.8% are for temporary crops and 16.67 are for permanent crops.
The grasslands/pasture lands will cover a vast area of 44.5% of the total basin area and 62 per cent of the total agricultural area.
51

8°45'
Lugait
8°15'
52
--- PROVINCIAL BOUNDARY ---MAJOR BASIN BOUNDARY - ·-MINOR BASIN BOUNDARY ~RIVER, CREEK
@ PROV! NCIAL CAPITAL e CHARTERED CITY o MUNICIPALITY
~LEVEL TO NEARLY LEVEL WITH SLOPE ~RANG! NG FROM C>-3% ~GENTLY SLOPING AND GENTLY UNDULATING ~W1TH SLOPE RANGING FROM 3-8%
lllilllllJ~zg0~~+.~\r ~~T~~~~:EN;?A~~~~~~~;;{ ~STEEPLY SLOPING ROLLING AND UNDULATING ~WITH SLOPE RANGING FROM 15-25% l.'ln.'!ml.STEEPLY SLOPING TO HILLY AND MOUNTAINOUS -WITH SLOPE RANGING FROM 25% AND OVER
Figure V-B-1 GENERAL SLOPES
MISAMIS ORIENTAL BASINS SCALE IN Kl LOMETER ,_., fiM"""'I ... .. IM"W( 5 0 5 10 15 20 25 30KMS
125°00· 125°15'

124°30· 124°45'
8°45'
8°15'
LEGEND:
0 ~~CENT
800'~ nm ~U~.f ENE TO QUATERNARY~l\ll!ll\llillll1~~~Q:'iij
~PLIOCENE TO QUATl<RNARY (QV)
UQ OLIGOCENE TO MIOCENE (Nil
[[[[O OLIGOCENE TO MIOCENE (N 1 SJ
l!ml'Jl!lf UPPER MIOCENE TO PLIOCENE 1°45·-
~ PLIOCENE TO PLEISTOCENE (N3SJ
~ PLIOCENE TO PLEISTOCENE (N~L)
~CRETACEOUS-PALEOGENE
124°15' 124°30' 124°45'
53
~PRE- CRETACEOUS
~ CRETACEOUS· PALEOGENE
••-• REGIONAL BOUNDARY -·-MAJOR BASIN BOUNDARY
-·- MINOR BASIN BOUNDARY --- PROVINCIAL BOUNOARY ~RIVER, CREEK
() PROVINCIAL CAPITAL e CHARTERED CITY
MUNICIPALITY 0
Figure V-B-2 GEOLOGIC FORMATION
MISAMIS ORIENTAL BASINS SCALE IN KILOMETER
FM"! ,_...,,.- - FMi 5 0 5 10 15 20 25 30KMS
125°15'
a0 30'.

s0 oo·
124°15' 124°30'
LEGEND:
- ~~ltGv~!-rEoLEO:oEs~isROM RECENT
al ~~1C-Jv~~'L'.Eh,o.f~~ FROM OLDER
124°45'
IlIII1IIIIIIII ~9t16~ ~~Wthi~~b'~f~bt>~ELOPED
~ ;~1~~ ~~~~~:ND AREAS DEVELOPED
mmJ n\J~ ~~~R~';1_f'N~RJift1~l';~t,~~E8F CALCAREOUS SHALE AND SANDSTONE
124°30' 124°45'
54
\.OCAT io• Mitri
~SOILS DEVELOPED FROM SANDSTONE
~~~ti~~~ ~~:tf:~l~NOUS ---- REGIONAL BOUNDARY -··-MAJOR BASIN BOUNDARY -·-MINOR BASIN BOUNDARY --- PROVINCIAL BOUNDARY
~RIVER, CREEK ~ PROVINCIAL CAPITAL e CHARTERED CITY 0 "1UNICIPALITV
Figure V-B-3 MAJOR GROUPS OF SOILS
MISAMIS ORIENTAL BASINS SCALE IN KILOMETER FM-1 FBI'. i;;;;;;---i 5 0 5 10 15 20 25
125°00· 125°15'
I 30KMS

124°15'
8°45'
.8°30'
124°15'
124°30' 124°45'
LEGEND:
- GOOD CROPLAND
~MODERATELY GOOD CROPLAND
lllilJll FAIRLY GOOD cnOPLAND
lll!!I: AREAS SUITABLE FOR PASTURE
55
125°00·
LOCATION MA#
~ AREAS THAT SHOULD BE PERMANENTLY ~ COVERED WITH FOREST
~ AREAS SUITABLE FOR AQUA-CULTURE
---- REGIONAL BOUNDARY -··- MAJOR BASIN BOUNDARY -·- MINOR BASIN BOUNDARY --- PROVINCIAL BOUNDARY ~ RIVER, CREEK
() PROVINCIAL CAPITAL • .CHARTERED CITY 0 MUNICIPALITY
Figure V-B-4 LAND CAPABILITY
MISAMIS ORIENTAL BASINS SCALE IN KILOMETER jMMMj r-or-iw---i JMiiMiil 5 0 5 10 15 20 25 30KMS
125°15'

124°15' 124°30'
•"""""~~'""" Cata rm
uinisiliban
8°45'
ALUBIJID RB
Lugait
LEGEND: ---~REGIONAL BOUNDARY
-·•-.MAJOR BASINBOUNDARY~~~~515~~ -·-MINOR BASIN BOUNDARY' --- PROVINCIAL BOUNDARY ~RIVER, CREEK
• PROVINCIAL CAPITAL/CHARTERED CITY O MUNICIPALITY
~ NOT SUSCEPTIBLE ~TOEROSION
ma ~gig~~~~J~ Y SUSCEPTIBLE
mJlsuscEPTIBLE TO EROSION
~VERY SUSCEPTIBLE ~TO EROSION
124°15' 124°30' 124°45'
56
125°00'
LOCA1' IO• MAI'
Figure V-B-5 SOIL EROSION SUSCEPTIBILITY
MISAMIS ORIENTAL BASINS SCALE IN KILOMETER
I I ~ ,..._r--i 5 0 5 10 15 20 25
125°15·
I 30KMS
8°15'·

124°15'
Libert ad
s0 15'
124°15'
124°30'
ALUBIJID RB
LEGEND:
==DIVERSIFIED CROPS
~ F.RUIT TREES
124°45'
124°45'
57
12s0oo·
llllllillllllll GRASSLANO/SHRUBLAND
~FOREST
-WETLAND
--•• REGIONAL BOUNDARY -··-MAJOR BASIN BOUNDARY
-·- MINOR BASIN BOUNDARY --- PROVINCIAL BOUNDARY ~ RIVER, CREEK
9 PROVINCIAL CAPITAL e CHARTERED CITY or MUNICIPALITY
Figure V-B-6 EXISTING LAND USE
MISAMIS ORIENTAL BASINS SCALE IN KILOMETER JMiiiiMl~JMiiiiiill 5 0 5 10 15 20 25 30KMS
ns0 oo· 125°30"
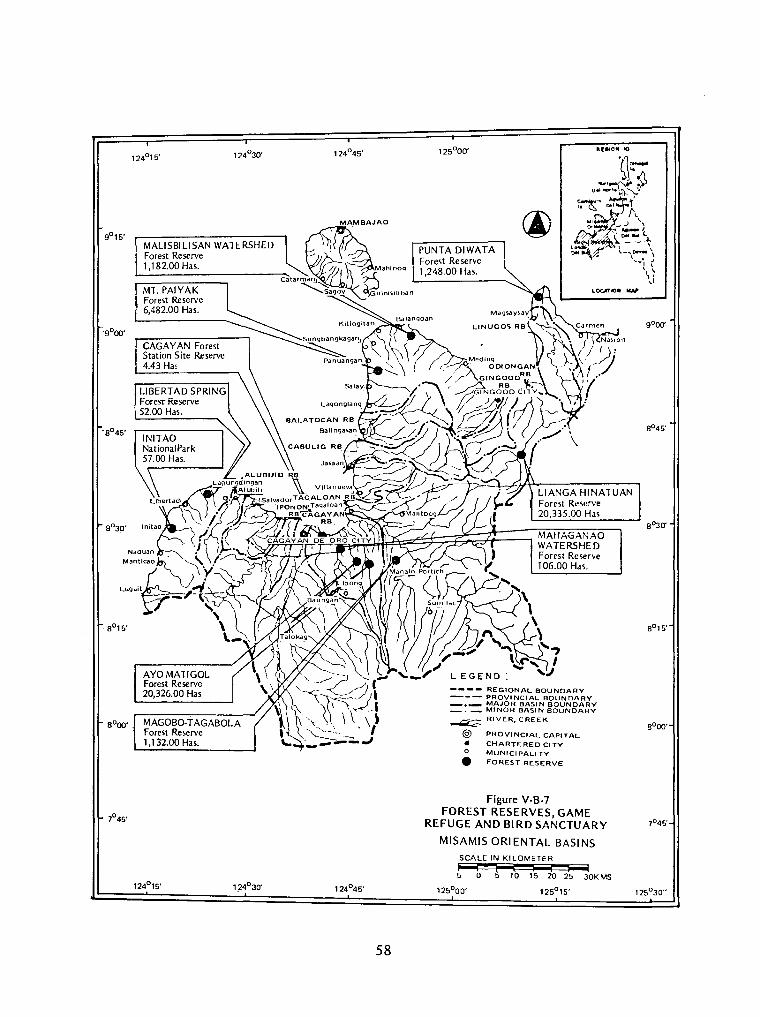
'8°45'
s0 15·
125°00· Rt~ON I()
124°15· 124045•
MALISBILISAN ~MAMBAJAO Forest Reserve WATERSHED !'I, 1, 182.00 Has. ., I
- - PUNTA DIWATA
Catarmaf"'!J....._: ~~Mahinog Forest Reserve ~"- 1,248.00 Has. Sagoy ____ __:__.:____
MAGOBO T::A-:----~ Forest Re~ GABOLA 1,132.00H.:-:.e
124015'
Guinisiliban
124045•
58
---- R -~- p~GIONAL BOUN -·- MA'3VINCIAL B DARY - · - Ml Ng:: BASIN ~;;:yoARY ~ RIVER. ~~~;Ksou~g:::~
@ PRO VINCI ~ CHARTER:~ CAPITAL
•
MUNICIPAL! CITY
FOREST TY RESERVE
F' FORES igure V-B-7 REFUGE ATN~Ei1ERVES, GAME
MISAMIS ORI RD SANCTUARY ENTAL B
SCALE IN Kl ASI NS ~ I ~OMETER
0 5' .......... -----10 15 20 .---. 125000' 25 30K MS
125015'
8°45'
8°30'
8°15'

CHAPTER VI
PRESENT AND FUTURE DEVELOPMENT AND RESOURCE NEEDS
A. Social Environment
A.1 Demographic Characteristics
A.1.1 population
The Misamis Oriental Basins which is composed of 41 municipalities had a total population of 797 ,446 in 1975. This reflected a 16 per cent increase from the 1970 figure or an annual growth rate of 3 per cent. Table Vl-A-1 summarizes the basin population characteristics while Tables D-1 and D-2 show its population distribution.
Table Vl-A-1 ACTUAL AND PROJECTED POPULATION, DENSITY AND STRUCTURE11
Misamis Oriental Basins
A c T u A L p R 0 J E c T E D
1970 I 1975 1980 I 1990 l 2000
Population 687,553 797,446 971,770 1,285,725 1,725,802
Density 86 100 121 161 216
Distribution
Urban 146,667 159,381 200,674 283,109 404,894 (21.3) (19.9) (20.6) (22.0) (23.4)
Rural 540,886 638,065 771,096 1,002,616 1,320,908 (78.6) (80.0) (79.3) (77.9) (76.5)
1/ Refer to Appendix E for the breakdown of figures. Figures in parenthesis refer to percent share.
A.1.2 population density
The average population density stood at 100 persons per square kilometer. Of the municipalities comprising the basin, the most densely populated areas were Cagayan de Oro City (400), Lugait (390), Kinogitan (304) and Laguindangan (301 ). The least densely populated municipalities were recorded in Malitbog (22), Talakag (24) and Claveria (26).
A.1.3 urban-rural population structure
The basin area was characterized by a highly rural population. In 1975, some 80 per cent of the populace resided in the rural areas (Table Vl-A-1 ).
A.1.4 age-sex structure, dependency ratio
The population in the area was relatively young with 46 per cent belonging
59

to age bracket 1-14 years. The working age population (15-64) comprised 52 per cent of the basin population while those with ages about 65 years represented only 2 per cent.
Comparing the aggregate population under the young and the older age group with the productive individuals, the computed dependency ratio was 0.93.
Sex structure in the basin showed a 51 per cent - 49 per cent male-female distribution.
A.1.5 household/family size
The total number of households in 1975, reached 127, 137 while the number of families was higher with 135,245, placing the average number of persons per household at 6.3 and the average family size at 5.9.
By the year 2000, the basin area is. expected to have about 275 ,000 households and 293,000 families.
A.1.6 demographic projections
Using the population projection figures (medium assumption) of the NCSO, the annual growth rate of the basin was placed at 3.1 per cent for the period 1975-2000. In absolute terms, the population is expected to have increased from 797,446 in 1975 to some 1,726,000 in 25 years. The urban population could reach some 405,000 while the rural population about 1,321,000.
The present density of 100 persons per square kilometer in 1975 will likewise increase to some 216 persons per square kilometer in the year 2000.
A.2 Income
A.2.1 income levels
Based on 1975 NCSO preliminary hand tabulations, the estimated total family income of Misamis Oriental Basins was ~800 million with only 23.5 per cent or "r188 million accounted for by the urban sector (Table Vl-A-2).
Table Vl-A-2 ESTIMATED TOTAL INCOME AND PER CAPITA INCOME CLASSIFIED
INTO URBAN AND RURAL, 1975 Misamis Oriental Basins
Total Family Income ('P'M)
Urban
Rural
Per Capita Income ('P')
Urban
Rural 11 NCSO Preliminary Tabulations, 1975.
60
Basin1'
800.3
187.6
612.7
1,004
1, 177
960

A.2.2 per capita income
The average family income in the basin was estimated at 'P'5,917 with the basin per capita placed at f'l ,004. The urban per capita income figure (:Pl ,777) was larger than the rural figure ("P"960).
A.2.3 income profiles
The income distribution pattern in the area showed that 33 per cent of the families belonged to the income stratum with an annual income below ¥2,000. Altogether, these families contributed 5 per cent to the total basin income. On the other hand, the middle income group (those receiving 'P'2,000 to P-10,000) compromised 55 per cent and contributed 41 per cent to the total income; while the highest income group which accounted for 12 per cent of all families earned 55 per cent of the basins' total income (Table Vl-A-3).
Table Vl-A-3 INCOME PROFILE BASIN
Misamis Oriental Basins
B A S I N1 I
Percent of Families
Total I Urban I
% Share of Total Income
Rural
Under :P2,000 32.5 21.5 35.3 2.6
~2,000 -:P6,000 41.5 45.2. 40.6 24.0
f"6,000 - :Pl 0,000 13.7 17.7 12.6 16.6.
:Pl 0,000 - Over 12.3 15.6 11.5 54.6
1 / Estimates
Based on data from the NCSO Household Surveys Division (Provincial tabulations)
A.2.4 farm income
In 1971, there were 4 7 ,082 farms in the basin which produced crops valued at :P591,437 million. Average income per farm was estimated to be :P12,562 (Table Vl-A-4).
Table Vl-A-4 FARM INCOME STATISTICS, 1971
Misamis Oriental Basins
Farms
Value of Crops (~M)
Average Income/Farm (~)
Source: Census of Agriculture, 1971
61
Basin
47,082
591,437
12,561.8

A.3 Labor Force and Employment Structure
A.3 .1 labor force
The basin's working age population (15-64 years) was placed .at 412,6?0 which was 52 per cent of the total basin population. The economically active population accounted for 53 per cent of 219:400 whil.e 4 7 per cent or 193,200 were economically inactive. Of the economically active, 96 per cent were employed while 4 per cent were unemployed (Table Vl-A-5).
POTENTIAL
Table Vl-A-5 LABOR FORCE PROJECTIONS
Misamis Oriental Basins
ECONOMICALLY ACTIVE ECONOMICALLY YEAR LABOR INACTIVE
FORCE Number % Employed % Unemployed % Number %
1975 412,600 219,400 53.2 209,900 95.7 9,400 4.3 193 ,200 46.8
1980 502,400 270,300 53.8 261,400 96.7 8,900 3.3 232, 100 46.2
1990 664,700 358,900 54.9 351,800 98.0 7,200 2.0 305,800 46.0
2000 892,200 499,700 56.0 489,700 98.0 10,000 2.0 392,600 44.0
Based on data from the NCSO Integrated Census of the Population and its Economic Activities Report.
A.3.2 employment
Of the total employed force in the basin, 60 per cent were in agriculture, 11 per cent were in industry and 29 per cent were in the tertiary sector. Agri· cultural workers in the basin totalled 126,400 while industrial and tertiary workers amounted to 22,800 and 60,700 respectively (Table Vl-A-6).
A.3.3 employment projections
The basins' potential labor force (15-64) was derived by applying the 1975 working age population proportion to the respective population projections. The results are shown in Table Vl-A-5.
If development programs proposed for the area will be implemented within the next 25 years, the increase in employment levels due to these developments will be reflected by an upward adjustment in labor force participation rates and employment ratios. The projected labor force participation rates and their corresponding absolute figures are also shown in Table Vl-A-5.
Assuming an increase of 1 per cent in the employment ratio every five years, the employed population would reach 490,000 in the year 2000. Unemployment levels correspondingly will be reduced from 4 per cent in 1975 to 2 per cent in the year 2000.
A.4 Domestic and Municipal Water Use
In this study, the 1975 average per capita water use of 0.115 cubic meters and 0.025 cubic meters were used for urban and rural daily domestic consumption
62

respectively. Per capita requirements for year 2000 was projected to reach 0.190 cubic meters for urban users and 0.040 cubic meters for the rural users.
The basin domestic requirements were estimated to be about 46,306 CMD in 1980, 76,968 CMD in 1990 and129,766 CMD in the year 2000. The shares of urban sector were 55, 57 and 59 respectively (Table Vl-A-7).
Table Vl-A-6 EMPLOYMENT DISTRIBUTION
BY INDUSTRY GROUP Misamis Oriental Basins
Employment
1975 % I 2000
Agriculture 126,400 60.1 176,300
Industry 22,800 10.9 129,800
Mining 307 .1 4,500
Manufacturing 16,400 7.8 100,200
Electricity 362 .2 3,000
Construction 5,700 2.8 22,100
Services 60,700 29.0 183,600
Commerce 17,400 8.3 75,300
Transportation 9,000 4.3 20,200
Service & Others 34,400 16.4 88,100
TOTAL 209,900 100 489,700
Based on data from the NCSO 1975 Integrated Census of the Population and its Economic Activities report.
Table Vl-A-7 PROJECTED WATER WITHDRAWALS FOR DOMESTIC USE
(Cubic Meters Per Day}
Urban
Rural
Total
% of Urban Intake
Misamis Oriental Basins
19so I 1990
25,486
20,820
46,306
55.0
63
43,882
33,086
76,968
57.0
2000
76,930
52,836
129,766
59.2
%
36.0
26.5 .9
20.5
.6
4.5
37.5
15.4
4.1
18
100

A.5 Water Supply Facilities
A.5.1 water supply resources
I 1971 · d water systems were the source of water for 34 per cent n , pipe . Th of all basin households. The next major source were spring sy~tems. e re-maining households were distributed as follows: pumps (17%), open wells (15%), artesian wells (6%), lakes and streams (3%), and rainwater (1 %). (Table Yl-A-8).
Table Vl-A-8 NUMBER OF HOUSEHOLDS BY SOURCE OF WATER
1970
Misamis Oriental Basins
Source
Piped Water
Artesian Well
Pump
Open Well
Spring
Rain
Lakes & Streams
Total Number of Households
Source: NCSO 1970 Census of Population and Housing (Refer to Appendix E for breakdown of figures)
Number
37,108
6,652
19,066
16,747
26,949
620
3,412
110,554
A.5.2 water supply infrastructures
% Served
33.7
6.0
17.2
15.1
24.3
.6
3.1
100.0
The Rural Waterworks Development Corporation (RWDC) has recognized three (3) levels of service namely: Level I, II and Ill. Level I service which is intended for rural centers is most basic, and essentially draws its potentiality from the sources such as open wells, artesian wells, and springs with no distribution system. Generally, it is designed to serve at least an average of 50 households. Level 11 service is also intended for rural centers where houses are clustered densely enough to justify a simple common pipe distribution system with public standpipes and this system services an average of 100 households. On the other hand, Level 111 service refers to a piped system with individual house connections. Unlike Levels I and 11, it is generally suited for densely populated urban areas.
Based on the 1975 survey made by the Ministry of Public Works and Highways (MPWH), municipalities belonging to this river basin depend highly on existing public wells (Level I} as a means of providing its domestic water needs. There are 482 operational and 240 non-operational existing wells. The wells serve an estimated population of 227,578. Existence of Level 11 system is indeterminate at this stage since MPWH has no available data, thus no exact number of existing Level II service is acquired.
64

There are three level 111 service3' existing within the basin namely: (1) Malaybalay Water District at Bukidnon which has a maximum capacity of 0.91 MCM/year and essentially serving an estimated 16,200 populace; (2) Gingoog City Water District at Misamis Oriental with a maximum capacity of 0.476 MCM/year and is serving 16,500 populace, and (3) Cagayan de Oro Water District also at Misamis Oriental with a maximum capacity of 3.36 MCM/ year which is good enough to serve an estimated 35,000 populace.
Proposed water supply facilities41 in the year 2000 is tabulated in Table Vl-A-9. An additional 3,147 units for Level I service will be needed assuming that the average household size of the basin is 6.3; 655 units for Level II service assuming an additional of one (1) unit per 100 number of household, and 35 units for Level 111 service assuming an additional of one (1) unit for every municipality which has a populace greater than 1,000.
A.6 Sewerage and Waste Disposal Facilities.
The basin had no centralized sewerage waste disposal facilities. As per 1970 NCSO report, many of the basin households had self-supplied systems. The survey showed that 24 per cent used the antipolo system, 20 per cent used the open pit type, 17 per cent used flush/water sealed facilities and 1 per cent used public toilets. Approximately 39 per cent of the total households had no access to sanitary toilet facilities.
B. Economic Sector
Gross Domestic Product (GDP) and sectoral Gross Value Added (GVA) are important aggregates in the study of the economic structure predominant in the basin. These data series provide indicators as to the intensity of economic activity in an area and determinants of growth and development which shall form the basis for projecting characteristics at certain period.
The summary values for the basin were drawn from provincial and regional data because of the non-availability of the data in the municipal level. Employment and income participation ratios were used as basic parameters. Regional assumptions and/or regional growth patterns were used as forecast tools. These projection of economic structures were made to serve future requirements of the area for water
and land resources development. The Gross Domestic Product refers to the sum total of goods and services
produced by a certain economy in a year. It is the summation of gross outputs of all economic sectors consisting of primary industries (agriculture, fishery, and forestry), secondary (mining, manufacturing, utilities, and construction), and tertiary on residentiary activities (commerce, transport, and services). Gross Value Added (GVA) or the output estimate were calculated as the product of employment and
labor productivity statistics.
3/ National Water Resources Council (NWRCl Survey - 1978.
4/ Computation based on the existing data only.
65

Table Vl-A-9 INVENTORY OF WATER SUPPLY FACILITIES
Misamis Oriental Basins
Population Projected Addt'I Population Required PROVINCE/MUNICIPALITIES Served Population To be Served Addt'I Facilities
{1975) (2000) (2000) Level
Rural I Urban Rural ( Urban Rural I Urban I I II ! Ill
AGUSAN DEL NORTE 1. Nasipit 5250 55592 22674 50342 160 19 2. Carmen 4000 34337 9717 30337 96 14 3. Buena Vista 8500 40415 22269 31915 103 27
BUKIDNON
1. Baungon 7180 15329 7693 8149 26 12 2. lmpasugong 4743 21216 16473 52 10 3. Li bona 14398 35963 21565 68 21 4. Manolo Fortich 12299 63273 5264 50974 162 37 5. Sumilao 3775 16188 4049 12413 39 6 6. Talakag 9633 31321 6478 21688 69 18
CAMIGUIN
1. Mambajao 3250 29944 13766 26694 85 13 2. Mahinog 1250 14671 5264 13421 43 7 3. Guinsiliban 2500 12564 10064 32 4 4. Sagay 2250 11272 6478 9022 29 6 5. Catarman 5250 19893 5264 14643 46 11
MISAMIS ORIENTAL 1. Manticao 3250 22030 7693 18780 60 16 1 2. Naawan 4750 18273 3644 13523 43 10 1 3. Lu gait 2000 8583 8908 6583 21 7 1 4. lnitao 9000 25130 10527 16130 51 16 1 5. Claveria 1250 17425 8908 16175 51 19 1 6. Gitagum 5000 13839 8839 28 10 1 7. Libertad 4000 9921 6478 5921 19 3 1 8. Kinoguitan 1250 13034 3239 1178.4 37 3 1 9. Sugbongcogon 500 5133 4049 4633 15 1 10. Salay 1000 23125 10527 22125 70 10 1 11. Balingoan 1500 3239 5264 1739 6 3 1 12. Medina 2000 21104 10527 19104 61 12 1 13. Talisayan 6000 11594 7693 5594 18 9 1 14. Magsaysay 4000 56597 4454 52597 167 22 1 15. Lagonglong 9500 14680 5669 5180 16 10 1 16. Balingasag 8000 41545 14576 33545 106 31 1 17. Opol 1750 22187 3644 20437 65 13 1 18. Alubijid 5500 23795 5669 18295 58 12 1 19. El Salvador 8750 29237 7288 20487 65 17 1 20. Cagayan de Oro City 58000 35000* 328379 93531 270379 58531 802 174 1 21 Gingoog City 6300 16500* 131813 33204 125513 16704 378 53 1
TOTAL 227578 51500 1242641 364408 1015063 75235 3147 655 35 • Netiolllll Water Resources Council (NWRC) Surwy - 1978
••No data on level II service is available.
Note: ~o esti".'ates are ~ilable as to the number of population served (1980) for the Municipalities of Malit!x>g (an Bukadnon), Bmuangan, Jasaan, laguindingan, Tagoloan and Villanueva (in Misamis Oriental}.
66

Base statistics for this study were obtained from the Northern Mindanao (Region X) Five and Ten Year Development Plant for the year 1978-1982, prepared by the NEDA-NRD. Also used were the NCSO employment census in 1975, and industrial establishment census for 1974. The projection indices were taken from NEDA Regional Planning Studies, RDS industry reports and NCSO population projection.
B.1 General Economic Structure
B.1 .1 gross domestic product and employment
The GDP of Misamis Oriental Basins figured at P:l ,987.3 M in 1975. Agriculture gave the largest contribution with 54 per cent followed by services with 36 per cent and the remaining 16 per cent was from industry.
In terms of employment, the basin absorbed 209,944 workers. Of this figure 60 per cent were engaged in primary industries, 29 per cent were engaged in the tertiary industries and 11 per cent were engaged in the secondary industries.
Due to the unavailability of data on labor productivity rates on the basin level, the regional computed labor productivity rates were used to arrive at sectoral value added of basin GDP. The highest average labor productivity rate in 1975 was registered by Industry at :Pl 4,012 followed by Services at P'l 1,877 and Agriculture with the lowest rate at P:8,424.
On the assumption that the labor productivity growth rates computed for the entire region represent all component basins, a long-range projection of labor/output ratios were computed up to year 2000. The labor productivity in Agriculture will grow 2.7 times in 25 years, 5.1 times in Industry and 4.1 times in Services. The resulting values were multi plied with the sectoral employment figures for the projected sectoral GVA's of the basin.
Analysis of the projections show that while employment will increase by 134 per cent over 25 years or 3.4 per cent annually, GVA will increase by 1,027 per cent within the same period or 10 per cent annually. A considerable shift will occur in both employment and GVA from agriculture to industry at the same time that increases in services would peak up from the expansion in industry.
Employment share of agriculture will be reduced to 36 per cent of basins' total while those in secondary by 26 per cent and those in the tertiary industries by 3 7 percent. Total output from Agriculture will constitute 18 per cent of the basins' total while Industry and Services will shoot up to 42 to 40 per cent respectively. In absolute terms, output in the primary sector will have an increased of 3.8 times, the secondary sector 29 times and the tertiary sector 12.4 times.
With the total basin population growing yearly at an average rate of 3 per cent during the 25-Year Plan Period, per capita GDP (at 1980 prices) which stood at 'Pl,208 in 1975 will reach 'P'5,612 by year 2000. This represents an annual growth rate of 3.6 per cent. The level of per capita GDP in year 2000 will be 4.6 times that of 1975.
Refer to Table Vl-B-1 and Figure Vl-B-1 for statistics of employment and
output.
67

O'I 00
-
GVA fftM)
9000 6000
Figure Vl-B-1 GVA-EMPLOYMENT DISTRIBUTION BY MAJOR SECTOR
Misamis Oriental Basins
EMPLOYMENT ('000}
-
1975 AGRICULTURE
2000
1975 INDUSTRY
2000
1975 SERVICES
2000
-3000 0 0 50 100 150
. ---- -- - ---
200

Table Vl-B-1 GROSS DOMESTIC PRODUCT AND GROSS VALUE ADDED
BY INDUSTRY GROUP, 1975 & 2000 (In PM at 1977 Prices) Misamis Oriental Basins
1975 2000 Agriculture 1,065 4,002 Industry 320 9,325
Mining 6 304 Manufacturing 229 8,242 Electricity 3 44 Construction 82 856
Services 722 8,971 Commerce 48 4,103 Transportation 436 839 Services 216 3,291
TOTAL (GDP) 1,987 22,404
Source: NEDA, NCSO.
B.1.2 sectoral highlights
The succeeding discussions will feature mainly the sectoral preferences and industrial characteristics significant for economic analysis.
B.1.2.1 agriculture, fishery and forestry
The primary sector (agriculture, forestry and fisheries) registered an employment of about 60 per cent of the basins' labor pool in 1975 and contributed some 54 per cent of the basins' output. In terms of crop production, palay and corn accounted for 51 per cent of the temporary crops in 1976. In the permanent crop group, coffee and fruits proved to be dominant registering 93 per cent of total. Total value of production for all crops in the basin was P591,437 million.
B.1.2.2 industry
In 1975, this sector contributed 16 per cent of the Gross Domestic Product and absorbed 11 per cent of the total workers which is the lowest among others in terms of employment. The GVA position in the 25 year period, however, is expected to change as sectoral improvements will boost its overall expansion. Industrial GVA contribution is projected to have the highest share in year 2000 contributing 42 per cent of GDP.
The manufacturing sector outstands all other industries in 1975 claiming 76 per cent of industrial output. The sector is expected to maintain this position
69
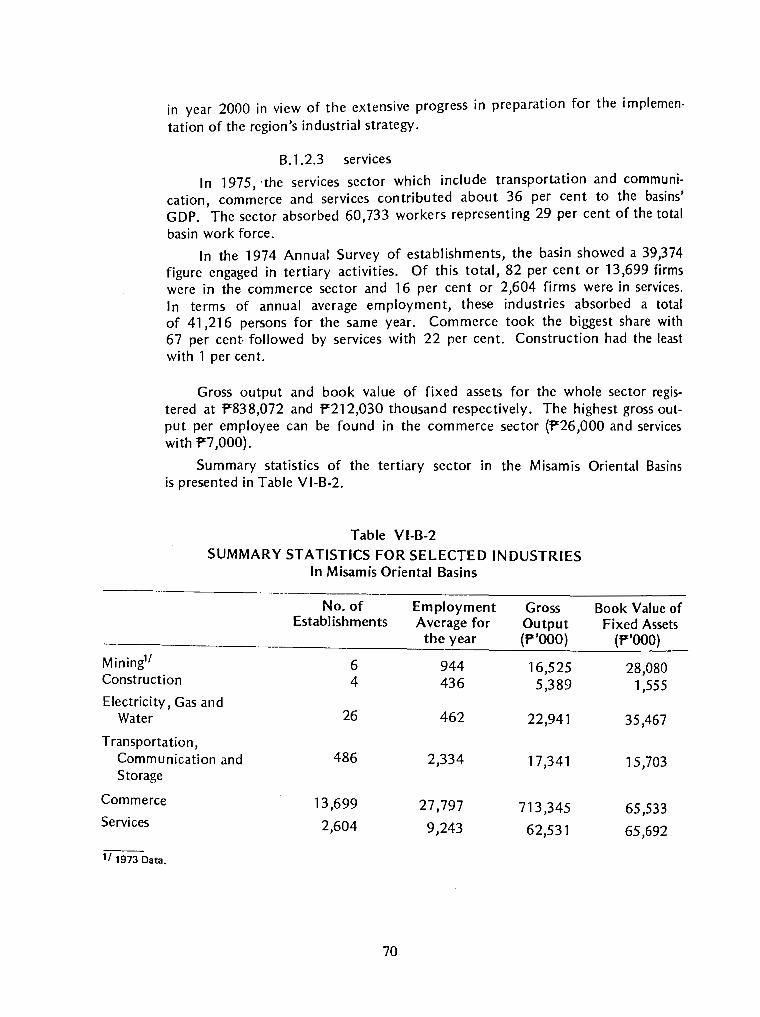
Mining11
in year 2000 in view of the extensive progress in preparation for the implemen
tation of the region's industrial strategy.
B.1.2.3 services
In 1975 ·the services sector which include transportation and communi-' cation, commerce and services contributed about 36 per cent to the basins'
GDP. The sector absorbed 60,733 workers representing 29 per cent of the total basin work force.
In the 1974 Annual Survey of establishments, the basin showed a 39,374 figure engaged in tertiary activities. Of this total, 82 per cent or 13,699 firms were in the commerce sector and 16 per cent or 2,604 firms were in services. In terms of annual average employment, these industries absorbed a total of 41,216 persons for the same year. Commerce took the biggest share with 67 per cent followed by services with 22 per cent. Construction had the least with 1 per cent.
Gross output and book value of fixed assets for the whole sector registered at :P838,072 and :P212,030 thousand respectively. The highest gross output per employee can be found in the commerce sector (:P26,000 and services with :P7,000).
Summary statistics of the tertiary sector in the Misamis Oriental Basins is presented in Table Vl-B-2.
Table Vl-B-2
SUMMARY STATISTICS FOR SELECTED INDUSTRIES In Misamis Oriental Basins
No. of Employment Gross Establishments Average for Output
the year (:P'OOO)
6 944
Book Value of Fixed Assets
(:P'OOO)
16,525 28,080 Construction 4 436 5,389 1,555 Electricity, Gas and
Water 26 462 22,941 35,467
Transportation, Communication and 486 Storage
2,334 17,341 15,703
Commerce 13,699 27,797 713,345 65,533 Services 2,604 9,243 62,531 65,692
1 / 1973 Data.
70

B.2 Agriculture
B.2.1 general
The assessment of the current agricultural pattern and future demands considered conditions conforming to development in the 26 municipalities which will be influenced by the basin development. This study area is considered the economic area which will form the base of our appraisal for productivity and performances.
B.2.2 agricultural area distribution
The agricultural area of the 26 municipalities in the Misamis Oriental Basins was estimated at 216,464 hectares in 1971 (NCSO, Census of Agriculture, 1971 ). Of this total, 40% (86,932 hectares) were classified as planted to permanent crops; 26% (56,613 hectares) as planted to temporary crops; 15% (32,155 hectares) as lands lying idle; 10% (21,641 hectares) are under permanent meadows and pastures; 6% (12,230 hectares) as forest growth and 3% (6,893 hectares) as all other lands.
Figure Vl-B-2 shows the agricultural area distribution in the basin.
B.2.3 farm features
The Misamis Oriental Basins' economic area had a total of some 47 ,331 farms. Categorized by farm size, 77% of these were less than 5 hectares each. The rest having 5 hectares comprised 23%.
By tenure of farm operator, 72% were operated by full owners, 19% by tenants, 6% by part owners, 0.1 % by managers and 3% by other forms of tenure.
B.2.4 land ownership and distribution pattern
Meanwhile, the land ownership and distribution pattern for all crops found in the basin followed a trend similar to that of the income measures. The fragmented character of the basin is reflected in the size-of-land-distribution with the majority of households (76%) owning the smaller parcels of land (1 to 4.9 hectares), comprising 42% of total farm area while less than 1% of families owning the bigger land parcels (25 hectares and above) comprising 21 % of total croplands. (See Table Vl-B-3).
The actual size of land area being farmed by the household determines the increase in land productivity in the basin. This is due to the level of technology and manner of cultivation being applied to the farm areas. Thus, improved water control and management and the provision of water for rice and corn lands will bring about changes in cultivation intensity. However, because land ownership and distribution for the basin indicate that smaller farm areas per household are within the higher farm-size brackets and the greater number of households per hectare are in the lower farm-size brackets, constraints can therefore be anticipated in relation to development activities (Table Vl-B-3). The concentration of land-ownership distribution is also evidenced by the Lorenz Curve for the basin indicating a ratio of 0.4348 (Figure Vl-B-3).
71

Vl <l'. lJ.J Cl:'. <l'. ~ Cl:'. <l'. LL.
LL. 0 1-z lJ.J u Cl:'. lJ.J c.. lJ.J > i== <l'. ...J :J ~ :J u
100
9 0
80
70
60
50
40
30
20
10
Figure Vl-B-2 LORENZ CURVE FOR LAND OWNERSHIP
DISTRIBUTION IN MISAMIS ORIENTAL BASINS ALL CROPS 1971
I/ I/
VJ /: I
J
/ / /'
/ /' / /
/
(.4348)
I/ / ,
v ~ i/
~ ~ ,,/ 10 20 3 0 40 50 60 70 80 90 100
CUMULATIVE PERCENT OF FAMILIES
72

-...J w
PERCENT DISTRIBUTION
COVERED WITH FOREST GROWTH (6%)
ALL OTHER LAND (3%l
PERMANENT MEADOWS and PASTURES (10%)
Source: 1971 CENSUS OF AGRICULTURE
Figure Vl-B-3 AGRICULTURAL AREA DISTRIBUTION
Misamis Oriental Basins
AGRICULTURAL LAND USE
PLANTED TO TEMPORARY CROPS
LYING IDLE
PLANTED TO PERMANENT CROPS
PERMANET MEADOWS AND PASTURE
COVE RED WI TH FOREST GROWTH
ALL OTHER LAND
0 20 40 60 80 100 120

Table Vl-B-3
VARIOUS MEASURES ON LAND-OWNERSHIP AND DISTRIBUTION BY FARM SIZE, ALL CROPS, 1971
Misamis Oriental Basins
Farm Size Mean Area Per % Distribution of Farm Area
Ratio of Farm % Distribution (Hectares) Household Household to Area of Farm Household
(Hectares)
Under 1.0 1 3 .70 8 39
27
16
1.0 2.9 2 19 .52 3.0 - 4.9 3 19 .35 5.0 - 9.9 5 19 .21
10.9 24.9 9 18 .11 7 25.9 - 49.9 16 4 .06 50.0 - over 167 18 .005
BASIN 4 100 .25 100
A precondition for income transfers in the rural areas of the basin will still therefore be highly dependent on land transfers, particularly in the foodproducing areas. Direct government investments especially for social overhead capital in water resource related infrastructure projects will not in themselves guarantee significant effects in reducing income inequalities caused by unequal land ownership distribution patterns. One important policy implication is the adjustment of water resource projects. This is because much of the productivity increases as predicted on agricultural land development and improved farm technological usage. Thus, the adjustment of water resource projects is intended to benefit those presently without the physical preconditions.
B.2.5 cropland distribution
The total cropland of the basin planted to permanent and temporary crops reached some 110,891 hectares or 56 per cent of the total agricultural lands. Permanent crops however utilized 87 ,214 hectares or 44 per cent of total croplands.
The major temporary crops included palay, corn and tobacco, all of which were planted to 106,610 hectares or 54 per cent of the total cropland. Of these palay areas of 32,236 hectares represented 30 per cent; corn areas of 72,938 hectares accounted for 68 per cent; tobacco areas of 1,436 hectares, 1 per cent; and all other temporary crop areas of 4,281 hectares including sugarcane, rootcrops and vegetables, 2 per cent.
Permanent crops accounted for about 44 per cent of the total cropland. Principal permanent crops consisted mainly of coconut and coffee.
Table Vl-8-4 shows cropland distribution, volume and value of production.
74

Table Vl-B-4
CROPLAND DISTRIBUTION, 1971
Misamis Oriental Basins
TEMPORARY CROPS Physical Area Effective Area Volume Value % (Has.) (Has.) (MT) (¥<>00) Share
Palay 32,236 41,041 42,522 21,995 4 w/ irrigation 2,306 3,585 13,240 6,975 1 w/o irrigation 29,930 33,606 29,282 15,020 3
Corn 72,938 90,382 2,842 84,632 14
Tobacco 227 234 835 62 .01
Sugarcane 1,436 1,868 568 1,321 .22
Rootcrops 3,771 49,006 19 4,549 .77
Vegetables 283 494 1 660 .11
Sub-Total 110,891 89,309 135,214
PERMANENT CROPS
Coconut 57 ,510 57,510 312 35,775 6
Coffee 4,271 4,271 1,365 398,785 67
Abaca 12,427 12,427 45 12,518 2
Fruits 13,006 13,006 3,454 9,145 2
Sub-Total 87,214 5,176 456,223 100%
Grand Total 198,105 94,485 591,437
B.2.6 production
During the crop year of 1971, the basin contributed a total agricultural receipt of about :P:569,442. Abaca was the major earner with total produce grossing :P:398,785 representing 70 per cent of the total agricultural receipts. Corn contributed another 15 per cent and coconut, 6 per cent. Palay and fruits had a combined production value of only :P:34,513 and contributed only 6 per
cent.
B.2.6.1 temporary crops
A total area of 113,367 hectares were planted to temporary crops such as palay, corn, sugarcane, tobacco, vegetables and rootcrops. On the whole, the value of production for temporary crops amounted to :P:135,214 which was 24 per cent of the area's total value of agricultural production.
P a I a y
Palay is one of the most significant crops in the basin. It is planted in an area of 34,712 hectares or 17% of the total cropland. Production in 1971
75

was 42,522 metric tons valued at ?'21,995 million, representing 48% of the total production receipts from temporary crops.
Effective crop area was 41,041 hectares utilizing a cropping intensity of 1.18. Productivity was 1.04 metric tons per hectare or 23.5 cavans/hectare
in 1971. Using the 1971 physical area for irrigated and non-irrigated lands, the
NIA cropping intensity and productivity of 1.8 and 3.45 MT/has. respectively for irrigated lands, 1.32 and 2.5 MT /ha. for non-irrigated lands, total palay production was estimated at 113,089 metric tons equivalent to 67 ,873 metric
tons of rice (with a recovery rate placed at only 60 per cent). Rice consump
tion for the basin for 1975 was placed at 78, 150 metric tons. Thus, the realized rice deficit was some 10,297 metric tons.
Demand for rice is expected to increase by 3 per cent annually over the next 25 years. Thus, for year 2000, rice requirement in the basin is expected to reach 171,372 metric tons.
Palay projections were based on several factors such as land constraints, farm technology, productivity levels as well as urban development in the basin area.
With the realized deficit of palay in 1975, the production goal for the Misamis Oriental Basins is focused on the optimization of palay cultivation in areas classified as suitable for rice. With palay area of 42,480 hectares as determined by the land suitability factors (net of areas for urban settlements), output projection was determined with the assumed changes in farm technology, irrigation facilities, cropping intensity and milling recovery. (See Table Vl-8-6 and Figure Vl-8-4 for sufficiency analysis).
Using the NIA average productivity of 4.5 metric tons/has. or 90 cavans per hectare and cropping intensity of 2 for potential lowland areas, palay output would reach 267,624 metric tons of rice. The basin can realize a surplus of 96,252 metric tons of rice (See Table Vl-8-5 and Table Vl-8-6). At 100 per cent self-sufficiency in rice, however, only some 35,481 hectares is required for cultivation in the basin or 84 per cent of the targeted riceland areas.
Table Vl-8-5 PALAY PRODUCTIVITY (Cavans/Hectares)
1975-2000
Irrigated Palay Non-Irrigated Palay
Misamis Oriental Basins
1975
69 50
76
2000
90*
%
30 20

Table Vl-B~ RICE PRODUCTION-SUFFICIENCY ANALYSIS YEAR 2000
Misamis Oriental Basins
Area (has.)
Palay Production11 (MT)
Rice Supply21
Rice Demand
Rice Surplus (Deficit)
• Potential Lowland irrigable area 1/ Palay Production = (Area) (Cl) (P)
where: irrigated
NIA Programmed Area for Irrigation
Irrigated Area
8,000
55,200
38,640 (0.77 M cavans)
171,372 (3.42 M cavans)
132,732 (2.65 M cavans)
Cl = Cropping intensit" = 2.0 P = Productivity = 3.45 Mt.Iha.
Potential lowland Irrigable Area Cl Cropping intensity = 2.0
P = Productivity = 4.5 Mt.Iha.
2/ 70% recovery rate
C o r n
Potential Lowland
Irrigable Area
42,480
382,320
267 ,624 (5.35 M cavans)
171,372 (3.42 M cavans)
96,252 (1.93 M cavans)
Self-Sufficiency
35,481
244,817
171,372 (3.42 M cavans)
171,372 (3.42 M cavans)
As of 1971, the Misamis Oriental Basins had a total of 72,938 hectares of cornlands. This area yielded a total output of 2,842 metric tons with an average productivity of 18.24 cavans (1.04 MT) per hectare which was comparatively lower than the regional average of 0.52 cavans (0.03 MT per hectare).
In 1975, assuming that area planted to corn remained constant at 1971 and cropping intensity levels and yield per hectare increased to 1.83 and 0.537 metric tons respectively, total corn supply was placed at 71,676 MT.
Corn Demand Projections
Demand for corn can be disaggregated into two purposes: human consumption and feed requirements. The inverse relationship of corn consumption with increases in income and the direct relationship of livestock and poultry meat demand with population growth over time resulted in an estimated requirement of 110,845 MT. This includes 40,729 metric tons for human consumption, 69,019 MT of animal corn requirement and an allowance of 1,097 for seeds, wastage, etc. (See Table Vl-8-7).
Land capability studies how cornlands in the basin could be expanded to as much as 80,304 hectares. With a cropping intensity of 1.9 and a productivity rate of 2.565 MT per hectare, such corn demand could easily be met by
77

Vl UJ 0::: < I-u UJ ::r: 0 z < V1 ::::> 0 :::c I-z
< UJ 0::: < 0 UJ I-< (..!)
02 0:::
47,200
45 LAND SUITABILITY 3/
42,480
30
19,041
15
1975 1980 1985 1990 1995 2000
Figure Vl-B-4 IRRIGATED PALAY AREA DEMAND vs. SUPPLY
MISAMIS ORIENTAL BASINS
l/ N.E.A. 25 YEAR IRRIGATION PROGRAM 21 M.A. BAECON DEMAND ASSUMPTIONS (LOW PRODUCTIVITY LEVEL) 31 EXCLUSIVELY FOR LOWLAND IRRIGABLE RICE AREA BASED ON LAND SUITABILITY FACTOR . (NET OF RESIDENTIAL LAND}
78

Hogs Chicken
TOTAL
utiliz_in~ only 69. per cent of the land capability area or 54,984 hectares. The remaining potential lands could either be devoted to a surplus corn production of some 123,379 MT for exports or be planted to supply deficient crops in the basin.
Table Vl-B-8 shows that present and potential corn demand supply situation in the basin.
Table Vl-B-7
FEED GRAIN REQUIREMENTS {1975-2000)
Misamis Oriental Basins
Anima111 Feedgrain Corn Animal 2' Feedgrain Corn Population Requirement Requirement
96,050 198,985
(MT) {MT)
20,171 497
6,057 149
6,200
Population Requirement Requirement
862,414 19,583,333
{MT) {MT)
181,107 48,958
54,332 14,687
69,019
1/ Actual NCS0, 1971
2/ Based on food demand See Appendix for Methodology
Table Vl-B-8
SUMMARY OF CORN DEMAND AND SUPPLY
1975 2000
Human Consumption 33,453 40,729
Animal Corn Requirement 6,200 69,019
Seed, Wastage, etc. 396 1,097
TOTAL DEMAND 40,049 110,845
Sugarcane
Sugarcane in the Misamis Oriental Basins was planted to only 229.1 hectare in 1971 and grossed some 835 MT of output, at a productivity level of 3.57 MT per hectare. For 1975, assuming there are no changes in physical area (227.1 has.) but an increase in cropping intensity (1.19) and in productivity rate to
12.236 MT /has., production reached 3 ,307 MT. At the cane-to-processed-sugar conversion rate of 1 :.045 MT51, this is roughly equivalent to 149 MT of processed sugar. Compared to the total demand for sugar of 16,499 MT, the basin presumably incurred a deficit of some 16,350, or almost 99 per cent of its sugar
requirements in that year.
5/ Nasutra Standards, 1980
79

Deficit in sugarcane production is seen to continue throughout the plan period in the basis of land constraints. Estimated areas for sugarcane production in year 2000 based on land capability factors (using the 1971 cropland distribution in the basin) will total to only 251.14 hectares. With a cropping intensity of 1.2 and using the projected yield per hectare of 46.9 MT61, total sugarcane production could reach some 14, 134 MT or 636 MT of processed sugar. This sugar supply level is about 1 per cent of the basin population's demand in year 2000 which is placed at 57,262 MT.
To meet the goal of self-sufficiency in sugar, area requirements for sugarcane production will have to be expanded to some 22,610 hectares.
Tobacco
The Misamis Oriental Basins had some 1,436 hectares planted to tobacco. Tobacco yieided a total output of 586 tons valued at :P:l ,321 million.
Vegetables
Vegetable production in the river basin in 1971 was placed at 1.4 MT at a productivity level of 0.003 MT /ha. and a cropping intensity of 1. 75. Total value of production grossed ~660, contributing a mere 0.11 per cent of total agricultural receipts.
Assuming that productivity increased to 1.802 MT /has. in 1975, total production reached about 892 MT in the planning base year. Comparing this with the basin population's total demand for vegetables of 44,816 MT, a deficit was apparently incurred for these crops amounting to some 43,924 MT.
Using the high MAAGAP71 vegetable productivity target of 9 metric tons per hectare for year 2000 at a cropping intensity of 1.8 and at vegetable areas reaching 312 hectares (land capability estimates), total vegetable production could reach 5,051 metric tons. Such a high level of vegetable production if ever attained in the basin would still mean a deficit of 127 ,958 metric tons. About 665,040 hectares are actually required to be utilized for cultivation to meet effective vegetable demand in year 2000.
Rootcrops
Various rootcrops consisting of peanuts, camote, cassava, etc. were planted to 3,771 hectares in 1971. At total effective area rc>aching 49 006 hectares
' ' cropping intensity was estimated at 1.30. Volume of production grossed 19 MT valued at :P:4,549 with productivity at 0.0004 MT /hectare.
For 1975, allowing productivity to grow to 1.100 MT/ha. with physical area remaining constant at 1971 levels and cropping intensity increasing at 1.52, total production reached 6,305 MT. With the basins' demand for rootcrops at 18, 102 MT there was presumably a production deficit of 11 797 MT or 65 per cent in that year. '
61 MAAGAP Estimates Journal of Agriculture & Economic Development JAED
71 Model Analysis for Agricultural Adjustments in the Philippines.
80

Project ADAM (Agricultural Diversification and Market) indicates that rootcrop production could possibly reach a 5.5 MT per hectare productivity level by year 2000 provided that intensified use of land resources and cropping techniques would be maximized.
However, at the level of productivity, the basin is still a deficient area for rootcrop production. Output is estimated to be 36,504 MT while demand is 37,502 MT showing a deficit of 998 MT. Output was computed given the land capability and a cropping intensity of 1.6. To attain self-sufficiency in rootcrops, however, area to be farmed should reach 62,226 has., about 15 times more of the land capability estimates.
B.2.6.2 permanent crops
Permanent crops contributed 44 per cent to total cropland or 87,275 hectares. The major permanent crops were abaca planted to 4,271 hectares, coconut to 57,510 hectares, and fruits to 12,427 hectares. Production from permanent crops reached 5, 176 metric tons or only 10 per cent of total agricultural production, valued at P:456,223.
Coconut
Coconut was cultivated in 57,510 hectares or 18 per cent of the total land area devoted to permanent crops. Yield amounted to 312 metric tons valued at 'F35 ,775 representing 6 per cent of the basins' agricultural receipts.
Coffee
Some 13,066 hectares were devoted to coffee, from which 3,454 metric tons valued at'F9,145 were realized.
Fruits
Various kinds of fruit-bearing trees were grown in an area of about 12,427 hectares. Fruit crops produced a total of 45 metric tons valued at 'F12,518. With total effective area placed at 12,427 has., average productivity was estimated at 0.004 MT /ha.
Allowing yields to increase to 0.803 MT/ha. in 1975, a production volume of some 9,979 MT was presumably harvested in that year, incurring a 78 per cent deficit from the basin population's fruit demand of 44,593 MT.
B.2.7 irrigation
The 1975 agricultural census showed that 2,305 hectares or 7 per cent of the total palay area had been irrigated.
With the proposed irrigation projects of the NIA, additional areas prepared to be served will be some 5,695 hectares. Thus, by year 2000, the total irrigated palay area in the basin will reach 8,000 hectares. The lowland irrigable area suitable for palay cultivation was established to be about 47 ,200 hectares. Netting 1 O per cent for urban settlement, the available area for development will only be about 42,480 hectares. (See Tables Vl-B-9 and Vl-B-10, and Figure
Vl-B-5).
81

124°15' 124030' 124045' 125°00·
·a0 4s'
8°30'
LUgalt
-8°15'
Figure Vl-B-5
NATIONAL !PROPOSED RRIGATIO
~=:=:=12=4=01 ~s·= =:=:=:=:~~~=:=:=:=:~;;;;=:=:==--'M::_:ISA~MIS ORIEN N PROJECTS
124030' SCALE IN KILOTAL BASINS ........ METER
124_045' 5 0 r---1 r-'l 10 15 20 25 doKMS
125°15'
82
8"45'-
a0 1s·
125030"

Table Vl-B-9
EXISTING IRRIGATION SYSTEMS
Misamis Oriental Basins
{Hectares)
I. National Systems
II. Communal Systems
Misamis Oriental 1,400 Camiguin 331 Agusan del Norte 530
Sub Total 2,261
111. Private Systems Misamls Oriental 34 Camiguin Agusan del Norte 10
Sub-Total 44 Grand Total 2,305
Table Vl-B-10 PROPOSED IRRIGATION PROJECTS
Misamis Oriental Basins
(Hectares)
I. National Projects Misamis Oriental Agusan del Norte 2,600
Bukidnon 2,000 Sub-Total 4,600
II. Communal Projects Misamis Oriental 695
Agusan del Norte 250
Bukidnon 150 Sub-Total 1,095
111. Private Projects
Grand Total 5,695
B.2.8 livestock and poultry
B.2.8.1 population
The total number of livestock and poultry reached 417,643 heads in 1971. The livestock population of 214,013 heads Was valued at :P:48,286 million. There
83
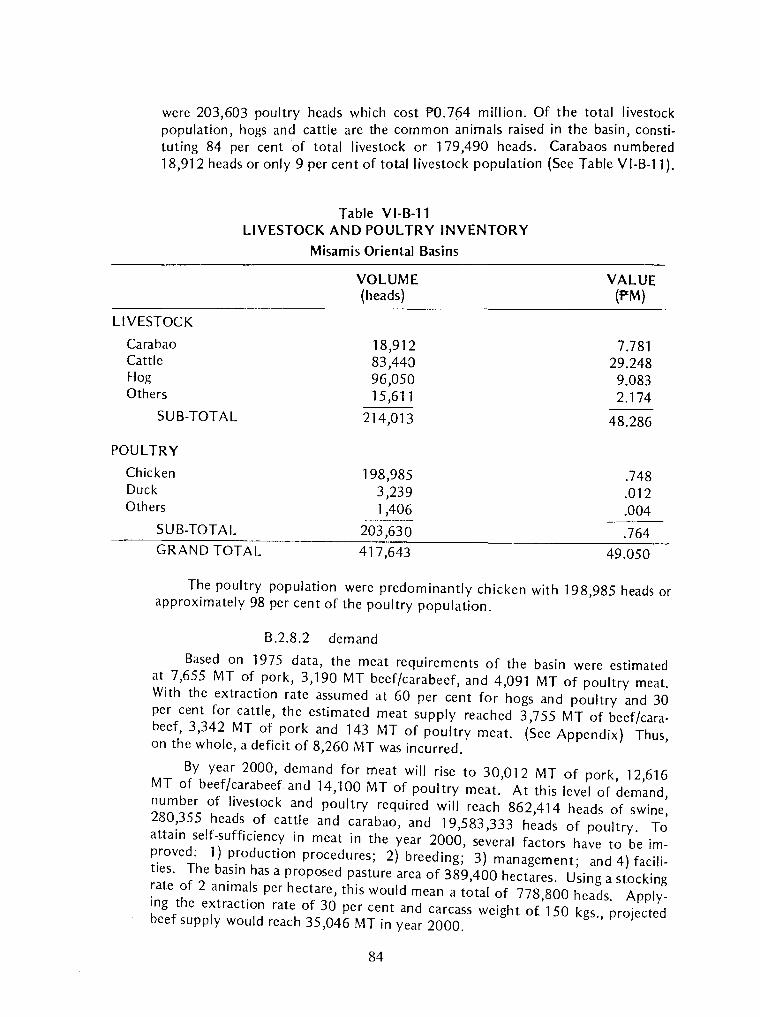
203 603 poultry heads which cost f'0.764 million. Of the total livestock were , · h b · · population, hogs and cattle are the common animals raised in t e asin, consti-tuting 84 per cent of total livestock or 179,490 hea~s. Carabaos numbered 18,912 heads or only 9 per cent of total livestock population (See Table Vl-B-11).
Table Vl-B-11 LIVESTOCK AND POUL TRY INVENTORY
LIVESTOCK
Carabao Cattle Hog Others
SUB-TOTAL
POULTRY
Chicken Duck Others
SUB-TOTAL
GRAND TOTAL
Misamis Oriental Basins
VOLUME (heads)
18,912 83,440 96,050 15 ,611
214,013
198,985 3,239 1,406
203,630
417,643
VALUE (PM)
7.781 29.248
9.083 2.174
48.286
.748
.012
.004
.764
49.050
The poultry population were predominantly chicken with 198,985 heads or approximately 98 per cent of the poultry population.
B.2.8.2 demand
Based on 1975 data, the meat requirements of the basin were estimated at 7,655 MT of pork, 3,190 MT beef/carabecf, and 4,091 MT of poultry meat. With the extraction rate assumed at 60 per cent for hogs and poultry and 30 per cent for cattle, the estimated meat supply reached 3,755 MT of beef/carabeef, 3,342 MT of pork and 143 MT of poultry meat. (See Appendix) Thus, on the whole, a deficit of 8,260 MT was incurred.
By year 2000, demand for meat will rise to 30,012 MT of pork, 12,616 MT of beef/carabeef and 14,100 MT of poultry meat. At this level of demand, number of livestock and poultry required will reach 862,414 heads of swine, 280,355 heads of cattle and carabao, and 19,583,333 heads of poultry. To attain self-sufficiency in meat in the year 2000, several factors have to be improved: 1) production procedures; 2) breeding; 3) management; and 4) facilities. The basin has a proposed pasture area of 389,400 hectares. Using a stocking rate of 2 animals per hectare, this would mean a total of 778,800 heads. Applying the extraction rate of 30 per cent and carcass weight of 150 kgs., projected beef supply would reach 35,046 MT in year 2000.
84

CROPS
B.2.9 agricultural water requirement
Agricultural water consumption considered the requirement of irrigation livestock and poultry. In 1975, agricultural water used in the basin was estimated at 624.11 million cubic meter per year (MCM/year). Corn irrigation used up 498.34 MCM or about 79 per cent of the total, rice 73.74 MCM, livestock and poultry 1.31 and. others combined 52.03 MCM.
Water requirement for agricultural crops was based on land capability. Of the total demand, 840. 70 MCM would be utilized for corn irrigation, 95.61 MCM for rice and 13.2 MCM for livestock and poultry. Table Vl-B-12 shows the tabulated water requirement projection.
Table Vl-B-12
WATER REQUIREMENTS (IN MCM/YEAR)
Misamis Oriental Basins
1975 2000
Palay 73.74 498.34
3.96 21.50
2.07 24.50
95.61 840.70
5 .11 25.55
2.37 33.18
Corn Sugarcane Tobacco Vegetables Rootcrops
SUB-TOTAL
LIVESTOCK AND POUL TRY
Cattle Swine Chicken
SUB-TOTAL
GRAND TOTAL
B.3 Fishery
624.11
.625800
.720375
.00915331
1.35
625.46
1,002.5
5.84 6.46
.90
13.20
1,015.70
The total fishpond production in the basin was recorded at 10,465 MT with
an estimated value of:P:75,000 in 1979.
Among the three types of fishing activities in the basin, municipal fishing has the most number of produce with 8,596 MT which amounted to ?61 thousand. This is about 80 per cent of the basins' total. Commercial fishing recorded an output of 1,500 MT valued at :Pl 1 thousand or 15 per cent and inland fishing has 369 MT amounting to about :P4 thousand or 5 per cent of the basins' total
value of production.
Based on the recommended per capita nutritional requirements per fish of NEDA/RDS, the annual fish demand for the basin for the period 1975 to 2000
85

were estimated. The resulting figures show 28,891 MT for 1975 and 87,584 MT for year 2000.
B.4 Industry Analysis of the industrial sector's performance by river basin utilized a
methodology which depends on employment and labor productivity per employed person so as to derive values of production by industrial sub-sectors and by industry groups, and census reports at the municipal level. The projected shares of manufacturing employment and output for the various industries were patterned from the RDS-NEDA proper, "The Role of Industry in Regional Development." The 1967 and 1972 Census and the Annual Survey for 1974 were used for the establishments' data and the 1974 NEDA Input-Output Tables were used for the water coefficients.
In 1975, the whole industry sector generated 'F320 million or 16 per cent of the gross domestic product (GDP) of 'F1 ,987 million. By year 2000, this sector is projected to increase its relative significance by contributing P9,325 million or 42 per cent of the GDP growing 29 times in 25 years or 1.2 per cent annually.
B.4.1 mining
The mining sector employed a total of 307 workers according to the 1975 population census, representing a mere 0.15 per cent of the total work force. Gross value-added for the sector was P6 million with only a share of 0.33 per cent of the basins' total GDP. By year 2000, GVA is projected to increase to P304 million with an estimated employment of 4,550.
Metallic ore reserves in the river basin in 1978 consisted of some 50,000 MT of chromite ore found in Manticao, Tuod; 40,000 MT in Sungay, Libertad, Opol, and Manticao; 65,000 MT in Awang; 45,000 MT in Manticao and Cagayan de Oro City; 29,000 MT in Carmen and 57,000 MT in Opal.
Non-metallic mineral reserves, on the other hand, consisted of some 10 million MT of cement raw materials in Luga-it and Salimbal, and another 5,376,000 MT of limestone ore in Naawan and Olosan. Also included are 2.5 MT of clay ore located in Manolo Fortich, Gaboc and Lingion; 3,428,800,000 MT of limestone ore also located in Manolo Forti ch; 1 million MT of silican sand ore located in Manticao, Talocao, Paniangan and 15,000 MT in Naawan and Don Pedro.
Status of operation on reserves as of report period had all metallic ore reserves producing while with regards to non-metallic ore, only two minerals are in the process of production namely cement raw materials ore found in Luga-it and Salimbat and limestone ore found in Gaboc and Lingion. Other mineral reserves such as limestone ore found in Manolo Fortich, silica sand ore found in Paniangan, Naawan and San Pedro and Diatomaceous Earth ore found in Quezon and San Jose have no production. Cement raw material located in Naawan and Olosan and clay ore located in Talakag and Tikala-an in Bukidnon have unknown status of operations (Table Vl-B-13).
86
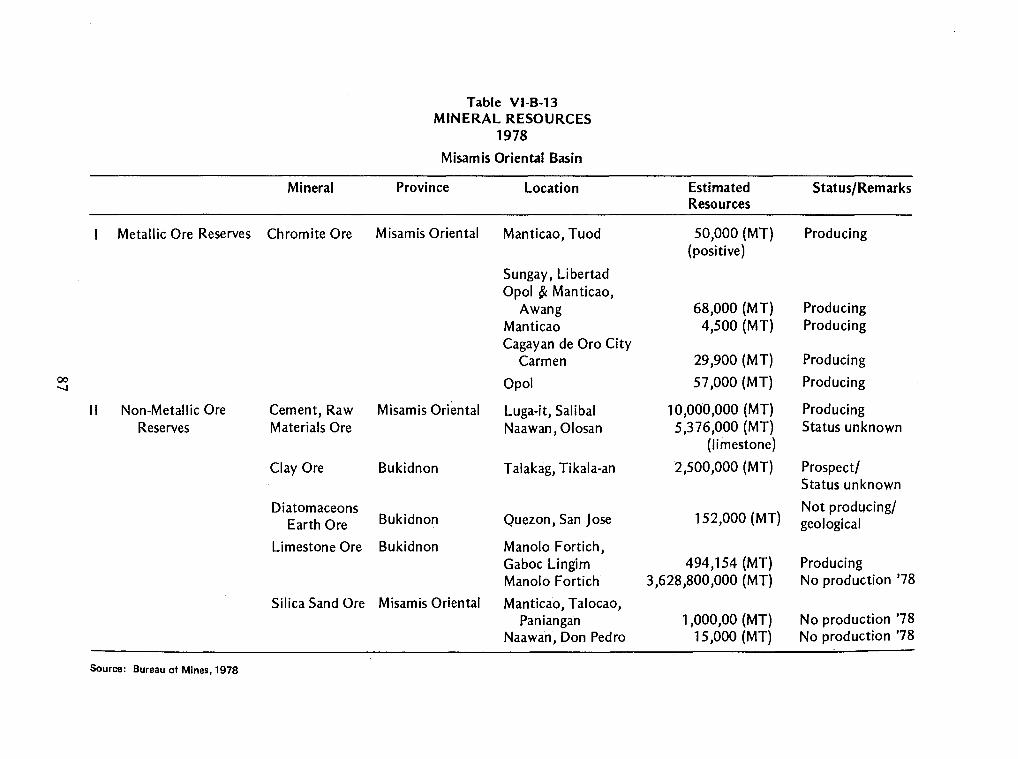
Table Vl-B-13 MINERAL RESOURCES
1978
Misamis Oriental Basin
Mineral Province Location Estimated Status/Remarks Resources
Metallic Ore Reserves Chromite Ore Misamis Oriental Manticao, Tuod 50,000 (MT) Producing (positive)
Sungay, Libertad Opol 8'. Manticao,
Awang 68,000 (MT) Producing Manticao 4,500 (MT) Producing Cagayan de Oro City
Carmen 29,900 (MT) Producing 00 Opol 57,000 (MT) Producing -...J
II Non-Metallic Ore Cement, Raw Misamis Oriental Luga-it, Saliba! 10,000,000 (MT) Producing Reserves Materials Ore Naawan, Olosan 5,376,000 (MT) Status unknown
(limestone)
Clay Ore Bukidnon Talakag, Tikala-an 2,500,000 (MT) Prospect/ Status unknown
Diatomaceons 152,000 (MT)
Not producing/ Earth Ore Bukidnon Quezon, San Jose geological
Limestone Ore Bukidnon Manolo F ortich, Gaboc Lingim 494,154 (MT) Producing Manolo Fortich 3,628,800,000 (MT) No production '78
Silica Sand Ore Misamis Oriental Manticao, Talocao, Paniangan 1,000,00 (MT) No production '78
Naawan, Don Pedro 15,000 (MT) No production '78
Source: Bureau ot Mines, 1978

Data on mineral production in 1978 meanwhile were taken from 37 reporting establishments/licensee (Bureau of Mines 1978) with a combined value of production of 1"119.8 million. This was an increase o'. ab~ut 90.8 per cent from the 1977 level of f"108.8 million. Of the non-metallic mineral types, sand and gravel production decreased from 96,914 to 20,050 cu. m. and decreased also in value from :P:1,604,042 to 448,937. Salt production increased in volume from 1 400 to 1 456 MT but decreased in value from 1"14,659 to 1"2,052 from 1977 ' , to 1978.
B.4.2 manufacturing
Manufacturing operations in the basin have been closely linked with the agricultural sector. Total manufacturing employment represented 7.83 per cent of the basins' total number of workers while output took about 11.51 per cent of the GDP. The primary industries of food, beverage, tobacco, textiles, and wood products manufacturing shared the biggest proportion of manufacturing output (75 per cent) followed by the intermediate goods industries of paper, chemicals, and petroleum sharing 19 per cent. Capital goods industries of metal manufactures and machineries followed with 16 per cent.
According to the 1972 Census of Establishment, manufacturing operations in Misamis Oriental Basins were carried out by small scale operators who made up about 99 per cent of the total number of establishments in the basin. These establishments absorb~d 77 per cent of the sector's working force while contributing some 40 per cent of the sector's output. For the periods from 1967 to 1972, the employment creation rate of these small establishments expanded by 59 per cent annually, while output was observed to have increased at ar. annual rate of 94 per cent. The increases were a result of the entry of new establishments as well as the overall improvement of existing industries. Note that while average employment size for the two censal years under consideration stabilized at about 3 persons per establishment, output per employee increased from :P:3,000 to :P:7,000. In contrast, large-scale industries registered a decline in average employment size from 158 to 119 but increased labor productivity from :P:l 7,000 to :P:36,000 per employee.
On the whole, the performances of the industries for the five-year period have not been very impressive. The rise in production costs was aggravated by decreasing realized returns thereby reducing the net profit margin from 119 per cent to 30 per cent, or the rate of return from 2.19 to 1.30.
An upward trend of capital-intensiveness was apparent as can be gleaned from the rise in capital formation rates from 0 to 12. Industrial statistics are presented in Tables Vl-B-14 and Vl-B-15.
The primary manufactures of food tobacco, textiles and wood industries in the basin will realize a long-term annual growth of about 13 per cent from 'F148 million in 1975 to :P:3,066 million in the year 2000. It is however observed that their proµortion to gross manufacturing output will continually ~how a downward trend from a share of 65 per cent in 1975 to 16 per cent in the year 2000 as a result of the shift of industry emphasis from consumer goods to intermediate and capital goods manufacture and the modernization of the
88

small unorganized sector. The intermediate industry sector is expected to increase from :P:43 million in 1975 to :P:12,541 million in the year 2000 representing an annual increase of about 26 per cent. Their share to gross output in manufacture will rise from 19 per cent to 66 per cent. The capital goods industries will. represent an annual growth rate of about 20 per cent from :P:37 million in 1975 to :P:3,412 million in the year 2000. Their proportion to gross value-added shall increase from 16 per cent to 18 per cent.
For further details refer to Tables Vl-B-14, Vl-B-15 and Vl-B-16.
Table Vl-B-14 SUMMARY STATISTICS FOR LARGE-SCALE MANUFACTURING
ESTABLISHMENTS IN MISAMIS ORIENTAL BASINS
1967 1972
Total Establishments 57 87 Total Engaged 8,986 10,324 Wages and Salaries (:P:'OOO} 21,079 42,351 Total Receipts ('F'OOO) 155,691 368,609 Total Costs ('P''OOO) 70,005 268,180 Census Value Added ('FOOO} 98,371 159,876 Gross Fixed Capital Formation (:P:'OOO) 18,167
Table Vl-B-15 SUMMARY STATISTICS FOR SMALL-SCALE MANUFACTURING
ESTABLISHMENTS IN MISAMIS ORIENTAL BASINS
Total Establishments Total Engaged Wages & Salaries ('F'OOO) Total Receipts (:P:'OOO) Total Costs (:P:'OOO) Census Value Added (:P:'OOO) Gross Fixed Capital Formation (:P:'OOO)
Source: NCSO Census of Establishments.
89
1967
1,024 3,427 1,513 9,105 4,947
1972
14,953 34,736
7,353 247,110 204,573
30,750
Annual Growth Rate(%)
9 3
15 15 31 10
Annual Growth Rate(%)
71 59 37 94
110

Table Vl-B-16
GROSS VALUE ADDED IN MANUFACTURING BY INDUSTRY GROUP
1975 and 2000 (In :PM at 1977 Prices)
Misamis Oriental Basins
1978 2000
Food and Beverages and Tobacco Textiles, Footwear and Related
Products
78
5 66
1,014
750
1,302 Wood and Wood Products
Paper, Printing and Allied Industries 16 799
Chemical Products and Petroleum Products 27
15
13
11,741
346
2,662
156
33 165
49
Non-Metallic Mineral Industries
Basic Metal and Metal Manufacturing
Machinery and Equipment 1 0.5
5 2
Electrical Machinery
Transport Equipment
Others
TOTAL 229 19,019
B.4.3 construction and electricity
In construction and electricity, gas and water sectors contributed about :P:86 million worth of output representing 4 per cent of the GDP and employing only 3 per cent of the basins' total number of workers.
The 1974 Annual Survey of Establishments reported a total of three establishments engaged in utilities sector with an annual average employment of 462 workers. There were, on the other hand, 4 construction establishments with a total of 436 workers as its annual average employment.
B.4.4 industrial water requirements
The quantification of industrial water needs of the study area was based on the projections of the industrial output and the mix of industry. In 1975, industrial -water requirements of the basin totalled to 0.13 MCM and this figure is expected to increase to 11.51 MCM by year 2000.
A sizable portion of the water demand is expected to come from the primary industries. However, their share of the total is expected to decline towards the year 2000. Hence, water needs of these primary industries are expected to decrease from 65 per cent of the total demand in 1975 to 16 per cent after 25 years. Of all the industrial water demand in 1975 the , manufacturing sector is the biggest user (91 %), followed by construction (6%), electricity and mining with 2% and 0.31 % respectively, (See Table Vl-B-17).
90

Table Vl-B-17 INDUSTRIAL WATER REQUIREMENTS
(In MCM/Year)
Misamis Oriental Basins
1975
TOTAL INDUSTRIAL WATER REQUIREMENT
Manufacturing1'
Mining
Construction
Electricity
.13
.12
.0004
.01
.0030
1 /Water requirements per manufacturing industry are presented in Appendix Table
B.5 Transportation
B.5.1 highways and road transport
2000
11.51
11.36
.02
.08
.04
As of 1980, the basin contained within its municipal boundaries an approximate road kilometerage of 926.335 kilometers. By administration, 30 per cent of these were national roads dominated by the asphalt and gravel type; 55 per cent were provincial r6ads, almost all of which were the gravel and earth type; 14 per cent were municipal roads consisting mostly of asphalt and earth roads; and 2 per cent were city roads wherein the most number of kilometerage were made up of gravel. As a whole, the basin consisted of 20 per cent or 184.35 kilometers of the concrete type; 18 per cent or 167. 777 kilometers of asphalt roads; 33 per cent or 306.164 km. of gravel roads; and about 29 per cent of the earth roads/types.
B.5.2 water transport
1978 PPA report shows that the sub-port of Nasipit, which is under the base port of Butuan, is the only sub-port accessible to the basin. The base port of Bu tu an, situated on the West Bank of Agusan River, has a port area of 11, 100
square meters.
Thirty-five per cent (35 per cent) of cargo trade was domestic while foreign trade accounted for sixty-five per cent (65%) at the sub-port of Nasipit. Total number of domestic vessels accounted for 78 per cent, while 22 per cent was for foreign vessels. Gross tonnage for domestic made up 57 per cent of total.
B.5.3 air transport
At present, there are three airports located in the basins' planning area. One is a trunkline airport situated in Cagayan de Oro City with an area of 112 has. and a taxi-way measuring 200 x 149 meters. It registered a passenger traffic of 175,389. Another is the feeder type of airport located in Mambajao, Camiguin having an area of 18 has., a taxi-way of 96 x 80 MAC and a passenger traffic of 23. The airport located in Malaybalay, Bukidnon is classified as a secondary
91

type of airport. It has an area of 12 has., a taxi-way of 100 x 50 meters, and a registered passenger traffic of 202.
B.6 Power
B.6.1 power generation and consumption
The program of the whole island of Mindanao is the development. of energy resources such as hydropower, geothermal and coal, and the establishment of a central system of electric power.
Hydropower is presently being developed as a cheap indigenous so~rce of power in the island. Initial development included the Lake Lanao-Agus River Complex with a potential capacity of 744 MW in seven (7) sites along the Agus
River Complex to lligan Bay. This was followed by the development of Pulang River capable to supply a potential of 873 MW in six (6) sites, the Tagoloan and Cagayan River.
The rapid industrial development in the island triggered an increase in demand of power at such a rate that the hydroelectric projects cannot cope up with it. For this reason, it has become necessary for the National Power Corporation and the National Electrification Administration to consider the early introduction of diesel and thermal plants to boost the energy requirement.
As a provisionary measure, the National Power Corporation and the National Electrification Administration were engaged on power development ~n an intraisland basis by putting up diesel, thermal plants to support the load growth within the area and the development of new load center.
Presently, Davao area is separated from the Mindanao grid due to the prevailing problem encountered in the construction of the Bubong-Kibawe portion of the Agus-Davao 138 KV transmission line. Thus, with the limited operations and capability of Davao Light and Power Company to supply power, the load growth within the region will become stunted. As an interim measure, the third power barge will be moved to Davao City until Agus power becomes available by 1983. It is also planned that a thermal plant with a capacity of 150 MW be installed in Davao to stabilize the operation of transmission network and to provide additional capacity within the grid. The plant will be operational by 1984.
It is planned that Agus 111 with a capacity of 225 MW be developed and ready for operation by 1984 to be followed by Pulangui IV with the first 2 units scheduled by 1985. The third is programmed to be on stream by 1986.
By 1985, the second thermal plant located in Nasipit-Agusan del Norte with a capacity of 150 MW is scheduled to come into stream early January followed by Pulan_gi 111 with a capacity of 136 MW at the start of the following year. Pulangi V with a capacity of 348 MW is scheduled to be operational at the retirement of 26.5 MW PLPCO diesel plants in 1987. In the year 1988, Cagayan I with a capacity of 100 MW and a thermal plant 111 shall be on stream.
The total generated power for the Mindanao grid in 1980 reached 314 MW. For the same year the projected power consumption within the Misamis Oriental Basins is forecasted at 118 MW representing 37.57 per cent of the total generated
92

power for Mindanao grid. It will provide adequate power service to approximately 82,840 co~sumers with an average consumption of 35 KWH/month/consumer. The system installed capacity by 1990 will be 2,724 MW. The load forecast for the basin by 1990 is 123 MW or 4.5 per cent of the total generated power for Mindanao grid. The projected load will provide 153,866 consumers with an average consumption of 58 KWH/month/consumer.
In the year 2000, the system peak demand will be 217 MW or 6.88 per cent at 3,154 MW of the system installed capacity with a reliable service for 164104 consumers. (See Figures Vl-B-6 and Vl-B-7). '
B.6.2 generating facilities
1. The total generating capacity of the existing grid is 212.6 MW composed of 201.6 MW hydro and 11 MW diesel. The present isolated operation of the Davao .area will be maintained until 1983 when it will then be integrated into the grid.
2. Agus River No. 11 (180 MW) presently under crash construction program is scheduled to be on the stream by May 1979. Start-up of initial unit will be as early as February 1979.
3. Presently under construction are three (3) diesel units of 18.65 MW each at Aplaya, two of which is expected to be commissioned on August 1979 and the 3rd unit coming in by February 1980. General Santos Diesel Plant consisting of 3 x 7.3 MW units is expected to be energized in mid~1979. This plant will initially operate as an isolated system and will be connected to the grid in July 1983 when the Cotabato Electrification Project is completed.
4. To increase the base load capability of the system, three (3) additional diesel units of 18.65 MW each were scheduled for commissioning in June 1980, bringing the total installed capacity of the Aplaya Diesel Plant to 122.9 MW.
5. To meet the requirements of the suppressed load forecast and serve the ever expanding load requirements of existing customers and the opportunity given by the financier, one Power Barge of 32 MW consisting of 4 units or 8 MW each is planned in Davao City by 1981. This Barge will be maintained in Davao City until the integration of Davao area into the grid by 1983.
6. Four (4) hydro plants namely, Agus VII (54 MW), Agus I (80 MW), Agus IV (150 MW) and Agus V(55 MW) are in the pre-construction stage. Scheduled completion dates are:
a) A~us VI I b) Agus I c) Agus V d) Agus IV
May and August 1981 November 1981 and January 1982 April and July 1982 March, April and July 1983
7. To meet the system requirements, espeeially energy, with the least expected suppression of load growth, three (3) coal-fired thermal plants of 150 MW each are programmed: one coming in January 1984, the second in
93

January 1985, and the third in 1988. These units will be located in Davao City, Nasipit, Butuan City and probably Surigao City. The end-line generating stations are imperative to achieve supply reliability and voltage stability.
8. Several hydro plants which were already identified are programmed for construction and completion towards the latter part of the study period. These are:
a) Agus 111 with an installed capacity of 225 MW is programmed for commissioning by April 1984. This project is presently being appraised by ADB.
b) Pulangi IV (Maramag) with an installed capacity of 255 MW with initial two units scheduled to be on stream by January 1985. Contract documents are expected to be ready by the third quarter of 1979.
c) Pulangi 111 with an installed capacity of 136 MW, is programmed for commissioning in 1986. It will be followed by Pulangi V (348 MW) by 1987. The pre-feasibility study of the Pulangi River Basin has been completed. The definite design including an interim report on feasibility is proposed to be taken up immediately.
d) Cagayan I, (100 MW) is also programmed for commissioning in 1983. The pre-feasibility study of the Cagayan River Basin along with that of the Tagoloan River Basin is funded by ADB.
By the end of 1988, the Mindanao Grid will be capable of generating 2,447 MW of power with the retirement of 26.5 MW DLPCO diesel plants. The generation mix by this time will be 72% hydro, 26% coal fired and 2% diesel based on system energy requirement of 10,467 GWH.
94

Figure Vl-B-6 INCREASE IN TOTAL SYSTEM KILOWATT DEMAND RELATIVE TO INCREASE IN NUMBER OF
CONSUMERS AND AVERAGE CONSUMPTION
400 80
300 60
ct. LU ::E ::J Vl z 0 !,,)_
0 z < ::E UJ 0 ~ 200 40, ~
z ~ 0 _J
::2
100
1980 1990 YEAR OF PROJECTION
95
0 ::E J: 3: ::..::
.20
2000'
.500
0 0 ?
400 ;:Q LU :::;: ::J Vl z 0 u u.. 0 ct.
300 LU a:l :::;: ::J z
200
100

8 .E
500
400
jQ 300 l.J.J ::;: ::i Vl z 0 u LL 0 0::: l.J.J al ::;:
~ 200
100
1980
Figure Vl-B-7 INCREASE IN HOUSE CONNECTION LEVEL AND NUMBER OF CONSUMERS
FROM 1980 TO 2000 YEARS
NNe.cnoN t..E.'11 •• -
----~<;2 .. -~-----. ·----
1990 YEAR OF PROJECTION
96
2000
400
300
0 0 9
..J Vl
l.J.J lJ.J
> Vl ::i
l.J.J 0 ..J J: z LL 0 200 0 ~ a:: u lJ.J
150~ al
z ::E 0 ::i
u z
125
100
100 75
50
25

CHAPTER VII
WATER RESOURCES DEVELOPMENT FRAMEWORK
A. Sectoral Indicators of Development
A.1 Water Resources
A.1.1 water requirements
Water requirements from the agricultural, industrial and domestic sectors for the year 1980 was estimated at 722.82 million cubic meters (MCM) and is projected to increase to 1J074.57 MCM by the year 2000. Breakdown of these requirements is shown on the Table Below.
Agricultural Industrial Domestic
Table Vll-A-1
WATER DEMAND IN MCM/YEAR 1980 and 2000
TOTAL
1980
703.51 2.41
16.90
722.82
A.1.2 water availability
2000
1,015.70 11.51 47.36
1,074.57
Water resources consist mainly of rainfall, surface runoff and groundwater storage. Average annual runoff for the Misamis Oriental Basins is placed at 18,067 MCM, while eighty (80) per cent dependability is approximately 26.04 MCM/day. On the other hand, total groundwater storage is estimated to be 19,912 MCM with an inflow to the groundwater reservoir system of 2,877 MCM/ year. Recommended safe yield is also set at 2,877 MCM/year. Rainfall, the source of both surface runoff and groundwater, is roughly 2,552 mm/year (Table Vll-2 and Figure Vll·A-1 ).
Table Vll-A-2
ESTIMATED WATER RESOURCES
Surface Runoff Groundwater Safe Yield Rainfall
18,067 MCM/year11
2,877 MCM/year 2,552 mm/year
1 / Based on groundwater recharge rate which includes water that discharges as surface runoff.
A.2 Land Resources
The total agricultural lands in 1971 (NCSO) covered approximately 5,399 square kilometers. About 37 per cent of 'that or 1,982 square kilometers was devoted to broad temporary and permanent crops only. This accounttd for the cultivated land underutilization (Refer to Table Vll-A-3).
97

Vl 1-z LIJ :::;;: LIJ c::: ::::> Cf LIJ c::: c::: LIJ I<( 3:
45
40
35
30
25
10
5
0 1980
Figure VI l-A-1
WATER PICTURE MISAMIS ORIENTAL BASINS
80% DEPENDABLE SURFACE RUNOFF
GROUNDWATER SAFE YIELD
98
DOMESTIC AND INDUSTRIAL USES
2000
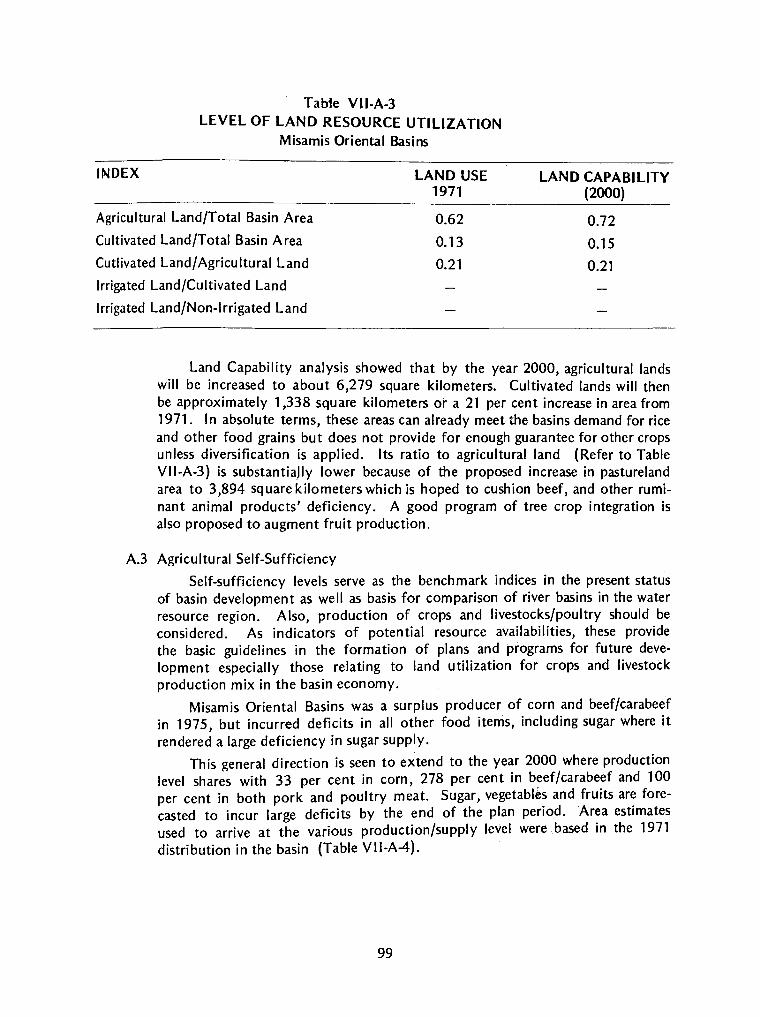
INDEX
Tabte Vll-A-3 LEVEL OF LAND RESOURCE UTILIZATION
Misamis Oriental Basins
LAND USE 1971
LAND CAPABILITY (2000)
Agricultural Land/Total Basin Area
Cultivated Land/Total Basin Area
Cutlivated Land/Agricultural Land
Irrigated Land/Cultivated Land
Irrigated Land/Non-Irrigated Land
0.62
0.13
0.21
0.72
0.15
0.21
Land Capability analysis showed that by the year 2000, agricultural lands will be increased to about 6,279 square kilometers. Cultivated lands will then be approximately 1,338 square kilometers or a 21 per cent increase in area from 1971. In absolute terms, these areas can already meet the basins demand for rice and other food grains but does not provide for enough guarantee for other crops unless diversification is applied. Its ratio to agricultural land (Refer to Table Vll-A-3) is substantiaJly lower because of the proposed increase in pastureland area to 3,894 square kilometers which is hoped to cushion beef, and other ruminant animal products' deficiency. A good program of tree crop integration is also proposed to augment fruit production.
A.3 Agricultural Self-Sufficiency
Self-sufficiency levels serve as the benchmark indices in the present status of basin development as well as basis for comparison of river basins in the water resource region. Also, production of crops and livestocks/poultry should be considered. As indicators of potential resource availabilities, these provide the basic guidelines in the formation of plans and programs for future development especially those relating to land utilization for crops and livestock production mix in the basin economy.
Misamis Oriental Basins was a surplus producer of corn and beef /carabeef in 1975, but incurred deficits in all other food items, including sugar where it rendered a large deficiency in sugar supply.
This general direction is seen to extend to the year 2000 where production level shares with 33 per cent in corn, 278 per cent in beef/carabeef and 100 per cent in both pork and poultry meat. Sugar, vegetables and fruits are forecasted to incur large deficits by the end of the plan period. Area estimates used to arrive at the various production/supply level were based in the 1971 distribution in the basin (Table Vll-A-4).
99

Table Vll-A-4 FOOD SELF-SUFFICIENCY
(In Metric Tons)
Misamis Oriental Basins
1975 2 0 0 0
Food Item Self- Self-
Demand Supply Sufficiency Demand Supply Sufficiency
Rice 78 150 11 77,081 99% 171,372 ,_
Corn 40,04921 71,676 179% 110,845 267 6241
' ' 391,362.4121
Sugar 16,499 149 1% 57 ,262
Rootcrops 18,102 6,305 35% 37,502
636
36,504
156%
353%
1%
97%
4% Vegetables 44,816 892 2% 133,008 5,051
59,634
30,01 '.231
35 04641
Fruits 44,593 9,979 22% 129,918
Pork 7,655 3,342 44% 30,012
Beef /Cara beef 3,190 3,755 118% 12,616 '
46%
100%
278%
100% Poultry Meat 4,091 143 3% 14,100 14 10051 '
1/1ncludes 25% allowance for buffer stock, wastage, etc.
2/ Human Consumption, feed requirements and 1% allowance for seeds and wastage. 3/ Targeted levels to meet demand. 4/ Based on earmark pasture lands.
Note: Level of self-sufficiency = Supply Demand.
A.4 Social Indicators
A.4.1 income
The average family income for the basins increased from 'F2,795 in 1961 to ?5,917in1975. It increased by about 112 per cent over that period. The basins' Gini Ratio showed a relatively improving condition in the income distribution most especially in the rural sector where there was a consistent rise from 1961-1975. The urban Gini ratio although higher than the urban sector faltered somehow in 1965 but improved onwards 1975 (see Table VI l-C-2).
A.4.2 health
Based on the 1975 and 1977 provincial data on morbidity and mortality rates from Ministry of Health (MOH) Disease Intelligence Center, the most prevalent water-borne disease in the four provinces (Bukidnon, Agusan del Norte, Camiguin, and Misamis Oriental) covering the Misamis Oriental Basins was gastro-enteritis (lable Yll-A-5 to Yll-A-8).
Information from the MOH Malaria Eradication Service Office showed that of the 41 municipalities covering the basin, 29 municipalities had positive cases of malaria. Mortality and morbidity due to malaria increased in number and cases in 1975 and 1977, however, Misamis Oriental experienced a decrease in the number of cases and deaths.
100

0
Table VI 1-A-S MORBIDITY AND MORTALITY RATES OF WATER-BORNE DISEASES
(Rate Per 100,000 Popualation) 1975 and 1977
Province: MISAMIS ORIENTAL
1 9 7 s 1 9 7 7* WATER BORNE DISEASE CASES DEATH CASES
NO. I RATE No.1 RATE NO. I RATE NO.
CHOLERA EL TOR 2 1.2 2 1.2 6 5.4 5
TYPHOID & PARATYPHOID FEVER 72 51.9 8 4.6 103 64.2 3
DYSENTERY ALL FORMS 780 455.5 12 6.8 743 584.3 45
GASTROENTERITIS 4,040 2,030.1 240 . 124.7 5,378 2,819.7 336
ACUTE POLIOMYELITIS 7 5.1 2 0.6 4 3.5 1
ACUTE INFECTIOUS ENCEPHALITIS 6 3.1 6 3.1 61 77.1 15
iNFECTIOUS HEPATITIS 90 57.8 5 2.4 235 164.1 9
MALARIA 129 111.2 5 2.8 76 56.5 3
SCHISTOSOMIASIS 1 0.6 0.6 0 0
FILARIASIS 0 0 0
Source: Philippine Health Statistics Disease Intelligence Center Ministry of Health
"Latest data available.
.SCIENCE AND TErnr-1nr rv-,v Tl\ .. .,... . , · . · .: "'~:~ff- ".<:< 1 · ,l'ii'ORMATION INSTITU. ~ - --
DEPARlME,\/1 <H· ··( 1 .. .. , ; ·1 ·' L)' J'i•'i'H"'O TE . .. · ' ' '· ' · . · J."' a LOGY .
LIBRARY
DEATH
I RATE
4.8
1.2
29.1
175.8
0.3
6.0
7.3
3.9

_. 0 I',,)
Province: CAMIGUIN
Table VI l-A-6
MORBIDITY AND MORTALITY RATES OF WATER-BORNE DISEASES (Rate Per 100,000 Population)
1975 and 1977
1 9 7 5 1 9 7 7* WATER BORNE DISEASE CASES I DEATH CASES I DEATH
NO. I RATE 1 NO. I RATE NO. j RATE I NO. I CHOLERA EL TOR 0 0 1 1.5 1
TYPHOID & PARATYPHOID FEVER 0 0 23 35.5 1
DYSENTERY ALL FORMS 22 35.7 10 16.2 14 21.6 5
GASTRO ENTERITIS 1,321 2,144.4 32 51.9 1,219 1,884.1 21
ACUTE POLIOMYELITIS 0 0 1 1.5 0
ACUTE INFECTIOUS ENCEPHALITIS 0 0 224 346.2 1
INFECTIOUS HEPATITIS 21 34.1 3 4.9 23 35.5 0
MALARIA 7 11.4 0 11 17.0 0
SCHISTOSOMIASIS 0 0 4 6.2 0
FILARIASIS 0 0 0 0
Source: Philippine Health Statistics Disease Intelligence Center Ministry of Health
*Latest data available.
RATE
1.5
1.5
7.7
32.5
1.5

_. 0 w
Table Vll-A-7 MORBIDITY AND MORTALITY RATES OF WATER-BORNE DISEASES
(Rate Per 100,000 Population) 1975 and 1977
Province : AGUSAN DEL NORTE
1 9 7 5 1 9 7 7* WATER BORNE DISEASE CASES DEATH CASES DEATH
NO. I RATE NO. I RATE NO. I RATE NO. I CHOLERA EL TOR 15 8.6 6 3.4 18 9.3 4
TYPHOID & PARATYPHOID FEVER 44 25.3 13 7.4 27 14.0 7
DYSENTERY ALL FORMS 354 195.2 11 6.2 450 228.1 24
GASTROENTERITIS 1,650 917.1 143 80.0 2,692 1,357.5 184
ACUTE POLIOMYELITIS 1 0.6 1 0.6 3 1.5 3
ACUTE INFECTIOUS ENCEPHALITIS 4 2.3 3 1.7 43 1.6 2
INFECTIOUS HEPATITIS 79 44.1 7 4.0 150 75.6 16
MALARIA 120 66.6 9 5.1 227 114.6 10
SCHISTOSOMIASIS 46 25.4 17 9.5 71 35.6 14
FILARIASIS 0 0 0 0
Source: Philippine Health Statistics Disease Intelligence Center Ministry of Health
*Latest data available.
RATE
2.1
3.6
12.3
94.1
1.5
1.0
8.2
5.1
7.1

0 .....
Table Vll-A-8 MORBIDITY AND MORTALITY RATES OF WATER-BORNE DISEASES
(Rate Per 100,000 Population) 1975 and 1977
Province: BUKIDNON
1 9 7 5 1 9 7 WATER BORNE DISEASE CASES DEATH CASES
NO. I RATE NO. I RATE NO. 1 RATE
CHOLERA EL TOR 3 0.5 3 0.5 2 0.3
TYPHOID & PARATYPHOID FEVER 0 0 20 3.2
DYSENTERY ALL FORMS 124 22.4 16 2.9 5 0.8
GASTROENTERITIS 1,491 268.8 140 25.2 2, 151 345.8
ACUTE POLIOMYELITIS 2 0.4 2 0.4 3 0.5
ACUTE INFECTIOUS ENCEPHALITIS 2 0.4 2 0.4 4 0.6
INFECTIOUS HEPATITIS 18 3.2 7 1.2 53 8.5
MALARIA 25 4.5 9 1.6 1,042 167.5
SCHISTOSOMIASIS 134 24.2 12 2.2 54 8.7
FILARIASIS 0 0 0
Source: Philippine Health Statistics Disease Intelligence Center Ministry of Health
•Latest data available.
7* DEATH
NO. I RATE
2 0.3
6 1.0
3 0.5
149 24.0
3 0.5
1 0.2
3 0.5
14 2.3
7 1.1
0

Only one municipality (Buenavista) of the 41 municipalities comprising the Misamis Oriental Basins was indicated as endemic for schistosomiasis the estimated number of cases represent 14.0 per cent of the 1975 total po~ulation of the municipality (Table Vll-A-9).
Table Vll-A-9
POPULATION (1975) AND ESTIMATED NUMBER OF SCHISTOSOMIASIS CASES BY MUNICIPALITY INCLUDING ESTIMATE SNAIL AREAS
AS OF DEC. 1980
Province/Municipality Population
AGUSAN DEL NORTE
Buenavista 28,682
TOTAL 28,682
Source: National Schistosomiasis Control Commission Ministry of Health (MOHi
A.4.3 education
Estimated Number Estimated Snail of Cases Areas (Has.)
4,016 30.0 --
4,016 30.0
The basins' literacy rate for 1970 was 77 .0 (no literacy data are available for 1975). In 1975, about 60 per cent of the basin population six years old and over either reached elementary or completed their elementary education. Some 20 per cent reached high school or completed their high school education. About 5 per cent reached college level while only 3 per cent completed college. Approximately 11 per cent had no schooling (Table Vll-A-10).
Table Vll-A-10 EDUCATIONAL ATTAINMENT, 1975
Number
No grade completed 71,834
Elementary 385,092
High School 126,591
College (No degree) 30,967
Academic Degree Holder 17 ,678
Not Stated 7,763
TOTAL 639,925
Source: NCSO Census of the Population and its Economic Activities Report (1975)
B. Project Profiles
B.1 Potential Multi-Purpose Projects
Percentage
11.2
60.2
19.8
4.8
2.8
1.2 --100.0
The potential of the basin for water impounding projects has not so far been tapped. No known reservoir projects exist although the area has numerous
105

potential multi-purpose reservoirs.
The NWRC8' in its inventory of water impounding reservoirs has identified four (4) potential projects within the area. Table Vll-B-1 presents a list of the potential reservoir sites within the basin, along with their coordinates, drainage areas, dam heights and functions (i.e. irrigation, power, flood control, etc.). The location of these reservoir sites are plotted in Figure VI l-B-1.
B.2 Irrigation Projects
In Misamis Oriental Basins, there is no national irrigation system existing within the area. What is available are some 20 communal and 16 private systems serving an area of 2,261 hectares and 44 hectares, respectively. Consequently, NIA has identified and proposed 5,695 hectares for irrigation. This, then is expected to boost agricultural production. (See Chapter VI for details)
B.3 Water Supply Projects
B.3.1 agency proposal and activities
Efforts on the national, provincial and municipal level are being made to meet the existing and future water supply needs of the basin. The Local Water Utilities Administration (LWUA) is undertaking several programs to improve water services. The formation of water districts (WD) is one of the major ones. Water districts actually existing within the basin are the Gingoog City WD and Cagayan de Oro WD.
At present, the Cagayan de Oro Water District (COWD) is servicing approximately 85 per cent of the urban population. The main source of water, being utilized by the population comes from a well field located in the alluvium of the Cagayan River. It is projected that by year 2000, 95 per cent of the population has had connections with the COWD. Consequently, the COWD has committed itself in the implementation of water supply systems in several Slum Improvement and Rehabilitation (SIR) areas, namely: Macabalan, Kauswagan, Lapasan and in the Bagong Lipunan Improvement of Sites and Services (BLISS) area long Adelfa Road9/.
Likewise, the Gingoog City Water District (GCWD} operates for domestic and industrial purposes. Estimated urban population served by the GCWD is 16,500.
B.3.2 study proposals
To provide adequate supply of potable water to projected population, some 3,147 Level I, 655 Level II and 35 Level Ill facilities will be required by year 2000. Shown in Table Vl-A-9 is the municipal distribution of estimated Level I, II and Ill facilities required.
8/ National Water Resources Council, Survey /Inventory on Water Impounding Reservoirs, 1978.
91 CO~I Consult (Consulting Engineers and Plannters AS) and Ministry of Public Works "Regional Cities Development Pro1ect - Cagayan de Oro", Project Identification Report, December 1979. '
106

0 -...J
CODE SITE NO.
M103021 Talakag
M102032 Maluko
M102033 Kalapiogan
M103034 Sta. Ana
M103035 Nicdao
1101036 Manolo Fortich
1102037 Odiongan
5102038 Opol
M102039 Mamburaya
M102040 Cagaya: 1 de Oro
5101041 Loguilo, Alubijid
M103042 Claveria
LEGEND: I = IRRIGATION P = POWER
FC = FLOOD CONTROL
Table Vll-B-1 WATER IMPOUNDING RESERVOIR PROJECTS PLANNING AREA 11
REGION X
RIVER
Cagayan No. 1
Tagoloan Ill
Tagoloan IV-A
Tagoloan IV
Bubunauan
Tagoloan
Odiongan
Poblacion
Malit bog
(Misamis Oriental Basins)
COORDINATES D.A. PROVINCE
N. LAT.
Bukidnon 8°14 '20"
Bukidnon 8°23 '40"
Bukidnon 8°29'37"
Bu kid non 8°32'11"
Bukidnon 8°23'20
Bukidnon 8°22'30"
Misamis Or.
Misamis Or.
Misamis Or. 8°19'34"
Misamis Or. 8°24'23"
Misamis Or. 8°35'42"
CATEGORY REGION NO. STATUS PROJECT NO.
E. LONG. (Sq.Km.)
124 °34 '25" 762.23
124°56'49" 567.9
124°50'21" 1,311.04
124V47'00 1,404.91
124°37'54" 224.24
124°52'00" 168.96
2.05
124°36'14" 893.32
124°37'26" 1,132.17
124°57'15" 34.41
CATEGORY M = MAJOR
D.H. (M)
195
181
130
70
150
7.95
110
75
170
M & I = MUNICIPAL & INDUSTRIAL SUPPLY
I = INTERMEDIATE S =SMALL
I
x x x x x
x x x x x
FUNCTIONS
p FC M
x x & I
x x x x x x x x x
x x x x x
x x x
STATUS
1 = EXISTING 2 = PROPOSED 3 = POTENTIAL 4 = UNDER
etc.
x x x x x x
x x x x x
CONSTRUCTION

B.4 Data Collection System
B.4.1 water resource data
The management of water resources within the basin depends highly on the quantity and quality of hydrologic data relevant to the basin. Thus, the implementation of an efficient data collection system is crucial in the development and effective use of the basins' water resources.
B.4.1.1 rainfall data
Rainfall data, aside from other considerations, is important in the analysis and interpretation of surface and groundwater records. As such, a comprehensive rainfall station network is needed in the basin to provide the necessary information. At present, there are ten (10) existing stations within the basin, most of which are situated on plain areas. Based on NWRC recommended standards101 ,
the number of required stations for the basins is nine (9) for the flat plain areas and twenty-four (24) for rolling/mountainous areas. Thus, additional two (2) stations for flat plain areas and twenty-one stations for mountainous areas should be established in the area. This would give a more accurate picture of areal variation of rainfall within the basin.
B.4.1.2 streamflow data
Streamflow discharge measurements are the only direct means of quantifying the amounts of water relevant to the utilization and prevention aspects of water resources developments. As such, the installation, operation and proper maintenance of the instruments for flow measurement is a priority consideration in water resource planning. There are five (5) existing gaging stations within the basin, all of which are situated on flat plains. The total number required as recommended by NWRC,111 is seven (7) stations for flat plain areas and twentyfour (24) for the mountainous areas. Therefore, two (2) more stations for flat plain areas and twenty-four (24) stations for mountainous areas should be installed to monitor the streamflows of the major rivers, and their tributaries.
B.4.1.3 evaporation and other
climatic data
Evaporation and other related data, such as temperature and humidity, are important for water balance and agrometeorological studies of a basin. Studies performed on the Philippines have shown that evaporation water do not vary significantly with respect to location.12 /. In view of this, the NWRC recommends a station density of one station per 20,000 square kilometers. At present, no station is collecting evaporation data within the basin. Therefore, it is imperative to install the required number of evaporation stations so as to enable an accurate analysis of water resources in the area.
10/ NWRC, Manual of Water Data Standards, Vol. 2, 1979. 11/ NWRC, Manual of Water Data Standards, Vol. 1 1979.
12/ M.M. Obradovich "A Climatic Map of the Philippines, "Technical Series No. 15, WMO/UNDP Project, February 1973.
108

B.4.1.4 groundwater data
Involved with the groundwater development and management are seven (7) government agencies, namely: National Water Resources Council Bureau of Water Supply (Ministry of Public Works and Highways), Bureau ~f Mines National lrrig?tion Administration, Metropolitan Waterworks and Sewerag~ System, Local Water Utilities Administration, Army Corp of Engineers and Rural Waterworks Development Corporation. These agencies facilitate the collection of groundwater data essential for domestic, agricultural and industrial water supply.
Just recently, NWRC has been entrusted with the responsibility of coordinating water resources exploration and exploitation, defining some standards for groundwater development and data collection, undertaking special activities in surface-resistivity and assembling and synthesizing information necessary for the analysis of the complex groundwater situation.
The area has still inadequate data on groundwater. This could be attributed to the non-existence of uniform standards and systems of data collection. In view of this, NWRC has developed a manual on Water Data Standards. Furthermore, NWRC has initiated the listing of all water resources developments and their corresponding data of the country. This requires the submission of data from well drillers and well owners. Likewise, the registration of water users has been operationalized, but then, the response of the private sector has not been enough. Therefore, there is a neetl to improve the manner by which information could be effectively dessiminated in order to acquire on accurate and sufficient data essential for groundwater quantification.
To install groundwater station network, several factors should be taken into consideration. Among them are the sub-surface geologic conditions which influence the occurrence and distribution of groundwater resources in the area and the presence of other nearby wells or adjacent bodies of water. Since no specific installation requirements are prescribed, precautionary measures must be contemplated. Thi.s will ensure efficient development and utilization of groundwater resources.
B.4.2 land resources data
The agency responsible for providing land resources data is the Bureau of Soils. Input for the formulation of planning including land capability, soils, erosion, existing land use, and other relevant maps were generated with a high level of technical expertise. Activities however, need to be regularly undertaken and coordinated with other agencies as to the schedule and level of detail and relevance.
As part of the continuing efforts to improve the data collection system within the basins, agencies involved in the development of the basins' resources should be enlisted in the data collection efforts of the NWRC. The NPC, NIA, and Bureau of Soils are agencies having the technical manpower and resources which may be tapped for this purpose, and assimilation and storage can be integrated into the NWRC's Philippine Automated Water Information System
(PAWIS).
109

C. Development Impact Evaluation
C.1 Socio-Economic Impact Evaluation
C.1.1 general
The framework of development for the Misamis Oriental Basins is predicated on the twin complementary and interrelated strategies of proper and rational land tesource utilization on one hand, and water resource development and management on the other. Significant among the derivative strategies for development for the basins are the following:
raise the level of social services and facilities particularly those related to health and nutrition.
achieve self-sufficiency in food crops for the basin population.
increase in per capita and family income by exploiting to the fullest extent possible the basins' natural, industrial, and human resources.
improvement and expansion of infrastructure facilities to promote higher production and mobility of goods and services.
optimum land resource allocation based on rational criteria of maximizing productivity, environmental protection and resource conservation.
C.1.2 effects in basin income
Intercensal changes in mean family incomes have as a whole worsened for Misamis Oriental Basins over 10-year period. With the bulk of economic activities highly dependent on agriculture and land development, any attempt to increase population incomes will have to based on present income sources of the population notably farming and land based activities.
The package of projects found feasible at the basin level will have quantified and direct income increase effects for the target beneficiaries due to improved water management, higher levels of cropping and land cultivation intensity and flood control.
C.1.3 possible effect on income inequality
The distribution of family income share for the Misamis Oriental Basins have relatively improved with the decrease in percentage share of the Pl 0,000 and over income, and the increase in the :P:2,000 - P:6,000 income bracket. However, the under :P:2,000 income class continue to be consistently increasing over a ten year period contrasting the consistent percentage decreases of the P:6,000 -P:10,000 income group over the same period (Refer to Table Vll-C-1).
The trend in the concentration ratios in general for both urban and rural component shows moderate increases from 1961 to 1975. Urban concentration ratio from 1961 to 1965 however, moderately faltered but increased onwards 1975. Inequality index for the basin shows that the distribution of family incomes have relatively changed (Table Vll-C-2).
110

Table Vll-C-1 PERCENT OF FAMILIES BY INCOME CLASS AND
CENSAL YEARS
Misamis Oriental Basins
1965
Under 2,000 28.2
2,000 - 6 ,000 40.9
6,000 - 10,000 16.1
10,000 - over 14.8
Per Cent Below Mean Family Income 31.3
Table Vll-C-2 SELECTED INCOME MEASURES
1961, 1965, 1971and1975
Misamis Oriental Basins
1961 1965
GINI RATIO
Basin .4813 .4906
Urban .4955 .4943
Rural .4886 .4918
FAMILY INCOMES {In Pesos) 2,795 3,486
FAMILY INCOMES DEFLATED 2,236 2,091 By 1965 CPI {In Pesos)
INDEX OF INTRA-BASIN .3966 .4180 INEQUALITY
C.1.4 spin-off impact on land reform development
1971
30.9
40.1
15.6
13.4
36.8
1971
.4934
.4982
.4937
4,864
1,945
.4188
1975
32.5
41.5
13.7
12.3
39.4
1975
.4990
.5041
.4974 5,917
1,775
.4233
Correlating the income measures with land ownership distribution for all crops indicated a similar pattern. The size of land distribution were fragmented in nature with the majority of households at about 76 per cent owning the smaller parcels of lands {1.0 to 4.9 hectares) which stood at 42 per cent of the total farm area. Less than 1 per cent owned the bigger parcels (25 hectares and above) which is about 21 per cent of the total farm lands.
Increases in land productivity in the basins will be greatly dependent on the actual size of land area being farmed by the household. A principal reason for this being technology and manner of cultivation. Much of the anticipated changes
111
in cropping intensity will largely be brought about by improved water control and management, provision of water for rice and other crops, and supportive extension services. Current trend in land ownership and distribution for the basin however is not conducive to these development activities. Various measures
' in land owners~ip and distribution indicate that the smaller farm areas per house-hold were within the lower farm-size brackets and the greater number of households per hectare were in the lower farm brackets (See Table Vl-B-3). The concentration of land-ownership distribution is also evidenced by the Lorenz curve for the basin indicating a ratio of 0.4348.
A precondition for income transfer in the rural areas of the basin will still therefore be highly dependent on land transfers, particularly in the food producing areas. Direct government investments in social overhead capital in water resources related infrastructure projects will not in themselves guarantee significant effects in reducing income inequalities caused by unequal ownership distribution patterns. Since much of the productivity increases are predicated on agricultural land development and improved farm technological usage, one important policy implication is the adjustment of water resource projects to benefit those presently without the physical preconditions.
The effects therefore of the package of projects for water resources development on income redistribution and land inequalities will largely be prepositioned on the development of institutional factors such as patterns of land ownership and the rate of land transfer in the basin. Full irrigation development of system identified in the basins can generally provide the material conditions whereby land reform can be accelerated. Conversely, the institution of a reform coverage in the basins area can substantially hasten the water resource development.
C.1.5 effects on employment generation in the agricultural sector
Development activities for the Misamis Oriental Basins consist of irrigation development, provision of water supply for various sectors, flood control and drainage, land development and other land improvement schemes. Employment generation for these activities will largely consist of:
1)
2)
3)
Those related to land expansion and improvement schemes;
Those associated with spin-off effects due to the increased activities in the above investments; and
Those pertaining to direct public expenditures.
The labor force for the basin is estimated to increase at an annual growth rate of 3 _per cent from 1975 to year 2000. With an unemployment rate of 4.3 per cent in 1975, the rural sector will have to provide additional new jobs within the next decades. Much of these will have to originate from increased activities in this sector.
112

124°15' 124°30' 124°45'
9°15'
-8°45'
a0 15•
124°15• '124°45'
113
I::,. TAGALAON IV DAM
LEGEND: I;;, NPC PROJECT
e PROPOSED OAMSITE
~ POTENTIAL OAMSITE
---- WATER RESOURCE REGION BOUNDARY
~ RIVER,CREEl<
Figure VI 1-8-1 WATER IMPOUNDING RESERVOIR
PROJECTS
MISAMIS ORIENTAL BASINS SCALE IN KILOMETER F*MI ,_..-;r---1 ,.---:i I 5 0 5 10 15 20 25 30KMS
125°00· 125°15' 125°30"

C.2 Environmental Impact Evafuation
In any national development, it is necessary to seek a balance between economic progress and environmental esthetics. However, only a general description of the environment and probable deductions in river basin planning have been made requiring still further research and evaluation.
The proposed water resource development would yield suitable results that would enhance the economic and social development of the country. Such desirable outcomes are: decreased soil erosion, improved watershed and forest management, expansion of fisheries, reduced stream and reservoir sedimentation, increased dependable water supply and groundwater resources, improved scenic attractiveness, improved health and standard of living and increased employment and income.
C.2.1 natural vegetation and wildlife
The basin area is completely dominated by grass, shrubs, pastures and forest growth which are limited generally at the eastern and southwestern borders of the basin followed by rice paddies and diversified crops.
There are ten (10) designated areas as forest reserves, game refuges and bird sanctuaries. These are the following:
1. Maalisbilsan Watershed Forest Reserve, Misamis Oriental (1.182 has.)
2. Mt. Paiyak Forest Reserve, Misamis Oriental (6,482 has.)
3. Cagayan Forest Station Site Reserve, Misamis Oriental (4.43 has.)
4. Libertad Spring Forest Reserve, Misamis Oriental (52 has.)
5. lnitao Game Refuge and Bird Sanctuary, Misamis Oriental (57 has.)
6. Mahaganao Watershed Forest Reserve, Misamis Oriental (106 has.)
7. Lianga Ninatuan Forest Reserve, Misamis Oriental (20.335 has.)
8. Ayo Matigol Forest Reserve, Bukidnon (20.326 has.)
9. Magobo-Tagabola Forest Reserve, Bukidnon (1, 132 has.)
10. Punta Diwata Forest Reserve, Agusan del Norte (1,248 has.)
There are at least four (4) areas that may be possibly affected by the proposed water re~ource development projects, dams and reservoirs which are mainly for hydroelectric, flood control and irrigation. These are:
1. Cagayan Forest Station Reserve 2. Mahaganao Watershed Forest Reserve 3. Ayo Matigol Forest Reserve 4. Magabo-Tagabola Forest Reserve
The greater portions of the area are under secondary forest growth and generally grasses and shrubs. Among these commonly secondary growth species
114

are tibig (Ficus nota), binunga (Macaranga tanarius), dita (Alstonia scho/aris), anabiong (Trema orientalis), anonang (Cordia dichotoma), morang (Artocarpus odoratisima), alim (Me/eno/epsis mu/tiglandulosa), banato (Ma/lotus phi/ippinen_sis),_ and ipil-ipil (Leucaena glauca). Growth of grasses, cogon (/mperata cylmdnca) are·also of great abundance in the rolling areas and some of the hills.
Vegetation is predominantly forest growth and supports diverse species of birds, fowls, reptiles and mammals.
Environmental change caused by water impounding projects may influence wildlife and vegetation. During the construction stage of these reservoir projects, certain activities which cause physical disturbances and alterations in the environment may have adverse effects on animal life such as reduction of animal forage as a result of clearing of underbrush. Likewise, if extensive agricultural activities will be undertaken as a result of proposed projects, application of herbicides and pesticides will diminish shelter and food. Fencing restrains animal movement and access to food and water areas. Hence, habitats that are disturbed may have adverse effects on their existence, for example cutting of forest trees that are primarily nesting places of birds may result in a reduction in their numbers.
Vegetation is also affected by such agitation. Acquisition of lands for nonagricultural purposes is likely to have the greatest impact. Reservoir construction and operation along various surface runoff control projects, may affect large areas of field since the area is abundant in rice paddies and corn lands. The impounding may raise groundwater levels, flooding the systems and consequently damaging crops. Aside from field crops, natural land vegetation, such as trees, grasses and shrubs may also be affected. Land clearing activities prior to construction, burning, application of herbicides and paving materials contribute to the harmful effects in the ecosystem.
Measures must then be implemented to preserve the diversification of vegetation, wildlife and their habitat. If construction activities are confined in an area where possible habitats are agitated, such disturbances must be minimal. Mitigation effects on herbicidal applications directly to the stumps of vegetative crops may also be effective provided they are vegetatively dormant. Land clearing must be limited to an absolute minimum.
Therefore, planning should ensure the minimization of expected adverse effects.
C.2.2 fisheries and water quality
No detailed survey on fisheries development have been made by the Bureau of Fisheries and Aquatic Resources (BFAR) for this basin.
As reported by the National Pollution Control Commission (NPCC), the water quality data (dissolved oxygen and biochemical demand, chloride total hardness, pH, etc.) obtained from the sampling stations of Solana, Odiongan, Gingoog and Cabulig rivers in Misamis Oriental showed that each factor falls within the required water criteria.
Untreated domestic and industrial effluents contribute to the changes of water quality primarily those coming from certain industries such as food
115

canneries or processing plants. This is true. for this basi~ wh~re ~he Basins Incorporated, an industrial firm located beside the Cab~hg River m Jasa_an. Waste water is discharged directly into the river, t~us ~lte_rmg the water qu_ali_ty. However, concentrations of these effluents are st1!l within the allowable hm1ts. Furthermore, domestic sewage effluent also contribute to the chan_ges of water quality of the basin and it is at the same time hazardous to public healt_h. It can result in harmful effects to aquatic life and the spread of communicable
diseases especially water borne. During the construction stage, with the removal of vegetation, stream
erosion may increase, since there is little or no retardation from heavy rains. As a result continuous erosion occurs thus reducing oxygen or even preventing photosynth~sis in algae, water moss and other aquatic plants. With excessive erosion, drainage from fertilized agricultural lands may have unlimited side effects. Pesticide analyses showed that amounts of dieldrin, aldrin heotachlorepoxide, 0-P-DDT and other hydrocarbon derivatives are present which may have been used for agricultural or for public health pest control but concentrations are still within the allowable limits.
In response therefore to the potentially harmful ecological effects of increased pesticide levels, the government has banned the use of persistent chlorinated hydrocarbon pesticides. Such chemicals derived from industrial effluents, have undesirable effects on fish and other organisms, since industrial wastes are acidic and toxic to aquatic life, thus, limiting the capacity of water for fish production. Enforcement has remained to be difficult, therefore local efforts must be increased to replace the persistent pesticides with the less degradable ones. Direct government control of the use of toxicants in the reservoir is an important part in reservoir planning.
The erosion and sedimentation of rivers that may result from construction activities that are related with irrigation and drainage, may be lessened if construction activities are done during the dry season. Another alternative is application of adequate erosion control on the contributing drainage area. Land should be covered with permanent trees or grasses, to reduce surface runoff from the surrounding upland area. If such is not suitable, other agricultural conservation practices may be applied.
Return flows from irrigation will increase salinity in the downstream receiving waters. In addition, surface waters from irrigation could increase the extent of salt water intrusion. Since irrigation is mainly for agricultural purposes, some crops are sensitive to salinity, thus giving a reduction in yield compared to non-saline conditions. Lack of proper drainage in an area with a high water table will result in the rise of groundwater thereby increasing salt intrusion. Therefore, improved drainage will increase river flows, hence diluting effects of pollutants and preventing an increase in tidal intrusion and salt content.
C.2.3 soils
The soi_I types in the b~sin area are a <;om bi nation of clayey and loamy. A grea_ter portion o_f the area 1s covered with secondary forests. The area may be cultivated to agricultural crops or for pasture provided that farm management
116
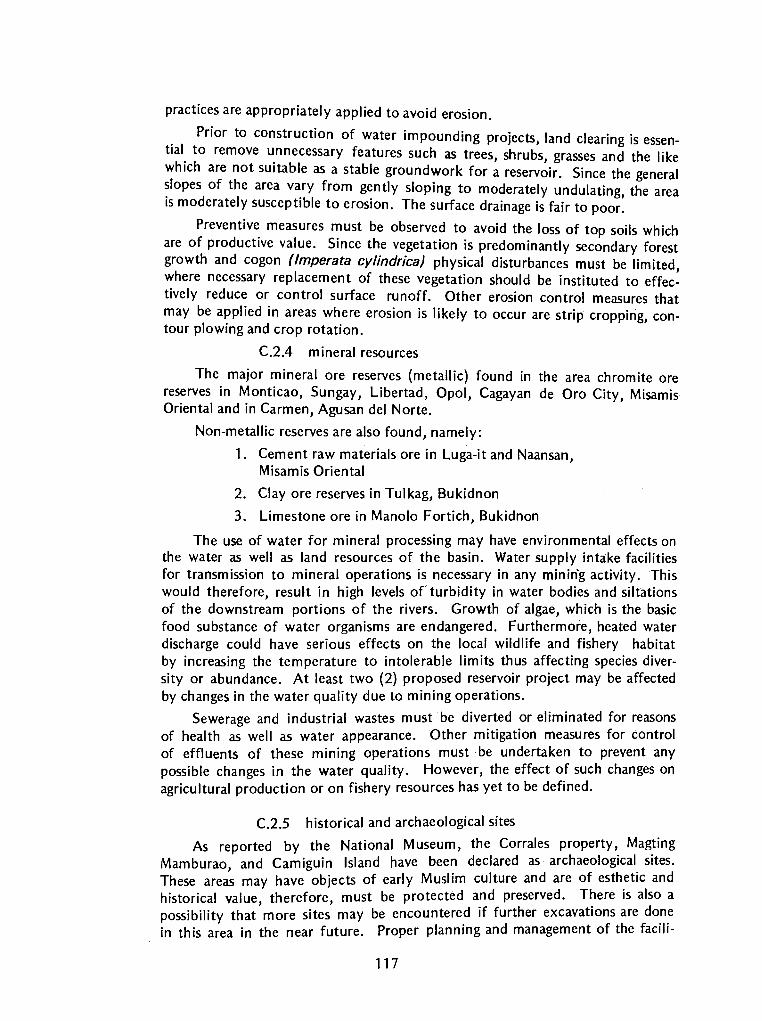
practices are appropriately applied to avoid erosion.
. Prior to construction of water impounding projects, land clearing is essen-tial. to remove ~nnecessary features such as trees, shrubs, grasses and the like which are not suitable as a stable groundwork for a reservoir. Since the general ~lopes of the area v~ry from gently sloping to moderately undulating, the area 1s moderately susceptible to erosion. The surface drainage is fair to poor.
Preventiv~ measures must be observed to avoid the loss of top soils which are of productive value. Since the vegetation is predominantly secondary forest growth and cogon (/mperata cylindrica) physical disturbances must be limited where necessary replacement of these vegetation should be instituted to effec~ tively reduce or control surface runoff. Other erosion control measures that may be a~plied in areas where erosion is likely to occur are strip cropping, contour plowing and crop rotation.
C.2.4 mineral resources
The major mineral ore reserves (metallic) found in the area chromite ore reserves in Monticao, Sungay, Libertad, Opol, Cagayan de Oro City, Misamis Oriental and in Carmen, Agusan del Norte.
Non-metallic reserves are also found, namely:
1. Cement raw materials ore in Luga-it and Naansan, Misamis Oriental
2. Clay ore reserves in Tulkag, Bukidnon
3. Limestone ore in Manolo Fortich, Bukidnon
The use of water for mineral processing may have environmental effects on the water as well as land resources of the basin. Water supply intake facilities for transmission to mineral operations is necessary in any mining activity. This would therefore, result in high levels of turbidity in water bodies and siltations of the downstream portions of the rivers. Growth of algae, which is the basic food substance of water organisms are endangered. Furthermore, heated water discharge could have serious effects on the local wildlife and fishery habitat by increasing the temperature to intolerable limits thus affecting species diversity or abundance. At least two (2) proposed reservoir project may be affected by changes in the water quality due to mining operations.
Sewerage and industrial wastes must be diverted or eliminated for reasons of health as well as water appearance. Other mitigation measures for control of effluents of these mining operations must be undertaken to prevent any possible changes in the water quality. However, the effect of such changes on agricultural production or on fishery resources has yet to be defined.
C.2.5 historical and archaeological sites
As reported by the National Museum, the Corrales property, Magting Mamburao, and Camiguin Island have been declared as archaeological sites. These areas may have objects of early Muslim culture and are of esthetic and historical value, therefore, must be protected and preserved. There is also a possibility that more sites may be encountered if further excavations are done in this area in the near future. Proper planning and management of the facili-
117

ties which would be associated with these water impounding projects is necessary. It is also imperative that any earthworks to be done in the basin have prior consultation with the concerned agency.
C.2.6 vectors and public health
Aside from the common human diseases (enteric, metabolic, respiratory, etc.) water-borne diseases such as cholera, typhoid and El Tor are very common in the area but of all the diseases, there was a considerable number of estimated cases of s~histosomiasis during 1980. Of the ten leading causes of morbidity and mortality over the periods of 1975 and 1977, reported cases of gastroenteritis ranks first based on rates per 100,000 population, followed by dysentery with malaria ranking third in the area. Cases of schistosomiasis are not known to occur except in Bukidnon, however probability of spreading may occur upon construction of the proposed water related projects.
One of the most significant results that may follow in any water resource development is the production of more breeding places of vectors (flies, mosquitoes, snails, etc) therefore, increasing the prevalence of the disease.
For example, schistosomiasis is essentially a "water-based" disease being dependent on an aquatic intermediate host, namely, the snail (Oncome/ania quadrasi). The host is adapted to a wide· range of environmental conditions. They breed in different sites in the presence of water and solid surfaces for deposition of eggs and some food supply. Snails do not thrive in the presence of human excrement but also in unpolluted water as long as there is enough supply of food (weeds, algae and other micro-organisms); The most common parasitic worm (schistosome) in the tropics is the Schistosoma japonicum.
Upon completion of water impounding projects, prevalence of the disease would increase, since surface area is widened. Plant growth consequently colonizes the shorelines, thus doubling the probability of the development and incidence of the schistosome carrying snail. Mats of weeds and other floating vegetation infested with the snai1 host, may be transported downstream spreading the disease in other areas where none existed before.
The disease, is oftentimes associated with irrigation systems. Irrigation schemes that have failed to achieve its productivity due to defective drainage form stagnant pools, wet areas and seepages which are ideal snail habitats.
One of the most significant result that may also follow upon impounding is the outbreak of the malaria disease. Plasmodium vivax and P/asmodium falciparum are the most prevalent types of malaria and is more difficult to control by antimalarial drugs. No program of malaria control can succeed as long as female anopheles mosquitoes are permitted to breed. Mosquitoes like most other two-winged insects pass through four (4) stages of development: the egg, larva, pupa and the fully developed insect of which the first three (3) stages occur in water.
The transmission of arbovirus diseases, such as malaria is associated mainly with irrigation areas linked to dams. The increased amount of land devoted to rice cultivation in irrigated areas may also tesult in extensive development of malaria.
118

The creation of an impounding project in an area where it has been previously a free flowing stream may lead to a complete reversal of the mosquito situation and consequently introduce a very serious malaria hazard in other areas. Shallow water at the edges of reservoir promotes the growth of these water weeds, which provides good breeding places for mosquitoes. Impoundments may be beneficial insofar as they may destroy breeding places, except, breeding may consequently take place in spillways and below the dams.
Although mass human treatment may be the easiest and most promising method for treatment of such water-borne diseases it may also be proven inadequate for the following reasons: defective and untidy irrigation, inadequate facilities for excreta disposal and lack of health education and unsanitary practices of inhabitants. To carry out environmental control there must be cooperation between public health service agencies and the local inhabitants.
Water -development projects may improve the situation in these areas when preventive measures are observed. These measures include sitting of housing away from canals; provision of adequate and safe water supply and sanitation provisions for bathing, water recreation, laundering shoreline sanitation; education of the human population to improve its habits in disposing wastes and excreta; provision of foot bridges; control of astray animals and improved monitoring systems to assure early detection of any adverse effects.
C.2. 7 socio-cultural aspects
The cultural minority groups within the basin are the Manobos, in Bukidnon.
Settlements of these groups may not be directly affected by the proposed damsites and irrigation projects.
D. Institutions
The network of institutional relationships in water resource management at the river basin or water resource sub-region level includes national, regional and local
agencies. The national officers work through their field offices, special projects or task
forces. Their range of activities cover policy form~lation, co~rdination,_ pla_nning a~d project development, construction and the operation o~ p~o1ects, mon1~onng, training, research and data management, regulatory and adjudicatory functions and en-forcement of legal measures.
A brief description of the organizational structure, functions and activities of these agencies at water resource area-level are presented in the succeeding paragraphs:
D.1 National Organizations
D.1.1 the National Economic and Development Authority (NEDA)
The NEDA is the highest planning and coordinating body in the country. It fays down the overall policy guideline~ for the long range dev_elopment of water resources and related sectors as vital components of the Five, Ten and Twenty-Five Year National Development Plan.
119

124°15' 124°45'
.g045•
ALUBIJID RB
8°30'
Luga it
a0 1s·
LEGEND:
~FOREST
1111. ~s~~~~. Marshes, Swamps)
124°15' 124°45'
120
125°00·
fj.~::• .. }:l SCH ISTOSOM IASIS
• e • • '
FOREST RESERVES, GAME REFUGE AND BIRD SANCTUARY
PROPOSED OAMSITE
MALARIA AREAS
MINERAL RESERVES
CULTURAL MINORITIES
Figure Vll-C-1 MAJOR AREAS OF
SIGNIFICANT ECOLOGICAL INTEREST MISAMIS ORIENTAL BASINS
SCALE IN KILOMETER .,..._., .......... .......... I I 5 0 5 10 15 20 25 30KMS
125°00· 125°15'
a0 JO'

The main control mechanism available to NEDA in effectively pursuing its coordinative functions and imposing its policies are its review and approval of projects for inclusion in the annual national budget. Technical review is exercised by the appropriate staff under NEDA and through inter-agency committees that are organi'Zed from time to time to handle special review functions.
The policy, plan coordination and technical functions of NEDA are decentralized at the regional level through its Regional Offices. The regional office serves as the secretariat and technical arm of the Regional Development Council (RDC) and extends, when necessary, technical assistance and consultancy services to regional and local government offices.
The Five and Ten-Year Regional Development Plans for Regions IX and X were completed by the NEDA in 1977.
D.1.2 The National Water Resources
Council (NWRC)
The NWRC was created by virtue of Presidential Decree No. 424 to coordinate and integrate all activities related to water resource development and to exercise regulatory and adjudicatory functions relative to water rights and other provisions of the Water Code of the Philippines.
In addition to its regular functions, the NWRC has a special interim responsibility of organizing through a task force, water associations and cooperatives in rural areas of non-PDAP provinces, and provides technical, institutional and financial assistance to the same until such time that a permanent institutional arrangement has been formed.
In line with its planning and research functions, the NWRC undertakes the preparation of integrated regional water resource development frameworks using the river basin as the unit of data generation and analysis, project identification, evaluation and planning. Part of this exercise is the framework plan for the Davao Oriental Water Resource Sub-Region and the regional development framework for Water Resource Region.
o: 1.3 The National Irrigation Administration (NIA)
The NIA is a corporate body having responsibility for the planning, construction, operation arid maintenance of all national irrigation systems as well as government funded communal and pump irrigation systems. It is also empowered to construct multi-purpose water resource projects in coordination with other agencies. The NIA also undertakes supportive activities like road construction, reforestation and extension services.
The latest inventory of on-going and proposed irrigation projects shows that an additional area of approximately 4,600 -hectares and another 1,095 hectares will be served by national and communal systems, res~ectively.
NIA works in coordination with the BPW in the task of designing and constructing drainage facilities and protective works in the agricultural areas served by the NIA projects. With regard to hydroelectric power development, NIA
121

works in coordination with the National Power Corporation.
The NIA also establishes and operates climatological and hydrographic measuring stations.
D.1.4 The Former Bureau of Public Works (BPW)
The former BPW was the largest line agency of the Ministry of Public Works. It undertook singly or in cooperation with related agencies the planning and implementation of infrastructure projects of the following categories: flood control, reclamation and drainage, waterworks systems, artesian wells and springs and other public works. It also maintained stream agrometeorological stations all over the country. At the basin level, these functions were exercised by the bureau's district offices.
The BPW maintained 13 gaging stations within the basins. It also had a continuous ·development program for waterworks systems for the major settlements as well as the construction of well and springs. The latter is carried out in cooperation with the local government units of the area.
D.1.5 The National Power Corporation (NPC)
The NPC undertakes the development of electric power generation facilities including hydro-electric and geothermal power and the construction and operation of dams, reservoirs, diversion facilities, and plants required for this purpose. The agency is authorized in coordination with NIA and BPW, to assume the lead where the hydro-electric purpose is of primary importance in multipurpose projects.
To meet the various requirements of the basin for electric power, the NPC will construct a number of thermal and hydro plants. There will be four thermal plants with total loads of 341 mw and also hydro plants with total loads of 716 mw. To meet the systems' requirements with the least expected suppression of load growth, 3 coal-fired thermal plants of 150 mw each are ·programmed. These will be located in Davao City, Nasipit, Butuan City, and probably Surigao City since endline generating stations are imperative to achieve supply reliability and voltage stability.
D.1.6 The Bureau of Forest Development (BFD)
The BFD has authority over the protection, development and management of all forest lands, grazing lands and all forest reservations including watershed reservations. A total of 156,217 hectares of forest reserves located in Surigao del Sur and Davao Oriental with a total of 134, 907 has. and 22,000 has., respectively have been proclaimed.
D.1.7 The Bureau of Soils (BS)
The Bureau of Soils is responsible for the assessment development and conservation of soil resources, conduction of research, and the management and conservation of soils in the country.
It also conducts specific area surveys upon request and specific projects which require an updated and detailed soil data.
122

D.1.8 The Ministry of Local Government and Community Development (MLGCD)
The MLGCD provides advice and assistance to local governments and communities. to improve and support their operations through training, education, cooperatives, and technical and financial assistance. These functions are performed through its regional, provincial and municipal offices.
Part of the Ministry's program is the "Barangay Water Supply Project" in 25 provinces nationwide to provide potable water supply to rural communities with populations ranging from 500 to 5,000 persons.
Likewise, the "Barangay Road Program" of the Ministry is undertaken in cooperation with the Ministry of Public Highways.
D.1.9 The Farm Systems Development Corporation (FSDC)
The FSDC was created to aid in organizing farmer irrigators associations, and in providing technical and financial assistance in the establishment of irrigation facilities in areas outside the NIA 's development program. In addition, it extend~ production, processing, diversification and marketing support to farmers.
FSDC's present efforts are concentrated on compact farmlands of less than 1,000 hectares that have been or are to be transferred to farmer-vwners under the Operation Land Transfer of the Ministry of Agrarian Reform.
D.1.10 The Local Water Utilities Administration (LWUA)
The LWUA is a national agency which provides technical, financial and management services to local water districts to assist them in the development and operation of water utilities. The priority areas under the long-range LWUA program include some 300 cities and towns with at least 20,000 population, further prioritized for actual development using the criteria of viability of and need for the service.
D.1.11 The National Electrification Administration
The N EA is the national agency that takes charge of the transmission and distribution of NPC supplied power. The NEA organizes and assists electric cooperatives, manages operations, maintains facilities and collects electric fees.
D.1.12 The Philippine Atmospheric, Geophysical and Astronomical Services Administration (PAGASA)
The PAGASA was created to operate a system for weather forecasting, collect and disseminate climatological data and study seismic disturbances, among others.
123

At present, there are four (4) stations in the basins, namely a synoptic station, a rainfall station, a Cooperative Climatological station and a cooperative rain station.
D.1.13 The National Schistosomiasis Control Council (NSCC)
This agency is charged with the formulation and the coordination of the implementation of a comprehensive schistosomiasis control program. Other functions include the development of an effective information ·and evaluation campaign and the conduction .of special studies related to control and treatment.
It is composed of six agencies, namely the Ministry of Health, the Ministry of Public Works, the Ministry of Local Government and Community Development, the National Irrigation Administration, the Ministry of Agriculture, and the Ministry of Education and Culture, all of which actually implement formulated programs and projects.
The NSCC has identified three out of the 30 municipalities of the Davao Oriental Basins as endemic schistosomiasis. The estimated number of affected persons reached 77,594 with the estimated number of cases at about 26,150. The estimated snail areas covered 1,061 hectares.
D.2 Regional Organization
D.2.1 The Regional Development Council (RDC)
The RDC serves as the regional policy and coordinating body. Its membership consists of the regional directors of NEDA and national line agencies, the governors of the member provinces, and where there are chartered cities within the region, the mayors of such Cities.
Because of its comprehensive membership, the RDC has the capability to integrate the programs of agencies having water related activities with the development strategies for the region, and in support of water-related sectors. Moreover, because· the provinces and cities are represented in the RDC, water related projects at lower levels are likewise integrable with the regional policies, strategies and programs.
D .2.2 Regional Sectoral Agencies
Sectoral agencies are decentralized at the regional and provincial level in varying degrees and in some cases, the planning, decision-making and programming of development projects may be done autonomously by the regional agency .
. One ~f the most decentralized agencies is the Ministry of Health's regional o~f1ce, wh!ch. can undertake programs in cooperation with related agencies and with provinc1.al and. local governments for such objectives as the improvement of health services, water supply and community health facilities.
124

D.3 Local Governments
D.3.1 Provincial Government
Under a decentralized local government system the provincial government has powers to generate development funds and work in partnership with national line agencies and other entities to improve social conditions and develop related infrastructure. Particuf ar areas of involvement include irrigation, roads, electric power and water supply.
D.3.2 Municipal and Barangay Governments
Since the local population is generally the target beneficiary of water resource development projects, the involvement of the local water governments and participative groups cannot be overemphasized. However, since the financial costs of most projects are hardly within the investment capability of these local units, their participation centers mostly in the non-monetary aspects of projects like cooperative labor and at times free voluntary operation of completed projects. Counterpart funds are sometimes required but often the amount involved is minimal, with the national or other organizations taking the larger share of the financial burden.
Examples of the projects where local government participation is of significance are barangay water supply, local waterworks and other social improvements, including watershed management.
125

APPENDICES
Appendix A Appendix B Appendix C Appendix D Appendix E
Water Resources Land Use Economics Social Power

APPENDIX A
WATER RESOURCES
o Drainage Area of the Misamis Oriental Basins
o Drainage Map
o Classification of Climate
o Minimum, Mean, Maximum Monthly Temperature and Relative Humidity Data -Cagayan de Oro
Figure A-1 Temperature Figure A-4 Relative Humidity Table A-1 Monthly Mean Minimum Temperature Table A-2 Monthly Mean Maximum Temperature Table A-3 Monthly Mean Temperature Table A-4 Relative Humidity
o Statistical Parameters of Monthly Rainfall
Table A-5 Liboran, Baungon, Bukidnon Table A-6 lmpasugong, Bukidnon Table A-7 lmpalutao, lmpasugong, Bukidnon Table A-8 Damilag, Manolo Fortich, Bukidnon Table A-9 Phillips, Manolo Fortich, Bukidnon Table A-10 Cagayan de Oro, Misamis Oriental
o Table A-11 - Rainfall Depth-Duration Frequency Analysis
o Statistical Parameters of Monthly Runoff
Table A-12 Cagayan River, Tinib, Cagayan de Oro City, Misamis Oriental
Table A-13 lponan River, Pagatpat, Cagayan de Oro City Table A-14 Alubijid River, Mu nay, Alubijid, Misamis Oriental
o Table A-15
o TableA-16 o Table A-17
Annual Peak Discharge of Rivers
Annual Minimum Flows of Rivers Existing Flood Damage Protection Measures
o Groundwater Mining Picture Figure A-3 Misamis Oriental Basin (Sub-Basin). Figure A-4 Balatokan River Basin Figure A-5 Linugas River Basin Figure A-6 Alubijid River Basin Figure A-7 Ginoog River Basin Figure A-8 Odiongan River Basin Figure A-9 Cabulig River' Basin Figure A-10 - Man du loy River Basin Figure A-11 - lponan River Basin
129
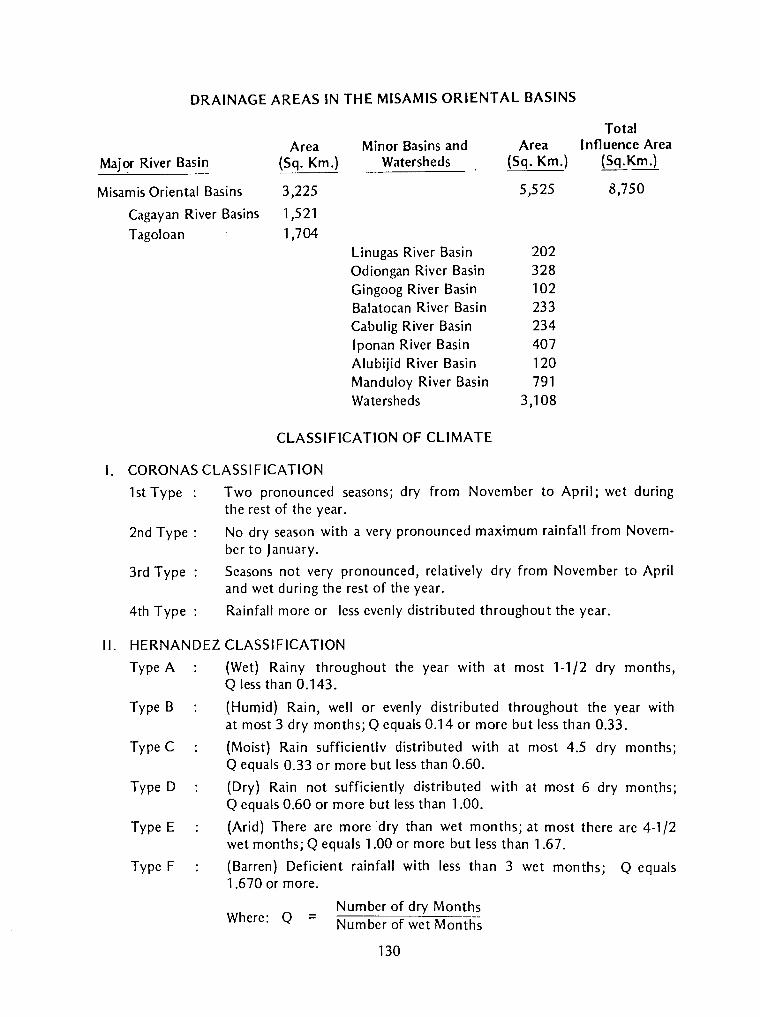
DRAINAGE AREAS IN THE MISAMIS ORIENTAL BASINS
Major River Basin
Misamis Oriental Basins
Cagayan River Basins Tagoloan
Area (Sq. Km.)
3,225
1,521 1,704
Minor Basins and Watersheds
Area (Sq. Km.)
5,525
Total Influence Area
(Sq.Km.)
8,750
Linugas River Basin Odiongan River Basin Gingoog River Basin Balatocan River Basin Cabulig River Basin lponan River Basin Alubijid River Basin Manduloy River Basin Watersheds
CLASSIFICATION OF CLIMATE
202 328 102 233 234 407 120 791
3,108
I. CORONAS CLASSIFICATION
lstType :
2nd Type:
3rd Type
4th Type
Two pronounced seasons; dry from November to April; wet during the rest of the year.
No dry season with a very pronounced maximum rainfall from November to January.
Seasons not very pronounced, relatively dry from November to April and wet during the rest of the year.
Rainfall more or less evenly distributed throughout the year.
11. HERNANDEZ CLASSIFICATION
Type A
Type B
Type C
Type D
Type E
Type F
(Wet) Rainy throughout the year with at most 1-1 /2 dry months, Q less than 0.143.
(Humid) Rain, well or evenly distributed throughout the year with at most 3 dry months; Q equals 0.14 or more but less than 0.33.
(Moist) Rain sufficientlv distributed with at most 4.5 dry months; Q equals 0.33 or more but less than 0.60.
(Dry) Rain not sufficiently distributed with at most 6 dry months; Q equals 0.60 or more but less than 1.00.
(Arid) There are more dry than wet months; at most there are 4-1/2 wet months; Q equals 1.00 or more but less than 1.67.
(Barren) Deficient rainfall with less than 3 wet months; Q equals 1.670 or more.
Where: Q = Number of dry Months Number of wet Months
130
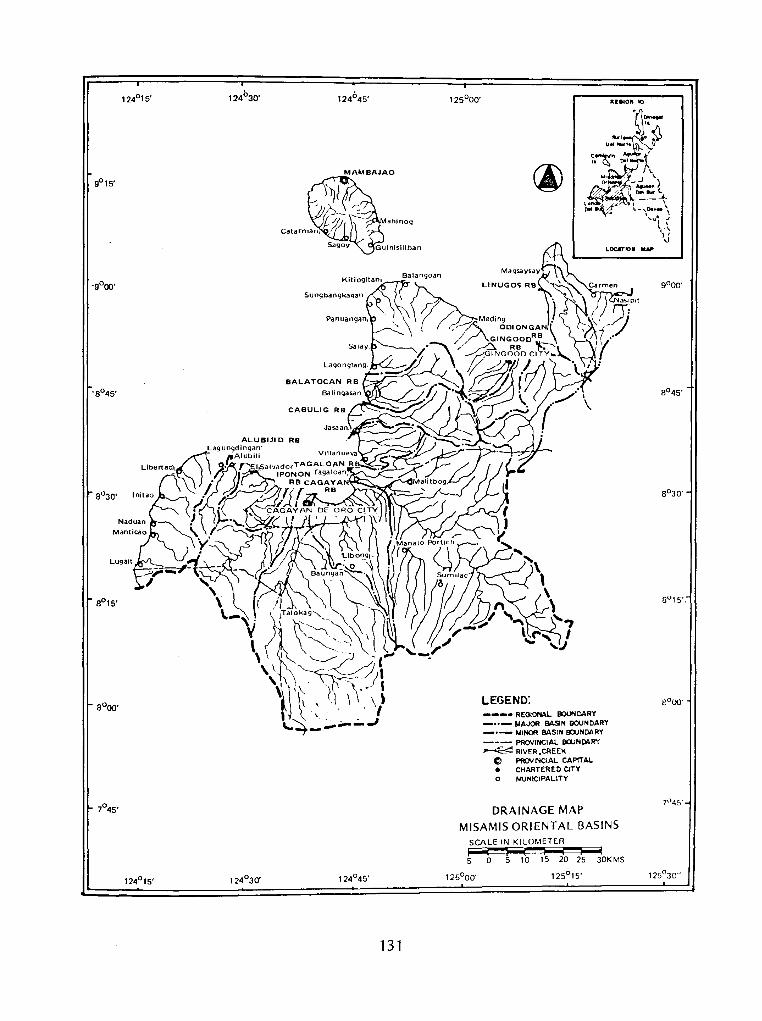
124°30'
8°30'
Lugait
8°15'
124°45'
131
lllife.ION IO
lOCA:T"IO• MU
Magsaysay
LEGEND: ---• REG!ONA.L BOUNDARY -··-MAJOR BASIN OOUNDARY -·- MINOR BASIN !DJNOARY --- PROVINCIAL BClJN~R':' ~RIVER ,CREEK
CJ ~INCIAL CAPITAL • CHARTERED CITY O MUNtclPALITY
DRAINAGE MAP MISAMIS ORIENTAL BASINS
SCALE IN KILOMETER ~P'"""""':~I 5 0 5 10 1 5 20 25 JOK MS
125°00· 125°15·
8°30'

Ill. KOPPEN CLASSIFICATION
AF Climate
Tropical Wet Climate
Temperature of coolest month above 18°C; rainfall of the driest month is at least 60 mm. Within this climate, there is a minimum of seasonal variation in temperature and precipitation. Both remain high during the year.
AW Climate
Tropical Wet and Dry Climate
Temperature of the coolest month above 18°C, distinct dry season in low-sun period or winter; characterized by a marked seasonal rhythm of rainfall; at least one month must have less than 60 mm. of rainfall.
AM Climate
Tropical Monsoon Climate
Temperature of the coolest month above 18°C, short dry season but with total rainfall so great that the ground remains sufficiently wet throughout the year to support rain forests; rainfall of the driest month is below 60 mm. It is intermediate between AF and AW, resembling AF in amount of rainfall and AW is seasonal distribution.
CF Climate
Warm Temperature Rainy Climate
Average temperature of coldest month below 18°C but above 3°, average temperature of warmest month over 1 o0 c, no distinct dry season, the driest month of summer receives more than 30 mm. of rainfall.
CW Climate
Warm Temperature Rain Climate
Average temperature of coldest month below 1 s0 c but above 3oc, average temperature of warmest month over 1 o0 c, winter dry; at least ten times as much rain in the wettest month of summer as in the driest month of winter.
132

w w
40
30
2 0
0
Figure A-1 MINIMUM, MEAN, MAXIMUM MONTHLY TEMPERATURE
CAGAYAN DE ORO CITY
,,,..,... //
-· ,_.,/
v v -~
TEMPERATURE DATA oc
·--- ....._ ·-· ·-·
-
·-. -· -......
~ r---.._
I
.......
-
t.--·--·- I '"-·-_ . .--·->--·-.___.,
I' . ·-"--·-
..__.
. F M A M A s 0 N D
-- ·MINIMUM MEAN ---·- MAXIMUM
PERIOD OF RECORD: 1961 - 1977
100
90
80
70
60
50
40
:>...._
~"
"
F M
Figure A-2 MAXIMUM, MEAN, MINIMUM
CAGAYAN DE ORO CITY MISAMIS ORIENTAL BASINS
RELATIVE HUMIDITY(%)
,P--.
I/
~ [_/
A M A
LATITUDE: 8°29'00" LONGITUDE: 124038'00"
PERIOD OF RECORD: 1961 -1977
-~ ,..V'
s 0 N D
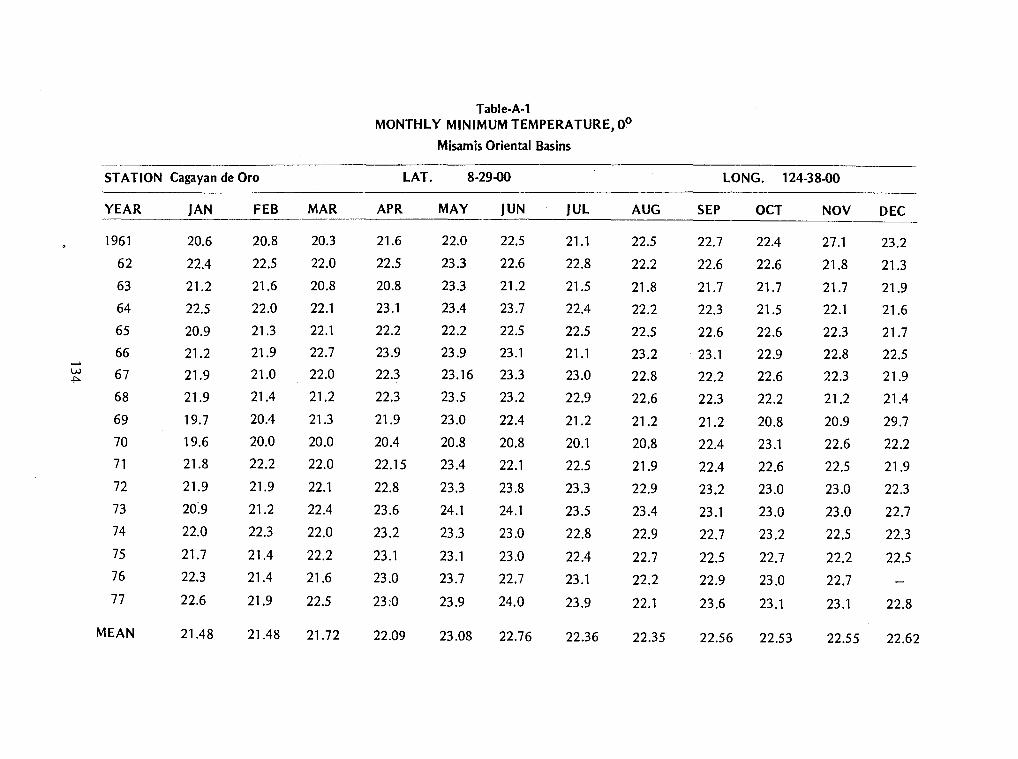
Table-A-1 MONTHLY MINIMUM TEMPERATURE, o0
Misamis Oriental Basins
STATION Cagayan de Oro LAT. 8-29-00 LONG. 124-38-00
YEAR JAN FEB MAR APR MAY JUN JUL AUG SEP OCT NOV DEC
1961 20.6 20.8 20.3 21.6 22.0 22.5 21.1 22.5 22.7 22.4 27.1 23.2
62 22.4 22.5 22.0 22.5 23.3 22.6 22.8 22.2 22.6 22.6 21.8 21.3
63 21.2 21.6 20.8 20.8 23.3 21.2 21.5 21.8 21.7 21.7 21.7 21.9
64 22.5 22.0 22.1 23.1 23.4 23.7 22.4 22.2 22.3 21.5 22.1 21.6
65 20.9 21.3 22.1 22.2 22.2 22.5 22.5 22.5 22.6 22.6 22.3 21.7
66 21.2 21.9 22.7 23.9 23.9 23.1 21.1 23.2 23.1 22.9 22.8 22.5 w 67 21.9 21.0 22.0 22.3 23.16 23.3 23.0 22.8 22.2 22.6 22.3 21.9 ~
68 21.9 21.4 21.2 22.3 23.5 23.2 22.9 22.6 22.3 22.2 21.2 21.4
69 19.7 20.4 21.3 21.9 23.0 22.4 21.2 21.2 21.2 20.8 20.9 29.7
70 19.6 20.0 20.0 20.4 20.8 20.8 20.1 20.8 22.4 23.1 22.6 22.2
71 21.8 22.2 22.0 22.15 23.4 22.1 22.5 21.9 22.4 22.6 22.5 21.9
72 21.9 21.9 22.1 22.8 23.3 23.8 23.3 22.9 23.2 23.0 23.0 22.3
73 20:9 21.2 22.4 23.6 24.1 24.1 23.5 23.4 23.1 23.0 23.0 22.7
74 22.0 22.3 22.0 23.2 23.3 23.0 22.8 22.9 22.7 23.2 22.5 22.3
75 21.7 21.4 22.2 23.1 23.1 23.0 22.4 22.7 22.5 22.7 22.2 22.5 76 22.3 21.4 21.6 23.0 23.7 22.7 23.1 22.2 22.9 23.0 22.7 77 22.6 21.9 22.5 23:0 23.9 24.0 23.9 22.1 23.6 23.1 23.1 22.8
MEAN 21.48 21.48 21.72 22.09 23.08 22.76 22.36 22.35 22.56 22.53 22.55 22.62

Table-A-2 MONTHLY MAXIMUM TEMPERATURE, o0
Misamis Oriental Basins
STATION Cagayan de Oro LAT. 8-29-00 LONG. 124-38-00
YEAR JAN FEB MAR APR MAY JUN JUL AUG SEP OCT NOV DEC -
1961 29 31.3 33.9 32.5 33.5 33.1 32.5 33.4 33.0 32.4 31.9 31.4
62 29.6 28.5 31.2 33.0 33.3 32.9 33.3 32.7 32.7 33.5 32.2 31.3
63 29.7 28.4 33.1 32.1 33.4 33.2 33.0 32.5 33.4 32.8 33.5 32.7
64 31.3 30.6 31.7 32.6 33.0 32.6 32.4 33.2 32.1 31.5 32.5 31.0
65 29.6 30.6 30.7 32.1 32.8 32.1 32.3 32.4 32.6 32.3 32.1 31.2
66 31.6 31.9 32.7 33.5 32.2 32.6 31.8 32.5 33.3 32.4 32.4 31.4
\.J..l 67 30.1 30.0 31 32.5 33.4 33.8 32.8 33 32.2 32.0 31.7 30.8 Vt
68 30.1 30.1 31.6 32.7 32.9 33.1 33.1 32.8 32.7 31.8 31.2 29.7
69 30.3 31.0 31.6 32.1 33.3 32.2 32.1 32.4 32.0 31.1 31.1 30.8
70 30.18 29.7 31.6 32.7 32.2 31.2 31.16 31.2 31.7 31.9 31.1 30.5
71 29.8 29.9 30.12 31.1 32.5 31.4 31.8 31.7 32.0 30.9 30.9 31.1 72 29.9 30.9 30.6 32.4 33.4 32.7 34.0 32.7 32.1 33.0 32.4 31.1 73 31.1 31.3 31.9 32.3 33.3 32.1 32.7 32.6 32.0 32.5 31.3 31.3 74 29.9 30.1 31.0 32.3 33.2 32.6 32.4 33.3 32.6 32.0 31.8 30.8 75 30.5 31.0 31.7 33.1 33.2 32.9 32.6 33.4 32.6 32.6 32.5 31.8 76 30.8 31.0 32.5 33.4 34.7 33.0 33.20 33.2 33.8 34.1 33 77 32.5 31.5 32.2 33.9 34.5 33.4 32.4 33.3 34.0 33.3 32.9 32.6
MEAN 30.35 30.41 31.07 32.61 32.81 32.7 32.56 32.75 32.48 32.32 32.03 31.61

Table-A-3 MONTHLY MEAN TEMPERATURE, o0
Misamis Oriental Basins
STATION Cagayan de Oro LAT. 8-29-00 LONG. 124-38-00
YEAR JAN FEB MAR APR MAY JUN JUL AUG SEP OCT NOV DEC
1961 24.8 26.1 27.1 27.1 27.9 27.8 26.8 28.0 27.9 27.4 29.5 27.3
62 26.0 25.5 26.6 27.8 23.8 27.8 28.1 27.5 27.5 27.7 27.0 26.5
63 25.5 25.0 27.0 26.5 27.9 26.2 27.3 27.2 27.6 27.3 27.6 27.3
64 26.9 26.3 26.9 27.9 28.2 27.7 27.4 27.7 27.2 26.5 27.3 26.3
65 25.3 26.0 26.4 27.2 27.5 27.3 27.4 27.5 27.6 27.5 27.2 20.5
u..> 66 26.4 26.9 27.7 28.7 28.1 27.9 26.5 27.9 28.2 27.7 27.6 27.0 O"I 67 26.0 25.5 26.5 27.4 28.3 28.6 27.9 27.9 27.2 27.3 27.0 26.4
68 26.0 25.8 26.4 27.5 28.2 28.2 28.0 27.7 27.5 27.0 26.2 25.6
69 25.0 25.7 26.4 27.2 28.2 27.3 26.7 26.8 26.6 26.0 26.0 30.3
70 24.9 24.9 25.8 26.6 26.5 26.0 25.7 26.3 27.2 27.2 26.9 26.4
71 25.8 26.1 26.1 27.1 28.0 26.6 26.9 26.8 27.2 27.0 26.7 26.5
72 25.9 26.4 26.4 27.6 28.4 28.3 28.7 27.8 27.7 28.0 27.7 26.7
73 26.0 26.3 27.2 28.0 28.7 28.6 28.1 28.0 27.6 27.8 27.2 27.0
74 25.6 26.2 26.5 27.8 28.3 27.8 27.6 28.1 27.7 27.6 27.2 26.6
75 26.1 26.2 27.0 28.1 28.2 28.0 27.5 28.1 27.6 27.7 27.4 27.2
76 26.6 26.2 27.1 28.2 29.2 27.9 28.2 27.7 28.4 28.6 27.9
77 27.6 26.7 27.4 28.5 29.2 28.7 28.2 27.7 28.8 28.2 28.0 27.7
MEAN 25.91 25.99 26.74 27.6 27.9 27.75 27.47 22.71 27.63 27.55 27.32 27.01

Table-A-4 RELATIVE HUMIDITY,%
Misamis Oriental Basins
STATION Cagayan de Oro LAT. 8-29-00 LONG. 124-38-00
YEAR JAN FEB MAR APR MAY JUN JUL AUG SEP OCT NOV DEC
1961 88 85 82 80 79 81 79 81 80 81 78 83 62 86 89 84 75 78 78 78 84 81 79 79 82 63 87 88 85 76 76 81 80 81 82 81 80 87
64 77 82 78 80 81 82 81 74 85 84 81 82 65 85 87 85 82 79 84 79 81 81 81 80 84
66 78 77 74 73 82 82 83 82 76 81 81 82 67 83 85 80 74 76 77 78 78 80 80 79 80 68 84 82 77 71 74 80 76 80 78 79 77 84
VJ -....J 69 80 75 78 74 77 81 79 80 80 83 84 85
70 83 84 76 73 80 84 80 80 79 81 82 85 71 83 85 82 77 79 83 80 80 80 83 82 82 72 84 80 81 76 76 79 73 78 81 77 79 81 73 78 75 74 74 74 78 79 79 82 79 83 81 74 82 84 79 80 76 79 82 79 80 83 83 85 75 83 78 77 75 77 80 80 77 81 79 77 76 82 79 75 72 73 81 78 77 78 77 79 77 82 81 78 71 77 79 82 81 79 78 81 79
MEAN 83 82 79 76 77 81 80 80 80 81 80 82

Table A-5 STATISTICAL PARAMETERS OF MONTHLY RAINFALL
AT LIBORAN, BAUNGON, BUKIDNON LAT.8°20' LONG. 124°40'
Misamis Oriental Basins
1966-80 JAN. FEB. MARCH APRfL MAY JUNE JULY AUGUST SEPT. OCT. NOV. DEC. ANNUAL
MEAN 47.90 44.45 30.27 56.83 158.47 224.73 279.27 275.93 167.37 395.80 170.00 48.00 2,468.50
STD. DEV. 35.78 55.65 19.95 70.25 85.41 18.69 157.95 198.98 121.66 0.0 98.15 24.18 0.0
CO. VAR 0.75 1.25 0.66 1.24 0.54 0.08 0.57 0.72 0.73 0.0 0.58 0.50 0.0
SKEW 0.0 0.0 -0.05 1.50 1.32 1.4~ -1.00 -1.73 -0.07 0.0 0.0 0.0 0.0
MAX. 73.20 83.80 50.10 136.70 254.40 245.90 415.20 393.90 288.10 395.80 239.40 65.10
MIN. 22.60 5.10 10.20 4.60 90.70 210.50 106.00 46.20 44.80 395.80 100.60 30.90
w 00
Table A-6
STATISTICAL PARAMETERS OF MONTHLY RAINFALL AT IMPASUGONG, BUKIDNON LAT. 8°20' LONG. 125°00'
Misamis Oriental Basins
1966-80 JAN. FEB. MARCH APRIL MAY JUNE JULY AUGUST SEPT. OCT. NOV. DEC. ANNUAL
MEAN 215.76 68.46 70.76 98.12 218.34 391.18 270.76 340.96 250.02 236.72 195.72 194.62 2,570.15
STD. DEV. 212.21 74.02 61.97 73.11 48.03 147.06 143.94 134.91 166.36 129.48 115.70 171.15 522.54
CO. VAR. 0.98 1.08 0.88 0.75 0.22 0.38 0.53 0.40 0.67 0.55 0.59 0.88 0.20
SKEW 0.87 1.14 1.47 -0.06 0.40 0.51 -0.73 0.32 0.12 -0.41 -0.75 0.64 0.61 MAX. 527.30 183.30 172.30 194.60 269.80 607.80 409.90 525.50 543.10 371.50 320.50 439.10 MIN. .7.50 5.00 19.60 1.90 173.50 211.70 58.20 193.10 61.00 57.00 26.20 38.10

Table A-7 STATISTICAL PARAMETERS OF MONTHLY RAINFALL
AT IMPALUTAO, IMPASUGONG, BUKIDNON LAT. 8°16' LONG. 125°02'
Misamis Oriental Basins
1966-80 JAN. FEB. MARCH APRIL MAY JUNE JULY AUGUST SEPT. OCT. NOV. DEC. ANNUAL
MEAN 129.11 123.90 127.12 124.13 242.82 310.75 300.51 345.16 276.15 245.83 180.35 174.94 2,588.45
STD. DEV. 85.47 68.58 99.02 57.65 103.60 84.11 107.24 119.67 115.67 91.44 117.20 83.79 422.89
CO. VAR 0.66 0.55 0.78 0.46 0.43 0.27 0.36 0.35 0.42 0.37 0.65 0.48 0.16 SKEW 1.30 0.86 1.41 1.42 0.29 -0.09 -0.25 0.45 0.16 0.03 0.88 -0.41 -0.86 MAX. 345.30 268.60 374.70 265.70 417.50 434.40 445.40 541.80 452.20 410.80 431.60 301.90
MIN. 3.60 36.20 10.70 55.20 113.80 189.70 124.40 180.70 125.40 94.20 33.20 11.50
_.. w \.0
Table A-8 STATISTICAL PARAMETERS OF MONTHLY RAINFALL
AT DAMILAG, MANOLO FORTICH, BUKIDNON LAT. 8°22' LONG. 124°48'
Misamis Oriental Basins
1966-80 JAN. FEB. MARCH APRIL MAY JUNE JULY AUGUST SEPT. OCT. NOV. DEC. ANNUAL
MEAN 106.56 108.49 70.30 55.95 159.98 276.12 244.98 279.59 236.48 162.51 148.84 112.84 1,965.80
STD. DEV. 71.79 91.01 54.63 39.29 72.58 70.92 89.27 107.11 102.04 96.59 85.39 65.94 343.67 CO. VAR. 0.67 0.84 0.78 0.70 0.45 0.26 0.36 0.38 0.43 0.59 0.57 0.58 0.18 SKEW 0.04 0.90 0.96 0.50 1.76 1.04 -0.26 0.28 0.46 0.06 1.19 0.84 0.21 MAX. 219.90 295.50 175.00 129.10 316.50 428.80 404.40 502.00 447.90 303.90 336.90 263.00 MIN. -0.0 2.20 1.20 3.50 110.00 193.30 63.70 i 31.30 72.30 25.60 55.70 12.50

Table A-9 STATISTICAL PARAMETERS OF MONTHLY RAINFALL
AT PHILLIPS, MANOLO FORTICH, BUKIDNON LAT. 8°20' LONG 124°29'
Misamis Oriental Basins
JAN. FEB. MARCH APRIL MAY JUNE JULY AUGUST SEPT. OCT. NOV. DEC. ANNUAL
MEAN 129.37 101.37 88.37 104.12 241.13 357.74 293.02 312.71 278.74 234.15 179.26 134.81 2,379.34 STD. DEV. 83.74 79.07 47.09 58.71 80.48 88.29 118.24 90.76 116.63 99.60 91.53 56.57 367.35 CO. VAR. 0.65 0.78 0.53 0.56 0.33 0.25 0.40 0.29 0.42 0.43 0.51 0.42 0.15 SKEW 0.27 0.97 0.25 0.32 -0.11 0.13 -0.08 0.11 0.26 0.44 1.34 -0.17 0.32 MAX. 270.40 246.90 179.30 226.20 383.50 501.70 492.40 506.90 521.70 447.00 414.30 247.70 MIN. 5.10 11.10 9.50 24.50 92.30 224.50 112.90 139.20 64.20 90.20 64.60 28.80
..... +:-0
Table A-10 STATISTICAL PARAMETERS OF MONTHLY RAINFALL
AT J17 CAGAYAN DE ORO, MISAMIS ORIENTAL LAT. 8°24' LONG. 124°36'
Misamis Oriental Basins
1961-80 JAN. FEB. MARCH APRIL MAY JUNE JULY AUGUST SEPT. OCT. NOV. DEC. ANNUAL
MEAN 122.35 81.29 46.58 35.38 98.87 206.90 205.85 229.18 206.15 174.48 113.57 81.63 1672.14
STD. DEV. 119.12 65.64 42.91 20.89 70.33 80.59 118.18 91.46 94.12 96.11 70.65 66.64 260.19
CO. VAR. 0.97 0.81 0.92 0.59 0.71 0.39 0.57 0.40 0.46 0.55 0.62 0.82
SKEW 1.71 0.35 1.21 0.90 0.66 0.14 0.82 -0.14 -0.19 0.62 1.48 0.91 -0.48
MAX. 452.00 189.50 158.60 79.00 231.00 357.40 458.90 410.60 372.70 398.70 326.10 241.40
MIN. 1-1.20 4.10 2.60 5.80 12.00 62.20 65.10 62.80 35.90 27.70 23.10 7.30

Table A-11 RAINFALL DEPTH-DURATION FREQUENCY ANALYSIS
CAGA YAN DE ORO CITY Misamis Oriental Basins
Return Period (Years) 2 5 10 15 20 25 50 100
Duration
5 mins. 135.7 172.6 196.9 215.7 220.5 225.7 258.5 273.2 10 mins. 122.3 155.4 177.3 189.6 198.3 205.0 225.5 245.9 15 mins. 113.0 143.2 163.1 174.4 182.3 188.4 207.1 225.7 30 mins. 88.4 112.2 128.0 136.9 143.1 147.9 162.7 177.3
1 hour 56.9 73.9 85.1 91.5 95.9 99.4 109.9 120.4 2 hours 33.5 43.6 50.3 54.1 56.7 58.7 65.0 71.2 3 hours 23.5 30.7 35.5 38.2 40.1 41.5 46.0 50.4 6 hours 12.9 17.2 20.0 21.6 22.7 23.6 26.2. 28.9
12 hours 6.8 9.1 10.5 11.4 12.0 12.4 13.8 15.2 24 hours 3.9 5.0 5.8 6.2 6.5 6 . .7 7.4 8.1
Table A-12 STATISTICAL PARAMETERS OF MONTHLY FLOW OF
1023 CAGAYAN R. TINIU, CAGAYAN DE ORO CITY MISAMIS ORIENTAL
Misamis Orienul Basins
1955-63 JAN. FEB. MARCH APRIL MAY JUNE JULY AUGUST SEPT. OCT. NOV. DEC. ANNUAL
MEAN 289.18 237.08 212.32 179.46 236.92 270.54 311.17 337.28 323.39 321.21 262.45 332.31 3,224.47
STD. DEV. 132.83 126.75 85.35 57.16 80.65 102.52 105.72 71.63 85.20 54.18 84.01 125.61 738.77
CO. VAR 0.46 0.53 0.40 0.32 0.34 0.38 0.34 0.21 0.26 0.17 0.32 0.38 0.23
SKEW 1.16 0.97 -0.05 -0.83 0.09 -1.21 0.89 -0.10 0.08 0.14 0.14 0.06 -0.25
MAX. 576.95 483.81 337.32 257.57 358.32 382.03 500.89 433.10 454.22 418.98 404.97 530.94
MIN. 137.40 85.Dl 81.18 79.52 129.66 51.84 187.67 218.53 195.23 229.89 129.50 140.75
141

Table A-13 ST A TISTICAL PARAMETERS OF MONTHLY FLOW OF
1023 IPONAN R.ATPAGATPAT,CAGAYAN DE ORO CITY
DRAINAGE AREA = 351 SQ.KM. Misamis Oriental Basins
1951-71 JAN. FEB. MARCH APRIL MAY JUNE JULY AUGUST SEPT. OCT. NOV. DEC. ANNUAL
MEAN 38.67 28.80 27.10 17.48 27.60 46.13 47.78 43.51 44.43 42.63 34.15 40.85 464.05
STD. DEV. 45.51 26.99 22.51 10.89 5.45 7.44 30.22 17.46 25.37 18.63 18.82 31.11 14.70
CO. VAR 1.18 0.94 0.83 0.62 0.20 0.16 0.63 0.40 0.51 0.44 0.55 0.76 0.03
SKEW 1.97 0.81 1.98 0.60 0.56 -0.93 1.59 -0.62 0.40 0.56 0.06 0.78 -0.42
MAX. 127.01 63.84 71.06 36.86 36.02 55.13 104.08 62.46 84.84 73.74 59.12 92.73
MIN. 9.88 5.25 7.53 4.74 21.32 33.44 22.34 18.96 12.11 19.12 9.95 12.29
+:-IV
Table A-14 STATISTICAL PARAMETERS OF MONTHLY FLOW OF
1024 ALUBIJ ID R. AT MUNAY, ALUBIJ ID, MISAMIS ORIENT AL DRAINAGE AREA = 94 SQ. KM.
Misamis Oriental Basins
1951-71 JAN. FEB. MARCH APRIL MAY JUNE JULY AUGUST SEPT. OCT. NOV. DEC. ANNUAL
MEAN 4.75 2.39 1.74 1.54 1.39 2.76 5.12 4.39 3.65 3.43 4.09 5.99 43.07
STD. DEV. 8.69 1.83 0.97 1.81 0.96 1.96 4.61 2.05 2.34 2.12 2.98 7.63 18.28
CO. VAR. 1.83 0.77 0.56 1.18 0.69 0.71 0.90 0.47 0.64 0.62 0.73 1.27 0.42
SKEW 3.24 0.47 0.56 3.38 1.50 0.52 1.52 0.47 0.84 0.54 1.70 2.27 0.98
MAX. 35.76 5.88 3.78 8.17 4.07 6.25 16.45 8.73 8.42 7.82 12.78 29.44
MIN. 0.48 0.27 0.35 0.23 0.16 0.47 1.13 1.02 0.70 0.86 0.54 0.54

Table A-15
ANNUAL PEAK DISCHARGE OF RIVERS Misamis Oriental Basins
(Discharge in CMS)
YEAR CAGAYAN RIVER IPONAN RIVER ALUBIJ ID RIVER
1951 3.22 1952 1953 1954 1955 506 1956 1,340 10.90 1957 255 19.05 3.15 1958 260.9 34.62 5.67 1959 185.4 38.86 2.03 1960 542 37.66 3.02 1961 1 ,075 22.37 5.03 1962 993 32.73 3.25 1963 392.7 3.32 1964 4.93 1965 47.42 13.35 1966 6.14 1967 1.95 1968 1.61 1969 27.53 1.13 1970 23.41 2.42
D.A. 11 1 ,331 351 94 No. of Years 9 9 17 Mean-Log 2.70 1.48 0.56 Std. Dev.-Log 0.30 0.13 0.28 Skewness 0.15 0.28 0.37
1/ Drainage Area in Sq. Km. (Square Kilometer}
143

Table A-16 ANNUAL MINIMUM FLOWS OF RIVER IN THE MISAMIS ORIENTAL BASINS
(Disharge in CMS)
YEAR CAGAYAN IPONAN ALUBIJID
1951 1952
0.26 0.13
1953 1954 1955 61.80
1956 60.60 0.73
1957 51.30 4.59 0.11
1958 36.20 1.83 0.10
1959 15.06 3.64 0.33
1960 49.00 3.69 0.22
1961 0.0 3.84 0.36
1962 67.80 11.21 0.28
1963 0.0 0.31
1964 0.55
1965 6.33 0.72
1966 0.32
1967 0.34
1968 0.32
1969 2.17 0.06
1970 5.81 0.19
NO.OF YEARS 9 9 17
MEAN 37.97 4.79 0.31
STD. DEV. 26.65 2.82 0.20
SKEWCOEFF. 0.56 1.58 1.04 D.A. (SQ. KM.) 1331 351 94
Table A-17 INVENTORY OF EXISTING FLOOD DAMAGE PROTECTION MEASURE
Misamis Oriental Basins
PROJ. Name and Location of Dikes/ Revet- C-0-C/ Dred-Spur Tim- Control River Clo- Drai-No. Project Levees ment/ Diver- ging Dikes her Gates Walls/sing nage
Bank sion CJ Pile Gravity Dikes Main Protect Chan- Hur- Walls
nel die (Km) (Km) (Km) (Km) (m) (m) (Units) (Km) (m) (m)
CAMI GUIN 1 Dinanga-san RC, Catarman 0.402 0.070 48.0 2 Guinsiliban RC, Guinsiliban 0.030 3 Sagay RC, Sagayan Camiguin 0.150
MISAMIS ORIENTAL 4 Balatugan RC, Balingasag 0.880 5 Dangoan RC, Medina 1.025 1.030 0.125 0.055 6 Tagoloan RC, Tagoloan 0.500 0.312 2.500 0.500 7 lnitao RC, lnitao 0.280 0.2114 0.130 0.230 8 Talisayan RC, Talisayan 0.130 0.750 0.500 1.250 ) Calapanit RC, Jasaan No data
10 Tagbocboc RC, Talisayan given
0.275 11 Mambayaan RC, Balingasag 0.10 2.00 12 Balingoan RC, Balingoan 0.045
TOTAL 2.632 2.4034 4.135 4.31 48.0 2 units
144

o! >--
6,000
~ u 5,000 ~ z CY _J
<: ~ 4,000 oc Cl J: 1:-3: ~ 3,000 z ~
2,000
1,00 0
O·
0
Figure A-3
GROUNDWATER MINING PICTURE MISAMIS ORIENTAL BASINS
I I I I MISAMIS ORIENTAL BASIN (Sub-Basin)
ESTIMATED GW STORAGE =4,566 MCM ESTIMATED SAFE YIELD = 1,200 MCM ESTIMATED 50-YR GWM YIELD = 1,290 MCM ESTIMATED 50-YR GWM
= 0.23 MCM/KM2 WELL DENSITY
~Q,4,5~0 .. 1,200
\ /
~ """""-
20 40 60
PERIOD OF EXHAUSTION Tin years
145
80 100
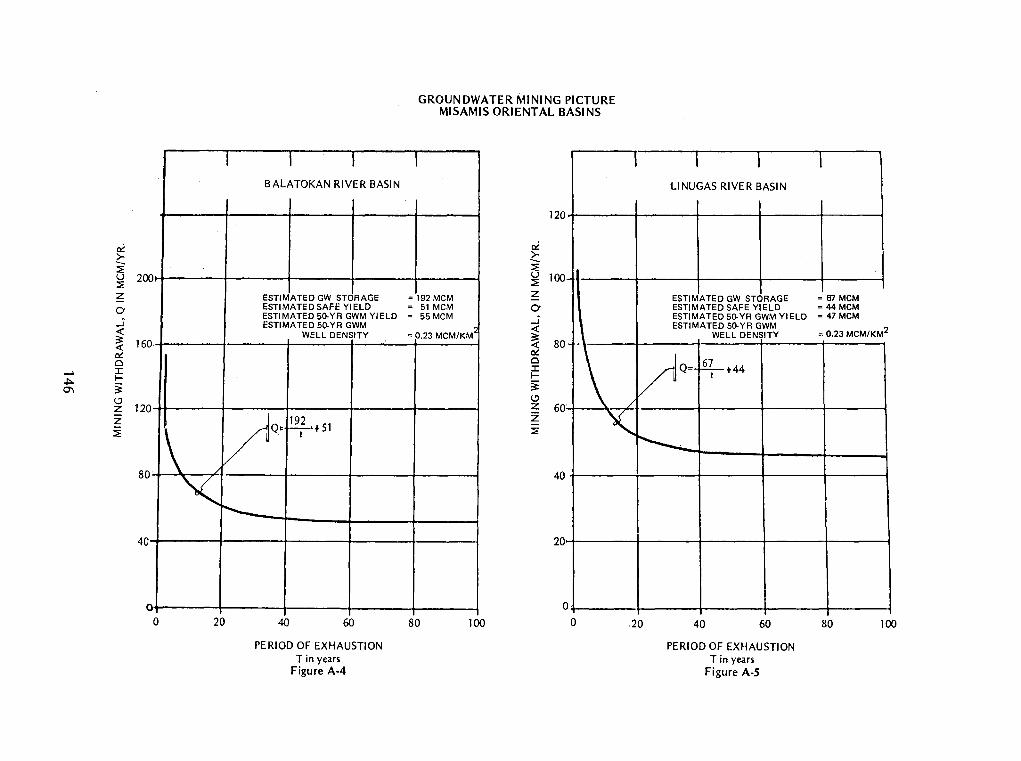
~ >-~ u ~
0 20
~ 0 _j <( ~ <( 0 16 ~ Cl ..... :c
~ f-O"I §:
(.!) z 12 0 z ~
8 0
4 0
--0
I I I BALATOKAN RIVER BASIN
ESTIMATED GW STORAGE ESTIMATED SAFE YIELD ESTIMATED 50-YR GWM YIELD ESTIMATED 50-YR GWM
WELL DENSITY
ViQ• ~+51 \ f
,
'< ~
20 40 60
PERIOD OF EXHAUSTION Tin years
Figure A-4
GROUNDWATER MINING PICTURE MISAMIS ORIENTAL BASINS
I
= 192 MCM = 51 MCM = 55 MCM
= 0.23 MCM/KM.
~ >---~
120
~ 100 z 0 _j <(
~ ~ Cl :c f-§! (.!) z
80 J
\
I I l LINUGAS RIVER BASIN
ESTIMATED GW STORAGE ESTIMATED SAFE YIELD ESTIMATED 50-YR GWM YIELD ESTIMATED 50-YR GWM
WELL DENSITY
v1Q--..§1._+44 I
/
z :E ~
!'--...._
60
40
20
0
80 100 0 .20 40 60
PERIOD OF EXHAUSTION Tin years
Figure A-5
\
= ff1 MCM = 44 MCM = 47 MCM
= 0.23 MCM/KM2
80 100

~ >-~ u 100 :::E ~ 0 .. i <(
~ 80 <( ~ 0 :i: I-
~ ~ -...J (,:)
~ 60 z :E
40 \
20
0
0
I I I ALUBIJID RIVER BASIN
ESTIMATED GW STORAGE ESTIMATED SAFE YIELD ESTIMATED 50-YR GWM YIELD ESTIMATED 50-YR GWM
WELL DENSITY
V1Q: ~+26 I
/
~ r---.___
20 40 60
PERIOD OF EXHAUSTION Tin years
Figure A-6
GROUNDWATER MINING PICTURE MISAMIS ORIENTAL BASINS
I
= 100 MCM = 26 MCM ~ 28MCM
= 0.23 MCM/KM2
~ >-~ u 100 :::E z 0 _j <(
~ ~ 0 :i: I-~ (,:) z z SE
80
60
\
I I I GINOOG RIVER BASIN
ESTIMATED GW STORAGE ESTIMATED SAFE YIELD ESTIMATED 50.YR GWM YIELD ESTIMATED 50-YR GWM
WELL DENSITY
1/10' ~-+22 /
< r--.... 40
20
0
80 100 0 20 40 60
PERIOD OF EXHAUSTION Tin years
Figure A-7
I
= 84 MCM = 22 MCM = 24 MCM
= 0.24 MCM/KM2
80 100

c.i >-~ u :;: 200
~ O' ... i' <( ;::: <( 160 ~ 0 J:
.i::.. I-00 §;
(.!)
z 120 z :E
80
40
0
0
I
' \ v
~
20
I I ODIONGAN RIVER BASIN
ESTIMATED GWSTORAGE ESTIMATED SAFE YIELD ESTIMATED 50.YR GWM YIELD ESTIMATED 50.YR GWM
WELL DENSITY
~Q _gzl_ + 71 t
40 60
PERIOD OF EXHAUSTION Tin years
Figure A-8
GROUNDWATER MINING PICTURE MISAMIS ORIENTAL BASINS
I
= 271 MCM = 71 MCM = 76 MCM
= 0.23 MCM/KM2
o2 ~ :;: ~ 200 z O' _j <(
~ 160 ~ 0
~ §
~ 120 z :E
\
I
80
~ 40
0
l l CABULIG RIVER BASIN
ESTIMATED GW STORAGE ESTIMATED SAFE YIELD ESTIMATED 50.YR GWM YIELD ESTIMATED 50.YR GWM
WELL DENSITY
~Q' J~L+st t
~
80 100 0 20 40 60
PERIOD OF EXHAUSTION Tin yC<1r Figure A-9
I
= 192 MCM = 51 MCM = 55 MCM
= 0.24 MCM/KM2
80 100

o! >-i" u ~ 500 : z 0 ....1" <( :::: <( 400
°' 0 :i: I-
~ ~ \0
" z 300 z ~
200
100 'I
0
0
I
\
\: v
20
I I MANDULOY RIVER BASIN
ESTIMATED GW STORAGE ESTIMATED SAFE YIELD ESTIMATED 50.YR GWM YIELD ESTIMATED 50.YR GWM
WELL DENSITY
/110" ..fil_i172 I
'
~
40 60
PERIOD OF EXHAUSTION Tin years
Figure A-10
GROUNDWATER MINING PICTURE MISAMIS ORIENTAL BASINS
I
o! >-i"
= 653 MCM
~ 500 z
= 172 MCM = 166 MCM
= 0.23 MCM/KM2
0 ....1" <(
~ 400
°' 0 :i: 1-3: " z 300 z ~
200
I I I IPONAN RIVER BASIN
ESTIMATED GW STORAGE ESTIMATED SAFE YIELD ESTIMATED 50-YR GWM YIELD ESTIMATED 50.YR GWM
WELL DENSITY
,,{/Qc ~+89 I
'v vu 100
0' 80 100 0 20 40 60
PERIOD OF EXHAUSTION Tin year
Figure A-8
I
= 336 MCM = 89 MCM • 96 MCM
= 0.24 MCM/KM2
-
80 100

APPENDIX B
METHODOLOGY FOR GENERAL LAND USE STUDY
• Introduction
• Diagnostic Criteria Existing Land Use
Land Capability slope soils soil erosion susceptibility
Sectoral Demand/Requirement on Land Ecological Balance
Land Use Regulatory Measures
• Table A-B-1 General Land Use Analysis Matrix

1.0 Introduction
METHODOLOGY FOR GENERAL LAND USE STUDY for
MISAMIS ORIENTAL BASINS
The evaluation process requires a thorough interpretation, analysis of the physical environment of land like water, topography, vegetation climate, and the various properties of soil and its characteristics, all of which influence the capability and/ or suitability of land to certain use it is best recommended to.
The process starts with the assessment of the performance of land with its present uses, then carefully analyze the physical factors like terrain, drainage, climate type and erosion conditions. However, the determinants do not limit to the above but also, include the ecological and cultural factors. Based on the overall evaluation process, the study shall make general suggestions on the recommended type of land use.
2.0 Diagnostic Criteria
2.1 Existing land Use A general land use is undertaken by the Bureau of Soils with the use of
aerial photographs. Field checks were undertaken in April 1978. land use maps in Water Resource Regions were done in 1 :250,000.
2.2 land Capability
Under the land capability analyses, three major factors are considered, namely, the slope of the land, soil type and degree of soil erosion. Analyses and classification is made with reference to present land use, soil conservation measures and farm management practices.
2.2.1 slope
Slope classes are determined and mapped out to determine the suitability of land for agricultural production. Each slope category determines the extent of the recommended agricultural use.
2.2.2 soils
Soils in the area are classified in order to determine the soil types that could be utilized for crop production.
2.2.3 soil erosion susceptibility
Extent of soil erosion in the area is classified and mapped out in order to determine areas which could be utilized for intensive agricultural diversification and the farming practices to follow also determine areas which should be unde; forest cover.
2.3 Sectoral Demand/Requirement on Land
2.3 .1 agriculture
2.3 .2 pasture/livestock
152
2.3 .3 forest
2.3.4 fishpond
2.4 Ecological Balance
2.5 Land Use Regulatory Resources
Some policies and laws concerning land use in the Philippines are as follows:
1. P.D. 815 - Restrict the conversion of prime agricultural lands for other uses.
2. P.D. 705 - The Forestry Reform Code of the Philippines was promulgated by the Republic of the Philippines on 19 May 1973. This code defines functions and responsibilities of the Bureau of Forest Development. It answers, all views of forest resource management, utilization, demarcation, protection, enforcement and rehabilitation. This code has several instructions ·concerning forest policies and the following policies have been adopted:
The multiple uses of forest lands shall be oriented to the development and progress requirements of the country, the advancement of science and technology and the public welfare:
Land classification and survey shall be systematized and hastened:
The establishment of wood-processing plants shall be encouraged and rationalized and the protection, development and rehabilitation of forest lands shall be emphasized so as to ensure their continuity in productive condition.
Section 54. No forest lands 50% in slope or over may be utilized for pasture purposes.
3. P.D. 331 - The document stipulated that all public forest be developed, managed and utilized on a sustained yield basis with the assistance of technically, trained and Registered Foresters. As emphasized, it seeks the help of technical personnel to carry out logging practices as well as silvicultural aspects. It seeks to harmonize the productivity and stability of the nation's forest ecosystems.
Implementing guidelines, rules and regulations on forest occupancy serve the purpose of requiring concerning terms of reference in forest occupancy. Strict compliance of the rules are written in the whole context of the agreement.
4. P.D. 953 - This decree requires every person who owns land adjoining a river or creek, to plant trees extending at least 5 meters on his land adjoining the edge of the bank of the river or creeks, except when such land, due to its permanent improvement, can not be planted with trees. Likewise, every holder of a license agreement, lease, license or permit from the government, involving occupancy and utilization of forest or grazing land with a river or creek therein shall plant trees extending at least 20 meters from each edge of the bank of river or creek.
153

5. L.0.1. 423 - This letter of instruction brought a new massive approach towards forest ecosystem management. It directed the creation of a Presidential Council for Forest Ecosystem Management (PROFEM) to "formulate programs, rules, guidelines, regulations and policies that will maintain and .enhance the country's forest ecosystem management, which involves reforestation, afforestation, Agroforestation,, establishment of communal forests, family orchards and recreational parks and areas.
6. LO.I. 145 Directed the Presidential Committee on Wood Industries Development to work out and submit a program at promoting the development of industrial forest plantation and tree farms in the Republic of the Philippines. This move has the primary objectives of introducing agroforestry program and the production of raw materials for wood based industries including the rehabilitation of critical watershed that are resettled·.
7. LO.I. 409 - Was issued to the officials of the Department of Natural Resources and Bureau of Forest Development to determine the performance of forest concessionaries and their adherence to forest regulations and policies.
8. L.0.1. 525 - Was issued to expedite the implementation of the government agro-forestry development pilot under Proclamation No. 1632. The Ministry of Natural Resources is authorized to use funds from the Department to compensate the value of improvem.ents of the various ranchers and small settlers within the agro-forestry development pilot project. It exempts displaced settlers and ranchers from the payment of application fees, registration fees and other requirements for the registration of their land patents or pasture application.
154
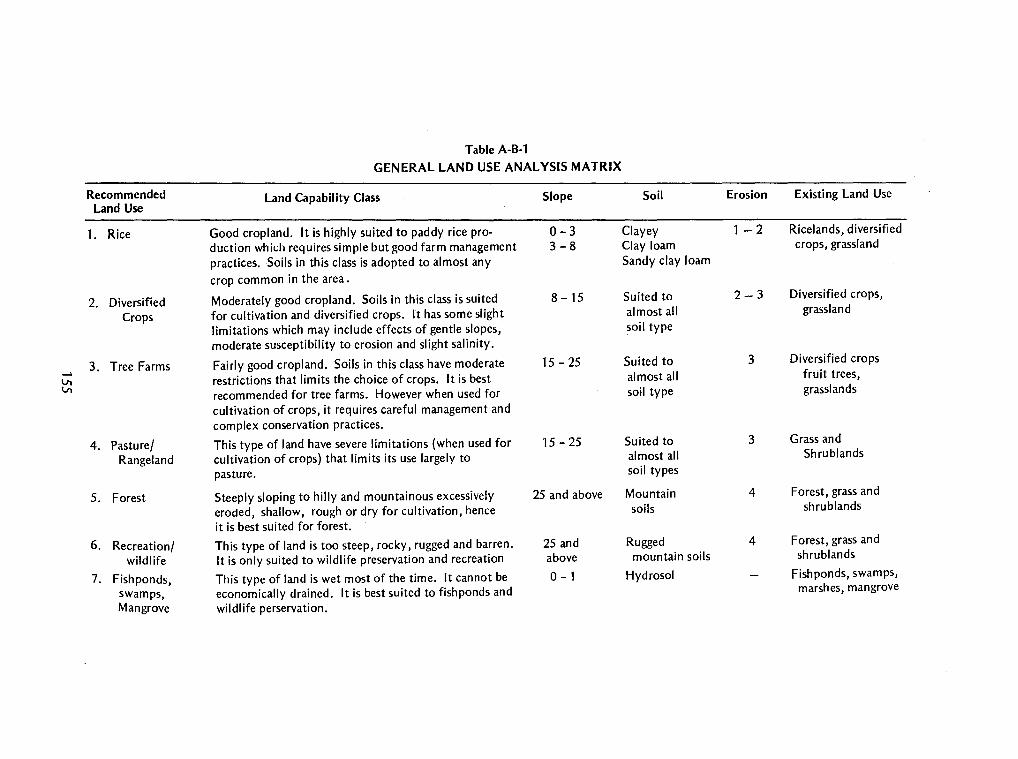
Table A-B-1
GENERAL LAND USE ANALYSIS MATRIX
Recommended Land Capability Class Slope Soil Erosion Existing Land Use Land Use
1. Rice Good cropland. It is highly suited to paddy rice pro- 0-3 Clayey 1-2 Ricelands, diversified
duction which requires simple but good farm management 3-8 Clay loam crops, grassland
practices. Soils in this class is adopted to almost any Sandy clay loam
crop common in the area.
2. Diversified Moderately good cropland. Soils in this class is suited 8 -15 Suited to 2-3 Diversified crops,
Crops for cultivation and diversified crops. It has some slight almost all grassland
limitations which may include effects of gentle slopes, soil type
moderate susceptibility to erosion and slight salinity.
3. Tree Farms Fairly good cropland. Soils in this class have moderate 15 - 25 Suited to 3 Diversified crops _. Vi restrictions that limits the choice of crops. It is best almost all fruit trees, Vi recommended for tree farms. However when used for soil type grasslands
cultivation of crops, it requires careful management and complex conservation practices.
4. Pasture/ This type of land have severe limitations (when used for 15 - 25 Suited to 3 Grass and
Rangeland cultivation of crops) that limits its use largely to almost all Shrublands
pasture. soil types
5. Forest Steeply sloping to hilly and mountainous excessively 25 and above Mountain 4 Forest, grass and
eroded, shallow, rough or dry for cultivation, hence soils shrublands
it is best suited for forest.
6. Recreation/ Th is type of land is too steep, rocky, rugged and barren. 25 and Rugged 4 Forest, grass and
wildlife It is only suited to wildlife preservation and recreation above mountain soils shrublands
7. Fishponds, This type of land is wet most of the time. It cannot be 0-1 Hydrosol Fishponds, swamps,
swamps, economically drained. It is best suited to fishponds and marshes, mangrove
Mangrove wildlife perservation.
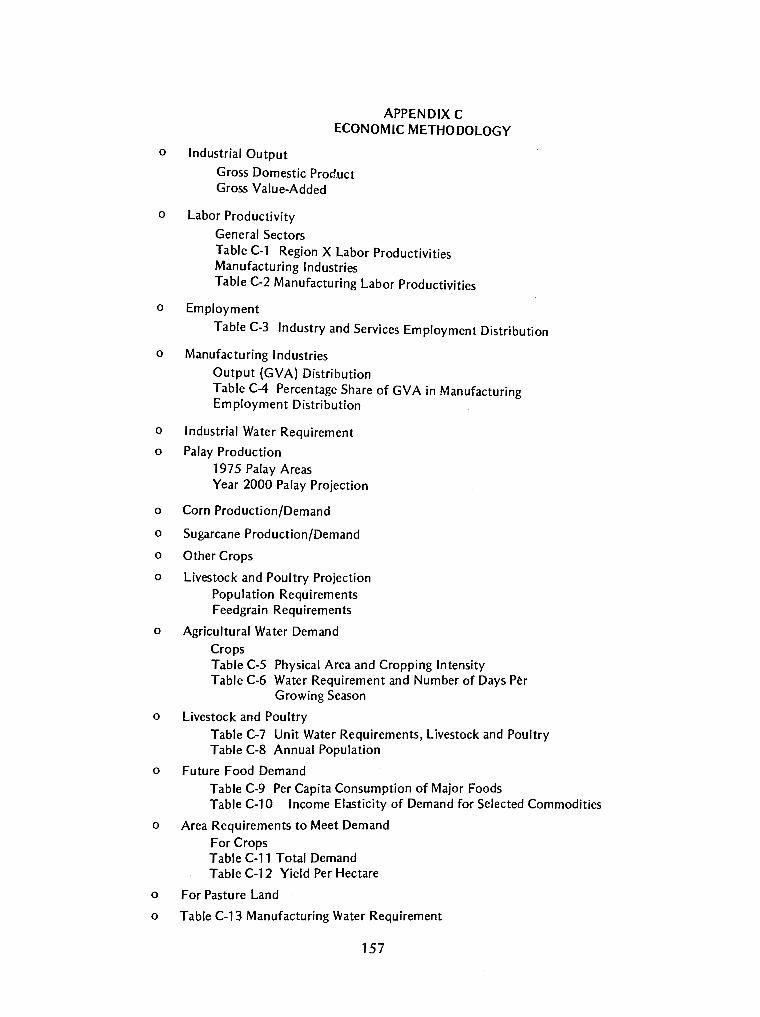
APPENDIX C ECONOMIC METHODOLOGY
o Industrial Output
Gross Domestic Product Gross Value-Added
o Labor Productivity
General Sectors Table C-1 Region X Labor Productivities Manufacturing Industries Table C-2 Manufacturing Labor Productivities
o Employment
Table C-3 Industry and Services Employment Distribution
o Manufacturing Industries
Output (GVA) Distribution Table C-4 Percentage Share of GVA in Manufacturing Employment Distribution
o Industrial Water Requirement
o Palay Production 1975 Palay Areas Year 2000 Palay Projection
o Corn Production/Demand
o Sugarcane Production/Demand
o Other Crops
o Livestock and Poultry Projection Population Requirements Feedgrain Requirements
o Agricultural Water Demand Crops Table C-5 Physical Area and Cropping Intensity Table C-6 Water Requirement and Number of Days Per
Growing Season
o Livestock and Poultry
Table C-7 Unit Water Requirements, Livestock and Poultry Table C-8 Annual Population
o Future Food Demand Table C-9 Per Capita Consumption of Major Foods Table C-10 Income Elasticity of Demand for Selected Commodities
o Area Requirements to Meet Demand For Crops Table C-11 Total Demand Table C-12 Yield Per Hectare
o For Pasture Land
o Table C-13 Manufacturing Water Requirement
157

ECONOMIC METHODOLOGY
1.0 INDUSTRIAL OUTPUT
1.1 Gross Domestic Product GDP: GVA (Agriculture + Industry + Services)
1.2 Gross Value-Added GVA = N x Lp Where: GVA =
N = Lp =
2.0 LABOR PRODUCTIVITY
2.1 General Sectors
estimated output by major sector
sectoral employment in the river basin (NCSO)
NEDA regional labor productivity rates, rebased in 1977 figures.
Labor productivity rates for various industries in 197 5 were derived from RDC (Five-Year Development Plan 1978-1982, Table 2.18). The 1975 GVA's per industry (at constant Prices) in Region X were computed backward from 1978 and 1982 figures and then rebased to 1980 by inflation factor 2.784. These were divided by total employment per industry in the political region to arrive at labor productivities by industry for 1975.
For Year 2000 NEDA Five Year Development Trend Plans were applied to the 1975 Lp's as follows: (1) Agriculture will grow 2.7 times in 25 years, (2) Industry 5.1 times, (3) Services 4.1 times.
Agriculture Mining Manufacturing Electricity Construction Transport Commerce Services
Table C-1 REGION X LABOR PRODUCTIVITIES
(P/Employed)
1975
8,424 21,089 13,923
8,714 14,407
5,356 25,120
6,286
2.2 Manufacturing Industries
2000
22,662 66,824 82,128 14,583 38,745 41,454 54,405 37,272
For Lp's of the various manufacturing industries, the same procedures as ~or the major industries was adopted. GVA's for 1971-74 (NEDA-RDS Regional Income Accounts of the Philippines) were projected to 1975. These in turn, were divided by respective employment levels to arrive at Lp's for 1975.
~p's for t~e year 2000 were derived residually as the quotient of projected GVA s over projected employment.
158
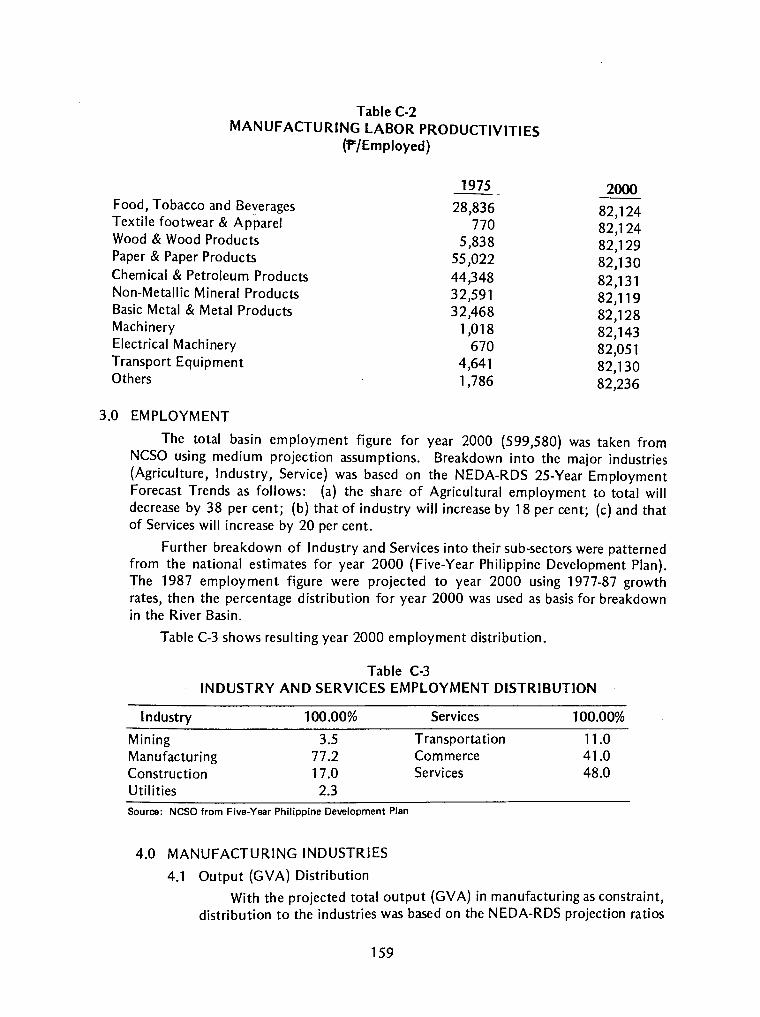
Table C-2 MANUFACTURING LABOR PRODUCTIVITIES
(¥/Employed)
Food, Tobacco and Beverages Textile footwear & Apparel Wood & Wood Products Paper & Paper Products Chemical & Petroleum Products Non-Metallic Mineral Products Basic Metal & Metal Products Machinery Electrical Machinery Transport Equipment Others
3.0 EMPLOYMENT
1975
28,836 770
5,838 55,022 44,348 32,591 32,468
1,018 670
4,641 1,786
2000
82,124 82,124 82,129 82,130 82,131 82, 119 82,128 82,143 82,051 82,130 82,236
The total basin employment figure for year 2000 (599,580) was taken from NCSO using medium projection assumptions. Breakdown into the major industries (Agriculture, Industry, Service) was based on the NEDA-RDS 25-Year Employment Forecast Trends as follows: (a) the share of Agricultural employment to total will decrease by 38 per cent; (b) that of industry will increase by 18 per cent; (c) and that of Services will increase by 20 per cent.
Further breakdown of Industry and Services into their sub-sectors were patterned from the national estimates for year 2000 (Five-Year Philippine Development Plan). The 1987 employment figure were projected to year 2000 using 1977-87 growth rates, then the percentage distribution for year 2000 was used as basis for breakdown in the River Basin.
Table C-3 shows resulting year 2000 employment distribution.
Table C-3 INDUSTRY AND SERVICES EMPLOYMENT DISTRIBUTION
Industry 100.00%
Mining 3.5 Manufacturing 77.2 Construction 17.0 Utilities 2.3 Source: NCSO from Five-Year Philippine Development Plan
4.0 MANUFACTURING INDUSTRIES
4.1 Output (GVA) Distribution
Services 100.00%
Transportation 11.0 Commerce 41.0 Services 48.0
With the projected total output (GVA) in manufacturing as constraint, distribution to the industries was based on the NEDA-RDS projection ratios
159

(NEDA-RDS, The Role of Industry in Regional Development, August, 1976, Industrial Table 10) Region X as follows:
Table C-4 PERCENTAGE SHARE OF GVA IN MANUFACTURING
2000
Food, Tobacco & Beverages Textiles, Footwear and Apparel Wood & Wood Products Paper & Paper Products Chemicals & Chemical Products & Petroleum Non-Metallic Mineral Products Basic Metal and Metal Products Machinery Electrical Machinery Transport Equipment Others
Source: RDS-NEDA
4.2 Employment Distribution
12.3 9.1
15.8 9.7
11.7 4.2
32.3 1.9 0.4 2.0 0.6
Employment distribution of the various manufacturing industries in the river basin 1975 was derived from the actual NCSO (provincial) figures for the same year. Initially, the river basins' percentage share in terms of area coverage per province was multiplied to the total employment per industry in the respective provinces. These were then added up to approximate the employment levels in manufacturing in the basin.
For year 2000, the same basis for distributing manufacturing output (GV A) was utilized for employment.
5.0 INDUSTRIAL WATER REQUIREMENT
IWR =
Where: IWR
Water Co-efficient
Water Rate
Output (GV A) x Water Coefficient Water Rate
=
=
=
industrial water requirement by industry
cost ratio of water to total industry from NEDA 1974 inter industry (Input-Output) Accounts of the Philippine (Appendix Table)
rate of commodity by water district (L WUA) 1.20 Region X.
160

6.0 PALAY PRODUCTION
6.1 1975 Palay Areas
Indices to derive palay production from irrigated areas in the basin were all NIA estim~tes. Irrigated areas {31,267 has.) was multiplied by the average cropping intensity (1.8) and yield per hectare (3.45).
Production from non-irrigated areas on the other hand was derived from various parameters. First, irrigated area were deducted from total riceland in the basin to arrive at non-irrigated area estimates. Second, corresponding nonirrigated yield per hectare (NIA 2.5) and average cropping intensity of (NCSO 1.30) were applied to these areas.
Total palay production was estimated as the sum of irrigated and nonirrigated palay yields.
Conversion from palay to rice production used a standard recovery rate of 60 per cent for 1971 and 1975 and 70 per cent for year 2000.
6.2 Year 2000 Palay Projection
Palay projection were based on several factors such as land constraints, farm technology, productivity levels, as well as urban development in the basin area.
Year 2000 production levels were estimated using the land capability estimates, NIA projected irrigated areas and the derived NIA non-irrigated areas against NIA corresponding cropping intensities and productivities.
7.0 CORN PRODUCTION/DEMAND
Corn production in 1975 was estimated by allowing yield per hectare to increase from 1971 level '0.99 MT to 1.31 MT while cropping intensity remained constant.
Projections of corn demand on the other hand, was estimated considering the two important variables of population and income growth. The consumption pattern of corn varies inversely with income as reflected by the negative income elasticity for corn resulting in a shift to other food items as income rises. Total demand for corn was then converted to area requirements and in turn compared with land capability corn areas to get the level of self-sufficiency of corn production in the river basin.
8.0 SUGARCANE PRODUCTION/DEMAND
Based on National Sugar Traders Corporation (NASUTRA) conversion rates, one MT of the sugarcane is roughly equivalent to 0.045 MT of processed sugar. This was adopted in the study to which is comparable to demand. Sugarcane area requirements and targeted production levels to sufficiently meet total demand were likewise targeted with existing capacities of adjacent sugar centrals to process the projected sugarcane production levels.
9.0 OTHER CROPS
For other crops, projections were estimated based mainly on Project ADAM productivity estimates for year 2000 (Journal of Agriculture and Economic Development, Vol. VIII, No. 3 Nov. 1978). Assuming minimal changes in cropping in-
161

tensities for vegetables, rootcr'ops and fruits, land capability area estimates were used with productivity levels at 9.2 MT /ha. for vegetables, 5.5 MT /ha. for rootcrops and 5.0 MT /ha. for fruits. With the objective of assessing the level of self-sufficiency of crop production in the river basin, area requirements based on demand were compared with potenti.al croplands based on land suitability factors from which future land utilization guidelines for basin development could be deduced.
10.0 LIVESTOCK AND POUL TRY PROJECTION
10.1 Population Requirements
Livestock and poultry population requirements were estimated based on food demand computation using the formula:
Required Animal Population = (Food Demand, 2000)
where: Unit Carcass Weight =
10.2 Feedgrain Requirements
(carcass Weights) Extraction Rate)
58 kgs. (Hogs) 150 kgs. (Cattle) 1.2 kgs. (Chicken)
Livestock and Poultry feedgrain requirements were determined by the formula:
Total Animal Feeds = (Animal Population) (Feedgrain requirement per Head per year)
where: Unit Feed Requirement = 210 kgs. (for Hogs)
2.5 kgs. (for Chicken)
30% of total animal feeds were assumed to be corn components.
11.0 AGRICULTURAL WATER DEMAND Agricultural water demand in the basin was derived for rice and other major
crops and. livestock and poultry. Water demand in 1975 was determined using the 19~1 cultivated area for each crops. Agricultural water demand for year 2000 was derived from the land capability map of the basin.
11.1 Crops
The mathematical computation and working equation for the diversion requirement for crops are given as follows: a) TDR rice = UWR x .01 x PA
where TDR = total diversion requirement for rice in (MCM/year)
UWR = unit water requirement per annum based on NIA rainfall evaporation studies at selected rates (in M/year) For Misamis Oriental Basin 1.542 (m/year).
PA = physical area (in hectares)
162

b) TWK other crops = Wr x Cl x PA x No. of days/growing season 106
where:
Wr
Cl PA
=
=
=
water requirement for other crops (in cu.m./ha.day)
cropping intensity physical area
Table C-5 PHYSICAL AREA (IN HAS.) AND CROPPING INTENSITY
Crops PA 1975 PA 2000 Cl 197511 Cl 200021
Palay 2,306 6,201 1.8 Corn 72,938 80,301 1.83 Sugarcane 227 251 1.19 Tobacco 1,436 1,585 1.38 Rootcrops 3,771 4,148 1.52 Vegetables 283 212 1.75
Source: NIA, NCSO, Land Capability Map
1 / NCSO, 1971
21 Estimates
Table C-6 WATER REQUIREMENT AND NUMBER OF DAYS PER
GROWING SEASON
2.0 1.9 1.2 1 :4 1.6 1.8
Water Requirements (M3 /Ha./Day)
Number of Days/Growing Season
Corn Sugarcane Tobacco Vegetable Rootcrops
Source: NEDA 1975
11.2 Livestock and Poultry
58 43.5 48 49.1 51.7
95 390 240
85.4 96.7
Livestock and Poultry water demand was determined by multiplying actual (for 1975) required (for 2000) livestock and poultry population by the water consumption per head, as follows:
Table C-7 UNIT WATER REQUIREMENTS
LIVESTOCK AND POULTRY
Livestock and Poultry Water Consumption/Head/Year
Cattle Swine Chicken
Source: BAI
163
7.5 cu.m, 7.5 cu.m. 0.046 cu.m.

Cattle water demand ·was determined by using the actual population in 1971 and the potential population (based in pasture land) by year 2000.
Cattle Swine Chicken
1/Actual,1971
12.0 FUTURE FOOD DEMAND
Table C-8 ANIMAL POPULATION
197511
3,755 3,342
142
2000
280,355 862,414
19,583,333
The food demand pattern in the basin area were deduced from the general consumption characteristics of Region X. The aggregate consumption levels of selected items were calculated considering population growth, income changes and dietary traditions or nutritional requirements. The method used was the compound growth rate formula as follows:
Dt = P x c (1 + Ye)n
where: Dt = demand for nth year
P = population in the nth year
C = per capita consumption
Y = real income growth rate
e = income elasticity of demand
Tables C-9 and C-10 show per capita consumption of major foods and income elasticities of demand for Region X.
Table C-9
PER CAPITA CONSUMPTION OF MAJOR FOODS (In Kg./Year)
Commodity 1975 Rice 78.40 Corn Sugar
41.95
Fruits 20.69
Vegetables 55.92
Rootcrops 56.20
Pork 22.70
Beef /Carabeef 9.60
Poultry Meat 4.00 5.13
Source: NEDA
164
2000
79.44 23.60 33.18 75.28 77.07 21.73 17.39
7.31 8.17

Table C-10 INCOME ELASTICITY OF DEMAND FOR SELECTED
COMMODITIES
Rice Corn Sugar Fruits Vegetables Rootcrops Pork Beef /Carabeef Poultry Meat Fish
Source: NEDA
First Ten Years
0.10 -0.24
0.54 0.26 0.26 0.02 0.60 0.76 0.66 0.35
13.0 AREA REQUIREMENTS TO MEET DEMAND
13 .1 For Crops
Next 15 Years
0.05 0.53 0.27 0.21 0.24 0.04 0.30 0.30 0.30 0.21
Estimation of area requirements based on demand in the river basin in 1975 and year 2000 utilized the following formula:
Area Requirement = Total Demand
Cl x Yield Per Hectare
Rice demand was first converted to palay production by the rice/palay conversion factor of 60 per cent for 1975 and 70 per cent for year 2000, while sugar was converted back to cane utilizing the NASUTRA cane-to-processed-sugar conversion rate. of 1 :045 MT.
Rice Corn Sugar Fruits Vegetables Rootcrops Pork Beef /Cara beef Poultry Meat
Table C-11 TOTAL DEMAND
165
1975
78,150 40,049 16,499 44,593 44,816 18,102
7,655 3,19C 4,091
2000
171,372 110,845 57,262
129,918 133,008 37,502 30,012 12,616 14,100

Rice w/ irrigation w/o irrigation
Corn Sugarcane Fruits Vegetables Rootcrops
Table C-12 YIELD PER HECTARE
1~75 11
3.45 2/
2.5 3/
.537 112.236
.803 1.802 1.100
2000
4.5 2/
3.0 3/
2.56541
46.9 5/
4.0 6/
9.0 5/
5.5 5/
1 /Adjusted from 1971 actual figure
2/ NIA-Estimates
4/ Masaganang Maisan Target
3/ 1bid. 5/ MAAGAP (Project ADAMI estimates
6/ Retained 1975 figure
13.2 For Pasture Land
Pasture land requirements based on demand considered the standard NCSO stocking rate of 2 heads per hectare. Required animal population as discussed in Section 10.1 and shown in Table C-8 were divided by two to approximate area requirements for pasture lands to hold the projected cattle/production.
Table C-13 MANUFACTURING WATER REQUIREMENT
BY INDUSTRY GROUP
Misamis Oriental Basins
1975
Food and Beverages and Tobacco .0502 Textiles, Footwear and Related
Products .0017 Wood and Wood Products .0205 Paper, Printing and Allied Products .0082 Chemical Products, Petroleum and
Coal .0213 Non-Metallic Mineral Products .0015 Basic Metal and Metal Products .0089 Machinery and Equipment .0003 Electrical Machinery .0001 Transport Equipment .0016 Others .0014
TOTAL MANUFACTURING .1157
166
2000
.6555
.2706
.4058
.3984
9.3931 .0337
1.7925 .0496 .0104 .0478
.0386 11.3657

• Table D-1
• Table D-2
• Table D-3
APPENDIX D
SOCIAL
Population, Density, and Population Distribution in the Basin
Population Projections by Municipality 1975-2000 (medium assumption)
Number of Households by Source of Water, 1970
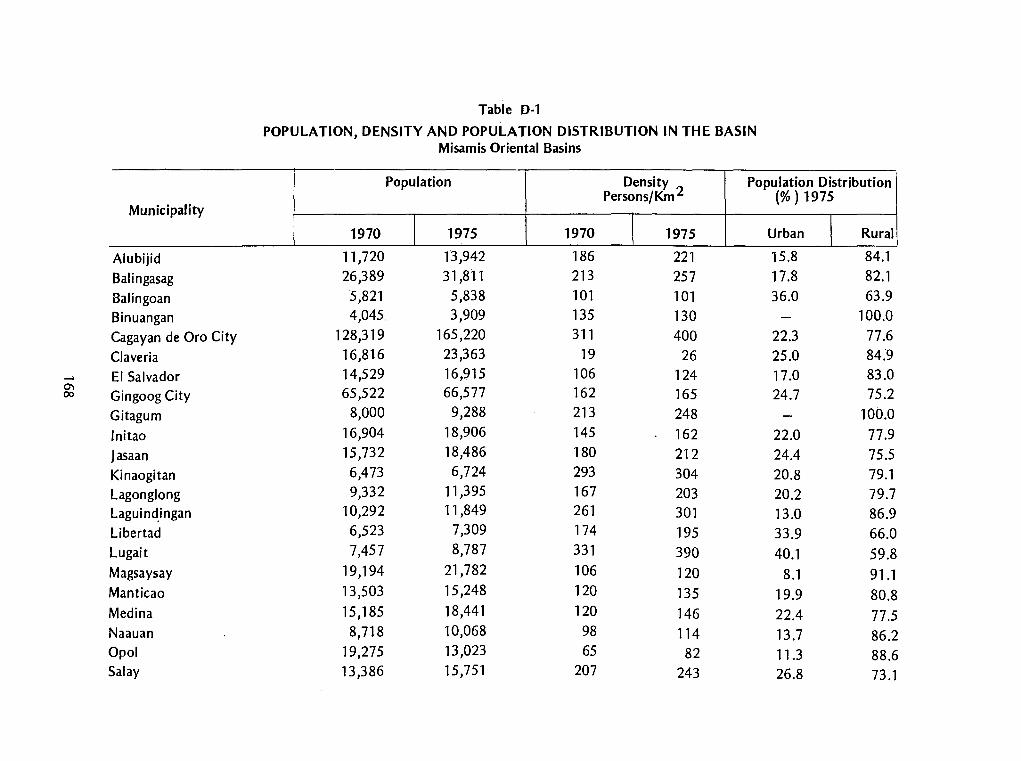
Municipality
Alubijid Balingasag Balingoan Binuangan Cagayan de Oro City Claveria El Salvador
°' 00 Gingoog City
Gitagum lnitao
Jasaan Kinaogitan Lagonglong Laguin~ingan
Libertad Lugait
Magsaysay
Manticao
Medina Naauan Opal Salay
Table D-1
POPULATION, DENSITY AND POPULATION DISTRIBUTION IN THE BASIN Misamis Oriental Basins
Population Density Persons/Km 2
Population Distribution (%) 1975
1970 I 1975 1970 [ 1975 Urban I Rural
11,720 13,942 186 221 15.8 84.1 26,389 31,811 213 257 17.8 82.1
5,821 5,838 101 101 36.0 63.9 4,045 3,909 135 130 100.0
128,319 165,220 311 400 22.3 77.6 16,816 23,363 19 26 25.0 84.9 14,529 16,915 106 124 17.0 83.0 65,522 66,577 162 165 24.7 75.2
8,000 9,288 213 248 100.0 16,904 18,906 145 162 22.0 77.9 15,732 18,486 180 212 24.4 75.5 6,473 6,724 293 304 20.8 79.1 9,332 11,395 167 203 20.2 79.7
10,292 11,849 261 301 13.0 86.9 6,523 7,309 174 195 33.9 66.0 7,457 8,787 331 390 40.1 59.8
19, 194 21,782 106 120 8.1 91.1 13,503 15 ,248 120 135 19.9 80.8 15, 185 18,441 120 146 22.4 77.5 8,718 10,068 98 114 13.7 86.2
19,275 13,023 65 82 11.3 88.6 13,386 15,751 207 243 26.8 73.1

Municipality
Sugbongcogon Tagoloan Talisayan Villanueva Catarman Mahinog Mambajao Sa gay Guinsiliban Buenavista Carmen Nasipit Baungon lmpasig-ong Li bona Malitbog Manolo Fortich Sumilao Talakag
T 0 TA L
Table D-1 (cont.)
POPULATION, DENSITY AND POPULATION DISTRIBUTION IN THE BASIN Misamis Oriental Basins
Population Density Persons/Km2
Population Distribution (%) 1975
1970 I 1975 1970 I 1975 Urban Rural 5,276 6,021 228 261 26.8 73.1
11,468 14,958 131 171 15.6 84.3 14,988 15,016 109 109 20.4 79.5
6,889 9,863 141 202 38.6 61.3 11,996 12, 168 223 226 16.8 83.1 8,999 9,411 276 289 21.6 78.3
18,673 19, 183 210 215 28.3 71.6 8,559 7,726 281 253 32.6 67.3 5,686 4,057 237 169 100.0
24,753 28,682 80 93 30.6 69.3 12,851 13,882 146 158 27.3 72.6 23,306 25,289 221 240 35.1 64.8 11,251 14,974 47 62 20.2 79.7 9,169 11,911 9 37 100.0
14,988 16,481 46 51 100.0 8,230 11,885 15 22 100.0
27,159 31,840 61 71 6.4 93.5 6,528 6,927 33 35 22.8 77.1
22,649 22,538 24 24 11.4 88.5
687,553 797,446 85.9 99.7 19.9 80.0

Table D-2 POPULATION PROJECTIONS BY MUNICIPALITY
1975-2000 (Medium Assumption)
Misamis Oriental Basins
Municipality 1975 1980 1990 2000 Actual Actual
Alubijid 13,942 15,441 21,330 29,464 Balingasag 31,811 38,308 46,367 56, 121 Balingoan 5,838 6,611 5,329 8,503 Binuangan 3,909 4,458 6,835 10,479 Cagayan de Oro 165,220 228,409 310,432 421,910 Claveria 23,363 29,065 27,665 26,333 El Salvador 16,915 20,462 27,338 36,525 Gingoog City 66,577 81,098 103,391 131,813 Gitagum 9,288 9,657 11,560 13,839 lnitao 18,906 21,879 27,931 35,657 Jasaan 18,486 23,521 30,500 39,550 Kinogitan 6,724 7,203 10,826 16,273 Lagonglong 11,395 13,578 16,622 20,349 Laguindingan 11,849 12,021 17,636 25,874 Libertad 7,309 7,739 11,265 16,399 Lugait 8,787 10,779 13,730 17,491 Magsaysay 21,782 22,821 37,326 61,051 Manticao 15,248 17,286 22,667 29,723 Medina 18,441 21,936 26,341 31,631 Naawan 10,068 12,300 16,419 21,917 Opal 13,023 16,145 20,421 25,831 Salay 15,751 17,905 24,547 33,652 Sugbongcogon 6,021 6,234 7,566 9,182 Tagoloan 14,958 22,004 24,968 28,332 Talisayan 15,016 15,660 17,379 19,287 Villanueva 9,863 11,903 15,924 21,304 Catarman 12, 168 12,422 17,678 25,157 Mahinog 9,411 9,997 14, 117 19,935 Mambajao 19, 183 21,335 30,538 43,710 Sagay 7,726 9,120 12,723 17,750 Guinsiliban 4,057 4,254 7,318 12,564 Bucnavista 28,682 31,577 44,490 62,684 Carmen 13,882 14,606 25,366 44,054 Nasipit 25,289 29,920 48,391 78,266 Baungon 14,974 18,307 20,529 23,022 lmpasog-ong 11,911 14,822 17, 733 21,216 Li bona 16,481 21,217 27,623 35,963 Malit bog 11,885 13,581 18,941 26,418 Manolo Fortich 31,840 42,492 53,965 68,537 Sumilao 6,927 8,636 13,220 20,237 Talakag 22,538 25,061 30,778 37,799
TOTAL 797,446 971,770 1,285,725 1,725,802
170

Table D-3 NUMBER OF HOUSEHOLDS BY SOURCE OF WATER, 1970
Misamis Oriental Basins
Total No. of Piped Artesian Pumps Open Springs Rain Lakes & Municipality Households Water Wells Wells Water Stream
Alubijid 1,944 64 845 873 145 17 Balingasag 4,256 350 1,416 330 114 1,912 3 131 Balingoan 934 88 350 91 328 77 Binuangan 634 490 138 5 Cagayan de Oro City 20,192 13,105 541 2,572 1,595 1,892 64 424 Claveria 2,810 465 5 263 1,936 8 133 El Salvador 2,473 451 148 877 648 229 120
__. Gingoog City 10,680 2,749 877 681 1,090 4,950 87 246 -....J Gitagum 1,338 148 687 414 75 14
lnitao 2,711 612 378 743 791 174 12 Jasaan 2,565 1,176 151 29 139 712 13 345 Kinogitan 1,039 769 24 15 229 1 Lagonglong 1,465 478 108 181 23 665 7 3 Laguindingan 1,681 350 1,080 179 68 4 Libertad 1,069 290 246 459 68 5 Lu gait 1,278 474 171 70 379 184 1 Magsaysay 3,235 128 760 1,235 1,029 22 61 Manticao 2,171 421 59 654 807 221 1 8 Medina 2,374 1,075 42 437 57 682 9 72 Naawan 1,375 16 636 514 194 15 Opol 1,736 180 34 452 604 440 25 Salay 2,166 1,292 15 4 35 819
Source: 1976 Census of Population and Housing

Table D-3 (cont.) NUMBER OF HOUSEHOLDS BY SOURCE OF WATER, 1970
Misamis Oriental Basins
Total No. of Piped Artesian Pumps Open Springs Rain Lakes & Municipality Households Water Wells Wells Water Stream
Sugbongcogon 778 626 1 151
Tagoloan 1,776 39 58 1,001 428 107 34 109
Talisayan 2,335 1,242 389 70 34 578 5 17
Villanueva 1,073 108 415 118 398 7 27
Ca tar man 1,969 1,309 13 60 25 542 14 6
Mahinog 1,494 1,298 6 24 153 12
....... Mambajao 2,958 2,536 8 40 342 31 -.J So gay 1,468 1,026 13 172 250 7 IV
Guinsilaban 747 616 9 46 76
Buenavista 4,020 736 180 1,414 1,057 532 13 88
Carmen 2,130 643 58 517 623 271 6 12
Nasipit 3,601 1,436 484 1,215 364 37 6 59
Baungon 1,913 61 666 648 33 205
lmpasog-ong 1,453 339 241 635 19 219
Li bona 2,398 113 616 993 585 37 54 Malitbog 1,450 198 73 898 14 267
Manolo Fortich 4,204 2,413 152 16 466 1,063 15 79
Sumilao 996 217 2 280 460 19 18
Talakag 3,664 36 363 770 1,834 90 571
TOTAL 110,554 37, 108 6,652 19,066 16,747 26,949 620 3,412
SOURCE: 1976 Census of Population and Housing,

APPENDIX E
POWER
o Glossary
o Summary of Forecast Assumptions
o Table E-1 Bases for Computing Future Load
o Table E-2
o Figure E-1
o Figure E-2
Load Forecast
Mindanao Grid Installed Capacity and Systems Demand of Misamis Oriental Basins
Mindanao Power Projects

Load Factor
Connected Load
Maximum Demand
Geothermal
Grid
Hydroelectric
Nuclear
Power
Sub-station
Voltage
Watt
Watt-Hour
Average kilowatt Hour (KWH)
Total KWH per month
System Loss
GLOSSARY
the ratio of the average load over a designated period of time to the peak load occuring in that period average load maximum demand
sum of continuous load
the greatest of all demands which have occurred during a specified period of time
relating to the heat of the earth's interior
interconnected of power station and transformation facilities
of, relating to, or employed in the production of electricity by water power
of, or relating to atomic power
energy capable of being transformed into work
consists of one or more transformers mechanically and electrically connected and coordinated in design and construction
the greatest root mean square difference of potential between any two conductors of the circuit connected
Absolute MKS unit of power equal to 1 joule per second or 1 /746 horsepower Note: 1 megawatt (MW) = 1,000,000 watts
unit of work or energy equivalent to the power of one watt operating for one hour and equal to about 2,655 foot pounds.
per consumer per month simulation of load behavior of each type of load for a given 24-hour period. The average KWH per consumer per month based on NEA and assumptions.
total number of consumers to be multiplied by the average KWH/ month/consumer
transmission losses from the generation outlet to the transfer point to service areas of 24 per cent were assumed.
174

SUMMARY OF FORECAST ASSUMPTIONS
Based on statistics and practices here in the Philippines, the commercial levels and usage of the potential consumers in the data were computed for the 1st (1980), 1 Oth (1990) and 20th (2000) years taking into consideration the percentage connection level and population growth rates. Other considerations taken into account were the engineering Feasibility Report by the National Electrification Administration, the actual housecount, field investigation and load feasibility and engineering studies by NEA engineering consultant. The load levels and usage (KWH/month/consumer) were projected up to year 2000.
The percentage connection in 1975 was based on actual households connection for Misamis Oriental River Basins. For the first year (1980) it assumed to be 52% for the 10th year (1990) 73% and for the 20th year (2000) 93%. The low percentage connection in 1980 is due to the initial connection covering poblacion areas and minimal connection along the feeder route. The percentage increase in the number of potential consumer for poblaciones and barrios were based on the annual growth per area covered by the basins.
Consumption in kilowatt hour per type of consumer were based on the consumption rate prepared by the NEA engineering consultant. From the average consumption in KWH/ month/consumer and estimated number of consumers, the maximum demand was determined for every city and municipalities covered by the basins.
The number of consumers and corresponding kilowatt demand in the data were projected up to 2000th year to determine the overall system demand with Misamis Oriental Basins.
175

Table E-1 BASES FOR COMPUTING FUTURE LOAD
Misamis Oriental Basins
In the other load computations, the following were assumed:
1. Population growth rate
1980 - 1990 = 1980-2000 =
1.0283914 1.0291327
2. Connection level and assumption rates
1980 = 52% at 35 kwh/month/consumer 1990 = 73% at 54 kwh/month/consumer 2000 = 93% at 80 kwh/month/consumer
3. Population increases
1980 = 1.21860 1990 = 1.61230 2000 = 2.16416
From the above assumptions, the following were derived:
C = other load in 1980 = 188,247,000 kwh/yr.
Other Load (1990} = (1.0283914'1 O x 73 C = 1.857 c 52
Other Load (2000} = (1.029327}20 x 93 c 52
Table E-2 Misamis Oriental Basins
Description 1975 1980
1. Population 797,446 971,770 2. Number of households 127,137 159,307 3. Number of Consumers 82,840 4. Projected increase on number
of houses based on 1975-1980
= 3.176 c
Planning Year 1990
1,285,725 210,775 153,866
figures (%) 25.30 65.78 5. Average KWH/month/consumer 35 58 6. Total KWH/month x 1000 2,899 8,924 7. Total KWH/ year x 1000 34,793 107,090 8. Other Load (KWH/year x 1000} 188,247 249,870 9. Sub-total (KWH/year x 1000} 223,040 356,961 10. System loss(%) 24 24 11. KWH/year (purchase/generate} 293,470 469,685 12. Load Factor(% 34 52 13. KW (peak/year) 98,536 103, 100 14. Peaking Factor 1.2 1.2 15. KW (Annual) 118,241 123, 730
176
2000
1,725,802 275,000 255,750
116.302 80
20,460 245,520 597,872 843,392
24 1,109 ,726
70 180,973
1.2 217 ,168

3()()(}
..,~
~ >< z Cl z <{ 2000 :;: UJ Cl
~ <{
:t 0 ..J
~
1000
Figure E-1 MINDANAO GRID INSTALLED CAPACITY ANO SYSTEM DEMAND
OF MISAMIS ORIENTAL BASINS
I I
I I
I I
I I
I I
, , , I ,
I I
I
/ , , ,
,' , ,
,,,.,,,,.,,--.,,.""
____ ...... ----.,,.-
, .,._,..__...,.,MINDANAO GKIO CAl'1\CI lY ,
I I
I I ,
• I -1980
l ~)~)(] YEAR or l'ROJE:C TIO~
177

...... 00
Figure E-2
Mindanao Power Projects
AGUS VII HE 54MW 1982 AGUS VI HE 200 MW (1977)
APLAYA DIESEL 112 MW (1981)
APLA YA DIESEL 11 MW (1977)
AGUSAN HE 1.6 MW (1957)
LEGEND:
GENERATING PLANTS 0 Hydroelectric
• Coal Thermal
8 Diesel
SUBSTATIONS
C Main:Substation
A Load End Substation
TRANSMISSION LINES Existing Under Const./Proposed
Implementation
COAL-FIRED THERMAL I 150 MW (1986)
TALOMO II HE 0.5 MW (1953)
TALOMO II-A HE 0.65 MW (1976)
TALOMO 11-B HE 0.3 MW (1954)
TALOMO Ill HE 1.8 MW (1956)
DAVAO BARGE 32 MW (1982)
GEN. SANTOS BARGE 22 MW (1983)

REFERENCES
BOOKS
Frevert R.K., et.al
1971 Soil and Water Conservation Engineering. Second Edition Liongson, L.Q.
1978 A user's guide to a subprogram library for applications in stochastic hydrology. Quezon City
Maass, Arthur, et. al.
1962 Design of water-resource systems. Harvard University Press, Cambridge Massachusettes
Martin, Charles
1976 Project Oriented Organization, In Project Management, How to make it work.
Abradovich, M.M.
1973 A climatic map of the Philippines. Processed.
Ven Te Chow
1963 Handbook on Applied Hydrology. McGraw-Hill. New York
REPRINTED ARTICLES
Buie, Eugene C.
Interdisciplinary teamwork in watershed planning. Processed.
Coutu, Arthur, J.
Estimation of income and hydrologic effects of alternative watershed programs. Journal Paper No. 1057, North Carolina Agricultural Experiment Station. Processed.
Ellis, Harold H.
Relationship between water and other property rights and small watershed development in the eastern states. Processed.
Ford, Edwin C., et. al. The benefits from watershed development Journal Paper No. 1145, North Carolina Agricultural Experiment Station. Processed.
Reagan, Mark M. Economically desirable institutional arrangement and cost sharing requirements. Processed.
Riggs, Fretcher E.
The watershed as an entity for planning. Processed.
Scot, William Henry 1958 A preliminary report on upland rice in Northern Luzon. Vol. 14.
Processed.
179
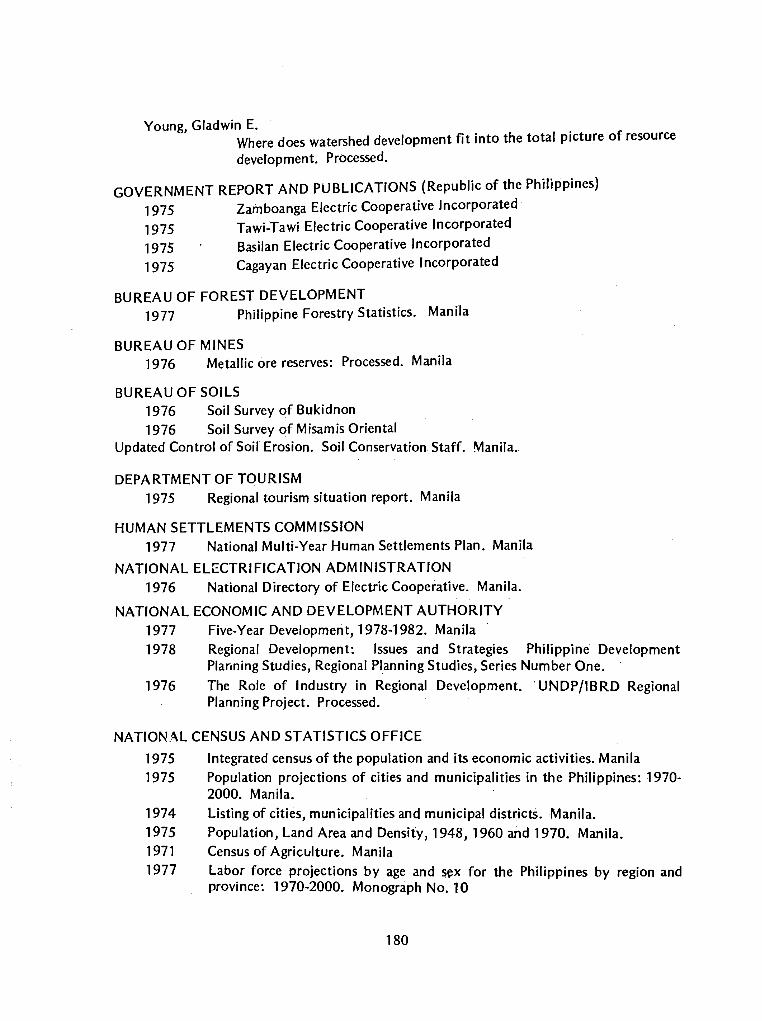
Young, Gladwin E. Where does watershed development fit into the total picture of resource
devetopment. Processed.
GOVERNMENT REPORT AND PUBLICATIONS (Republic of the Philippines)
1975 Zamboanga Electric Cooperative Incorporated 1975 Tawi-Tawi Electric Cooperative Incorporated 1975 Basilan Electric Cooperative Incorporated 1975 Cagayan Electric Cooperative Incorporated
BUREAU OF FOREST DEVELOPMENT 1977 Philippine Forestry Statistics. Manila
BUREAU OF MINES 1976 Metallic ore reserves: Processed. Manila
BUREAU OF SOILS 1976 Soil Survey of Bukidnon 1976 Soil Survey of Misamis Oriental
Updated Control of Soil Erosion. Soil Conservation Staff. Manila.
DEPARTMENT OF TOURISM 1975 Regional tourism situation report. Manila
HUMAN SETTLEMENTS COMMISSION 1977 National Multi-Year Human Settlements Plan. Manila
NATIONAL EU::CTRIFICATION ADMINISTRATION 1976 National Directory of Electric Cooperative. Manila.
NATIONAL ECONOMIC AND DEVELOPMENT AUTHORITY 1977 Five-Year Development, 1978-1982. Manila 1978 Regional Development: Issues and Strategies Philippine Development
Planning Studies, Regional Planning Studies, Series Number One.
1976 The Role of Industry in Regional Development. UNDP/IBRD Regional Planning Project. Processed.
NATIONAL CENSUS AND STATISTICS OFFICE
1975 Integrated census of the population and its economic activities. Manila
1975 Population projections of cities and municipalities in the Philippines: 1970-2000. Manila.
1974 Listing of cities, municipalities and municipal districts. Manila.
1975 Population, Land Area and Density, 1948, 1960 and 1970. Manila. 1971 Census of Agriculture. Manila
1977 Labor force projections by age and sex for the Philippines by region and province: 1970-2000. Monograph No. 10
180

1976 Geographical patterns of internal migration in the Philippines. 1960-1970. Monograph No. 5. Manila.
1975 Total income and per capita income. Preliminary tabulation. Manila 1970 Census of population and housing. Manila
NATIONAL POWER CORPORATION 1979 Power Expansion Program. Manila. 1977 Survey Inventory of Water Impounding Reservoir, 1978. Quezon City. 1976 Philippine Water Resources. Quezon City. 1977 Manual of Water Data Standard. Vols. 1-15.
PHILIPPINE ATMOSPHERIC, GEOPHYSICAL AND ASTRONOMICAL SERVICES ADMINISTRATION 1975 Tropical-Cyclones. Processed. Quezon City 1960 Climatic Observation. Processed. Quezon City
Climate of the Philippines. Processed. Quezon City
PHILIPPINE WEATHER BUREAU Annual Climatological Review, 1952, 54, 60-70. Quezon City.
INTERNATIONAL PUBLICATIONS
MAP
1974 Approaches to water development planning in developed and developing economics. Food and Agriculture Organizations. Processed. Rpme.
1976 A framework for land evaluation. Food and Agriculture Organization. Processed. Rome.
1974 Methods for Projection of Urban and Rural Population. United National Manual VIII. Processed. New York.
Bureau of Coast and Geodetic Survey 1976 Topo Maps, Scale 1 :250,000. Manila
181