Report The Tracer Study - DOST-SEI
49
Science Education Institute Department of Science and Technology September 2020 Report The Tracer Study DOST-SEI Undergraduate Scholar-Graduates Batch 2018 and 2019
-
Upload
khangminh22 -
Category
Documents
-
view
0 -
download
0
Transcript of Report The Tracer Study - DOST-SEI

Science Education InstituteDepartment of Science and Technology
September 2020
ReportThe Tracer Study
DOST-SEI UndergraduateScholar-GraduatesBatch 2018 and 2019
September 2020
Department of Science and TechnologyScience Education Institute
ReportThe Tracer Study
DOST-SEI UndergraduateScholar-GraduatesBatch 2018 and 2019

The Tracer Study Report DOST-SEI Undergraduate Scholar Graduates Batch 2018 and 2019
ISSN 2449-4925
All rights reserved.©2020 by the Department of Science and Technology - Science Educa�on Ins�tute (DOST-SEI) Metro Manila, Philippines
Suggested Citation:Department of Science and Technology - Science Educa�on ins�tute (DOST-SEI) (2020). The Tracer Study Report DOST-SEI Undergraduate Scholar Graduates Batch 2018 and 2019 DOST-SEI, Taguig City.
Published by:Department of Science and Technology - Science Educa�on Ins�tute (DOST-SEI)1st and 2nd Levels, Science Heritage BuildingDOST Compound, General Santos AvenueBicutan, Taguig City, Metro Manila, PhilippinesTel. Nos. (632) 8837-1359, (632) 8839-0241, Fax No. (632) 8837-1925h�ps://www.sei.dost.gov.ph
Request for permission to use any material from this publica�on or for further informa�onshould be addressed to the copyright holder.
Printed in Metro Manila, Philippines

Contents
List of Figures .................................................................................................. List of Table .....................................................................................................
Foreword ................................................................................
1 Introduc�on ...................................................................
1.1. Survey Overview ............................................................................ 1.2. General Objec�ve .......................................................................... 1.3. Scope and Methodology ................................................................
2 Results ...........................................................................
2.1. Socio-Demographic Characteris�cs of Scholar-Graduates ............ 2.2. Job Search and Transi�on to Work ................................................ 2.3. Current Employment and Work Characteris�cs ............................ 2.4. Feedback/Issues and Concerns of Scholars ...................................
3 Summary and Conclusion ..............................................
iv - vivivii
1 - 3
1 - 22 - 33
5 - 36
5 - 89 - 1415 - 3132 - 36
37 - 39
iii
List of Figures
Figure 1. Percentage distribu�on of scholar-graduates Batch 2018 and 2019 by sex, civil status, and age
Figure 2. Percentage distribu�on of scholar-graduates Batch 2018 and 2019 by scholarship program sadhkashdhkdhshsdsjdakjsdh
Figure 3. Percentage distribu�on of scholar-graduates Batch 2018 and 2019 by field of study
Figure 4. Percentage distribu�on of scholar-graduates Batch 2018 and 2019 by employment situa�on (first six months a�er gradua�on)sadhkashdhkdhshh
Figure 5. Percentage distribu�on of scholar-graduates Batch 2018 and 2019 with job/work within six months a�er gradua�on by sex
Figure 6. Percentage distribu�on of scholar-graduates Batch 2018 and 2019 by specific fields of study with jobs within the first six months a�er gradua�on
Figure 7. Percentage distribu�on of scholar-graduates Batch 2018 and 2019 by means of acquiring first job/work a�er gradua�on
Figure 8. Percentage distribu�on of scholar-graduates Batch 2018 and 2019 by period of �me in acquiring fist job/work
Figure 9. Percentage distribu�on of scholar-graduates Batch 2018 and 2019 with current employment by sex
Figure 10. Percentage distribu�on of scholar-graduates Batch 2018 and 2019 who are currently employed
Figure 11. Percentage distribu�on of scholar-graduates Batch 2018 and 2019 with “first job/work a�er gradua�on”hkdhsFigure 12. Percentage distribu�on of scholar-graduates Batch 2018 and 2019 by employment classifica�on
iv
5 - 6
6
8
9
10
11
13
14
15
16
16
17
Figure 13.a. Percentage distribu�on of scholar-graduates Batch 2018 and 2019 by employment sector
Figure 13.b. Percentage distribu�on of scholar-graduates Batch 2018 and 2019 by employment sector and employment classifica�on
Figure 14.a Percentage distribu�on of scholar-graduates Batch 2018 and 2019 employed in the private sector
Figure 14.b. Percentage distribu�on of scholar-graduates Batch 2018 and 2019 employed in the government sector
Figure 14.c. Percentage distribu�on of scholar-graduates Batch 2018 and 2019 employed in the academe
Figure 15. Percentage distribu�on of scholar-graduates Batch 2018 and 2019 by employment dura�on of current job/work
Figure 16. Percentage distribu�on of scholar-graduates Batch 2018 and 2019 by appropriateness of field of study in rela�on to current job/work
Figure 17. Percentage distribu�on of scholar-graduates Batch 2018 and 2019 by qualifica�on/degree versus current job/work
Figure 18. Percentage distribu�on of scholar-graduates Batch 2018 and 2019 by appropriateness of professional posi�on to current job/work
Figure 19. Percentage distribu�on of scholar-graduates Batch 2018 and 2019 by reasons for taking current job/work
Figure 20. Percentage distribu�on of scholar-graduates Batch 2018 and 2019 by degree of sa�sfac�on of current job/work situa�on
Figure 21. Percentage distribu�on of scholar-graduates Batch 2018 and 2019 by occupa�onal classifica�on by sex
Figure 22. Percentage distribu�on of scholar-graduates Batch 2018 and 2019 by income per month
Figure 23. Percentage distribu�on of scholar-graduates Batch 2018 and 2019 who said “being a DOST-SEI Scholar is an advantage in Job Search”
v
18
18
19
20
20
21
22
23
24
25
26
30
31
32

Figure 24. Percentage distribu�on of scholar-graduates Batch 2018 and 2019 by preferred means of contacts/communica�on
List of Table
Table 1. Occupa�onal Classifica�on of Scholar-Graduates Batch 2018 and 2019, Undergraduate Level (using Interna�onal Standard Classifica�on of Occupa�ons e.g. Major, Sub-major, Minor and Unit Groups)
27 - 30
36
vi
This report presents the findings of the Tracer Study conducted among DOST-SEI undergraduate scholar-graduates Batch 2018 and 2019, par�cularly those who a�ended the Exit Conferences held in NCR and in the various regions of the country. This is the very first tracer study conducted by the Research Unit, STMERPD that tracked the whereabouts of a specific batch of scholar-graduates, one to two years a�er gradua�on.
This report provides a more detailed informa�on and a be�er picture of the scholar-graduates’ situa�on in the labor market. It focuses on the demographic characteris�cs of the scholar-graduates, job search and transi�on to work, employment characteris�cs, match between field of study and current jobs, occupa�onal classifica�on, relevance of being a DOST-SEI in job search, job sa�sfac�on, and other relevant feedbacks of the scholar-graduates.
We hope that this report will encourage all our scholar-graduates to ac�vely register and update their informa�on in the DOST-SEI Tracer website regularly, to become part of the pool of S&T professionals in the country and document the impact of the scholarship program in their personal lives and professional careers. Correspondingly, the DOST-SEI will con�nue to ensure effec�ve and efficient delivery of
Foreword
services to our clients, and con�nuously reach out to our scholar alumni to become more responsive and relevant ci�zens of our country. This in turn, leads the government to jus�fy its con�nued investment in S&T scholarship programs for na�onal development.
JOSETTE T. BIYO, Ph.D.Director, DOST-SEI
vii

1.1 Survey Overview
1. INTRODUCTION
The Department of Science and Technology (DOST) through the Science Educa�on Ins�tute (SEI), is mandated through Execu�ve Order No. 128, to undertake efforts on accelera�ng the produc�on of the country’s S&T human resource capability through the grant of scholarships in Science Technology, Engineering, and Mathema�cs (STEM). The tracking of the DOST-SEI scholar-graduates of the various scholarship programs has been a challenge for the Ins�tute for a long period of �me. Hence, the tracer study is one of the regular research ac�vi�es of the Science and Technology Manpower Educa�on Research and Promo�on Division (STMERPD), Research Unit to reach out to the DOST-SEI scholars, and track their post-scholarship careers.
The periodic tracking of the scholar graduates focuses on determining their present situa�on and career movement, par�cularly their employment loca�on and status. The scholar-graduates’ major successes and stories of real-life contribu�ons to their families, communi�es, organiza�ons and the country in general are likewise documented.
As of January 2020, the following five (5) DOST-SEI tracer studies, including this one, the Tracer Study of DOST-SEI Scholar Graduates, Batch 2018 and 2019 (Undergraduate Level) have been conducted: a
1. Tracer Study on DOST-SEI S&T Scholar Graduates 2000-2011, Factsheet No. 1 (unpublished 2012).
2. Tracer Study on DOST-SEI S&T Scholar Graduates 2000-2012, Factsheet No. 2 (ISSN 2449-4925, 2015).
1

3. Tracer Study on DOST-SEI S&T Scholar Graduates 2000-2012, Factsheet No. 3 (ISSN 2449-4925, 2017).
4. Tracer Study on DOST-SEI S&T Scholar Graduates 2000-2012, Factsheet No. 4 (ISSN 2449-4925, 2019).
5. The Tracer Study Report, DOST-SEI Undergraduate Scholar-Graduates Batch 2018 and 2019, (ISSN 2449-4925, 2020).
2
The Tracer Study ReportDOST-SEI Undergraduate Scholar-Graduates Batch 2018 and 2019
This current Tracer Survey Report provides valuable informa�on on the employment situa�on, place of work, job search and transi�on to work (e.g., the period of �me they get their first job) of scholar-graduates who graduated in 2018 and 2019. The informa�on about the rela�onship of scholar-graduates’ educa�on with their current jobs, relevance of being a DOST-SEI in job search, degree of job sa�sfac�on, including their feedbacks are likewise presented in this report. This informa�on may be vital in assessing the employability of DOST-SEI scholar-graduates a�er gradua�on, (e.g. one to two years a�er gradua�on), and in developing appropriate ac�ons and strategies to maximize the full poten�al of scholar- graduates for regional and na�onal development.
To follow up the whereabouts of scholar-graduates Batch 2018 and 2019 a�er gradua�on.
Specific Objectives
1. To determine the socio-demographic characteris�cs of DOST-SEI scholar- graduates Batch 2018 and 2019 in terms of sex, civil status, age, scholarship program availed, and fields of study;
2. To determine the employment and work characteris�cs of scholar- graduates Batch 2018 and 2019 in their respec�ve employments;
1.2 General Objective

3
The Tracer Study ReportDOST-SEI Undergraduate Scholar-Graduates Batch 2018 and 2019
3. To determine the relevance of the scholar-graduates’ educa�on to current jobs;
4. To determine the advantage of being a DOST-SEI scholar-graduate as a creden�al for employment opportuni�es; and
5. To gather some feedbacks from the DOST-SEI scholar graduates.
1.3 Scope and Methodology
This study focuses on the scholar-graduates who completed their program of study in 2018 and 2019, through any of the following scholarship programs of DOST-SEI S&T Undergraduate Scholarship Programs: 1) RA 7687 (S&T Schoalrship Act of 1994); 2) RA 2067 (Merit); and 3) RA 10612 (JLSS), par�cularly those who accomplished the Exit Survey ques�onnaires distributed during the conduct of Exit Conferences, held in NCR and in the various regions of the country in 2018 and 2019. The scholar-graduates were invited to par�cipate in the online tracer study, through their email addresses, using the Google Survey Form. The tracer study ques�onnaire has four parts namely: Part 1. Socio-Demographic Characteris�cs of Scholars; Part 2. Job Search and Transi�on to Work; Part 3. Employment and Work Characteris�cs; and Part 4. Feedback of Scholar-Graduates. The ques�onnaire intends to obtain both quan�ta�ve and qualita�ve data from DOST-SEI scholar graduates about their whereabouts a�er gradua�on.
A total of 1,098 scholar-graduates responded to the tracer online survey, with a response rate of 66.4%. These scholar-graduates have already graduated from their respec�ve programs one to two years prior to the commencement of the tracer survey conducted from February 2019 un�l March 2020.
The data cleaning, analysis, genera�on of tables, figures, frequency counts, percentages, and other relevant sta�s�cs on the quan�ta�ve data were done using the R so�ware and Microso� Excel. Ra�ngs scales were also used to determine the current job sa�sfac�on and relevance of the scholars’ fields of study to their current jobs. The qualita�ve data were thema�cally analyzed to draw out pa�erns among the respondents’ responses.

4
The Tracer Study ReportDOST-SEI Undergraduate Scholar-Graduates Batch 2018 and 2019
It is important to men�on, that the tables and graphs contained in this report only reflect the responses of the DOST-SEI scholar-graduates Batch 2018 to 2019 who agreed to par�cipate in the Tracer Study. Moreover, the difficulty to locate and follow-up the scholar-respondents during the data collec�on, has caused a major constraints in a�aining a high response rate. A

42.9%
N = 1,098
2. RESULTS
This sec�on presents the socio-demographic characteris�cs of the respondents of this study in terms of sex, civil status, age, scholarship program, and the fields of study at the undergraduate level.
2.1 Socio-Demographic Characteristics of Scholar-Graduates
Sex, Civil Status, and Age Group
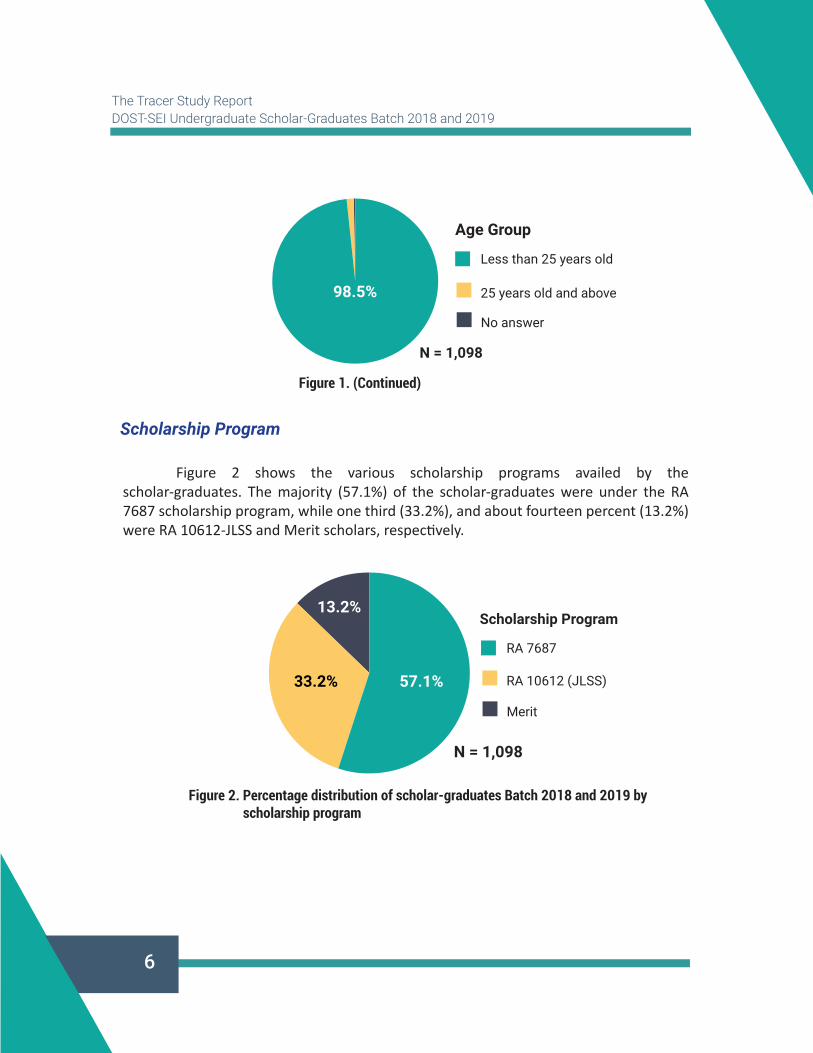
As shown in Figure 1, the majority (57.1%) of the respondents from the scholar-graduates of Batch 2018 and 2019 were female, while 42.9% were male respondents. Almost all of them were in their early twen�es (98.5%) and singles (99.6%) at the �me of survey.
Female
Male
SexSingle
Married
Marital Status
99.6%57.1%
Figure 1. Percentage distribution of scholar-graduates Batch 2018 and 2019 by sex, civil status, and age
42.9%
5
6
The Tracer Study ReportDOST-SEI Undergraduate Scholar-Graduates Batch 2018 and 2019
Less than 25 years old
25 years old and above
No answer
Age Group
N = 1,098
98.5%
Figure 1. (Continued)
Figure 2 shows the various scholarship programs availed by the scholar-graduates. The majority (57.1%) of the scholar-graduates were under the RA 7687 scholarship program, while one third (33.2%), and about fourteen percent (13.2%) were RA 10612-JLSS and Merit scholars, respec�vely.
Figure 2. Percentage distribution of scholar-graduates Batch 2018 and 2019 by scholarship program
Scholarship Program
57.1%33.2%
13.2%
N = 1,098
RA 7687
RA 10612 (JLSS)
Merit
Scholarship Program
N = 1,098
7
The Tracer Study ReportDOST-SEI Undergraduate Scholar-Graduates Batch 2018 and 2019
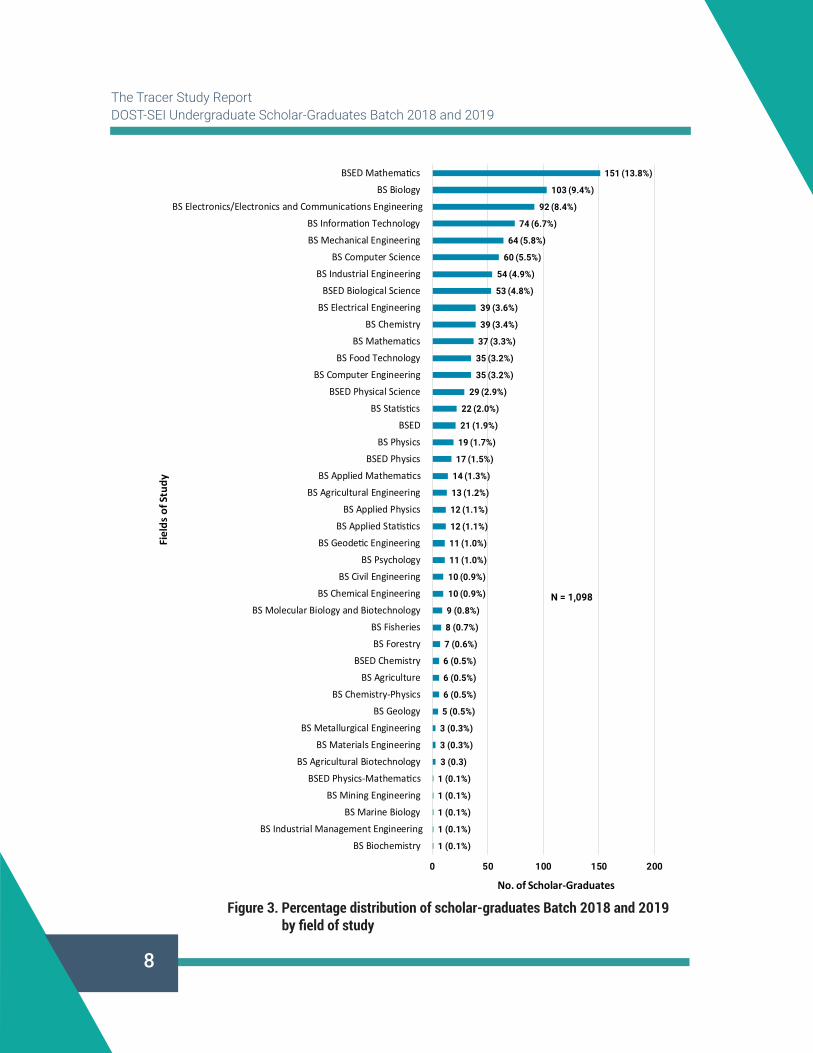
As shown in Figure 3, the top ten S&T fields of study completed by most of the scholar-graduates were BSED Mathema�cs (13.8%); BS Biology (9.4%); B.S. Electronics/Electronics and Communica�ons Engineering (8.4%); BS Informa�on Technology (6.7%); BS Mechanical Engineering (5.8%%); BS Computer Science (5.5%); BS Industrial Engineering (4.9%); BSED Biological Science (4.8%); and BS. Electrical Engineering (3.6%); and BS Chemistry (3.4%). Very few scholars (0.1%) were graduates in BSED Physics-Mathema�cs; BS Mining Engineering, BS Marine Biology; BS Industrial Management Engineering; and BS Biochemistry.
Field of Study
8
The Tracer Study ReportDOST-SEI Undergraduate Scholar-Graduates Batch 2018 and 2019
Figure 3. Percentage distribution of scholar-graduates Batch 2018 and 2019 by field of study
1 (0.1%)
1 (0.1%)
1 (0.1%)
1 (0.1%)
1 (0.1%)
3 (0.3)
3 (0.3%)
3 (0.3%)
5 (0.5%)
6 (0.5%)
6 (0.5%)
6 (0.5%)
7 (0.6%)
8 (0.7%)
9 (0.8%)
10 (0.9%)
10 (0.9%)
11 (1.0%)
11 (1.0%)
12 (1.1%)
12 (1.1%)
13 (1.2%)
14 (1.3%)
17 (1.5%)
19 (1.7%)
21 (1.9%)
22 (2.0%)
29 (2.9%)
35 (3.2%)
35 (3.2%)
37 (3.3%)
39 (3.4%)
39 (3.6%)
53 (4.8%)
54 (4.9%)
60 (5.5%)
64 (5.8%)
74 (6.7%)
92 (8.4%)
103 (9.4%)
151 (13.8%)
0 50 100 150 200
BS BiochemistryBS Industrial Management Engineering
BS Marine BiologyBS Mining Engineering
BSED Physics-Mathema�csBS Agricultural Biotechnology
BS Materials EngineeringBS Metallurgical Engineering
BS GeologyBS Chemistry-Physics
BS AgricultureBSED Chemistry
BS ForestryBS Fisheries
BS Molecular Biology and BiotechnologyBS Chemical Engineering
BS Civil EngineeringBS Psychology
BS Geode�c EngineeringBS Applied Sta�s�cs
BS Applied PhysicsBS Agricultural Engineering
BS Applied Mathema�csBSED Physics
BS PhysicsBSED
BS Sta�s�csBSED Physical Science
BS Computer EngineeringBS Food Technology
BS Mathema�csBS Chemistry
BS Electrical EngineeringBSED Biological Science
BS Industrial EngineeringBS Computer Science
BS Mechanical EngineeringBS Informa�on Technology
BS Electronics/Electronics and Communica�ons EngineeringBS Biology
BSED Mathema�cs
No. of Scholar-Graduates
Fiel
ds o
f Stu
dy
N = 1,098

9
The Tracer Study ReportDOST-SEI Undergraduate Scholar-Graduates Batch 2018 and 2019
2.2 Job Search and Transition to Work
This sec�on summarizes the responses of the scholar-graduates which describes the employment situa�on of scholar-graduates six months a�er gradua�on, and how they found their job/work. The term transi�on to work refers to the period of �me the scholar-graduates acquired their first job.
As shown in Figure 4, more than fi�y percent (55.1%) of the scholar-graduates, Batch 2018 and 2019 were already employed during their first six months a�er gradua�on, while one fourth (25.7%) were s�ll unemployed and searching for work. It is interes�ng to note, that 11.1% and 7.6% of the scholar-graduates pursued graduate studies and a�ended further trainings, respec�vely. About twenty percent (18.6%) a�ended review classes, and almost an equal propor�on (17.5%) were on vaca�on during their first six months a�er gradua�on. The other scholar-graduates had occasional jobs (11.9%); engaged in self-employment/freelance work (5.2%); put up family business/family work/ (4.2%); while 0.7% were already hired, but s�ll wai�ng for job deployment during this period.
Employment Situation (First Six Months after Graduation)
8 (0.7%)
46(4.2%)
57 (5.2%)
83 (7.6%)
122 (11.1%)
131 (11.9%)
192 (17.5%)
204 (18.6%)
282 (25.7%)
605 (55.1%)
0 100 200 300 400 500 600 700
Wai�ng for job deployment
Family work/Put-up family business
Self-employment/freelance work
Further training
Pursue graduates studies
Occassional job
Take a vaca�on
Review/take board examina�on
Searching job/Unemployed
Employed
No. of Scholar-Graduates
Empl
oym
ent S
itua�
on*
N = 1,098
*Multiple Responses
Figure 4. Percentage distribution of scholar-graduates Batch 2018 and 2019 by employment situation (first six months after graduation)

When the scholar-graduates with job/work (e.g., employed in companies/ ins�tu�ons, with occasional jobs, self-employed/freelance work, engaged in family business, and already hired but wai�ng for deployment) were disaggregated by sex, there were more females (57.8%) as compared to males (42.2%) with job/work within the period of six months a�er gradua�on.
Figure 6 shows the distribu�on of scholar-graduates by specific field of study with jobs within six months a�er gradua�on. Results show that 90-100% of the scholar-graduates with degree courses in BS Computer Engineering (91.4%); BS Computer Science (93.3%); BS Food Technology (94.3%); BS Applied Mathema�cs (100.0%); BS Psychology (90.9%) BSED Chemistry (100.0%); BS Mining Engineering (100.0%); BSEd Physics-Mathema�cs (100.0%); and BS Marine Biology (100.0%) were able to land their jobs within six months a�er they graduated.
On the other hand, the degree courses with low employment rate (less than 30%) within the first six months a�er gradua�on from college were observed in the following: BS Chemical Engineering (10.0%);BS Electronics/Electronics and Communica�ons Engineering (28.3%);and BS Geode�c Engineering (27.3%).
Figure 5. Percentage distribution of scholar-graduates Batch 2018 and 2019 with job/work within six months after graduation by sex
n = 733
57.8%42.2%
Female
Male
Sex
10
The Tracer Study ReportDOST-SEI Undergraduate Scholar-Graduates Batch 2018 and 2019

Figure 6. Percentage distribution of scholar-graduates Batch 2018 and 2019 by specific fields of study with jobs within the first six months after graduation
11
The Tracer Study ReportDOST-SEI Undergraduate Scholar-Graduates Batch 2018 and 2019
0
0
1 (10.%)
3 (27.3%)
26 (28.3%)
3 (30.0%)
1 (33.3%)
2 (33.3%)
3 (37.5%)
2 (40.0%)
18 (46.2%)
33 (51.6%)
22 (56.4%)
12 (57.1%)
91 (60.3%)
63 (61.2%)
11 (64.7%)
2 (66.7%)
2 (66.7%)
6 (66.7%)
12 (70.6%)
21 (72.4%)
14 (73.7%)
10 (76.9%)
41 (77.4%)
18 (81.8%)
5 (83.3%)
6 (85.7%)
6 (85.7%)
32 (86.5%)
65 (87.8%)
48 (88.9%)
10 (90.9%)
32 (91.4%)
56 (93.3%)
33 (94.3%)
1 (100.0%)
1 (100.0%)
1 (100.0%)
6 (100.0%)
14 (100.0%)
0% 10% 20% 30% 40% 50% 60% 70% 80% 90% 100%
BS Biochemistry
BS Industrial Management Engineering
BS Chemical Engineering
BS Geodetic Engineering
BS Electronics/Electronics and Communications Engineering
BS Civil Engineering
BS Metallurgical Engineering
BS Agriculture
BS Fisheries
BS Geology
BS Electrical Engineering
BS Mechanical Engineering
BS Chemistry
BSED
BSED Mathematics
BS Biology
BS Applied Physics
BS Agricultural Biotechnology
BS Materials Engineering
BS Molecular Biology and Biotechnology
BSED Physics
BSED Physical Science
BS Physics
BS Agricultural Engineering
BSED Biological Science
BS Statistics
BS Chemistry-Physics
Bachelor in Applied Statistics
BS Forestry
BS Mathematics
BS Information Technology
BS Industrial Engineering
BS Psychology
BS Computer Engineering
BS Computer Science
BS Food Technology
BS Marine Biology
BSEd Physics-Mathematics
BS Mining Engineering
BSED Chemistry
BS Applied Mathematics
% of Scholar-Graduates
Fiel
ds o
f Stu
dy
Employed Unemployed
35
54
11
35
60
9
29
1913
53
22
6
77
17
3774
3921
151
103
173
3
5
39
64
10
3
6
8
101192
1
1

The means of acquiring first job among the scholar-graduates is shown in Figure 7. As indicated in the results, half (50.8%) of the scholar-graduates were able to acquire their jobs through job adver�sements or announcements in the newspapers and websites; and one third (33.0%) through the help of their family contacts or friends. Moreover, one in every ten of the scholar-graduates obtained their jobs either through job fairs (16.1%); job placement program of the Department of Educa�on (DepEd) for scholars under the RA 10612 Scholarship Program of DOST-SEI (17.1%); and through their universi�es/colleges (15.4%). About two percent (1.9%) stated that they sent their resume to various ins�tu�ons/companies and as walk-in applicants, while the same number (1.9%) were absorbed by the companies/agencies a�er they completed their on-the-job trainings. A very few were recommended by their professors (0.9%) and through job offers (0.5%).
Means of Acquiring First Jobs
12
The Tracer Study ReportDOST-SEI Undergraduate Scholar-Graduates Batch 2018 and 2019

13
The Tracer Study ReportDOST-SEI Undergraduate Scholar-Graduates Batch 2018 and 2019
Figure 7. Percentage distribution of scholar-graduates Batch 2018 and 2019 by means of acquiring first job/work after graduation
1 (0.1%)
1 (0.1%)
1 (0.1%)
3 (0.3%)
5 (0.5%)
8 (0.9%)
17 (1.9%)
17 (1.9%)
141 (15.4%)
148 (16.1%)
157 (17.1%)
303 (33.0%)
466 (50.8%)
0 100 200 300 400 500
SK Election
2017 Summer Practical Training Program (SPTP)
Worked as part-time tutor
Others
Job offer (e.g. topnotcher's privilege in teaching review center)
Through proffesor's recommenda�on
Absorbed by agencies
Sent resume to various ins�tu�ons/Walk-in applicants
Through the university/college
Job fair
Through DepEd placement program (for RA 10612 program)
With the help of family contacts/friends
Replied to job ads/announcements (e.g. newspaper, website, internet)
No. of Scholar-Graduates
Mea
ns o
f Acq
uirin
g Jo
b/W
ork*
Professor's Recommendation
With the help of family contacts/friends
Job fair
Through the University/College
Through DepEd placement program (for RA 10612 program)
Replied to job ads/announcements (e.g. newspaper,website,internet)
n =918
Sent resume to various institution/Walk-in applicants
Absorbed by agencies
Job Offer
Others
*Multiple Responses

The informa�on on the period of �me, the scholar-graduates had acquired their first job/work were also asked. As revealed in Figure 8, majority (404 or 57.8%) were able to acquire their first job in one to six months a�er gradua�on. Disaggrega�ng the scholar-graduates by year of gradua�on, majority (55.9%) of Batch 2018 as compared to Batch 2019 (44.1%) were able to acquire their first jobs before gradua�on. However, greater propor�on among Batch 2019 (62.5%), as compared to Batch 2018 (37.5%) had acquired their jobs during gradua�on. The greater majority among Batch 2018 were able to acquire their first job/work from 7-12 months a�er gradua�on (91.0%) and more than one year (95.8%) a�er gradua�on, as compared to Batch 2019.
Figure 8. Percentage distribution of scholar-graduates Batch 2018 and 2019 by period of time in acquiring first job/work
Period of Time in Acquiring First Job
1 (4.2%)
20 (9.0%)
201 (49.8%)
10 (62.5%)
15 (44.1%)
23 (95.8%)
202 (91.0%)
203 (50.2%)
6 (37.5%)
19 (55.9%)
0% 10% 20% 30% 40% 50% 60% 70% 80% 90% 100%
> 1 year a�er gradua�on
7 - 12 months a�er gradua�on
1 - 6 months a�er gradua�on
During gradua�on
Before gradua�on
% of Scholar-Graduates
Perio
d of
Tim
e Ac
quiri
ng F
irst J
ob/W
ork
C.Y. 2019 C.Y. 2018
24
222
404
16
34
14
The Tracer Study ReportDOST-SEI Undergraduate Scholar-Graduates Batch 2018 and 2019

2.3 Current Employment and Work Characteristics
Current Employment Status
This sec�on primarily describes the current employment status (e.g., employed and unemployed) and employment sectors (e.g., government, private [local/abroad/mul�na�onal companies] sectors, and academe) of scholar-graduates at the �me of survey. The length of �me they have been working in their current jobs, the appropriateness of their fields of study to their current jobs (e.g., job mismatch/over qualifica�on), reasons for taking current jobs, as well as the perceived link of being a DOST-SEI scholar-graduate to job search as a good creden�al for employment opportuni�es are likewise presented in this sec�on.H
Figure 9 shows that the great majority (83.6%) of the scholar-graduates were already employed at the �me of the survey, less than twenty percent (16.4%) were s�ll unemployed. Among the employed, majority were female (57.1%), and only 42.9% were male. Most of the unemployed on the other hand, were also females (57.2%).
Figure 9. Percentage distribution of scholar-graduates Batch 2018 and 2019 with current employment by sex
Female524
(57.1%)
394(42.9%)
Male
Female103 (57.2%)
Male77 (42.8%)
Employed918 (83.6%)
Unemployed180 (16.4%)
N = 1,098
15
The Tracer Study ReportDOST-SEI Undergraduate Scholar-Graduates Batch 2018 and 2019

When we look at the current employment of scholar-graduates by Batch, Figure 10 shows that 90.4% of Batch 2018 and 73.3% among Batch 2019 were already employed at the �me of survey. The majority of the scholar-graduates (76.0%) men�oned that it is their first job a�er gradua�on (See Figure 11).
Figure 10. Percentage distribution of scholar-graduates Batch 2018 and 2019 who are currently employed
Figure 11. Percentage distribution of scholar-graduates Batch 2018 and 2019 with “first job/work after graduation”
90.4%Batch 2018
n = 659
73.3%Batch 2019
n = 439
76.0%“First Job”
N = 1,098
16
The Tracer Study ReportDOST-SEI Undergraduate Scholar-Graduates Batch 2018 and 2019

Employment Classification
Figure 12 shows the employment classifica�on of scholar-graduates. There were more scholar-graduates who were s�ll on Proba�onary (41.2%) period as compared to those with Permanent/Regular posi�ons. (36.7%). One fourth (19.5%), and less than five percent (2.5%) were Contractual/Job Order/Casual and with freelance jobs, respec�vely.
Figure 12. Percentage distribution of scholar-graduates Batch 2018 and 2019 by employment classification
Employment Sector
When we look at the employment sector of the scholar-graduates, 47.8% were employed in the private sector, while only 22.3% and 11.8% were engaged in the government sector and academe, respec�vely (See Figure 13.a). Meanwhile, less than half of the scholar-graduates both in the government (42.9%) and private (40.0%) sectors were occupying permanent/ regular posi�ons, while only 13.8% are from the academe as shown in Figure 13.b.
23 (2.5%)
178 (19.5%)
335 (36.7%)
376 (41.2%)
0 50 100 150 200 250 300 350 400
Freelancer
Contractual/Job Order/Casual
Regular/Permanent
Proba�onary
No. of Scholar-Graduates
Empl
oym
nent
Cla
ssifi
ca�o
n
n= 912(No Response = 6)
17
The Tracer Study ReportDOST-SEI Undergraduate Scholar-Graduates Batch 2018 and 2019

Figure 13.b Percentage distribution of scholar-graduates Batch 2018 and 2019 by employment sector and employment classification
180 (16.4%)
18 (1.6%)
130 (11.8%)
245 (22.3%)
525 (47.8%)
0 100 200 300 400 500 600
Not Applicable
No response
Academe
Government
Private
No. of Scholar-Graduates
Empl
oym
ent S
ecto
r
N = 1,098
1 (5.6%)
2 (1.5%)
3 (1.2%)
15 (83.3%)
110 (84.6%)
137 (55.9%)
315 (60.0%)
2 (11.1%)
18 (13.8%)
105 (42.9%)
210 (40.0%)
0% 10% 20% 30% 40% 50% 60% 70% 80% 90% 100%
No Response
Academe
Government
Private
% of Scholar-Graduates
Empl
oym
ent S
ecto
r
No Response Not Regular/Permanent Regular/Permanent
525
245
130
18
Figure 13.a Percentage distribution of scholar-graduates Batch 2018 and 2019 by employment sector
18
The Tracer Study ReportDOST-SEI Undergraduate Scholar-Graduates Batch 2018 and 2019

Correspondingly, the specific employment loca�on by sector was also determined. Among those employed in the private sector, majority (69.5%) were connected in local companies/industries, while 20.6% and 9.9% in the mul�na�onal companies and BPOs, respec�vely (See Figure 14.a.). For those in the government sector, majority were employed at the Department of Educa�on (79.2%), while small propor�ons in the Department of Science and Technology (5.7%), Department of Natural Resources (5.3%) LGUs (2.9%); Department of Agriculture (2.0%); and in other government agencies (See Figure 14.b). For those working in the academe, the great majority were in the private schools (71.5%), and 28.5% in the state colleges and universi�es as shown in Figure 14.c.
Figure 14.a. Percentage distribution of scholar-graduates Batch 2018 and 2019 employed in the private sector
n = 525
69.5%
20.6%
9.9%
Local Companies
International/MultinationalCompanies
BPOs
Private Sector
19
The Tracer Study ReportDOST-SEI Undergraduate Scholar-Graduates Batch 2018 and 2019

Figure 14.b. Percentage distribution of scholar-graduates Batch 2018 and 2019 employed in the government sector
Figure 14.c. Percentage distribution of scholar-graduates Batch 2018 and 2019 employed in the academe
71.5%
28.5%Academe/HUCs (Private)
HUCs (Government)
Academe Sector
n = 130
1 (0.04%)
1 (0.04%)
1 (0.04%)
1 (0.04%)
1 (0.04%)
1 (0.04%)
2 (0.08%)
2 (0.08%)
2 (0.08%)
5 (2.0%)
7 (2.9%)
13 (5.3%)
14 (5.7%)
194 (79.2%)
0 50 100 150 200 250
Procurement Policy Board
BFAR-NFRDI
Bureau of the Treasury of the Philippines
DOH
NIA
PSA
PSHS
DPWH
DSWD
Dept. Agri.
LGU
DENR
DOST
DepEd
No. of Scholar-Graduates
Gov
ernm
ent
Agen
cies
n = 245
Government Sector
20
The Tracer Study ReportDOST-SEI Undergraduate Scholar-Graduates Batch 2018 and 2019

Figure 15 shows the employment dura�on of scholar-graduates in their current job/work. It can be observed that most of the scholar-graduates have been in their respec�ve employments for one to three months (32.0%) and six to nine months (28.6%). Less than twenty percent were ten to 12 months (10.3%); more than one year (12.7%); and less than one-month dura�on (15.1%) in their current job/work.
Figure 15. Percentage distribution of scholar-graduates Batch 2018 and 2019 by employment duration of current work/job
Employment Duration
As to the appropriateness of field of study to current job of scholar-graduates, 61.8% of the scholar-graduates men�oned that their current job is related to their field of study, and a quarter (25.2%) revealed that their job were exclusively their own field. Less than ten percent (7.7%) men�oned a completely different field, while about three percent (2.7%) stated that their job required no par�cular field (Figure 16).
Appropriateness of Field Study to Current Job/Work
10 (1.1%)
117 (12.7%)
95 (10.3%)
263 (28.6%)
294 (32.0%)
139 (15.1%)
0 50 100 150 200 250 300 350
Not indicated
More than 1 year
10 - 12 months
6 - 9 months
1 - 3 months
Less than 1 month
No. of Scholar-Graduates
Empl
oym
ent D
ura�
on
n= 918
21
The Tracer Study ReportDOST-SEI Undergraduate Scholar-Graduates Batch 2018 and 2019
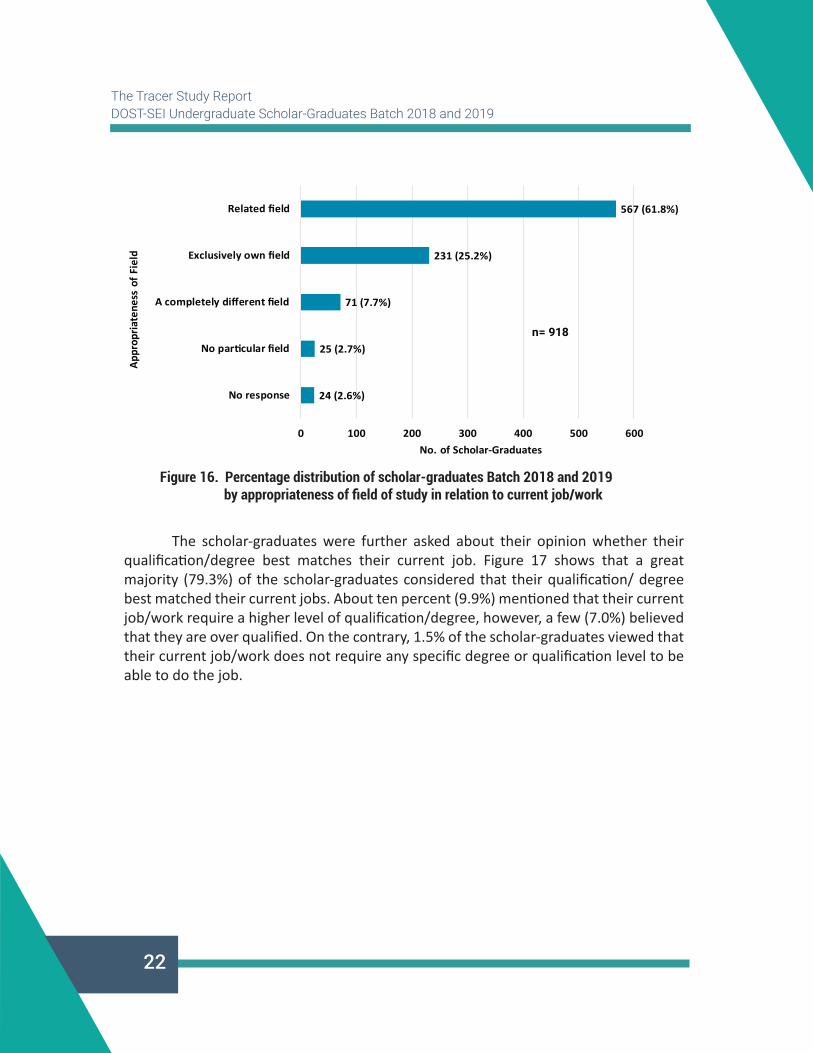
Figure 16. Percentage distribution of scholar-graduates Batch 2018 and 2019 by appropriateness of field of study in relation to current job/work
The scholar-graduates were further asked about their opinion whether their qualifica�on/degree best matches their current job. Figure 17 shows that a great majority (79.3%) of the scholar-graduates considered that their qualifica�on/ degree best matched their current jobs. About ten percent (9.9%) men�oned that their current job/work require a higher level of qualifica�on/degree, however, a few (7.0%) believed that they are over qualified. On the contrary, 1.5% of the scholar-graduates viewed that their current job/work does not require any specific degree or qualifica�on level to be able to do the job.
24 (2.6%)
25 (2.7%)
71 (7.7%)
231 (25.2%)
567 (61.8%)
0 100 200 300 400 500 600
No response
No par�cular field
A completely different field
Exclusively own field
Related field
No. of Scholar-Graduates
Appr
opria
tene
ss o
f Fie
ld
n= 918
22
The Tracer Study ReportDOST-SEI Undergraduate Scholar-Graduates Batch 2018 and 2019

Figure 17. Percentage distribution of scholar-graduates Batch 2018 and 2019 by qualification/degree versus current job/work
21 (2.3%)
14 (1.5%)
64 (7.0%)
91 (9.9%)
728 (79.3%)
0 200 400 600 800
Not indicated
No specific degree/qualifica�on
A lower degree/qualifica�on
A higher degree/qualifica�on
My degree/qualifica�on
No.of Scholar-Graduates
Qua
lifica
�on/
Deg
ree
n = 918
Professional posi�on refers to a posi�on for which an employee is required to have a high degree of knowledge and skills acquired through baccalaureate degree. When the scholar-graduates were asked on the extent of appropriateness of their professional posi�on to their current job, Figure 18 shows that more than twenty percent of the scholars stated that their professional posi�ons were appropriate to a great extent (36.6%); to a moderate extent (26.0%); and to a very great extent (24.1%) in terms of their college degrees. Less than ten percent (8.7%) and less than five percent (2.3%) men�oned to some extent and not at all, respec�vely.
Appropriateness of Professional Position
23
The Tracer Study ReportDOST-SEI Undergraduate Scholar-Graduates Batch 2018 and 2019

Figure 18. Percentage distribution of scholar-graduates Batch 2018 and 2019 by appropriateness of professional position to current job/work
Reasons for Taking Current Job/Work
Figure 19 shows the reasons cited by some scholar-graduates for taking current job/work not closely related to their field of study. The top most reason cited by the scholars was “my current job is only temporary and I am s�ll searching for a more related job” (18.4%). Almost ten percent men�oned that “my current jobs allows me to work in a favored geographical area” (9.5%); and “offers me more security” (8.8%). Some cited that “my work allows me to have a flexible �me schedule” (6.2%) and “my job is related to my course of study” (2.1%). It is important to note that less than five percent said that “my interest have changed” (3.4%) and “for return of service obliga�on only” (2.6%).
21 (2.3%)
21 (2.3%)
80 (8.7%)
221 (24.1%)
239 (26.0%)
336 (36.6%)
0 100 200 300 400
Not indicated
Not at all
To some extent
To a very great extent
To a moderate extent
To a great extent
No. of Scholar-Graduates
Appr
opria
tene
ss o
f Pro
fess
iona
l Pos
i�on
n = 918
24
The Tracer Study ReportDOST-SEI Undergraduate Scholar-Graduates Batch 2018 and 2019

Figure 19. Percentage distribution of scholar-graduates Batch 2018 and 2019 by reasons for taking current job/work
Figure 20 shows the degree of sa�sfac�on of scholar-graduates with their current job/work situa�on. It can be observed that many of the scholar-graduates were Very Satisfied (34.5%) to Extremely Satisfied (9.9%) with their current job situa�on. Almost the same propor�ons also men�oned that they were Moderately Satisfied (39.5%), to Slightly Satisfied (10.9%) with their present job/work, however, 3.2% were Not at all Satisfied with their current job/work situa�on (See Figure 20).
Degree of Satisfaction with Current Job/Work Situation
19 (2.1%)
24 (2.6%)
31 (3.4%)
56 (6.2%)
81 (8.8%)
88 (9.5%)
169 (18.4%)
0 50 100 150 200
My job is related to my course study
Return service only
My interests have changed
My current job allows a flexible �me schedule
My current job offers more security
My current job allows me to work in a favoredgeographical place
My current job is only temporary, s�ll searching for amore related job
No. of Scholar-Graduates-
Reas
ons f
or Ta
king
Cur
rent
Jo/W
ork*
n= 918
*Multiple Responses
25
The Tracer Study ReportDOST-SEI Undergraduate Scholar-Graduates Batch 2018 and 2019

Figure 20. Percentage distribution of scholar-graduates Batch 2018 and 2019 by satisfaction level with current job/work situation
When we examined the occupa�onal classifica�on of 918 scholar-graduates, using the Interna�onal Standard Classifica�on of Occupa�ons e.g., Major, Sub-Major, Minor and Unit Groups. Half of the occupa�ons of scholar-graduates were classified under the Professional Group (50.4%), followed by the Technicians and Associate Professionals (28.3%), Clerical Support Workers (20.2%), and a very few in the Services and Sales Workers (0.8%) (Table 1).
Among the Professional Group, majority of the scholar-graduates were in the Teaching Professions (71.5%), mostly Secondary Educa�on Teachers (83.1%). This is followed by the Informa�on and So�ware and Applica�ons Developers and Analysts. Moreover, about five percent were classified under the Science and Engineering Professionals (5.0%), while 0.9% in the Business Administra�on. jkash
Occupational Classification
18 (2.0%)
29 (3.2%)
91 (9.9%)
100 (10.9%)
317 (34.5%)
363 (39.5%)
0 50 100 150 200 250 300 350 400
Not indicated
Not at all sa�sfied
Extremely sa�sfied
Slightly sa�sfied
Very sa�sfied
Moderately sa�sfied
No. of Scholar-Graduates
Deg
ree
of S
a�sf
ac�o
n
n = 918
26
The Tracer Study ReportDOST-SEI Undergraduate Scholar-Graduates Batch 2018 and 2019

For those classified under the Technicians and Associate Professionals, a great majority were Science and Engineering Associate Professionals (75.0%), mostly Physical and Engineering Science Technicians (86.7%). Those who were classified under the Business and Administra�on Associate Professionals and Informa�on and Communica�ons Technicians were 13.9% and 11.2%, respec�vely.
The scholar-graduates whose occupa�onal classifica�on falls under the Clerical Support Workers were mostly Numerical and Material Recording Clerks (38.9%) and General and Keyboard Clerks (34.6%). About one fourth were Client Informa�on Workers (22.7%), and Other Clerical Support Workers (2.7%), and a very few as Customer Services Clerks (1.1%).
The occupa�onal classifica�ons of the remaining scholar-graduates were classified under the Services and Sales Workers, of which majority were Sales Workers (71.4%). About thirty percent (28.6%) were Personal/Health Care Assistants.
Table 1. Occupational Classification of Scholar-Graduates Batch 2018-2019, Undergraduate Level (using International Standard Classification of Occupations e.g. Major, Sub-major, Minor and Unit Groups)
Managers 3 0.3% Chief Executives, Senior Officials and Legislators 1 0.1%
• Legislators and Senior Officials Legislators 1 100,0% Administrative and Commercial Managers 2 0.2%
• Business Services and Administration Managers - Business Services and Administration Managers Not Elsewhere
Classified (1) • Sales, Marketing and Development Managers
- Research and Development Managers (1)
1
1
50.0%
50.0%
Professionals 463 50.4% Teaching Professionals 331 71.3%
• Secondary Education Teachers • University and Higher Education Teachers • Teaching Professional NEC • Other Language Teachers • Information Technology Trainers
275 27 18 10 1
83.1% 8.2% 5.4% 3.0% 0.3%
27
The Tracer Study ReportDOST-SEI Undergraduate Scholar-Graduates Batch 2018 and 2019

28
The Tracer Study ReportDOST-SEI Undergraduate Scholar-Graduates Batch 2018 and 2019
(Table 1. Continued)Information and Communications Technology Professionals 105 22.7%
• Software and Applications Developers and Analysts - Applications Programmers (53) - Software Developers (25) - Web and Multimedia Developers (18)
• Database and Network Professionals - Systems Administrators (9)
96 9
91.4%
8.6%
Science and Engineering Professionals 23 5.0% • Engineering Professionals
- Industrial and Productions Engineers (12) - Mechanical Engineers (2)
• Mathematicians, Actuaries and Statisticians • Life Science Professionals
- Farming, Forestry and Fisheries Advisers (2) - Biologists, Botanists, Zoologists and Related Prof. (2)
• Physical and Earth Sciences Professionals
14 4 4 1
60.8%
17.4% 17.4%
0.4% Business Administration Professionals
4 0.9%
Technicians and Associate Professionals 260 28.3% Science and Engineering Associate Professionals 195 75.0%
• Physical and Engineering Science Technicians - Mechanical Engineering Technicians (48) - Electronics Engineering Technicians (44) - Chemical and Physical Science Technicians (29) - Electrical Engineering Technicians (26) - Civil Engineering Technicians (13) - Physical and Engineering Technicians NEC (5) - Mining and Metallurgical Technicians (2) - Chemical Engineering Technicians (1) - Draftpersons (1)
• Life Science Technicians and Related Associate Professionals - Life Science Technicians (25) - Agricultural Technicians (1)
169
26
86.7%
13.3%
Business and Administration Associate Professionals 36 13.9% • Financial and Mathematical Associate Professionals
- Statistical, Mathematical and Related Associated Prof. (27) - Securities and Financial Dealers and Brokers (1)
• Sales and Purchasing Agents and Brokers - Commercial Sales Representatives (1)
• Government Regulatory Associate Professionals - Government Regulatory Associate Professionals (5)
• Administrative and Specialized Secretaries - Administrative and Executive Secretaries (2)
28 1 5 2
77.8%
2.7%
13.9%
5.6%

(Table 1. Continued)
29
The Tracer Study ReportDOST-SEI Undergraduate Scholar-Graduates Batch 2018 and 2019
Information and Communications Technicians 29 11.2% • ICT Operations and User Support Technicians
- ICT Operations Technicians (15) - ICT User Support Technicians (11)
• Telecommunications and Broadcasting Technicians - Broadcasting and Audiovisual Technicians (3)
26 3
89.7%
10.3%
Clerical Support Workers 185 20.2% Numerical and Material Recording Clerks 72 38.9%
• Material Recording and Transport Clerks - Production Clerks (33) - Stocks Clerks (5)
• Numerical Clerks - Statistical, Finance and Insurance Clerks (19) - Accounting and Bookkeeping Clerks (10) - Payroll Clerks (5)
38
34
52.8%
47.2%
General and Keyboard Clerks 64 34.6% • General Office Clerks • Keyboard Operators
- Data Entry Clerks (20) - Typists and Word Processing Operators (4)
40 24
62.5% 37.5%
Client Information Workers 42 22.7% • Contact Centre Information Clerks • Inquiry Clerks • Receptionists
22 15 5
52.4% 35.7% 11.9%
Other Clerical Support Workers 5 2.7% • Personnel Clerks 5 100.0%
Customer Services Clerks 2 1.1% • Debt Collectors and Related Works • Tellers, Money Collectors and Related Works
1 1
50.0% 50.0%
Services and Sales Workers 7 0.8% Sales Workers 5 71.4%
• Cashiers and Ticket Clerks • Shopkeepers
3 2
60.0% 40.0%
Personal Care Workers 2 28.6% • Health Care Assistants 2 100.0%
TOTAL EMPLOYED 918 100.0%

30
The Tracer Study ReportDOST-SEI Undergraduate Scholar-Graduates Batch 2018 and 2019
As shown in Figure 21, almost all major occupa�onal classifica�ons were dominated by females. The highest observa�ons were noted among those in the Services and Sales Workers (85.7%) and Clerical Support Workers (67.0%), followed by the Professionals (55.5%); and Technicians and Associate Professionals (52.3%). The Managers group (66.7%) were male dominated.
2 (66.7%)
1 (14.3%)
61 (33.0%)
124 (47.7%)
206 (44.5%)
1 (33.3%)
6 (85.7%)
124 (67.0%)
136 (52.3%)
257 (55.5%)
0% 20% 40% 60% 80% 100%
Managers
Services and Sales Workers
Clerical Support Workers
Technicians and Associate Professionals
Professionals
% of Scholar-Graduates-
Maj
or O
ccup
a�on
al C
lass
ifica
�on
Male Female
463
7
185
260
3
Figure 21. Percentage distribution of scholar-graduates Batch 2018 and 2019 by occupational classification by sex
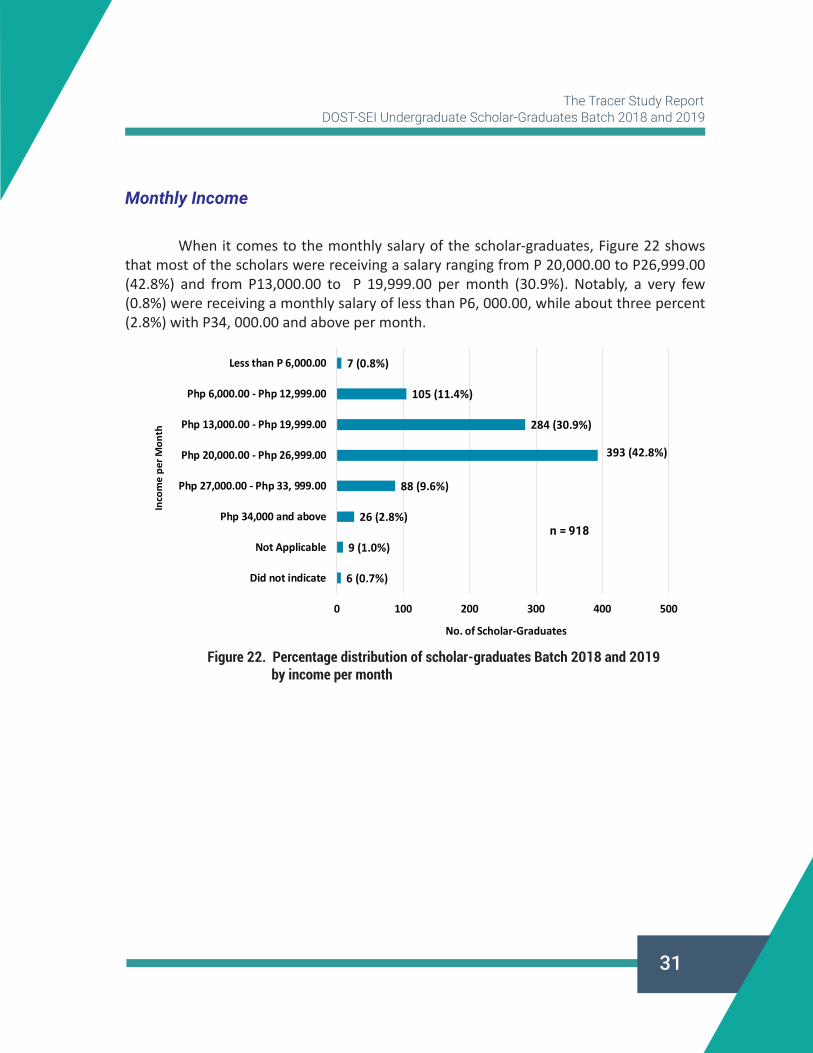
When it comes to the monthly salary of the scholar-graduates, Figure 22 shows that most of the scholars were receiving a salary ranging from P 20,000.00 to P26,999.00 (42.8%) and from P13,000.00 to P 19,999.00 per month (30.9%). Notably, a very few (0.8%) were receiving a monthly salary of less than P6, 000.00, while about three percent (2.8%) with P34, 000.00 and above per month.
Monthly Income
31
The Tracer Study ReportDOST-SEI Undergraduate Scholar-Graduates Batch 2018 and 2019
Figure 22. Percentage distribution of scholar-graduates Batch 2018 and 2019 by income per month
6 (0.7%)
9 (1.0%)
26 (2.8%)
88 (9.6%)
393 (42.8%)
284 (30.9%)
105 (11.4%)
7 (0.8%)
0 100 200 300 400 500
Did not indicate
Not Applicable
Php 34,000 and above
Php 27,000.00 - Php 33, 999.00
Php 20,000.00 - Php 26,999.00
Php 13,000.00 - Php 19,999.00
Php 6,000.00 - Php 12,999.00
Less than P 6,000.00
No. of Scholar-Graduates
Inco
me
per M
onth
n = 918

2.4 Feedback of Scholars
This sec�on describes the feedback of scholar-graduates, par�cularly on the advantages and disadvantages of being a scholar-graduate in job search; on the conduct of Tracer Study; on training needs; and on some issues and concerns as DOST- SEI scholar-graduates. Their responses were summarized and grouped according to pa�erns for analysis.
On Job Search
Figure 23 shows that majority (79.1%) of the scholar-graduates said that “being a DOST Scholar graduate is an advantage in job search”.
32
The Tracer Study ReportDOST-SEI Undergraduate Scholar-Graduates Batch 2018 and 2019
Figure 23. Percentage distribution of scholar-graduates Batch 2018 and 2019 who said “being a DOST-SEI scholar is an advantage in job search”
79.1%“Advantageous”
N = 1,098
The reasons given by the scholar-graduates why being a DOST-SEI scholar is an advantage in job search were analyzed, and revealed the following pa�erns: 1) It serves as good character reference; 2) It boosts credibility/creden�als; 3) It creates a good impression/edge over other applicants; 4) It increases the scholars’ morale/ confidence as an applicant 5) It gives assurance for immediate employment a�er gradua�on (e.g., JLSS Scholars); and 6) It helps build connec�ons/linkages.
On the contrary, some scholars also men�oned some disadvantages of being a DOST-SEI scholar graduate in job search. Their answers were grouped according to the

following pa�erns: 1) It gives pressure due to high employers’ expecta�ons; 2) It limits the opportuni�es for other job offers (e.g., JLSS Scholars); and 4) It gives a wrong belief for some companies that scholars will not stay long in their companies because of government service obliga�on. Some scholars men�oned that experience/skills, work a�tude, character and self-confidence are being considered in hiring rather than being a scholar-graduate.
On Tracer Study
The Tracer Study has gained some posi�ve feedback from the scholar-graduates. These include the following: 1) It is a good strategy/approach to monitor/track and keep the scholars connected a�er gradua�on; 2) It is a demonstra�on of DOST-SEI’s concern among its scholar-graduates even a�er gradua�on; 3) It is expected that this survey will provide posi�ve outcome, par�cularly in helping the scholar-graduates find be�er job opportuni�es; and 4) It is a useful/convenient approach of upda�ng and tracking the professional growth of scholars.
33
The Tracer Study ReportDOST-SEI Undergraduate Scholar-Graduates Batch 2018 and 2019
On Training Needs
If given the opportunity, the scholar-graduates were interested to avail of the following trainings to enhance their professional skills and foster their personal development.
Data Science/Data Analy�cs/Programming/Advanced IT Trainings
• Machine Learning/ Big Data Analysis/Data Science • Python/SQL/Anaconda and Computer Programming • 3D prin�ng, 3D modelling • Computer Networking • Remote Sensing (GIS) • Web development • Microelectronics • CISCO, CCNA

Engineering/Space Science
• Robo�cs • Planning, Construc�on, Power Plant • Trainings related to HVAC, Pumps and generator sets • Audio Engineering • Astrophysics
Research and Development
• Research Techniques and Use of Equipment • Algae Culture • Food Produc�on and Development/Innova�on • Food Safety, GMP and HACCP cer�fica�ons • Biotechnology
34
The Tracer Study ReportDOST-SEI Undergraduate Scholar-Graduates Batch 2018 and 2019
Technical Skills Development
• Technical-voca�onal training • TESDA Trainings • Communica�on and oral wri�en trainings
Teaching/Educa�onal Strategies
• Classroom-based trainings • In-service teacher’s trainings • Natural Language Processing, Classroom Management, Design Thinking • Technology Integra�on in Classroom or mul�disciplinary problem-based learning • Laboratory Experiments and Pedagogical
Management/Business
• Effec�ve organiza�on and �me management • Business science trainings
Other free seminars/conferences/forums/mee�ngs/counseling/annual gathering

• Provide immediate job deployment/endorsement of JLSS scholars to DepEd, and available slots every school year to fulfill the service obliga�on on �me.
• Provide six months to one-year teaching prepara�on (e.g., training/CPE) before actual teaching, especially among those who are not educa�on majors. dkashdjkash
• Consider degree courses with teaching units in the course program for applicants of the R.A. 10612 Scholarship Program to avoid discrimina�on in the workplace and difficulty in teaching (e.g., no prior knowledge in teaching methods).
• Provide orienta�on on the Qualifica�on Standards and course of promo�on of Special Science Teacher.
On Job Placement
JLSS Scholars
• Some private companies/ industries are hesitant to hire the scholar graduates because they have the impression that DOST scholar graduates will not stay long because they have to serve in the government. hjsadh
• Provide job placement to other S&T scholar-graduates, similar to RA 10612 graduates. sajdhakjdhsahdASHDASJDKHAJSHDASHDAJKS
• Hire scholar-graduates in the government, par�cularly in the research ins�tu�ons of DOST.
• Conduct job fairs and send emails to scholars on job opportuni�es in the government to get them employed in their respec�ve fields/ specializa�ons. KJS
dkashdjkash
Non-JLSS Scholars
35
The Tracer Study ReportDOST-SEI Undergraduate Scholar-Graduates Batch 2018 and 2019
Other Issues and Concerns
• Address the delay in the release of s�pend and book allowance. sdhajkashd
On Release of Stipend
• Intensify informa�on dissemina�on of Graduate Scholarship Program.• Reach out remote areas for various science exhibits to benefit students
in far flung areas.
On Information Dissemination
Means of Contact Preferred by Scholar-Graduates
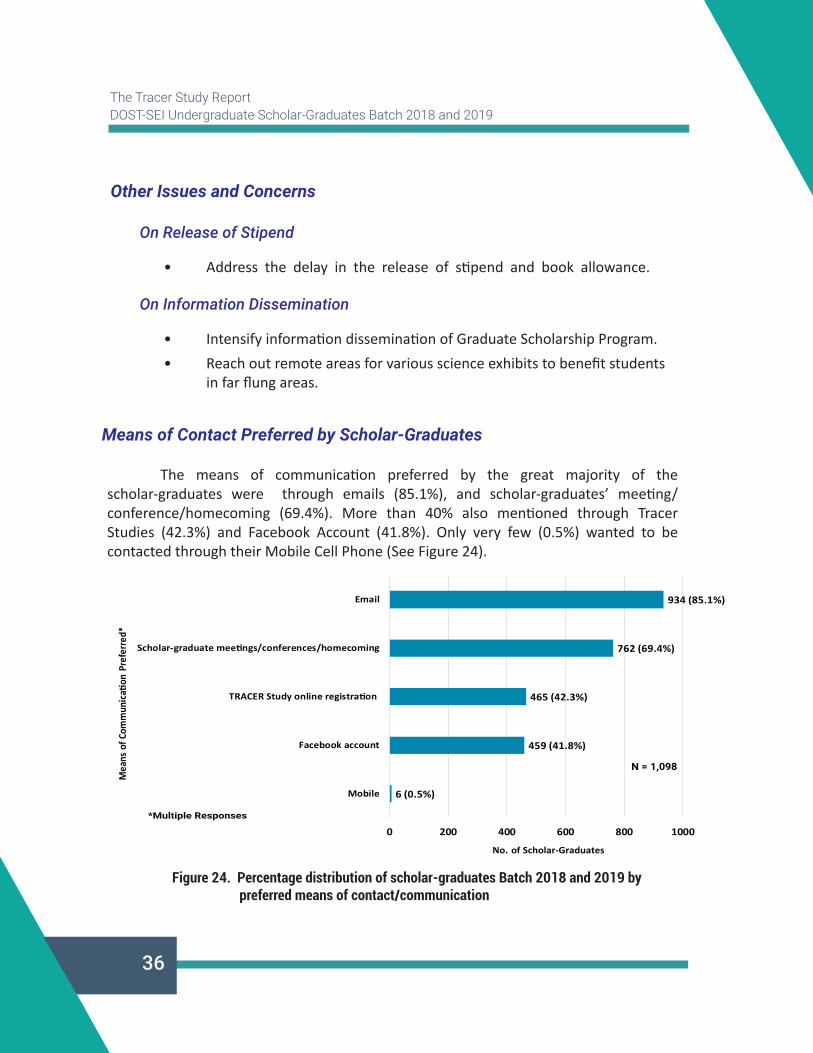
The means of communica�on preferred by the great majority of the scholar-graduates were through emails (85.1%), and scholar-graduates’ mee�ng/ conference/homecoming (69.4%). More than 40% also men�oned through Tracer Studies (42.3%) and Facebook Account (41.8%). Only very few (0.5%) wanted to be contacted through their Mobile Cell Phone (See Figure 24).
36
The Tracer Study ReportDOST-SEI Undergraduate Scholar-Graduates Batch 2018 and 2019
Figure 24. Percentage distribution of scholar-graduates Batch 2018 and 2019 by preferred means of contact/communication
6 (0.5%)
459 (41.8%)
465 (42.3%)
762 (69.4%)
934 (85.1%)
0 200 400 600 800 1000
Mobile
Facebook account
TRACER Study online registra�on
Scholar-graduate mee�ngs/conferences/homecoming
No. of Scholar-Graduates
Mea
ns o
f Com
mun
ica�
on P
refe
rred
*
N = 1,098
*Multiple Responses

37
3. SUMMARY AND CONCLUSION
The conduct of Tracer Studies among DOST-SEI scholar-graduates is an important means of gathering relevant informa�on about the whereabouts of scholars a�er gradua�on. Correspondingly, it provides a be�er understanding of the long-term impact of the scholarship programs implemented in terms of personal and professional achievements of the scholars in their chosen fields, which eventually would benefit their families, the labor force, the community, and the economy as a whole. Hence, it informs policy so that the S&T scholarship programs of the Ins�tute can be further improved to serve the needs of the �mes.
The respondents of this Tracer study were scholars who par�cipated during the Exit Conferences held in the various regions of the country, including the Na�onal Capital Region (NCR) in 2018 and 2019. A total of 1,098 scholar-graduates responded to the online Tracer Study conducted from February 2019 un�l March 2020, one to two years a�er they graduated.
Approximately, six in every 10 scholars-graduates were already employed within the period of six months a�er gradua�on. At the �me of survey, (e.g., one to two years a�er they graduated), eight in every 10 scholar-graduates had already landed a job either permanent/proba�onary/contractual/job order/casual posi�ons, which translate to an employment rate of 83.6%.
The females made up the largest propor�on of employed scholars as they comprised more than half of the total employed scholar-graduates. The unemployed on the other hand, were also predominantly females. Looking at the unemployment rate by program, two in every ten among the Merit scholars, and one in every ten each for RA 10612 and RA 7687 scholarship programs were unemployed.

38
The Tracer Study ReportDOST-SEI Undergraduate Scholar-Graduates Batch 2018 and 2019
The highly employable degree courses of scholar-graduates with 90-100% employment rate within the period of six months a�er gradua�on were BS Applied Mathema�cs; BSED Chemistry; BS Mining Engineering; BSEd Physics-Mathema�cs; BS Marine Biology; BS Computer Science; and BS Psychology.
Interes�ngly, about twelve and eight percent of the scholar-graduates were pursuing graduate studies and training cer�fica�on, respec�vely, during the first six months a�er gradua�on. This is a good indica�on that some scholars were interested to expand their exper�se, knowledge and skills related to their professional specializa�on, which in turn would contribute in a�aining a cri�cal mass of highly-skilled S&T professionals in the country.
The employment loca�on of scholar-graduates revealed that about five in 10 scholar-graduates were employed in the private sector, while only two in 10 in the government, and one in 10 in the Academe. Majority of those working in the private sector were connected with local companies, while about ten percent in BPOs. Among those employed in the government sector, the great majority joined the teaching force at DepEd, while majority of those in the academe were affiliated in the private schools.
The appropriateness of fields of study in rela�on to the current jobs of scholars indicated a job mismatch among ten percent of scholar-graduates. These scholars men�oned that their current job/work were completely different from their educa�onal background and did not require any par�cular field of specializa�on. On the contrary, over qualifica�on was also reported by about ten percent of the scholars. They men�oned that their job can be done with a lower degree/qualifica�on level or no specific degree at all. With regard to the appropriateness of professional posi�on, less than five percent reported that their posi�ons were not at all appropriate with their degrees. Despite these findings, a great majority were moderately to extremely sa�sfied with their current job situa�on. Most of the scholar-graduates accepted the job/work even if they were not closely related with their field of study for convenience; security; work flexibility; accessibility; as temporary employment, (e.g., s�ll searching/exploring more related job/work); return of service obliga�on only; and change of interest.
The occupa�onal classifica�on of 918 scholar-graduates, using the Interna�onal Standard Classifica�on of Occupa�ons e.g., Major, Sub-Major, Minor and Unit Groups, revealed that half of the occupa�ons of scholar-graduates were classified under the Professional Group, approximately the same propor�ons were also classified under the

39
The Tracer Study ReportDOST-SEI Undergraduate Scholar-Graduates Batch 2018 and 2019
Technicians and Associate Professionals and Clerical Support Workers. Less than one percent of the scholar-graduates were categorized in the Services and Sales Workers.
With regard to the monthly salary of the scholar-graduates, about 75% had an average monthly salary of P 23,499.00 per month. This rate is much higher as compared to the average salary of P 16,887 per month for a new graduate in the Philippines based on 2,493 salaries submi�ed anonymously to Indeed.com.ph (2020) by new graduate employee and users, collected from past and present job adver�sements in the past 36 months. Notably, about three percent reported with high income of P34, 000.00 and above among the scholars.
When it comes to the feedback of scholar-graduates, there were posi�ve as well as nega�ve responses gathered from the scholar-graduates during the survey, par�cularly on their employment situa�on a�er gradua�on. Among the pressing issues revealed were those from the RA 10612 scholar-graduates, par�cularly the deployment process a�er gradua�on, and the lack of pre-service teacher training provided to them prior to teaching assignments, which resulted to discrimina�ons of some scholars in the work place. On the other hand, majority of the scholars expressed posi�vity in the conduct of the Tracer Study with about 80% tes�fying that being a DOST-SEI scholar has an advantage against non-scholar graduates in job search. Many of the scholar-graduates were also interested to avail further trainings in their respec�ve fields of study and are willing to work at the research ins�tu�ons of DOST. Moreover, majority of them wanted to maintain their linkage and contact with DOST-SEI, especially on job opportuni�es, through their emails, and through mee�ngs/conferences, and home coming ac�vi�es.
Overall, the findings of the Tracer Study is a reflec�on on the quality of DOST-SEI scholar-graduates, as demonstrated by their performance in the labor market a�er gradua�on, as well as an indica�on of the competence of the Ins�tute in the administra�on and management of its scholarship programs. With the increasing number of scholar-graduates every year, the DOST-SEI must con�nue to tap linkages that will bring possible employment opportuni�es for its scholar-graduates and con�nuously reach out to them to con�nue to increase their capaci�es in their chosen fields and become more responsive and relevant ci�zens of the country.

Editorial Team
Executive AdviserJosette T. Biyo, Ph.D.
Director
Adviser and Chief EditorRuby R. Cristobal, Ph.D.
Chief Science Research Specialist
Data Analysts/Writers
Imelda S. SarioSupervising Science Research Specialist
Glennise Shyra P. BaykingScience Research Specialist II
Lay-out Artist/ProofreaderGlennise Shyra P. Bayking
Science Research Specialist II
Vergel P. RebutaScience Research Specialist II
Data Collectors/Encoders
Vergel P. RebutaScience Research Specialist II
Lew Jorden R. JulveScience Research Specialist I
Randolf S. SasotaSenior Science Research Specialist
Department of Science and TechnologyScience Education Institute
1st and 2nd Levels, Science Heritage BuildingDOST Compound, General Santos AvenueBicutan, Taguig City, Metro Manila
www.sei.dost.gov.ph