Castles and their Landscapes: A Gravity Model
16
Castles and their Landscapes: A Gravity Model Experiment Kate Buchanan Abstract Castle studies in recent years has developed two major themes: spatial analysis and landscape studies. Studies of castle landscapes have shown that external spaces were intensively used. Thus one of the limitations of spatial analysis in castle studies is the failure to include external spaces as an option for locations of social interaction. This raises questions about how the physical layout of the entire castle property affected the ways people interacted with these external features and which features and external spaces might be more attractive than others. Therefore, a methodology that includes the assessment of external spaces is sorely needed. This study tests out the gravity model as a potential method for assessing the attractiveness of landscape features to the castle population in order to open up a dialogue about methods for quantifying interaction with and in the landscape. Introduction Adapted from an established foundation in the sciences, ‘Spatial Studies’ or ‘Spatial Analysis’ has emerged as a key methodology in many disciplines throughout the arts and humanities. Some of the most exciting and thought-provoking new research has come out of assessing space and determining what role it has played as a driver of social interaction. Along with other sub-disciplines in the late twentieth and early twenty first centuries, castle studies has moved to incorporate spatial analysis as a standard method of study. Some studies looked at the spatial relationships based on an innate human need to establish claim to a territory. Others looked at environmental factors as the sole influence in structural setting. Another approach looked at the interior of structures as a form of symbolism for society and underlying power-relationships. Patrick A. Faulkner’s typology of domestic features and planning diagrams were revolutionary in the 1950s and 60s (1958, 1963) in identifying a discrepancy between spaces designated for military or domestic functions. Perhaps the most influential uses of spatial analysis in castle studies, however, began with Graham Fairlclough’s adaption of Faulkner’s planning diagrams (1992) and Hillier and Hanson’s method for assessing how spatial arrangement either limited or encouraged social interaction through a system called Relative Asymmetry (1984). This latter method has been used to identify spaces of control, and later by Rory Sherlock to determine levels of depth, or spaces that were deeply privatised rather than highly public (2008), ideas further explored by Gillian Eadie (2010). Alan Rutherford used this access analysis to demonstrate an emphasis on social status rather than military defence in select Scottish castles (1998). It is important to note that, in each of these studies, only internal space was being assessed and any consideration of external spaces was excluded. In most cases, the exclusion of external space is the result of surviving evidence. Internal spaces remain reasonably intact, but external spaces require deeper, and sometimes fruitless, investigation to identify. Nevertheless, this exclusion is problematic, as it does not allow for the significance of the social use of outside spaces to be considered as a dynamic in the functional activity of castles as arenas for the negotiation of social relationships. 1 As castle studies were adopting spatial analysis as a widely recognised methodology, a movement developed to include the surrounding landscape when considering a castle. There had been some studies that looked at landscape features as peripheral to the main residential structure, but Oliver Creighton’s assessment of castles and their landscapes as a single unit 1 Special thanks to Prof. Richard Oram and Dr. Thomas Finan for their encouragement with this observaon.
Transcript of Castles and their Landscapes: A Gravity Model

Castles and their Landscapes: A Gravity Model Experiment
Kate Buchanan
Abstract
Castle studies in recent years has developed two major themes: spatial analysis and landscape studies. Studies of castle landscapes have shown that external spaces were intensively used. Thus one of the limitations of spatial analysis in castle studies is the failure to include external spaces as an option for locations of social interaction. This raises questions about how the physical layout of the entire castle property affected the ways people interacted with these external features and which features and external spaces might be more attractive than others. Therefore, a methodology that includes the assessment of external spaces is sorely needed. This study tests out the gravity model as a potential method for assessing the attractiveness of landscape features to the castle population in order to open up a dialogue about methods for quantifying interaction with and in the landscape.
Introduction
Adapted from an established foundation in the sciences, ‘Spatial Studies’ or ‘Spatial Analysis’ has emerged as a key methodology in many disciplines throughout the arts and humanities. Some of the most exciting and thought-provoking new research has come out of assessing space and determining what role it has played as a driver of social interaction. Along with other sub-disciplines in the late twentieth and early twenty first centuries, castle studies has moved to incorporate spatial analysis as a standard method of study. Some studies looked at the spatial relationships based on an innate human need to establish claim to a territory. Others looked at environmental factors as the sole influence in structural setting. Another approach looked at the interior of structures as a form of symbolism for society and underlying power-relationships. Patrick A. Faulkner’s typology of domestic features and planning diagrams were revolutionary in the 1950s and 60s (1958, 1963) in identifying a discrepancy between spaces designated for military or domestic functions. Perhaps the most influential uses of spatial analysis in castle studies, however, began with Graham Fairlclough’s adaption of Faulkner’s planning diagrams (1992) and Hillier and Hanson’s method for assessing how spatial arrangement either limited or encouraged social interaction through a system called Relative Asymmetry (1984). This latter method has been used to identify spaces of control, and later by Rory Sherlock to determine levels of depth, or spaces that were deeply privatised rather than highly public (2008), ideas further explored by Gillian Eadie (2010). Alan Rutherford used this access analysis to demonstrate an emphasis on social status rather than military defence in select Scottish castles (1998). It is important to note that, in each of these studies, only internal space was being assessed and any consideration of external spaces was excluded. In most cases, the exclusion of external space is the result of surviving evidence. Internal spaces remain reasonably intact, but external spaces require deeper, and sometimes fruitless, investigation to identify. Nevertheless, this exclusion is problematic, as it does not allow for the significance of the social use of outside spaces to be considered as a dynamic in the functional activity of castles as arenas for the negotiation of social relationships.1
As castle studies were adopting spatial analysis as a widely recognised methodology, a movement developed to include the surrounding landscape when considering a castle. There had been some studies that looked at landscape features as peripheral to the main residential structure, but Oliver Creighton’s assessment of castles and their landscapes as a single unit
1 Special thanks to Prof. Richard Oram and Dr. Thomas Finan for their encouragement with this observation.

revolutionised the study (2002). The inclusion of the surrounding landscape features has become standard within castle studies, as is seen in Matthew Johnston’s inclusion of the surroundings from a context of function and form (2002). Hansson has also looked at features in relation to social practices, expanding the history to include cross-cultural comparison (2006). McManama-Kearin took an approach that incorporates the inventorying of castle features in Ireland and uses a GIS to assess their visibility from the castle through view-shed analysis (2012). Her study reveals that few of the castles assessed were situated in a militarily beneficial way, and that priority was given to access to water (not necessarily internal access) and crossroads or routes, of which at least one could be monitored from the gatehouse. Swallow’s work on Aldford Castle highlights the connection between the individual elements of the site and that each feature should not be taken as a piece outside the daily multipurpose function of the castle (2013).
Despite the fact that spatial analysis and landscape studies have both developed as major methodologies within castle studies, there have been limited attempts to bring these two methodologies together. Thus, spatially assessing the external space of castles becomes somewhat of a ‘spatial frontier’. This study has been focussed on developing a new model for analysing castles and their landscapes in order to address this void. What follows is a developing methodology adapted from the gravity model and a test of this method on late fifteenth- and early sixteenth-century castles in Angus, Scotland. First, the gravity model will be explained, followed by a demonstration of how the populations of the castles was estimated and the how the resources were identified. After all elements needed for the model are defined the conclusions of this experiment are explained.
The Gravity Model
The gravity model takes the principles laid out by Newton’s law, replacing mass with populations in order to quantify a natural attraction, or draw, between two populations:
I=M1 M 2
R2
where M1 is the population of the first location, M2 is the population of the second location, and R is the distance between the two locations (Johnson 1977).
The populations studied with this model have been expanded to assess interaction between human populations and a resource (Melitz 2007, Wilson 2007, Lewer and Van den Berg 2008, Rivers et al. 2008). Jochim published an adaptation of the gravity model ‘demonstrating one technique of handling site location and resource “pulls” quantitatively.’ To calculate the mass or population of a resource Jochim combines qualities pertaining to the resource:
M 2=wna
where w is the weight of the resource, n is the quantity of the resource, and a the area in which the resource is found (1976, Butzer 1982). In this way, the ‘pulls’ of different resources on a human population can be quantified, identifying resource types or areas that have the strongest relationship of attraction to the human population (Jochim 1976). It is important to remember that this model bases this relationship only on population size and distance and does not take into account preferences or choices made for dietary, cultural, or functional purposes. Nevertheless, the ability of this model to determine a scale of interaction between a human population and environmental features within an identified site provides one of many possible avenues for assessing this relationship. This experiment used Jochim’s

adaption of the gravity model to assess the natural draw for interaction between a castle and the associated environmental features.
The Gravity Model in the Context of Castles
As with any application of the gravity model, the context of the properties used in the formula need to be defined. Moving the use of the gravity model into the medieval and early modern period in Scotland provides a unique setting for the application of this model.
Population of the Castle
Ideally the population of the castle could be identified through available household accounts. However, these accounts, if they ever existed, are not available for the majority of noble castles in Scotland. In order to identify a population of the castle which would have interacted with the exterior landscape, internal space must be used. A maximum feasting capacity and a corresponding population can be estimated if there is enough archaeological evidence to identify the size of the hall. For her dissertation research on Irish towers, Eadie developed a formula for identifying an estimated maximum feasting capacity of a hall. Eadie’s model combines modern theories pertaining to dining space with the widely accepted U-shaped dinning arrangement. A U-shaped dining arrangement consists of the high table running along the width of the room on one end with two parallel rows of low tables running down the length of the room perpendicular to the high table. The high table only has diners on one side of the table, allowing it to be served from the front with 60cm between the table and the wall. The low tables have diners on both sides of the table and are served from both sides of the table, requiring 90cm between the wall and the table. To accommodate two streams of traffic 140cm has been placed between the edge of the high table and the end of the low table and between the entrance of the hall and the end of the low table (See Figure 1).

Figure 1: Example of U-shaped dining arrangement with predicted distances from Eadie’s model
Each guest is given 65cm of space at a table and the lord is given 95cm to accommodate status and a chair (Eadie 2010). Therefore, the space needed for serving can be subtracted from the length and width of the hall to give an approximate length of the tables in the hall. The table lengths can be divided by the space allotted for seating which provides an approximate number of guests that could be seated in that hall.
The formula for identifying the number of diners at the low tables can be written as follows:
L−340 cm=N
N ÷ 65 cm=K
K × 4=D
where L is the length of the hall, N is the length of the lower tables, K is the number of guests per table side, and D is the total number of guests seated at the low tables.
The formula for identifying the number of diners at the high table can be written as follows:
W −260 cm=M
M−95 cm=P
P ÷65 cm=G
where W is the width of the hall, M is the length of the high table, P is the space available to guests at the high table after removing the space allotted to the lord, and G is the number of guests at the high table.

Therefore, the maximum number of diners capable of eating at one time in the hall with a U-shaped dinning arrangement (X) is:
X=D+G+1
where one is added to include to lord.
The diners would have been accompanied by serving staff, who also need to be included in the maximum population for castle during a feast. It is recognised that the serving staff for the feast might not all be residents of the castle, but would be on the site during the time of the feast. In Le Menagier de Paris, forty guests required two esquires for wine, two stewards to seat guests, one sewer (attendant) per table, and two servants per table (Power 1992). The number of esquires generally required to serve a hall can be listed as a ratio of 1:10. On top of this there are three more people assigned to each table in the hall. Woolgar suggests that a typical table would have seated four people, two on each side (1999). Dividing the number of guests by four provides an estimate for the number of tables in the hall to make the U-shaped dinning pattern. The number of tables is then multiplied by three and added to the general number of serving staff to find the maximum number of household staff needed for a feast (S) (Buchanan 2010).2 This can be written as follows:
S=3( X4 )+ X
10
Therefore the population of the castle (M1) is the combination of the diners and the servants:
M 1=X+S
Identification of the Resource
Now that the process for estimating a maximum population for the castle has been explained, the ‘population’ of the external resource site needs to be established. Many of the landscape features associated with the castle site are vital resource locations. Therefore, Jochim’s adaptation of the gravity model is applicable to assessing the draw of interaction between the castle and the surrounding landscape features. According to his model four main features need to be identified with the resource in order to complete this assessment: location, area, quantity, and weight.
The descriptions of many of these sites in contemporary documents include architectural components as well as rights to major resource elements associated with the property. Although the castle property might be known to include resource features, the location of these resources and the expanse of land which they cover are required for the resource to be included in gravity model use. Not only does this allow for the distance to be identified, but the area also makes it possible for the density of the resource to be calculated. As Jochim’s M2 population is focused on the density of the resource, it is also important to know the quantity of the resource yield. Modern weight measurement of individual resources allows for an average weight to be assigned to the resource type and multiplied by the quantity to get an overall weight.
Testing of the Gravity Model on Castles in Angus, Scotland
2 It is possible that more staff were included in the household to take care of the horses and other livestock that were not included in the serving staff for the feast. However, it is also likely that people performed multiple tasks, especially when a higher number of staff was required, so the number calculated here is the one used in the later gravity model calculations.

In order to test this model on Scottish castles, the area of Angus, in eastern Scotland, during the period between 1450 and 1550 was selected to provide an insight on non-royal noble castles with different geographic characteristics. The features required to use the gravity model on castle sites severely limited the number of sites that were included in this study. Six sites were identified as having enough surviving architectural structure for identifying the size of the contemporary hall and the location of an associated resource. At these six sites, however, the site of the mill was the only resource feature that could be identified, limiting the test to assess interaction between the castle and the associated mill site rather than addressing the draw of interaction between the castle and a variety of different resource types and locations. Nevertheless, the following exemplifies the process and results of this experiment in full.
Human Population (M1)
No internal administrative records of the noble households in Angus survive from the period under examination. Therefore, the method outlined above was used to determine a theoretical maximum population size during a feast. It has been suggested that a screen would have separated the dining area from the service area. Therefore, where possible, a likely screens passage has been identified, shortening the space used for dining purposes. The following section outlines how the internal measurements were obtained for the sites used in this test.
Affleck
Affleck, also known as Auchenleck, castle was built in the late fifteenth century between the Monikie and the Pitairlie Burns. Although it has been suggested that it was a ‘free standing tower-house’ (Tranter 1970), the lack of provisioning for kitchen space suggests it was only one structure within a wider complex. The early castellologists David MacGibbon and Thomas Ross surveyed the structure in the nineteenth century with external measurements of 11.43m by 8.1m and internal measurements of 8.12m by 4.93m (1887a). A stair leading up to the first and second floors is in the south-east corner of the tower, partly contained with the small jamb. A stair leading to the upper floors is in the south-west corner, and if a screen existed in this hall it is likely that it was placed separating these two stairs from the rest of the chamber. Excluding space dedicated to the screens passages leaves the available space provided for dining in the hall at Affleck a length of 667cm and a width of 492.5cm (See Figure 2).

Figure 2: Site of Affleck Castle and Mill with hall plan
Broughty
The original structure of Broughty Castle was finished c.1493 (MacGibbon and Ross 1889), but it had already fallen into ruin by the early seventeenth century. It remained ruinous for over two hundred years until in the 1860s it was restored as a defensive battery for the government by Robert Anderson (Mudie and Walker 1970). The original tower was refurbished in that restoration, though the addition of a wing tower in the north-west corner changed any evidence of how access with the late fifteenth-century tower was arranged. As it stands, the main tower is entered on the south and enough evidence remains to strongly suggest the size of the hall. With the screen placed across the southern part of the hall the space available for dining measures 1051cm in length and 768cm in width (See Figure 3).

Figure 3: Site of Broughty Castle and Mill with hall plan
Edzell
There is some controversy as to when the main tower at Edzell was built. According to MacGibbon and Ross’s interpretation of the details of the tower, the inverted keyhole loops, the protruding staircase, and the more ornamental checked appearance of the corbels point to a late fifteenth-century origin (1887a). More recent interpretation places the original construction date in the early sixteenth century: Tabraham to the 1530s (2005) and the current Historic Scotland guidebook to the 1520s (2007). Edzell was surveyed in the 1930s by William Douglas Simpson, who measured the interior of the hall at 10.05m by 7.16m (1930-31). The tower was accessed through the north-west wall with the main stair in the north corner. A service stair leading from the vaulted cellar to the hall sits on the other side of the same wall in the south-west corner. Therefore, it seems likely that a screen would have divided the main dining area from these stairs, making the area available for dining 703.5cm by 716cm (See Figure 4).

Figure 4: Site of Edzell and Mill with Hall Plan
Glamis
Traditionally there was some form of lordly residence at this site from as early as the eleventh century (Fordun 1775), but John Lyon, second laird of Glamis began work on what is the current structure between 1404 and 1435. The structural remains of this early fifteenth century structure are embedded within the current building. Harry Gordon Slade has estimated that the original measurements of the hall, before the addition of a large chimney in the west gable, were approximately 17.07m by 6.71m. According to Slade, the main access to the hall was from the main stair in the south-east corner of the block. The service stair comes from the north-east corner (Slade 2000). Therefore, a screen is likely to have run north-south separating the stairs from the main dining area, making the main dining space 1263cm by 671cm (See Figure 5).

Figure 5: Site of Glamis Castle and Mill with Hall Plan
Inverquharity
Walter Ogilvy of Auchterhouse was given the property of Inverquharity in 1420. The structure was likely an L-shape tower house, though the eastern wing was ruined by the 1840s when MacGibbon and Ross surveyed the structure, measuring the tower as 13.71m by 10.05m with walls 2.28m thick (1887b). The main entrance was in the eastern wall. However, traffic was directed north from the entrance through a westward bend, locating the entrance to the hall on the north side. It is likely that a screen was drawn over the northern part of the hall, making dining space 816cm by 579cm (See Figure 6).

Figure 6: Site of Inverquharity Castle and Mill with Hall Plan
Red Castle
There is evidence that a structure has been at Redcastle since the twelfth century but it is unknown when the current building whose ruins occupy the site was constructed. MacGibbon and Ross suggest that the ruins are a mix of a thirteenth century curtain wall and a fifteenth-century tower house. By the time of their survey, the tower only consisted of some of the northern wall with elements of the eastern and western walls (1887a). Remarkably, the site remained in a similar condition in 1940-41 when Simpson surveyed the estate (and despite some late twentieth-century collapse, is still of similar extent). The tower’s external measurements were 13.41m by 9.98m with walls 1.67m thick and stood four storeys tall (Simpson 1940). For this study it has been presumed that a hall existed in the tower. There is no evidence regarding access to the tower to allow for the identification of a possible screens passage, thus making the possible space available for dining 1174cm by 831cm (See Figure 7).

Figure 7: Site of Red Castle and Mill with Hall Plan
Given the measurements identified above, an estimated maximum feasting population was calculated for these six sites listed in Table 1. However, it is noted that this maximum population would have gathered on rare occasions at the site, and it is not indicative of the interaction between the castle and the surrounding associated features on a daily basis. To account for a daily level of interaction the gravity model has been calculated with a standardized minimum population of ten. Therefore, the relationship of attraction between the human population and the resource can be compared with a maximum and minimum population.
Table 1: Estimated Maximum Population of Castle Sites
SITE MAXIMUM POPULATIONAFFLECK 45BROUGHTY 97EDZELL 54GLAMIS 117INVERQUHARITY 63RED CASTLE 111
Resource: Distance (R) and Population (M2)
Distance (R)
Although there is documentation for the castle properties having an associated mill, the specific locations of the mills were not mentioned in that contemporary record. Mill sites are rarely changed over time due to the amount of work needed to implement the water diversions used for running the mill. For this reason, the associated mills for these six properties have been identified on historical maps dating from the 1590s and later.

Affleck
Affleck is listed as having a mill from 1471 (Paul 1882b). The early Scottish cartographer Timothy Pont’s drawing of the property indicates a mill close to Affleck Castle along the Pitairlie Burn (1583-1601a). Ainslie (1794) and Thomson (1825) note an ‘Affleck Mill’ along the Pitairlie Burn near a place called Denhead. The Ordinance Survey map shows that a similarly located mill was named Denhead Mill (1865). For this study this mill site has been identified as the mill associated with Affleck Castle(Figure 2) with a distance of 1120m between the mill and castle.
Broughty
In 1524 the lands and mill of Balgillo are listed as attached to Broughty Castle (Paul 1882b). Pont denotes the place of Balgillo along the Dighty Water, north of Broughty Castle (1583-1601a). Both Ainslie (1794) and Thomson (1825) identified a mill at Balgillo near Linlathen. Based on these records the location of Balgillo Mill has been identified as shown in Figure 3, with a distance of 2490m between the mill and castle.
Edzell
There is a mill associated with the property of Edzell in a document dated 1511 (Paul 1882a). Pont identifies a ‘corn mill’ along the River North Esk near Arnhall (1583-1601b). This location is also noted by Gordon (1636-1652b). Roy (1752), Ainslie (1794), Thomson (1825), and the Ordinance Survey (1946) map all indicate a mill at Arnhall, or the current town of Edzell. Therefore, this mill location has been identified as being associated with the Edzell property for this experiment (Figure 4), showing a distance of 1970m between the mill and castle.
Glamis
Although there is no known documentation referring to a mill originating from the time period of this study, Glamis is identified as a barony with many other features associated with the property (Paul 1882a). Given the high status of the Lyons who owned Glamis,3it is unlikely that they did not have a mill. Gordon notes a mill south of Glamis Castle on the Glamis Burn (1636-1652a). Ainslie identifies a mill along the Glamis Burn outside the village of Glamis (1794), also shown by Thomson (1825). This location, as shown in Figure 5, has been identified for the mill associated with Glamis for this study leaving 1540m between the castle and the mill.
Inverquharity
In 1541 both a fulling (wool) and grain mill were listed as belonging to the property of Inverquharity (Paul 1882b). Pont shows the location of the Inverquharity mill on the north side of the Quharity Burn (1583-1601b). However, Gordon (1652), Ainslie (1794), and the current archaeological site of the Inverquharity mill are all on the south side of the Quharity Burn (Ordinance Survey 1961). Therefore, location of the mill has been identified for this study on the south side of the water, as shown in Figure 6, making the distance between the mill and castle 409m.
Red Castle
3 The Lyons had a long history of royal service, holding positions such as: Master of the King’s Household, Ambassador to England, members of the King’s Council, Justiciar of the North and Chamberlain of Scotland (Paul 1904, ODNB 2004).
Laptop, 06/09/15,
Which one? State the edition and scale e.g. 2nd edition 1 inch to the mile…

A confirmation of land in 1481 lists the barony of Red Castle as having a mill and castle associated with it (Paul 1882a). Ainslie (1794) and Thomson show a mill, called Lunan Mill, located upstream from Red Castle along the Lunan Water (1825). This site has been identified as the mill associated with Red Castle in this study, shown in Figure 7, leaving 1390m between the mill and castle.
Population (M2)
Specific accounts for the production of the mills associated with these six properties were not found. However, produce accounts from the episcopal household of the bishopric of Dunkeld, whose chief centres lay immediately west of the study area of this current project, were found. The accounts of milling production from the chief residential properties of the bishopric were averaged to obtain an estimate of production likely at these properties in Angus (Mylne and Hannay 1915). Similar accounts from St Andrews diocese, immediately south of the study area, demonstrate that the production recorded in Dunkeld was representative of this part of eastern Scotland (Hannay 1913).
Quantity (n)
The amount of grain production for 68 mills belonging to the Bishopric of Dunkeld totalled to 112 Chalders 6 Bolls of victual (grain provisions) and 51 Chalder 14 Bolls of barley (Mylne and Hannay 1915). The correlating measures to volumes are shown in Table 2 (Gershtein and Gershtein 2013). Therefore, the average production of these mills was 1 Chalder 3 Bolls of victual and 12 Bolls 1 Firlot of barley.
Table 2: Measurements and Weight of GrainVolume Barley Oats Wheat Rye
Chalder 16 Bolls 3386.6L 2063kg 1463kg 2604kg 2388kgBoll 4 Firlots 211.7L 128.9kg 91.4kg 162.8kg 149.2kg
Firlot 4 Pecks 52.9L 32.2kg 22.9kg 40.7kg 37.3kgPeck 4 Lippie 13.2L 8.06kg 5.7kg 10.2kg 9.4kg
Lippie 3.04L 1.9kg 1.3kg 2.3kg 2.2kg
Weight (w)
As ‘victual’ is not specified as a specific type of grain when barley is, it is likely that it consisted of a mix of the three other common types of grain: oats, wheat, and rye. To get an idea of the weight of victual and average of these three grains was taken. Given the weights listed in Table 2, a chalder of victual would weigh 2151.67kg and a boll 134.48kg. The weight of barley is calculated separately at 128.9kg per boll and 32.23kg per firlot.
Area (a)
The extent of the mill structures on these six properties is not known at this time, though further archaeological investigation may reveal structural remains. Although it is understood that the entire mill site would have included housing for the miller and the lade/pond system, an area of five square-meters has been assigned to each mill for this study.
Combining these three features to identify the M2, or wna, for this gravity model adaptation goes as follows:
weight (w)× number(n)
Victual
1 Chalder× 2151.67 kg=2151.67 kg
3 Bolls × 134.48 kg=403.44 kg
Barley
12 Bolls ×128.9kg=1546.8 kg
1Firlot × 32.23 kg=32.23 kg
Total:
2151.67+403.44+1546.8+32.23=4134.14 kg
wn ×area(a)
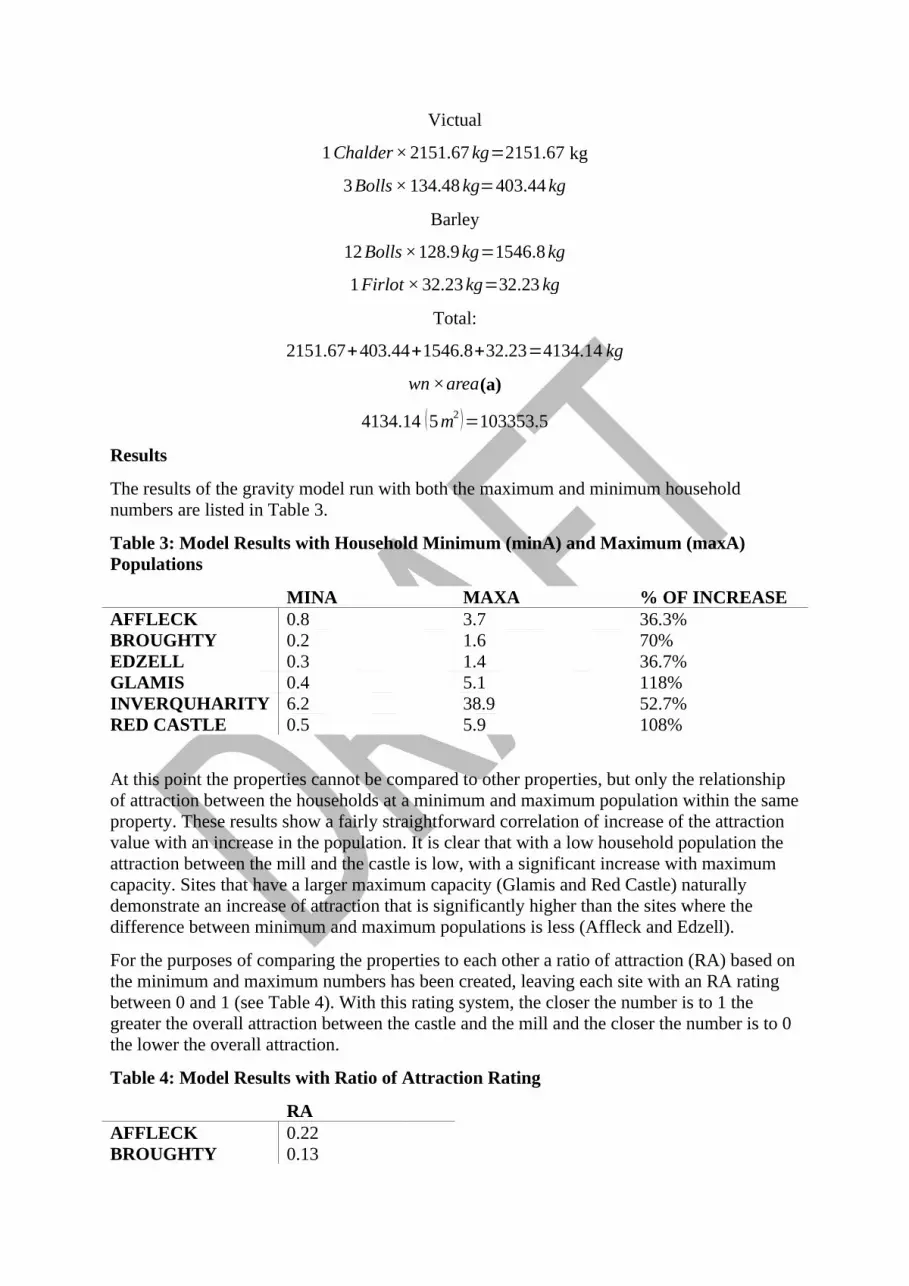
4134.14 (5 m2 )=103353.5
Results
The results of the gravity model run with both the maximum and minimum household numbers are listed in Table 3.
Table 3: Model Results with Household Minimum (minA) and Maximum (maxA) Populations
MINA MAXA % OF INCREASEAFFLECK 0.8 3.7 36.3%BROUGHTY 0.2 1.6 70%EDZELL 0.3 1.4 36.7%GLAMIS 0.4 5.1 118%INVERQUHARITY 6.2 38.9 52.7%RED CASTLE 0.5 5.9 108%
At this point the properties cannot be compared to other properties, but only the relationship of attraction between the households at a minimum and maximum population within the same property. These results show a fairly straightforward correlation of increase of the attraction value with an increase in the population. It is clear that with a low household population the attraction between the mill and the castle is low, with a significant increase with maximum capacity. Sites that have a larger maximum capacity (Glamis and Red Castle) naturally demonstrate an increase of attraction that is significantly higher than the sites where the difference between minimum and maximum populations is less (Affleck and Edzell).
For the purposes of comparing the properties to each other a ratio of attraction (RA) based on the minimum and maximum numbers has been created, leaving each site with an RA rating between 0 and 1 (see Table 4). With this rating system, the closer the number is to 1 the greater the overall attraction between the castle and the mill and the closer the number is to 0 the lower the overall attraction.
Table 4: Model Results with Ratio of Attraction Rating
RAAFFLECK 0.22BROUGHTY 0.13

EDZELL 0.21GLAMIS 0.08INVERQUHARITY 0.16RED CASTLE 0.08
As Table 4 demonstrates, none of the sites included in this study have a ratio of attraction weighted strongly. Overall, all six sites have a low ratio of attraction. Among the six sites, however, Affleck and Edzell have the strongest ratio of attraction between their castles and mills, whereas Glamis and Red Castle have the weakest. Broughty and Inverquharity sit in the middle of this table. What is perhaps most interesting is that Inverquharity, where the mill was significantly closer than at the other sites, very high minA and maxA numbers, did not demonstrate a stronger ratio of attraction. However, as it does not have a very high maximum population and the rate of increase was 52.7%, this low ratio of attraction is consistent with the model.
Conclusions
Location and population were only some dynamics contributing to the draw to the mill sites in among a series of socio-legal factors, such as legal requirements for the tenants to sue the mill. However, when the exact numbers for this kind of interaction are not known, it is possible to use location and estimated populations to identify trends for interaction between the castle and the mill site. There is a low rate of draw between the castle site and mill for each of the six castles examined in Angus, Scotland between the years 1450 and 1550. Considering the significant distance being assessed, this is not surprising. However, as no other resource sites could be included in this study it is not possible to know how this ratio of attraction between the castle and the mill compares to other significant resource features associated with the castle property. The understanding of the household and resources associated with these sites has been greatly increased with this experiment and the ground work for future research on quantifying the relationship between the castle and its associated external features has now been laid. Given that this study has successfully highlighted rates of attraction between the castle and one resource type, the further application of this adaptation of the gravity model castle sites in a different location or time period where a more full understanding of the layout and production of the property can be obtained would be extremely valuable.