Case study Cape Verde Islands
35
ACPD 12, 29535–29569, 2012 Case study Cape Verde Islands K. W. Fomba et al. Title Page Abstract Introduction Conclusions References Tables Figures Back Close Full Screen / Esc Printer-friendly Version Interactive Discussion Discussion Paper | Discussion Paper | Discussion Paper | Discussion Paper | Atmos. Chem. Phys. Discuss., 12, 29535–29569, 2012 www.atmos-chem-phys-discuss.net/12/29535/2012/ doi:10.5194/acpd-12-29535-2012 © Author(s) 2012. CC Attribution 3.0 License. Atmospheric Chemistry and Physics Discussions This discussion paper is/has been under review for the journal Atmospheric Chemistry and Physics (ACP). Please refer to the corresponding final paper in ACP if available. Aerosol size-resolved trace metal composition in remote northern tropical Atlantic marine environment: case study Cape Verde Islands K. W. Fomba, K. M¨ uller, D. van Pinxteren, and H. Herrmann Leibniz – Institute for Tropospheric Research (TROPOS), Permoserstr. 15, 04318, Leipzig, Germany Received: 26 October 2012 – Accepted: 6 November 2012 – Published: 16 November 2012 Correspondence to: H. Herrmann ([email protected]) Published by Copernicus Publications on behalf of the European Geosciences Union. 29535
-
Upload
khangminh22 -
Category
Documents
-
view
1 -
download
0
Transcript of Case study Cape Verde Islands
ACPD12, 29535–29569, 2012
Case study CapeVerde Islands
K. W. Fomba et al.
Title Page
Abstract Introduction
Conclusions References
Tables Figures
J I
J I
Back Close
Full Screen / Esc
Printer-friendly Version
Interactive Discussion
Discussion
Paper
|D
iscussionP
aper|
Discussion
Paper
|D
iscussionP
aper|
Atmos. Chem. Phys. Discuss., 12, 29535–29569, 2012www.atmos-chem-phys-discuss.net/12/29535/2012/doi:10.5194/acpd-12-29535-2012© Author(s) 2012. CC Attribution 3.0 License.
AtmosphericChemistry
and PhysicsDiscussions
This discussion paper is/has been under review for the journal Atmospheric Chemistryand Physics (ACP). Please refer to the corresponding final paper in ACP if available.
Aerosol size-resolved trace metalcomposition in remote northern tropicalAtlantic marine environment: case studyCape Verde IslandsK. W. Fomba, K. Muller, D. van Pinxteren, and H. Herrmann
Leibniz – Institute for Tropospheric Research (TROPOS), Permoserstr. 15, 04318, Leipzig,Germany
Received: 26 October 2012 – Accepted: 6 November 2012 – Published: 16 November 2012
Correspondence to: H. Herrmann ([email protected])
Published by Copernicus Publications on behalf of the European Geosciences Union.
29535
ACPD12, 29535–29569, 2012
Case study CapeVerde Islands
K. W. Fomba et al.
Title Page
Abstract Introduction
Conclusions References
Tables Figures
J I
J I
Back Close
Full Screen / Esc
Printer-friendly Version
Interactive Discussion
Discussion
Paper
|D
iscussionP
aper|
Discussion
Paper
|D
iscussionP
aper|
Abstract
Size-resolved trace metal concentrations of 15 elements in aerosol particles at theCape Verde Atmospheric Observatory (CVAO) under remote background conditionswere investigated through analysis of aerosol samples collected during intensive fieldstudies from January 2007 to November 2011 using total reflection x-ray fluorescence5
(TXRF). The identification of the main air mass origin that influence remote marineaerosol in the northern tropical Atlantic has been investigated. In total 317 sampleswere collected. The dataset was analyzed according to the main air mass inflow at thestation. We found that remote conditions make up about 45 % of the meteorologicalconditions in a year at CVAO and thus the northern tropical Atlantic. Surprisingly, air10
masses from North America are often responsible for higher trace metal concentrationsin this region.
Elements such as Zn, Pb, Cu, Cr, Ni, and V were mostly found in the submicronsize fractions while elements with dominant crustal or oceanic origin such as Fe, Ti,Mn, Sr, and Rb, were found in the coarse fractions (>1 µm). The highest metal con-15
centrations especially for Zn (3.23 ng m−3), Cu (0.81 ng m−3), Sr (2.63 ng m−3), and Cr(0.53 ng mm−3), were observed in air masses originating from North America and theconcentrations were within the same concentration range to those reported previouslyin the literature for remote marine aerosols. Fe (12.26 ng m−3), Ti (0.91 ng m−3) and Mn(0.35 ng m−3) showed higher concentrations when air mass came from Europe and the20
Canary Islands. Pb concentration was low (<0.20 ng m−3) and did not vary significantlywith air mass direction. The low Pb concentration is indicative of the complete phasedout of leaded gasoline even in African countries. Crustal enrichment factor values de-creased from fine to coarse mode particles with low values (<4) observed for Fe, Mn,and Rb and high values (>20) for Zn, Cu, Ni, Cr, Pb, and Se. The observed enrichment25
of the elements was attributed to crustal, marine, anthropogenic and biogenic sources,as well as long range transport and re-suspension. Zn, Cu and Pb were indicators ofanthropogenic activities while Ti, and Sr, were indicators of crustal and marine origin,
29536

ACPD12, 29535–29569, 2012
Case study CapeVerde Islands
K. W. Fomba et al.
Title Page
Abstract Introduction
Conclusions References
Tables Figures
J I
J I
Back Close
Full Screen / Esc
Printer-friendly Version
Interactive Discussion
Discussion
Paper
|D
iscussionP
aper|
Discussion
Paper
|D
iscussionP
aper|
respectively. Oceanic emissions contributed to most of the Selenium observed. Thiswork provides the first long term size resolved trace metals study for remote tropicalnorthern Atlantic marine aerosols and the dataset could serve as good initiation ofyearly flux estimates.
1 Introduction5
Atmospheric input of trace metals is essential for marine productivity, for example, Fe,Mn, Cu, Cd, and Zn (Morel et al., 2003). The atmosphere has been recognized as amajor source of metals to the open oceans (Duce et al., 1991) since inputs from riverand land erosion are mostly local whereas atmospheric inputs are not localized butspread over larger area. Islands are very useful in studying deposition patterns to the10
open oceans since they experience similar conditions like the oceans and provide longlasting infrastructures for carrying out long and short term experiments. In the tropicalnorthern Atlantic, the Cape Verde islands are well situated for carrying out such exper-iments and atmospheric conditions in this region are representative of a larger part ofthe northern tropical Atlantic. This was one of the principal reasons for the creation of15
the Cape Verde Atmospheric Observatory (CVAO). CVAO thus provides a platform forstudying both remote marine aerosols as well as continental and Saharan dust domi-nated aerosols. Aerosol compositions being observed at CVAO are affected by mixingof air masses and the influence of aerosols from sources situated in North America, Eu-rope or Africa. Thus the aerosol composition varies temporally and spatially in concert20
with meteorological conditions.Remote conditions at the CVAO are attributed to air masses that do not come from
neighboring continental Africa since such air parcels are known to carry significantamount of mineral aerosols especially during Saharan dust outbreaks. The outbreakshave seasonal patterns with peaks between December and March (Chiapello et al.,25
1997, 1999, 2005). The other months are dominated by remote conditions with very lowaerosol loadings which could be as low as 7 µg m−3. During such conditions aerosol
29537
ACPD12, 29535–29569, 2012
Case study CapeVerde Islands
K. W. Fomba et al.
Title Page
Abstract Introduction
Conclusions References
Tables Figures
J I
J I
Back Close
Full Screen / Esc
Printer-friendly Version
Interactive Discussion
Discussion
Paper
|D
iscussionP
aper|
Discussion
Paper
|D
iscussionP
aper|
trace metals originate from oceanic emissions as well as long range transport fromsouthern Europe and North America.
Previous ship cruises and other works in this region have mostly been focused onthe influence of Saharan dust outflow from the African continent (Johansen et al., 1999;Buck et al., 2010a, b; Hand et al., 2004) but not much has been done to better charac-5
terize the aerosol trace metal in remote conditions which despite their low concentra-tions are also of importance to the marine biota.
Aerosol trace metal studies in some remote regions of the Atlantic oceans atBermuda (Huang et al., 1996; Duce et al., 1976; Spokes et al., 2001; Witt et al., 2006)or during ship cruises (Spokes et al., 2001; Witt et al., 2006) and even in Antarctica10
(Weller et al., 2008) have shown that trace metals are enriched above the oceanicand crustal sources and are found in different size fractions. Anthropogenic activitiesthat lead to emission of trace metals are usually related to high temperature processessuch as smelting, fuel combustion, or waste incineration (Pacyna et al., 2007; Gallowayet al., 1982). In such processes metals are mostly emitted in gaseous forms and they15
rapidly condense on the surfaces of particles having a high surface area leading to theirlikely presence in the fine mode (<1 µm) aerosol particles (Galloway et al., 1982). Re-cently, there have been reports on trace metals found in marine microgels and colloids(Bertine and VernonClark, 1996; Guo et al., 2000). These gels and colloids usually lessthan 1 µm in size have been found to act as cloud condensation nuclei (Orellana et al.,20
2011). Thus, although they are not yet well characterized in marine aerosols they maycontribute to the trace metal budget in the sub-micrometer aerosol particle fraction.Metals from coarse particles (>1 µm) are mostly attributed to mechanical processessuch as rock weathering, soil erosion, volcanic eruptions, or bubble bursting. Coarsemode particles are deposited faster and have atmospheric life times of up to 4 days25
while fine mode particles live longer and may attain life times of more than 6 days un-der dry conditions. In regions with low rain probability and thus less influence of wetdeposition such as the Cape Verde islands and its local environment (Lee et al., 2010)such particles can readily reach the above atmospheric lifetimes (Lawler et al., 2009;
29538

ACPD12, 29535–29569, 2012
Case study CapeVerde Islands
K. W. Fomba et al.
Title Page
Abstract Introduction
Conclusions References
Tables Figures
J I
J I
Back Close
Full Screen / Esc
Printer-friendly Version
Interactive Discussion
Discussion
Paper
|D
iscussionP
aper|
Discussion
Paper
|D
iscussionP
aper|
Johansen et al., 1999). Therefore, emissions from anthropogenic activities may havesignificant influence on trace metal budget in this region.
Within the present study results of data collected during a series of nine intensivefield campaigns from January 2007 to November 2011 on size-resolved trace metalcomposition in remote marine aerosols observed at the CVAO are presented. The aim5
of this work was to characterize the variability of bioactive trace metals such as Mn,Fe, Cu, Zn, Se, V, Cr, Pb, and Ni, evaluate their natural background concentrations,size distribution and their source origins with the help of crustal enrichment factors andback trajectory analysis in this region of the Atlantic. Major sea salt elements such asK, Ca, S, Cl were not the focus of this work.10
2 Experimental
2.1 Site and sampling
Aerosol sampling was performed at the CVAO which is located north east of the is-land of Sao Vicente, Cape Verde and is situated 70 m from its coastline at 16◦51′49 N,24◦52′02 W experiencing mostly north-easterly winds. The annual average tempera-15
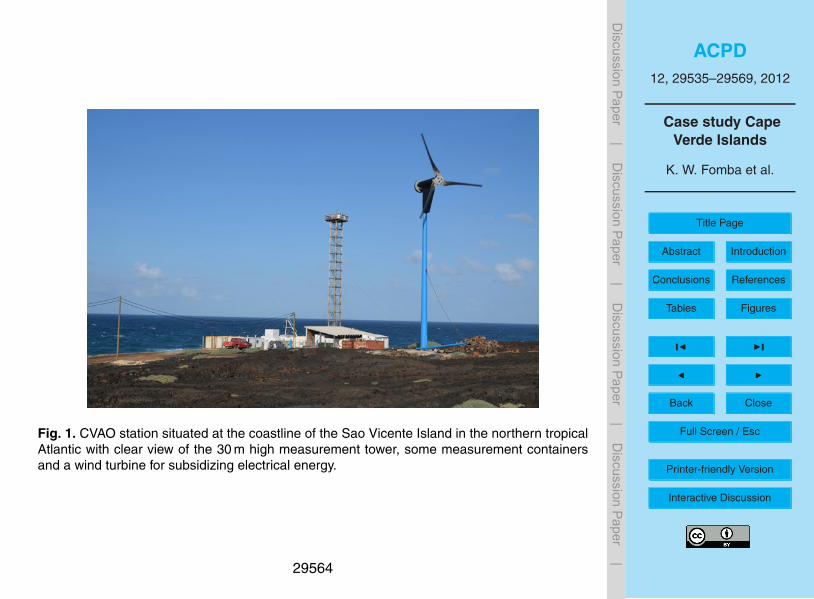
ture at Sao Vicente is about 25 ◦C and it is an arid region with a maximum of 50 mm ofrainfall per year. Sample collection was done on top of a tower with an inlet height of32 m above ground to reduce strong influence of sea spray on the collected particles.Due to the location of the station, influences from the island like orographic influencesin dust sedimentation and anthropogenic emissions are negligible. Thus the collected20
samples are representative of a clean atmosphere over the ocean and not contami-nated by materials from the islands. A picture of the CVAO station is shown in Fig. 1with clear view of its coastline location, the 30 m high measurement tower, measure-ment containers and subsidiary electrical power infrastructure.
Particles were sampled using a high volume (HV) Digitel (DHA 80) collector on quartz25
filters in 72 h periods throughout the year for aerosol mass concentration and further
29539

ACPD12, 29535–29569, 2012
Case study CapeVerde Islands
K. W. Fomba et al.
Title Page
Abstract Introduction
Conclusions References
Tables Figures
J I
J I
Back Close
Full Screen / Esc
Printer-friendly Version
Interactive Discussion
Discussion
Paper
|D
iscussionP
aper|
Discussion
Paper
|D
iscussionP
aper|
chemical analysis. During intensive campaigns lasting 4–6 weeks, size resolved sam-pling was carried out using a 5-stage Berner low pressure impactor with a PM10 isoki-netic inlet (Hauke, Gmunden, Austria) operated at a flow rate of 75 L min−1 in a 24 hperiod with about 45 min reserved for the replacement of the samples. The impactorsamples were collected on annealed aluminum foils and polycarbonate (nuclepore)5
foils (Wicom, Heppenheim, Germany). The nuclepore foils were placed on the alu-minum foils on each impactor stage and were used for the determination of metals. Theimpactor stage cutoff’s were as follows: stage 1 (St. 1) : 0.05–0.14 µm, stage 2 : 0.14–0.52 µm, stage 3 : 0.52–1.2 µm, stage 4 : 1.2–3.5 µm, stage 5 (St. 5) : 3.5–10 µm.
After sampling, filters were stored in aluminum boxes at 5 ◦C at the station for 24–48 h10
and subsequently frozen at −20 ◦C. The samples were thereafter transported underfrozen conditions from Cape Verde to Leipzig (Germany). To estimate the mass ofthe particles, the filters were equilibrated for 3 days at 20±1 ◦C and 50±5 % relativehumidity before and after sampling and thereafter weighed. The mass of the filters weredetermined using a micro-balance (HV-filter: MettlerAT261 Delta Range, impactor foils:15
Mettler Toledo UMT2).
2.2 Metal analysis
Trace metal analysis on nuclepore foils was carried out using Total Reflection X-RayFluorescence (TXRF) S2 PICOFOX (Bruker AXS, Berlin, Germany) equipped with aMo-X-ray source on polished quartz substrates. The nuclepore foils were cut with re-20
spect to the number of visible spots on the foils (6 spots for stage 1, 3 for stage 2, 2for stages 3 and 1 for stages 4 and 5). Cut spots were placed on substrates and 5 µL65 % concentrated HNO3 and subsequently gallium (as internal standard) was addedon the spots. Depending on the size fraction, different gallium concentrations were ap-plied (10 ng for the three sub-micrometer fractions and 100 ng for the coarse mode25
fractions). The solution was left to evaporate at about 100 ◦C and thereafter the sub-strates containing the spots were measured. As reported by (Muller et al., 2010), thecut spot diameters are typically 6 mm and were close to the TXRF beam diameter of
29540
ACPD12, 29535–29569, 2012
Case study CapeVerde Islands
K. W. Fomba et al.
Title Page
Abstract Introduction
Conclusions References
Tables Figures
J I
J I
Back Close
Full Screen / Esc
Printer-friendly Version
Interactive Discussion
Discussion
Paper
|D
iscussionP
aper|
Discussion
Paper
|D
iscussionP
aper|
10 mm. However, due to sample orientation on the substrate, samples were measuredat two different angles having a difference of 90◦ between them in order to ensure acomplete excitation of the spots. Each substrate was measured 3 times at each angleand the maximum value from the measurements at the different angles was taken asthe elements value on the substrate.5
PICOFOX is able to analyze elements from Al to Bi. However, in this work the focushas been only on the aerosol trace metals which are not naturally expected to residein remote aerosols in high concentrations compared to major sea salt elements suchas Cl, Br, K, S or Ca. The studied trace metals were Mn, Fe, Cu, Zn, Se, V, Cr, Pb,Ni, Ti, Rb, Sr, Ba, La, and Ce. The other trace elements not considered in this work10
were not detected such as elements from Pr to Tl or had concentrations below thebackground level for elements such as Y, Zr, Nb, Ru, Rh, Cd, Pd, Ag, Sn, Sb, Te.Due to the low crustal content in the remote marine aerosols analyzed and the highbackground values of Si and Al coming from the quartz substrate and aluminum foilsused during the sampling, respectively, the concentrations of Si and Al could not be15
effectively quantified. Furthermore, the sample preparation method (e.g., the substrateheating at 100 ◦C) made quantification of volatile species such as Cl and Br difficult.
The blank values of the polycarbonate filters and the quartz substrates were mea-sured (Table 1). The filter field blanks were higher than those of the substrate. Thetypical blank values of the quartz substrates (n = 75) of these elements were <10 pg20
except for Fe where values were <20 pg. A total of 20 field blank filters were analyzedduring the stipulated sampling period and were prepared using the same procedureas those of the probed filters as stated above. The field blanks were filters that we de-ployed to the field but were not probed during the campaign. Their elemental averagevalues were used as filter blank values (Table 1). The highest blank values were ob-25
served for Fe, Zn, and Sr and the lowest for Se, La, and Rb. Blank correction was doneby subtracting blank filter values from those of the probed filters.
In principle, the detection limit of TXRF is in the picogram range but also depends onthe substrate background and sample type with lower limits for very thin films compared
29541
ACPD12, 29535–29569, 2012
Case study CapeVerde Islands
K. W. Fomba et al.
Title Page
Abstract Introduction
Conclusions References
Tables Figures
J I
J I
Back Close
Full Screen / Esc
Printer-friendly Version
Interactive Discussion
Discussion
Paper
|D
iscussionP
aper|
Discussion
Paper
|D
iscussionP
aper|
to powder samples, provided the substrate surface is well polished. The method de-tection limit was estimated as three times the standard deviation (Std.) of the filterblank values (Table 1). For all the analyzed elements, more than 90 % of the sampleshad values that were above the method detection limit. However, the blank subtractionmethod led to uncertainties and estimation errors especially for the first impaction stage5
of about ±25–35 % due to their low mass while uncertainties of about ±7–15 % wasobtained for the other stages with the higher percentage in the lower stages especiallyfor elements with higher method detection limits.
2.3 Back trajectory analysis
Air mass back trajectory footprints for all collected samples were performed to assist in10
the data interpretation. 96-h back trajectories were calculated for every hour within thesample collection interval using the PC version of the NOAA HYSPLIT (Hybrid SingleParticle Lagrangian Integrated Trajectory) model. The model was run in the ensemblemode with a starting height of 500 m above ground level. In the ensemble mode, off-sets are applied to the meteorological field for each member of the trajectory ensemble.15
One meteorological grid point in the horizontal dimension and 0.01 sigma units (approx.250 m) in the vertical dimension were used in this work. The resulting trajectory ensem-ble consists of 27 trajectories for all possible offsets in the x-, y-, and z-dimension. Theair mass history of a 24 h sample is then described by an ensemble of 648 trajecto-ries which provides a better description of the variability in the air mass footprint as20
compared to the single trajectory mode. Via a GIS approach, the meteorological andgeographical data are combined in a database to produce graphical outputs for the airmass footprint. The output then provides information of the estimated air mass resi-dence time over given geographical landscapes, e.g., over natural vegetation, marine,arid, urban, and agricultural areas. These landscapes are usually represented in the25
graphical output with the colors, green, blue, yellow, black and brown, respectively. Fur-ther details on the ensemble procedure and the GIS based approach can be found in(van Pinxteren et al., 2010).
29542

ACPD12, 29535–29569, 2012
Case study CapeVerde Islands
K. W. Fomba et al.
Title Page
Abstract Introduction
Conclusions References
Tables Figures
J I
J I
Back Close
Full Screen / Esc
Printer-friendly Version
Interactive Discussion
Discussion
Paper
|D
iscussionP
aper|
Discussion
Paper
|D
iscussionP
aper|
3 Results and discussion
3.1 Aerosol mass concentration
Figure 2 shows the time series of the aerosol mass concentration measured at CVAOwithin the time period of January 2007 and November 2011. The time interval duringwhich intensive field campaigns and trace metal analysis were performed are high-5
lighted in red with open triangles. Nine intensive field campaigns were performed dur-ing this period. Four of the campaigns were carried out in the winter months betweenDecember and February lasting averagely 6 weeks (i.e. KV II, IV, VI and VII) while therest five were performed in the months of May, June, July and November lasting mostly3 to 4 weeks. Thus a higher amount of samples were collected during the winter months10
as otherwise. In total, 317 samples were collected during the intensive campaigns. Thetemporal variability of the mass concentrations shown in Fig. 2 is indicative of the sea-sonal trends observed in this region with respect to the aerosol particle loading. Asindicated in the figure, during the period between 23 October 2009 and 09 July 2010sampling was done at a height of 4 m on the top of a container due to tower mainte-15
nance. Thus during this period, the aerosol mass was strongly influenced by sea spray.With the exception of the above mentioned time period, the high spikes with mass con-centrations above 100 µg m−3 are mostly indicative of days with Saharan dust outbreakwhich are often observed in the winter months. The low mass concentrations below30 µg m−3 are typical of remote conditions at CVAO and as can be seen from the time20
series, this scenario is representative of about 45 % of the year.The variation in the mass concentrations during remote background conditions were
found to be correlated with the local wind speed. Average local wind speed at CVAOlies at about 7.3±2.2 m s−1 but might increase to >13 m s−1 during stormy periodsleading to variations of up to 30 % in the aerosol mass concentrations. Similar seasonal25
trends in aerosol loading with higher mass concentrations during the winter months incomparison to the summer months were observed in other previous studies in thisregion (Chiapello et al., 1995; Schepanski et al., 2009). This seasonality is attributed to
29543

ACPD12, 29535–29569, 2012
Case study CapeVerde Islands
K. W. Fomba et al.
Title Page
Abstract Introduction
Conclusions References
Tables Figures
J I
J I
Back Close
Full Screen / Esc
Printer-friendly Version
Interactive Discussion
Discussion
Paper
|D
iscussionP
aper|
Discussion
Paper
|D
iscussionP
aper|
the changing location and structure of the subtropical “Azores” high pressure systemwhich resides to the north of Cape Verde. According to Kalnay et al. (1996), the highpressure region in winter is broader and covers a larger region from the Caribbeanto the middle east thus facilitating air mass inflow from the African continent while inthe summer months, the region is narrower and restricted to the central Atlantic ocean5
favoring north-east air mass flow from along Europe and the African coast. Despite thishigh pressure zones, the air mass inflow also changes within the winter periods suchthat air masses from Europe and North America are also observed at CVAO. Thus,the remote scenario considered in this work is not restricted to particular seasons butmainly on the daily and weekly variation of the changing air mass direction observed10
at CVAO.
3.2 Air mass analysis
All 317 collected size-resolved samples were characterized and analyzed for their airmass footprints. 100 of these samples were of remote conditions, that is, strong airmass influence from the Atlantic, Canary Islands, Europe and North America. The15
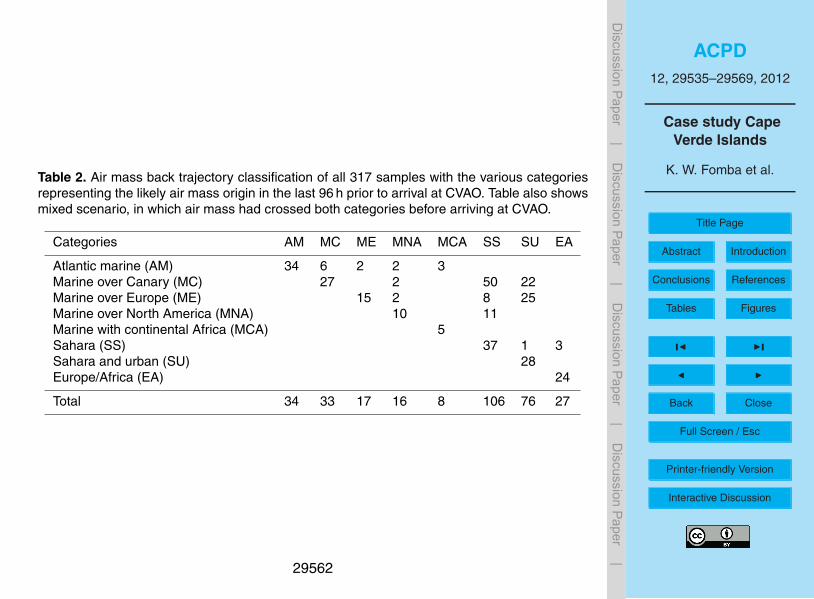
rest of the samples (217) were related to air mass outflow from or linked to the Africancontinent especially through the Saharan Sahel corridor. The larger number of samplesin this regime is justified by the timing during which most campaigns were done. Table 2shows the classification of the samples with respect to their air mass back trajectories.
The trajectory categories were, Atlantic marine (AM), marine over the Canary Islands20
(MC), Marine over Europe (ME), Marine over North America (MNA), Marine with conti-nental Africa (MCA), Saharan dust only (SS), Saharan dust and Urban areas (SU), andlastly Europe and African air mass (EA). The numbers at the bottom of the table rep-resent the total number of times that a given category was observed including mixedsituations, e.g., marine air mass over Europe and the Canary islands. In this study,25
only the results of the 100 samples pertaining to the remote background conditions atCVAO (AM to MNA) will be discussed. Figure 3 shows exemplary back trajectories of
29544
ACPD12, 29535–29569, 2012
Case study CapeVerde Islands
K. W. Fomba et al.
Title Page
Abstract Introduction
Conclusions References
Tables Figures
J I
J I
Back Close
Full Screen / Esc
Printer-friendly Version
Interactive Discussion
Discussion
Paper
|D
iscussionP
aper|
Discussion
Paper
|D
iscussionP
aper|
four days that were representative of the air mass categories AM to MNA. Figure 3a tod represent AM, MC, ME and MNA conditions, respectively.
The Atlantic air masses mostly arrived from the North West direction and were mostof the time associated with low wind speeds (<6 m s−1). The back trajectory analysesreveal that these air masses usually spent little time over urban or arid regions in the5
last 96 h prior to their arrival at CVAO. On the contrary, the marine air masses over theCanary Islands crossed some arid and urban regions prior to their arrival at CVAO. Themarine air mass from Europe had slightly higher wind speeds than both the AM and MCair masses and as shown below were mostly of North East origin. These air massesare also expected to carry fresh anthropogenic emitted particles with them. Lastly, the10
North America marine air masses also came from the North West with higher windspeeds than any of the other air masses, and also carried significant amounts of an-thropogenically emitted particles with them. These four regimes are discussed becausethey are the main air mass regimes that account for the remote marine aerosol con-stitution at CVAO. The regimes as mentioned above have only weak seasonal trends15
with more remote conditions observed in the spring and summer months but no strongseasonal trend as those for mineral dust outbreaks.
3.3 Trace metal concentration
The average concentrations (standard deviations in brackets) of the investigated met-als for the given air mass categories are shown in Table 3. In obtaining the average20
concentrations, 34 samples for the MA, 27 for the MC, 15 for the ME and 10 for theMNA air mass categories were used while the samples pertaining to the mixed sce-narios were not considered. Results show higher variability of the metal concentrations(as shown by the standard deviation values) for MNA air masses in comparison to theothers.25
This difference may be attributed to the high wind speed (>13 m s−1) that is as-sociated with this air mass resulting to a greater mixing of different sorts of aerosols.Higher concentrations of Zn, Cu, Sr, Ba, Rb, and Cr were observed for MNA air masses
29545
ACPD12, 29535–29569, 2012
Case study CapeVerde Islands
K. W. Fomba et al.
Title Page
Abstract Introduction
Conclusions References
Tables Figures
J I
J I
Back Close
Full Screen / Esc
Printer-friendly Version
Interactive Discussion
Discussion
Paper
|D
iscussionP
aper|
Discussion
Paper
|D
iscussionP
aper|
in comparison to the others. The higher wind speed could explain the higher concen-trations of Sr, Ba, and Rb since these elements are also emitted from the oceans andto a very small extend Zn, Cu, and Cr, from particle re-suspension from the surfacewaters (Weisel et al., 1984). However, the higher concentrations of Cu, Cr and Zn aremainly from anthropogenic activities since Zn is a strong surrogate for anthropogenic5
emissions (Wang et al., 2005), e.g., from combustion processes, which are common inNorth America.
The concentrations of other crustal elements such as Fe, Ti, and Mn, were lower forthe MNA but higher for ME and MC air masses. The higher concentrations from theseair masses may be due to the shorter distance the air-parcel traveled prior to arriving at10
CVAO, thereby, enabling an easy transportation of crustal particles over this distance. Asimilar tendency to that of the crustal metals was observed for Se, Ni, and V, with highermass concentrations observed for air-parcels originating from Europe and the Canaryislands in comparison to those from the other directions. For the other investigatedmetals including; Pb, Ce, La, Sc, no significant difference was found between their15
concentrations with respect to the air mass back trajectories implying their values mayrepresent typical background concentrations in this region.
The mean concentrations of Pb in this work were low (<0.2 ng m−3 and ranged from0.01–0.46 ng m−3) in comparison to reported concentrations of other studies but were,however, within the concentration range reported elsewhere for remote conditions.20
Kriews and Schrems (1998) reported median concentrations of 0.32 ng m−3 (0.11–57 ng m−3) for Pb in aerosol samples collected over the Atlantic ocean during the Po-larstern cruise from Bremerhaven to Punta Arenas (Chile). Huang et al. (1996) reportedarithmetic mean concentrations of 0.86 ng m−3 (0.04–3.2 ng m−3) at Bermuda while10 yr earlier Wolff et al. (1986) had reported mean concentration of 3.6 ng m−3 (<0.1–25
8.7 ng m−3) at Bermuda. Witt et al. (2006) reported Pb concentrations of, 0.19 ng m−3
(0.08–27 ng m−3), for remote northern Atlantic and 0.6 ng m−3 (0.15–1.8) ng m−3 for re-mote southern Atlantic during their JCR cruise. The values in this study are in goodagreement with those of Witt et al. (2006) for remote northern Atlantic conditions but
29546
ACPD12, 29535–29569, 2012
Case study CapeVerde Islands
K. W. Fomba et al.
Title Page
Abstract Introduction
Conclusions References
Tables Figures
J I
J I
Back Close
Full Screen / Esc
Printer-friendly Version
Interactive Discussion
Discussion
Paper
|D
iscussionP
aper|
Discussion
Paper
|D
iscussionP
aper|
deviate from those in other remote regions. Comparing the Pb concentrations from airmasses from North America in this work 0.14 ng m−3 (0.05 to 0.23 ng m−3), to thosereported at Bermuda by Haung et al. (1996), it is eminent that there have been a sig-nificant decrease by about a factor of 3 in the Pb emissions from North America overthis time period. This decrease is likely related to the phased-out of leaded gasoline5
and the improvement in technological processes that are related to Pb emissions.In all air mass directions, iron had the highest mean mass concentration
(<12.26 ng m−3) followed by Zn (<3.26 ng m−3), Sr (<2.63 ng m−3), Ti (<0.91 ng m−3),Ni (<0.89 ng m−3), Cu (<0.81 ng m−3), and Cr (<0.53 ng m−3). The lowest concentra-tion was observed for Co (<10 pg m−3), La (<30 pg m−3), and Se (<100 pg m−3). The10
concentrations of the other elements were between these extremes. The obtained con-centration range of these elements is within the same order of magnitude as those re-ported for other remote regions in the Atlantic and other open oceans. Witt et al. (2006)reported mean concentrations and ranges for Cu, 0.7 ng m−3 (0.34–1.42 ng m−3), Ni,0.18 ng m−3 (0.06–0.26 ng m−3), and Zn, 2.56 ng m−3 (0.68–4.48 ng m−3) for remote15
southern Atlantic conditions. For the remote northern Atlantic, concentrations for Cu,0.58 ng m−3 (0.47–0.7 ng m−3), Ni, 0.22 ng m−3 (0.01–0.42 ng m−3), Zn, 2.05 ng m−3
(1.95–2.15 ng m−3 ), and Ba, 0.42 ng m−3 (0.4–0.44 ng m−3) were reported. The con-centrations in this study were in good agreement with those reported by Witt etal. (2006) for remote northern Atlantic conditions. Despite the few data set used by Witt20
et al. (2006) in comparison to those used in this study, the concentration ranges in thetwo studies are within the same order of magnitude. Duce et al. (1983) reported meanconcentrations for remote conditions at Enewetak of 0.04 ng m−3 for Cu, 0.17 ng m−3
for Zn, 0.08 ng m−3 for V, 0.12 ng m−3 for Pb, and 0.16 ng m−3 for Zn. Their mean valueswere generally lower than those obtained in this work but, however, fall within the con-25
centration range observed in this study. Similarly, Spokes et al. (2001) reported slightlyhigher concentrations than those of Duce et al. (1983) for remote marine conditionsat Mace Head but their values are still within the concentration range obtained in thiswork. They found mean concentrations of 1.45 ng m−3 for Pb, 3.87 ng m−3 for Zn, and
29547
ACPD12, 29535–29569, 2012
Case study CapeVerde Islands
K. W. Fomba et al.
Title Page
Abstract Introduction
Conclusions References
Tables Figures
J I
J I
Back Close
Full Screen / Esc
Printer-friendly Version
Interactive Discussion
Discussion
Paper
|D
iscussionP
aper|
Discussion
Paper
|D
iscussionP
aper|
0.66 ng m−3 for Mn. Weller et al. (2008) reported concentrations of 19.0 (±18.0) pg m−3
for Se, 1.6 (±1.3) pg m−3 for Ce and 0.86 (±0.7) pg m−3 for La for remote regions atNeumayer, Antarctica. Their concentrations were lower than those in this work which isexpected due to lower anthropogenic influence in the Antarctica as at CVAO. The val-ues for Fe, Ti and Mn were within the range of values observed by (Buck et al., 2010b)5
during their CLIVAR ship cruise along the Northern tropical Atlantic.Generally, metals from crustal origin were dominant in air masses from Europe and
Canary islands while elements known to be emitted from anthropogenic process suchas Cu, Zn, Cr, Ni, were of long range transport with a higher concentration observedfrom air masses originating from North America.10
In summary, we found reasonable agreement on the data of Pb, Cu, Zn, Se, Ba withthose reported in the literature, however, we observe slightly higher concentrations forNi, Cr, Sr, and lower values for Fe, Mn, Ti, V. Higher Cr, Zn, and Cu concentrationswere observed only in MNA air masses while Fe, Mn, Ti, Ni, V were higher in MEand MC air masses. These results were comparable to other remote marine regions15
in the Pacific or southern Atlantic Ocean but are the first long term results for tracemetal concentrations in remote northern tropical Atlantic marine aerosols. The smallconcentration variations between this work and other reported works, however, can beexplained in terms of the different dominant air mass origins that strongly influence theremote environment. Although there have been other studies of trace metal concentra-20
tion in other remote marine environments as cited above, we are not aware of any longterm studies in the northern Atlantic of size resolved data that would allow assessmentof compositional variability and aerosol solubility studies as in the present work.
3.4 Size resolved analysis
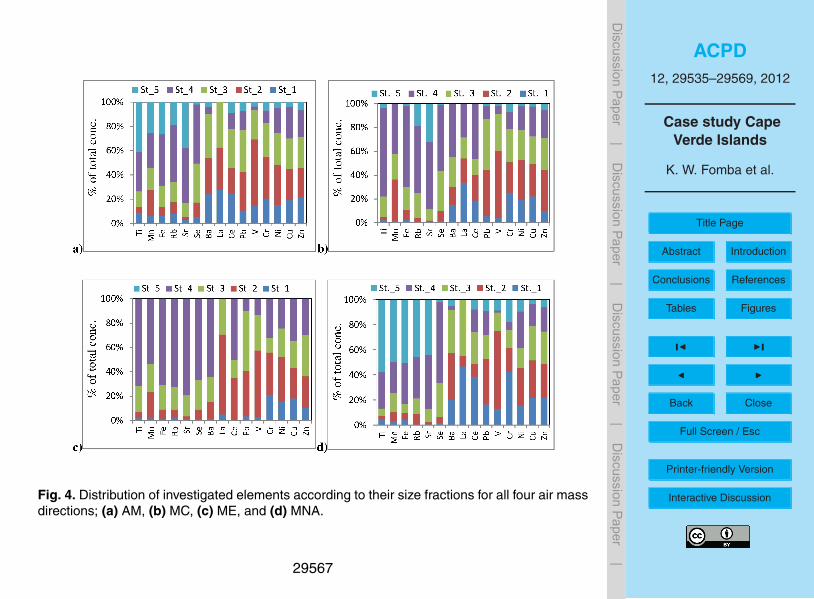
The size-resolved analysis of the investigated metals for the given air mass footprints25
is shown in Fig. 4. Fe, Ti, Sr, Rb, Mn, were mostly found on stages 4 and 5 (1.2–10 µm)implying that most of the mass of these metals originated from a common source of
29548

ACPD12, 29535–29569, 2012
Case study CapeVerde Islands
K. W. Fomba et al.
Title Page
Abstract Introduction
Conclusions References
Tables Figures
J I
J I
Back Close
Full Screen / Esc
Printer-friendly Version
Interactive Discussion
Discussion
Paper
|D
iscussionP
aper|
Discussion
Paper
|D
iscussionP
aper|
coarse aerosol. This tendency was for all of the air mass directions. About 85 % of Sr,40–60 % of Mn, 70–75 % of Fe, Rb, and Ti was present in the coarse mode with a smallincrease in their mass fraction by about 10 % during MNA air mass influence. This in-crease may also be attributed to the high wind speeds usually accompanying this airmass. Despite the prevalence in the larger particles, their presence in the sub-micron5
particles is indicative of the presence of particles from combustion and or industrialsources in addition to re-suspension and frictional process from road traffic. Fine modemanganese may originate from high temperature combustion processes of manganeserich fuels. Ba, La, Ce, were found on all stages with a higher fraction on stages two andthree for La, and on stages four and three for Ba and Ce. This implies that these ele-10
ments were of mixed origin, such as from crustal, oceanic and anthropogenic sources.Vanadium, Cr, Ni, Cu, Zn, and Pb were mostly found in the fine mode, in particular,
on impactor stages 2 and 3 (0.14 µm–0.52 µmm). However, more than 20 % of theirmass was also found in coarse mode particles. Their broad existence is indicative oftheir multiple source origin including a combination of long range transport due to the15
long atmospheric residence time of the sub-micron particles, vehicular, and industrialemissions. With the phased out of leaded gasoline, lead concentrations may likely beof non-automotive sources related to metal industries (Allen et al., 2001; Guieu et al.,2002).
For a few elements, Cr, Ni, Cu and Zn, less than 20 % of their mass was found on20
stage 1 (50–140 nm). The presence of such bioactive trace metals in the submicronparticle range suggest that these metals may be coming from organometallic com-pounds in the ocean as well as from marine colloids (Orellana et al., 2011; Guo etal., 2000) that are known to contain substantial amount of trace metals. Organic com-pounds containing these metals could be released from the ocean’s surface micro-25
layer through blasting of the ocean surface during stormy conditions thereby releasingthem to the atmosphere. Such organic compounds can also be long range transportedfrom the continents. High organic matter concentrations on stage1 were observed inprevious studies at CVAO (Muller et al. 2010). Selenium showed a significant coarse
29549

ACPD12, 29535–29569, 2012
Case study CapeVerde Islands
K. W. Fomba et al.
Title Page
Abstract Introduction
Conclusions References
Tables Figures
J I
J I
Back Close
Full Screen / Esc
Printer-friendly Version
Interactive Discussion
Discussion
Paper
|D
iscussionP
aper|
Discussion
Paper
|D
iscussionP
aper|
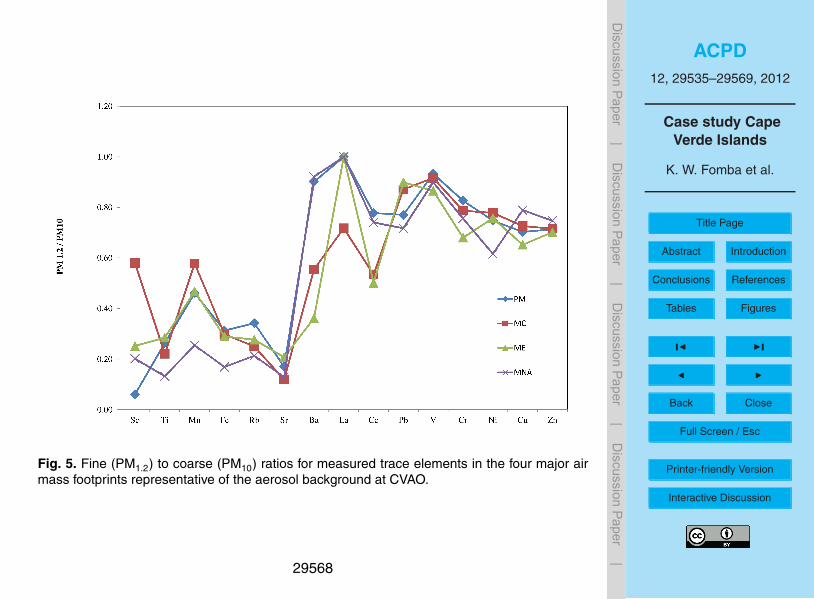
mode fraction. This occurrence may be due to the presence of biogenic material orthe deposition of gaseous forms of Se on coarse particle surfaces. The demarcationbetween the elements present in the fine and coarse mode particles in all air mass cat-egories is better illustrated in Fig. 5 in terms of the PM1.2/PM10 ratio. PM1.2 is obtainedas the sum of the first three impactor stages while PM10 is the sum of all impactor5
stages. The PM1.2/PM10 ratios show a uniform profile for the various air mass origins.The deviations from the pattern are only observed for Mn, Ba, La, and Ce. Most of
the metals were present in the fine mode exhibiting high PM1.2/PM10 ratios especiallyfor V, Cr, Ni, Cu, Zn, and Pb. For Mn, the different tendencies were observed for thedifferent air mass origin implying a significant amount of fine mode Mn particles were10
emitted from air masses originating from Europe and also those crossing the Canaryislands. The variation in the fine to coarse mode ratio for Ba, and Ce in the differentair mass origins imply that these elements had many origins or possessed significantspatial variability. In most cases, the dominantly fine mode metals were concentratedon the second and third impactor stages (0.14–1.2 µm) and can be attributed to long15
range transport. Metals of crustal or oceanic origins such as Ti, Mn, Fe, and Sr showvery low PM1.2/PM10 ratio being indicative of their coarse mode presence.
3.5 Enrichmentent factor analysis
Crustal enrichment factor (EF) analysis was applied to estimate the contributions ofcrustal dust to the obtained elemental concentrations in our samples. For this analysis,20
Ti was used as marker for mineral dust instead of iron since iron has a wider origin inoceanic regions than titanium. Wedepohl (1995) compilation of continental crust com-position was used to calculate enrichment factors and crustal contribution on elementalconcentrations.
For an element (Z) in a sample, the EF relative to Ti is given as:25
EF =(Z/Ti)Sample
(Z/Ti)Crust
(1)
29550

ACPD12, 29535–29569, 2012
Case study CapeVerde Islands
K. W. Fomba et al.
Title Page
Abstract Introduction
Conclusions References
Tables Figures
J I
J I
Back Close
Full Screen / Esc
Printer-friendly Version
Interactive Discussion
Discussion
Paper
|D
iscussionP
aper|
Discussion
Paper
|D
iscussionP
aper|
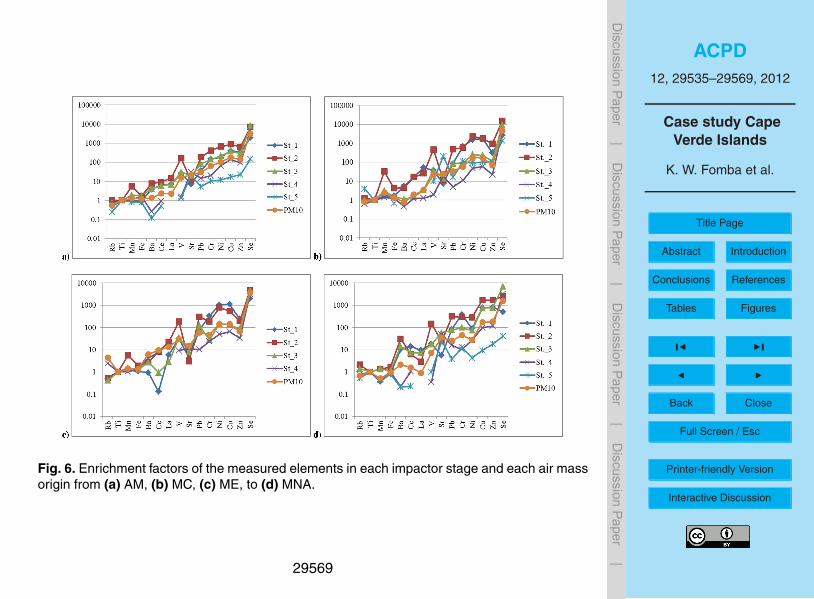
An enrichment factor above 2 is considered as moderate enrichment of the elementand below 0.70 signifies strong depletion in comparison to the composition of the refer-ence source. Enrichment factors between 0.70 and 2 are considered to be similar andwithin the error range to the reference source, implying that the elements with such fac-tors might have originated from such a source. Figure 6 shows the enrichment factors5
with respect to Ti for each size fraction and PM10 for the measured elements in the fourmain air mass directions representative of the remote conditions.
The elemental enrichment factors show similar trends in all four air mass directionswith a reduction in the EF’s with increasing particle size. The coarse particles werethus related to crustal emissions in comparison to the fine mode particles. From the10
elemental enrichment factors, three main groups of element could be observed.
i. Group one elements include Fe, Mn, Co, and Rb. These elements had enrichmentfactors between 0.8 and 2 on most of the stages in all air mass directions. TheirPM10 enrichment factors also lied in this range indicating that these elementsare associated with particles which became airborne by soil dispersion or other15
crustal sources. Mn showed higher EF’s on stages 2 and 3 for the Atlantic marineair masses indicating that other sources than mineral dust could contribute toits presence such as from iron and steel industries (Hacisalihoglu et al., 1991).The release of manganese during smelting and use of methylcyclopentadienylmanganese tricarbonyl as an octane enhancer in unleaded car fuels may partially20
account for enhanced levels of fine mode aerosol manganese seen in pollutedair (Wallace and Slonecker, 1997; Pfeifer et al., 1999). This could be associatedto long range transport from Europe or North America since particles in this sizerange (140 nm to 520 nm, stages 2 and 3) can live longer than 8 days in theatmosphere.25
ii. Group two elements include Ba, Ce, La, Sr, V. These elements had enrichmentfactors between 2 and 20 indicating they were of mixed sources, including crustal,marine or anthropogenic sources. The lower enrichment factors were observed
29551
ACPD12, 29535–29569, 2012
Case study CapeVerde Islands
K. W. Fomba et al.
Title Page
Abstract Introduction
Conclusions References
Tables Figures
J I
J I
Back Close
Full Screen / Esc
Printer-friendly Version
Interactive Discussion
Discussion
Paper
|D
iscussionP
aper|
Discussion
Paper
|D
iscussionP
aper|
mostly in the case of marine air masses (Fig. 6a, b) indicating the elements werelikely of crustal origin while the higher EF were mostly observed in air masses thatcrossed Europe or North America (Fig. 6c, d) before arriving at CVAO indicatingthat these elements were also of anthropogenic origin. The high enrichment factorfor V was mostly observed on the second and third stages. The main source of5
atmospheric non crustal V is residual oil burning (Zoller et al., 1973) and particlesfrom oil burning processes do have long atmospheric life times due to their smallparticles sizes. The high Sr enrichment factors can be attributed to its marine(Weller et al., 2008) sources.
iii. Group three elements include Pb, Cr, Ni, Cu, Zn and Se. These elements had10
very high enrichment factors in all air mass directions. The high values are anindication of strong anthropogenic influence. Atmospheric Pb originates mostlyfrom smelters or from the burning of unleaded fuel. In general, combustion pro-cesses are the major contributors for Pb which is consistent with its dominantpresence in the very fine mode. Despite the phased out of leaded fuel, residual15
levels of Pb in air originating from Pb in gasoline are expected to persist in conti-nental particles for decades (Brewer and Belzer, 2001). Pb can also originate fromre-suspension of crustal material (Wang et al., 2005) thus explaining the lower EFwith decreasing particle size observed for Pb. Ni and Cr are also emitted via com-bustion processes. As observed above their higher enrichment in the fine mode20
is indicative of emissions from combustion processes (Steinsberger et al., 1994).Their occurrence in the coarse mode may be related to natural emissions includ-ing windblown soil, vegetation or to a very small extend sea salt. Road traffichas also been found to contribute to Ni emissions with mean emission factors ofabout 0.07 mg kg−1 in Europe, suggesting that road traffic pollution might not be25
negligible. Similarly, the very high EF for Cu and Zn signifies their anthropogenicorigin. Cu and Zn are elements that are typical of emissions from anthropogenicactivities like fly ash, waste incineration and traffic (Pacyna, 1984; Pacyna andPacyna, 2001). Their enrichment in the coarse mode indicates that the coarse
29552
ACPD12, 29535–29569, 2012
Case study CapeVerde Islands
K. W. Fomba et al.
Title Page
Abstract Introduction
Conclusions References
Tables Figures
J I
J I
Back Close
Full Screen / Esc
Printer-friendly Version
Interactive Discussion
Discussion
Paper
|D
iscussionP
aper|
Discussion
Paper
|D
iscussionP
aper|
mode particles may be originating from lower temperature industrial processes orfrom erosion of Zn rich soils. Cu and Zn may also have oceanic sources espe-cially when associated with marine colloids that may be released from the marinemicrolayer or also from re-suspension (Weisel et al., 1984).
Selenium had the highest enrichment factor in all air mass directions and on all5
impaction stages suggesting that its presence in this region is not related to crustalfractionation or erosion. Coal fired power plants and copper smelters apparently areimportant anthropogenic sources for Se (Germani et al., 1981; Andren et al., 1975)and may contribute to the observed concentrations in this region especially for airmasses that crossed Europe or North America before arriving at CVAO. Other nat-10
ural sources like sea spray (Mosher and Duce, 1987) or volcanoes have also beensuggested (Cunningham and Zoller, 1981). The sea spray could certainly account fora given fraction of the observed concentrations since Se was observed in all air massdirections. However, volcanic sources may be rather negligible since very few activevolcanoes are positioned along the air mass directions observed in the work. In Cape15
Verde, the active volcano of Fogo lies south east of CVAO thus its influence on theremote Se concentrations observed at CVAO may be neglected. It has been postu-lated that heterogeneous reactions are important determinants of Se concentrationsin aerosol particles. According to Mosher and Duce (1983), approximately 10 to 25 %of the Se in nonurban regions resides in the vapor phase and a significant amount of20
the gas phase Se evolve from the ocean with a subsequently occurrence of a gas toparticle conversion in the atmosphere. Although the mechanisms responsible for thisevolution were not specified, they inferred that the processes responsible for the flux ofSe from the ocean to the atmosphere are biologically mediated. Amouroux et al. (2001)showed that the production of gaseous Selenium species coincide with phytoplankton25
blooms responsible for dimethyl sulfide (DMS) emission. They observed that the sul-fur atom in DMS can be substituted by Selenium implying a close correlation betweenDMS and Se. Lately, Weller et al. (2008) observed a significant correlation between Seand the end products of photochemical DMS oxidation, methane sulfonate and non-
29553
ACPD12, 29535–29569, 2012
Case study CapeVerde Islands
K. W. Fomba et al.
Title Page
Abstract Introduction
Conclusions References
Tables Figures
J I
J I
Back Close
Full Screen / Esc
Printer-friendly Version
Interactive Discussion
Discussion
Paper
|D
iscussionP
aper|
Discussion
Paper
|D
iscussionP
aper|
sea salt sulfate, suggesting that atmospheric Se should be closely coupled to the DMSproduction. Conclusively, the enriched Se in the particles can therefore be attributedto oceanic sources for the coarse and fine fraction as well as long range transportedaerosol for the particles in the fine fraction.
4 Conclusions5
Size resolved trace metal concentrations of 15 elements in aerosol particles at CVAOunder remote background conditions were investigated in this study. The identificationof the main air mass origins that influence the remote marine aerosol in the northerntropical Atlantic has been achieved. For this analysis, a total of 100 samples collectedover a four year time period from 2007 to 2011 were used. Our observation revealed10
that remote conditions were representative of 45 % of the year’s aerosol conditions atCVAO while Saharan dust and air mass originating from continental Africa accountedfor the remaining 55 % of the year. The results show very low trace metal concentra-tions as compared to continental trace metal concentrations but, however, fall in thesame order of magnitude as those observed in other remote oceanic regions. Higher15
metal concentrations were observed for air masses that had crossed North Americaor Europe before arriving at CVAO in comparison to Atlantic marine air mass. In gen-eral, the air mass from North America was also associated with high wind speeds(>13 m s−1) leading not only to higher metal concentrations but also to higher aerosolparticle concentration. The size resolved data of the metals show distinct distribution20
of the elements indicating that the particles resulted from disparate processes. In par-ticular, elements from natural sources were primarily associated with coarse particlesalthough other natural sources like oceanic emissions might have also been respon-sible for some fine mode particles. Elements from anthropogenic sources were foundin the fine mode particles. Enrichment factor analysis was performed to evaluate the25
natural opposed to anthropogenic sources of the metals. High enrichment factors wereobserved for Zn, Cu, Ni, Cr, Pb and Se indicating their dominant anthropogenic over
29554
ACPD12, 29535–29569, 2012
Case study CapeVerde Islands
K. W. Fomba et al.
Title Page
Abstract Introduction
Conclusions References
Tables Figures
J I
J I
Back Close
Full Screen / Esc
Printer-friendly Version
Interactive Discussion
Discussion
Paper
|D
iscussionP
aper|
Discussion
Paper
|D
iscussionP
aper|
natural processes. In the case of Se, biogenic sources might have also been important.Elements such as Mn, Fe, Ba, Rb, had low enrichment factors indicating their predom-inant natural source such as soil erosion or sea spray. Our observation over a five yearperiod at CVAO shows that the long range transport from North America as well asEurope play a key role in the supply of essential bioactive metals such as Zn, Co, Cu,5
Fe, Cd into the northern tropical Atlantic ocean which are constantly required for themetabolism of marine microorganisms. With emissions from anthropogenic activitiesdominating the trace metal budget in remote aerosols and thus the life of marine or-ganisms in this region, it is important that caution and consideration are taken whenmaking environmental policies on anthropogenic activities in Europe, Africa and North10
America. These results are expected to be representative of the trace metal contentdeposited to the ocean over this region and may provide useful hints on assessing theimpact of these metals on processes at the ocean surface or water columns via modelstudies.
This work provides the first long term size resolved trace metal studies with a larger15
dataset for remote marine aerosol in the northern tropical Atlantic. These results couldserve as a starting point for initializing model runs and estimating yearly flows of thesemetals in this region of the Atlantic Ocean since these results are representative ofevents that occurred over the last five years with some seasonal trends. Obtainingyearly flows of total and bioavailable aerosol trace metal content in this region would be20
useful in assessing the global input of atmospheric nutrients into the northern tropicalAtlantic
Acknowledgements. The authors would like to thank Helder Timas Nascimento andLuis Mendes Neves for their support during the routine sample collection at the CVAO. Wewould also like to thank the laboratory assistant for their technical support, and the BMBF for25
the financial support through the SOPRAN project.
29555

ACPD12, 29535–29569, 2012
Case study CapeVerde Islands
K. W. Fomba et al.
Title Page
Abstract Introduction
Conclusions References
Tables Figures
J I
J I
Back Close
Full Screen / Esc
Printer-friendly Version
Interactive Discussion
Discussion
Paper
|D
iscussionP
aper|
Discussion
Paper
|D
iscussionP
aper|
References
Allen, A. G., Nemitz, E., Shi, J. P., Harrison, R. M., and Greenwood, J. C.: Size distributions oftrace metals in atmospheric aerosols in the UK, Atmos. Environ., 35, 4581–4591, 2001.
Amouroux, D., Liss, P. S., Tessier, E., Hamren-Larsson, M., and Donard, O. F. X.: Role of oceansas biogenic sources of selenium, Earth Planet Sc. Lett., 189, 277–283, 2001.5
Andren, A. W., Klein, D. H., and Talmi, Y.: Selenium in coal-fired steam plant emissions, Environ.Sci. Technol., 9, 856–858, doi:10.1021/es60107a002, 1975.
Bertine, K. K. and VernonClark, R.: Elemental composition of the colloidal phase isolated bycross-flow filtration from coastal seawater samples, Mar. Chem., 55, 189–204, 1996.
Brewer, R. and Belzer, W.: Assessment of metal concentrations in atmospheric particles from10
Burnaby Lake, British Columbia, Canada, Atmos. Environ., 35, 5223–5233, 2001.Buck, C. S., Landing, W. M., and Resing, J. A.: Particle size and aerosol iron sol-
ubility: A high-resolution analysis of Atlantic aerosols, Mar. Chem., 120, 14–24,doi:10.1016/j.marchem.2008.11.002, 2010a.
Buck, C. S., Landing, W. M., Resing, J. A., and Measures, C. I.: The solubility and de-15
position of aerosol Fe and other trace elements in the North Atlantic Ocean: Observa-tions from the A16N CLIVAR/CO2 repeat hydrography section, Mar. Chem., 120, 57–70,doi:10.1016/j.marchem.2008.08.003, 2010b.
Chiapello, I., Bergametti, G., Gomes, L., Chatenet, B., Dulac, F., Pimenta, J., and Suares, E.S.: An Additional Low Layer Transport of Sahelian and Saharan Dust over the North-Eastern20
Tropical Atlantic, Geophys. Res. Lett., 22, 3191–3194, 1995.Chiapello, I., Bergametti, G., Chatenet, B., Bousquet, P., Dulac, F., and Soares, E. S.: Origins
of African dust transported over the northeastern tropical Atlantic, J. Geophys. Res.-Atmos.,102, 13701–13709, 1997.
Chiapello, I., Prospero, J. M., Herman, J. R., and Hsu, N. C.: Detection of mineral dust over the25
North Atlantic Ocean and Africa with the Nimbus 7 TOMS, J. Geophys. Res.-Atmos., 104,9277–9291, 1999.
Chiapello, I., Moulin, C., and Prospero, J. M.: Understanding the long-term variability of Africandust transport across the Atlantic as recorded in both Barbados surface concentrations andlarge-scale Total Ozone Mapping Spectrometer (TOMS) optical thickness, J. Geophys. Res.-30
Atmos., 110, D18s10 doi:10.1029/2004jd005132, 2005.
29556
ACPD12, 29535–29569, 2012
Case study CapeVerde Islands
K. W. Fomba et al.
Title Page
Abstract Introduction
Conclusions References
Tables Figures
J I
J I
Back Close
Full Screen / Esc
Printer-friendly Version
Interactive Discussion
Discussion
Paper
|D
iscussionP
aper|
Discussion
Paper
|D
iscussionP
aper|
Cunningham, W. C. and Zoller, W. H.: The Chemical-Composition of Remote Area Aerosols, J.Aerosol. Sci., 12, 367–384, 1981.
Duce, R. A., Ray, B. J., Hoffman, G. L., and Walsh, P. R.: Trace-Metal Concentration as aFunction of Particle-Size in Marine Aerosols from Bermuda, Geophys. Res. Lett., 3, 339–342, 1976.5
Duce, R. A., Arimoto, R., Ray, B. J., Unni, C. K., and Harder, P. J.: Atmospheric Trace-Elementsat Enewetak-Atoll .1. Concentrations, Sources, and Temporal Variability, J. Geophys. Res.-Oc. Atm., 88, 5321–5342, 1983.
Duce, R. A., Liss, P. S., Merrill, J. T., Atlas, E. L., Buat-Menard, P., Hicks, B. B., Miller, J. M.,Prospero, J. M., Arimoto, R., Church, T. M., Ellis, W., Galloway, J. N., Hansen, L., Jickells,10
T. D., Knap, A. H., Reinhardt, K. H., Schneider, B., Soudine, A., Tokos, J. J., Tsunogai, S.,Wollast, R., and Zhou, M.: The atmospheric input of trace species to the world ocean, GlobalBiogeochem. Cy., 5, 193–259, doi:10.1029/91gb01778, 1991.
Galloway, J. N., Thornton, J. D., Norton, S. A., Volchok, H. L., and Mclean, R. A. N.: Trace-Metalsin Atmospheric Deposition – a Review and Assessment, Atmos. Environ., 16, 1677–1700,15
1982.Germani, M. S., Small, M., Zoller, W. H., and Moyers, J. L.: Fractionation of Elements during
Copper Smelting, Environ. Sci. Technol., 15, 299–305, 1981.Guieu, C., Loye-Pilot, M. D., Ridame, C., and Thomas, C.: Chemical characterization of the Sa-
haran dust end-member: Some biogeochemical implications for the western Mediterranean20
Sea, J. Geophys. Res.-Atmos., 107, 4258, doi:10.1029/2001jd000582, 2002.Guo, L. D., Santschi, P. H., and Warnken, K. W.: Trace metal composition of colloidal organic
material in marine environments, Mar. Chemi., 70, 257–275, 2000.Hacisalihoglu, G., Balkas, T. I., Tuncel, S. G., Herman, D. H., Olmez, I., and Tuncel, G.: Trace-
Element Composition of the Black-Sea Aerosols, Deep–Sea Res., 38, 1255–1266, 1991.25
Hand, J. L., Mahowald, N. M., Chen, Y., Siefert, R. L., Luo, C., Subramaniam, A., and Fung,I.: Estimates of atmospheric-processed soluble iron from observations and a global min-eral aerosol model: Biogeochemical implications, J. Geophys. Res.-Atmos., 109, D17205,doi:10.1029/2004jd004574, 2004.
Huang, S. L., Arimoto, R., and Rahn, K. A.: Changes in atmospheric lead and other pollution30
elements at Bermuda, J. Geophys. Res.-Atmos., 101, 21033–21040, 1996.
29557
ACPD12, 29535–29569, 2012
Case study CapeVerde Islands
K. W. Fomba et al.
Title Page
Abstract Introduction
Conclusions References
Tables Figures
J I
J I
Back Close
Full Screen / Esc
Printer-friendly Version
Interactive Discussion
Discussion
Paper
|D
iscussionP
aper|
Discussion
Paper
|D
iscussionP
aper|
Johansen, A. M., Siefert, R. L., and Hoffmann, M. R.: Chemical characterization of ambientaerosol collected during the southwest monsoon and intermonsoon seasons over the Ara-bian Sea: Anions and cations, J. Geophys. Res.-Atmos., 104, 26325–26347, 1999.
Kalnay, E., Kanamitsu, M., Kistler, R., Collins, W., Deaven, D., Gandin, L., Iredell, M., Saha, S.,White, G., Woollen, J., Zhu, Y., Chelliah, M., Ebisuzaki, W., Higgins, W., Janowiak, J., Mo,5
K. C., Ropelewski, C., Wang, J., Leetmaa, A., Reynolds, R., Jenne, R., and Joseph, D.: TheNCEP/NCAR 40-year reanalysis project, B. Am. Meteorol. Soc., 77, 437–471, 1996.
Lawler, M. J., Finley, B. D., Keene, W. C., Pszenny, A. A. P., Read, K. A., von Glasow, R.,and Saltzman, E. S.: Pollution-enhanced reactive chlorine chemistry in the eastern tropicalAtlantic boundary layer, Geophys. Res. Lett., 36, L08810, doi:10.1029/2008gl036666, 2009.10
Lee, J. D., McFiggans, G., Allan, J. D., Baker, A. R., Ball, S. M., Benton, A. K., Carpenter, L.J., Commane, R., Finley, B. D., Evans, M., Fuentes, E., Furneaux, K., Goddard, A., Good,N., Hamilton, J. F., Heard, D. E., Herrmann, H., Hollingsworth, A., Hopkins, J. R., Ingham,T., Irwin, M., Jones, C. E., Jones, R. L., Keene, W. C., Lawler, M. J., Lehmann, S., Lewis, A.C., Long, M. S., Mahajan, A., Methven, J., Moller, S. J., Muller, K., Muller, T., Niedermeier,15
N., O’Doherty, S., Oetjen, H., Plane, J. M. C., Pszenny, A. A. P., Read, K. A., Saiz-Lopez,A., Saltzman, E. S., Sander, R., von Glasow, R., Whalley, L., Wiedensohler, A., and Young,D.: Reactive Halogens in the Marine Boundary Layer (RHaMBLe): the tropical North Atlanticexperiments, Atmos. Chem. Phys., 10, 1031–1055, doi:10.5194/acp-10-1031-2010, 2010.
Morel, F. M. M., Milligan, A. J., and Saito, M. A.: 6.05 – Marine Bioinorganic Chemistry: The20
Role of Trace Metals in the Oceanic Cycles of Major Nutrients, in: Treatise on Geochemistry,edited by: Editors-in-Chief: Heinrich, D. H., and Karl, K. T., Pergamon, Oxford, 113–143,2003.
Mosher, B. W. and Duce, R. A.: Vapor phase and particulate selenium in the marine atmo-sphere, J. Geophys. Res., 88, 6761–6768, doi:10.1029/JC088iC11p06761, 1983.25
Mosher, B. W. and Duce, R. A.: A Global Atmospheric Selenium Budget, J. Geophys. Res.-Atmos., 92, 13289–13298, 1987.
Muller, K., Lehmann, S., van Pinxteren, D., Gnauk, T., Niedermeier, N., Wiedensohler, A., andHerrmann, H.: Particle characterization at the Cape Verde atmospheric observatory duringthe 2007 RHaMBLe intensive, Atmos. Chem. Phys., 10, 2709–2721, doi:10.5194/acp-10-30
2709-2010, 2010.
29558
ACPD12, 29535–29569, 2012
Case study CapeVerde Islands
K. W. Fomba et al.
Title Page
Abstract Introduction
Conclusions References
Tables Figures
J I
J I
Back Close
Full Screen / Esc
Printer-friendly Version
Interactive Discussion
Discussion
Paper
|D
iscussionP
aper|
Discussion
Paper
|D
iscussionP
aper|
Orellana, M. V., Matrai, P. A., Leck, C., Rauschenberg, C. D., Lee, A. M., and Coz, E.: Marinemicrogels as a source of cloud condensation nuclei in the high Arctic, P. Natl. Acad. Sci.USA, 108, 13612–13617, doi:10.1073/pnas.1102457108, 2011.
Pacyna, J. M.: Estimation of the Atmospheric Emissions of Trace-Elements from AnthropogenicSources in Europe, Atmos. Environ., 18, 41–50, 1984.5
Pacyna, J. M. and Pacyna, E. G.: An assessment of global and regional emissions of tracemetals to the atmosphere from anthropogenic sources worldwide, Environ. Rev., 9, 269–298, 2001.
Pacyna, E. G., Pacyna, J. M., Fudala, J., Strzelecka-Jastrzab, E., Hlawiczka, S., Panasiuk, D.,Nitter, S., Pregger, T., Pfeiffer, H., and Friedrich, R.: Current and future emissions of selected10
heavy metals to the atmosphere from anthropogenic sources in Europe, Atmos. Environ., 41,8557–8566, doi:10.1016/j.atmosenv.2007.07.040, 2007.
Pfeifer, G. D., Harrison, R. M., and Lynam, D. R.: Personal exposures to airborne metals inLondon taxi drivers and office workers in 1995 and 1996, Sci. Total Environ., 235, 253–260,1999.15
Schepanski, K., Tegen, I., and Macke, A.: Saharan dust transport and deposition towardsthe tropical northern Atlantic, Atmos. Chem. Phys., 9, 1173–1189, doi:10.5194/acp-9-1173-2009, 2009.
Spokes, L., Jickells, T., and Jarvis, K.: Atmospheric inputs of trace metals to the northeastAtlantic Ocean: the importance of southeasterly flow, Mar. Chem., 76, 319–330, 2001.20
Steinsberger, S. C., Dewees, W. G., Bell, A. C., Finken, R. A., Knoll, J. E., and Midgett, M. R.:Development and Validation of the Us-Epa Hexavalent Chromium Source Emissions Mea-surement Method, Fuel Process Technol., 39, 265–276, 1994.
van Pinxteren, D., Bruggemann, E., Gnauk, T., Muller, K., Thiel, C., and Herrmann, H.: A GISbased approach to back trajectory analysis for the source apportionment of aerosol con-25
stituents and its first application, J. Atmos. Chem., 67, 1–28, doi:10.1007/s10874-011-9199-9, 2010.
Wallace, L. and Slonecker, T.: Ambient air concentrations of fine (PM2.5) manganese in USnational parks and in California and Canadian cities: The possible impact of adding MMT tounleaded gasoline, J. Air Waste Manage, 47, 642–652, 1997.30
Wang, X. L., Sato, T., Xing, B. S., Tamamura, S., and Tao, S.: Source identification, size distri-bution and indicator screening of airborne trace metals in Kanazawa, Japan, J. Aerosol. Sci.,36, 197–210, doi:10.1016/j.jaerosci.2004.08.005, 2005.
29559

ACPD12, 29535–29569, 2012
Case study CapeVerde Islands
K. W. Fomba et al.
Title Page
Abstract Introduction
Conclusions References
Tables Figures
J I
J I
Back Close
Full Screen / Esc
Printer-friendly Version
Interactive Discussion
Discussion
Paper
|D
iscussionP
aper|
Discussion
Paper
|D
iscussionP
aper|
Weisel, C. P., Duce, R. A., Fasching, J. L., and Heaton, R. W.: Estimates of the Transport ofTrace-Metals from the Ocean to the Atmosphere, J. Geophys. Res.-Atmos., 89, 1607–1618,1984.
Weller, R., Woltjen, J., Piel, C., Resenberg, R., Wagenbach, D., Konig-Langlo, G., and Kriews,M.: Seasonal variability of crustal and marine trace elements in the aerosol at Neumayer5
station, Antarctica, Tellus B, 60, 742–752, doi:10.1111/j.1600-0889.2008.00372.x, 2008.Witt, M., Baker, A. R., and Jickells, T. D.: Atmospheric trace metals over the At-
lantic and South Indian Oceans: Investigation of metal concentrations and lead iso-tope ratios in coastal and remote marine aerosols, Atmos. Environ., 40, 5435–5451,doi:10.1016/j.atmosenv.2006.04.041, 2006.10
Wolff, G. T., Ruthkosky, M. S., Stroup, D. P., Korsog, P. E., Ferman, M. A., Wendel, G. J.,and Stedman, D. H.: Measurements of Sox, Nox and Aerosol Species on Bermuda, Atmos.Environ., 20, 1229–1239, 1986.
Zoller, W. H., Gordon, G. E., Gladney, E. S., and Jones, A. G.: Sources and Distribution ofVanadium in Atmosphere, Adv. Chem. Ser., 31–47, 1973.15
29560

ACPD12, 29535–29569, 2012
Case study CapeVerde Islands
K. W. Fomba et al.
Title Page
Abstract Introduction
Conclusions References
Tables Figures
J I
J I
Back Close
Full Screen / Esc
Printer-friendly Version
Interactive Discussion
Discussion
Paper
|D
iscussionP
aper|
Discussion
Paper
|D
iscussionP
aper|
Table 1. Average blank values of quartz substrate (n = 75) and filter blank (n = 20) and overallmethod detection limit (MDL). All values are given in ng. Typical sampled volume was 105 m−3.n.d. implies not detected.
Substrate Filter blank MDL
Element Mean Std. Mean Std. 3× Std.
Ti 0.008 0.004 0.043 0.011 0.033V 0.003 0.002 0.011 0.003 0.009Cr 0.005 0.002 0.032 0.028 0.084Mn 0.004 0.002 0.005 0.008 0.024Fe 0.018 0.028 0.45 0.148 0.444Ni 0.004 0.003 0.01 0.012 0.036Cu 0.004 0.005 0.089 0.016 0.048Zn 0.008 0.003 0.166 0.041 0.123Se n.d n.dRb 0.002 0.001 0.004 0.004 0.012Sr 0.005 0.003 0.102 0.031 0.093Ba 0.003 0.001 0.007 0.004 0.012La 0.003 0.004 0.004 0.003 0.009Ce 0.005 0.003 0.007 0.005 0.015Pb 0.006 0.002 0.02 0.019 0.057
29561
ACPD12, 29535–29569, 2012
Case study CapeVerde Islands
K. W. Fomba et al.
Title Page
Abstract Introduction
Conclusions References
Tables Figures
J I
J I
Back Close
Full Screen / Esc
Printer-friendly Version
Interactive Discussion
Discussion
Paper
|D
iscussionP
aper|
Discussion
Paper
|D
iscussionP
aper|
Table 2. Air mass back trajectory classification of all 317 samples with the various categoriesrepresenting the likely air mass origin in the last 96 h prior to arrival at CVAO. Table also showsmixed scenario, in which air mass had crossed both categories before arriving at CVAO.
Categories AM MC ME MNA MCA SS SU EA
Atlantic marine (AM) 34 6 2 2 3Marine over Canary (MC) 27 2 50 22Marine over Europe (ME) 15 2 8 25Marine over North America (MNA) 10 11Marine with continental Africa (MCA) 5Sahara (SS) 37 1 3Sahara and urban (SU) 28Europe/Africa (EA) 24
Total 34 33 17 16 8 106 76 27
29562

ACPD12, 29535–29569, 2012
Case study CapeVerde Islands
K. W. Fomba et al.
Title Page
Abstract Introduction
Conclusions References
Tables Figures
J I
J I
Back Close
Full Screen / Esc
Printer-friendly Version
Interactive Discussion
Discussion
Paper
|D
iscussionP
aper|
Discussion
Paper
|D
iscussionP
aper|
Table 3. Average (standard deviation), minimum, and maximum PM10 trace metal concentra-tion at CVAO under remote conditions for the various air mass origins. Samples with mixedscenarios were not considered in obtaining the average values. Values are given in ng m−3 .Range shows the lowest and highest concentrations measured in all the samples irrespectiveof their air mass origin. Reported column represent mean concentrations and their reportedranges in brackets.
AM MC ME MNA Range Reported
Ti 0.53 (0.72) 0.85 (0.6) 0.91 (0.99) 0.62 (0.27) 0.05–3.17 (0.81–6.02)d
V 0.14 (0.19) 0.31 (0.2) 0.31 (0.27) 0.13 (0.14) 0.01–0.82 (0.45–1.27)d
Cr 0.37 (0.24) 0.49 (0.22) 0.31 (0.22) 0.53 (0.27) 0.01–0.99 0.09 (0.03–0.39)c
Mn 0.12 (0.18) 0.35 (0.19) 0.21 (0.15) 0.09 (0.07) 0.00–0.81 (0.01–1.27)d
Fe 6.39 (7.1) 11.38 (6.41) 12.26 (10.4) 9.88 (7.32) 0.1–25.89 (1.4–24.45)d
Ni 0.32 (0.32) 0.89 (0.36) 0.64 (0.43) 0.47 (0.29) 0.01–1.5 0.18 (0.06–0.26)a
Cu 0.43 (0.38) 0.57 (0.26) 0.47 (0.31) 0.81 (0.41) 0.03–1.17 0.7 (0.34–1.42)a
Zn 1.23 (1.19) 1.01 (0.51) 0.89 (0.46) 3.23 (1.61) 0.05–4.77 2.56 (0.68–4.48)a
Se 0.06 (0.04) 0.1 (0.05) 0.08 (0.05) 0.04 (0.02) 0.01–0.2 0.019 (0.018)b
Rb 0.01 (0.01) 0.02 (0.02) 0.01 (0.02) 0.03 (0.02) 0.00–0.05 0.12 (0.04–0.46)c
Sr 1.14 (1.56) 2.09 (0.24) 0.66 (0.49) 2.63 (1.83) 0.01–9.25 0.29 (0.27)b
Ba 0.15 (0.27) 0.14 (0.1) 0.16 (0.16) 0.47 (0.35) 0.01–0.93 0.15 (0.05–0.25)a
La 0.01 (0.01) 0.03 (0.03) 0.02 (0.01) 0.01 (0.01) 0.00–0.1 0.00086 (0.0007)b
Ce 0.03 (0.02) 0.03 (0.04) 0.02 (0.03) 0.03 (0.03) 0.00–0.14 0.0016 (0.0013) b
Pb 0.09 (0.09) 0.15 (0.11) 0.2 (0.19) 0.14 (0.07) 0.01–0.46 0.6 (0.15–1.8) a
a Witt et al. (2006) b Weller et al. (2008) c Duce et al. (1983) d Buck et al. (2008).
29563
ACPD12, 29535–29569, 2012
Case study CapeVerde Islands
K. W. Fomba et al.
Title Page
Abstract Introduction
Conclusions References
Tables Figures
J I
J I
Back Close
Full Screen / Esc
Printer-friendly Version
Interactive Discussion
Discussion
Paper
|D
iscussionP
aper|
Discussion
Paper
|D
iscussionP
aper|
Fig. 1. CVAO station situated at the coastline of the Sao Vicente Island in the northern tropicalAtlantic with clear view of the 30 m high measurement tower, some measurement containersand a wind turbine for subsidizing electrical energy.
29564

ACPD12, 29535–29569, 2012
Case study CapeVerde Islands
K. W. Fomba et al.
Title Page
Abstract Introduction
Conclusions References
Tables Figures
J I
J I
Back Close
Full Screen / Esc
Printer-friendly Version
Interactive Discussion
Discussion
Paper
|D
iscussionP
aper|
Discussion
Paper
|D
iscussionP
aper|
Fig. 2. Time series of PM10 mass concentration at CVAO from January 2007 to November 2011.Red lines with open triangles represent periods of intensive field measurements (9 in totallabeled KV I to KV IX).
29565

ACPD12, 29535–29569, 2012
Case study CapeVerde Islands
K. W. Fomba et al.
Title Page
Abstract Introduction
Conclusions References
Tables Figures
J I
J I
Back Close
Full Screen / Esc
Printer-friendly Version
Interactive Discussion
Discussion
Paper
|D
iscussionP
aper|
Discussion
Paper
|D
iscussionP
aper|
Fig. 3. Examples of 96 h air mass back trajectory ensembles arriving at CVAO. The blue, yellow,green and brown colors represent ocean, arid, vegetation and continental landscapes, respec-tively. (A) 2 May 2011: Atlantic marine, (B) 24 May 2009: Marine over Canary Islands. (C)4 June 2007: Marine from Europe, (D) 2 Feburary 2009: marine air mass from North America.
29566
ACPD12, 29535–29569, 2012
Case study CapeVerde Islands
K. W. Fomba et al.
Title Page
Abstract Introduction
Conclusions References
Tables Figures
J I
J I
Back Close
Full Screen / Esc
Printer-friendly Version
Interactive Discussion
Discussion
Paper
|D
iscussionP
aper|
Discussion
Paper
|D
iscussionP
aper|
Fig. 4. Distribution of investigated elements according to their size fractions for all four air massdirections; (a) AM, (b) MC, (c) ME, and (d) MNA.
29567
ACPD12, 29535–29569, 2012
Case study CapeVerde Islands
K. W. Fomba et al.
Title Page
Abstract Introduction
Conclusions References
Tables Figures
J I
J I
Back Close
Full Screen / Esc
Printer-friendly Version
Interactive Discussion
Discussion
Paper
|D
iscussionP
aper|
Discussion
Paper
|D
iscussionP
aper|
Fig. 5. Fine (PM1.2) to coarse (PM10) ratios for measured trace elements in the four major airmass footprints representative of the aerosol background at CVAO.
29568
ACPD12, 29535–29569, 2012
Case study CapeVerde Islands
K. W. Fomba et al.
Title Page
Abstract Introduction
Conclusions References
Tables Figures
J I
J I
Back Close
Full Screen / Esc
Printer-friendly Version
Interactive Discussion
Discussion
Paper
|D
iscussionP
aper|
Discussion
Paper
|D
iscussionP
aper|
Fig. 6. Enrichment factors of the measured elements in each impactor stage and each air massorigin from (a) AM, (b) MC, (c) ME, to (d) MNA.
29569