Camlin Fine Sciences Ltd - Axis Direct
20
Camlin Fine Sciences Ltd
-
Upload
khangminh22 -
Category
Documents
-
view
2 -
download
0
Transcript of Camlin Fine Sciences Ltd - Axis Direct
APCOTEX Limited
Camlin Fine Sciences Ltd
Axis Annual Analysis
20th September 2021
BUY
Target Price
215
Camlin Fine Sciences Ltd. Specialty Chemicals
1
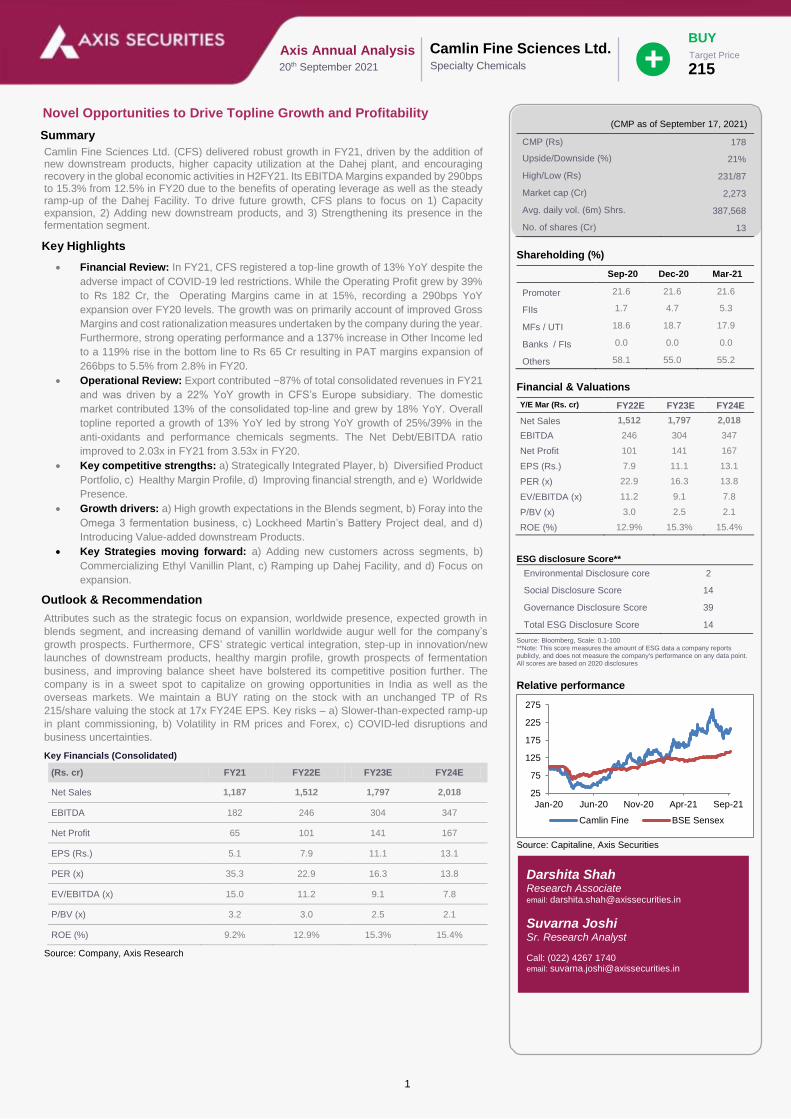
Novel Opportunities to Drive Topline Growth and Profitability
Summary
Camlin Fine Sciences Ltd. (CFS) delivered robust growth in FY21, driven by the addition of new downstream products, higher capacity utilization at the Dahej plant, and encouraging recovery in the global economic activities in H2FY21. Its EBITDA Margins expanded by 290bps to 15.3% from 12.5% in FY20 due to the benefits of operating leverage as well as the steady ramp-up of the Dahej Facility. To drive future growth, CFS plans to focus on 1) Capacity expansion, 2) Adding new downstream products, and 3) Strengthening its presence in the fermentation segment.
Key Highlights
Financial Review: In FY21, CFS registered a top-line growth of 13% YoY despite the
adverse impact of COVID-19 led restrictions. While the Operating Profit grew by 39%
to Rs 182 Cr, the Operating Margins came in at 15%, recording a 290bps YoY
expansion over FY20 levels. The growth was on primarily account of improved Gross
Margins and cost rationalization measures undertaken by the company during the year.
Furthermore, strong operating performance and a 137% increase in Other Income led
to a 119% rise in the bottom line to Rs 65 Cr resulting in PAT margins expansion of
266bps to 5.5% from 2.8% in FY20.
Operational Review: Export contributed ~87% of total consolidated revenues in FY21
and was driven by a 22% YoY growth in CFS’s Europe subsidiary. The domestic
market contributed 13% of the consolidated top-line and grew by 18% YoY. Overall
topline reported a growth of 13% YoY led by strong YoY growth of 25%/39% in the
anti-oxidants and performance chemicals segments. The Net Debt/EBITDA ratio
improved to 2.03x in FY21 from 3.53x in FY20.
Key competitive strengths: a) Strategically Integrated Player, b) Diversified Product
Portfolio, c) Healthy Margin Profile, d) Improving financial strength, and e) Worldwide
Presence.
Growth drivers: a) High growth expectations in the Blends segment, b) Foray into the
Omega 3 fermentation business, c) Lockheed Martin’s Battery Project deal, and d)
Introducing Value-added downstream Products.
Key Strategies moving forward: a) Adding new customers across segments, b)
Commercializing Ethyl Vanillin Plant, c) Ramping up Dahej Facility, and d) Focus on
expansion.
OOutlook & Recommendation
Attributes such as the strategic focus on expansion, worldwide presence, expected growth in
blends segment, and increasing demand of vanillin worldwide augur well for the company’s
growth prospects. Furthermore, CFS’ strategic vertical integration, step-up in innovation/new
launches of downstream products, healthy margin profile, growth prospects of fermentation
business, and improving balance sheet have bolstered its competitive position further. The
company is in a sweet spot to capitalize on growing opportunities in India as well as the
overseas markets. We maintain a BUY rating on the stock with an unchanged TP of Rs
215/share valuing the stock at 17x FY24E EPS. Key risks – a) Slower-than-expected ramp-up
in plant commissioning, b) Volatility in RM prices and Forex, c) COVID-led disruptions and
business uncertainties.
Key Financials (Consolidated)
(Rs. cr) FY21 FY22E FY23E FY24E
Net Sales 1,187 1,512 1,797 2,018
EBITDA 182 246 304 347
Net Profit 65 101 141 167
EPS (Rs.) 5.1 7.9 11.1 13.1
PER (x) 35.3 22.9 16.3 13.8
EV/EBITDA (x) 15.0 11.2 9.1 7.8
P/BV (x) 3.2 3.0 2.5 2.1
ROE (%) 9.2% 12.9% 15.3% 15.4%
Source: Company, Axis Research
(CMP as of September 17, 2021)
CMP (Rs) 178
Upside/Downside (%) 21%
High/Low (Rs) 231/87
Market cap (Cr) 2,273
Avg. daily vol. (6m) Shrs. 387,568
No. of shares (Cr) 13
Shareholding (%)
Sep-20 Dec-20 Mar-21
Promoter 21.6 21.6 21.6
FIIs 1.7 4.7 5.3
MFs / UTI 18.6 18.7 17.9
Banks / FIs 0.0 0.0 0.0
Others 58.1 55.0 55.2
Financial & Valuations
Y/E Mar (Rs. cr) FY22E FY23E FY24E
Net Sales 1,512 1,797 2,018
EBITDA 246 304 347
Net Profit 101 141 167
EPS (Rs.) 7.9 11.1 13.1
PER (x) 22.9 16.3 13.8
EV/EBITDA (x) 11.2 9.1 7.8
P/BV (x) 3.0 2.5 2.1
ROE (%) 12.9% 15.3% 15.4%
ESG disclosure Score**
Environmental Disclosure core 2
Social Disclosure Score 14
Governance Disclosure Score 39
Total ESG Disclosure Score 14
Source: Bloomberg, Scale: 0.1-100 **Note: This score measures the amount of ESG data a company reports publicly, and does not measure the company's performance on any data point. All scores are based on 2020 disclosures
Relative performance
Source: Capitaline, Axis Securities
25
75
125
175
225
275
Jan-20 Jun-20 Nov-20 Apr-21 Sep-21
Camlin Fine BSE Sensex
Darshita Shah Research Associate email: [email protected]
Suvarna Joshi Sr. Research Analyst
Call: (022) 4267 1740 email: [email protected]

2
FY21 - Performance round-up
Camlin Fine Sciences (CFS) was formed after de-merging the fine chemical business of Kokoyu Camlin (erstwhile Camlin Ltd) in 2006.
The company is vertically integrated and engages in research, development, manufacturing, commercializing, and marketing of specialty
chemicals and blends. Its products find applications in a wide array of sectors such as food, feed and pet nutrition, pharma,
petrochemicals, polymers, flavours and fragrances, agrochemicals, dyes and pigments, and biodiesel, among others. The business can
be categorised into 3 different verticals based on the product profile namely a) Shelf Life Solutions, b) Performance Chemicals, c) Aromas
Chemicals, and d) Health and Wellness Segment.
Encouraging revenue growth: The revenue for FY21 stood at Rs 1,187 Cr, registering a growth of 13% YoY. This was led by a
25% growth in the Anti-Oxidants segment and a 39% growth in the performance chemicals segment driven by higher hydroquinone
sales in CFS Europe.
Excellent Operating Profit growth: The operating profit grew by a robust 39% on a YoY basis to Rs 182 Cr as a result of the
commercialization of the Dahej Facility and cost savings. High growth in Operating Profits resulted in 290bps YoY expansion in
EBITDA Margins to 15%.
Improved bottom line: PAT was reported at Rs 65 Cr, registering a 119% YoY growth on account of strong operating performance,
13% drop in the interest costs, and 45% rise in Other Income.
Segmental Performance
Revenue by Segments
CFS’s revenues is contributed by 3 verticals namely, a) Shelf Life Solutions which consists of the Anti-oxidants segment and Blends Segment, b) Performance Chemicals, Aromas Chemicals, and c) Health & Wellness segment.
Shelf Life Solutions (53% Revenue): The Shelf Life Solutions segment is further subdivided into Anti-oxidants and Blends. The
anti-oxidants segment grew by 25% YoY and contributed 25% to the top-line while blends grew by 6% YoY, contributing 28% to the
top-line. The Shelf Life Solutions business for India and the rest of the Asian markets was quite stable during the year. The company
has successfully increased its distribution network and plans to widen the product basket to the application industries using its
antioxidants. Also, the company intends to launch new products from this division in FY22 for various food and beverage industries
to cater to the Asia Pacific markets.
Performance Chemicals (29% Revenue): While the overall global demand for Performance Chemicals plummeted in FY21 due to
pandemic, hampering its performance, CFS Europe provided positive results with higher hydroquinone sales in FY21. The
company’s vertical integration continued to provide a competitive edge with a steady supply of its products all over the world. It
attained a historic milestone with the expansion of Hydroquinone and Catechol capacity at Dahej in 2020. The expansion has
coincided with the rapidly increasing needs of industries such as Petrochemicals, Polymers, Agrochemicals, Dyes, and Pigments
that will be high-performance gainers in the near future and will contribute to the fast-growing demand for high-quality additives for
food and feed globally.
Aromas Chemicals (17% Revenue): The Company supplied vanillin to clients in several continents and won key accounts with
reputed companies in Europe, Brazil, Asia and the Middle East. The division also catered to leading and popular chocolate & cocoa
product firms, various flavour & fragrance houses, and many other global taste & nutrition solutions companies.
Health & Wellness Segment (1% Revenue): CFS would continue to actively promote its product portfolio to cater to the growing
population’s aspires to live a healthy lifestyle. The company has already approved the strategic investment in AlgalR NutraPharms
(AlgalR) by way of acquisition. AlgalR uses exclusive fermentation-based technology for manufacturing Omega-3 acids from algal.
sources. Compared to fish oil, it has the advantage of being sustainable, clean as well as vegetarian.
Exhibit 1: Segment-wise Contribution
Particulars
Shelf Life Solutions Performance Chemicals
Aromas Chemicals
Health & Wellness Segment
Total Anti-Oxidants Blends
FY21 Revenue (Rs in Cr) 296 332 202 344 12 1187
% to top-line 25% 28% 29% 17% 1% 100%
FY20 Revenue (Rs in Cr) 238 314 247 202 49 1049
% to top-line 23% 30% 24% 19% 5% 100%
Growth (% YoY) 25% 6% 39% 17% (76%) 13%
Source: Company, Axis Research
3
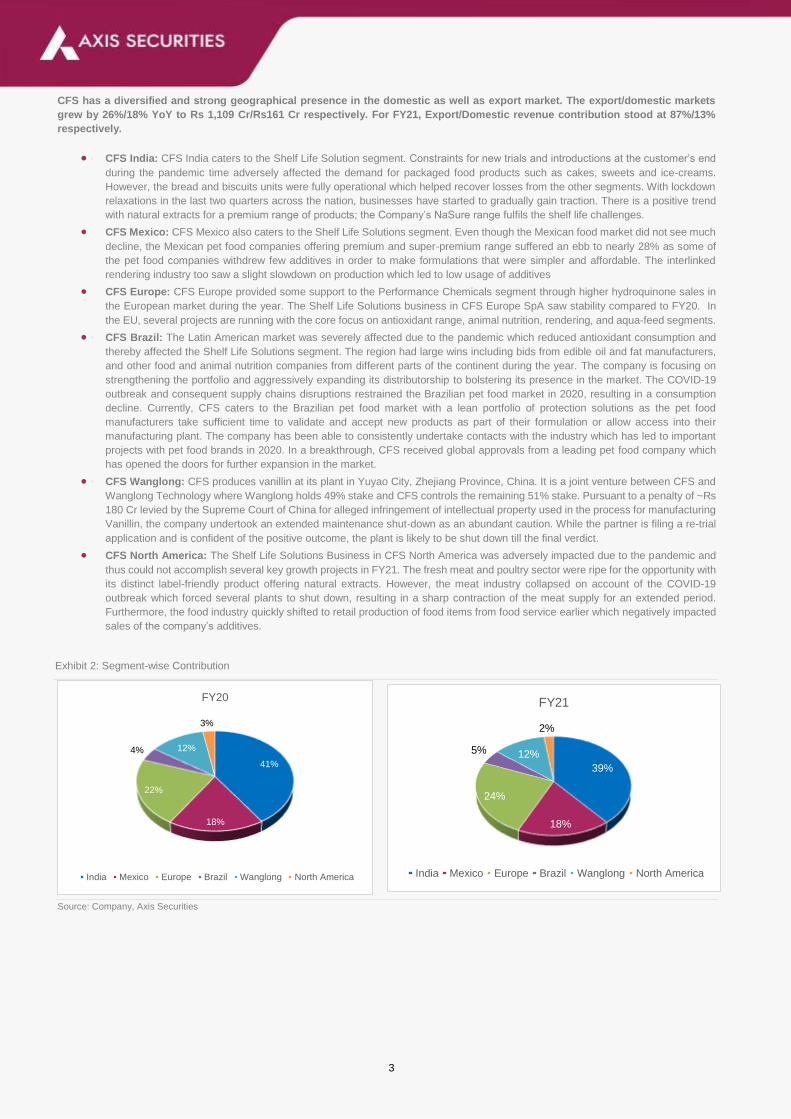
CFS has a diversified and strong geographical presence in the domestic as well as export market. The export/domestic markets
grew by 26%/18% YoY to Rs 1,109 Cr/Rs161 Cr respectively. For FY21, Export/Domestic revenue contribution stood at 87%/13%
respectively.
CFS India: CFS India caters to the Shelf Life Solution segment. Constraints for new trials and introductions at the customer’s end
during the pandemic time adversely affected the demand for packaged food products such as cakes, sweets and ice-creams.
However, the bread and biscuits units were fully operational which helped recover losses from the other segments. With lockdown
relaxations in the last two quarters across the nation, businesses have started to gradually gain traction. There is a positive trend
with natural extracts for a premium range of products; the Company’s NaSure range fulfils the shelf life challenges.
CFS Mexico: CFS Mexico also caters to the Shelf Life Solutions segment. Even though the Mexican food market did not see much
decline, the Mexican pet food companies offering premium and super-premium range suffered an ebb to nearly 28% as some of
the pet food companies withdrew few additives in order to make formulations that were simpler and affordable. The interlinked
rendering industry too saw a slight slowdown on production which led to low usage of additives
CFS Europe: CFS Europe provided some support to the Performance Chemicals segment through higher hydroquinone sales in
the European market during the year. The Shelf Life Solutions business in CFS Europe SpA saw stability compared to FY20. In
the EU, several projects are running with the core focus on antioxidant range, animal nutrition, rendering, and aqua-feed segments.
CFS Brazil: The Latin American market was severely affected due to the pandemic which reduced antioxidant consumption and
thereby affected the Shelf Life Solutions segment. The region had large wins including bids from edible oil and fat manufacturers,
and other food and animal nutrition companies from different parts of the continent during the year. The company is focusing on
strengthening the portfolio and aggressively expanding its distributorship to bolstering its presence in the market. The COVID-19
outbreak and consequent supply chains disruptions restrained the Brazilian pet food market in 2020, resulting in a consumption
decline. Currently, CFS caters to the Brazilian pet food market with a lean portfolio of protection solutions as the pet food
manufacturers take sufficient time to validate and accept new products as part of their formulation or allow access into their
manufacturing plant. The company has been able to consistently undertake contacts with the industry which has led to important
projects with pet food brands in 2020. In a breakthrough, CFS received global approvals from a leading pet food company which
has opened the doors for further expansion in the market.
CFS Wanglong: CFS produces vanillin at its plant in Yuyao City, Zhejiang Province, China. It is a joint venture between CFS and
Wanglong Technology where Wanglong holds 49% stake and CFS controls the remaining 51% stake. Pursuant to a penalty of ~Rs
180 Cr levied by the Supreme Court of China for alleged infringement of intellectual property used in the process for manufacturing
Vanillin, the company undertook an extended maintenance shut‐down as an abundant caution. While the partner is filing a re-trial
application and is confident of the positive outcome, the plant is likely to be shut down till the final verdict.
CFS North America: The Shelf Life Solutions Business in CFS North America was adversely impacted due to the pandemic and
thus could not accomplish several key growth projects in FY21. The fresh meat and poultry sector were ripe for the opportunity with
its distinct label-friendly product offering natural extracts. However, the meat industry collapsed on account of the COVID-19
outbreak which forced several plants to shut down, resulting in a sharp contraction of the meat supply for an extended period.
Furthermore, the food industry quickly shifted to retail production of food items from food service earlier which negatively impacted
sales of the company’s additives.
Exhibit 2: Segment-wise Contribution
Source: Company, Axis Securities
41%
18%
22%
4% 12%
3%
FY20
India Mexico Europe Brazil Wanglong North America
39%
18%
24%
5% 12%
2%
FY21
India Mexico Europe Brazil Wanglong North America
4
Key operational activities during the year
Capex plans
During FY21, the consolidated Capex was Rs 204 which primarily included capitalization on account of Dahej Diphenol Plant of Rs
183 Cr.
The Dahej Diphenol Capex was a greenfield expansion to add a capacity of 10,000 MTPA for manufacturing diphenols such as
Hydroquinone and Catechol which are major raw materials and the downstream products.
Additionally, a Capex of Rs 185 Cr was undertaken to set up an additional multi-purpose plant with a capacity of 6,000 MTPA to
manufacture Guaiacol (raw material for Vanillin), Vanillin, Ethyl Vanillin, Methyl Vanillin and its derivatives to ramp up the revenues
of the aromas segment, making the facility entirely integrated. In FY21, the capital work in progress included Rs 124 Cr for the
Vanillin plant. Capex is expected to commercialize in Q1FY23.
The company’s FY22 Capex plans of ~Rs 75 Cr are targeted to all projects for downstream products.
Strategic Capital Re-Allocation
During FY21, Infinity Holdings decided to invest Rs 170 Cr which is to be utilized as growth capital for future expansion and
enhancement of the company’s operations.
The investment was through allotment of 35,500,000 warrants, wherein each warrant is convertible into one equity share of the
face value of Rs 1/- each.
Key competitive strengths
Strategically Integrated Player: The company is a backward integrated player through its facility in Italy and recently commissioned
Dahej facility that manufactures di-phenols. CFS is thus the 2nd largest and lowest-cost producer of Hydroquinone and Catechol and is
the 3rd largest producer of Vanillin in the world. CFS gains a significant cost advantage over peers as it can strategically procure raw
materials from the Dahej plant at competitive rates and thereby produce more downstream products cost-effectively. The integration will
also help the company in gaining further control over the price and availability of the raw materials and gradually reduce dependence on
the Italian plant.
Worldwide Presence: CFS has a global presence through its subsidiaries across various geographies, enabling its to acquire a diverse
set of customers and deliver value-added and customized services, products and technological upgrade. In a business like blends,
customization plays an important role due to clients’ varying requirements, thereby having a worldwide presence enables CFS to serve
its existing clients well while onboarding more clients under its fold by leveraging its expertise. The taste and fragrance preferences differ
in different geographies and having a widespread presence coupled with a deep market-specific knowledge help CFS in providing value-
added solutions based on unique regional requirements.
Improving Financial Strength: The company’s Net Debt/EBITDA ratio improved to 2.0 in FY21 from 3.5 in FY20 led by strong bottom-
line performance as well as debt repayment. Furthermore, its ROE/ROCE rose to 9.2%/11.3% in FY21 from 6.4%/10.2% in FY20, implying
the company’s consistently improving financial strength.
Healthy Margin Profile: The EBITDA Margin expanded by 287bps on a YoY basis to 15.3% in FY21 post commercialization of the Dahej
facility. The company’s efforts in process reengineering, process and yield improvements, technological up-gradation, and other cost-
saving measures resulted in cost optimization which further pushed up the EBITDA Margins.
Key Growth Drivers
Blends segment expected to deliver high Growth: The Blends segment, though impacted due to COVID-19 disruptions, is expected
to report healthy growth of over 20% moving forward. The blends business uniquely involves customization based on clients’ requirements
which require physical presence to the client office or plant, which places the company in a sweet spot due to its global presence. With
the blends business picking up across geographies in America (North and South), South East Asian countries, the management aims to
grow the segment at a 25%+ in FY23 with the targeted market share of 30%.
Entering the Omega 3 Fermentation Business: CFS acquired AlagalR NutraPharms – an India-based manufacturer of nutritional lipids
or omega-3 fatty acids through the fermentation process, which significantly reduces the burden on marine life. This business is expected
to be a long-term driver for the company considering market size and a limited number of players that procure Omega 3 from algae.
Lockheed Martin Project: CFS also has a strategic tie-up with Lockheed Martin – a US-based company that is working on innovative
technologies to unlock the full potential of green energy of flow batteries to store renewable energy. CFS would be supplying the key raw
material for this project and an association with Lockheed Martin would aid CFS in developing sustainable products that will benefit the
environment at large.
Introducing value-added downstream products: The successful commercialization of the Diphenol plant at Dahej is expected to be
the stepping stone for the second phase of the company’s growth as it will aid in widening the downstream product portfolio. The company
aims to use Hydroquinone (HQ) for captive consumption and production of margin-accretive downstream products instead of selling it in
the open market.
5
Key R&D Highlights
In FY21, the company’s R&D Centre focused on numerous products and process improvements for all its business verticals with a
pipeline of developments leaning towards Performance Chemicals and Shelf Life Solutions.
CFS India developed a green and commercially viable product with one of its antioxidants for industrial production and has also
begun work on newer antioxidant developments both synthetic and plant-based. In addition, the development of products for the
bakery and snack food industries are at commercial phases and have been focused on developing products for the animal nutrition
industry to promote the growth and health of birds (poultry).
To expand its current offering to the biodiesel industry, the R&D team at CFS Brazil is working jointly with a technological firm in
Argentina for commercializing few innovative products.
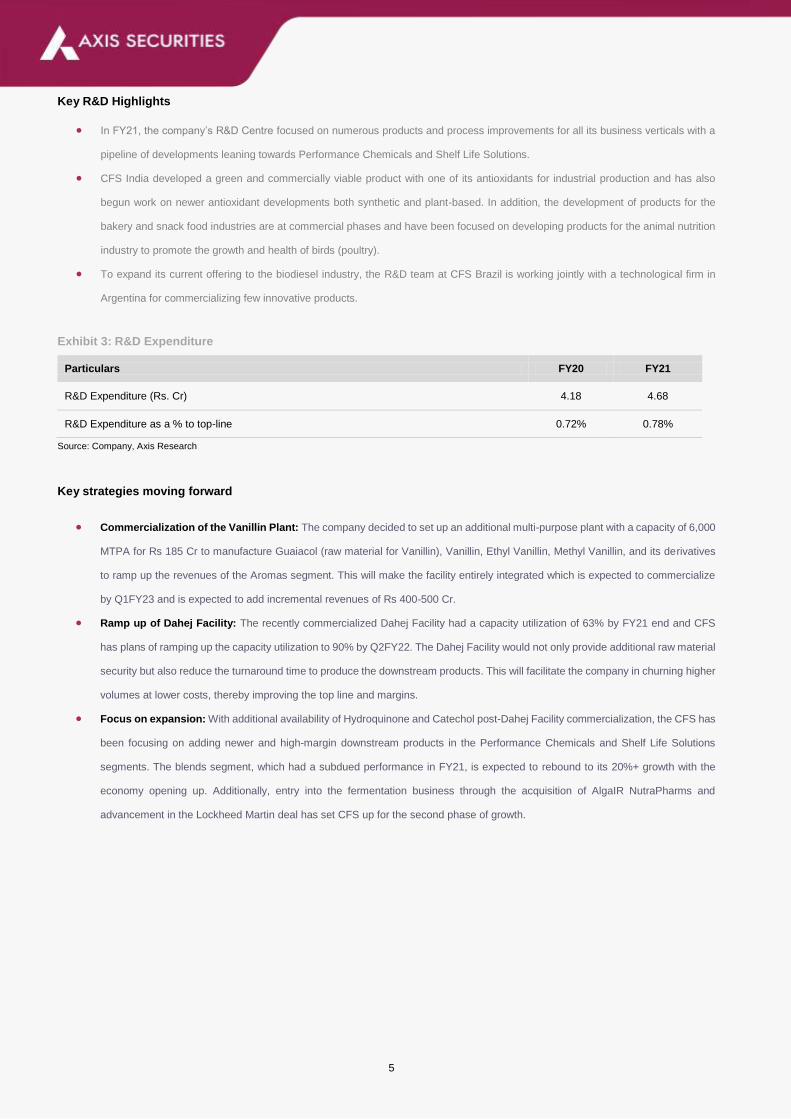
Exhibit 3: R&D Expenditure
Particulars FY20 FY21
R&D Expenditure (Rs. Cr) 4.18 4.68
R&D Expenditure as a % to top-line 0.72% 0.78%
Source: Company, Axis Research
Key strategies moving forward
Commercialization of the Vanillin Plant: The company decided to set up an additional multi-purpose plant with a capacity of 6,000
MTPA for Rs 185 Cr to manufacture Guaiacol (raw material for Vanillin), Vanillin, Ethyl Vanillin, Methyl Vanillin, and its derivatives
to ramp up the revenues of the Aromas segment. This will make the facility entirely integrated which is expected to commercialize
by Q1FY23 and is expected to add incremental revenues of Rs 400-500 Cr.
Ramp up of Dahej Facility: The recently commercialized Dahej Facility had a capacity utilization of 63% by FY21 end and CFS
has plans of ramping up the capacity utilization to 90% by Q2FY22. The Dahej Facility would not only provide additional raw material
security but also reduce the turnaround time to produce the downstream products. This will facilitate the company in churning higher
volumes at lower costs, thereby improving the top line and margins.
Focus on expansion: With additional availability of Hydroquinone and Catechol post-Dahej Facility commercialization, the CFS has
been focusing on adding newer and high-margin downstream products in the Performance Chemicals and Shelf Life Solutions
segments. The blends segment, which had a subdued performance in FY21, is expected to rebound to its 20%+ growth with the
economy opening up. Additionally, entry into the fermentation business through the acquisition of AlgaIR NutraPharms and
advancement in the Lockheed Martin deal has set CFS up for the second phase of growth.
6
Sustainability: ESG score
CFS has carefully adopted operations, raw materials sourcing, product portfolio expansion and practices that are friendly from an
environmental and social perspective. The company is also proactively working towards sourcing clean energy from wind energy farms with
a capacity of 1.25 MW. This renewable energy could replace up to 20% of the existing grid power supply. CFS has initiated various ESG
initiatives with an objective to:
Safeguard employee well being by enabling work-from-home amidst the pandemic
Focus on ‘sustainable solutions’ for food wastage
Undertake energy conservation measures
Augment environment-friendly technologies
Pursue strategic collaboration for renewable energy sources
Enhance the well-being of the community
Risks & Mitigation
The company maintains a strategic approach to risk management and approaches it cautiously to reap its rewards and accelerate growth.
Currency Fluctuation: The company’s operations expose it to foreign currency risk, affecting its financial position and cash flows.
The company mitigates this risk through an effective forex management policy. Furthermore, the company being the net exporter
on the currency front judicially uses a natural hedge provided by exports against imports.
Margin Sustainability: The inflationary pressure on the raw materials can affect the margins, thereby affecting the company’s
profitability. The company regularly and closely monitors manufacturing costs to ensure operating margins are maintained. It
undertakes process reengineering, process improvements, yield improvements, technological up-gradation and other cost-saving
measures to optimize overall manufacturing costs.
Government Policies: Lack of clarity on future Government policies continues to be an area of major concern for the industry. The
exact impact of this cannot be assessed until the proposed changes are introduced and implemented.
COVID-19 Pandemic: Any disruption in the economic activities on account of the COVID-19 resurgence may impact raw material
manufacturers, customers, or operational sites partially or fully. Due to the nature of the pandemic, it is uncertain to predict the
impact of COVID-19 in the near future.
7
Financial Statement Analysis
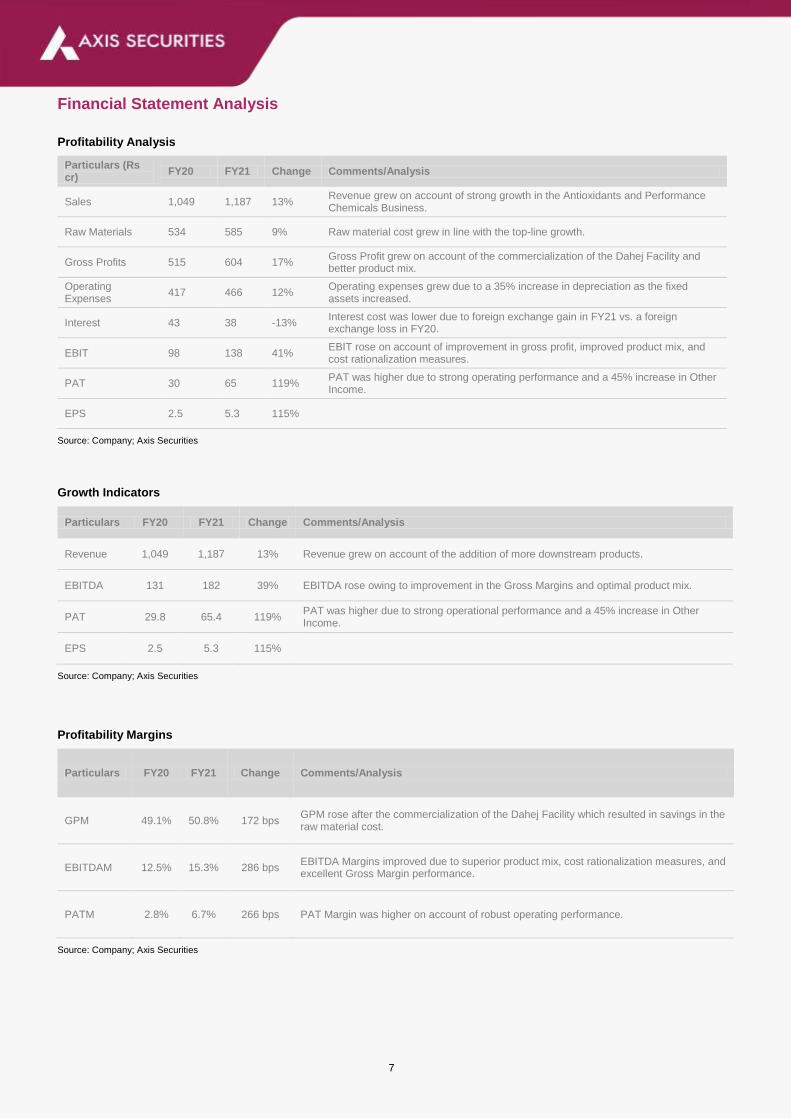
Profitability Analysis
Particulars (Rs cr)
FY20 FY21 Change Comments/Analysis
Sales 1,049 1,187 13% Revenue grew on account of strong growth in the Antioxidants and Performance Chemicals Business.
Raw Materials 534 585 9% Raw material cost grew in line with the top-line growth.
Gross Profits 515 604 17% Gross Profit grew on account of the commercialization of the Dahej Facility and better product mix.
Operating Expenses
417 466 12% Operating expenses grew due to a 35% increase in depreciation as the fixed assets increased.
Interest 43 38 -13% Interest cost was lower due to foreign exchange gain in FY21 vs. a foreign exchange loss in FY20.
EBIT 98 138 41% EBIT rose on account of improvement in gross profit, improved product mix, and cost rationalization measures.
PAT 30 65 119% PAT was higher due to strong operating performance and a 45% increase in Other Income.
EPS 2.5 5.3 115%
Source: Company; Axis Securities
Growth Indicators
Particulars FY20 FY21 Change Comments/Analysis
Revenue 1,049 1,187 13% Revenue grew on account of the addition of more downstream products.
EBITDA 131 182 39% EBITDA rose owing to improvement in the Gross Margins and optimal product mix.
PAT 29.8 65.4 119% PAT was higher due to strong operational performance and a 45% increase in Other Income.
EPS 2.5 5.3 115%
Source: Company; Axis Securities
Profitability Margins
Particulars FY20 FY21 Change Comments/Analysis
GPM 49.1% 50.8% 172 bps GPM rose after the commercialization of the Dahej Facility which resulted in savings in the raw material cost.
EBITDAM 12.5% 15.3% 286 bps EBITDA Margins improved due to superior product mix, cost rationalization measures, and excellent Gross Margin performance.
PATM 2.8% 6.7% 266 bps PAT Margin was higher on account of robust operating performance.
Source: Company; Axis Securities
8
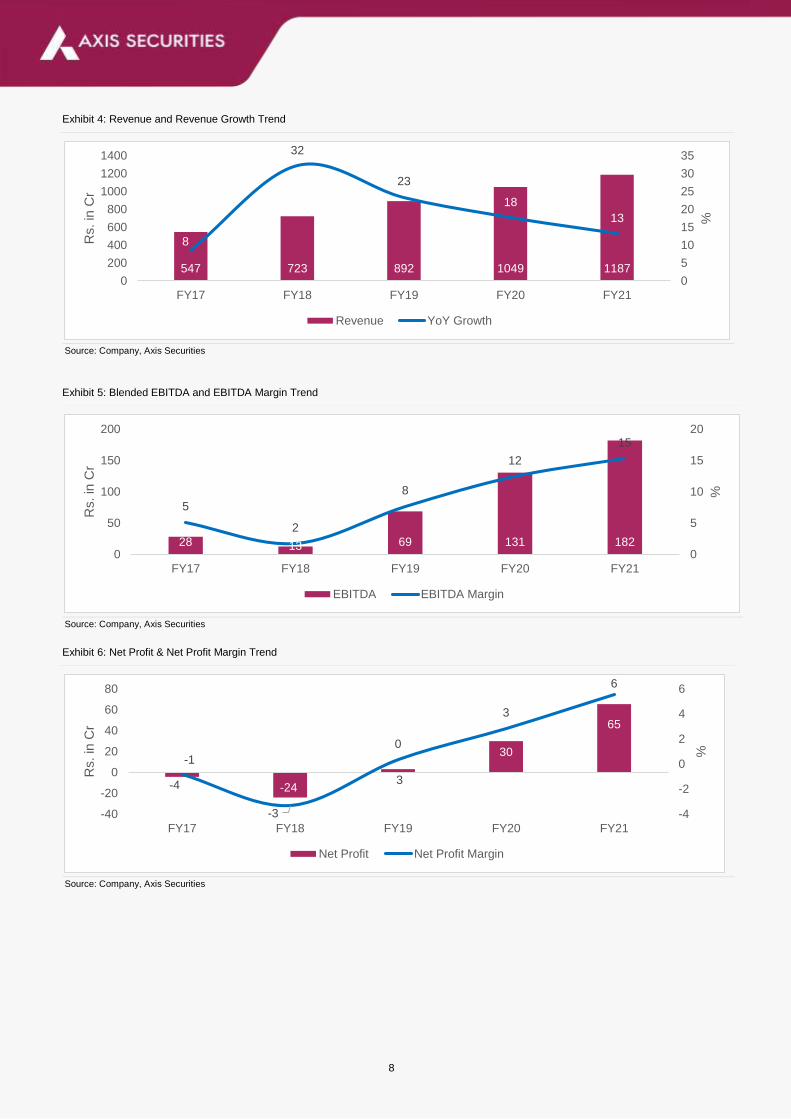
Exhibit 4: Revenue and Revenue Growth Trend
Source: Company, Axis Securities
Exhibit 5: Blended EBITDA and EBITDA Margin Trend
Source: Company, Axis Securities
Exhibit 6: Net Profit & Net Profit Margin Trend
Source: Company, Axis Securities
547 723 892 1049 1187
8
32
23
18
13
0
5
10
15
20
25
30
35
0
200
400
600
800
1000
1200
1400
FY17 FY18 FY19 FY20 FY21
%
Rs. in
Cr
Revenue YoY Growth
28 13 69 131 182
5
2
8
12
15
0
5
10
15
20
0
50
100
150
200
FY17 FY18 FY19 FY20 FY21
%
Rs. in
Cr
EBITDA EBITDA Margin
-4 -243
30
65
-1
-3
0
3
6
-4
-2
0
2
4
6
-40
-20
0
20
40
60
80
FY17 FY18 FY19 FY20 FY21
%
Rs. in
Cr
Net Profit Net Profit Margin
9
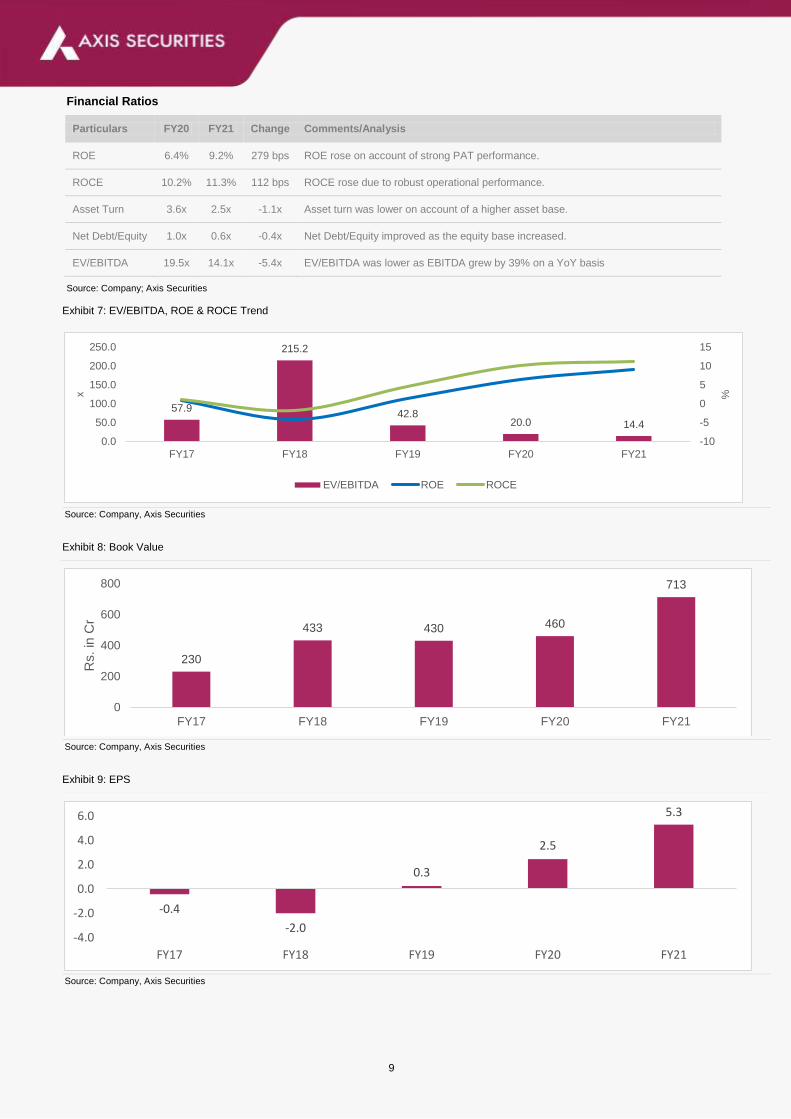
Financial Ratios
Particulars FY20 FY21 Change Comments/Analysis
ROE 6.4% 9.2% 279 bps ROE rose on account of strong PAT performance.
ROCE 10.2% 11.3% 112 bps ROCE rose due to robust operational performance.
Asset Turn 3.6x 2.5x -1.1x Asset turn was lower on account of a higher asset base.
Net Debt/Equity 1.0x 0.6x -0.4x Net Debt/Equity improved as the equity base increased.
EV/EBITDA 19.5x 14.1x -5.4x EV/EBITDA was lower as EBITDA grew by 39% on a YoY basis
Source: Company; Axis Securities
Exhibit 7: EV/EBITDA, ROE & ROCE Trend
Source: Company, Axis Securities
Exhibit 8: Book Value
Source: Company, Axis Securities
Exhibit 9: EPS
Source: Company, Axis Securities
57.9
215.2
42.820.0 14.4
-10
-5
0
5
10
15
0.0
50.0
100.0
150.0
200.0
250.0
FY17 FY18 FY19 FY20 FY21
%x
EV/EBITDA ROE ROCE
230
433 430 460
713
0
200
400
600
800
FY17 FY18 FY19 FY20 FY21
Rs. in
Cr
-0.4
-2.0
0.3
2.5
5.3
-4.0
-2.0
0.0
2.0
4.0
6.0
FY17 FY18 FY19 FY20 FY21
10
Key Balance Sheet Takeaways
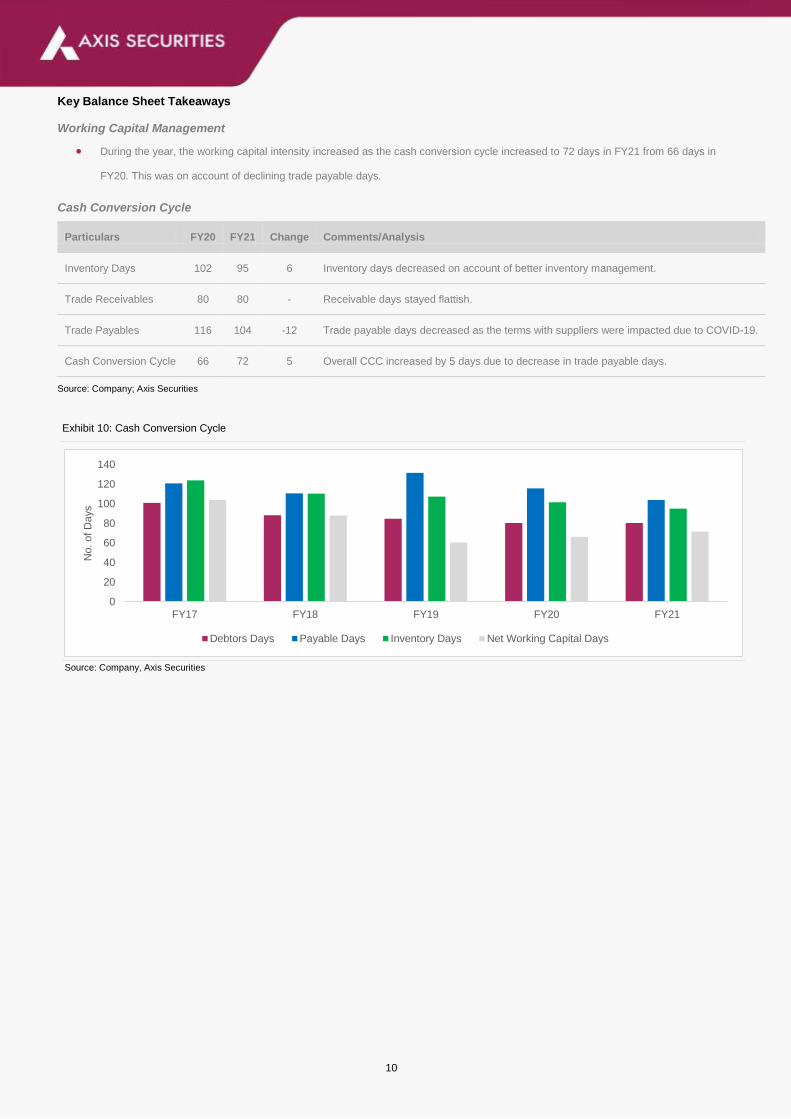
Working Capital Management
During the year, the working capital intensity increased as the cash conversion cycle increased to 72 days in FY21 from 66 days in
FY20. This was on account of declining trade payable days.
Cash Conversion Cycle
Particulars FY20 FY21 Change Comments/Analysis
Inventory Days 102 95 6 Inventory days decreased on account of better inventory management.
Trade Receivables 80 80 - Receivable days stayed flattish.
Trade Payables 116 104 -12 Trade payable days decreased as the terms with suppliers were impacted due to COVID-19.
Cash Conversion Cycle 66 72 5 Overall CCC increased by 5 days due to decrease in trade payable days.
Source: Company; Axis Securities
Exhibit 10: Cash Conversion Cycle
Source: Company, Axis Securities
0
20
40
60
80
100
120
140
FY17 FY18 FY19 FY20 FY21
No. of D
ays
Debtors Days Payable Days Inventory Days Net Working Capital Days
11
Key Balance Sheet Takeaways (Cont…)
Debt Levels: The company’s debt remained flat at Rs 490 Cr while net Debt/EBITDA improved to 2.03x in FY21from 3.53x in FY20.
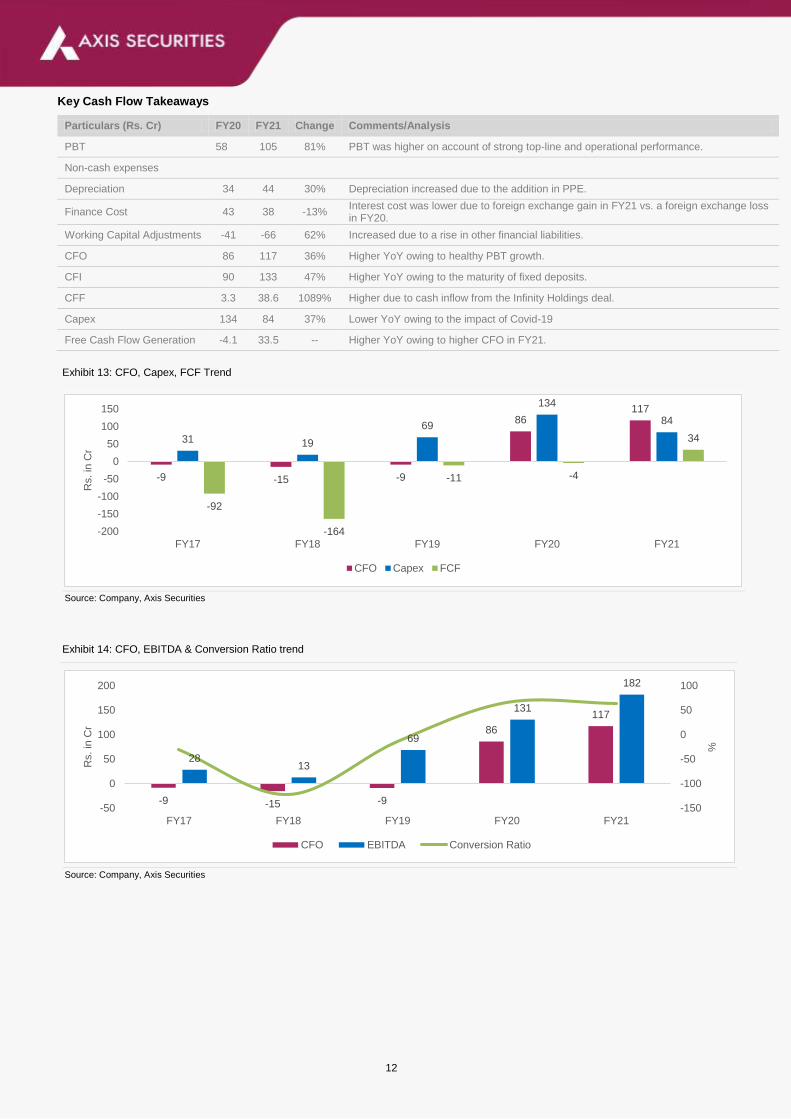
Gross Block: Gross Block rose by 103% from Rs 310Cr in FY20 to Rs 630Cr in FY21 on account of the capitalization of the Dahej
Diphenol facility.
Capex plans: A Capex of Rs 185 Cr was undertaken to set up an additional multi-purpose plant having a capacity of 6,000 MTPA
to manufacture Guaiacol (raw material for Vanillin), Vanillin, Ethyl Vanillin, Methyl Vanillin, and its derivatives to grow the Aromas
segment’s revenues as well as to make the facility completely integrated. The said plant is expected to be commercialized in Q1FY23.
The company also has Capex plans for FY22 including all projects for downstream products in the range of Rs 75 Cr.
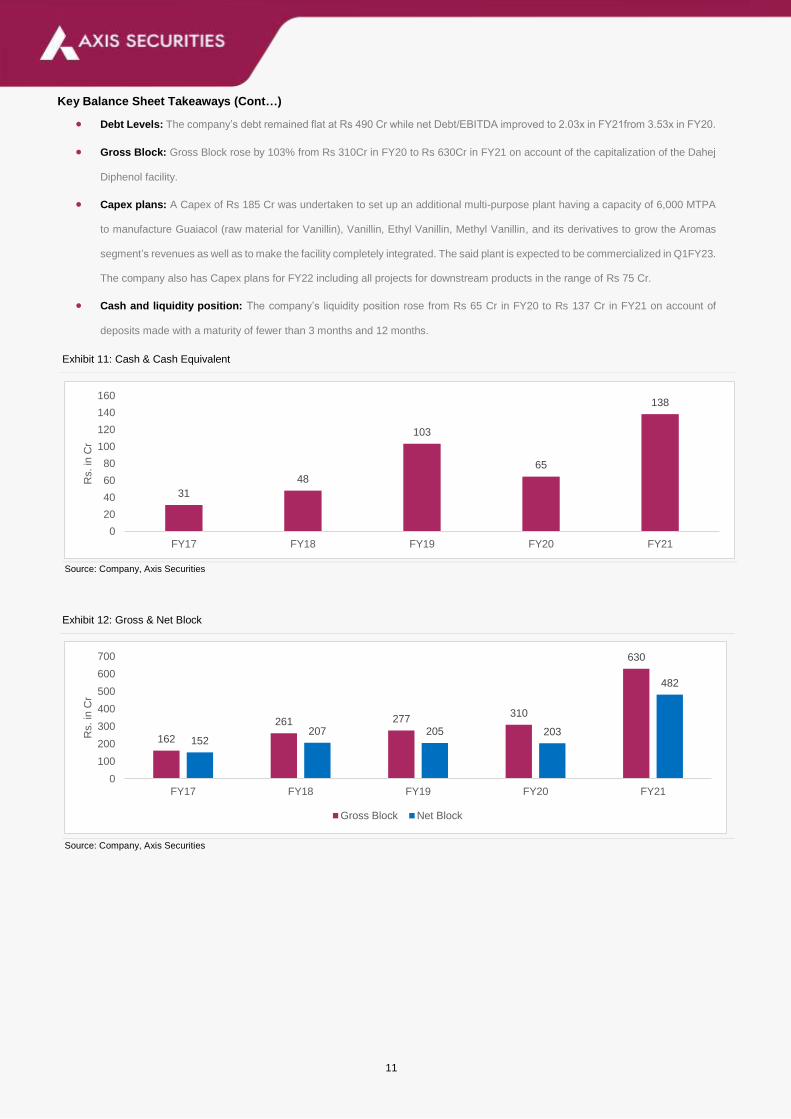
Cash and liquidity position: The company’s liquidity position rose from Rs 65 Cr in FY20 to Rs 137 Cr in FY21 on account of
deposits made with a maturity of fewer than 3 months and 12 months.
Exhibit 11: Cash & Cash Equivalent
Source: Company, Axis Securities
Exhibit 12: Gross & Net Block
Source: Company, Axis Securities
31
48
103
65
138
0
20
40
60
80
100
120
140
160
FY17 FY18 FY19 FY20 FY21
Rs. in
Cr
162
261 277310
630
152207 205 203
482
0
100
200
300
400
500
600
700
FY17 FY18 FY19 FY20 FY21
Rs. in
Cr
Gross Block Net Block
12
Key Cash Flow Takeaways
Particulars (Rs. Cr) FY20 FY21 Change Comments/Analysis
PBT 58 105 81% PBT was higher on account of strong top-line and operational performance.
Non-cash expenses
Depreciation 34 44 30% Depreciation increased due to the addition in PPE.
Finance Cost 43 38 -13% Interest cost was lower due to foreign exchange gain in FY21 vs. a foreign exchange loss in FY20.
Working Capital Adjustments -41 -66 62% Increased due to a rise in other financial liabilities.
CFO 86 117 36% Higher YoY owing to healthy PBT growth.
CFI 90 133 47% Higher YoY owing to the maturity of fixed deposits.
CFF 3.3 38.6 1089% Higher due to cash inflow from the Infinity Holdings deal.
Capex 134 84 37% Lower YoY owing to the impact of Covid-19
Free Cash Flow Generation -4.1 33.5 -- Higher YoY owing to higher CFO in FY21.
Exhibit 13: CFO, Capex, FCF Trend
Source: Company, Axis Securities
Exhibit 14: CFO, EBITDA & Conversion Ratio trend
Source: Company, Axis Securities
-9 -15 -9
86117
31 19
69
134
84
-92
-164
-11 -4
34
-200
-150
-100
-50
0
50
100
150
FY17 FY18 FY19 FY20 FY21
Rs. in
Cr
CFO Capex FCF
-9 -15 -9
86
117
2813
69
131
182
-150
-100
-50
0
50
100
-50
0
50
100
150
200
FY17 FY18 FY19 FY20 FY21
%
Rs. in
Cr
CFO EBITDA Conversion Ratio
13
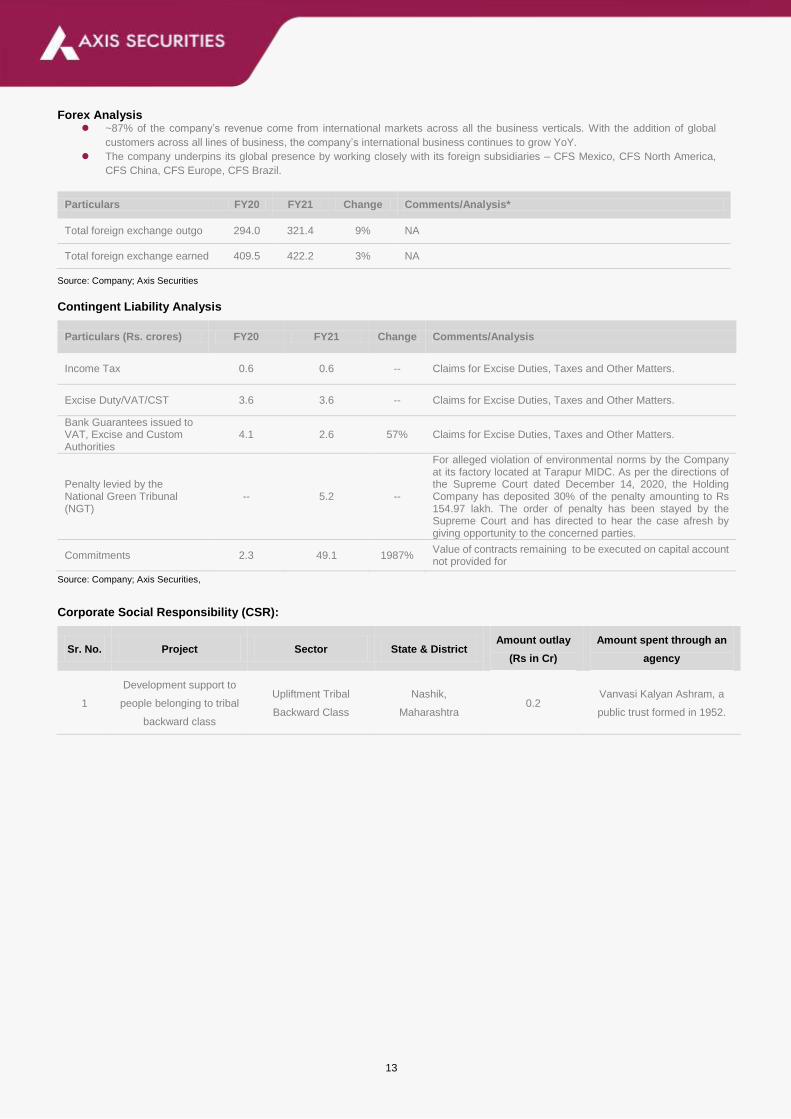
Forex Analysis
~87% of the company’s revenue come from international markets across all the business verticals. With the addition of global
customers across all lines of business, the company’s international business continues to grow YoY.
The company underpins its global presence by working closely with its foreign subsidiaries – CFS Mexico, CFS North America,
CFS China, CFS Europe, CFS Brazil.
Particulars FY20 FY21 Change Comments/Analysis*
Total foreign exchange outgo 294.0 321.4 9% NA
Total foreign exchange earned 409.5 422.2 3% NA
Source: Company; Axis Securities
Contingent Liability Analysis
Particulars (Rs. crores) FY20 FY21 Change Comments/Analysis
Income Tax 0.6 0.6 -- Claims for Excise Duties, Taxes and Other Matters.
Excise Duty/VAT/CST 3.6 3.6 -- Claims for Excise Duties, Taxes and Other Matters.
Bank Guarantees issued to VAT, Excise and Custom Authorities
4.1 2.6 57% Claims for Excise Duties, Taxes and Other Matters.
Penalty levied by the National Green Tribunal (NGT)
-- 5.2 --
For alleged violation of environmental norms by the Company at its factory located at Tarapur MIDC. As per the directions of the Supreme Court dated December 14, 2020, the Holding Company has deposited 30% of the penalty amounting to Rs 154.97 lakh. The order of penalty has been stayed by the Supreme Court and has directed to hear the case afresh by giving opportunity to the concerned parties.
Commitments 2.3 49.1 1987% Value of contracts remaining to be executed on capital account not provided for
Source: Company; Axis Securities,
Corporate Social Responsibility (CSR):
Sr. No. Project Sector State & District Amount outlay
(Rs in Cr)
Amount spent through an
agency
1
Development support to
people belonging to tribal
backward class
Upliftment Tribal
Backward Class
Nashik,
Maharashtra 0.2
Vanvasi Kalyan Ashram, a
public trust formed in 1952.
14
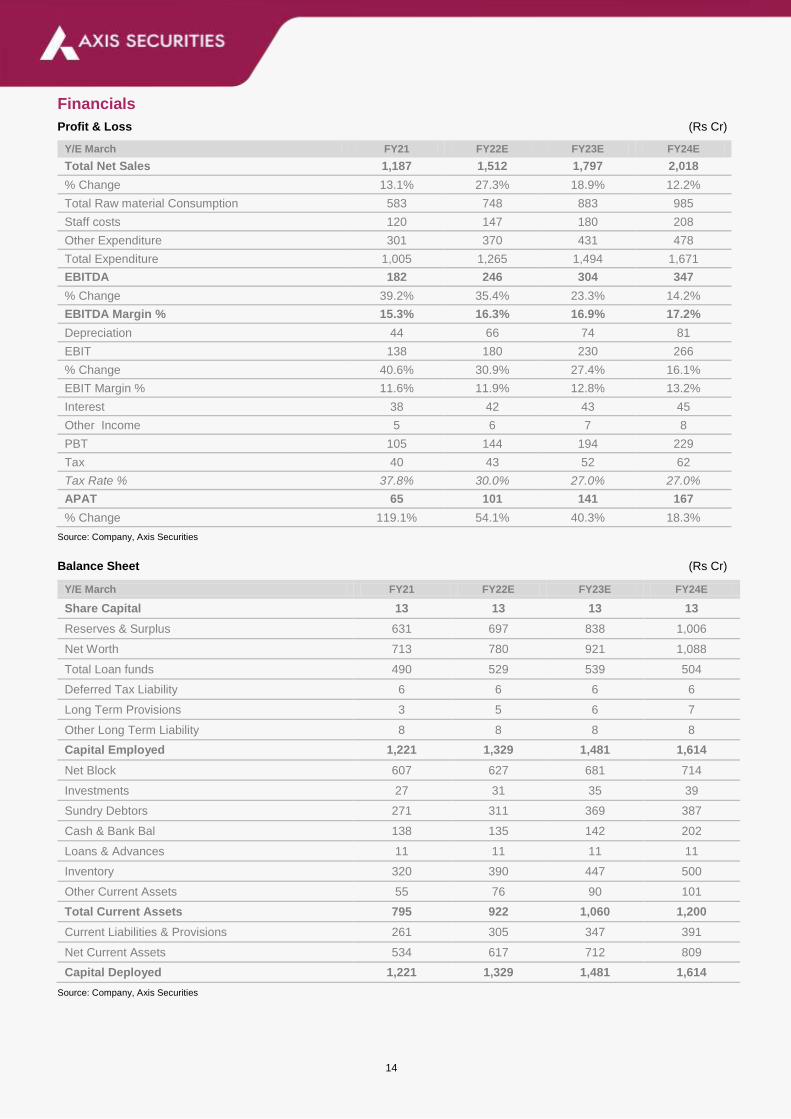
Financials
Profit & Loss (Rs Cr)
Y/E March FY21 FY22E FY23E FY24E
Total Net Sales 1,187 1,512 1,797 2,018
% Change 13.1% 27.3% 18.9% 12.2%
Total Raw material Consumption 583 748 883 985
Staff costs 120 147 180 208
Other Expenditure 301 370 431 478
Total Expenditure 1,005 1,265 1,494 1,671
EBITDA 182 246 304 347
% Change 39.2% 35.4% 23.3% 14.2%
EBITDA Margin % 15.3% 16.3% 16.9% 17.2%
Depreciation 44 66 74 81
EBIT 138 180 230 266
% Change 40.6% 30.9% 27.4% 16.1%
EBIT Margin % 11.6% 11.9% 12.8% 13.2%
Interest 38 42 43 45
Other Income 5 6 7 8
PBT 105 144 194 229
Tax 40 43 52 62
Tax Rate % 37.8% 30.0% 27.0% 27.0%
APAT 65 101 141 167
% Change 119.1% 54.1% 40.3% 18.3%
Source: Company, Axis Securities
Balance Sheet (Rs Cr)
Y/E March FY21 FY22E FY23E FY24E
Share Capital 13 13 13 13
Reserves & Surplus 631 697 838 1,006
Net Worth 713 780 921 1,088
Total Loan funds 490 529 539 504
Deferred Tax Liability 6 6 6 6
Long Term Provisions 3 5 6 7
Other Long Term Liability 8 8 8 8
Capital Employed 1,221 1,329 1,481 1,614
Net Block 607 627 681 714
Investments 27 31 35 39
Sundry Debtors 271 311 369 387
Cash & Bank Bal 138 135 142 202
Loans & Advances 11 11 11 11
Inventory 320 390 447 500
Other Current Assets 55 76 90 101
Total Current Assets 795 922 1,060 1,200
Current Liabilities & Provisions 261 305 347 391
Net Current Assets 534 617 712 809
Capital Deployed 1,221 1,329 1,481 1,614
Source: Company, Axis Securities
15
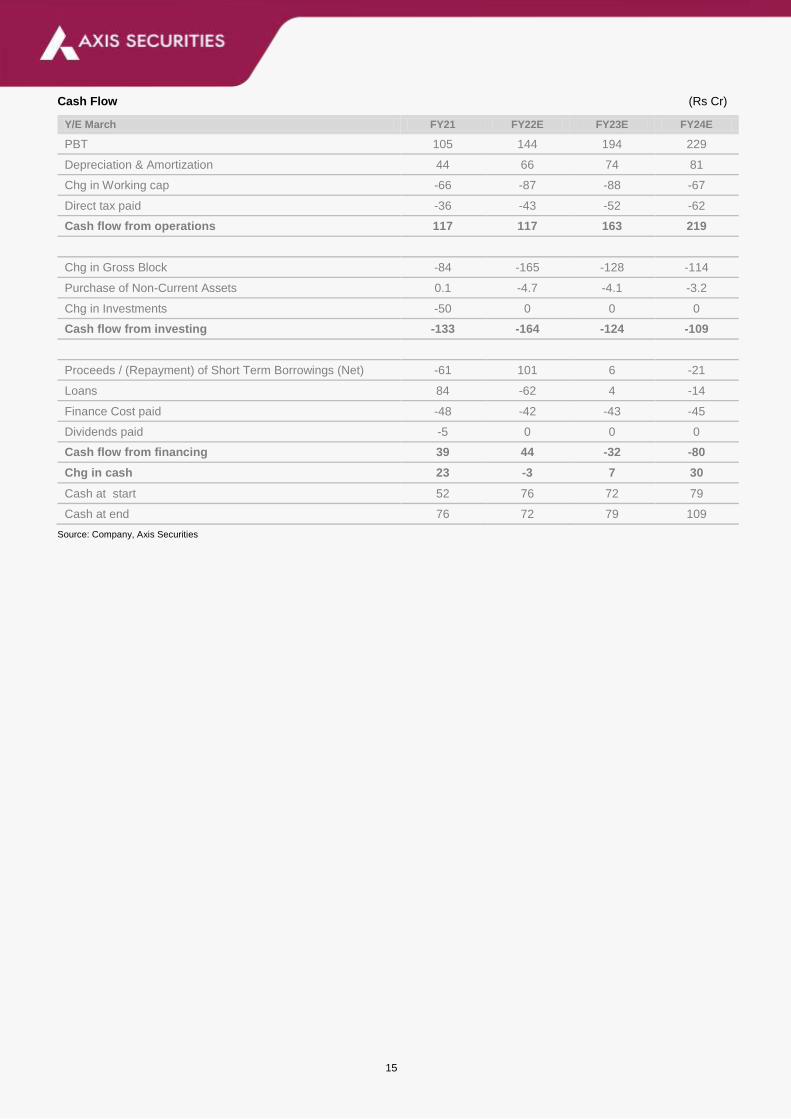
Cash Flow (Rs Cr)
Y/E March FY21 FY22E FY23E FY24E
PBT 105 144 194 229
Depreciation & Amortization 44 66 74 81
Chg in Working cap -66 -87 -88 -67
Direct tax paid -36 -43 -52 -62
Cash flow from operations 117 117 163 219
Chg in Gross Block -84 -165 -128 -114
Purchase of Non-Current Assets 0.1 -4.7 -4.1 -3.2
Chg in Investments -50 0 0 0
Cash flow from investing -133 -164 -124 -109
Proceeds / (Repayment) of Short Term Borrowings (Net) -61 101 6 -21
Loans 84 -62 4 -14
Finance Cost paid -48 -42 -43 -45
Dividends paid -5 0 0 0
Cash flow from financing 39 44 -32 -80
Chg in cash 23 -3 7 30
Cash at start 52 76 72 79
Cash at end 76 72 79 109
Source: Company, Axis Securities
16
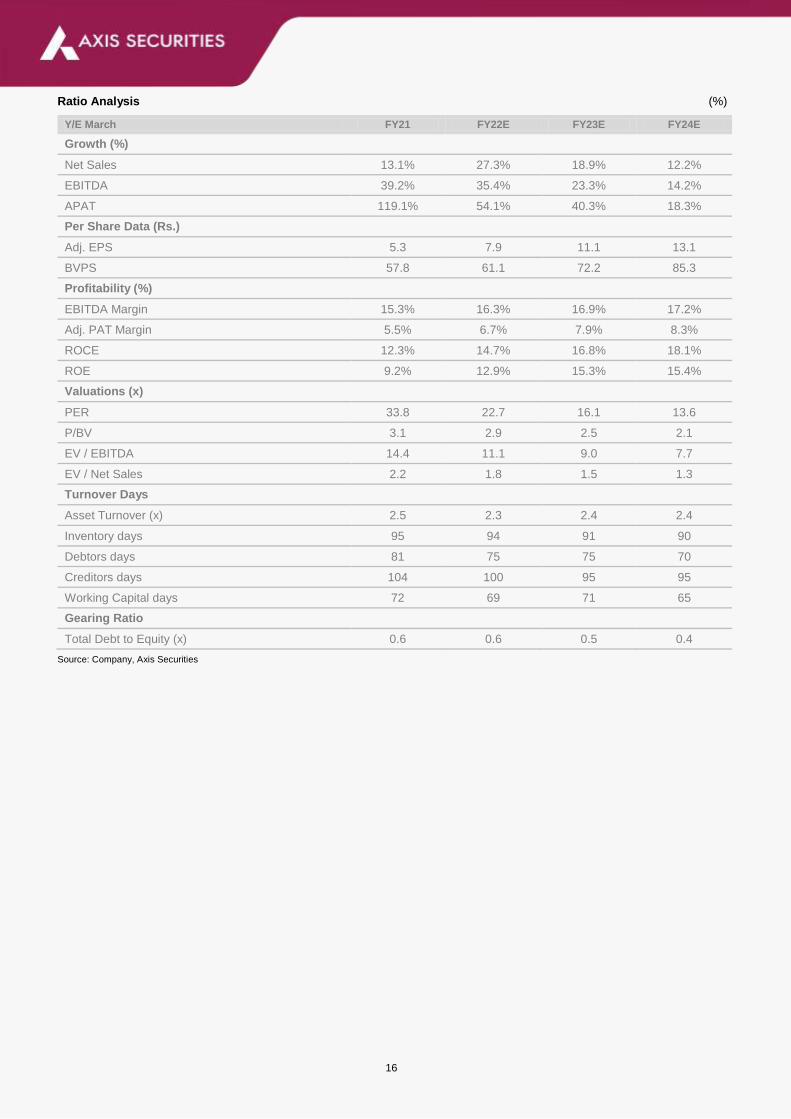
Ratio Analysis (%)
Y/E March FY21 FY22E FY23E FY24E
Growth (%)
Net Sales 13.1% 27.3% 18.9% 12.2%
EBITDA 39.2% 35.4% 23.3% 14.2%
APAT 119.1% 54.1% 40.3% 18.3%
Per Share Data (Rs.)
Adj. EPS 5.3 7.9 11.1 13.1
BVPS 57.8 61.1 72.2 85.3
Profitability (%)
EBITDA Margin 15.3% 16.3% 16.9% 17.2%
Adj. PAT Margin 5.5% 6.7% 7.9% 8.3%
ROCE 12.3% 14.7% 16.8% 18.1%
ROE 9.2% 12.9% 15.3% 15.4%
Valuations (x)
PER 33.8 22.7 16.1 13.6
P/BV 3.1 2.9 2.5 2.1
EV / EBITDA 14.4 11.1 9.0 7.7
EV / Net Sales 2.2 1.8 1.5 1.3
Turnover Days
Asset Turnover (x) 2.5 2.3 2.4 2.4
Inventory days 95 94 91 90
Debtors days 81 75 75 70
Creditors days 104 100 95 95
Working Capital days 72 69 71 65
Gearing Ratio
Total Debt to Equity (x) 0.6 0.6 0.5 0.4
Source: Company, Axis Securities
17
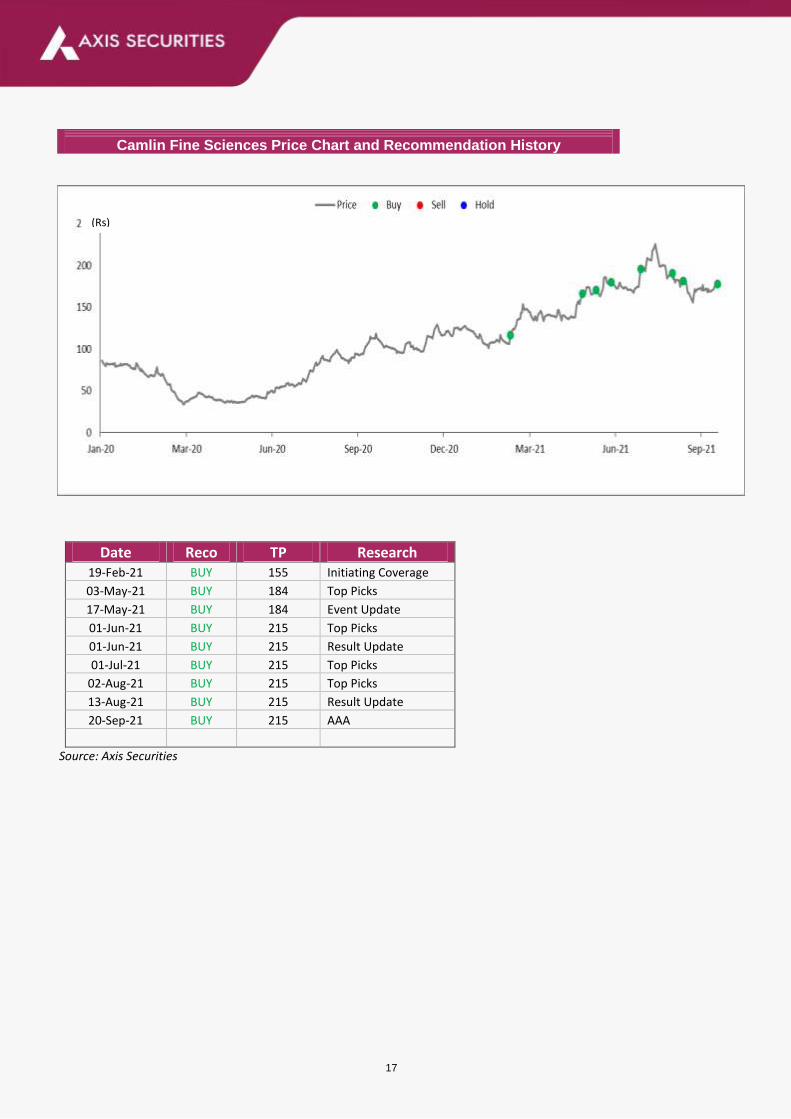
Camlin Fine Sciences Price Chart and Recommendation History
Date Reco TP Research 19-Feb-21 BUY 155 Initiating Coverage
03-May-21 BUY 184 Top Picks
17-May-21 BUY 184 Event Update
01-Jun-21 BUY 215 Top Picks
01-Jun-21 BUY 215 Result Update
01-Jul-21 BUY 215 Top Picks
02-Aug-21 BUY 215 Top Picks
13-Aug-21 BUY 215 Result Update
20-Sep-21 BUY 215 AAA
Source: Axis Securities
(Rs)
18
About the analyst
Analyst: Darshita Shah
Contact Details: [email protected]
Sector: Specialty Chemicals, Mid-Caps
Analyst Bio: Darshita Shah is CFA Level III candidate and has over a year experience in Equity
Market and Research.
About the analyst
Analyst: Suvarna Joshi
Contact Details: [email protected]
Sector: FMCG, Consumption sector, Mid-Caps, Agrochemical
Analyst Bio: Suvarna Joshi is MBA (Finance) from Mumbai University with about 10 years of
experience in Equity market and research
Disclosures:
The following Disclosures are being made in compliance with the SEBI Research Analyst Regulations 2014 (herein after referred to as the Regulations).
1. Axis Securities Ltd. (ASL) is a SEBI Registered Research Analyst having registration no. INH000000297. ASL, the Research Entity (RE) as defined in
the Regulations, is engaged in the business of providing Stock broking services, Depository participant services & distribution of various financial products.
ASL is a subsidiary company of Axis Bank Ltd. Axis Bank Ltd. is a listed public company and one of India’s largest private sector bank and has its various
subsidiaries engaged in businesses of Asset management, NBFC, Merchant Banking, Trusteeship, Venture Capital, Stock Broking, the details in respect
of which are available on www.axisbank.com.
2. ASL is registered with the Securities & Exchange Board of India (SEBI) for its stock broking & Depository participant business activities and with the
Association of Mutual Funds of India (AMFI) for distribution of financial products and also registered with IRDA as a corporate agent for insurance business
activity.
3. ASL has no material adverse disciplinary history as on the date of publication of this report.
4. I/We, Darshita Shah, MBA-Finance and Suvarna Joshi MBA-Finance , author/s and the name/s subscribed to this report, hereby certify that all of the
views expressed in this research report Apcotex urately reflect my/our views about the subject issuer(s) or securities. I/We (Research Analyst) also certify
that no part of my/our compensation was, is, or will be directly or indirectly related to the specific recommendation(s) or view(s) in this report. I/we or
my/our relative or ASL does not have any financial interest in the subject company. Also I/we or my/our relative or ASL or its Associates may have
beneficial ownership of 1% or more in the subject company at the end of the month immediately preceding the date of publication of the Research Report.
Since associates of ASL are engaged in various financial service businesses, they might have financial interests or beneficial ownership in various
companies including the subject company/companies mentioned in this report. I/we or my/our relative or ASL or its associate does not have any material
conflict of interest. I/we have not served as director / officer, etc. in the subject company in the last 12-month period.Any holding in stock – No
5. 5. ASL has not received any compensation from the subject company in the past twelve months. ASL has not been engaged in market making activity for
the subject company.
6. In the last 12-month period ending on the last day of the month immediately preceding the date of publication of this research report, ASL or any of its
associates may have:
Received compensation for investment banking, merchant banking or stock broking services or for any other services from the subject company of this research
report and / or;
Managed or co-managed public offering of the securities from the subject company of this research report and / or;
Received compensation for products or services other than investment banking, merchant banking or stock broking services from the subject company of this
research report;
ASL or any of its associates have not received compensation or other benefits from the subject company of this research report or any other third-party in
connection with this report.
Term& Conditions:
This report has been prepared by ASL and is meant for sole use by the recipient and not for circulation. The report and information contained herein is strictly confidential and may not be altered in any way, transmitted to, copied or distributed, in part or in whole, to any other person or to the media or reproduced in any form, without prior written consent of ASL. The report is based on the facts, figures and information that are considered true, correct, reliable and Apcotex urate. The intent of this report is not recommendatory in nature. The information is obtained from publicly available media or other sources believed to be reliable. Such information has not been independently verified and no guaranty, representation of warranty, express or implied, is made as to its Apcotex uracy, completeness or correctness. All such information and opinions are subject to change without notice. The report is prepared solely for informational purpose and does not constitute an offer document or solicitation of offer to buy or sell or subscribe for securities or other financial instruments for the clients. Though disseminated to all the customers simultaneously, not all customers may receive this report at the same time. ASL will not treat recipients as customers by virtue of their receiving this report.
19
Disclaimer:
Nothing in this report constitutes investment, legal, Apcotex ounting and tax advice or a representation that any investment or strategy is suitable or appropriate to the
recipient’s specific circumstances. The securities and strategies discussed and opinions expressed, if any, in this report may not be suitable for all investors, who must
make their own investment decisions, based on their own investment objectives, financial positions and needs of specific recipient.
This report may not be taken in substitution for the exercise of independent judgment by any recipient. Each recipient of this report should make such investigations as it
deems necessary to arrive at an independent evaluation of an investment in the securities of companies referred to in this report (including the merits and risks involved),
and should consult its own advisors to determine the merits and risks of such an investment. Certain transactions, including those involving futures, options and other
derivatives as well as non-investment grade securities involve substantial risk and are not suitable for all investors. ASL, its directors, analysts or employees do not take
any responsibility, financial or otherwise, of the losses or the damages sustained due to the investments made or any action taken on basis of this report, including but
not restricted to, fluctuation in the prices of shares and bonds, changes in the currency rates, diminution in the NAVs, reduction in the dividend or income, etc. Past
performance is not necessarily a guide to future performance. Investors are advice necessarily a guide to future performance. Investors are advised to see Risk Disclosure
Document to understand the risks associated before investing in the securities markets. Actual results may differ materially from those set forth in projections. Forward-
looking statements are not predictions and may be subject to change without notice.
ASL and its affiliated companies, their directors and employees may; (a) from time to time, have long or short position(s) in, and buy or sell the securities of the
company(ies) mentioned herein or (b) be engaged in any other transaction involving such securities or earn brokerage or other compensation or act as a market maker
in the financial instruments of the company(ies) discussed herein or act as an advisor or investment banker, lender/borrower to such company(ies) or may have any other
potential conflict of interests with respect to any recommendation and other related information and opinions. Each of these entities functions as a separate, distinct and
independent of each other. The recipient should take this into Apcotex ount before interpreting this document.
ASL and / or its affiliates do and seek to do business including investment banking with companies covered in its research reports. As a result, the recipients of this report
should be aware that ASL may have a potential conflict of interest that may affect the objectivity of this report. Compensation of Research Analysts is not based on any
specific merchant banking, investment banking or brokerage service transactions. ASL may have issued other reports that are inconsistent with and reach different
conclusion from the information presented in this report. The Research reports are also available & published on AxisDirect website.
Neither this report nor any copy of it may be taken or transmitted into the United State (to U.S. Persons), Canada, or Japan or distributed, directly or indirectly, in the
United States or Canada or distributed or redistributed in Japan or to any resident thereof. If this report is inadvertently sent or has reached any individual in such country,
especially, USA, the same may be ignored and brought to the attention of the sender. This report is not directed or intended for distribution to, or use by, any person or
entity who is a citizen or resident of or located in any locality, state, country or other jurisdiction, where such distribution, publication, availability or use would be contrary
to law, regulation or which would subject ASL to any registration or licensing requirement within such jurisdiction. The securities described herein may or may not be
eligible for sale in all jurisdictions or to certain category of investors.
The Disclosures of Interest Statement incorporated in this document is provided solely to enhance the transparency and should not be treated as endorsement of the
views expressed in the report. The Company reserves the right to make modifications and alternations to this document as may be required from time to time without any
prior notice. The views expressed are those of the analyst(s) and the Company may or may not subscribe to all the views expressed therein.
Copyright in this document vests with Axis Securities Limited.
Axis Securities Limited, Dealing office: 1st Floor, I-Rise Building, Q Parc, Loma Park, Thane, Ghansoli, Navi Mumbai-400701, Regd. off.- Axis House,8th Floor, Wadia
International Centre, Pandurang Budhkar Marg, Worli, Mumbai – 400 025. Compliance Officer: Anand Shaha, Email: [email protected], Tel No: 022-
49212706
DEFINITION OF RATINGS
Ratings Expected absolute returns over 12-18 months
BUY More than 10%
HOLD Between 10% and -10%
SELL Less than -10%
NOT RATED We have forward looking estimates for the stock but we refrain from assigning valuation and recommendation
UNDER REVIEW We will revisit our recommendation, valuation and estimates on the stock following recent events
NO STANCE We do not have any forward looking estimates, valuation or recommendation for the stock