Daily Morning Note - Axis Direct
15
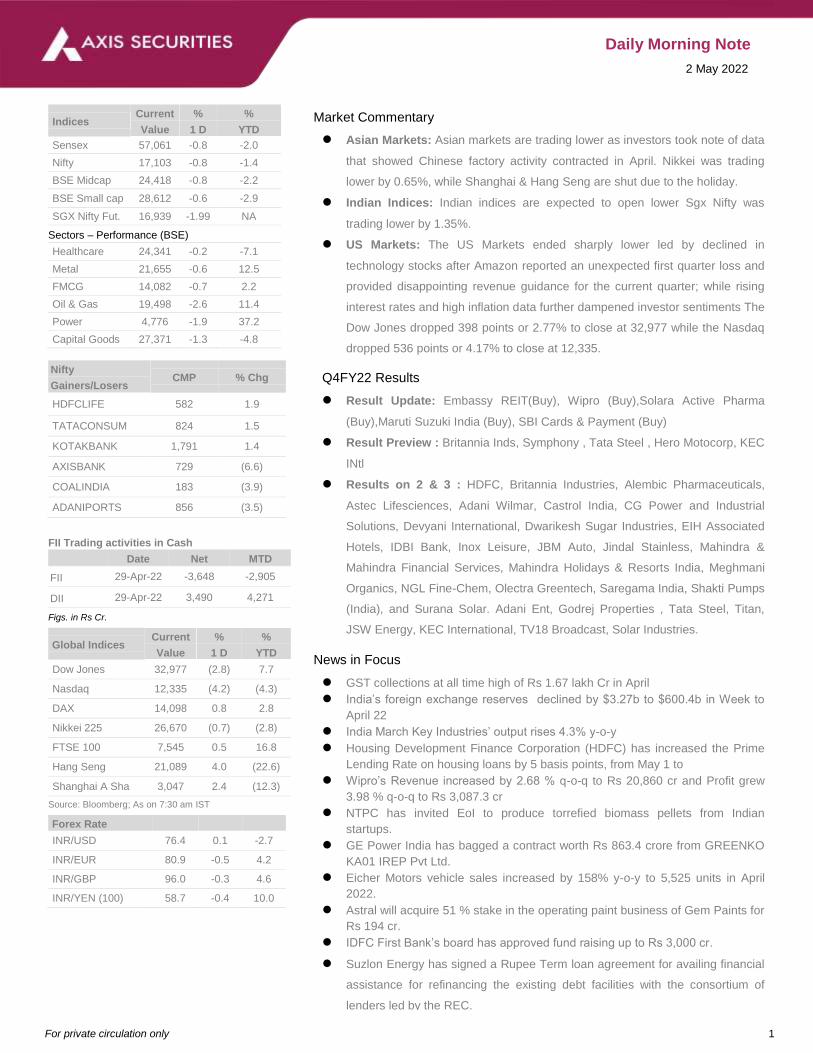
For private circulation only 1 Daily Morning Note 2 May 2022 Market Commentary Asian Markets: Asian markets are trading lower as investors took note of data that showed Chinese factory activity contracted in April. Nikkei was trading lower by 0.65%, while Shanghai & Hang Seng are shut due to the holiday. Indian Indices: Indian indices are expected to open lower Sgx Nifty was trading lower by 1.35%. US Markets: The US Markets ended sharply lower led by declined in technology stocks after Amazon reported an unexpected first quarter loss and provided disappointing revenue guidance for the current quarter; while rising interest rates and high inflation data further dampened investor sentiments The Dow Jones dropped 398 points or 2.77% to close at 32,977 while the Nasdaq dropped 536 points or 4.17% to close at 12,335. Q4FY22 Results Result Update: Embassy REIT(Buy), Wipro (Buy),Solara Active Pharma (Buy),Maruti Suzuki India (Buy), SBI Cards & Payment (Buy) Result Preview : Britannia Inds, Symphony , Tata Steel , Hero Motocorp, KEC INtl Results on 2 & 3 : HDFC, Britannia Industries, Alembic Pharmaceuticals, Astec Lifesciences, Adani Wilmar, Castrol India, CG Power and Industrial Solutions, Devyani International, Dwarikesh Sugar Industries, EIH Associated Hotels, IDBI Bank, Inox Leisure, JBM Auto, Jindal Stainless, Mahindra & Mahindra Financial Services, Mahindra Holidays & Resorts India, Meghmani Organics, NGL Fine-Chem, Olectra Greentech, Saregama India, Shakti Pumps (India), and Surana Solar. Adani Ent, Godrej Properties , Tata Steel, Titan, JSW Energy, KEC International, TV18 Broadcast, Solar Industries. News in Focus GST collections at all time high of Rs 1.67 lakh Cr in April India’s foreign exchange reserves declined by $3.27b to $600.4b in Week to April 22 India March Key Industries’ output rises 4.3% y-o-y Housing Development Finance Corporation (HDFC) has increased the Prime Lending Rate on housing loans by 5 basis points, from May 1 to Wipro’s Revenue increased by 2.68 % q-o-q to Rs 20,860 cr and Profit grew 3.98 % q-o-q to Rs 3,087.3 cr NTPC has invited EoI to produce torrefied biomass pellets from Indian startups. GE Power India has bagged a contract worth Rs 863.4 crore from GREENKO KA01 IREP Pvt Ltd. Eicher Motors vehicle sales increased by 158% y-o-y to 5,525 units in April 2022. Astral will acquire 51 % stake in the operating paint business of Gem Paints for Rs 194 cr. IDFC First Bank’s board has approved fund raising up to Rs 3,000 cr. Suzlon Energy has signed a Rupee Term loan agreement for availing financial assistance for refinancing the existing debt facilities with the consortium of lenders led by the REC. Indices Current Value % 1 D % YTD Sensex 57,061 -0.8 -2.0 Nifty 17,103 -0.8 -1.4 BSE Midcap 24,418 -0.8 -2.2 BSE Small cap 28,612 -0.6 -2.9 SGX Nifty Fut. 16,939 -1.99 NA Sectors – Performance (BSE) Healthcare 24,341 -0.2 -7.1 Metal 21,655 -0.6 12.5 FMCG 14,082 -0.7 2.2 Oil & Gas 19,498 -2.6 11.4 Power 4,776 -1.9 37.2 Capital Goods 27,371 -1.3 -4.8 Nifty Gainers/Losers CMP % Chg HDFCLIFE 582 1.9 TATACONSUM 824 1.5 KOTAKBANK 1,791 1.4 AXISBANK 729 (6.6) COALINDIA 183 (3.9) ADANIPORTS 856 (3.5) FII Trading activities in Cash Date Net MTD FII 29-Apr-22 -3,648 -2,905 DII 29-Apr-22 3,490 4,271 Figs. in Rs Cr. Global Indices Current Value % 1 D % YTD Dow Jones 32,977 (2.8) 7.7 Nasdaq 12,335 (4.2) (4.3) DAX 14,098 0.8 2.8 Nikkei 225 26,670 (0.7) (2.8) FTSE 100 7,545 0.5 16.8 Hang Seng 21,089 4.0 (22.6) Shanghai A Sha 3,047 2.4 (12.3) Source: Bloomberg; As on 7:30 am IST Forex Rate INR/USD 76.4 0.1 -2.7 INR/EUR 80.9 -0.5 4.2 INR/GBP 96.0 -0.3 4.6 INR/YEN (100) 58.7 -0.4 10.0
-
Upload
khangminh22 -
Category
Documents
-
view
1 -
download
0
Transcript of Daily Morning Note - Axis Direct
For private circulation only 1
Daily Morning Note
2 May 2022
Market Commentary
Asian Markets: Asian markets are trading lower as investors took note of data
that showed Chinese factory activity contracted in April. Nikkei was trading
lower by 0.65%, while Shanghai & Hang Seng are shut due to the holiday.
Indian Indices: Indian indices are expected to open lower Sgx Nifty was
trading lower by 1.35%.
US Markets: The US Markets ended sharply lower led by declined in
technology stocks after Amazon reported an unexpected first quarter loss and
provided disappointing revenue guidance for the current quarter; while rising
interest rates and high inflation data further dampened investor sentiments The
Dow Jones dropped 398 points or 2.77% to close at 32,977 while the Nasdaq
dropped 536 points or 4.17% to close at 12,335.
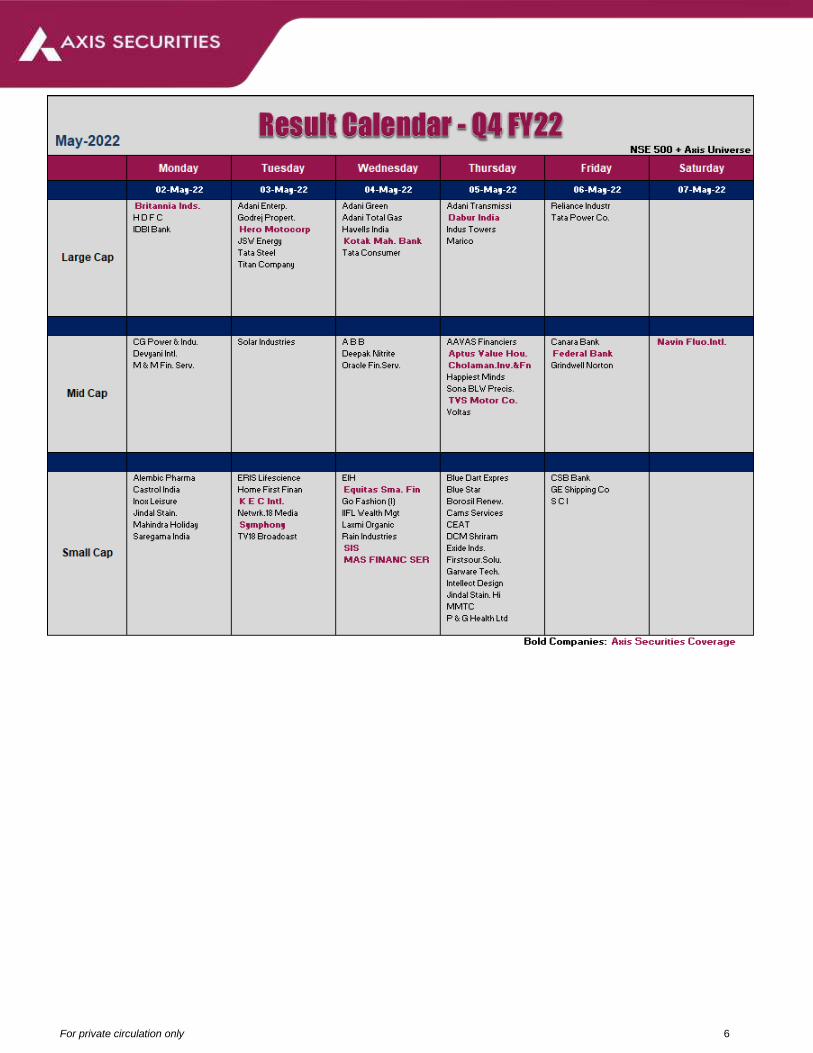
Q4FY22 Results
Result Update: Embassy REIT(Buy), Wipro (Buy),Solara Active Pharma
(Buy),Maruti Suzuki India (Buy), SBI Cards & Payment (Buy)
Result Preview : Britannia Inds, Symphony , Tata Steel , Hero Motocorp, KEC
INtl
Results on 2 & 3 : HDFC, Britannia Industries, Alembic Pharmaceuticals,
Astec Lifesciences, Adani Wilmar, Castrol India, CG Power and Industrial
Solutions, Devyani International, Dwarikesh Sugar Industries, EIH Associated
Hotels, IDBI Bank, Inox Leisure, JBM Auto, Jindal Stainless, Mahindra &
Mahindra Financial Services, Mahindra Holidays & Resorts India, Meghmani
Organics, NGL Fine-Chem, Olectra Greentech, Saregama India, Shakti Pumps
(India), and Surana Solar. Adani Ent, Godrej Properties , Tata Steel, Titan,
JSW Energy, KEC International, TV18 Broadcast, Solar Industries.
News in Focus
GST collections at all time high of Rs 1.67 lakh Cr in April
India’s foreign exchange reserves declined by $3.27b to $600.4b in Week to
April 22
India March Key Industries’ output rises 4.3% y-o-y
Housing Development Finance Corporation (HDFC) has increased the Prime
Lending Rate on housing loans by 5 basis points, from May 1 to
Wipro’s Revenue increased by 2.68 % q-o-q to Rs 20,860 cr and Profit grew
3.98 % q-o-q to Rs 3,087.3 cr
NTPC has invited EoI to produce torrefied biomass pellets from Indian
startups.
GE Power India has bagged a contract worth Rs 863.4 crore from GREENKO
KA01 IREP Pvt Ltd.
Eicher Motors vehicle sales increased by 158% y-o-y to 5,525 units in April
2022.
Astral will acquire 51 % stake in the operating paint business of Gem Paints for
Rs 194 cr.
IDFC First Bank’s board has approved fund raising up to Rs 3,000 cr.
Suzlon Energy has signed a Rupee Term loan agreement for availing financial
assistance for refinancing the existing debt facilities with the consortium of
lenders led by the REC.
• Sun Pharmaceutical Industries $485 mn antitrust deal gets initial
court approval . the company has agreed to pay $485 mn to settle an antitrust
Indices Current
Value
%
1 D
%
YTD
Sensex 57,061 -0.8 -2.0
Nifty 17,103 -0.8 -1.4
BSE Midcap 24,418 -0.8 -2.2
BSE Small cap 28,612 -0.6 -2.9
SGX Nifty Fut. 16,939 -1.99 NA
Sectors – Performance (BSE)
Healthcare 24,341 -0.2 -7.1
Metal 21,655 -0.6 12.5
FMCG 14,082 -0.7 2.2
Oil & Gas 19,498 -2.6 11.4
Power 4,776 -1.9 37.2
Capital Goods 27,371 -1.3 -4.8
Nifty
Gainers/Losers CMP % Chg
HDFCLIFE 582 1.9
TATACONSUM 824 1.5
KOTAKBANK 1,791 1.4
AXISBANK 729 (6.6)
COALINDIA 183 (3.9)
ADANIPORTS 856 (3.5)
FII Trading activities in Cash
Date Net MTD
FII 29-Apr-22 -3,648 -2,905
DII 29-Apr-22 3,490 4,271
Figs. in Rs Cr.
Global Indices Current
Value
%
1 D
%
YTD
Dow Jones 32,977 (2.8) 7.7
Nasdaq 12,335 (4.2) (4.3)
DAX 14,098 0.8 2.8
Nikkei 225 26,670 (0.7) (2.8)
FTSE 100 7,545 0.5 16.8
Hang Seng 21,089 4.0 (22.6)
Shanghai A Sha 3,047 2.4 (12.3)
Source: Bloomberg; As on 7:30 am IST
Forex Rate
INR/USD 76.4 0.1 -2.7
INR/EUR 80.9 -0.5 4.2
INR/GBP 96.0 -0.3 4.6
INR/YEN (100) 58.7 -0.4 10.0
For private circulation only 2
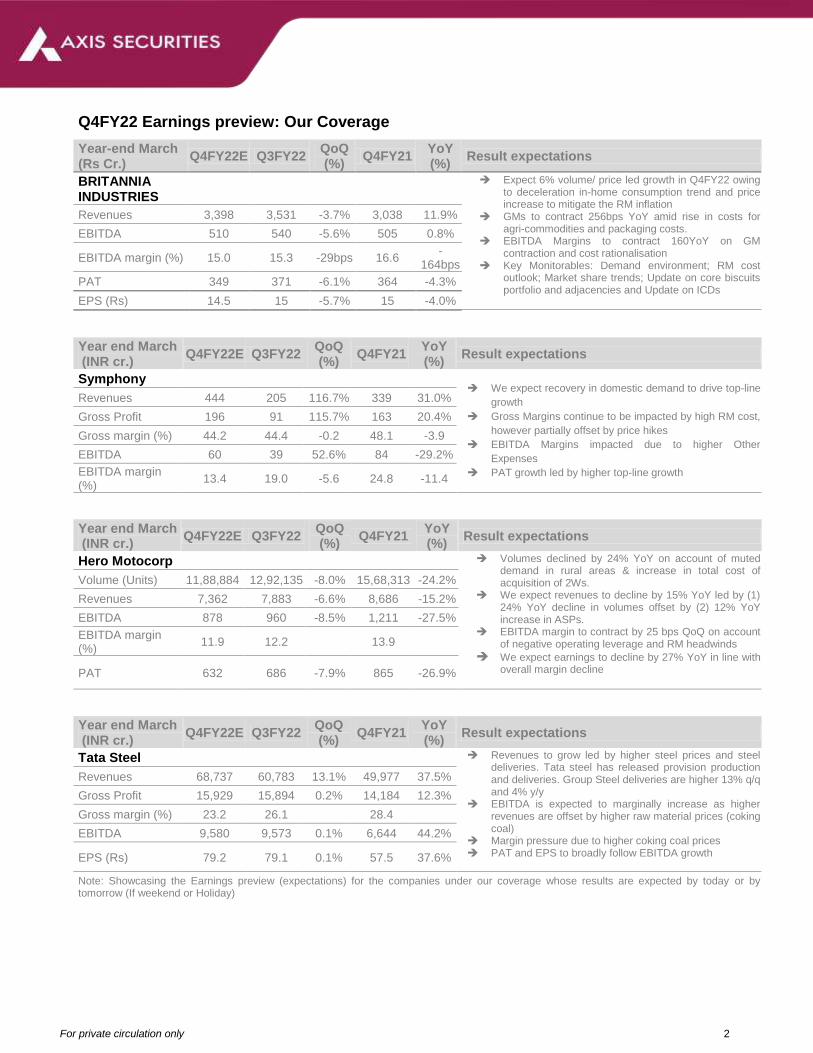
Q4FY22 Earnings preview: Our Coverage
Year-end March (Rs Cr.) Q4FY22E Q3FY22
QoQ (%)
Q4FY21 YoY (%)
Result expectations BRITANNIA INDUSTRIES
Expect 6% volume/ price led growth in Q4FY22 owing to deceleration in-home consumption trend and price increase to mitigate the RM inflation
GMs to contract 256bps YoY amid rise in costs for agri-commodities and packaging costs.
EBITDA Margins to contract 160YoY on GM contraction and cost rationalisation
Key Monitorables: Demand environment; RM cost outlook; Market share trends; Update on core biscuits portfolio and adjacencies and Update on ICDs
Revenues 3,398 3,531 -3.7% 3,038 11.9%
EBITDA 510 540 -5.6% 505 0.8%
EBITDA margin (%) 15.0 15.3 -29bps 16.6 -
164bps
PAT 349 371 -6.1% 364 -4.3%
EPS (Rs) 14.5 15 -5.7% 15 -4.0%
Year end March (INR cr.) Q4FY22E Q3FY22
QoQ (%)
Q4FY21 YoY (%)
Result expectations Symphony
We expect recovery in domestic demand to drive top-line
growth
Gross Margins continue to be impacted by high RM cost,
however partially offset by price hikes
EBITDA Margins impacted due to higher Other
Expenses
PAT growth led by higher top-line growth
Revenues 444 205 116.7% 339 31.0%
Gross Profit 196 91 115.7% 163 20.4%
Gross margin (%) 44.2 44.4 -0.2 48.1 -3.9
EBITDA 60 39 52.6% 84 -29.2%
EBITDA margin (%)
13.4 19.0 -5.6 24.8 -11.4
Year end March (INR cr.) Q4FY22E Q3FY22
QoQ (%)
Q4FY21 YoY (%)
Result expectations Hero Motocorp
Volumes declined by 24% YoY on account of muted
demand in rural areas & increase in total cost of acquisition of 2Ws.
We expect revenues to decline by 15% YoY led by (1) 24% YoY decline in volumes offset by (2) 12% YoY increase in ASPs.
EBITDA margin to contract by 25 bps QoQ on account of negative operating leverage and RM headwinds
We expect earnings to decline by 27% YoY in line with overall margin decline
Volume (Units) 11,88,884 12,92,135 -8.0% 15,68,313 -24.2%
Revenues 7,362 7,883 -6.6% 8,686 -15.2%
EBITDA 878 960 -8.5% 1,211 -27.5%
EBITDA margin (%)
11.9 12.2
13.9
PAT 632 686 -7.9% 865 -26.9%
Year end March (INR cr.) Q4FY22E Q3FY22
QoQ (%)
Q4FY21 YoY (%)
Result expectations Tata Steel Revenues to grow led by higher steel prices and steel
deliveries. Tata steel has released provision production and deliveries. Group Steel deliveries are higher 13% q/q and 4% y/y
EBITDA is expected to marginally increase as higher revenues are offset by higher raw material prices (coking coal)
Margin pressure due to higher coking coal prices PAT and EPS to broadly follow EBITDA growth
Revenues 68,737 60,783 13.1% 49,977 37.5%
Gross Profit 15,929 15,894 0.2% 14,184 12.3%
Gross margin (%) 23.2 26.1
28.4
EBITDA 9,580 9,573 0.1% 6,644 44.2%
EPS (Rs) 79.2 79.1 0.1% 57.5 37.6%
Note: Showcasing the Earnings preview (expectations) for the companies under our coverage whose results are expected by today or by tomorrow (If weekend or Holiday)
For private circulation only 3
SBI Cards & Payment Services Ltd. - Q4FY22 Result Update - BUY; Target Price Rs. 1050
Performance Round-up - Q4FY22 numbers for SBI Cards & Payment Services Ltd. (SBIC) were below our expectations except for a beat on
PAT due to lower-than-expected provisions. The company’s business momentum remained strong with spends at Rs 54,134 Cr ( up 51% YoY;
down 2% QoQ due to seasonal phenomena), ahead of our expectations of Rs 50,500 Cr owing to the pick up in the travel and discretionary
spends. The management commentary on spends momentum sustaining was positive which is encouraging. Spends growth will be adequately
supported by improving spends on travel and discretionary spends as these are high-value spends. The company added ~1 Mn customers
(2nd quarter in a row) during the quarter, taking the cards-in-force (CIF) to 1.38 Cr (+17% YoY, +5% QoQ). However, owing to the intense
competition, SBIC lost market share both in terms of Cards in Force and Spends by ~10/30bps YoY (as of Feb’21) respectively. However, the
management has indicated that it would not chase market share gains at the expense of profitability and instead grow more prudently.
Key Concall Highlights - (a) The management believes that the RBI master circular on new credit card guidelines is positive for the overall
industry as it would lead to higher card issuances, and also stated that SBIC is largely compliant with the new rules. The company also
indicated that the co-branded card partnerships would be a critical growth factor as new customer acquisitions become increasingly digital.
(b) The management will now focus on reducing the cost of acquiring new customers and will look to on-board customers digitally to create a
seamless end-to-end digital journey for customers.
Valuation and Outlook - The momentum on spends with travel and discretionary spends contributing healthily along with new card addition
remaining strong are encouraging and will aid fee income. However, the lower share of revolver balances in the receivables mix continues to
remain a cause of concern and is likely to dampen NIMs which are expected to remain below pre-COVID levels. With asset quality stress
easing and GNPA/NNPA being at pre-COVID levels along with a negligible restructured book, we expect the credit costs to moderate thereby
supporting the bottom line. While pressure on NIMs is likely to persist, improving cost ratios and normalizing credit costs would support ROA
over the medium term. However, maintaining and improving market share in an increasingly competitive environment would remain a key
monitorable. Though the RBI is yet to come up with the discussion paper on MDR charges, as stated previously, the availability of multiple
levers to tackle the issue and SBIC’s ability to pass on the impact of such a cap, if imposed, is reassuring. However, the uncertainty around its
imposition remains a key overhang. We maintain our BUY recommendation on the stock with a revised target price of Rs 1,050/share (33x
FY24E EPS), implying an upside of 27% from CMP.
Maruti Suzuki India Ltd – Q4FY22 Result Update: Buy; TP: Rs 9,800
Beat On EBITDA; Growth Outlook Remains Strong
Financial Performance: Maruti Suzuki India Ltd (MSIL) Q4FY22 performance came in ahead of our expectations on the margin front, aided by
operating leverage benefits, lower discounts, and price hikes. Improvement in the average realization by 12% YoY helped MSIL report flat
revenue growth. MSIL’s revenue stood at Rs 26,740 Cr in Q4FY22 (Our estimate - Rs 26,840 Cr). Reported EBITDA came in at Rs 2,427 Cr
(our estimate - Rs 2,198 Cr), a 22% YoY improvement (Rs 1,991 Cr in Q4FY21). MSIL reported EBITDA margin of 9.1%, a 237bps QoQ
expansion (our estimate – 8.2%). The beat on margins was on account of operating leverage benefits, favorable product mix, lower discounts,
and price hikes. MSIL reported PAT of Rs 1,839 Cr (Our estimate - Rs 1,532 Cr), a growth of 56% YoY.
Outlook & Valuation: The demand environment for the PV industry remains resilient despite the Covid-19 headwinds and we expect the
industry to report robust volume growth, driven by high aspirations, improving affordability, and lower penetration. MSIL could emerge as the
biggest beneficiary of demand recovery in the post-Covid period, considering its stronghold in the Entry-Level segment and a favourable
upcoming product lifecycle. Strong demand, softening commodity inflation, and improving semiconductor shortage will support a recovery in the
margin. The company would gain further market share, driven by an expected shift towards petrol and CNG vehicles. We expect the company’s
volumes to witness a strong growth CAGR of 16% over FY22-24E. We expect margins to be supported by strong demand, softening
commodity inflation, and improving chip shortages. We expect a recovery of both market share and margin in FY23 and FY24, led by a
favourable product lifecycle, operating leverage, and product mix as well as price action/cost-cutting. We maintain our BUY rating on the stock
with an unchanged TP of Rs 9,800 valuing the stock at 27x its FY24E EPS. TP implies an upside of 27% from the CMP.
For private circulation only 4
Solara Active Pharma Sciences Ltd - Q4FY22 Result Update; Under Review
Under Recoveries & Business Restructuring Lead to Negative Profitability
Solara Active Pharma Sciences (Solara) reported subdued performance in Q4FY22 with revenue at Rs 361 Cr, registering notable de-growth of
18.8% YoY, led by under-recoveries and low demand for its products in the market. The company reported gross margins of 35.1% YoY, the
lowest since its inception due to under-recoveries, input cost pressures, and volatility coupled with logistics cost increases. Reported EBITDA
margins too were subdued at 3.8% due to low gross profitability and high other expenses, adjusting for the inventory changes and Vizag under-
recovery, EBITDA now tracks at 19.7%, tried to reach normal levels.
Jitesh Devendra, the Former CEO and Managing Director(MD) of Solara has been re-appointed as the company's Managing Director. Mr.
Jitesh, along with S. Hariharan (ED and CFO) will continue to focus on driving the company’s growth and profitability going forward.
The company’s business seems to have lost momentum due to lower demand for Ibuprofen as well a lack of pricing power in the non-regulated
market, and higher input and logistic costs. The company’s margins are also at risk, forcing us to keep this scrip Under Review for now.
Wipro Q4 FY22 Result Update; BUY; TP of Rs 600/share
Financial Performance: Wipro Ltd’s (Wipro) revenue growth stood below our expectations at Rs 20,313 Cr, up only 3.1% QoQ and 27% YoY
in CC terms. Operating profit grew robust 2.8% YoY to Rs 3,111 Cr, aided by better executions, better employee management, and service
mix. However, the operating margin declined by 60bps at 17.0% QoQ. Net profit for the quarter reported a growth of 34% YoY as it stood at Rs
3,873 Cr.
Operating Performance: While the company’s BFSI vertical grew by 3.5% QoQ, its E&U vertical reported a de-growth of 3% over the same
period. The Communication vertical grew by 1.8% QoQ and the Consumer business/ Manufacturing verticals by 4.7%/ 1.9% QoQ respectively.
The majority of the verticals are witnessing strong growth and are likely to continue their growth in the forthcoming quarters in the backdrop of a
strong deal pipeline.
Outlook & Valuation: We recommend a BUY rating on the stock and assign a 22x P/E multiple to its FY24E earnings of Rs 27.7/share to
arrive at a TP of Rs 600/share, implying an upside of 18% from the CMP.
Embassy REIT - Q4FY22 Result Update; BUY; TP of Rs 425/share.
Stable Occupancies Led by Back-to-Office Drive
Embassy REIT’s Q4FY22 revenue at Rs 749 Cr was in line with our estimate amidst stable occupancies coupled with resilient
collections after the pandemic. The occupancy was 87.1% on the total portfolio of 33.8 msf at the end of Q4FY22. Reported
NOI margins are 82.4% and EBITDA margins improved to 76.7% due to a fall in indirect expenses.
EMBASSY has Leased 2.2 msf at 18% spreads across 47 deals, achieved 14% rent escalations on 7.7 msf across 89 deals for
FY22, focused on occupiers from high growth sectors such as SaaS, EV, and E-Commerce.
The management has guided NOI of Rs 2,710 Cr (on average) for FY23 and NDCF/distributions of Rs 2,050 Bn. DPU
guidance stands at Rs 21.7 per unit for FY23 on a similar base of 948 Mn units. Furthermore, the office leasing
momentum continues to grow backed by a healthy return to workplace trajectory coupled with robust hiring by
technology and global captive players and record tech investments. The company remains focused on delivering
growth to Unitholders and scaling up its industry-leading portfolio. Therefore, we recommend a BUY rating on the
stock with a TP of Rs 425/share.
For private circulation only 5
Indiamart Q4 FY22 - Result Update; BUY; TP of Rs 6,800/share
Financial Performance: IndiaMart Intermesh Ltd (Indiamart) reported strong revenue growth of 7% QoQ and
stood at Rs 201 Cr in Q4FY22, reporting revenue growth of 13% YoY. However, the company posted weak
operating profits of Rs 57 Cr, registering a de-growth of 27% QoQ. Its Operating Margins, too, declined by 27%
QoQ to 28% due to higher employee costs (up 33% QoQ) and the cost of acquisitions. The company’s net profit
for Q4FY22 stood at Rs 57 Cr, registering a growth of 3% YoY but a de-growth of 18.1% QoQ.
Operating Performance: Indiamart has reported consistent growth in registered buyers, which grew to 149 Mn,
implying a growth of 4.2% QoQ. It also has expanded its foothold on the number of the products live on the
platform with total live products on the platform at 83 Mn, up 3.75% QoQ. Total business enquiries delivered stood
at 120 Mn demonstrating growth of 2.6% QoQ. Annualised ARPU for Q4FY22 declined to Rs 47,400 but is likely to
improve with a better offering mix.
Outlook & Valuation: We recommend a BUY rating on the stock and assign a 45x P/E multiple to its FY24E
earnings of Rs 150/share to arrive at a TP of Rs 6,800/share, implying an upside potential of 38% from the CMP.
For private circulation only 6
For private circulation only 7
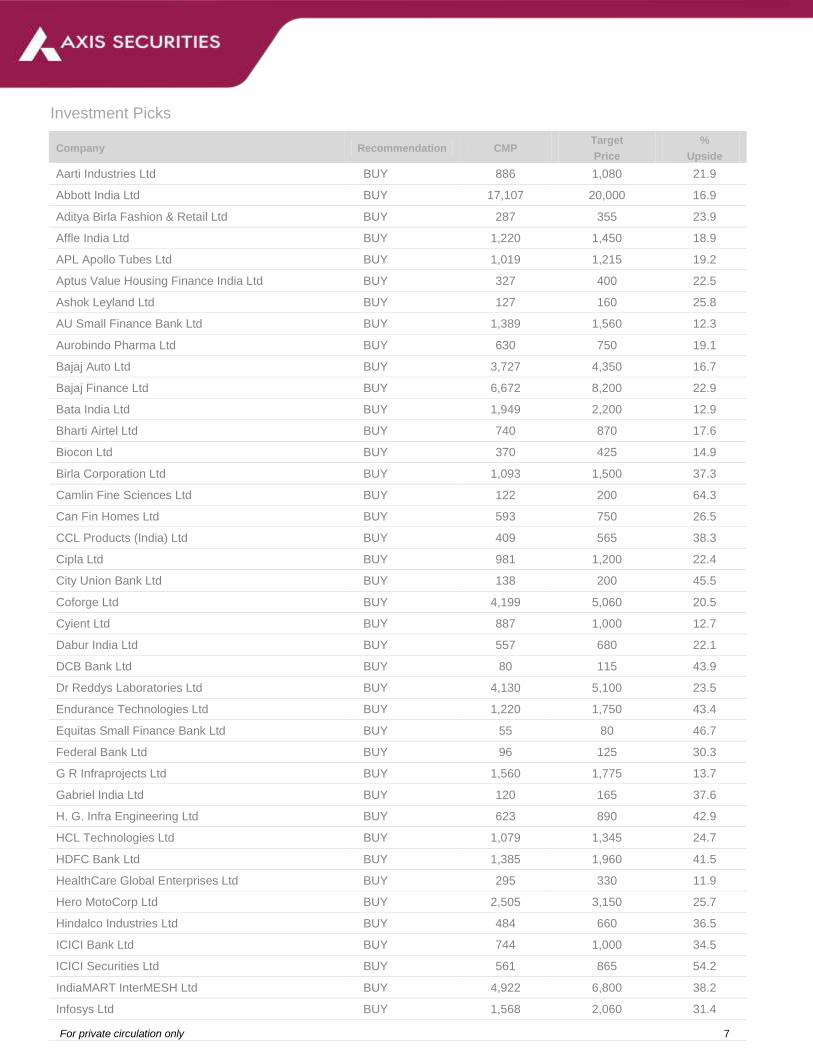
Investment Picks
Company Recommendation CMP Target
Price
%
Upside
Aarti Industries Ltd BUY 886 1,080 21.9
Abbott India Ltd BUY 17,107 20,000 16.9
Aditya Birla Fashion & Retail Ltd BUY 287 355 23.9
Affle India Ltd BUY 1,220 1,450 18.9
APL Apollo Tubes Ltd BUY 1,019 1,215 19.2
Aptus Value Housing Finance India Ltd BUY 327 400 22.5
Ashok Leyland Ltd BUY 127 160 25.8
AU Small Finance Bank Ltd BUY 1,389 1,560 12.3
Aurobindo Pharma Ltd BUY 630 750 19.1
Bajaj Auto Ltd BUY 3,727 4,350 16.7
Bajaj Finance Ltd BUY 6,672 8,200 22.9
Bata India Ltd BUY 1,949 2,200 12.9
Bharti Airtel Ltd BUY 740 870 17.6
Biocon Ltd BUY 370 425 14.9
Birla Corporation Ltd BUY 1,093 1,500 37.3
Camlin Fine Sciences Ltd BUY 122 200 64.3
Can Fin Homes Ltd BUY 593 750 26.5
CCL Products (India) Ltd BUY 409 565 38.3
Cipla Ltd BUY 981 1,200 22.4
City Union Bank Ltd BUY 138 200 45.5
Coforge Ltd BUY 4,199 5,060 20.5
Cyient Ltd BUY 887 1,000 12.7
Dabur India Ltd BUY 557 680 22.1
DCB Bank Ltd BUY 80 115 43.9
Dr Reddys Laboratories Ltd BUY 4,130 5,100 23.5
Endurance Technologies Ltd BUY 1,220 1,750 43.4
Equitas Small Finance Bank Ltd BUY 55 80 46.7
Federal Bank Ltd BUY 96 125 30.3
G R Infraprojects Ltd BUY 1,560 1,775 13.7
Gabriel India Ltd BUY 120 165 37.6
H. G. Infra Engineering Ltd BUY 623 890 42.9
HCL Technologies Ltd BUY 1,079 1,345 24.7
HDFC Bank Ltd BUY 1,385 1,960 41.5
HealthCare Global Enterprises Ltd BUY 295 330 11.9
Hero MotoCorp Ltd BUY 2,505 3,150 25.7
Hindalco Industries Ltd BUY 484 660 36.5
ICICI Bank Ltd BUY 744 1,000 34.5
ICICI Securities Ltd BUY 561 865 54.2
IndiaMART InterMESH Ltd BUY 4,922 6,800 38.2
Infosys Ltd BUY 1,568 2,060 31.4
For private circulation only 8
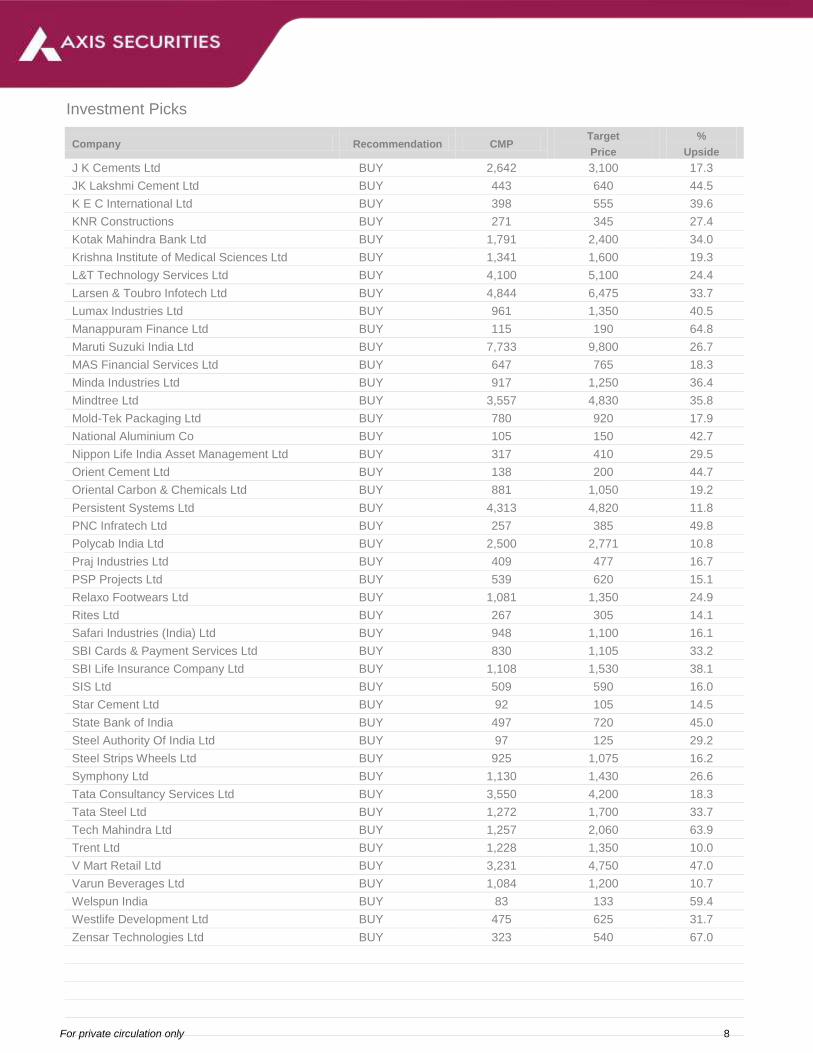
Investment Picks
Company Recommendation CMP Target
Price
%
Upside
J K Cements Ltd BUY 2,642 3,100 17.3
JK Lakshmi Cement Ltd BUY 443 640 44.5
K E C International Ltd BUY 398 555 39.6
KNR Constructions BUY 271 345 27.4
Kotak Mahindra Bank Ltd BUY 1,791 2,400 34.0
Krishna Institute of Medical Sciences Ltd BUY 1,341 1,600 19.3
L&T Technology Services Ltd BUY 4,100 5,100 24.4
Larsen & Toubro Infotech Ltd BUY 4,844 6,475 33.7
Lumax Industries Ltd BUY 961 1,350 40.5
Manappuram Finance Ltd BUY 115 190 64.8
Maruti Suzuki India Ltd BUY 7,733 9,800 26.7
MAS Financial Services Ltd BUY 647 765 18.3
Minda Industries Ltd BUY 917 1,250 36.4
Mindtree Ltd BUY 3,557 4,830 35.8
Mold-Tek Packaging Ltd BUY 780 920 17.9
National Aluminium Co BUY 105 150 42.7
Nippon Life India Asset Management Ltd BUY 317 410 29.5
Orient Cement Ltd BUY 138 200 44.7
Oriental Carbon & Chemicals Ltd BUY 881 1,050 19.2
Persistent Systems Ltd BUY 4,313 4,820 11.8
PNC Infratech Ltd BUY 257 385 49.8
Polycab India Ltd BUY 2,500 2,771 10.8
Praj Industries Ltd BUY 409 477 16.7
PSP Projects Ltd BUY 539 620 15.1
Relaxo Footwears Ltd BUY 1,081 1,350 24.9
Rites Ltd BUY 267 305 14.1
Safari Industries (India) Ltd BUY 948 1,100 16.1
SBI Cards & Payment Services Ltd BUY 830 1,105 33.2
SBI Life Insurance Company Ltd BUY 1,108 1,530 38.1
SIS Ltd BUY 509 590 16.0
Star Cement Ltd BUY 92 105 14.5
State Bank of India BUY 497 720 45.0
Steel Authority Of India Ltd BUY 97 125 29.2
Steel Strips Wheels Ltd BUY 925 1,075 16.2
Symphony Ltd BUY 1,130 1,430 26.6
Tata Consultancy Services Ltd BUY 3,550 4,200 18.3
Tata Steel Ltd BUY 1,272 1,700 33.7
Tech Mahindra Ltd BUY 1,257 2,060 63.9
Trent Ltd BUY 1,228 1,350 10.0
V Mart Retail Ltd BUY 3,231 4,750 47.0
Varun Beverages Ltd BUY 1,084 1,200 10.7
Welspun India BUY 83 133 59.4
Westlife Development Ltd BUY 475 625 31.7
Zensar Technologies Ltd BUY 323 540 67.0
For private circulation only 9
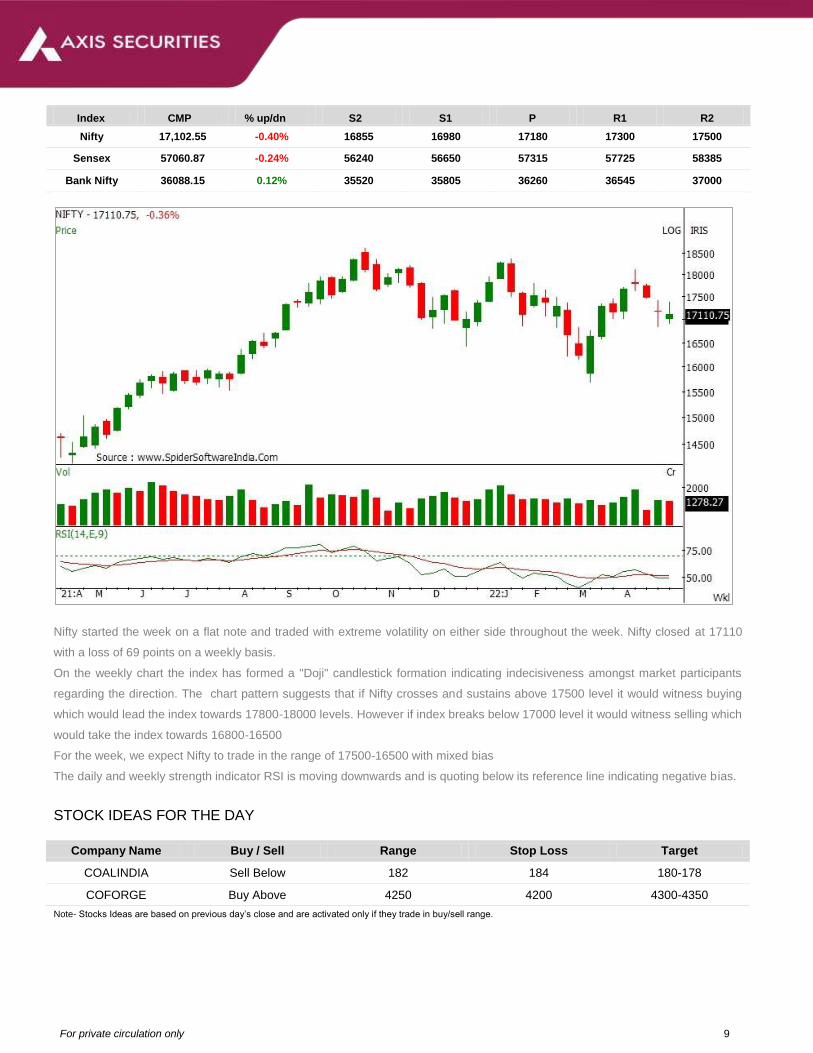
Index CMP % up/dn S2 S1 P R1 R2
Nifty 17,102.55 -0.40% 16855 16980 17180 17300 17500
Sensex 57060.87 -0.24% 56240 56650 57315 57725 58385
Bank Nifty 36088.15 0.12% 35520 35805 36260 36545 37000
Nifty started the week on a flat note and traded with extreme volatility on either side throughout the week. Nifty closed at 17110
with a loss of 69 points on a weekly basis.
On the weekly chart the index has formed a "Doji" candlestick formation indicating indecisiveness amongst market participants
regarding the direction. The chart pattern suggests that if Nifty crosses and sustains above 17500 level it would witness buying
which would lead the index towards 17800-18000 levels. However if index breaks below 17000 level it would witness selling which
would take the index towards 16800-16500
For the week, we expect Nifty to trade in the range of 17500-16500 with mixed bias
The daily and weekly strength indicator RSI is moving downwards and is quoting below its reference line indicating negative bias.
STOCK IDEAS FOR THE DAY
Company Name Buy / Sell Range Stop Loss Target
COALINDIA Sell Below 182 184 180-178
COFORGE Buy Above 4250 4200 4300-4350
Note- Stocks Ideas are based on previous day’s close and are activated only if they trade in buy/sell range.
For private circulation only 10
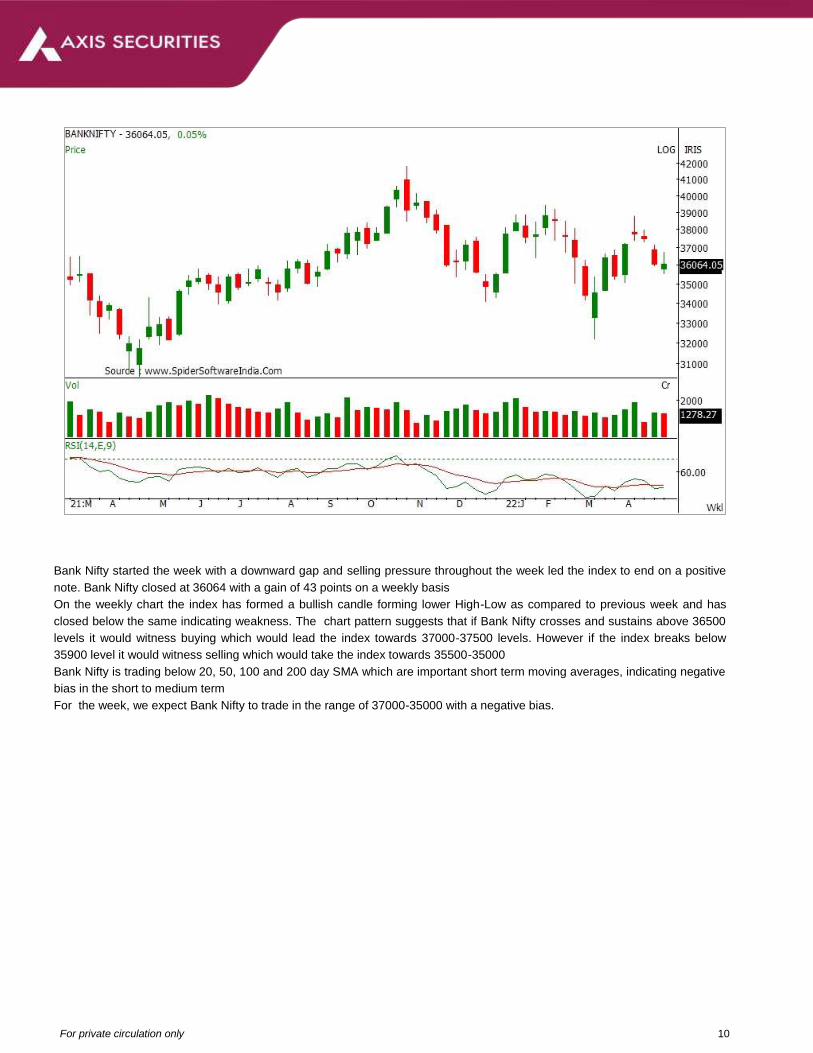
Bank Nifty started the week with a downward gap and selling pressure throughout the week led the index to end on a positive
note. Bank Nifty closed at 36064 with a gain of 43 points on a weekly basis
On the weekly chart the index has formed a bullish candle forming lower High-Low as compared to previous week and has
closed below the same indicating weakness. The chart pattern suggests that if Bank Nifty crosses and sustains above 36500
levels it would witness buying which would lead the index towards 37000-37500 levels. However if the index breaks below
35900 level it would witness selling which would take the index towards 35500-35000
Bank Nifty is trading below 20, 50, 100 and 200 day SMA which are important short term moving averages, indicating negative
bias in the short to medium term
For the week, we expect Bank Nifty to trade in the range of 37000-35000 with a negative bias.
For private circulation only 11
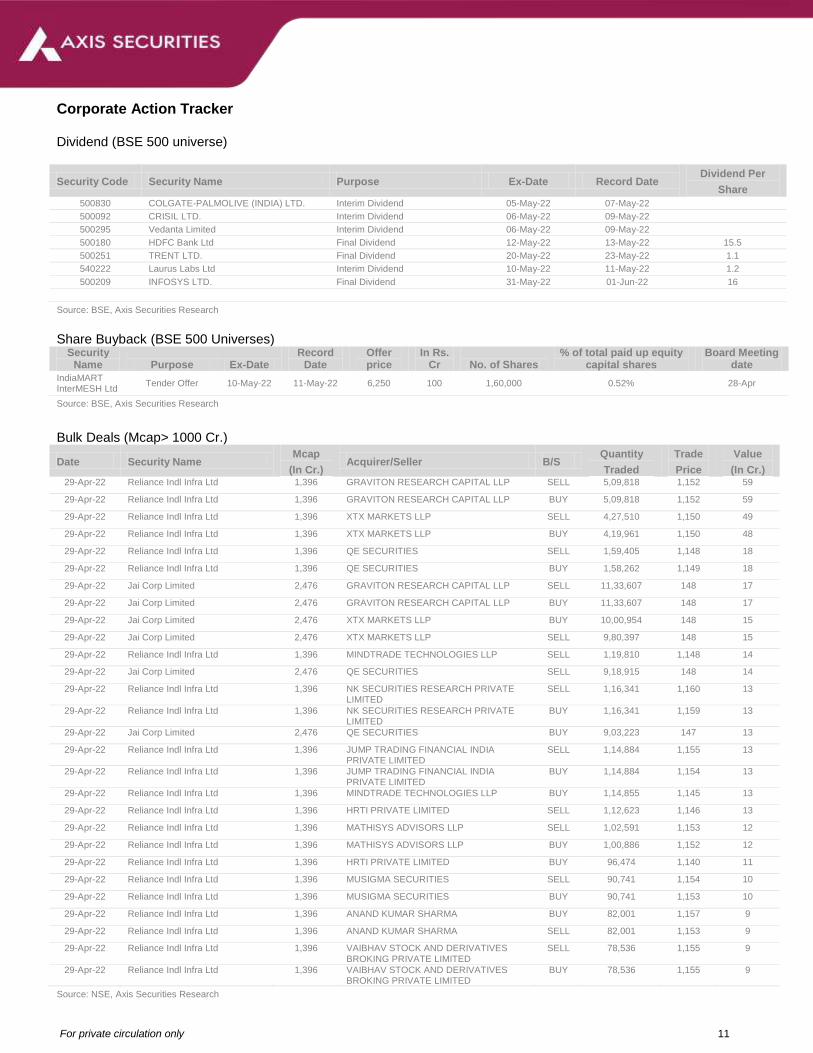
Corporate Action Tracker
Dividend (BSE 500 universe)
Security Code Security Name Purpose Ex-Date Record Date Dividend Per
Share
500830 COLGATE-PALMOLIVE (INDIA) LTD. Interim Dividend 05-May-22 07-May-22
500092 CRISIL LTD. Interim Dividend 06-May-22 09-May-22
500295 Vedanta Limited Interim Dividend 06-May-22 09-May-22
500180 HDFC Bank Ltd Final Dividend 12-May-22 13-May-22 15.5
500251 TRENT LTD. Final Dividend 20-May-22 23-May-22 1.1
540222 Laurus Labs Ltd Interim Dividend 10-May-22 11-May-22 1.2
500209 INFOSYS LTD. Final Dividend 31-May-22 01-Jun-22 16
Source: BSE, Axis Securities Research
Share Buyback (BSE 500 Universes)
Security Name Purpose Ex-Date
Record Date
Offer price
In Rs. Cr No. of Shares
% of total paid up equity capital shares
Board Meeting date
IndiaMART InterMESH Ltd
Tender Offer 10-May-22 11-May-22 6,250 100 1,60,000 0.52% 28-Apr
Source: BSE, Axis Securities Research
Bulk Deals (Mcap> 1000 Cr.)
Date Security Name Mcap
(In Cr.) Acquirer/Seller B/S
Quantity
Traded
Trade
Price
Value
(In Cr.) 29-Apr-22 Reliance Indl Infra Ltd 1,396 GRAVITON RESEARCH CAPITAL LLP SELL 5,09,818 1,152 59
29-Apr-22 Reliance Indl Infra Ltd 1,396 GRAVITON RESEARCH CAPITAL LLP BUY 5,09,818 1,152 59
29-Apr-22 Reliance Indl Infra Ltd 1,396 XTX MARKETS LLP SELL 4,27,510 1,150 49
29-Apr-22 Reliance Indl Infra Ltd 1,396 XTX MARKETS LLP BUY 4,19,961 1,150 48
29-Apr-22 Reliance Indl Infra Ltd 1,396 QE SECURITIES SELL 1,59,405 1,148 18
29-Apr-22 Reliance Indl Infra Ltd 1,396 QE SECURITIES BUY 1,58,262 1,149 18
29-Apr-22 Jai Corp Limited 2,476 GRAVITON RESEARCH CAPITAL LLP SELL 11,33,607 148 17
29-Apr-22 Jai Corp Limited 2,476 GRAVITON RESEARCH CAPITAL LLP BUY 11,33,607 148 17
29-Apr-22 Jai Corp Limited 2,476 XTX MARKETS LLP BUY 10,00,954 148 15
29-Apr-22 Jai Corp Limited 2,476 XTX MARKETS LLP SELL 9,80,397 148 15
29-Apr-22 Reliance Indl Infra Ltd 1,396 MINDTRADE TECHNOLOGIES LLP SELL 1,19,810 1,148 14
29-Apr-22 Jai Corp Limited 2,476 QE SECURITIES SELL 9,18,915 148 14
29-Apr-22 Reliance Indl Infra Ltd 1,396 NK SECURITIES RESEARCH PRIVATE LIMITED
SELL 1,16,341 1,160 13
29-Apr-22 Reliance Indl Infra Ltd 1,396 NK SECURITIES RESEARCH PRIVATE LIMITED
BUY 1,16,341 1,159 13
29-Apr-22 Jai Corp Limited 2,476 QE SECURITIES BUY 9,03,223 147 13
29-Apr-22 Reliance Indl Infra Ltd 1,396 JUMP TRADING FINANCIAL INDIA PRIVATE LIMITED
SELL 1,14,884 1,155 13
29-Apr-22 Reliance Indl Infra Ltd 1,396 JUMP TRADING FINANCIAL INDIA PRIVATE LIMITED
BUY 1,14,884 1,154 13
29-Apr-22 Reliance Indl Infra Ltd 1,396 MINDTRADE TECHNOLOGIES LLP BUY 1,14,855 1,145 13
29-Apr-22 Reliance Indl Infra Ltd 1,396 HRTI PRIVATE LIMITED SELL 1,12,623 1,146 13
29-Apr-22 Reliance Indl Infra Ltd 1,396 MATHISYS ADVISORS LLP SELL 1,02,591 1,153 12
29-Apr-22 Reliance Indl Infra Ltd 1,396 MATHISYS ADVISORS LLP BUY 1,00,886 1,152 12
29-Apr-22 Reliance Indl Infra Ltd 1,396 HRTI PRIVATE LIMITED BUY 96,474 1,140 11
29-Apr-22 Reliance Indl Infra Ltd 1,396 MUSIGMA SECURITIES SELL 90,741 1,154 10
29-Apr-22 Reliance Indl Infra Ltd 1,396 MUSIGMA SECURITIES BUY 90,741 1,153 10
29-Apr-22 Reliance Indl Infra Ltd 1,396 ANAND KUMAR SHARMA BUY 82,001 1,157 9
29-Apr-22 Reliance Indl Infra Ltd 1,396 ANAND KUMAR SHARMA SELL 82,001 1,153 9
29-Apr-22 Reliance Indl Infra Ltd 1,396 VAIBHAV STOCK AND DERIVATIVES BROKING PRIVATE LIMITED
SELL 78,536 1,155 9
29-Apr-22 Reliance Indl Infra Ltd 1,396 VAIBHAV STOCK AND DERIVATIVES BROKING PRIVATE LIMITED
BUY 78,536 1,155 9
Source: NSE, Axis Securities Research
For private circulation only 12
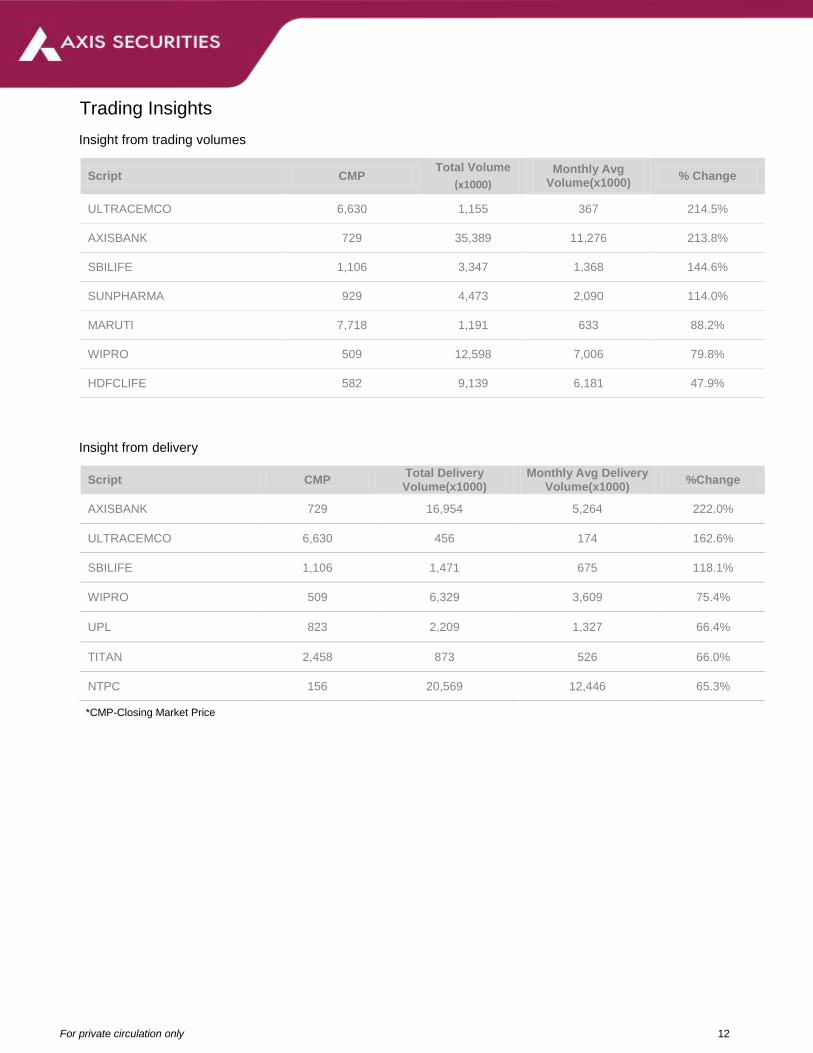
Trading Insights
Insight from trading volumes
Script CMP Total Volume
(x1000)
Monthly Avg Volume(x1000)
% Change
ULTRACEMCO 6,630 1,155 367 214.5%
AXISBANK 729 35,389 11,276 213.8%
SBILIFE 1,106 3,347 1,368 144.6%
SUNPHARMA 929 4,473 2,090 114.0%
MARUTI 7,718 1,191 633 88.2%
WIPRO 509 12,598 7,006 79.8%
HDFCLIFE 582 9,139 6,181 47.9%
Insight from delivery
Script CMP Total Delivery Volume(x1000)
Monthly Avg Delivery Volume(x1000)
%Change
AXISBANK 729 16,954 5,264 222.0%
ULTRACEMCO 6,630 456 174 162.6%
SBILIFE 1,106 1,471 675 118.1%
WIPRO 509 6,329 3,609 75.4%
UPL 823 2,209 1,327 66.4%
TITAN 2,458 873 526 66.0%
NTPC 156 20,569 12,446 65.3%
*CMP-Closing Market Price

For private circulation only 13
Daily Support/ Resistance of Nifty Companies
Company CMP Pivot Point R1 R2 S1 S2
NIFTY 50 17,103 17,178 17,302 17,502 16,978 16,853
ADANIPORTS 856 869 886 915 840 823
ASIANPAINT 3,237 3,245 3,270 3,302 3,213 3,188
AXISBANK 729 741 757 785 713 697
BAJAJ-AUTO 3,730 3,760 3,808 3,886 3,681 3,633
BAJAJFINSV 14,911 15,014 15,177 15,444 14,747 14,584
BAJFINANCE 6,672 6,716 6,781 6,891 6,606 6,541
BHARTIARTL 739 745 755 771 729 720
BPCL 363 366 370 377 358 354
BRITANNIA 3,279 3,305 3,345 3,410 3,240 3,200
CIPLA 981 984 991 1,002 974 967
COALINDIA 183 186 190 197 179 175
DIVISLAB 4,505 4,538 4,587 4,668 4,457 4,409
DRREDDY 4,132 4,171 4,227 4,322 4,076 4,020
EICHERMOT 2,630 2,653 2,686 2,741 2,598 2,565
GAIL 159 160 161 163 158 157
GRASIM 1,692 1,705 1,725 1,758 1,672 1,653
HCLTECH 1,079 1,085 1,095 1,110 1,069 1,059
HDFC 2,230 2,243 2,270 2,311 2,202 2,175
HDFCBANK 1,385 1,387 1,402 1,420 1,369 1,354
HDFCLIFE 582 583 593 603 573 564
HEROMOTOCO 2,507 2,517 2,543 2,579 2,481 2,455
HINDALCO 483 487 494 505 476 468
HINDUNILVR 2,235 2,249 2,276 2,316 2,209 2,183
ICICIBANK 743 748 755 768 736 728
INDUSINDBK 979 988 1,000 1,022 966 954
INFY 1,568 1,575 1,590 1,612 1,553 1,539
IOC 126 128 130 133 124 122
ITC 260 260 262 265 258 256
JSWSTEEL 727 730 737 747 720 713
KOTAKBANK 1,791 1,790 1,811 1,831 1,770 1,749
LT 1,694 1,707 1,726 1,758 1,675 1,655
M&M 922 926 935 948 914 905
MARUTI 7,718 7,763 7,899 8,081 7,582 7,446
NESTLEIND 18,330 18,419 18,571 18,811 18,178 18,027
NTPC 156 158 160 163 154 152
ONGC 160 162 165 170 157 154
POWERGRID 228 230 234 240 224 221
RELIANCE 2,790 2,808 2,838 2,887 2,760 2,729
SBILIFE 1,106 1,102 1,136 1,167 1,071 1,036
SBIN 496 501 508 519 489 483
SHREECEM 25,922 26,013 26,248 26,575 25,686 25,451
SUNPHARMA 929 938 957 985 910 891
TATAMOTORS 438 440 445 452 433 429
TATASTEEL 1,271 1,276 1,287 1,303 1,260 1,248
TCS 3,547 3,569 3,601 3,655 3,515 3,483
TECHM 1,259 1,265 1,283 1,306 1,242 1,225
TITAN 2,458 2,480 2,510 2,562 2,428 2,398
ULTRACEMCO 6,630 6,647 6,775 6,919 6,503 6,376
UPL 823 824 832 841 815 807
WIPRO 509 515 524 538 501 492
Source: Axis Direct.
For private circulation only 14
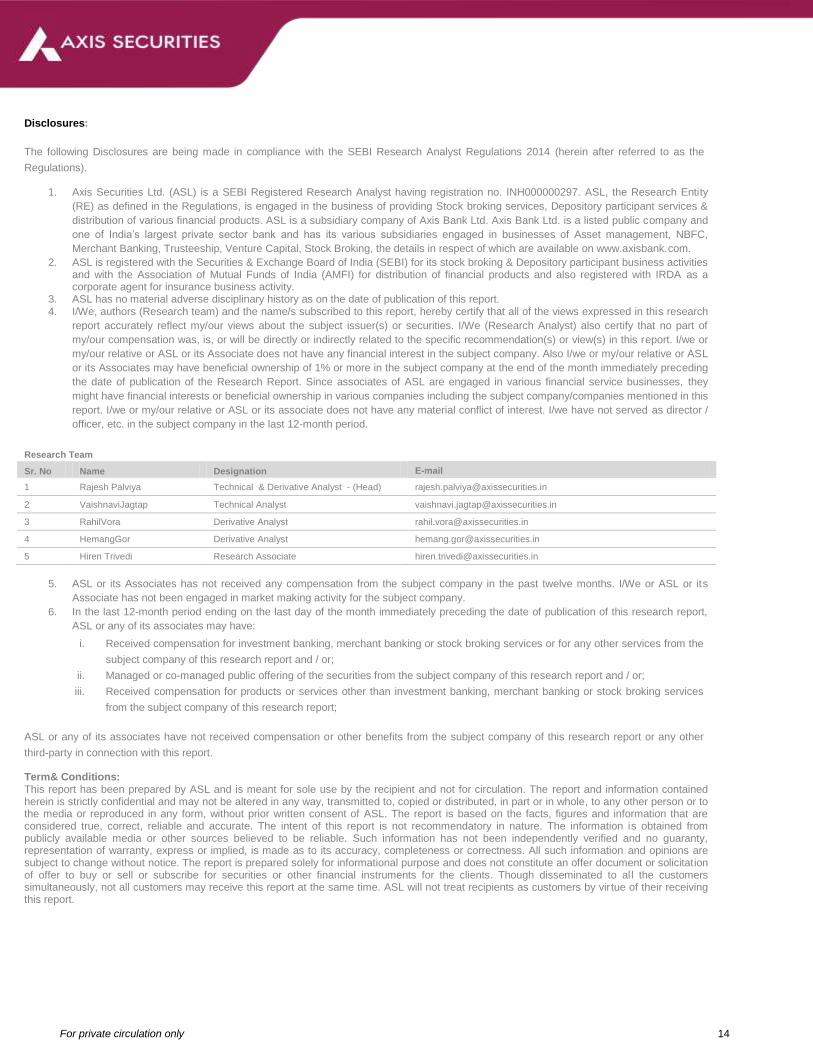
Disclosures:
The following Disclosures are being made in compliance with the SEBI Research Analyst Regulations 2014 (herein after referred to as the
Regulations).
1. Axis Securities Ltd. (ASL) is a SEBI Registered Research Analyst having registration no. INH000000297. ASL, the Research Entity
(RE) as defined in the Regulations, is engaged in the business of providing Stock broking services, Depository participant services &
distribution of various financial products. ASL is a subsidiary company of Axis Bank Ltd. Axis Bank Ltd. is a listed public company and
one of India’s largest private sector bank and has its various subsidiaries engaged in businesses of Asset management, NBFC,
Merchant Banking, Trusteeship, Venture Capital, Stock Broking, the details in respect of which are available on www.axisbank.com.
2. ASL is registered with the Securities & Exchange Board of India (SEBI) for its stock broking & Depository participant business activities and with the Association of Mutual Funds of India (AMFI) for distribution of financial products and also registered with IRDA as a corporate agent for insurance business activity.
3. ASL has no material adverse disciplinary history as on the date of publication of this report. 4. I/We, authors (Research team) and the name/s subscribed to this report, hereby certify that all of the views expressed in this research
report accurately reflect my/our views about the subject issuer(s) or securities. I/We (Research Analyst) also certify that no part of
my/our compensation was, is, or will be directly or indirectly related to the specific recommendation(s) or view(s) in this report. I/we or
my/our relative or ASL or its Associate does not have any financial interest in the subject company. Also I/we or my/our relative or ASL
or its Associates may have beneficial ownership of 1% or more in the subject company at the end of the month immediately preceding
the date of publication of the Research Report. Since associates of ASL are engaged in various financial service businesses, they
might have financial interests or beneficial ownership in various companies including the subject company/companies mentioned in this
report. I/we or my/our relative or ASL or its associate does not have any material conflict of interest. I/we have not served as director /
officer, etc. in the subject company in the last 12-month period.
Research Team
Sr. No Name Designation E-mail
1 Rajesh Palviya Technical & Derivative Analyst - (Head) [email protected]
2 VaishnaviJagtap Technical Analyst [email protected]
3 RahilVora Derivative Analyst [email protected]
4 HemangGor Derivative Analyst [email protected]
5 Hiren Trivedi Research Associate [email protected]
5. ASL or its Associates has not received any compensation from the subject company in the past twelve months. I/We or ASL or its
Associate has not been engaged in market making activity for the subject company.
6. In the last 12-month period ending on the last day of the month immediately preceding the date of publication of this research report,
ASL or any of its associates may have:
i. Received compensation for investment banking, merchant banking or stock broking services or for any other services from the
subject company of this research report and / or;
ii. Managed or co-managed public offering of the securities from the subject company of this research report and / or;
iii. Received compensation for products or services other than investment banking, merchant banking or stock broking services
from the subject company of this research report;
ASL or any of its associates have not received compensation or other benefits from the subject company of this research report or any other
third-party in connection with this report. Term& Conditions: This report has been prepared by ASL and is meant for sole use by the recipient and not for circulation. The report and information contained herein is strictly confidential and may not be altered in any way, transmitted to, copied or distributed, in part or in whole, to any other person or to the media or reproduced in any form, without prior written consent of ASL. The report is based on the facts, figures and information that are considered true, correct, reliable and accurate. The intent of this report is not recommendatory in nature. The information is obtained from publicly available media or other sources believed to be reliable. Such information has not been independently verified and no guaranty, representation of warranty, express or implied, is made as to its accuracy, completeness or correctness. All such information and opinions are subject to change without notice. The report is prepared solely for informational purpose and does not constitute an offer document or solicitation of offer to buy or sell or subscribe for securities or other financial instruments for the clients. Though disseminated to all the customers simultaneously, not all customers may receive this report at the same time. ASL will not treat recipients as customers by virtue of their receiving this report.
For private circulation only 15
Disclaimer: Nothing in this report constitutes investment, legal, accounting and tax advice or a representation that any investment or strategy is suitable
or appropriate to the recipient’s specific circumstances. The securities and strategies discussed and opinions expressed, if any, in this report
may not be suitable for all investors, who must make their own investment decisions, based on their own investment objectives, financial
positions and needs of specific recipient.
This report may not be taken in substitution for the exercise of independent judgment by any recipient. Each recipient of this report should
make such investigations as it deems necessary to arrive at an independent evaluation of an investment in the securities of companies
referred to in this report (including the merits and risks involved), and should consult its own advisors to determine the merits and risks of
such an investment. Certain transactions, including those involving futures, options and other derivatives as well as non-investment grade
securities involve substantial risk and are not suitable for all investors. ASL, its directors, analysts or employees do not take any responsibility,
financial or otherwise, of the losses or the damages sustained due to the investments made or any action taken on basis of this report,
including but not restricted to, fluctuation in the prices of shares and bonds, changes in the currency rates, diminution in the NAVs, reduction
in the dividend or income, etc. Past performance is not necessarily a guide to future performance. Investors are advise necessarily a guide to
future performance. Investors are advised to see Risk Disclosure Document to understand the risks associated before investing in the
securities markets. Actual results may differ materially from those set forth in projections. Forward-looking statements are not predictions and
may be subject to change without notice.
ASL and its affiliated companies, their directors and employees may; (a) from time to time, have long or short position(s) in, and buy or sell
the securities of the company(ies) mentioned herein or (b) be engaged in any other transaction involving such securities or earn brokerage or
other compensation or act as a market maker in the financial instruments of the company(ies) discussed herein or act as an advisor or
investment banker, lender/borrower to such company(ies) or may have any other potential conflict of interests with respect to any
recommendation and other related information and opinions. Each of these entities functions as a separate, distinct and independent of each
other. The recipient should take this into account before interpreting this document.
ASL and / or its affiliates do and seek to do business including investment banking with companies covered in its research reports. As a result, the recipients of this report should be aware that ASL may have a potential conflict of interest that may affect the objectivity of this report. Compensation of Research Analysts is not based on any specific merchant banking, investment banking or brokerage service transactions. ASL may have issued other reports that are inconsistent with and reach different conclusion from the information presented in this report. Neither this report nor any copy of it may be taken or transmitted into the United State (to U.S. Persons), Canada, or Japan or distributed, directly or indirectly, in the United States or Canada or distributed or redistributed in Japan or to any resident thereof. If this report is inadvertently sent or has reached any individual in such country, especially, USA, the same may be ignored and brought to the attention of the sender. This report is not directed or intended for distribution to, or use by, any person or entity who is a citizen or resident of or located in any locality, state, country or other jurisdiction, where such distribution, publication, availability or use would be contrary to law, regulation or which would subject ASL to any registration or licensing requirement within such jurisdiction. The securities described herein may or may not be eligible for sale in all jurisdictions or to certain category of investors. The Disclosures of Interest Statement incorporated in this document is provided solely to enhance the transparency and should not be treated as endorsement of the views expressed in the report. The Company reserves the right to make modifications and alternations to this document as may be required from time to time without any prior notice. The views expressed are those of the analyst(s) and the Company may or may not subscribe to all the views expressed therein.
Copyright in this document vests with Axis Securities Limited.
Axis Securities Limited, SEBI Single Reg. No.- NSE, BSE & MSEI – INZ000161633, ARN No. 64610, CDSL-IN-DP-CDSL-693-2013, SEBI-Research Analyst Reg. No. INH 000000297, SEBI Portfolio Manager Reg. No.- INP000000654, Main/Dealing off.- 1st Floor, I-Rise Building,
Q Parc, Loma Park, Thane, Ghansoli, Navi Mumbai-400701, Regd. off.- Axis House,8th Floor, Wadia International Centre, PandurangBudhkar Marg, Worli, Mumbai – 400 025. Compliance Officer: AnandShaha, Email: [email protected], Tel No: 022-
49212706