Calorimetric study of the Paranematic-to-Nematic transition of polydomain side-chain...
17
EPJ manuscript No. (will be inserted by the editor) Experimental and theoretical study of the nanoparticle-driven blue phase stabilisation Brigita Roˇ ziˇ c 1 , Vassilios Tzitzios 2 , Eva Karatairi 2,3 , Uroˇ s Tkalec 1,4 , George Nounesis 2 , Zdravko Kutnjak 1 , George Cordoyiannis 1,5 , Riccardo Rosso 6 , Epifanio G. Virga 6 , Igor Muˇ seviˇ c 1 , and Samo Kralj 1, 7, a 1 Condensed Matter Physics Department, Joˇ zef Stefan Institute, Jamova cesta 39, Ljubljana 1000, Slovenia 2 Institute of Radioisotopes and Radiodiagnostic Products, National Centre for Scientific Research Demokritos, Aghia Paraskevi 15310, Greece 3 Department of Materials Science, University of Patras, 26500 Patras, Greece 4 NAMASTE Centre of Excellence, Jamova 39, Ljubljana 1000, Slovenia 5 EN FIST Centre of Excellence, Dunajska 156, Ljubljana 1000, Slovenia 6 Dipartimento di Matematica and CNISM, Universit`a di Pavia, via Ferrata 1, I-27100 Pavia, Italy 7 Department of Physics, University of Maribor, Koroˇ ska cesta 160, Maribor 2000, Slovenia Received: date / Revised version: date Abstract. High-resolution ac calorimetry and optical polarising microscopy have been employed in order to study the effects of various types of nanoparticles on the stabilisation of liquid-crystalline blue phases. Imposing stabilisation of blue phases, achieving a 20 K range for blue phase III, has been observed for CdSe nanoparticles of 4.5 nm diameter and hydrophobic coating. On the contrary, the effect of hydrophilic aerosil silica nanoparticles of 7.5 nm diameter and hydrophilic coating is very week. The presented experimental data are accompanied by a theoretical model that accounts for the observed phenomena. 1 Introduction The cholesteric blue phases (BPs) appear in a narrow tem- perature range between the isotropic and the cholesteric phase of highly-chiral thermotropic liquid crystals [1–4] Send offprint requests to : a Present address: [email protected] and, scarcely, in lyotropic systems [5,6]. Three distinct and thermodynamically stable BPs have been observed upon decreasing temperature, named as blue phase III (BPIII), blue phase II (BPII) and blue phase I (BPI) [7, 8]. Their structure, as it has been revealed by previous stud- ies, is macroscopically amorphous for BPIII and of simple
Transcript of Calorimetric study of the Paranematic-to-Nematic transition of polydomain side-chain...
EPJ manuscript No.(will be inserted by the editor)
Experimental and theoretical study of the nanoparticle-driven
blue phase stabilisation
Brigita Rozic1, Vassilios Tzitzios2, Eva Karatairi2,3, Uros Tkalec1,4, George Nounesis2, Zdravko Kutnjak1, George
Cordoyiannis1,5, Riccardo Rosso6, Epifanio G. Virga6, Igor Musevic1, and Samo Kralj1,7,a
1 Condensed Matter Physics Department, Jozef Stefan Institute, Jamova cesta 39, Ljubljana 1000, Slovenia
2 Institute of Radioisotopes and Radiodiagnostic Products, National Centre for Scientific Research Demokritos, Aghia Paraskevi
15310, Greece
3 Department of Materials Science, University of Patras, 26500 Patras, Greece
4 NAMASTE Centre of Excellence, Jamova 39, Ljubljana 1000, Slovenia
5 EN FIST Centre of Excellence, Dunajska 156, Ljubljana 1000, Slovenia
6 Dipartimento di Matematica and CNISM, Universita di Pavia, via Ferrata 1, I-27100 Pavia, Italy
7 Department of Physics, University of Maribor, Koroska cesta 160, Maribor 2000, Slovenia
Received: date / Revised version: date
Abstract. High-resolution ac calorimetry and optical polarising microscopy have been employed in order
to study the effects of various types of nanoparticles on the stabilisation of liquid-crystalline blue phases.
Imposing stabilisation of blue phases, achieving a 20 K range for blue phase III, has been observed for CdSe
nanoparticles of 4.5 nm diameter and hydrophobic coating. On the contrary, the effect of hydrophilic aerosil
silica nanoparticles of 7.5 nm diameter and hydrophilic coating is very week. The presented experimental
data are accompanied by a theoretical model that accounts for the observed phenomena.
1 Introduction
The cholesteric blue phases (BPs) appear in a narrow tem-
perature range between the isotropic and the cholesteric
phase of highly-chiral thermotropic liquid crystals [1–4]
Send offprint requests to:a Present address: [email protected]
and, scarcely, in lyotropic systems [5,6]. Three distinct
and thermodynamically stable BPs have been observed
upon decreasing temperature, named as blue phase III
(BPIII), blue phase II (BPII) and blue phase I (BPI) [7,8].
Their structure, as it has been revealed by previous stud-
ies, is macroscopically amorphous for BPIII and of simple
2 Brigita Rozic et al.: Experimental and theoretical study of the nanoparticle-driven blue phase stabilisation
and body-centered cubic symmetry for BPII and BPI, re-
spectively [9–11]. The blue phases are gifted with a high
potential for applications, such as three-dimentional lasers
and fast displays [12–16]. Nevertheless, their extensive use
in the industry is hampered by the narrow temperature
range at which they usually appear. Intense research ef-
forts that include pioneer synthetic methods and confine-
ment of liquid crystals (LCs), employment of experimental
techniques and theoretical studies are in progress the last
ten years in order to achieve a wide-range stabilisation
of the blue phases and understand the underlying mecha-
nisms [17–30].
In this paper detailed experimental results are reported
on blue phase stabilisation by doping a chiral LC with dif-
ferent kinds of nanoparticles. It is demonstrated that the
effect strongly depends on the type of nanoparticles dis-
persed in the liquid crystal. Moreover, a theoretical model
is presented, accounting for the trapping of nanoparticles
in the disclination lines in order to interpret the observed
phenomena. In Sec. II the samples and experimental se-
tups are described. The theoretical background is pre-
sented in Sec. III. The experimental results are shown in
Sec. IV and discussed in Sec. V. In the last section we
summarise the main conclusions. The theoretical consid-
erations needed to qualitatively explain the measurements
are presented in a more detailed way in the Appendices.
In the Appendix I the phase separation tendency on enter-
ing an orientationally-ordered phase is briefly presented.
In the Appendix II the influence of nanoparticle’s sur-
face treatment on interaction with its surrounding is anal-
CE8 liquid crystal
CdSe nanoparticles
tri-octyl phosphine
oleyl amine
Cr-HexG*-HexJ*-HexJ*-SmC*-SmA-N*-BPI-BPII-BPIII-I
OH
OH
OH
Aerosil-300 nanoparticles
4.5 nm 7 nmOH
OHOH
OH OH
O
O
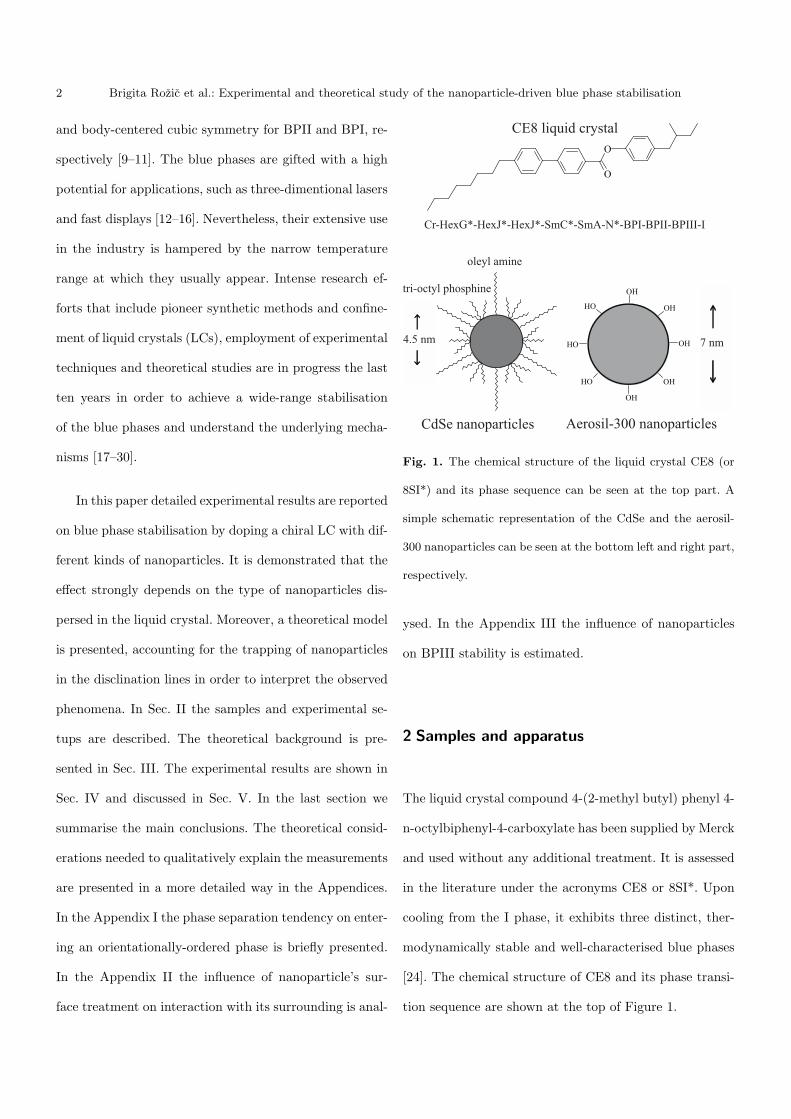
Fig. 1. The chemical structure of the liquid crystal CE8 (or
8SI*) and its phase sequence can be seen at the top part. A
simple schematic representation of the CdSe and the aerosil-
300 nanoparticles can be seen at the bottom left and right part,
respectively.
ysed. In the Appendix III the influence of nanoparticles
on BPIII stability is estimated.
2 Samples and apparatus
The liquid crystal compound 4-(2-methyl butyl) phenyl 4-
n-octylbiphenyl-4-carboxylate has been supplied by Merck
and used without any additional treatment. It is assessed
in the literature under the acronyms CE8 or 8SI*. Upon
cooling from the I phase, it exhibits three distinct, ther-
modynamically stable and well-characterised blue phases
[24]. The chemical structure of CE8 and its phase transi-
tion sequence are shown at the top of Figure 1.

Brigita Rozic et al.: Experimental and theoretical study of the nanoparticle-driven blue phase stabilisation 3
The CdSe nanoparticles (NPs) have been synthesised
at the National Centre for Scientific Research “Demokri-
tos”. The procedure was as follows: 0.5 mmol Cd(acac)2
was injected in 20 ml oleyl amine (OA), under continu-
ous magnetic stirring until a clear solution was acquired.
Elemental selenium (0.5 mgr-at.) was dissolved in 2 ml tri-
octyl phosphine. The Se-TOP solution was then added in
the Cd-OA dispersion at 120 oC and the reaction was com-
pleted in 1 hour at 250 oC in order to attain nanoparticle
nucleation and growth. All the experimental procedures
were carried out under Ar mantle. Nanoparticles precipi-
tated after cooling the reaction mixture to room temper-
ature by the addition of 40 ml ethanol. The so-produced
CdSe NPs are essentially monodisperse and have an av-
erage diameter of 4.5 nm [24]. They are highly soluble in
non-polar solvents such as hexane, toluene and chloroform.
Prior to mixing with CE8 their solution was inserted in
an ultrasonic bath in order to eliminate any possible ag-
gregation. A simple schematic representation of them is
shown at the bottom left part of Figure 1. Further details
on the preparation and the characterisation of the CdSe
NPs have been described elsewhere [31].
The hydrophilic aerosil type-300 nanoparticles are man-
ufactured by Degussa. They are spherical SiO2 particles
with a diameter 2R ∼ 7 nm, treated with hydroxyl groups
on an active surface area a = 300m2/g. Prior to mixing
with the liquid crystal, the aerosil powder was heated to
500 oC for few hours in order to destroy preformed particle
aggregates mediated by hydrogen bonding and to evapo-
rate any possible humidity absorbed by them. A simple
schematic representation of these NPs is shown at the bot-
tom right part of Figure 1.
Apart from the bulk CE8, several mixtures with CdSe
and aerosil nanoparticles have been prepared and mea-
sured. In particular, the x = 0.02, 0.07 and 0.20 concen-
trations were prepared for CE8 and CdSe nanoparticles,
where x stands for the ratio of the mass of NPs over
the mass of CE8. Moreover, a mixture of x = 0.05 was
prepared for CE8 and aerosils. This concentration corre-
sponds to the range of the so-called soft-regime, where the
nanoparticles form adaptive networks [32,33]. High-purity
toluene has been used as a solvent for the preparation of
CE8 and CdSe mixtures (due to the good solubility of
the nanoparticles in the particular solvent), whereas high-
purity acetone has been used for the CE6 and aerosil ones,
following the well-established protocol described in [34].
High-resolution ac calorimetry has been used in order
to obtain the heat capacity temperature dependence for
pure CE8 and several mixtures with nanoparticles. Apart
from the principal ac mode, our apparatus can operate
also in the so-called relaxation or non-adiabatic scanning
mode. The ac mode is sensible only to the continuous en-
thalpy changes, but the phase of the ac temperature oscil-
lations provides information on the nature of the transi-
tion, i.e. continuous (second order) or discontinuous (first
order). The relaxation mode senses both the continuous
and discontinuous (i.e. latent heat) enthalpy changes. A
detailed description of the technique can be found else-
where [35]. Sample quantities of 40mg were placed in silver
cells and mounted in the calorimeter. The heat capacity of

4 Brigita Rozic et al.: Experimental and theoretical study of the nanoparticle-driven blue phase stabilisation
the cell was subtracted and the result was divided by sam-
ple mass in order to derive the net specific heat capacity
Cp of the samples.
Optical observations of the blue phases of bulk CE8
were performed using a polarising optical microscope Nikon
Eclipse E600. The sample was placed between untreated
indium tin oxide (ITO) glass plates and then inserted in
an Instec STC-200 heating stage with temperature stabil-
ity of 0.1 K. Afterwards, it was examined under crossed
polarisers by slowly decreasing the temperature from the
isotropic phase. A Nikon Coolpix E5400 digital camera
has been used for capturing images.
3 Theoretical background
3.1 Parameters describing the mixtures
We consider a nematogen - non-nematogen mixture. The
local volume concentration ϕ of the NPs is the conserved
parameter. The spatially averaged volume concentration
of NPs and LC molecules in the mixture is given by ϕ =
Nnpvnp/V and 1−ϕ, respectively. Here over-bar (..) marks
the spatial average, Nnp counts number of NPs, vnp mea-
sures the volume of a nanoparticle and V stands for the
volume of the sample.
At the mesoscopic level the LC orientational ordering
is described by the symmetric, traceless tensor [37]
Q =3∑
i=1
λi−→e i ⊗−→e i. (1)
It is expressed in terms of its eigenvalues λi and eigen-
vectors −→e i. We consider uniaxial nematic LCs, which in a
bulk equilibrium exhibit uniaxial ordering conventionally
expressed as [37]
Q = S
(−→n ⊗−→n − 1
3I
). (2)
Here −→n is the nematic director field, S is the uniaxial
orientational order parameter, and I stands for the unit
tensor. The unit vector −→n , exhibiting the head-to-tail in-
variance (i.e. ±−→n states are equivalent), points along the
local uniaxial ordering direction. The order parameter S
quantifies the extent of fluctuations along this direction.
3.2 Free energy
We express the free energy Ω of a mixture as
Ω =
∫(fm + fc + fe + fsδ(
−→r −−→r s)) d3−→r , (3)
where δ stands for the delta function, −→r s locates NP-
LC interfaces and the integral runs over the sample vol-
ume. The mixing (fm), condensation (fc) and elastic (fe)
free energy densities are expressed as
fm =kBT
vlc(1− ϕ) ln(1− ϕ) +
kBT
vnpϕ lnϕ+ χϕ(1− ϕ),
(4)
fc =A0(T − T∗)
2QijQij −
B
3QijQjkQki +
C
4(QijQij)
2,
(5)
fe =L
2Qjk,iQjk,i + 2κLεiklQijQlj,k, (6)
where a summation over the repeated indices is as-
sumed. Only the most essential and simplified terms, nec-

Brigita Rozic et al.: Experimental and theoretical study of the nanoparticle-driven blue phase stabilisation 5
essary in order to explain the experimental observations,
are included.
The term fm describes the isotropic mixing for the
two components within the Flory theory [38], kB is the
Boltzmann constant, T is the absolute temperature, vlc
estimates the volume of an average LC molecule, and χ
stands for the Flory-Huggins parameter [38].
The condensation term fc enforces orientational LC
ordering below a critical temperature Tc. The quantities
A0, B, C, are material constants and T∗ describes the
supercooling temperature of a pure bulk LC component.
The elastic term fe penalises the elastic distortions
which tend to enforce a twisted orientational ordering. The
quantity L is the bare nematic elastic constant represent-
ing the LC elastic properties in a single elastic constant
approximation. κ is the chiral parameter, which is pro-
portional to the pitch of the cholesteric helix in a bulk
cholesteric phase.
The conditions at the NP-LC interface are determined
by the surface anchoring term fs. Its anisotropic part ∆fs
is conventionally expressed as ∆fs =w2
(Qij −Q
(s)ij
)(Qij −Q
(s)ij
), where w > 0 is the anchoring strength fa-
voring the nematic ordering determined by Q(s) at an in-
terface. For example, if a uniaxial orientational ordering
is enforced along the unit vector −→n e (the so called easy
axis), then
Q(s) = Ss
(−→n e ⊗−→n e −
1
3I
), (7)
where Ss describes the surface enforced degree of the
uniaxial ordering.
3.3 Mechanical force
In order to calculate a mechanical force−→F on a NP im-
mersed in orientationally-ordered LC medium we use the
expression [40,39],
−→F =
∫T (E)−→v d2r. (8)
Here T (E) is the Ericksen stress tensor and the integration
is performed over the NP surface, where a local outer unit
normal points along −→v . The Eriksen stress tensor can be
expressed in terms of the volume LC free energy density
f = fc + fe as
T (E) = If −∇Q⊙ ∂f
∂∇Q, (9)
where
(A⊙B)ij :=∑h,k
AhkiBhkj (10)
for any pair of third-rank tensors A and B.
4 Experimental Results
In this section the experimental results are presented. In
Figure 2 optical polarising microscopy images of the blue
phase structure of bulk CE8 are shown. In Figure 3 the
heat capacity temperature profiles obtained by the ac mode
along the isotropic (I), BPIII, BPII, BPI, cholesteric (N∗)
and smectic A (SmA) phases are shown for the bulk CE8
and three mixtures with CdSe NPs. When CE8 is doped
with NPs, all phase transitions are smeared and shifted to
lower temperatures. A substantial increase in the range of
BPIII as a function of NPs concentration is observed. This

6 Brigita Rozic et al.: Experimental and theoretical study of the nanoparticle-driven blue phase stabilisation
Fig. 2. Images of the BPI structure of bulk CE8 placed in ITO
glasses and observed under crossed polarisers. The image A
(top part) displays a larger sample area, while image B (bottom
part) corresponds to a smaller area using three times higher
magnification. In both images the peculiar platelet structure
of BPI can be visualised.
range, being 1.2 K wide for bulk CE8, is extended to 10 K
for x = 0.02 and it approaches 20 K for x = 0.20 of NPs.
Concerning the other two blue phases, BPII already dis-
appears for x ≥ 0.02 and BPIII is rather mildly affected.
The resulting T-x phase diagram for CE8 and CdSe NPs
is displayed in Figure 4.
390 400 410 420
2
3
4
BPI-BPIIIBPIII-IN*-BPI
SmA-N*
T (K)
2
3
4 BPIII-I
BPI-BPIIIN*-BPI
(d)
(c)
Cp (J
K-1
g-1)
SmA-N*
2
3
4BPIII-I
BPI-BPIIIN*-BPISmA-N*
BPII-BPIII
(b)
2
3
4BPIII-I
N*-BPI
BPI-BPII
SmA-N*
(a)
Fig. 3. The heat-capacity temperature profiles obtained in
ac runs are presented here. From top to bottom, the results
for bulk CE8 (a), x = 0.02 (b), 0.07 (c) [24] and 0.20 (d)
concentrations of CdSe nanoparticles can be seen.
The heat capacity temperature profiles for the bulk
CE8 and the mixture x = 0.05 with aerosil NPs on the
phase transition behaviour is shown in Figure 5. Contrary
to the strong impact of CdSe NPs, observed already for
x = 0.02 mixture, a very week influence of the aerosils is
realised in this case. The phase transitions occur at tem-
peratures very close to the ones of CE8 and their shape
remains bulk-like. In addition, BPII does not disappear
for the aerosil mixture studied here, though its range is
decreased for few mK compared to bulk CE8. The con-

Brigita Rozic et al.: Experimental and theoretical study of the nanoparticle-driven blue phase stabilisation 7
0.00 0.05 0.10 0.15 0.20
-20
-10
0(b)
SmA
N*BPI
BPII
BPIII
I
T-
T IBPI
II (K
)
x
0.00 0.05 0.10 0.15 0.20
-20
-10
0
x
T-T IB
PIII
(K)
I
BPIII
BPII
BPIN*
SmA
(a)
Fig. 4. The phase diagram of CE8 and its mixtures with CdSe
NPs is presented upon cooling (a) and heating (b). The solid
lines serve only as guides to the eye.
siderable difference between the effect of the two types of
nanoparticles can be depicted in Figure 6, where the re-
sulting phase diagrams are plotted in the same range of
concentrations.
The results for CE8 and CdSe mixtures are repro-
ducible on heating and cooling, as it has been confirmed
by the present measurements. A very small hysteresis ob-
served between heating and cooling runs is attributed to
the first order character of these phase transitions.
405 410 415 420
2
4
6
8
10
BPIII-I
BPII-BPIII
BPII-BPIBPI-N*
N*-SmA
Cp (J
g-1K
-1)
T (K)
(b)
2
4
6
8
10
BPII-BPIII
BPII-BPI
BPI-N*N*-SmA
BPIII-I
(a)
Fig. 5. The heat-capacity temperature profiles obtained in ac
runs are presented for bulk CE8 [24] at the top layer (a) and for
x = 0.05 concentration of aerosil nanoparticles at the bottom
layer (b).
5 Discussion
Henceforth, the possible mechanisms behind the observed
huge temperature widening of the BPIII phase are dis-
cussed. The 1st possible mechanism was originally pro-
posed by Kikuchi et al. [17] who studied a polymer-stabilised
BPI structure. They have reported that the monomers as-
semble at the disclination cores. The overall volume of
relatively costly defect cores is reduced and, consequently,
the temperature interval of the BP structure hosting the
disclination lines is increased.

8 Brigita Rozic et al.: Experimental and theoretical study of the nanoparticle-driven blue phase stabilisation
0.000 0.025 0.050-15
-10
-5
0(b)
SmA
N*
BPIBPII
BPIII
I
T-
T IBPI
II (K
)
x
0.000 0.025 0.050
-15
-10
-5
0
x
T-T IB
PIII
(K)
I
BPIII
BPII
BPI
N*
SmA
(a)
Fig. 6. The phase diagrams are presented, plotted only in
the range of similar concentrations of CdSe NPs at the top
layer (a) and aerosil NPs at the bottom layer (b) for a direct
comparison. The solid lines on both layers serve only as guides
to the eye.
The proposed scenario explains in addition the NP-
induced widening of BPIII phase for appropriate parti-
cles. In the following, the essential conditions that are
necessary for the NP-induced BPIII phase stabilisation
are discussed. For the case that NPs collect at the core
of defects it is shown in Appendix III that their assem-
bling increases the temperature range ∆TBP of the sta-
bility of the BPIII phase. The main mechanism behind
this is a partial replacement of the relatively energetic
core volume of the disclinations with NPs. Therefore, the
trapped NPs strongly reduce the effective condensation
free energy costs, while the remaining free energy terms
are rather weakly affected. The estimate Eq.(33), derived
in Appendix III, yields a dependence∆TBP (x)/∆TBP (0) ∝
1/(1−xb), with b being a constant, which is in line with the
experimental observations. In the limit of large x values,
NPs tend to saturate the defect lines and the described
mechanism is not anymore effective. The NPs are expected
to be essentially non-uniformly distributed within the discli-
nation lines. Such a random character stabilises the amor-
phous BPIII-type structure and not the more ordered BPI
and BPII structures. Note that the effect of NPs on the
I-BP transition with respect to the BP-N∗ one is much
weaker because i) the penalty of introducing defects is
less energetic and ii) the size of defect cores is larger and,
consequently, the core volume replacement is less effective.
We next discuss the conditions which favour the as-
sembling of NPs at the disclination lines. For this pur-
pose one needs initially a homogeneous mixture of NPs
and LC in the isotropic phase. Therefore, the effective
Florry-Hugins parameter χeff , introduced in Appendix I
(Eq.(17)), should be below a critical value. On entering
BPIII, the average orientational ordering is established
and consequently χeff strongly increases, see Eq.(17), as
it is demonstrated in the Appendix I. In order to promote
phase separation this term should be positive. If it is in-
creased above the threshold value, the NPs tend to sepa-
rate from the LC medium. It is of interest to assemble the
expelled NPs at the disclination lines. But for this mech-

Brigita Rozic et al.: Experimental and theoretical study of the nanoparticle-driven blue phase stabilisation 9
Fig. 7. The hybrid plane parallel cell of thickness h hosting
a nanoparticle. At the top plate (z = h) the radial uniaxial
orientation is enforced. On the contrary, the bottom plate (z =
0) imposes a uniaxial homeotropic orientation along the z-axis.
The free boundary condition is imposed at the cylinder wall
(r = R). The system exhibits a cylindrical symmetry.
anism to be effective, it is necessary that the NPs have
appropriate surface coating. Note that the expression for
χeff includes also the term which describes the LC wet-
ting properties at the LC-NP interfaces. This contribution
might play an important role for a strong enough surface
interaction wetting strength W . It supports a phase sep-
aration tendency if W > 0, i.e., the interface tends to
locally decrease the degree of LC ordering.
In order to estimate the effects of NP’s surface coating
on interaction with its surrounding and the consequent
NP trapping capabilities, we study theoretically a force
exhibited on NP within a plane parallel hybrid cell ex-
hibiting a cylindrical symmetry. A cylindrical-shape NP
is set at an arbitrary position z at the symmetry axis of
the cell as shown in Figure 7. At the top plate (z = h) a
strong uniaxial radial anchoring is imposed, i.e.
Q(s)rad = Seq
(−→e r ⊗−→e r −
1
3I
), (11)
where −→e r is the unit vector along the radial cylindrical
coordinate and Seq stands for the equilibrium nematic or-
der parameter (see Eq.(7)). At the bottom plate (z = 0)
a strong homeotropic anchoring is imposed, i.e.
Q(s)hom = Seq
(−→e z ⊗−→e z −
1
3I
), (12)
where −→e z is the unit vector along the z-axis. For such a
geometry the boojum topological defect in enforced at the
top plate [41]. For given boundary conditions it is char-
acterised by a finger-like structure, where the finger tip is
due to topologically reasons melted (i.e., Q = 0). The boo-
jum core structure is analysed in detail in Ref.[41]. Due
to the symmetry of the problem the mechanical force on
the immersed NP points along ±−→e z if it is different from
zero. Note that there exist at least three qualitatively dif-
ferent “attractors” for the NP : i) the melted point at the
boojum finger tip, ii) a homogeneous ordering along −→e z
at z = 0, and iii) a radial ordering at z = h. We consider
three different surface coatings of the NP. At the NP sur-
face we either strongly enforce a) Q = 0, b) Q = Q(s)rad,
c) or Q = Q(s)hom. The hight and diameter of NP is set to
be equal to the biaxial order parameter correlation length.
The position of NP is varied along the z-axis, and for each
position we calculate the equilibrium nematic configura-
tion and the corresponding mechanical force on the NP.

10 Brigita Rozic et al.: Experimental and theoretical study of the nanoparticle-driven blue phase stabilisation
The mathematical details of simulation are given in Ap-
pendix II. In Figure 8 the force is plotted as a function
of z-coordinate for the three different surface treatments.
One can see that the NP, which is enforcing melting, ra-
dial or homogeneous configuration, tends to assemble at
the finger tip, top plate or bottom plate, respectively. The
main information of this study is that the NPs tend to
assemble at locations which exhibit similar local struc-
ture. Therefore, in order to to efficiently assemble NPs
at a disclination core it is essential to choose the surface
coating in such a way that the effective NPs resembles the
defect core structure.
The experimental results confirm the simulation out-
comes. The aerosils locally enforce a relatively strong ne-
matic ordering. On the other hand, the CdSe NPs are
coated with flexible chains. Therefore, the effective struc-
ture of CdSe NPs more resembles the essentially disor-
dered structure at disclination lines. In addition, the aerosil
particles tends to form a network structure, which pre-
vents the collection of particles at disclination lines. In
the experiment we probed a concentration within the so-
called soft network regime [32,33], ranging in the interval
0.01 < x < 0.10, where the aerosil nanoparticles form
adaptive networks. Therefore, the CdSe NPs are expected
to have a much stronger tendency to assemble at discli-
nations. Consequently, the reduction of the energetically
costly condensation term is less effective in aerosil-liquid
crystal mixtures.
The measured stability diagrams in the (x, T ) plane
are topologically similar to stability diagrams, where x
0.2 0.4 0.6 0.8
-0.04
-0.02
0.00
0.02
0.04
F/F o
(h-z)/h
radial homogeneous melted
Fig. 8. The force F experienced by differently surface-treated
NPs as a function of distance z within the cell shown in Figure
7. The nanoparicle enforces locally either i) melting of the LC
order (dashed line), or ii) radial uniaxial order (full line), or
iii) homogeneous ordering (dash-dotted line) along the z-axis.
Note that for the case i) the force equals zero at the boo-
jum finger tip. The characteristic sizes of the nanoparticle are
comparable to the biaxial order parameter correlation length,
which is roughly equal to h/10 in the simulation. Fo stands for
the reference force.
is replaced by chirality strength. This suggests that an
increased chirality itself could be responsible for the ob-
served phenomena. It could be that the flexible chains
covering the CdSe NPs could adopt and even amplify the
chiral tendency of the LC molecules. An increase in the
chirality widens BPIII much more than BPI phase and
changes the I-BPIII transition temperature much less than
the other transition temperatures, in agreement with the
present experimental results. However, note that the chi-
rality strength is defined as a ratio between the chiral elas-
tic and the condensation free energy term. In the disclina-

Brigita Rozic et al.: Experimental and theoretical study of the nanoparticle-driven blue phase stabilisation 11
tion trapping mechanism the condensation penalty is de-
creased and consequently the effective chirality strength is
increased which explains the above mentioned similarities
in (x, T ) and (chirality strength, T ) phase diagram.
6 Conclusions
The effects of various types of nanoparticles in the stabili-
sation of BPs have been presented. A substantial widening
of BPIII is achieved reaching a range of 20 K for large con-
centrations of CdSe nanoparticles. BPII disappears and
BPI is weakly affected. Our theoretical estimates support
the assumption that the main mechanism responsible for
the BPIII stabilization is the effectively reduced condensa-
tion free energy penalty due to assembling of NPs at the
disclination lines. The effect of CdSe nanoparticles were
recently explored for another liquid crystal compound and
they have revealed very similar results [24,42], establish-
ing a robust method to stabilise BPIII. In particular, the
theoretical analysis suggests that in order to achieve NP-
driven stabilization it is advantageous to i) enforce LC-
NP phase separation on entering the LC orientationally
ordered phase and ii) to drive NPs towards disclination
cores. The latter process is pronounced if NPs effective
configuration locally resembles the core structure of the
disclinations. Note that there might be also a qualitatively
different mechanism behind the observed behavior which
our measurements can not rule out. The BP stability dia-
gram as a function of x is similar to the one obtained as a
function of chirality strength [36]. This suggests that the
presence of appropriate NPs could enhance the effective
chirality of the system which does not require assembling
of NPs at defect cores. In this case, the molecular chiral-
ity of LCs is amplified by the presence of homogeneously
distributed NPs. However, for the first mechanism (assem-
bling the NPs at the cores) the effective chirality strength
of the system is also increasing on increasing x. Namely,
the chirality strength expresses a ratio between the elastic
and the condensation free energy penalty. In case that the
NPs assembled at the disclination cores, they apparently
reduce the effective free energy condensation whereas they
only slightly effect the elastic free energy penalty, and the
effective chirality of the system is increased. This explains
the resemblance between (x,T) and (chirality strength,T)
phase diagram also if the NP assembling mechanism em-
phasised in this paper is prevailing.
7 Acknowledgments
This work was performed with the financial support of EU
(Project No. HPRN-CT-2002-00169) and Slovenian Office
of Science (Projects No. J1-9368, J1-0155, P1-0125). E.K.
acknowledges the support of the Graduate Fellowship Pro-
gram of N.C.S.R. “Demokritos”. G.C. acknowledges the
EN FIST Centre of Excellence and U.T. acknowledges the
financial support from the NAMASTE Centre of Excel-
lence.
Appendix I: Phase separation
In the appendix we estimate the influence of the on-
set of LC orientational ordering on the phase separation
of a mixture of NPs and liquid crystal. For this purpose

12 Brigita Rozic et al.: Experimental and theoretical study of the nanoparticle-driven blue phase stabilisation
the LC ordering is approximated with a spatially averaged
uniaxial order parameter S and volume concentration of
nanoparticles ϕ. The average free energy density is ex-
pressed as f = fm + fc + fe + fs . The patially averaged
terms are approximately given by [43,44]
fm ∼ kBT
vlc(1− ϕ) ln(1− ϕ) +
kBT
vnpϕ lnϕ+ χϕ(1− ϕ),
(13)
fc ∼(1− ϕ
) (a0(T − T∗)S
2 − bS3+ cS
4), (14)
fe ∼(1− ϕ
)LS
2/ξ
2, (15)
fs ∼(1− ϕ
)ϕW, (16)
where a0 = 2A0/9, b = 2B/27, c = C/9. The(1− ϕ
)term in fc and fe accounts for the part of the volume not
taken up by LC. In general T∗ = T∗(ϕ). The average do-
main length ξ estimates the elastic distortions in the LC
orientational order. A simple binary modeling [45] sug-
gests T∗ = T0 − λϕ, where T0 > 0 and λ > 0 are indepen-
dent of ϕ. Such dependence reflects relatively weaker inter-
actions among the LC molecules due to the NPs, which
act as ”impurities“. Furthermore, the average contribu-
tion of the interface is proportional to(1− ϕ
)ϕ, because
this free energy term is absent in the limits ϕ = 0 and
ϕ = 1. W includes assembled interface properties which
are independent of ϕ.
With this in mind one can express the effective Flory-
Huggins [38] parameter χeff as
χeff = χ+ a0λS2+W. (17)
Appendix II : LC mediated force on an im-
mersed object
Systems that exhibit a cylindrically symmetric LC or-
dering are considered. For this purpose the LC is con-
fined within a cylindrical plane parallel cell of thickness
h, which is schematically shown in Figure 7. The posi-
tive orthonormal triad −→e r,−→e ϑ,
−→e z describes the unit
vectors of the cylindrical coordinate system. Here −→e r is a
radial unit vector, −→e z points along the z-coordinate, while
−→e ϑ = −→e z ×−→e r.
We take into account the expression for Ω (see Eq.(3)),
where we consider a pure LC in the nematic phase and
set κ = 0, ϕ = 0. We parameterise Q in terms of scalars
qm, qδ, q0 as [46]
Q = −2q0−→e ϑ ⊗−→e ϑ + (q0 + qδ)
−→e r ⊗−→e r +
(q0 − qδ)−→e z ⊗−→e z + qm(−→e r ⊗−→e z +
−→e z ⊗−→e r).
(18)
We restrict our attention to cylindrically symmetric
solutions where the parameters q’s depend only on the
coordinates r and z. It is convenient to introduce the re-
duced temperature θ = 24A0(T−T∗)CB2 = T−T∗
T∗∗−T∗, where T∗∗
is the nematic superheating temperature and the super-
heating nematic order parameter s0 = B4C . For this scal-
ing the bulk nematic order parameter equilibrium value
is given by θ ≤ TIN−T∗T∗∗−T∗
= 8/9 by Seq = s0(1 +
√1− θ
)and metastable states exist in the interval θ ∈ [0, 1]. We
further introduce the bare biaxial correlation length ξb =√4LC/B2 and the dimensionless scaled quantities Q =

Brigita Rozic et al.: Experimental and theoretical study of the nanoparticle-driven blue phase stabilisation 13
Q/s0, q0 = q0/s0, qm = qm/s0, qδ = qδ/s0 Then, all
lengths are scaled with respect to h, i.e. r = r/h, z = z/h,
ξb = ξb/h. Henceforth, the tildes are skipped. Details
about the parametrisation Eq.(18) and the employed scal-
ing are given in [46].
The resulting dimensionless volume free energy densi-
ties read
fc=θ3 (q
2m+q2δ+3q20)−4q0(q
2m+q2δ−q20)+
12 (q
2m+q2δ+3q20)
2,
fe=2ξ2b
(3|∇q0|2+|∇qδ|2+|∇qm|2+ (3q0+qδ)2+q2m
r2
).
(19)
where ∇ stands for the dimensionless Nabla operator.
The minimisation of the free energy yields the follow-
ing bulk Euler-Lagrange equations for q0(r, z), qδ(r, z),
qm(r, z):
0=ξ2b
[∆q0−
3q0+qδr2
]− θ
6 q0+13 (q
2δ+q2m−3q20)−
q02 (3q20+q2δ+q2m)
(20)
0=ξ2b
[∆qδ−
3q0+qδr2
]− θ
6 qδ+2q0qδ−qδ2 (3q20+q2δ+q2m),
(21)
0=ξ2b [∆qm− qmr2]− θ
6 qm+2q0qm− qm2 (3q20+q2δ+q2m),
(22)
where ∆ = ∂2
∂r2 + 1r
∂∂r + ∂2
∂z2 is the dimensionless Laplace
operator. The equations are solved by a standard relax-
ation method for given boundary conditions.
Our interest is to calculate the force on a NP immersed
in the LC cell. For this purpose the Ericksen stress tensor
must be evaluated at the LC-NP interface and the in-
tegration Eq.(8) has to be performed. We consider only
cases where the cylindrical symmetry of the system is
preserved, i.e. we put a cylindrically symmetric NP at
the symmetry axis of the cell as shown in Figure 7. Us-
ing the parametrisation and scaling described above, the
relevant components of the dimensionless Ericksen tensor
T (E) = T (E) (4C)3
B4 are expressed as
−→e z·T (E)−→e z=
ξ2b
(3(q20,r−q20,z)+(q2δ,r−q2δ,z)+(q2m,r−q2m,z)+
q2m+(3q0+qδ)2
r2
)
+ θ6 (3q
20+q2δ+q2m)+2q0(q20−q2δ−q2m)+ 1
4 (3q20+q2δ+q2m)
2,
(23)
−→e z·T (E)−→e r=−2ξ2b(3q0,rq0,z+qδ,rqδ,z+qm,rqm,z).
(24)
The resulting non-vanishing dimensionless force F =
F (4C)3
h2B4 along the z-axis reads
F2π=
∫top
−→e z·T (E)−→e zrdr−∫bottom
−→e z·T (E)−→e zrdz+
∫wall
−→e z·T (E)−→e rrdz,
(25)
where the 1st, 2nd and 3rd integral run over the top,
bottom and lateral surface of the cylindrical NP shown

14 Brigita Rozic et al.: Experimental and theoretical study of the nanoparticle-driven blue phase stabilisation
in Figure 7. At the surfaces we either enforce melting or
conditions given by Eq.(11) or Eq.(12).
Appendix III : Nanoparticle-induced tempera-
ture shift
In this appendix we estimate influence of NPs on the
isotropic-blue phase-cholesteric (I-BP -N∗) phase sequence
upon varying the temperature. The I-BP and BP-N∗ phase
transition temperatures of bulk samples are labeled as TIB
and TBN , respectively.
Originating from Eq.(3) we consider only the most es-
sential terms in a BP phase that are needed to explain
the measurements. In a analysis the structural differences
among the BP structures can be neglected. Our attention
is confined in conditions for which the topological discli-
nation lines are stable. The latter are the hallmark of BP
structures. In the cores of the disclination lines the ne-
matic order is either essentially melted (i.e. S ∼ 0) or
strongly biaxial [47]. The core average radius is roughly
given by the relevant (uniaxial or biaxial) order parameter
correlation length ξ.
In the following the free energy cost ∆Ω of a repre-
sentative lattice cell unit of volume V0 is estimated within
a BP structure hosting disclination lines of a total length
hd, in absence of NPs. The corresponding condensation
free energy penalty ∆Ωc of introducing the disclination
line inside an orientationally ordered medium is roughly
given by
∆Ωc ∼ a0(TIB − T )S2πξ2hd. (26)
This penalty opposes to formation of a BP structure
with respect to the competitive defectless chiral phase N∗.
However, the former can be stabilised by the so-called
surface elastic term in fe, characterised by the saddle
splay elastic constant K24. This elastic term can be via
the Gauss theorem [37] expressed as a surface contribu-
tion at interfaces facing the LC body. Using the nota-
tion implemented in Eq.(3) it holds [48] K24 = k24S2 ∼
2LS2. The corresponding free energy contribution∆Ω24 of
the saddle-splay term at the interface separating the line
disclination core volume and its surrounding is roughly
given by
∆Ω24 ∼ −πk24S2hd. (27)
For K24 > 0 this term favors formation of BP struc-
tures. Furthermore, the presence of disclinations is ac-
companied by director field distortions in the LC body.
The corresponding elastic penalty ∆Ωe can be roughly
expressed [23] as
∆Ωe ∼πKhd
4ln
(Rmax
ξ
), (28)
where K = kS2 ∼ 2LS2stands for an average Frank
elastic constant [37,48] and Rmax is the cutoff radius. The
distance 2Rmax roughly determines the distance between
neighboring disclination lines running in similar direction.
The stability of the BP structures with respect to N∗
below TIB is determined by the condition ∆Ωc +∆Ω24 +
∆Ωe < 0. Hence, TBN is defined by
∆Ωc +∆Ω24 +∆Ωe = 0. (29)

Brigita Rozic et al.: Experimental and theoretical study of the nanoparticle-driven blue phase stabilisation 15
The corresponding temperature width ∆TBP = TIB −
TBN of the BP stability is given by
∆TBP =k24 − k
4 ln(
Rmax
ξ
)a0ξ2
. (30)
On the other hand the I-BP transition is given by the
conditions Ω ≡ Ωc + ∆Ω24 + ∆Ωe = 0 and ∂Ω∂S
= 0,
where the condensation term Ωc which drives the I-BP
transition, is given by
Ωc ∼(a0(T − T∗)S
2 − bS3+ cS
4) (
V0 − πξ2hd
). (31)
Note that below TIB it holds Ωc < 0.
We next consider the case that NPs are added to LC
medium and that they collect at the disclination lines.
The condensation free energy penalty is decreased due to
the reduced volume occupied by the energetically costly
isotropic (or strongly biaxial) phase [17]. It roughly holds
∆Ωc ∼ a0(TIB − T )S2 (
πξ2hd −Nnpvnp). (32)
where Nnp ∝ x counts number of nanoparticles within
the defect line of length hd, and vnp is the NP’s volume.
Furthermore, we assume that the changes in ∆Ω24 and
∆Ωe are relatively negligible.
From the conditions given by Eq.(29) and Eq.(30) it
follows ∆TBP (x)∆TBP (x=0) ∼
(1− Nnpvnp
πξ2hd
)−1
. Taking into account
x ∼ mnp
mlc∼ ϕ
ρnp
ρlc, we finally obtain
∆TBP (x)
∆TBP (x=0)∼(1−x
ρlcρnp
V0πξ2hd
)−1=(1−ϕ
V0πξ2hd
)−1.
(33)
Heremnp (ρnp) andmlc (ρlc) stand for mass (densities)
of NPs and LC molecules, respectively.
References
1. D. Coats, and P. Pieranski, Phys. Lett. A 45, 115 (1973).
2. P. J. Collings, and J. R. McColl, J. Chem. Phys. 69, 3371
(1978).
3. T. Blumel, P. J. Collings, H. Onusseit, and H. Stegemeyer,
Chem. Phys. Lett. 116, 30 (1985).
4. P. H. Keyes, MRS Bull. 16, 32 (1991).
5. A. Leforestier, and F. Livolant, Liq. Cryst. 17, 651 (1994).
6. J. Charvolin, and J. F. Sadoc, Eur. Phys. J. E 25, 335
(2008).
7. P. P. Crooker, Mol. Cryst. Liq. Cryst. 98, 31 (1983).
8. R. Collings, Phys. Rev. A 30, 30 (1984).
9. R. Barbet-Massin, P. E. Cladis, and P. Pieranski, Phys.
Rev. A 30, 1161 (1984).
10. E. Dubois-Violette, B. Pansu, and P. Pieranski, Mol.
Cryst. Liq. Cryst. 192, 221 (1990).
11. E. P. Koistinen, and P. H. Keyes, Phys. Rev. Lett. 74,
4460 (1995).
12. W. Cao, A. Munoz, P. Palffy-Muhoray, and B. Taheri, Na-
ture Mater. 1, 111 (2002).
13. Y. Hisakado, H. Kikuchi, T. Nagamura, and T. Kajiyama,
Adv. Mater. 17, 96 (2005).
14. S. M. Morris, A. D. Ford, C. Gillspie, M. N. Pivnenko,
O. Hadeler, and H. J. Coles, J. Soc. Inf. Disp. 14, 565
(2006).
15. H. Iwamochi, and A. Yoshizawa, Appl. Phys. Express 1,
111801 (2008).
16. H. Y. Liu, C. T. Wang, C. Y. Hsu, T. H. Lin, and J. H. Liu,
Appl. Phys. Lett. 96, 121103 (2010).

16 Brigita Rozic et al.: Experimental and theoretical study of the nanoparticle-driven blue phase stabilisation
17. H. Kikuchi, M. Yokota, Y. Hisakado, H. Yang, and T. Ka-
jiyama, Nature Mater. 1, 64 (2002).
18. M. Nakata, Y. Takanishi, J. Watanabe, and H. Takezoe,
Phys. Rev. E 68, 041710 (2003).
19. H. J. Coles, and M. N. Pivnenko, Nature 436, 997 (2005).
20. G. P. Alexander, and J. M. Yeomans, Phys. Rev. E 74, 74
(2006).
21. A. Yoshizawa, H. Iwamochi, S. Segawa, and M. Sato, Liq.
Cryst. 34, 1039 (2007).
22. T. Noma, M. Ojima, H. Asagi, Y. Kawahira, A. Fujii, and
M. Ozaki, J. Surf. Sci. Nanotech. 6, 17 (2008).
23. H. Yoshida, Y. Tanaka, K. Kawamoto, H. Kubo, T. Tsuda,
A. Fujii, S. Kuwabata, H. Kikuchi, and M. Ozaki, Appl.
Phys. Express 2, 121501 (2009).
24. E. Karatairi, B. Rozic, Z. Kutnjak, V. Tzitzios, G. Noune-
sis, G. Cordoyiannis, C. Glorieux, J. Thoen, and S. Kralj,
Phys. Rev. E 81, 041703 (2010).
25. M. Ravnik, G. P. Alexander, J. M. Yeomans, and S. Zumer,
Faraday Discus. 144, 159 (2010).
26. J. Fukuda, and S. Zumer, Phys. Rev. Lett. 104, 017801
(2010).
27. H. Iwamochi, T. Hirose, Y. Kogawa, and A. Yoshizawa,
Chem. Lett. 39, 170 (2010).
28. F. Castles, S. M. Morris, E. M. Terentjev, and H. J. Coles,
Faraday Discus. 104, 157801 (2010).
29. S. Taushanoff, K. Van Le, J. Williams, R. J. Twieg,
B. K. Sasashiva, H. Takezoe, and A. Jakli, J. Mater. Chem.
20, 5893 (2010).
30. K. -M. Chen, S. Gauza, H. Xianyu, and T. -T. Wu, J.
Display Technol. 6, 49 (2010).
31. V. Tzitzios, V. Georgakilas, I. Zafiropoulou, N. Boukos,
G. Basina, D. Niarchos, and D. Petridis, J. Nanosci. Nan-
otechno. 8, 3117 (2008).
32. G. S. Iannacchione, C. W. Garland, J. T. Mang, and
T. P. Rieker, Phys. Rev. E 58, 5966 (1998).
33. J. Barre, A. R. Bishop, T. Lookman, and A. Saxena, Phys.
Rev. Lett. 94, 208701 (2005).
34. H. Haga, and C. W. Garland, Phys. Rev. E 56, 3044
(1997).
35. H. Yao, K. Ema, and C. W. Garland, Rev. Sci. Instrum.
69, 172 (1998).
36. M. B. Bowling, P. J. Collings, C. J. Booth, and
J. W. Goodby, Phys. Rev. E 48, 4113 (1993).
37. P. G. de Gennes and J. Prost, The Physics of Liquid Crys-
tals, Oxford University Press, Oxford (1993).
38. P. J. Flory, Proc. R. Soc. A 243, 73 (1956).
39. J. L. Ericksen, Arch. Ration. Meck. Anal. 9, 371 (1962).
40. E. G. Virga, Variational Theories for liquid Crystals,
Chapman Hall, london (1994).
41. S. Kralj, R. Rosso, and E. G. Virga, Phys. Rev. E 78,
031701 (2008).
42. G. Cordoyiannis, P. Losada-Perez, C. S. P. Tripathi,
B. Rozic, U. Tkalec, V. Tzitzios, E. Karatairi, G. Noune-
sis, Z. Kutnjak, I. Musevic, C. Glorieux, S. Kralj, and
J. Thoen, Liq. Cryst. , in press (2010).
43. V. J. Anderson, E. M. Terentjev, P. Petrov, S. P. Meeker,
J. Crain,and W. C. K. Poon, Eur. Phys. J. E 4, 11 (2001).
44. V. Popa-Nita, P. van der Schoot, and S. Kralj, Eur. Phys.
J. E 21, 189 (2006).
45. S. Kralj, Z. Bradac, and V. Popa-Nita, J. Phys.: Condens.
Matter 20, 244112 (2008).
Brigita Rozic et al.: Experimental and theoretical study of the nanoparticle-driven blue phase stabilisation 17
46. F. Bisi, E. C. Gartland, R. Rosso, and E. G. Virga, Phys.
Rev. E 68, 021707 (2003).
47. S. Kralj, E. G. Virga, and S. Zumer, Phys. Rev. E 60, 1858
(1999).
48. S. Kralj, and S. Zumer, Phys. Rev. A 45, 2461 (1992).