Multiscale modelling of particle debonding in reinforced elastomers subjected to finite deformations
Upload
independentCategory
view
1download
0
Melt compounding with graphene to develop functional, high-performance elastomers
This article has been downloaded from IOPscience. Please scroll down to see the full text article.
2013 Nanotechnology 24 165601
(http://iopscience.iop.org/0957-4484/24/16/165601)
Download details:
IP Address: 130.220.71.24
The article was downloaded on 28/03/2013 at 01:35
Please note that terms and conditions apply.
View the table of contents for this issue, or go to the journal homepage for more
Home Search Collections Journals About Contact us My IOPscience

IOP PUBLISHING NANOTECHNOLOGY
Nanotechnology 24 (2013) 165601 (14pp) doi:10.1088/0957-4484/24/16/165601
Melt compounding with graphene todevelop functional, high-performanceelastomersSherif Araby1,2, Izzuddin Zaman1, Qingshi Meng1,Nobuyuki Kawashima3, Andrew Michelmore3, Hsu-Chiang Kuan4,Peter Majewski1, Jun Ma1,3,6 and Liqun Zhang5,7
1 School of Engineering, University of South Australia, SA5095, Australia2 Department of Mechanical Engineering, Faculty of Engineering, Benha University, Egypt3 Mawson Institute, University of South Australia, SA5095, Australia4 Department of Energy Application Engineering, Far East University, Tainan County 744, Taiwan5 Key Laboratory for Nanomaterials, Ministry of Education; Beijing University of Chemical Technology,Beijing 100029, People’s Republic of China
E-mail: [email protected] and [email protected]
Received 14 September 2012, in final form 4 March 2013Published 27 March 2013Online at stacks.iop.org/Nano/24/165601
AbstractRather than using graphene oxide, which is limited by a high defect concentration and costdue to oxidation and reduction, we adopted cost-effective, 3.56 nm thick graphene platelets(GnPs) of high structural integrity to melt compound with anelastomer—ethylene–propylene–diene monomer rubber (EPDM)—using an industrial facility.An elastomer is an amorphous, chemically crosslinked polymer generally having rather lowmodulus and fracture strength but high fracture strain in comparison with other materials; andupon removal of loading, it is able to return to its original geometry, immediately andcompletely. It was found that most GnPs dispersed uniformly in the elastomer matrix,although some did form clusters. A percolation threshold of electrical conductivity at 18 vol%GnPs was observed and the elastomer thermal conductivity increased by 417% at 45 vol%GnPs. The modulus and tensile strength increased by 710% and 404% at 26.7 vol% GnPs,respectively. The modulus improvement agrees well with the Guth and Halpin-Tsai models.The reinforcing effect of GnPs was compared with silicate layers and carbon nanotube. Oursimple fabrication would prolong the service life of elastomeric products used in dynamicloading, thus reducing thermosetting waste in the environment.
S Online supplementary data available from stacks.iop.org/Nano/24/165601/mmedia
(Some figures may appear in colour only in the online journal)
1. Introduction
Of all engineering materials, polymers have undergone themost rapid increase in industrial applications over the past
6 Address for correspondence: School of Engineering, University of SouthAustralia, Mawson Lakes, SA 5095, Australia. http://people.unisa.edu.au/jun.ma.7 Address for correspondence: Beijing University of Chemical Technology,Beijing 10029, People’s Republic of China.
four decades, owing to their high specific strength and lowmanufacturing cost. However, their limitations include lackof electrical and thermal conductivity for most polymers,poor strength for elastomers and brittleness for thermosets,which severely limit their applications. To overcomethese disadvantages, polymer nanocomposites are producedby compounding nanoparticles into polymers to achievesignificantly improved or new properties beyond those oftraditional particle-filled composites. Nanocomposites are
10957-4484/13/165601+14$33.00 c© 2013 IOP Publishing Ltd Printed in the UK & the USA

Nanotechnology 24 (2013) 165601 S Araby et al
generally classified by the geometries of the nanoparticles—particulate (e.g. silica) [1], layered (silicate layers) [2],and fibrous geometries (nanotubes) [3]—of which layeredpolymer nanocomposites have shown the greatest mechanicaland barrier properties, and attracted the most extensiveresearch and development due to the fillers’ high specificsurface area, functionality and cost-effective fabrication [4].However, the challenge is to provide layered nanocompositeswith more functionalities, such as electrical and thermalconductivity. Electrically conductive composites are crucialin aerospace applications such as lightening strike dissipationin aircrafts and electrical charge mitigations in space vehiclesin charged space environments. Thermal conductivity playsa key role in dissipating heat build-up in elastomeric parts,such as tyres and vehicle track pads, which are used indynamic loading environments. The improvement of thermalconductivity is able to significantly improve the service life ofelastomers and thus reduces the impact of thermoset waste onthe environment.
Elastomers are not only used in manufacturing tyres,conveyor belts and hoses, but for toughening brittlepolymers [5, 6]. Since most neat elastomers are notmechanically strong, a number of nanoadditives havebeen explored, including the well-known carbon black,thermoplastics [7] and the recently explored clay [8–11] andstarch [12, 13]. While carbon black remains the dominantfiller for conductive polymer composites, carbon nanotubeshave attracted extensive interest in recent years, becausesufficient functionalities can be achieved at low percolationthresholds due to the high aspect ratio of nanotubes. However,it has not yet reached the situation where carbon nanotubesare suitable for use in functional polymer nanocomposites,because of expensive manufacturing costs and the highviscosity caused by the ‘bird’s nest’ structure of the entangledtubes. By contrast, graphene—a flat sheet of carbon just oneatom thick—is a new class of promising filler for functionalnanocomposites: its parent graphite is abundant in nature andthus cost effective as a raw material, and it is the stiffestand strongest material measured to date (Young’s modulus1 TPa and intrinsic strength 130 GPa) while upon loading itcan elongate by 25% of its original length. Graphene carrieshigher electrical/thermal conductivity and provides higherreinforcement [14] than multi-walled carbon nanotubes,isotropic electrical/thermal conductivities on the grapheneplane, low viscosity when compounded with a polymer, andnon-toxicity. A hypothesis made in this study was that, withappropriate (i) ratios of carbon to oxygen and (ii) dispersionand exfoliation, graphene should significantly improve thestiffness, strength and electrical/thermal conductivities ofpolymers.
When graphene is fabricated by micromechanicalexfoliation of graphite, its yield is too low to producepolymer nanocomposites [15, 16]. Graphene oxide hasbeen extensively studied, but its fabrication involves harshoxidation and either chemical or thermal reduction [4,17]. Although thermal reduction removed nearly all oxygenatoms, it just fixed a small fraction of defects, leading toorders of magnitude lower electrical conductivity and 75%
reduced stiffness [18]. Studies of nanocomposites based ongraphite intercalation compounds (GICs) started in the 1990s,where commercial GICs at less than $10 kg−1 were treatedwith rapid heating or thermal shock to produce looselystacked graphite platelets. Our recent research [19, 20] hasshown that this method in combination with sonication insolvent can produce graphene platelets (GnPs) of 2–4 nmin thickness, which contain only 7% atomic oxygen. Sinceprevious research has shown that acidification and thermalexpansion can increase the graphene thickness to∼1 nm [21],each of our GnPs may comprise 3–4 graphene layers. Onincreasing the number of graphene layers from one to three,the stiffness does not change and the fracture strength reduces23% from 130 to 101 GPa [22]. Given that the fracturestrength of most polymers ranges from 1 to 80 MP, theseGnPs should suffice to toughen or reinforce polymers. Moreimportantly, Raman spectroscopy demonstrated a low ID/IGratio for GnPs, implying a high structural integrity for theretention of exceptional performance from its sister graphene.It is worth mentioning that GnPs are different to graphitenanoplatelets in thickness; graphite nanoplatelets are muchthicker (tens to a few hundreds in thickness) and thusapproximate the properties of graphite. In a previous work, apercolation threshold of 0.612 vol% was made for epoxy/GnPnanocomposites, and such a low threshold cannot be achievedusing graphite nanoplatelets. Therefore, GnPs represent atechnological advance over graphite nanoplatelets.
Three methods for compounding nanoadditives withpolymers include in situ polymerization, solution mixingand melt compounding; of these, melt compounding holdsthe most promise for industrial applications due to itsenvironmental friendliness and compatibility with industrialpractice. However, all previous work for fabrication ofelastomer/graphene nanocomposites avoided this method dueto the high graphene production cost and the difficultyin dispersing graphene in the matrix. Zhang et al firstcompounded an elastomer with microwave-expanded graphiteby latex compounding; at∼10 wt%, thermal conductivity wasenhanced from 0.19 to 0.30 W m−1 K−1, the tensile strengthimproved from 4 to 12 MPa, but fracture strain reduced [23].When the same method was applied in mixing naturalrubber and graphene oxide, no better thermal conductivityenhancement was reported [24]. Guo adopted solutionmixing; at 10 wt% graphene oxide, the tensile strength ofbutyl rubber improved from 0.2 to 0.8 MPa [25]. Zhangsolution-compounded graphene oxide with nitrile-butadienerubber; at 0.44 vol% the tensile strength reached a maximumimprovement of 50% [26].
In spite of these efforts, fundamental questions not yetaddressed include (i) whether graphene has the potential tomarkedly improve the thermal conductivity of elastomers forthe release of internal heat rise; and (ii) if graphene doesthe job, then will it be possible to use the current industrialfacilities—two-roll mills and internal mixers—for fabricationof these advanced materials.
In this paper, as summarized in figure S1 (in theonline supporting information available at stacks.iop.org/Nano/24/165601/mmedia), we will present a melt compound-ing approach to fabricate functional, mechanically strong
2

Nanotechnology 24 (2013) 165601 S Araby et al
Table 1. Recipes of elastomer compounds.
Material Weight (g)
EPDM 100Dicumyl peroxide (DCP) 4Sulfur 1N,N ′-m-phenylenebismaleimide (HVA-2) 1GnPs Variable
elastomer nanocomposites, which include (i) using a two-rollmill, to mix GnPs with a popular elastomer in industry:ethylene–propylene–diene monomer rubber (EPDM), and(ii) investigating the structure–property relations of thesenanocomposites. Our investigation shows that this methodis indeed an industry-compatible approach to make highlydispersed inorganic/organic nanohybrids with good controlson the structure and properties.
2. Experimental section
2.1. Materials
Jilin Petrochemical Limited, China provided ethylene–propylene–diene monomer rubber (EPDM 4045, ethylenecontent 53%–59% with a Mooney viscosity of ML (1 + 4)at 100 ◦C = 38–52). Curing chemicals were listed in table 1.A commercial graphite intercalated compound (GIC, Asbury3494) was kindly provided by Asbury Carbons, Asbury, NJ.Curing chemicals and GIC were used as received withoutfurther purification.
2.2. Preparations
Graphene platelets. One gram of GIC was weighed,transferred to a preheated crucible inside a furnace at 700 ◦Cand treated for 1 min. The crucible was taken out and leftin a fume cupboard to allow the expanded product to cooldown. Afterwards, the product was immersed in acetone ina metal container with mechanical stirring for 10 min. Thenthe container was covered and treated in an ultrasonicationbath (200 W, 42 kHz) for 1 h. During sonication, the expandedproduct was able to split into graphene platelets (GnPs) [27].GnPs were separated from acetone by filtration, followedby a drying process using a ventilated oven and a vacuumoven; this produced the densified GnPs. The densificationcan reduce the nanoparticles’ inhalation hazard during meltcompounding. A similar method was coincidently used byHyunwoo et al [28].
Melt mixing. GnPs were mixed with the elastomer usinga two-roll mill, during which GnPs were gradually addedto prevent loss. Following the addition of GnPs into theelastomer, the roll gap was increased and reduced a few timesto uniformly disperse GnPs in the matrix. After the mixturecooled to room temperature, curing chemicals were added andmixed using a similar procedure, with a careful control overthe temperature rise that may cause premature crosslinking.The elastomer and its nanocomposites were vulcanized at
150 ◦C under 3 MPa for 30 min. 3 MPa was chosen becauseit can produce similar mechanical properties to those obtainedunder high-pressure curing.
Since weight fractions were used in our experiments, weadopted equation (1) to convert to volume fractions.
Vf =ρmWf
ρf(1−Wf)+ ρmWf(1)
where ρ and W are the density and weight fraction,respectively. Subscripts m and f refer to matrix and filler,respectively. Density values of the elastomer and GnPs weretaken as 1.2 g cm−3 and 2.26 g cm−3, respectively.
2.3. Nanocomposite characterizations
X-ray diffraction (XRD) was used to investigate the layeredstructure of GIC, GnPs and their nanocomposites. XRDmeasurements were operated at room temperature using aMini-Materials Analyzer (MMA). The x-ray diffractometerwas tuned to Cu Kα radiation at 35 kV and 12 kW. Spectrawere collected under a reflection mode at 1◦ min−1 between2θ = 2–45◦.
AFM images of GnPs were taken with a NT-MDT SPMinstrument using NSG03 non-contact ‘golden’ cantilevers.The samples were prepared by (i) suspending GnPs in acetoneat 0.0004 wt% through 60 min sonication and (ii) dropping thesolution on a silicon wafer, followed by drying.
Transmission electron microscopy (TEM, PhilipsCM200) was conducted to provide two-dimensional imagesfor the 2.8 vol% nanocomposite. Sections of ∼60 nm inthickness were made at −120 ◦C and observed at 200 kV.
Scanning electron microscopy (SEM, Philips XL30FEG-SEM) was conducted to examine the tear-fracturedsurface of the nanocomposites at 10 kV. The sample surfacewas coated with a thin layer of platinum.
Tensile properties were measured by Instron 5567 usinga 2 kN load cell at 100 mm min−1. Two days aftercuring, dumbbell samples were die cut for tensile tests whilenon-nicked specimens were cut to measure the tear strength.Young’s moduli, measured as the slope in the initial straightportion of the stress–strain curve, were computed usingsoftware at a strain range 0.003%–1%. Non-nicked specimenswere cut and tested at 100 mm min−1 to obtain the maximumload that the specimens can withstand. All the reported valuesare the average of five testing results.
A dynamic mechanical analyser 2890 (TA Instrument,Inc., USA) was used to measure the storage modulus, lossmodulus and mechanical loss factor of the elastomer and itsnanocomposites using a tensile mode, at a frequency of 1 Hz,strain 1%, heat rate 5 ◦C min−1 and temperature range−80 to0 ◦C.
Electrical volume resistivity was measured for allspecimens by a two-point-probe high-resistance meter(Agilent 4339B and 6000B cell) according to ASTMD257-99, with five testings taken to obtain an averageof volume resistivity at 5 V. Thermal conductivity wasmeasured by a thermal conductivity Tester HC-110, which isa microprocessor-based instrument for testing in accordance
3

Nanotechnology 24 (2013) 165601 S Araby et al
Figure 1. XRD patterns of a raw graphite intercalation compound (GIC), washed GIC, expanded product and densified graphene platelets(GnPs).
with ASTM C 518, ISO 8301 and JIS A 1412, with a samplesize �51 × 6 mm and the temperatures of top and bottommoulds set as 50 and 30 ◦C, respectively.
A swelling test was performed through immersing thesamples (dimension 20 × 20 × 2 mm) into toluene for threedays. The samples were weighed to obtain W1, and thenimmersed into toluene for three days; these sopped sampleswere wiped and weighed to obtain W2. All sample weights,before and after swelling, have been corrected to exclude theGnPs in the samples. The swelling ratio is determined byequation (2):
ζ =W2 −W1
W1. (2)
The crosslink density (ve) is calculated using the Flory–Rehner equation [29]:
ve = −ln(1− Vr)+ Vr + χV2
r
Vs(3√
Vr − 0.5Vr)(3)
where Vs, the molar volume of solvent, is 106.3 cm3 mol−1
for toluene, and χ , taken as 0.496, is the Flory/Hugginsinteraction parameter between toluene and the elastomer [30].The rubber volume fraction was calculated according to theequation:
Vr =W1
W1 + η(W2 −W1)(4)
where η is the ratio of elastomer to toluene density.
3. Results and discussion
3.1. Morphology
Graphene plateletsFigure 1 contains XRD patterns of a graphite intercalation
compound (GIC), washed GIC, expanded product anddensified graphene platelets (GnPs). GIC is formed byintercalating atomic or molecular layers of different chemical
species, such as alkali metals and bisulfate, between graphenelayers. The number of graphene layers between the adjacentintercalated chemicals is known as a stage number, rangingfrom 1 to 5 [31, 32]. Washing GIC leads to an increasein the diffraction intensity (from diffraction (a) to (b) infigure 1) because all or part of these intercalated chemicalswere removed by washing, leading to an increase in thestacking coherence; this is shown in the illustration nextto figure 1. Figure 1(c) illustrates that, upon expansion, allstages may separate from each other or even be exfoliated,but the layered graphene structure should be retained ineach stage, and this explains why only slight diffraction((c) in figure 1) is seen after the thermal treatment. Thediffraction pattern of the densified GnPs shows no shift in2θ because the stages were expanded and even disorderlyexfoliated in the fabrication while the layered structurein each stage remained. This conclusion is in agreementwith two studies [33, 34]. The diffraction intensity andwidth (figure 1(d)) increases obviously after the densificationbecause GnPs stacked themselves through the densificationprocess. Later we will show that these stacked GnPs areable to separate themselves in the polymer matrix by meltcompounding.
Atomic force microscopy (AFM) was adopted to measurethe thickness of 20 randomly selected platelets, and onerepresentative measurement is shown in figure 2. Thethickness was measured as 3.55 ± 0.32 nm, in line withour recent work [19]. Since thermal expansion was reportedto produce an ∼1 nm thick graphene layer [35], each GnPproduced in our study may contain 3–4 graphene layers.
It is important to keep the GnP thickness as low (must benanoscale) as possible, because (i) the total number of GnPsand their surface area in a given volume of a nanocompositeabruptly increase with reduction in the thickness, and (ii) lowthickness reduces the negative effect of the poor through-planefunctional and mechanical properties of graphene. We herebydevelop a model to illustrate the effect of GnP thickness onthe number of GnPs and their surface area in a matrix.
4

Nanotechnology 24 (2013) 165601 S Araby et al
Figure 2. AFM measurement of the thickness of graphene platelets dispersed in acetone.
Figure 3. Number of graphene platelets (left) and their total surface area (right) in a given volume of matrix.
The total number of GnPs (N) in a volume of a compositeis:
N =V
v(5)
v = l ∗ w ∗ t (6)
where V and v are the nanocomposite and graphene volumes,respectively, while l,w, and t are the length, width, andthickness of graphene, respectively.
Assuming that the volume percentage of graphene in thenanocomposite is ϕ%, thus equation (5) can be updated as:
N =ϕ ∗ V
100 ∗ l ∗ w ∗ t. (7)
The total surface area of graphene (S) inside thenanocomposite can be computed by equation (8);
S = (2 ∗ l ∗ t + 2 ∗ l ∗ w+ 2 ∗ w ∗ t) ∗ N. (8)
Assuming that: (i) the volume of the nanocomposite is10 µm3, (ii) GnPs are at a percentage of 1 vol%, (iii) eachplatelet is to be treated as a rectangular cuboid whose lateraldimension (length and depth) is 1×1 µm, the total number ofgraphene equals:
N =10 ∗ 109 (nm3) ∗ 1
100 ∗ 1 ∗ 1000 (nm) ∗ 1 ∗ 1000 (nm) ∗ t (nm). (9)
The total surface area of GnPs is obtained by
S− (2 ∗ 1 ∗ 1000 ∗ 1 ∗ 1000+ 4 ∗ 1000 ∗ t) ∗ N. (10)
In figure 3, both the GnP number and their total surfacearea reduce dramatically when the thickness increases from 1to 5 nm, demonstrating the necessity to keep the thickness aslow as possible.
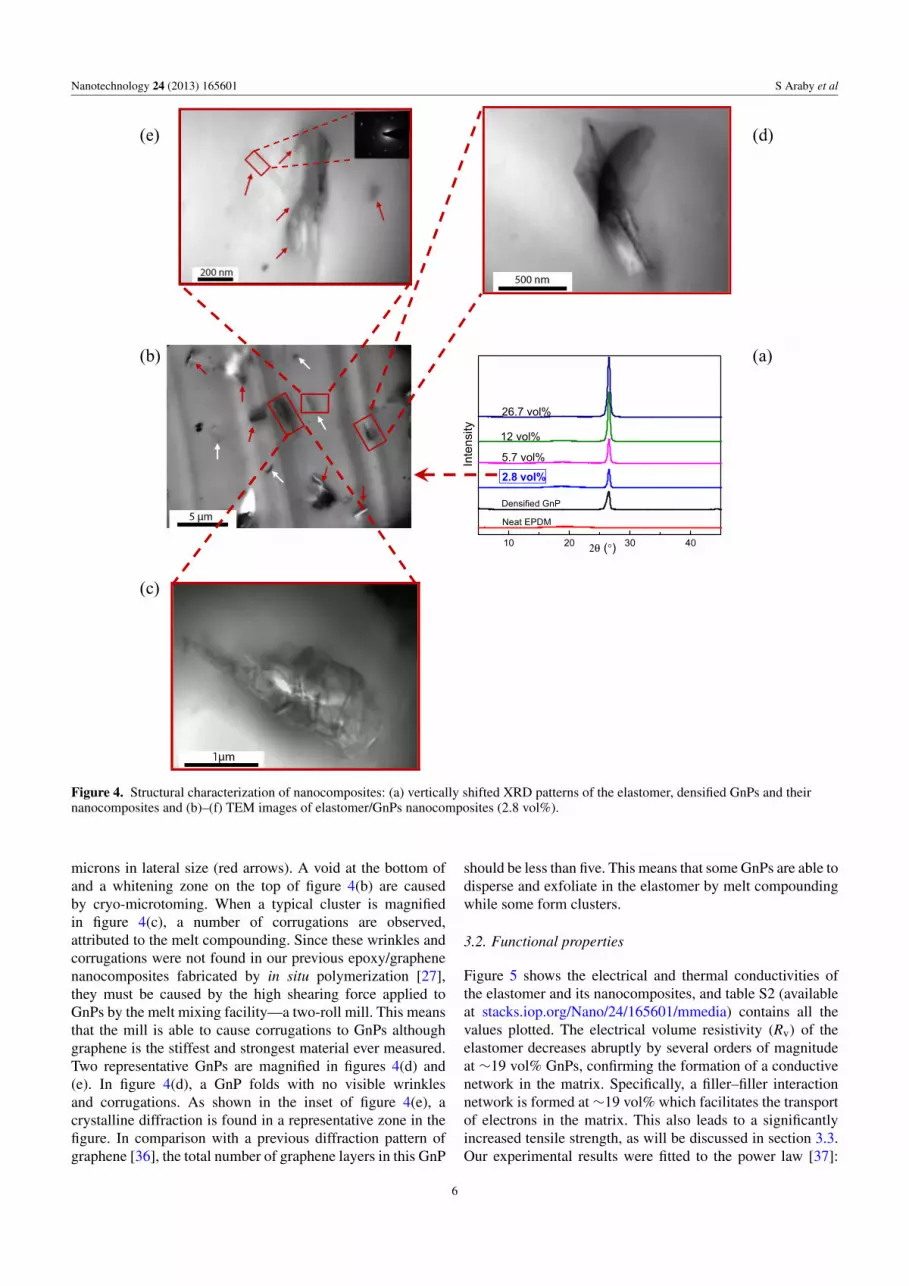
Elastomeric nanocompositesFigure 4(a) contains XRD patterns of elastomer/GnP
nanocomposites. While no obvious diffraction is seen for theelastomer due to its amorphous structure, all nanocompositesshow diffraction at 2θ = 26.5◦ assigned to the layeredstructure of graphite, indicating the retention of the layeredstructure in each platelet. Specifically, there are two levelsof layered structure for GnPs in the matrix: one relates tothe layer spacing of graphene in each GnP and the otherdescribes the spacing between GnPs. While the layer spacingbetween GnPs may change during melt compounding (figureS1 available at stacks.iop.org/Nano/24/165601/mmedia), thespacing in each GnP should be retained through all theseprocesses. The increased diffraction intensity in figure 4(a)implies that more GnPs appear in a given volume of matrix.
Figures 4(b)–(e) contain TEM micrographs of the2.8 vol% elastomer/GnP nanocomposite. Two types ofdispersion phases are visible in figure 4(b), including (i)homogeneously dispersed GnPs of lateral dimension smallerthan 1 µm (white arrows) and (ii) GnP clusters of over a few
5
Nanotechnology 24 (2013) 165601 S Araby et al
Figure 4. Structural characterization of nanocomposites: (a) vertically shifted XRD patterns of the elastomer, densified GnPs and theirnanocomposites and (b)–(f) TEM images of elastomer/GnPs nanocomposites (2.8 vol%).
microns in lateral size (red arrows). A void at the bottom ofand a whitening zone on the top of figure 4(b) are causedby cryo-microtoming. When a typical cluster is magnifiedin figure 4(c), a number of corrugations are observed,attributed to the melt compounding. Since these wrinkles andcorrugations were not found in our previous epoxy/graphenenanocomposites fabricated by in situ polymerization [27],they must be caused by the high shearing force applied toGnPs by the melt mixing facility—a two-roll mill. This meansthat the mill is able to cause corrugations to GnPs althoughgraphene is the stiffest and strongest material ever measured.Two representative GnPs are magnified in figures 4(d) and(e). In figure 4(d), a GnP folds with no visible wrinklesand corrugations. As shown in the inset of figure 4(e), acrystalline diffraction is found in a representative zone in thefigure. In comparison with a previous diffraction pattern ofgraphene [36], the total number of graphene layers in this GnP
should be less than five. This means that some GnPs are able todisperse and exfoliate in the elastomer by melt compoundingwhile some form clusters.
3.2. Functional properties
Figure 5 shows the electrical and thermal conductivities ofthe elastomer and its nanocomposites, and table S2 (availableat stacks.iop.org/Nano/24/165601/mmedia) contains all thevalues plotted. The electrical volume resistivity (Rv) of theelastomer decreases abruptly by several orders of magnitudeat ∼19 vol% GnPs, confirming the formation of a conductivenetwork in the matrix. Specifically, a filler–filler interactionnetwork is formed at∼19 vol% which facilitates the transportof electrons in the matrix. This also leads to a significantlyincreased tensile strength, as will be discussed in section 3.3.Our experimental results were fitted to the power law [37]:
6

Nanotechnology 24 (2013) 165601 S Araby et al
Figure 5. Electrical volume resistivity and thermal conductivity ofthe elastomer and its nanocomposites.
Table 2. Electrical volume resistivity at different preparation stagesfor the nanocomposites at 26.7 vol%.
Sampleno. Fabrication Rv (� cm)
1 Elastomer mixed with 26.7 vol% GnPs andcuring chemicals
3.24× 10¹³
2 Similar to sample 1, but exposed to 3 MPawithout heating
2.59× 10¹⁴
3 Similar to sample 2, but with heating forvulcanization
2.44× 10⁷
σc ∝ (ϕ − ϕt)t, where σc is the composite conductivity, ϕt is
the percolation threshold expressed as a volume fraction, andt is the universal critical exponent. The fitting results (see SI)reveal that (i) the percolation threshold is at ϕt = 19 vol%, and(ii) t = 1.3, with a regression coefficient R2
= 98%.Since the nanocomposites were prepared by a two-step
process including (i) mixing the elastomer with GnPs andother additives and (ii) crosslinking, we were curious toidentify which step plays a critical role in creating theconducting network. Hence, a number of samples weredesigned, fabricated and analysed as below. Sample 1 wasmade by melt mixing the elastomer with 26.7 vol% GnPsand other additives; Sample 2 was produced by applying apressure of 3 MPa to a similar sample to Sample 1 for 30 minat room temperature; and Sample 3 was created by applying3 MPa to a similar sample to Sample 1 for 30 min at 150 ◦Cfor curing. All these samples were tested for Rv. In table 2,only the cured sample shows a much reduced Rv, implyingthat vulcanization is critical to create a filler–filler interactionnetwork by promoting the dispersion and exfoliation of GnPs.XRD was employed to further identify the structure of thesenanocomposites in figure S3 (available at stacks.iop.org/Nano/24/165601/mmedia). The cured sample demonstrates afar lower intensity of diffraction, and this curing effect on thenanocomposite structure is shown in the schematics next tothe XRD in figure S3 (available at stacks.iop.org/Nano/24/165601/mmedia).
Since graphene is known for its higher thermalconductivity than copper, we were intrigued to investigatethe thermal conductivity of these materials. Although
previous work focused merely on the thermal conductivityof thermoplastics or thermosetting resins [38–41], thermallyconductive elastomers are of more significance for productsused in dynamic loading environments, such as tyres andconveyor belts [42]. Elastomers are inherently insulating,producing tremendous heat build-up in dynamic loadingenvironments—the internal built-up temperature can be ashigh at 150 ◦C causing macromolecular chain scission.Thermal degradation caused by heat build-up is the majorageing mechanism for these elastomers [42].
In figure 5, 45 vol% GnPs enhance the thermalconductivity of the elastomer by 407%. To the best of ourknowledge, this is the maximum improvement in thermalconductivity for elastomer-based nanocomposites fabricatedby melt compounding. Yanhu et al [24] reported a slightincrease (12% at 2 wt% graphene) in the thermal conductivityof natural rubber/graphene nanocomposites prepared viasolution compounding. Our finding indicates the greatpotential to improve the thermal energy dissipation ofelastomers, which in turn prolongs the service life ofelastomeric products.
Since thermal energy is transferred through phonons(lattice vibrations), better coupling in the vibration modesat the GnP–elastomer and GnP–GnP interfaces provides alower thermal resistance [43–45]. In this study, the GnP–GnPdistance reduces with increasing GnP fraction, leading to animprovement in both electrical and thermal conductivity. Theelastomeric nature of these materials and the much smallercontrast of thermal conductivity between the elastomer andgraphene (compared to electrical conductivity) may be thetwo reasons why a higher filler loading is required to attaina significant improvement in thermal conductivity.
3.3. Mechanical and thermal dynamic properties
Figure 6(a) contains stress–strain graphs of the elastomer andits nanocomposites. Tensile strength increases markedly withincreasing GnP content, implying a significant reinforcement;strain at fracture increases with GnP content until 12 vol%,followed by a reduction. These changes are explained below.
Without loading, a cured neat elastomer is composedof crosslinked molecular chains which are highly twisted,kinked and coiled. Upon loading, these chains partially uncoil,untwist and straighten, resulting in elongation in the loadingdirection (figure 6(b)). Rupture of chains occurs when theloading exceeds a critical value, and this leads to strain atfracture.
The addition of GnPs into the elastomer creates threeeffects: (i) providing stiffness and strength, since graphene isthe stiffest and strongest material ever measured; (ii) actingas more crosslinking points in addition to the crosslinkedchains, which actually makes the matrix stiffer and stronger;(iii) acting as a connector bridging different chains, and thisindeed increases the matrix molecular weight, leading to anenhancement in strain at breakage (figure 6(c)). The first twoeffects explain why the GnP addition obviously increases thestiffness and strength.
7

Nanotechnology 24 (2013) 165601 S Araby et al
Figure 6. (a) Stress–strain relations of the elastomer and its nanocomposites, (b)–(d) schematics of tensile deformation of: (b) neatelastomer; (c) a nanocomposite at a low GnP fraction and (d) a nanocomposite at a high GnP fraction.
With increases in GnP content, the tensile strength isenhanced since GnPs stiffen and strengthen elastomers. The26.7 vol% nanocomposite shows reduced strain at fracture,caused by the confining effect of GnPs on chain deformation(figure 6(d)). At 26.7 vol%, GnPs start contacting eachother, as explained in section 3.2, and this limits the chaindeformation under loading, causing the reduction of fracturestrain (figure 6(d)).
Young’s modulus and tear strength are shown infigure 7(a). Steady improvements of both properties areobvious; at 26.7 vol% GnPs, the modulus and tensile strengthof the elastomer improve by 710% and 404%, respectively,implying a good dispersion of GnPs. The good dispersionwould provide greater interface between GnPs and the matrixso that GnPs are able to share a higher fraction of load upondeformation.
Of various viscoelastic polymers, elastomers show farhigher elasticity than their peer thermoplastics, but this highelasticity may be reduced by the addition of reinforcementnanoadditives. We measured how quickly and completelythe deformed elastomer and its 12 vol% nanocompositerecovered after loading. These samples were tested forfracture strength first. Once 70% of the fracture loadingwas applied to the samples, the loading was removed and
their elongation was measured as a function of time. Infigure 7(b), the elastomer recovers its original geometry after10 min of testing, while the recovery of the nanocompositetakes more time and is not 100% complete. GnPs in thematrix present a physical barrier to the molecular deformationof the elastomer under loading, causing more chains torupture, and thus the loaded nanocomposite cannot recovercompletely. By contrast, the chains of the elastomer under theloading partially uncoil, untwist and straighten, and all thesedeformations are completely recoverable.
Tear strength measures the resistance of an elastomerto tear. Since most elastomeric products often undergo atear-failure mode during their service, improving tear strengthis of significance. In figure 7(a), tear strength increasesby 270% at 26.7 vol% GnPs. Although the underlyingmechanisms of tensile rupture and tearing are much the same,tearing is generally distinguished from tensile deformation byits association with a significantly higher stress concentrationon the starting fracture point due to its notch geometry. Thisimprovement in tear strength was attributed to the presenceof GnPs in the nanocomposites, where the two-dimensionalplatelets may block the propagation of cracks. It is known thata good interface is able to (i) transfer a fraction of load fromthe matrix to the dispersion phase and (ii) restrain the matrix
8

Nanotechnology 24 (2013) 165601 S Araby et al
Figure 7. Mechanical properties of the elastomer and its nanocomposites: (a) tear strength and Young’ modulus, (b) strain recovery of theelastomer and its 12 vol% nanocomposites, and (c), (d) storage modulus, tan δ, and loss modulus as a function of temperature.
molecular deformation in the vicinity of the interface, leadingto a high level of energy absorption in the crack propagationpathway [5, 6, 46, 47]. An exceptional interface region frominorganic to organic can be as long as a few centimetres [47],but its thickness is often difficult to measure in polymernanocomposites. This highly improved tear strength impliesan effective interface transferring load, demonstrating goodcompatibility between GnPs and elastomer molecular chains.
Figures 7(c) and (d) present the temperature dependenceof storage modulus, loss modulus and loss factor tan δ forthe elastomer and its nanocomposites, with detailed valuessummarized in tables S5 (available at stacks.iop.org/Nano/24/165601/mmedia). At −40 to −25 ◦C, the storage modulus ofthe elastomer drops abruptly. The storage modulus across alltemperature ranges increases with increasing GnP fraction.For instance, the storage modulus improves by 2536% and159% at 12 vol% GnPs in the glass and rubbery regions,respectively. The modulus increase is attributed to (i) theresilient nature of graphene, as it features a modulus of 1 TPa,fracture strength 100 GPa and fracture strain 25%, and underloading GnPs transfer stress by sharing fractions of load andrestrain the movement of matrix molecules in their vicinity;and (ii) the presence of GnPs in the matrix which act as morephysical crosslinks. Although no chemical modification wasmade on GnPs, an exponential increase in dynamic modulusat high fraction is obtained, confirming the good compatibilityand the strong adhesion between GnPs and the elastomer incomparison with clay filler.
The glass transition temperature (Tg), which is measuredat the maximum tan δ value, increases with GnP contents.
In table S5 (available at stacks.iop.org/Nano/24/165601/mmedia), the 5.7 vol% GnPs increase Tg by 2.2%, whichconfirms the quite good interfacial interaction between GnPsand the matrix, resulting in a decrease in the mobility ofelastomer chains over/between GnPs surfaces during dynamicmechanical loading, in agreement with our previous work onpolymer nanocomposites [13, 27, 48, 49].
DMA damping graphs—loss modulus versus temperature—demonstrate that the crosslinked macromolecular motionin the matrix is able to absorb and dissipate fracture energyat different temperatures. In general, the larger the areaunder the graph, the less susceptible the material is totearing [51]. In figure 7(d), a transition zone is seen ataround −27 ◦C, and the increase in loss modulus is far higherbelow the transition temperature. This points towards a highdamping property of the nanocomposites, in particular at lowtemperatures, implying a significantly improved resistance totearing contributed by GnPs.
3.4. Crosslink density
Most elastomers are of no commercial value unless properlycrosslinked. The swelling ratio of elastomers often reduceswith increasing crosslink density, as crosslinking limits theswelling of macromolecules. Using equations (2) and (3)in section 2, the swelling ratio and crosslink density ofthe elastomer and its nanocomposites were calculated andare presented in figure 8 and table S3 (available at stacks.iop.org/Nano/24/165601/mmedia). Using the Flory–Rehnerequation [29], we excluded the weight of GnPs from
9

Nanotechnology 24 (2013) 165601 S Araby et al
Figure 8. Swelling ratio and crosslink density of the elastomer andits nanocomposites.
the samples. Generally, with increasing GnP fractions, thecrosslink density increases significantly while the swellingratio reduces obviously, e.g. a 170% increase in crosslinkdensity and a 36% reduction in swelling ratio at 26.7 vol%GnPs. This is caused by the presence of GnPs in the matrix.Through melt compounding, elastomer macromoleculesentangled with GnPs and may migrate into the GnP spacing,promoting the exfoliation and dispersion of GnPs. As theratio of curing chemicals to elastomer was kept identical inthe fabrication process, these GnPs must provide physicalcrosslink points as shown in figure 6, contributing to thehighly improved crosslink density. The presence of GnPscreates a tortuous path, reducing the diffusion of solventmolecules, which contributes to the remarkably reducedswelling ratio.
3.5. Fracture analysis
Scanning electron microscopy (SEM) was adopted toinvestigate whether GnPs are uniformly dispersed in theelastomer and identify the filler–matrix interface strength.Figure 9 presents typical SEM micrographs of the tear-fractured surfaces of the elastomer and its nanocomposites.In figure 9(a), the elastomer fracture surface is smooth andshows no signs of matrix deformation. In contrast, the fracturesurfaces of all nanocomposites are obviously rough, implyingthat GnPs play an important role in reinforcing the elastomer.
In figure 9(b), GnPs are uniformly dispersed in the matrixand a number of ridges (as indicated by red arrows) arevisible. When a typical zone is magnified in figure 9(c),three white particles are found to coexist with many tinyparticles that should be either GnPs or their clusters; thesetwo types of dispersion phase correspond to our TEM analysis(figures 4(b)–(e)). Figure 9(d) shows details of one whiteparticle, where layers are clearly visible; this particle mustbe a giant GnP cluster consisting of a few GnPs joined byelastomer chains; matrix deformation as shown by the redarrow indicates a quite good interface between cluster andmatrix, albeit no interface modification was made in thisstudy. Under loading, the interface effectively transfers a
fraction of load from the matrix to the GnPs and their clusters;when deformation occurs, it restrains the movement of matrixmolecules in the vicinity of these dispersion phases.
At 26.7 vol% GnPs, a wavy structure is predominantacross the tear-fractured surface in figure 9(e). A typicalzone magnified in figure 9(f) shows more detail—this wavystructure might consist of GnPs, most of which are alignedunder the curing pressure. Examination of figures 9(g)and (h) reveals two phenomena: no layer breakage occursand no matrix is visible; this means elastomer molecules(i) intercalating into the spacing between GnPs and (ii)combining with GnPs. This explains the formation ofwave-like deformation under loading.
3.6. Modelling the mechanical properties
Comparing experimental data with theoretical modelscontributes to the design of composites. A composite stiffnessis influenced by different factors, such as the stiffness ofits constitutive phases, volume fraction of filler, morphologyand the interface [50–52]. In this work, Young’s moduliwere compared with theoretical predictions. To interpretthe variation of stiffness, the measured Young’s moduliwere fitted into two models: the Guth model [53] and theHalpin–Tsai model [54], since both provide good predictionsat small strain values [55]. The Guth model predictsthe stiffness of composites filled with spherical particles,expressed as
E = Eo(1+ 2.5V + 14.1V2) (11)
where E and Eo are the Young’s moduli of composite andmatrix, respectively, and V is the filler volume fraction. Thismodel was updated by Guth for nonspherical fillers by addinga shape factor or an aspect ratio f :
E = Eo(1+ 0.67fV + 1.62f 2V2). (12)
The linear term accounts for the reinforcing effect ofindividual fillers and the high order term is for the contributionfrom filler–filler interactions [56]. The Halpin–Tsai modelwas used to predict the stiffness of the aligned filler compositeas a function of aspect ratios and volume fractions. Thepredicted Young’s modulus in the longitudinal directionparallel to the aligned fillers is calculated by:
E =Eo(1+ 2fβV)
1− βV(13)
where β is given by
β =(Ef/Eo)− 1(Ef/Eo)+ 2f
(14)
where Ef is the filler stiffness. In the case of nanocompositeswhere there is a huge contrast of Young’s modulus betweenthe filler and matrix, such as this study (E = 1 MPa for theelastomer while E = 1 TPa for graphene), the Halpin–Tsaimodel can be reduced to
E = Eo1+ 2fV
(1− V). (15)
10

Nanotechnology 24 (2013) 165601 S Araby et al
Figure 9. SEM images of the elastomer (a), and its 2.8 vol% (b)–(d) and 26.7 vol% (e)–(h) nanocomposites.
In figure 10, the experimental results are in goodagreement with all predicted values using both models, inparticular at low fractions. The best fitting was found at f = 8,very close to those reported in [55, 56]. The aspect ratio f maybe a lot lower than that of GnPs, owing to (i) restacking ofGnPs during the nanocomposite fabrication, such as formationof the clusters shown in figures 4 and 9, and (ii) reduction inthe GnP lateral dimension caused by the high shearing forceduring melt compounding (figure 4(d)).
3.7. Comparison of graphene platelets with silicate layer andcarbon nanotubes
Previous studies of elastomer/clay nanocomposites indicatethat tensile strength, although increasing at first and reachinga maximum at 10 wt% clay, reduced with more clay additionregardless of interface modification [57, 58]. In contrast,both the tensile and tear strength in this study increasewith graphene platelets (GnPs) and no maximum values arereached at any fractions. In addition, the standard deviation in
11

Nanotechnology 24 (2013) 165601 S Araby et al
Figure 10. Comparison of experimental results with predictions bythe Guth and Halpin–Tsai models for the elastomer and itsnanocomposites.
our testing is quite low (tables S4 available at stacks.iop.org/Nano/24/165601/mmedia), confirming the uniform dispersionof GnPs in the matrix. This means that GnPs possess muchbetter compatibility with elastomers and produce a far higherreinforcement than clay.
In spite of the high manufacturing cost, multi-walled car-bon nanotubes (MWCNTs) have attracted extensive interestover the past 20 years in the development of functional, highmechanical performance polymer composites. In contrast,GnPs are far cheaper and may possess higher functionalitydue to their high structural integrity [19, 20]. Since carbonblack (CB) is a dominant additive in the elastomer industry,we compared the reinforcing effects of GnPs with MWCNTsand CB. In figure 11, the MWCNT nanocomposite is stifferand stronger than the 2.8 vol% GnP nanocomposite, but itsperformance is equivalent to the 5.7 vol% GnP nanocom-posite. Taking into account the cost advantage of GnPs(∼$20 kg−1) in comparison with MWCNTs (∼$265 kg−1),GnPs represent a technological advance over MWCNTsfor the development of functional polymer compositesof high mechanical performance. At 2.8 vol%, the GnPnanocomposite indicates a slightly lower fracture strengthbut a far higher fracture strain than the CB nanocomposite.CB has been researched and developed for 80 years; incontrast, GnPs are less than one year old. Although this studysimply compounded GnPs with the elastomers without anyinterface modification, satisfactory mechanical performancesand electrical/thermal conductivities are obtained. We believethat greater property improvement would be achieved inthe future by surface modification of GnPs, which wouldoutperform CB in terms of tensile strength.
Conclusion
We created graphene platelets (GnPs) of 3.55 ± 0.32 nmin thickness using thermal shock followed by ultrasoni-cation, developed elastomer/GnP nanocomposites by meltcompounding with an elastomer, ethylene–propylene–diene
Figure 11. Reinforcing effects of graphene platelets, carbon blackand multi-walled carbon nanotubes on the elastomer.
rubber (EPDM), and investigated the structure–propertyrelations of these nanocomposites.
The incorporation of 26.7 vol% GnPs into the elastomerdramatically improved the tensile strength, Young’s modulus,and tear strength by 404%, 710% and 270%, respectively. Thedynamic mechanical analysis of the nanocomposites showeda 5 ◦C improvement in glass transition temperature. Moreimportantly, our study showed that this melt compoundingtechnique can produce electrically and thermally conductiveelastomeric nanocomposites. The percolation threshold ofelectrical conductivity is at 18 vol%. At 45 vol% GnPs, thethermal conductivity of the elastomer increased by 407%.The swelling ratio of the elastomer was reduced by 62%at 26.7 vol% GnPs. The experimental values of stiffnessagree well with the Guth and Halpin–Tsai models. Our studyprovides a novel route to the development of electrically andthermally conductive, mechanically strong elastomers, whichwill prolong the service life of elastomeric products used indynamic loading environments.
Acknowledgments
The authors thank B Wade, L Waterhouse and J Terlet fortechnical support at Adelaide Microscopy. JM thanks Asburyfor providing the graphite intercalation compound.
References
[1] Adam M B, Pingyan L, Steven C and Steven L G 2011Gas-phase production of gold-decorated silica nanoparticlesNanotechnology 22 315603
[2] Shao-jian H, Yi-qing W, Yi-ping F, Qing-sheng L andLi-qun Z 2010 The preparation of an elastomer/silicatelayer nanocompound with an exfoliated structure and astrong ionic interfacial interaction by utilizing an elastomerlatex containing pyridine groups Nanotechnology21 115601
[3] Zhou S-J, Ma C-Y, Meng Y-Y, Su H-F, Zhu Z, Deng S-L andXie S-Y 2012 Activation of boron nitride nanotubes andtheir polymer composites for improving mechanicalperformance Nanotechnology 23 055708
12

Nanotechnology 24 (2013) 165601 S Araby et al
[4] Peng X, James L, Roger D B and Balaji P 2012 Load transferand mechanical properties of chemically reduced graphenereinforcements in polymer composites Nanotechnology23 505713
[5] Le Q-H, Kuan H-C, Dai J-B, Zaman I, Luong L andMa J 2010 Structure–property relations of 55 nmparticle-toughened epoxy Polymer 51 4867
[6] Ma J, Mo M-S, Du X-S, Dai S-R and Luck I 2008 Study ofepoxy toughened by in situ formed rubber nanoparticlesJ. Appl. Polym. Sci. 110 304
[7] Ma J, Feng Y X, Xu J, Xiong M L, Zhu Y J and Zhang L Q2002 Effects of compatibilizing agent and in situ fibril onthe morphology, interface and mechanical properties ofEPDM/nylon copolymer blends Polymer 43 937
[8] Ma J, Xu J, Ren J-H, Yu Z-Z and Mai Y-W 2003 A newapproach to polymer/montmorillonite nanocompositesPolymer 44 4619
[9] Ma J, Xiang P, Mai Y-W and Zhang L-Q 2004 A novelapproach to high performance elastomer by using clayMacromol. Rapid Commun. 25 1692
[10] Ma J, Yu Z-Z, Kuan H-C, Dasari A and Mai Y-W 2005 A newstrategy to exfoliate silicone rubber/clay nanocompositesMacromol. Rapid Commun. 26 830
[11] Liang Y-R, Ma J, Lu Y-L, Wu Y-P, Zhang L-Q andMai Y-W 2005 Effects of heat and pressure on intercalationstructures of isobutylene–isoprene rubber/claynanocomposites. I. Prepared by melt blending J. Polym. Sci.B 43 2653
[12] Qi Q, Wu Y, Tian M, Liang G, Zhang L and Ma J 2006Modification of starch for high performance elastomerPolymer 47 3896
[13] Tang H, Qi Q, Wu Y, Liang G, Zhang L and Ma J 2006Reinforcement of elastomer by starch Macromol. Mater.Eng. 291 629
[14] Podsiadlo P, Kaushik A K, Arruda E M, Waas A M, Shim B S,Xu J, Nandivada H, Pumplin B G, Lahann J,Ramamoorthy A and Kotov N A 2007 Ultrastrong and stifflayered polymer nanocomposites Science 318 80
[15] Eizenberg M and Blakely J M 1979 Carbon monolayer phasecondensation on Ni(111) Surf. Sci. 82 228
[16] Xuekun L, Minfeng Y, Hui H and Rodney S R 1999 Tailoringgraphite with the goal of achieving single sheetsNanotechnology 10 269
[17] Zhang Y, Hu W, Li B, Peng C, Fan C and Huang Q 2011Synthesis of polymer-protected graphene bysolvent-assisted thermal reduction process Nanotechnology22 345601
[18] Zhu Y, Murali S, Cai W, Li X, Suk J W, Potts J R andRuoff R S 2010 Graphene and graphene oxide: synthesis,properties, and applications Adv. Mater. 22 3906
[19] Zaman I, Kuan H-C, Meng Q, Michelmore A, Kawashima N,Pitt T, Zhang L, Gouda S, Luong L and Ma J 2012 A facileapproach to chemically modified graphene and its polymernanocomposites Adv. Funct. Mater. 22 2735
[20] Zaman I, Kuan H-C, Dai J, Kawashima N, Michelmore A,Sovi A, Dong S, Luong L and Ma J 2012 From carbonnanotubes and silicate layers to graphene platelets forpolymer nanocomposites Nanoscale 4 4578
[21] Nemes-Incze P, Osvath Z, Kamaras K and Biro L P 2008Anomalies in thickness measurements of graphene and fewlayer graphite crystals by tapping mode atomic forcemicroscopy Carbon 46 1435
[22] Lee C, Wei X, Li Q, Carpick R, Kysar J W and Hone J 2009Elastic and frictional properties of graphene Phys. StatusSolidi b 246 2562
[23] Yang J, Tian M, Jia Q-X, Shi J-H, Zhang L-Q, Lim S-H,Yu Z-Z and Mai Y-W 2007 Improved mechanical andfunctional properties of elastomer/graphite nanocompositesprepared by latex compounding Acta Mater. 55 6372
[24] Zhan Y, Wu J, Xia H, Yan N, Fei G and Yuan G 2011Dispersion and exfoliation of graphene in rubber by anultrasonically-assisted latex mixing and in situ reductionprocess Macromol. Mater. Eng. 296 590
[25] Lian H, Li S, Liu K, Xu L, Wang K and Guo W 2011 Study onmodified graphene/butyl rubber nanocomposites. I.Preparation and characterization Polym. Eng. Sci. 51 2254
[26] Bai X, Wan C, Zhang Y and Zhai Y 2011 Reinforcement ofhydrogenated carboxylated nitrile–butadiene rubber withexfoliated graphene oxide Carbon 49 1608
[27] Zaman I, Phan T T, Kuan H-C, Meng Q, Bao La L T,Luong L, Youssf O and Ma J 2011 Epoxy/grapheneplatelets nanocomposites with two levels of interfacestrength Polymer 52 1603
[28] Kim H, Kobayashi S, AbdurRahim M A, Zhang M J,Khusainova A, Hillmyer M A, Abdala A A andMacosko C W 2011 Graphene/polyethylenenanocomposites: effect of polyethylene functionalizationand blending methods Polymer 52 1837
[29] Flory P J and Rehner J J 1943 Statistical mechanics ofcross-linked polymer networks. II. Swelling J. Chem. Phys.11 521
[30] Macsiniuc A, Rochette A and Rodrigue D 2010 Understandingthe regeneration of EPDM rubber crumbs from used tyresProg. Rubber Plast. Recycl. Technol. 26 51
[31] Shih C-J, Vijayaraghavan A, Krishnan R, Sharma R, Han J-H,Ham M-H, Jin Z, Lin S, Paulus G L C, Reuel N F,Wang Q H, Blankschtein D and Strano M S 2011 Bi- andtrilayer graphene solutions Nature Nanotechnol. 6 439
[32] Weller T E, Ellerby M, Saxena S S, Smith R P andSkipper N T 2005 Superconductivity in the intercalatedgraphite compounds C6Yb and C6Ca Nature Phys. 1 39
[33] Kun P, Weber F and Balazsi C 2011 Preparation andexamination of multilayer graphene nanosheets byexfoliation of graphite in high efficient attritor mill Cent.Eur. J. Chem. 9 47
[34] Malesevic A, Vitchev R, Schouteden K, Volodin A, Zhang L,Tendeloo G V, Vanhulsel A and Haesendonck C V 2008Synthesis of few-layer graphene via microwaveplasma-enhanced chemical vapour depositionNanotechnology 19 305604
[35] Meyer J C, Geim A K, Katsnelson M I, Novoselov K S,Booth T J and Roth S 2007 The structure of suspendedgraphene sheets Nature 446 60
[36] Park S and Ruoff R S 2009 Chemical methods for theproduction of graphenes Nature Nanotechnol. 4 217
[37] Stankovich S, Dikin D A, Dommett G H B, Kohlhaas K M,Zimney E J, Stach E A, Piner R D, Nguyen S T andRuoff R S 2006 Graphene-based composite materialsNature 442 282
[38] Veca L M, Meziani M J, Wang W, Wang X, Lu F, Zhang P,Lin Y, Fee R, Connell J W and Sun Y-P 2009 Carbonnanosheets for polymeric nanocomposites with highthermal conductivity Adv. Mater. 21 2088
[39] Ganguli S, Roy A K and Anderson D P 2008 Improvedthermal conductivity for chemically functionalizedexfoliated graphite/epoxy composites Carbon 46 806
[40] Yang S-Y, Lin W-N, Huang Y-L, Tien H-W, Wang J-Y,Ma C-C M, Li S-M and Wang Y-S 2011 Synergetic effectsof graphene platelets and carbon nanotubes on themechanical and thermal properties of epoxy compositesCarbon 49 793
[41] Baniassadi M, Addiego F, Laachachi A, Ahzi S,Garmestani H, Hassouna F, Makradi A, Toniazzo V andRuch D 2011 Using SAXS approach to estimate thermalconductivity of polystyrene/zirconia nanocomposite byexploiting strong contrast technique Acta Mater. 59 2742
[42] Meyer L, Jayaram S and Cherney EA 2004 Thermalconductivity of filled silicone rubber and its relationship to
13

Nanotechnology 24 (2013) 165601 S Araby et al
erosion resistance in the inclined plane test IEEE Trans.Dielectr. Electr. Insul. 11 620
[43] Kim H, Abdala A A and Macosko C W 2010Graphene/polymer nanocomposites Macromolecules43 6515
[44] Potts J R, Dreyer D R, Bielawski C W and Ruoff R S 2011Graphene-based polymer nanocomposites Polymer 52 5
[45] Balandin A A 2011 Thermal properties of graphene andnanostructured carbon materials Nature Mater. 10 569
[46] Kuan H-C, Dai J-B and Ma J 2010 A reactive polymer fortoughening epoxy resin J. Appl. Polym. Sci. 115 3265
[47] Ma J, Qi Q, Bayley J, Du X-S, Mo M-S and Zhang L-Q 2007Development of SENB toughness measurement forthermoset resins Polym. Test. 26 445
[48] Zaman I, Le Q-H, Kuan H-C, Kawashima N, Luong L,Gerson A and Ma J 2011 Interface-tuned epoxy/claynanocomposites Polymer 52 497
[49] Ma J, La L T B, Zaman I, Meng Q, Luong L, Ogilvie D andKuan H-C 2011 Fabrication, structure and properties ofepoxy/metal nanocomposites Macromol. Mater. Eng.296 465
[50] Brechet Y, Cavaille J Y, Chabert E, Chazeau L, Dendievel R,Flandin L and Gauthier C 2001 Polymer based
nanocomposites: effect of filler–filler and filler–matrixinteractions Adv. Eng. Mater. 3 571
[51] Guzman de Villoria R and Miravete A 2007 Mechanicalmodel to evaluate the effect of the dispersion innanocomposites Acta Mater. 55 3025
[52] Deng F and Vliet K J V 2011 Prediction of elastic propertiesfor polymer–particle nanocomposites exhibiting aninterphase Nanotechnology 22 165703
[53] Guth E 1945 Theory of filler reinforcement J. Appl. Phys.16 20
[54] Halpin J C and Pagano N J 1969 The laminate approximationfor randomly oriented fibrous composites J. Compos.Mater. 3 720
[55] Bergstrom J S and Boyce M C 1999 Mechanical behavior ofparticle filled elastomers Rubber Chem. Technol. 72 633
[56] Flandin L, Hiltner A and Baer E 2001 Interrelationshipsbetween electrical and mechanical properties of a carbonblack-filled ethylene–octene elastomer Polymer 42 827
[57] Gatos K G and Karger-Kocsis J 2005 Effects of primary andquaternary amine intercalants on the organoclay dispersionin a sulfur-cured EPDM rubber Polymer 46 3069
[58] Zhang L, Wang Y, Wang Y, Sui Y and Yu D 2000 Morphologyand mechanical properties of clay/styrene-butadiene rubbernanocomposites J. Appl. Polym. Sci. 78 1873
14
Copyright © 2022 FDOKUMEN