Calibration procedure for a potato crop growth model using information from across Europe
15
ecological modelling 211 ( 2 0 0 8 ) 209–223 available at www.sciencedirect.com journal homepage: www.elsevier.com/locate/ecolmodel Calibration procedure for a potato crop growth model using information from across Europe T. Heidmann a,∗ , C. Tofteng b , P. Abrahamsen b , F. Plauborg a , S. Hansen b , A. Battilani c , J. Coutinho d , F. Doleˇ zal e , W. Mazurczyk f , J.D.R. Ruiz b , J. Tak´ aˇ c g , J. Vacek h a Department of Agroecology, Faculty of Agricultural Sciences, University of Aarhus, Research Centre Foulum, P.O. Box 50, DK-8830 Tjele, Denmark b Department of Agricultural Sciences, Faculty of Life Sciences, University of Copenhagen, Agrovej 10, DK-2630 Taastrup, Denmark c Consorzio di Bonifica de secondo grado per il Canale Emiliano Romagnolo, Via E. Masi, 8, I-40137 Bologna, Italy d Department of Soil Science, Universidade de Tr´ as-os-Montes e Alto Douro, Ap. 1012, 5001-911 Vila Real, Portugal e Research Institute for Soil and Water Conservation Prague, Zabovreska 250, CZ-156 27 Praha 5, Zbraslav, Czech Republic f Plant Breeding and Acclimatization Institute, Jadwisin, 05-140 Serock, Poland g Hydromelioration State Enterprise, Vrakunsk´ a 29, SK-825 63 Bratislava 211, Slovakia h Potato Research Institute Havl´ ıˇ ck ˚ uv Brod Ltd., Dobrovsk´ eho 2366, 580 01 Havl´ ıˇ ck ˚ uv Brod, Czech Republic article info Article history: Received 29 November 2006 Received in revised form 10 September 2007 Accepted 11 September 2007 Published on line 22 October 2007 Keywords: Potato growing Field experiments Modelling Daisy Parameterisation Calibration FertOrgaNic Drip irrigation Fertigation Nitrogen fertilisation abstract In the FertOrgaNic EU project, 3 years of field experiments with drip irrigation and fertigation were carried out at six different sites across Europe, involving seven different varieties of potato. The Daisy model, which simulates plant growth together with water and nitrogen dynamics, was used to simulate the field experiments. An initial potato parameterisation was generated from an independent dataset and was used for site-specific calibrations. At those sites where the same variety was used for all 3 years, the calibration of the initial potato model was based on the first 2 years using the last year for validation. From the site- specific parameterisations, shared traits were extracted into a common parameterisation. This resulted in a list of the parameters that six independent people found had the most impact on the simulations. This common parameterisation we argue is a valuable platform for adaptation of the Daisy model to new potato varieties or for the improvement of the existing parameter set. The procedure is then, as a starting point, to focus the calibration process on the recommended list of parameters to change. We demonstrate this approach by showing the procedure for recalibrating three varieties using all relevant data from the sites. We believe these new parameterisations to be more robust, because they indirectly were based on information from the six different sites. We claim that this procedure combines both local and specific modeller expertise in a way that results in more robust and general parameterisations than if the common parameterisation step had been skipped. © 2007 Elsevier B.V. All rights reserved. 1. Introduction The presented work was part of the EU-funded project FertOr- gaNic, whose main objective was to develop a new growing ∗ Corresponding author. Tel.: +45 89991730; fax: +45 89991200. E-mail address: [email protected] (T. Heidmann). system with enhanced use of various organic fertilisers sup- plemented with mineral nitrogen (N). The application of the additional N was based on improved management strategies for drip irrigation and N fertigation to increase the water 0304-3800/$ – see front matter © 2007 Elsevier B.V. All rights reserved. doi:10.1016/j.ecolmodel.2007.09.008
-
Upload
independent -
Category
Documents
-
view
4 -
download
0
Transcript of Calibration procedure for a potato crop growth model using information from across Europe

Cu
TJa
Pb
c
d
e
f
g
h
a
A
R
R
1
A
P
K
P
F
M
D
P
C
F
D
F
N
1
Tg
0d
e c o l o g i c a l m o d e l l i n g 2 1 1 ( 2 0 0 8 ) 209–223
avai lab le at www.sc iencedi rec t .com
journa l homepage: www.e lsev ier .com/ locate /eco lmodel
alibration procedure for a potato crop growth modelsing information from across Europe
. Heidmanna,∗, C. Toftengb, P. Abrahamsenb, F. Plauborga, S. Hansenb, A. Battilani c,. Coutinhod, F. Dolezal e, W. Mazurczykf, J.D.R. Ruizb, J. Takac g, J. Vacekh
Department of Agroecology, Faculty of Agricultural Sciences, University of Aarhus, Research Centre Foulum,.O. Box 50, DK-8830 Tjele, DenmarkDepartment of Agricultural Sciences, Faculty of Life Sciences, University of Copenhagen, Agrovej 10, DK-2630 Taastrup, DenmarkConsorzio di Bonifica de secondo grado per il Canale Emiliano Romagnolo, Via E. Masi, 8, I-40137 Bologna, ItalyDepartment of Soil Science, Universidade de Tras-os-Montes e Alto Douro, Ap. 1012, 5001-911 Vila Real, PortugalResearch Institute for Soil and Water Conservation Prague, Zabovreska 250, CZ-156 27 Praha 5, Zbraslav, Czech RepublicPlant Breeding and Acclimatization Institute, Jadwisin, 05-140 Serock, PolandHydromelioration State Enterprise, Vrakunska 29, SK-825 63 Bratislava 211, SlovakiaPotato Research Institute Havlıckuv Brod Ltd., Dobrovskeho 2366, 580 01 Havlıckuv Brod, Czech Republic
r t i c l e i n f o
rticle history:
eceived 29 November 2006
eceived in revised form
0 September 2007
ccepted 11 September 2007
ublished on line 22 October 2007
eywords:
otato growing
ield experiments
odelling
aisy
arameterisation
a b s t r a c t
In the FertOrgaNic EU project, 3 years of field experiments with drip irrigation and fertigation
were carried out at six different sites across Europe, involving seven different varieties of
potato. The Daisy model, which simulates plant growth together with water and nitrogen
dynamics, was used to simulate the field experiments. An initial potato parameterisation
was generated from an independent dataset and was used for site-specific calibrations. At
those sites where the same variety was used for all 3 years, the calibration of the initial
potato model was based on the first 2 years using the last year for validation. From the site-
specific parameterisations, shared traits were extracted into a common parameterisation.
This resulted in a list of the parameters that six independent people found had the most
impact on the simulations. This common parameterisation we argue is a valuable platform
for adaptation of the Daisy model to new potato varieties or for the improvement of the
existing parameter set. The procedure is then, as a starting point, to focus the calibration
process on the recommended list of parameters to change. We demonstrate this approach by
alibration
ertOrgaNic
rip irrigation
ertigation
showing the procedure for recalibrating three varieties using all relevant data from the sites.
We believe these new parameterisations to be more robust, because they indirectly were
based on information from the six different sites. We claim that this procedure combines
both local and specific modeller expertise in a way that results in more robust and general
an if
system with enhanced use of various organic fertilisers sup-
itrogen fertilisation parameterisations th
. Introduction
he presented work was part of the EU-funded project FertOr-aNic, whose main objective was to develop a new growing
∗ Corresponding author. Tel.: +45 89991730; fax: +45 89991200.E-mail address: [email protected] (T. Heidmann).
304-3800/$ – see front matter © 2007 Elsevier B.V. All rights reserved.oi:10.1016/j.ecolmodel.2007.09.008
the common parameterisation step had been skipped.
© 2007 Elsevier B.V. All rights reserved.
plemented with mineral nitrogen (N). The application of theadditional N was based on improved management strategiesfor drip irrigation and N fertigation to increase the water
i n g
210 e c o l o g i c a l m o d e l land N-use efficiency and hence reduce the risk of losses tothe environment (http://www.fertorganic.org/). The new sys-tem was tested by conducting 3 years of field experimentswith seven different potato varieties (Solanum tuberosum L.) cv.Agata, cv. Agria, cv. Filea, cv. Folva, cv. Kennebec, cv. Solana,and cv. Triada under different management strategies at sixdifferent sites across Europe. The data from the field exper-iments were analysed using the Danish simulation modelDaisy (Hansen et al., 1990, 1991; Abrahamsen and Hansen,2000).
Simulation models are valuable tools for evaluating theeffect of different management practices on crop yield andenvironment. Some models are used as research tools forstudying crop growth and water and N dynamics but also asbasis for legislation and regulation by policy-makers whenenvironmental effects of crop production are estimated. Daisyis developed from field experiments and has been tested inseveral situations (De Willingen, 1991; Verecken et al., 1991;Diekkruger et al., 1995; Svendsen et al., 1995; Smith et al., 1997).The tests have shown a good agreement between measuredand simulated results of water and nitrogen dynamics andbiomass production. Crop-specific information on most of themain crops in Danish agriculture is available from field experi-ments and included in the crop modules of the model. A potatomodule did exist in the model, but due to large differencesbetween varieties in the FertOrgaNic experiments, there was aneed for parameterisation of more than one variety. Therefore,to use the Daisy model for analysing the FertOrgaNic field data,new potato modules were developed for each site and param-eterised with the help from modellers from each experimentalsite.
The accuracy of process-oriented crop-growth modelsdepends on the soundness of the representation of physiolog-ical processes and the parameter values in their mathematicalrepresentations (Zhai et al., 2004). Using a model in differentclimate zones such as the Mediterranean and Scandina-vian often requires the calibration of the model parameters(Botterweg, 1995). The calibration involves estimation ofmodel parameters from field data to improve the fit betweenmodel and data, such as in Kabat et al. (1995) where severalpotato growth models were calibrated using the same data
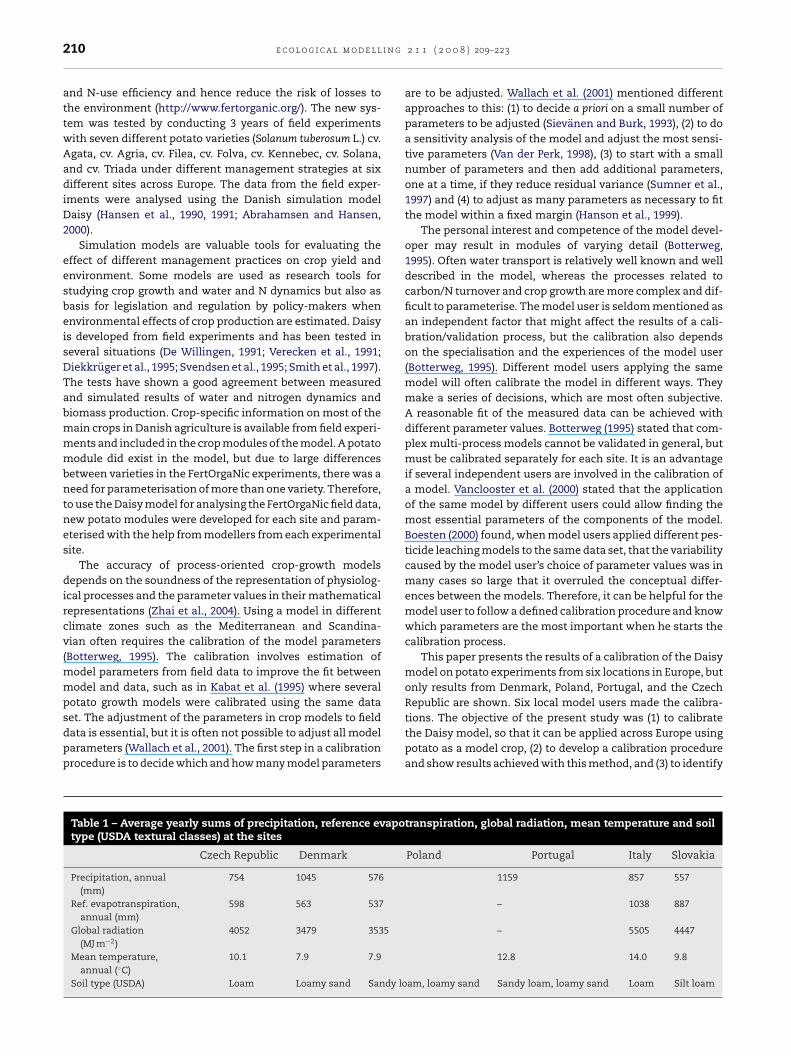
set. The adjustment of the parameters in crop models to fielddata is essential, but it is often not possible to adjust all modelparameters (Wallach et al., 2001). The first step in a calibrationprocedure is to decide which and how many model parametersTable 1 – Average yearly sums of precipitation, reference evapotype (USDA textural classes) at the sites
Czech Republic Denmark
Precipitation, annual(mm)
754 1045 576
Ref. evapotranspiration,annual (mm)
598 563 537
Global radiation(MJ m−2)
4052 3479 3535
Mean temperature,annual (◦C)
10.1 7.9 7.9
Soil type (USDA) Loam Loamy sand Sandy lo
2 1 1 ( 2 0 0 8 ) 209–223
are to be adjusted. Wallach et al. (2001) mentioned differentapproaches to this: (1) to decide a priori on a small number ofparameters to be adjusted (Sievanen and Burk, 1993), (2) to doa sensitivity analysis of the model and adjust the most sensi-tive parameters (Van der Perk, 1998), (3) to start with a smallnumber of parameters and then add additional parameters,one at a time, if they reduce residual variance (Sumner et al.,1997) and (4) to adjust as many parameters as necessary to fitthe model within a fixed margin (Hanson et al., 1999).
The personal interest and competence of the model devel-oper may result in modules of varying detail (Botterweg,1995). Often water transport is relatively well known and welldescribed in the model, whereas the processes related tocarbon/N turnover and crop growth are more complex and dif-ficult to parameterise. The model user is seldom mentioned asan independent factor that might affect the results of a cali-bration/validation process, but the calibration also dependson the specialisation and the experiences of the model user(Botterweg, 1995). Different model users applying the samemodel will often calibrate the model in different ways. Theymake a series of decisions, which are most often subjective.A reasonable fit of the measured data can be achieved withdifferent parameter values. Botterweg (1995) stated that com-plex multi-process models cannot be validated in general, butmust be calibrated separately for each site. It is an advantageif several independent users are involved in the calibration ofa model. Vanclooster et al. (2000) stated that the applicationof the same model by different users could allow finding themost essential parameters of the components of the model.Boesten (2000) found, when model users applied different pes-ticide leaching models to the same data set, that the variabilitycaused by the model user’s choice of parameter values was inmany cases so large that it overruled the conceptual differ-ences between the models. Therefore, it can be helpful for themodel user to follow a defined calibration procedure and knowwhich parameters are the most important when he starts thecalibration process.
This paper presents the results of a calibration of the Daisymodel on potato experiments from six locations in Europe, butonly results from Denmark, Poland, Portugal, and the CzechRepublic are shown. Six local model users made the calibra-
tions. The objective of the present study was (1) to calibratethe Daisy model, so that it can be applied across Europe usingpotato as a model crop, (2) to develop a calibration procedureand show results achieved with this method, and (3) to identifytranspiration, global radiation, mean temperature and soil
Poland Portugal Italy Slovakia
1159 857 557
– 1038 887
– 5505 4447
12.8 14.0 9.8
am, loamy sand Sandy loam, loamy sand Loam Silt loam

g 2 1
ti
2
2
DaiSPm
loTtomati
ofa
•
•
•
•
depth from 0 m to (at most sites) 0.75 m. The sampling wascarried out at least in early spring and again after harvest ofthe potato. Soil mineral N was also sampled in the soil solu-tion with suction cells (0.75 m below soil surface) five to six
e c o l o g i c a l m o d e l l i n
he most important model parameters that require attentionn the initial stage of model parameterisation.
. Materials and methods
.1. Experimental design and measurements
ata used in the present study were extracted from dripnd fertigation experiments with potatoes carried out dur-ng 2003–2005 at six experimental sites in Denmark, Poland,lovakia, the Czech Republic, Italy, and during 2003–2004 inortugal (Table 1). Table 2 describes the design of the experi-ents.Treatments T1 and T6 represented the zero fertilisation
evel needed to calculate the efficiency and the recovery ratiof both fertilisation and irrigation inputs in treatments T2–T5.2 and T3, which were without and with irrigation, respec-
ively, were control plots to assess the separate effect of therganic N supply. T4 and T5 received a basic dressing of organicanure (same amounts as in T2 and T3), full irrigation, but
lso an additional mineral N supply by means of different fer-igation strategies. Fertigation is mineral N dissolved in therrigation water and applied through the drip lines.
The new potato growing system was in its design and devel-pment governed by some common protocols, which wereollowed at all the experimental sites (details are explainedfter the list).
The new system was focused on different strategies of Napplication whereas other nutrients (P, K, etc.) were appliedas in conventional systems.The organic N source (slurry, FYM, compost, etc.) was incor-porated at a depth of 0–0.1 m, preferably in spring beforepotato planting.Medium early varieties of potatoes were studied, i.e. tablepotatoes, potatoes for crisps or chips. The mother tubewas planted at maximum 8 cm depth (before ridging) witharound 0.75 m ridge distance and around 0.33 m between
potatoes in the ridge, corresponding to around 40,000 plantsper ha.The amount of organic N needed was estimated based onthe N balance for the field.Table 2 – Factorial design of the drip and fertigationexperiments, where organic nitrogen was supplied froman organic source (FYM, slurry or another source ascompost)
Treatment T1 T2 T3 T4 T5 T6
Organic N 0 0.5 0.5 0.5 0.5 0Mineral N 0 0 0 0.5* 0.5** 0Irrigation 0 0 1 1 1 1
Mineral nitrogen was supplied in the irrigation water through driplines (fertigation). The levels are given as 0 (no input), 1 (full/optimalinput based on estimates from a water or nitrogen balance calcu-lation) and 0.5 (half the optimal input based on estimates from anitrogen balance). ‘*’ and ‘**’ are N-fertigated treatments with theuse of two different application strategies.
1 ( 2 0 0 8 ) 209–223 211
• Expected N-mineralisation from the soil organic matterduring the growing season was estimated based on localexperience.
• The organic N was ridged up around the potato mothertubers in the first out of two ridging operations.
• The drip line was placed centrally on the partly built ridgeand a second ridging operation was carried out to cover thedrip line with up to around 0.1 m soil.
• Mineral N concentration in the final fertigation solutionshould be around 0.1–0.2% N by the time it reaches thepotato roots.
• To avoid toxicity towards the potato roots, the electric con-ductivity of the solution used for fertigation could not behigher than 3 dS m−1.
• Application of irrigation and N-fertigation was guided bythe FertOrgaNic Decision Support System (DSS) developedduring the project (cf. http://www.fertigation.org/). Two Nfertigation strategies were explored.
• After harvesting the potato field, a catch crop such as winterrye, winter wheat or rye-grass was sown.
Fig. 1 shows the difference between the two fertigationstrategies, T4 and T5, in the Danish experiment. Half of theexpected N-fertiliser demand was applied as pig slurry to thefertigated treatments at planting. After emergence, two differ-ent fertigation strategies were applied: a static approach, T4,which suggests a distribution of the additional nitrogen basedon standard recommendations, and a dynamic approach, T5,with N applied later in the growing season, and based on asimple daily N-balance-estimation method (Battilani et al.,2006).
In the present study, the following measurements werecarried out in all the treatments. Mineral N (ammonium andnitrate) was determined in soil samples representing soil
Fig. 1 – An example of the distribution of the mineralnitrogen in the experiments, when using the staticapproach (T4) and the dynamic approach (T5) in Denmarkduring 2004.
i n g
212 e c o l o g i c a l m o d e l ltimes during the growing season. Dry matter (DM) and total Ncontent of leaves, stems and tubers were measured five to sixtimes during the growing season. Tuber DM and total N con-tent were measured at harvest. Soil water content and tensionwere measured at two depths (at most sites approximately0.15 and 0.38 m below top of ridge). Methods of measuring soilwater content varied from site to site. Among the methodsused there were gravimetric sampling, Theta probes (Delta-T devices, Cambridge, UK), TDR (time domain reflectometry)probes with both manual and automatic readings with theuse of the Tektronix 1502C cable tester (Tektronix Inc., Beaver-ton, OR, USA), neutron scattering, and Virrib sensors (AMETconsortium, Velke Bılovice, Czech Republic). Soil water ten-sion was mostly measured with standard tensiometers, butat some sites also with Watermark sensors (Irrometer Co.,Riverside, CA, USA).
Weather data – precipitation, air temperature, global radi-ation, wind speed and relative humidity – were mostlymeasured locally at the sites or taken from the nearestweather station.
2.2. Data quality
The primary purpose of this work was not statistical com-parisons between the treatments. The funding did not allowrepetitions in the experiment, although it was managed atsome sites through other sources. We hope, that runningthe same experiment on multiple sites will compensate forthat. Furthermore, local experts at each site gave an estimateof the uncertainty based on experience from earlier exper-iments. Instead, we focus on the calibration process usingdata from several sites in Europe. The data was of varyingquality because of unexpected incidents in at least one of theexperimental years, e.g. occurrence of extreme heat in Italy, ananaerobic layer in Czech Republic, a hard pan in Denmark, andinitial problems with the measuring techniques. The methoddescribed in this paper is partly an attempt to compensatefor the shortcoming of the site-specific data set by combiningdata from all six sites.
2.3. The Daisy model
Daisy is a one-dimensional soil–plant–atmosphere systemmodel designed to simulate water balance, heat balance,solute balance and crop production in agro-ecosystems sub-jected to various management strategies (Hansen et al.,1990, 1991, 2001; Abrahamsen and Hansen, 2000). The water-balance model comprises a surface-water balance and asoil-water balance. The surface-water model includes sub-models for snow accumulation and melting, interception,throughfall, evaporation of water in the crop canopy, infil-tration, and surface runoff. The soil-water balance includeswater flow in the soil matrix as well as in macropores. It finallyincludes water uptake by plants and a model for drainage topipe drains. The heat-balance model simulates soil tempera-ture and freezing and melting in the soil. The solute-balance
model simulates transport, sorption and nitrogen transfor-mation processes including mineralisation–immobilisation,nitrification and denitrification, sorption of ammonium,uptake of nitrate and ammonium, and leaching of nitrate2 1 1 ( 2 0 0 8 ) 209–223
and ammonium. The crop-production model simulates plantgrowth and development, including the accumulation of DMand N in different plant parts, the development of leaf-areaindex and the distribution of root density. The agriculturalmanagement model allows complex management scenariosto be built. An overview of recent developments, parameteri-sations and applications of the model can be found in Hansenet al. (2001) and Jensen et al. (2001).
In the present context, the mineralisation–immobilisationand the crop-growth models are of special interest. Theturnover of soil organic matter and the subsequent miner-alisation or immobilisation of mineral N is simulated by aconventional multi-pool model that is based on the carbonturnover. The model considers three distinguishable typesof organic matter, viz., newly added organic matter (AOM),soil microbial biomass (SMB) and soil organic matter (SOM).Especially, the latter constitutes a vast number of organic com-pounds. In order to be able to apply first-order kinetics, AOM,SMB and SOM are divided into two sub-pools each (SOM maybe split into three sub-pools, but the third pool is consideredinert). The model considers a new set of AOM pools for eachaddition of organic matter. This type of model is known torequire quite a number of parameters. The present modelparameterisation is based on Mueller et al. (1998) and Bruunet al. (2003) and is supplemented by results obtained in thepresent project.
The potato model presented in this paper is a new develop-ment. It is based on the generic crop model included in Daisy(Hansen et al., 2001). The structure of the crop model is shownin Fig. 2. In the figure, solid lines represent flows of matterand the dashed lines represent information flows. It is notedthat the model considers leaf, stem, root and storage organs,where the latter in the present case are tubers. Furthermore,it is noted that the main plant-growth processes consideredare photosynthesis, respiration (both maintenance respirationand growth respiration, the latter arising from conversion ofassimilates into structural DM), partitioning of assimilates,and leaf and root death. Partitioning, leaf and root death,senescence, N stress (stress factors) and canopy structure areall influenced by the crop development stage (not shown inthe diagram).
The photosynthesis model is based on a simple lightresponse curve (Goudriaan, 1982) for a single leaf charac-terised by an initial light-use efficiency and a maximumphotosynthesis rate (Fm). The canopy photosynthesis is esti-mated by assuming the light distribution within the canopypredicted by applying Beers law and assuming a light dis-tribution over the day that is proportional to the localextraterrestrial radiation. The canopy is divided into a numberof layers. Assuming the properties of each crop canopy layerto be equal to the properties of a single leaf, the gross photo-synthesis is calculated by accumulating the contribution fromthe individual layers. The gross photosynthesis is calculatedfor each hour of the day and then accumulated to daily grossphotosynthesis.
The basic parameterisation of the potato model is based
partly on literature values and partly on calibration, apply-ing the model to a dataset kindly provided by Dr. D.K.L.MacKerron of the Scottish Crop Research Institute (SCRI).This dataset comprised 2 years, 1984 and 1985, with six and
e c o l o g i c a l m o d e l l i n g 2 1 1 ( 2 0 0 8 ) 209–223 213
the
fitbpcKabaam
2
Tmfttm
“deT
(
(
Fig. 2 – Overview of the carbon flow in
ve N-fertilisation levels, respectively, of fully irrigated pota-oes of the cultivar Maris Piper. These data have previouslyeen used in connection with a workshop “Modelling andarameterisation of the soil–plant–atmosphere system – Aomparison of potato growth models” which was reported byabat et al. (1995). Especially, the model CROPWATN presentedt this workshop by Karvonen and Kleemola (1995) resem-les the structure of the generic crop model in Daisy (Fig. 2),nd hence results from this model application have serveds input to the parameterisation of the new Daisy potatoodel.
.4. Calibration procedure
he main purpose of the FertOrgaNic project was the develop-ent of a computer-based DSS as well as practical guidelines
or using drip irrigation and a combination of organic fer-iliser and fertigation. However, as an additional product ofhe experiments, we also wanted to use the data for potato
odelling in a European context.We saw the challenge as a social one, how to combine the
central” model-specific knowledge (mainly the Daisy modelevelopers at the University of Copenhagen, Faculty of Life Sci-nces (KU-LIFE)), with the distributed site-specific knowledge.his led to a four-stage calibration procedure:
1) The first stage was to create a common basis for theproject. A comprehensive experimental data set was avail-able from SCRI, from which the experts from KU-LIFEmade a basic potato parameterisation (referred to below as“Scottish parameterisation”). KU-LIFE also hosted a Daisyworkshop for all the local site experts, to give them a
basic understanding of how to work with and calibrate themodel.2) The local experts made site-specific calibrations using thebasic potato parameterisation. At the sites where the same
generic crop model included in Daisy.
variety was used for all 3 years, the first 2 years were usedfor calibration and the third for validation.
(3) Under the assumption that all the potato varieties sharesome traits, the model experts at KU-LIFE created acommon parameterisation by merging the various siteparameterisations. The first result was a list of parame-ters that were changed during the site-specific calibrationscompared to the initial parameterisation. Furthermore,the merge was performed by looking at the site-specificvalues for each parameter to extract the one we foundmost representative for the set as a whole.
(4) Using this common parameterisation as a new base, themodel experts at KU-LIFE derived a new parameterisationfor the three varieties that had the best data sets. Only oneof the three varieties (Agria) was used at multiple sites.It may be difficult to separate the site and variety for thetwo other varieties. However, all three recalibrated variety-specific models are now less site specific, because they arebased on the common potato parameterisation developedin step 3, and thus indirectly incorporating data from allsites.
2.5. Evaluation of simulation results
Evaluation of the agreement between observed and mod-elled variables included qualitative as well as quantitativetechniques. The agreement between model results and obser-vations was evaluated visually from plots of observed andsimulated data. Furthermore, the root mean square error(R.M.S.E.) was calculated as an objective measure. R.M.S.E.was calculated as (�(xs − xo)2)/n)0.5, where xs is the simulatedvalue, x the observed value, and n is the number of observa-
otions. A normalised R.M.S.E., named N.R.M.S.E., was obtainedby dividing R.M.S.E. by the mean xo of observations. N.R.M.S.E.was calculated for shoot and tuber DM and total N contentin all treatments from simulations and observations made
i n g
214 e c o l o g i c a l m o d e l lcontinuously during the growing season. Hence, a separatevalue of NMRSE was obtained for each of the four quantitiesindicated, each treatment and each year. An N.R.M.S.E. valueof 25% and below was defined as acceptable agreement. Thecomparison between the initial and the recalibrated parame-terisations was made by grouping the calculated N.R.M.S.E.’sfor the main data in all treatments (i.e. in T1–T5, crop DM and Ncontent divided into shoots and tubers) into categories below10, 20 and 30% and above 30%, respectively. Correct simulationof nitrogen uptake was given higher priority than dry mat-ter production because of the nitrogen aspects of the project(FertOrgaNic).
3. Results
In this section, the calibration procedure is described indetail. The calibration was divided into two stages: a site-specific and a variety-specific parameterisation, but only thevariety-specific parameterisation will be described in detail.Simulation results for treatment T4 were chosen as a referencefor parameterisation. T4 was the static fertigation approachapplied to the fully irrigated and fully fertilised treatments(Fig. 1).
3.1. Site-specific parameterisation
At each site a local modeller calibrated the potato model.The site-specific measurements from years 2003 and 2004were used for the calibrations, and the calibrations were ini-tially based on the Scottish parameterisation. This resultedin parameterisations that were both site and variety specific.The calibration procedures for Denmark, the Czech Republic,and Poland are briefly described below. A detailed descriptioncan be found in the FertOrgaNic report (Abrahamsen et al.,2006). Table 3 shows the varieties used at the different sitesand key parameter values of the initial Scottish parameterisa-tion compared to the resulting site-specific parameterisations
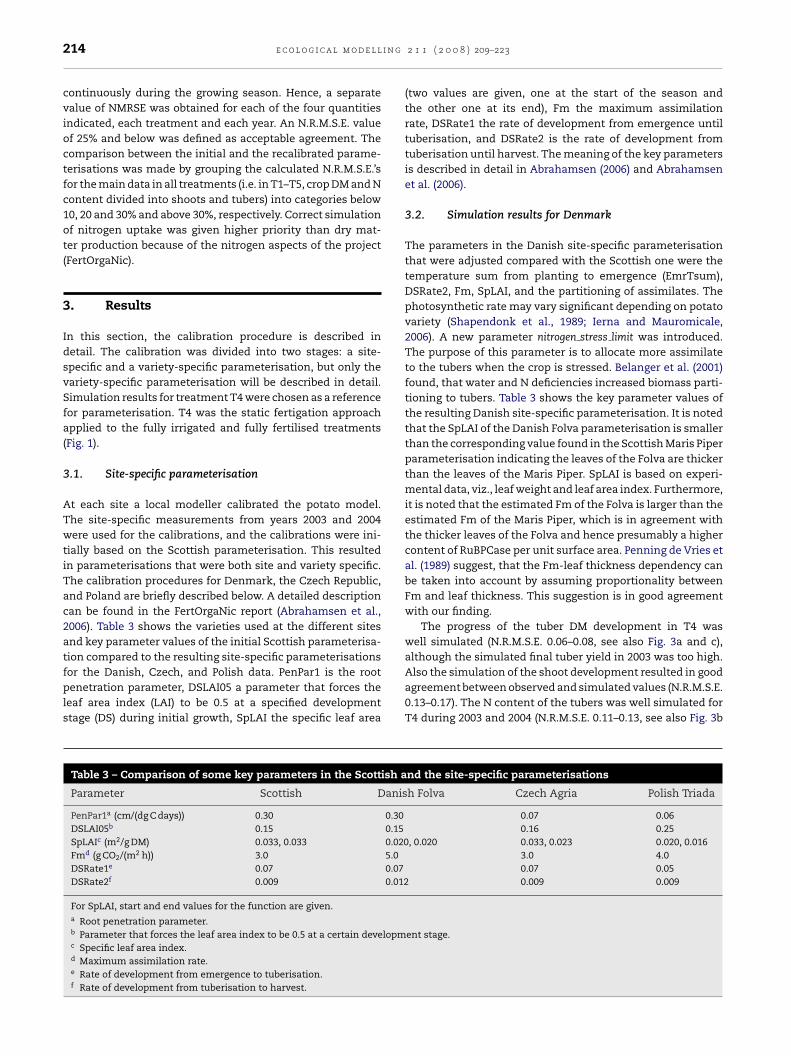
for the Danish, Czech, and Polish data. PenPar1 is the rootpenetration parameter, DSLAI05 a parameter that forces theleaf area index (LAI) to be 0.5 at a specified developmentstage (DS) during initial growth, SpLAI the specific leaf areaTable 3 – Comparison of some key parameters in the Scottish a
Parameter Scottish Danis
PenPar1a (cm/(dg C days)) 0.30 0.30DSLAI05b 0.15 0.15SpLAIc (m2/g DM) 0.033, 0.033 0.020Fmd (g CO2/(m2 h)) 3.0 5.0DSRate1e 0.07 0.07DSRate2f 0.009 0.012
For SpLAI, start and end values for the function are given.a Root penetration parameter.b Parameter that forces the leaf area index to be 0.5 at a certain developmc Specific leaf area index.d Maximum assimilation rate.e Rate of development from emergence to tuberisation.f Rate of development from tuberisation to harvest.
2 1 1 ( 2 0 0 8 ) 209–223
(two values are given, one at the start of the season andthe other one at its end), Fm the maximum assimilationrate, DSRate1 the rate of development from emergence untiltuberisation, and DSRate2 is the rate of development fromtuberisation until harvest. The meaning of the key parametersis described in detail in Abrahamsen (2006) and Abrahamsenet al. (2006).
3.2. Simulation results for Denmark
The parameters in the Danish site-specific parameterisationthat were adjusted compared with the Scottish one were thetemperature sum from planting to emergence (EmrTsum),DSRate2, Fm, SpLAI, and the partitioning of assimilates. Thephotosynthetic rate may vary significant depending on potatovariety (Shapendonk et al., 1989; Ierna and Mauromicale,2006). A new parameter nitrogen stress limit was introduced.The purpose of this parameter is to allocate more assimilateto the tubers when the crop is stressed. Belanger et al. (2001)found, that water and N deficiencies increased biomass parti-tioning to tubers. Table 3 shows the key parameter values ofthe resulting Danish site-specific parameterisation. It is notedthat the SpLAI of the Danish Folva parameterisation is smallerthan the corresponding value found in the Scottish Maris Piperparameterisation indicating the leaves of the Folva are thickerthan the leaves of the Maris Piper. SpLAI is based on experi-mental data, viz., leaf weight and leaf area index. Furthermore,it is noted that the estimated Fm of the Folva is larger than theestimated Fm of the Maris Piper, which is in agreement withthe thicker leaves of the Folva and hence presumably a highercontent of RuBPCase per unit surface area. Penning de Vries etal. (1989) suggest, that the Fm-leaf thickness dependency canbe taken into account by assuming proportionality betweenFm and leaf thickness. This suggestion is in good agreementwith our finding.
The progress of the tuber DM development in T4 waswell simulated (N.R.M.S.E. 0.06–0.08, see also Fig. 3a and c),although the simulated final tuber yield in 2003 was too high.
Also the simulation of the shoot development resulted in goodagreement between observed and simulated values (N.R.M.S.E.0.13–0.17). The N content of the tubers was well simulated forT4 during 2003 and 2004 (N.R.M.S.E. 0.11–0.13, see also Fig. 3bnd the site-specific parameterisations
h Folva Czech Agria Polish Triada
0.07 0.060.16 0.25
, 0.020 0.033, 0.023 0.020, 0.0163.0 4.00.07 0.050.009 0.009
ent stage.

e c o l o g i c a l m o d e l l i n g 2 1 1 ( 2 0 0 8 ) 209–223 215
Fig. 3 – Site-specific simulation results of crop dry matter and nitrogen together with soil mineral nitrogen for the treatmentT nd 2
at(
uvyuoltoosr
4 in Denmark during the calibration years 2003 (a and b), a
nd d). The simulations of shoot-N content during 2003 wereoo high (N.R.M.S.E. 0.48) but were well simulated during 2004N.R.M.S.E. 0.19).
A validation of the final site parameterisation was madesing the observations from 2005, but the results for thealidation year were not as good as for the two calibrationears. The DM of the tubers and shoots was acceptably sim-lated only in T4 (both N.R.M.S.E.’s being 0.21), but for thether treatments the simulated tuber yields were generally
ow (not shown). The simulation of shoot and tuber-N con-ent in 2005 was not acceptable (N.R.M.S.E. 0.31–0.42), as the
bserved tuber-N content was very low compared with the twother years (Fig. 3b, d and f). Observations in the field this yearhowed a root depth of only around 0.25 m. The maximumoot depth of the potato was set in the model to 0.50 m in all004 (c and d), and during the validation year 2005 (e and f).
years. If the maximum root depth in the model was reducedto take account of this, the results improved for T4 but not forthe stressed treatments (not shown). It seems that the modeland its parameterisation based on the calibration from the twoother years still need some improvement to describe the cropdevelopment during 2005.
3.3. Simulation results for the Czech Republic
As for the Danish calibration, the changes made in the Czechcalibration were mostly based on direct observations. The
emergence was adjusted using EmrTsum, but DSRate1 andDSRate2 were kept unchanged (Table 3). PenPar1, DSLAI0.5,partitioning of assimilates, and values for potential and crit-ical N content were changed. The same value of initial SpLAI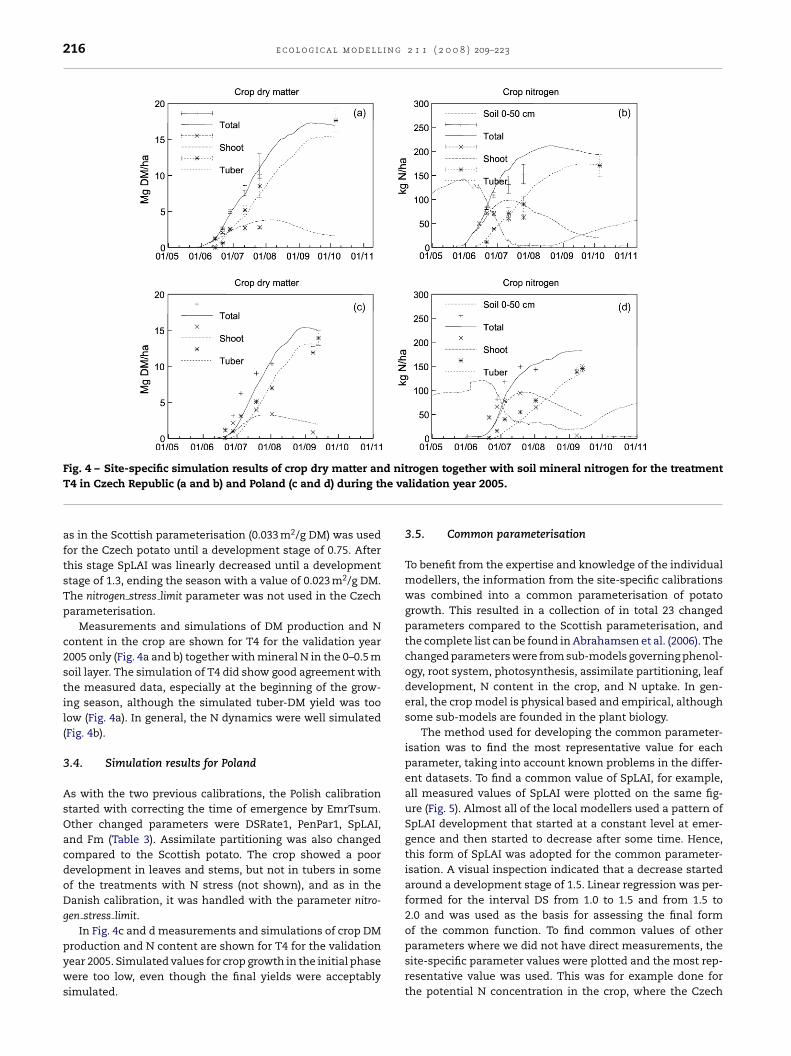
216 e c o l o g i c a l m o d e l l i n g 2 1 1 ( 2 0 0 8 ) 209–223
d nie va
Fig. 4 – Site-specific simulation results of crop dry matter anT4 in Czech Republic (a and b) and Poland (c and d) during th
as in the Scottish parameterisation (0.033 m2/g DM) was usedfor the Czech potato until a development stage of 0.75. Afterthis stage SpLAI was linearly decreased until a developmentstage of 1.3, ending the season with a value of 0.023 m2/g DM.The nitrogen stress limit parameter was not used in the Czechparameterisation.
Measurements and simulations of DM production and Ncontent in the crop are shown for T4 for the validation year2005 only (Fig. 4a and b) together with mineral N in the 0–0.5 msoil layer. The simulation of T4 did show good agreement withthe measured data, especially at the beginning of the grow-ing season, although the simulated tuber-DM yield was toolow (Fig. 4a). In general, the N dynamics were well simulated(Fig. 4b).
3.4. Simulation results for Poland
As with the two previous calibrations, the Polish calibrationstarted with correcting the time of emergence by EmrTsum.Other changed parameters were DSRate1, PenPar1, SpLAI,and Fm (Table 3). Assimilate partitioning was also changedcompared to the Scottish potato. The crop showed a poordevelopment in leaves and stems, but not in tubers in someof the treatments with N stress (not shown), and as in theDanish calibration, it was handled with the parameter nitro-gen stress limit.
In Fig. 4c and d measurements and simulations of crop DM
production and N content are shown for T4 for the validationyear 2005. Simulated values for crop growth in the initial phasewere too low, even though the final yields were acceptablysimulated.trogen together with soil mineral nitrogen for the treatmentlidation year 2005.
3.5. Common parameterisation
To benefit from the expertise and knowledge of the individualmodellers, the information from the site-specific calibrationswas combined into a common parameterisation of potatogrowth. This resulted in a collection of in total 23 changedparameters compared to the Scottish parameterisation, andthe complete list can be found in Abrahamsen et al. (2006). Thechanged parameters were from sub-models governing phenol-ogy, root system, photosynthesis, assimilate partitioning, leafdevelopment, N content in the crop, and N uptake. In gen-eral, the crop model is physical based and empirical, althoughsome sub-models are founded in the plant biology.
The method used for developing the common parameter-isation was to find the most representative value for eachparameter, taking into account known problems in the differ-ent datasets. To find a common value of SpLAI, for example,all measured values of SpLAI were plotted on the same fig-ure (Fig. 5). Almost all of the local modellers used a pattern ofSpLAI development that started at a constant level at emer-gence and then started to decrease after some time. Hence,this form of SpLAI was adopted for the common parameter-isation. A visual inspection indicated that a decrease startedaround a development stage of 1.5. Linear regression was per-formed for the interval DS from 1.0 to 1.5 and from 1.5 to2.0 and was used as the basis for assessing the final formof the common function. To find common values of other
parameters where we did not have direct measurements, thesite-specific parameter values were plotted and the most rep-resentative value was used. This was for example done forthe potential N concentration in the crop, where the Czech
e c o l o g i c a l m o d e l l i n g 2 1
Fig. 5 – The distribution of the specific LAI for the commonpotato parameterisation is based on data from all sites.
Fig. 6 – The potential nitrogen concentrations chosen forthe different site-calibrations. The site-specific calibrations(thin lines) refer to the three different varieties used at theS
d(
Pft
lovakian site.
istribution was chosen to represent the common functionFig. 6).
One feature was changed as a result of the validation of theolish site. The validation process showed that the procedureor starting growth was too sensitive to the weather condi-ions. Therefore, the common parameterisation was adjusted
Table 4 – Comparison of some key parameters in the common
Parameter Common Folva
PenPar1a (cm/(dg C days)) 0.06 0.06DSLAI05b 0.2 0.5SpLAIc (m2/g DM) 0.02, 0.006 0.022, 0Fmd (g CO2/(m2 h)) 4.0 4.8DSRate1e 0.06 0.055DSRate2f 0.009 0.011
For SpLAI, start and end values for the function are given.a Root penetration parameter.b Parameter that forces the leaf area index to be 0.5 at a certain developmc Specific leaf area index.d Maximum assimilation rate.e Rate of development from emergence to tuberisation.f Rate of development from tuberisation to harvest.
1 ( 2 0 0 8 ) 209–223 217
so that initial growth was determined by the developmentstage only, which explicitly responds to air temperature. Themechanistic concept of initial growth in the original modelseems inadequate and was replaced by an empirical submodel for initial growth, which also was used in an earlierversion of the model. This makes the crop model more robust.
The resulting common parameterisation is thought to bea more robust basis for any new calibration, as it is built onknowledge and experience extracted from sites across Europe.The intention is that it provides a basis for variety-specificparameterisations.
3.6. Variety-specific parameterisation
A new calibration based on the common parameterisation wasperformed for three potato varieties: Agria, Folva and Triada.Agria was grown in the Czech Republic all 3 years and in Por-tugal and Slovakia in 2003. Folva was only grown in Denmarkand Triada only in Poland. Our idea was that by using the com-mon parameterisation as a base, these new parameterisationswould to a higher degree reflect the variety, and be less site-specific and thus more representative for use across Europe.
The data from 2005 were included in the variety-specificcalibration, because the data sets had already been used forvalidation of the site-specific calibrations, and the trends inthe data sets were then already known. Another reason wasthat the validation of the 2005 data for Poland revealed thatthere were conditions governing the potato growth that werenot covered by the previous site-specific calibration.
The variety-specific recalibration procedures are brieflydescribed in the following three sections. Table 4 shows keyparameter values for the common parameterisation and thevalues resulting from the variety-specific calibration for thevarieties Folva, Agria, and Triada.
3.7. Folva parameterisation, Denmark
The variety Folva was only grown in Denmark. The recal-
ibration was based on the parameters from the commonparameterisation. An adjustment of EmrTsum from 425 to330 resulted in correct plant emergence. The DSRate1, whichdetermines tuber initiation, was kept at 0.06, corresponding toand the recalibrated parameterisations
(DK) Agria (CZ, PT, SK) Triada (PL)
0.06 0.060.5 0.4
.006 0.02, 0.006 0.015, 0.0094.0 5.00.06 0.060.09 0.009
ent stage.

i n g 2 1 1 ( 2 0 0 8 ) 209–223
Table 6 – Number of model and data comparisonsdistributed into ranges of N.R.M.S.E. when therecalibrated parameterisation (per variety) and data fromall treatments (T1–T6, DK: only T1–T5) during 2003–2005were used
N.R.M.S.E. 0–10% 0–20% 0–30% Above 30%
Denmark, FolvaShoot—dry matter 1 6 9 6Tuber—dry matter 3 8 12 3Shoot—N content 0 6 9 6Tuber—N content 2 5 8 7
Total of 60 6 25 38 22
AgriaShoot—dry matter 1 6 11 17Tuber—dry matter 2 10 21 7Shoot—N content 0 2 8 20Tuber—N content 0 7 13 15
Total of 112 3 25 53 59
Poland, TriadaShoot—dry matter 0 0 2 15Tuber—dry matter 0 6 14 3Shoot—N content 0 0 2 15
218 e c o l o g i c a l m o d e l l
the common parameterisation. Fm was at the start increasedfrom 4.0 to 5.0, because the yield level was generally too low.The parameter DSLAI0.5 was equal to 0.5 in the commonparameterisation, which resulted in correct initial growth andthe final yields were acceptably simulated. However, the parti-tioning of assimilate had to be adjusted, so that less assimilatewas allocated to the leaves and stems after the tuber initia-tion and hence more to the tubers. Afterwards, the simulatedLAI was too high and the value of the factor that makes theSpLAI dependent on DS (SpLAIMod) was changed slightly atdevelopment stage 1.5 from 1.0 to 1.1. The result was that thesimulated yields were generally too high and to improve them,Fm had to be reduced from 5.0 to 4.8. Finally, the parameter-isation was refined based on the calculated N.R.M.S.E. Thisresulted in an earlier beginning of leaf senescence, from DS1.50 to 1.48. Furthermore, a small decrease in DSRate1 from0.060 to 0.055 and an increase of DSRate2 from 0.09 to 0.11were introduced (Table 4). This resulted in a parameterisationthat was better than the first site-specific parameterisation(Tables 5 and 6). The improvements applied particularly to2005 and to the plant-N content. However, the simulations ofthe stressed treatments (T1 and T2) were not as good as thesimulations of T4 (not shown). Fig. 7 shows the final simulationresults for treatment T4 in 2005. The final Folva parameterisa-tion can be found on the Daisy homepage.
3.8. Agria parameterisation
The potato variety Agria was grown in the Czech Republic,Portugal, and Slovakia. The inclusion of data from all thesesites was an opportunity to create a potato parameterisa-tion that was less site-specific. The data sets contained some
Table 5 – Number of model and data comparisonsdistributed into ranges of N.R.M.S.E. when thesite-specific parameterisation (irrespective of variety)and data from all treatments (T1–T6, DK: only T1–T5)from 2003 to 2005 were used
N.R.M.S.E. 0–10% 0–20% 0–30% Above 30%
Denmark, FolvaShoot—dry matter 0 4 10 5Tuber—dry matter 3 5 12 3Shoot—N content 0 3 6 9Tuber—N content 0 6 9 6
Total of 60 3 18 37 23
AgriaShoot—dry matter 0 2 9 19Tuber—dry matter 4 11 20 8Shoot—N content 0 3 7 21Tuber—N content 0 10 17 11
Total of 112 4 26 53 59
Poland, TriadaShoot—dry matter 0 0 3 14Tuber—dry matter 0 6 12 5Shoot—N content 0 0 2 15Tuber—N content 0 3 5 12
Total of 68 0 9 22 46
Tuber—N content 0 6 11 6
Total of 68 0 12 29 39
problems, described in the following, that were necessaryto take into account during the calibration. The measure-ments from T4 and T5 from the Czech Republic in 2004 werenot considered relevant, because this year an anaerobic soillayer was observed in these treatments, caused probably bywrong placement and unfavourable composition of the slurry.It seems, that this has negatively affected the potato pro-duction. During the original site-specific calibration of thePortuguese site, we had to estimate both the amount of irriga-tion applied as well as the initial content of mineral nitrogenin the soil, because the measured values for both were toouncertain. When revisiting the Portuguese site for the variety-specific Agria parameterisation, we choose to use the sameestimations of irrigation and mineral nitrogen. No measure-ments were made early in the growing season 2003 in Slovakiaand, therefore, the initial growth and start of tuberisation wereuncertainly determined.
The steps in the calibration procedure were to calibrate:(1) emergence, (2) initial growth, (3) SpLAI, (4) the influence ofair temperature on DSRate1 and DSRate2, and (5) assimilatepartitioning.
Emergence was adjusted by EmrTsum. Using the commonparameterisation, the growth just after emergence was toofast for almost all treatments in the Czech Republic. A valueof 0.5 for DSLAI05 gave a better initial growth. Common val-ues of SpLAI were used, as these were in good agreementwith the Czech measurements. For the Slovak data set, thecommon values were too low and for the Portuguese data setthey seemed to be too high, which indicates that the common
values may be a reasonably good across-Europe average.The next calibration step was to ensure that tuberisa-tion time is correctly simulated. The potatoes grown in theCzech Republic generated tubers much faster than the pota-

e c o l o g i c a l m o d e l l i n g 2 1 1 ( 2 0 0 8 ) 209–223 219
Fig. 7 – Simulation results of crop dry matter and nitrogen together with soil mineral nitrogen for the variety Folva intreatment T4 in Denmark during 2005 (recalibration). The late measured value is total tuber dry matter measured at the finalh
t1atKhitTgbbttwico(ottrt
tahhsptfsttusasas
arvest.
oes grown in Portugal and Slovakia. At the Czech site, it took2–18 days from emergence, while it took 34 days in Portugalnd 25 days in Slovakia. Tuber initiation is very dependent onemperature and day length (Ritchie et al., 1995; Haverkort andooman, 1997). The air temperatures after emergence wereigher at the sites in Portugal and Slovakia than at the site
n the Czech Republic. Thus, the data may indicate that airemperatures above a certain threshold delay tuberisation.o be able to simulate this effect, the parameter TempEff1overning the temperature effect on the development rateefore tuberisation was adjusted accordingly. This was doney feeding an optimisation program with all five sets of airemperatures and the corresponding number of days beforeuberisation. The value of TempEff1 that gave the best matchas chosen. One must add, however, that the mother tubers
n the Czech experiment were chitted, i.e., their physiologi-al age was higher. This circumstance may have affected notnly the onset of emergence but also the onset of tuberisation
Villafranca et al., 1998). It is also possible to include an effectf day length on tuberisation in the model, but it was omit-ed because we assume that the effect of the variable motherubers was important in our experiments across Europe andesulted in insufficient data quality for parameterisation ofhis effect.
Using these parameter values, the simulated DM produc-ion was too high at the end of the growing season in Portugalnd Slovakia, but not in the Czech Republic. The excessivelyigh DM production simulated in Portugal and Slovakia mayave been a consequence of too late leaf senescence in theimulations, when compared to observations. To lower theroduction rate, leaf senescence had to be increased for Por-ugal and Slovakia, but this would cause a worse simulationor the Czech conditions, because the senescence was wellimulated for the Czech potatoes. To solve these conflictingrends, the parameter governing the temperature effect afteruberisation was adjusted so that high temperatures speedp phenological aging. This resulted in earlier simulated leafenescence for potatoes from Portugal and Slovakia, without
ffecting the potatoes from the Czech Republic, and all theimulations were improved. The Portuguese data indicatedn even faster aging rate but this could not be achieved inimulations without causing problems for the simulations ofthe two other sites. Stem loss of dry matter over time wasindicated by some measurements but this process was notincluded in Daisy. Instead, allocating less assimilates to thestem simulated this trend.
Tables 5 and 6 show that the N.R.M.S.E. values of theAgria simulation were almost the same for both the site-specific and the variety-specific recalibrated simulations, butthe actual simulation results were very different. Fig. 8 showsthe simulation results of the Agria variety for the Czechtreatment T4 for 2005. In comparison with the results ofthe site-specific calibration (Fig. 4a and b), the simulatedN contents of the crop now better coincide with the mea-sured ones, except for the total N content in tubers atharvest, and the agreement was better for the other treat-ments (not shown). The simulated DM contents were notimproved. For the Agria site-specific parameterisations, theN.R.M.S.E. values were calculated from the simulations usingthree different parameterisations—one for each site, but forthe recalibrated simulations only one parameterisation wasused. For the Portuguese simulations, the start phase wasimproved, but the final production was often too high. Thefinal Agria parameterisation can be found on the Daisy home-page.
3.9. Triada parameterisation, Poland
The potato parameterisation for Triada was based only onthe Polish field experiments. The validation of the Polishsite-specific parameterisation showed problems in predictingthe initial growth, especially for the non-irrigated treatments.The initial growth was low, and this influenced the rest of thesimulation period. It seems that initiation of growth in Daisywas too sensitive to weather conditions just after emergence.The validation year 2005 received about 60% less radiationduring the period just after emergence than the two preced-ing years. In the recalibration procedure, the initial growthfunction was made independent of the light intensity. Thiswas justified by knowledge found by Villafranca et al. (1998),
that the initial growth of the potato can be very dependenton the variable state of the mother tubers. The steps in therecalibration process were: (1) to get emergence and the startof tuberisation correct, (2) to adjust root development relative
220 e c o l o g i c a l m o d e l l i n g 2 1 1 ( 2 0 0 8 ) 209–223
Fig. 8 – Simulation results of crop dry matter and nitrogen together with soil mineral nitrogen for the variety Agria inhe l
treatment T4 in Czech Republic during 2005 (recalibration). Tthe final harvest.
to measured root depths and soil moisture, (3) to determineSpLAI from measurements, (4) to adjust Fm, (5) to adjustinitial growth, (6) to change the partitioning of assimilate, (7)to set limits for N uptake, (8) to make the phenological ratemore dependent on temperature, and (9) to make the cropless sensitive to water stress.
The first step was to adjust the emergence time by EmrT-Sum. After that, a correct prediction of tuberisation start wasfound using the common development rate (Table 4). Rootmeasurements of 2005 indicated a deeper root penetrationat emergence than in 2003 and 2004. This was interpreted asbeing a consequence of a deeper sowing depth of the mothertuber. Setting the sowing depth of the mother tuber to 0.30 min 2005 instead of 0.20 m used in the common parameterisa-tion gave better agreements between simulated and measuredroot development. The measurements of LAI and DM of leaveswere used to calculate SpLAI, and this resulted in a lower valuethan the one used in the common parameterisation (Table 4).The new value of SpLAI gave a reduction in production thathad to be compensated for by increasing Fm from 4.0 to 5.0 gCO2/(m2 h). In general, Fm has been the parameter used forfitting the general level of production, after adjustment of
directly measured parameters. Ierna and Mauromicale (2006)found that the photosynthetic rate was positively associatedwith the aboveground biomass. The simulation results for2005 were still very poor, especially during the start of theFig. 9 – Simulation results of crop dry matter and nitrogen togethtreatment T4 in Poland during 2005 (recalibration).
ate measured value is total tuber dry matter measured at
growing period. Increasing the value of DSLAI05 from 0.2 to0.4 gave a better result during 2005. This, unfortunately, hada slightly negative effect on the success of 2003 and 2004simulations. The common definitions of assimilate partition-ing parameters resulted in too much DM in stem comparedto DM in leaves, and, therefore, the partitioning parametershad to be changed. Measurements of soil mineral N in theupper 0.60 m showed a lower boundary of 30–40 kg N/ha. Thepotato parameterisation was accordingly modified by settingthe parameters NH4 root min and NO3 root min, specifyingthe minimum concentrations needed near the root surface foruptake to happen.
By changing the leaf-senescence rate it was possible toget even better predictions of the 2003 and 2005 treatments.Unfortunately, this was not the case for the 2004 treatments,where an increased leaf-senescence rate did not match themeasurements, resulting in too low a production. This couldindicate that the crop phenological aging in 2004 was slowerthan in 2003 and 2005. The year 2004 was colder than 2003and 2005 in the period from April to mid-July. To simulate theapparent difference in the phenological aging, the parame-terisation was modified to give maximum developing rates at20 ◦C.
Due to poor simulations of the water stressed treatments(T1 and T2, not shown), the parameterisation of crop responseto water stress was changed. A linear relation between water
er with soil mineral nitrogen for the variety Triada in

g 2 1
sMbc(tt
4
Ttpdbipa
4
SccVaaic
pTtpsrupwm
bshtmilttean
waiai
e c o l o g i c a l m o d e l l i n
tress and assimilate production is used by default in Daisy.ogensen (1980) showed that the assimilate production might
e less sensitive to water stress than this relation indi-ated. This last refinement improved the simulation resultsTables 5 and 6), especially for 2005. The simulation results forreatment T4 can be seen in Fig. 9. The final Triada parame-erisation can be found on the Daisy homepage.
. Discussion
his study describes a calibration method that can be usedo model potato growth in Europe. Following the steps in therocedure can be helpful for model users when they want toevelop and parameterise new potato modules, so they cane applied satisfactorily at different locations. The parameter-
sations resulting from the calibration can be used as startingoints for new calibrations of potatoes for other soils, climates,nd management practices.
.1. Systematic calibration process
ystematic or automatic calibration/validation proceduresan often be found in the literature, especially for hydrologi-al modelling and pesticide-leaching models (Refsgaard, 1997;anclooster et al., 2000; Abrahamson et al., 2005), whereasutomated procedures for crop models are more rare (Huntnd Boote, 1998; Wallach et al., 2001). The first stage in our cal-bration was to create an initial potato parameterisation thatould serve as a starting point for all the simulations.
Vanclooster et al. (2000) recommend the good modellingractice (GMP) that records the steps in the modelling process.he main objective of a GMP is to describe what has been done,
o justify why it has been done, and to document the modellingrocess such that the model user and any independent per-on may repeat the modelling exercise and achieve the sameesult (Travis, 1995). The first advice in GMP is “The modelser is responsible for understanding the model and its appro-riate usage”. In the present study, a step toward this targetas made at a workshop held in 2003, where the site-specificodellers learned to use the Daisy model.The next advice in GMP is “The model user is responsi-
le for estimating the model parameters and the input for aelected scenario”. Because our model users were local, theyad close contact to the persons that were responsible forhe field measurements or they undertook the field experi-
ents themselves. This is important for the quality of thenput and for the explanation of unexpected situations. Theocal modellers performed the calibrations with only elec-ronic communication to the model experts. An evaluation ofhe process with the site-specific calibration by the local mod-llers showed that electronic communication was insufficientnd that direct contact between the site and model experts isecessary.
In the present study, the steps in the calibration procedureere described in details and as such agreed well with the last
dvice in the GMP: “The user is finally responsible for develop-ng modelling reports that contain sufficient information forn independent person to reproduce the results”. The report-ng (Abrahamsen et al., 2006) of the detailed analysis of the1 ( 2 0 0 8 ) 209–223 221
calibration procedure and parameters use will most likely aidsubsequent users of the model.
In the present study, the initial procedure was an ordinarycalibration/validation process that is often composed of cali-bration of the model on experimental data from some yearsand validation of the model on data from another year. Thecalibration process was an iterative ‘trial and error’ process.It is important that the parameters are evaluated in a logi-cal sequence. At all sites in the present study, the parametersrelated to soil water were calibrated first and then parametersrelated to crop growth and N dynamics—a sequence that isoften used (Hanson et al., 1999).
The next step in our procedure was to combine the result-ing parameter sets from the individual calibrations into a newcommon parameter set. The model developers from KU-LIFEdid this work. A strategy like this was also used in a systematicparameterisation of legume crop models where the startingvalues determining crop development and phenology werefrom ‘general’ cultivars (Hunt and Boote, 1998).
Afterwards, the calibration was iterated using the commonparameter set as a starting point. The data from the experi-ments during 2005 were also included in this analysis. As afirst step, six key parameters were inspected and, if necessary,their values, imported from the common parameterisation,were changed. It is recommended to adjust the time of emer-gence parameter individually because the variable history andactual state of the mother tubers make it difficult to find anautomatic universal way how to estimate it. Villafranca et al.(1998) found that the physiological age of the mother tuber canaffect the development of the potato as long as until tuberi-sation. Afterwards, other parameters were modified if thiscontributed to reduction of N.R.M.S.E. A method like this, start-ing with a few important parameters and then including moreparameters, one at a time as long as the fit between measure-ments and simulations improves, was described by Wallachet al. (2001) and the same strategy was used by Zhai et al.(2004).
4.2. Use of parameterisation
If a model user wants to apply the model to a potato cropgrown on the same site, then the site-specific specific parame-ters can be a good starting point. Hanson et al. (1999) describedregional or site-specific parameters as parameters that maychange according to site. The parameters can differ from siteto site depending on soil, climate, and management practice(Abrahamson et al., 2005). Therefore, the parameters must beestimated separately for each plot (Sievanen and Burk, 1993).In Poland and Denmark, the variety-specific parameterisationcorresponds to the site-specific parameters because the vari-ety was only used in experiments at one site. The applicationof the Daisy model on different sites in Europe in this studyresulted in parameters that respond to the local conditions.
For an inexperienced user it may be difficult to select thekey parameters to calibrate because different combinations ofparameters can result in equally good simulations (Botterweg,
1995). The selection of the important parameters was facili-tated in this study, where six independent model users fromdifferent locations in Europe made their own choices depend-ing on the soil, climate, and management practices at their
i n g
r
222 e c o l o g i c a l m o d e l l
locations. There were six parameters that all individual usersneeded to change in order to get a good agreement betweenmeasurements and simulations. These were defined as thekey parameters. Besides these six key parameters, the timeof emergence should be adjusted individually as mentionedabove.
If a model user will calibrate the model on experi-ments with the same variety he can use the variety-specificparameter set as a starting point. It is expected that thisvariety-specific parameterisations reflect the variety proper-ties better and are less site-specific, more representative andmore suitable for use across Europe. Unlike the site-specificparameterisations, the new variety-specific parameterisa-tions have not yet been validated, as no new data wereavailable.
The parameterisation resulting from this procedure can,e.g., be used in scenario studies including simulations of manycombinations of soils, climate, crop rotations and manage-ment for several years. Before applying a model across Europeit is necessary to test the model on the different climate andsoils in several areas of Europe. Adopting the calibration pro-cedure in this study we hope to remove some local bias dueto, e.g., inaccuracy in data at a site, and then to be able to cre-ate potato variety parameterisations that are more suitable foruse in different parts of Europe.
5. Conclusions
The FertOrgaNic project has resulted in transport andexchange within Europe of know-how of the Daisy simula-tion system, methods of measurements, and development ofa shared scientific language. The project has shown the impor-tance for local modellers of having close contact to persons,who make the field experiments and of detailed knowledge onthe conditions under which the experiments were performed.The calibration project started with a Daisy workshop gener-ating a calibration base for the group of modellers.
The problem with local modelling is that the parame-terisation for a given variety may become too site-specificregarding climate, soil and management. We believe that thetwo steps of creating the common parameterisation first andthen the variety-specific parameterisations have worked welland generated robust and portable parameterisations. Theseparameterisations are now a part of the Daisy distribution.However, they need to be validated on other experimentaldata sets with new site partners to check their portabil-ity.
The calibration procedure we recommend to follow is tostart calibrating the water dynamics and then continue withthe crop growth and N dynamics. The calibration of the cropgrowth should be started with the six key parameters identi-fied in this study. In addition, it is always necessary to adjustthe emergence time individually, because the initiation ofpotato growth is very dependent on the history and actualstate of the mother tubers. After the key parameters have
been parameterised, other more or less subjectively selectedparameters can be included in the calibration process untilan acceptable agreement is reached between modelled andmeasured data.2 1 1 ( 2 0 0 8 ) 209–223
It is recommended to use site-specific parameter setsobtained in the present study as a starting point if the modeluser wants to calibrate a potato crop from the same country(Denmark, Czech Republic or Poland) for which the parameterset has been developed. The variety-specific parameter setsshould be used if the model user wants to calibrate a potatocrop of the same variety (Agria, Folva or Triada). The commonparameter set is expected to be valid as a starting point formodel users from other sites and for the modelling of otherpotato varieties than mentioned above.
Acknowledgements
This work was financed jointly by the EU 5th Framework RTDproject (QLK5-2002-01799) FertOrgaNic (Improved organic fer-tiliser management for high nitrogen and water use efficiencyand reduced pollution in crop systems), and national fundingfrom the co-authoring institutes. We are very grateful to Dr.D.K.L. MacKerron of the Scottish Crop Research Institute forhis highly valuable comments.
e f e r e n c e s
Abrahamsen, P., 2006. Daisy Program Reference Manual, RoyalVeterinary and Agricultural University, Copenhagen,http://www.dina.kvl.dk/∼daisy/ftp/daisy-ref.pdf.
Abrahamsen, P., Hansen, S., 2000. Daisy: an opensoil–crop–atmosphere system model. Environ. Modell. Softw.15, 313–330.
Abrahamsen, P., Battilani, A., Coutinho, J., Dolezal, F., Heidmann,T., Mazurczyk, W., Ruiz, J.D.R., Takac, J., Tofteng, C., 2006. Daisycalibration. Results from the EU project FertOrgaNic,Deliverable D 5 1, http://www.fertorganic.org/.
Abrahamson, D.A.A., Radcliffe, D.E., Steiner, J.L., Cabrera, M.L.,Hanson, J.D., Rojas, K.W., Schomberg, H.H., Fisher, D.S.,Schwartz, L., Hoogenboom, G., 2005. Calibration of the rootzone quality model for simulating tile drainage and leachednitrate in the Georgia Piedmont. Agron. J. 97, 1584–1602.
Battilani, A., Plauborg, F., Hansen, S., 2006. FertOrgaNic DecisionSupport System V4.0 Beta 6. Results from the EU projectFertOrgaNic. Improved organic fertiliser management for highnitrogen and water use efficiency and reduced pollution incrop systems (QLK5-2002-01799). Deliverable D5 2. Final set ofDSS rules. http://www.fertorganic.org/.
Belanger, G., Walsh, J.R., Richards, J.E., Milburn, P.H., Ziadi, N.,2001. Tuber growth and biomass partitioning of two potatocultivars grown under different N fertilization rates with andwithout irrigation. Am. J. Potato Res. 78, 109–117.
Boesten, J.J.T.I., 2000. Modeller subjectivity in estimating pesticideparameters for leaching models using the same laboratorydata set. Agric. Water Manag. 44, 389–409.
Botterweg, P., 1995. The user’s influence on model calibrationresults: an example of the model SOIL, independentlycalibrated by two users. Ecol. Model. 81, 71–81.
Bruun, S., Christensen, B.T., Hansen, E.M., Magid, J., Jensen, L.S.,2003. Calibration and validation of the soil organic matterdynamics of the Daisy model with data from the Askovlong-term experiments. Soil Biol. Biochem. 35, 67–76.
De Willingen, P., 1991. Nitrogen turnover in the soil-crop system;comparison of fourteen simulation models. Fert. Res. 27,141–149.
Diekkruger, B., Sondgerath, D., Kersebaum, K.C., McVoy, C.W.,1995. Validity of agroecosystem models: a comparison of

g 2 1
G
H
H
H
H
H
H
I
J
K
K
M
M
P
R
R
new approach and application to a corn model. Agron. J. 93,
e c o l o g i c a l m o d e l l i n
results of different models applied to the same data set. Ecol.Model. 81, 3–29.
oudriaan, J., 1982. Potential production processes. In: Penningde Vries, F.W.T., van Laar, H.H. (Eds.), Simulation of PlantGrowth and Crop Production. Simulation Monographs. Pudoc,Wageningen, pp. 98–113.
ansen, S., Jensen, H.E., Nielsen, N.E., Svendsen, H., 1990. DAISY:Soil Plant Atmosphere System Model. NPO Report no. A10.The National Agency for Environmental Protection,Copenhagen, 272 pp.
ansen, S., Jensen, H.E., Nielsen, N.E., Svendsen, H., 1991.Simulation of nitrogen dynamics and biomass production inwinter wheat using the Danish simulation model Daisy. Fert.Res. 27, 245–259.
ansen, S., Thirup, C., Refsgaard, J.C., Jensen, L.S., 2001.Modelling of nitrate leaching at different scales—applicationof the Dasiy. In: Shaffer, M., Liwang, M., Hansen, S. (Eds.),Modeling Carbon and Nitrogen Dynamics for SoilManagement. Lewis Publishers, Boca Raton, pp. 511–547.
anson, J.D., Rojas, K.W., Shaffer, M.J., 1999. Calibrating the rootzone water quality model. Agron. J. 91, 171–177.
averkort, A.J., Kooman, P.L., 1997. The use of systems analysisand modelling of growth and development in potatoideotyping under conditions affecting yields. Euphytica 94,191–200.
unt, L.A., Boote, K.J., 1998. Data for model operation, calibration,and evaluation. In: Tsuji, G.Y., Hoogenboom, G., Thornton, P.K.(Eds.), Understanding Options for Agricultural Protection.Kluwer Academic Publishers, Great Britain, pp. 9–39.
erna, A., Mauromicale, G., 2006. Physiological and growthresponse to moderate water deficit of off-season potatoes in aMediterranean environment. Agric. Water Manag. 82, 193–209.
ensen, L.S., Mueller, T., Bruun, S., Hansen, S., 2001. Application ofthe Daisy model for short and long-term simulation of soilcarbon and nitrogen dynamics. In: Shaffer, M., Liwang, M.,Hansen, S. (Eds.), Modeling Carbon and Nitrogen Dynamics forSoil Management. Lewis Publishers, Boca Raton, pp. 483–509.
abat, P., Marshall, B., van den Broek, B.J., Vos, J., van Keulen, H.,1995. Modelling and parameterization of thesoil–plant–atmosphere system. In: A Comparison of PotatoGrowth Models. Wageningen Pers, 513 pp.
arvonen, T., Kleemola, J., 1995. CROPWATN: prediction of waterand nitrogen limited potato production. In: Kabat, P.,Marshall, B., van den Broek, B.J., Vos, J., van Keulen, H. (Eds.),Modelling and Parameterization of theSoil–Plant–Atmosphere System. A Comparison of PotatoGrowth Models. Wageningen Pers., pp. 335–369.
ogensen, V.O., 1980. Drought sensitivity at various growthstages of barley in relation to relative evapotranspiration andwater stress. Agron. J. 72, 1033–1038.
ueller, T., Magid, J., Jensen, L.S., Nielsen, N.E., 1998. Soil C and Nturnover after incorporation of chopped maize barley strawand blue grass in the field: evaluation of the DAISYsoil-organic-matter submodel. Ecol. Model. 111, 1–15.
enning de Vries, F.W.T., Jansen, D.M., ten Berge, H.F.M., Bakema,A., 1989. Simulation of Ecophysiological Processes of Growthin Several Annual Crops. Simulation Monographs Pudoc.,Wageningen, 271 pp.
efsgaard, J.C., 1997. Parameterisation, calibration and validationof distributed hydrological models. J. Hydrol. 198, 69–97.
itchie, J.T., Griffin, T.S., Johnson, B.S., 1995. IV-8: SUBSTOR:functional model of potato growth, development and yield. In:P. Kabat, B. Marshall, B.J. van den Broek, J. Vos, H. van Keulen
1 ( 2 0 0 8 ) 209–223 223
(Eds.), Modelling and Parameterization of theSoil–Plant–Atmosphere System. A Comparison of PotatoGrowth Models. Wageningen Pers., pp. 401–435.
Shapendonk, A.H.C., Splitters, C.J.T., Groot, P.J., 1989. Effects ofwater stress on photosynthesis and chlorophyll fluorescenceof five potato cultivars. Potato Res. 32, 17–32.
Sievanen, R., Burk, T.E., 1993. Adjusting a process-based growthmodel for varying site conditions through parameterestimation. Can. J. For. Res. 23, 1837–1851.
Smith, P., Smith, J.U., Powlson, D.S., Arah, J.R.M., Chertov, O.G.,Coleman, K., Franko, U., Frolking, S., Gunnewick, H.K.,Jenkinson, D.S., Jensen, L.S., Kelly, R.H., Li, C., Molina, J.A.E.,Mueller, T., Parton, W.J., Thornley, J.H.M., Whitmore, A.P., 1997.A comparison of the performance of nine soil organic mattermodels using datasets from seven long-term experiments.Geoderma 81, 153–222.
Sumner, N.R., Fleming, P.M., Bates, B.C., 1997. Calibration of amodified SFB model for twenty-five Australian catchmentsusing simulated annealing. J. Hydrol. 197, 166–188.
Svendsen, H., Hansen, S., Jensen, H.E., 1995. Simulation of cropproduction, water and nitrogen balances in two Germanagro-ecosystems using the Daisy model. Ecol. Model. 81,197–212.
Travis, K.Z., 1995. Recommendations for the correct use ofmodels and reporting of modelling results. In: Boesten,J.J.T.I., Businelli, M., Delmas, A., Edwards, V., Helweg, A., Jones,R., Klein, M., Kloskovski, R., Layton, R., Marcher, S., Schafer, H.,Smeets, L., Styczen, M., Russell, M., Travis, K., Walker, A., Yon,D. (Eds.), Leaching Models and EU Registration. The FinalReport of the Work of the Regulatory ModellingWork Group of FOCUS, Forum for the Coordination ofPesticide Fate models and their Use. Guidance Document4952/VI/95. Commission of the European Communities, DGVI,Brussels, p. 123.
Vanclooster, M., Boesten, J.J.T.I., Trevistan, M., Brown, C.D., Capri,E., Eklo, O.M., Gottesburen, B., Gouy, V., van der Linden,A.M.A., 2000. A European test of pesticide-leaching models:methodology and major recommendations. Agric. WaterManag. 44, 1–19.
Van der Perk, M., 1998. Calibration and identifiability analysis of awater quality model to evaluate the contribution of differentprocesses to the short-term dynamics of suspended sedimentand dissolved nutrients in the surface water of ruralcatchment. Hydrol. Process. 12, 683–699.
Verecken, H., Jansen, E.J., Hack-ten Broeke, M.J.D., Scherts, M.,Engelke, R., Fabrewich, F., Hansen, S., 1991. Comparison ofsimulation results of five nitrogen models using different datasets. In: Soil and Groundwater Research Report II: Nitrate insoils. Final report on contracts EV4V-0098-NL andEV4V-00107-C. DG XII. Commission of the EuropeanCommunities, pp. 321–338.
Villafranca, M.J., Veramendi, J., Sota, V., Mingo-Castel, A.M., 1998.Effect of physiological age of mother tuber and number ofsubcultures on in vitro tuberisation of Potato (Solanumtuberosum L.). Plant Cell Rep. 17, 787–790.
Wallach, D., Goffinet, B., Bergez, J.-E., Debaeke, P., Leenhardt, D.,Aubertot, J.-N., 2001. Parameter estimation for crop models: a
757–766.Zhai, T., Mohtar, R.H., El-Awar, F., Jabre, W., Volenec, J.J., 2004.
Parameter estimation for process-oriented crop growthmodels. T. ASAE 47, 2109–2119.