BY SULTAN SULEMAN (B. Pharm) - CiteSeerX
89
1 COMPARATIVE IN VITRO QUALITY EVALUATION OF TABLETS OF THE COMMONLY PRESCRIBED ANTIEPILEPTIC DRUGS, CARBAMAZEPINE AND PHENOBARBITAL, FROM DRUG RETAIL OUTLETS IN ADDIS ABABA BY SULTAN SULEMAN (B. Pharm) A thesis submitted to the School of Graduate studies of Addis Ababa University in partial fulfillment for the Degree of Master of Science in Pharmaceutical Analysis and Quality Assurance June 2005
-
Upload
khangminh22 -
Category
Documents
-
view
5 -
download
0
Transcript of BY SULTAN SULEMAN (B. Pharm) - CiteSeerX

1
COMPARATIVE IN VITRO QUALITY EVALUATION OF TABLETS OF
THE COMMONLY PRESCRIBED ANTIEPILEPTIC DRUGS,
CARBAMAZEPINE AND PHENOBARBITAL, FROM DRUG RETAIL
OUTLETS IN ADDIS ABABA
BY
SULTAN SULEMAN (B. Pharm)
A thesis submitted to the School of Graduate studies of Addis Ababa
University in partial fulfillment for the Degree of Master of Science in
Pharmaceutical Analysis and Quality Assurance
June 2005

2
ADDIS ABABA UNIVERSITY
SCHOOL OF GRADUATE STUDIES
COMPARATIVE IN VITRO QUALITY EVALUATION OF TABLETS OF
THE COMMONLY PRESCRIBED ANTIEPILEPTIC DRUGS,
CARBAMAZEPINE AND PHENOBARBITAL, FROM DRUG RETAIL
OUTLETS IN ADDIS ABABA
By
SULTAN SULEMAN (B. PHARM)
DEPARTMENT OF PHARMACEUTICAL CHEMISTRY
SCHOOL OF PHARMACY
Approved by the Examining Board:
Name Signature Date
Prof. Farghaly Addel-Hamid
Omar
____________________ __________________ ___________
(Advisor)
Dr. Asfaw Debella
__________________ __________________ ___________
(Examiner)
Dr. Tamil
_________________ __________________ ___________
(Examiner)
W/t Dunge Ashenafi
_________________ __________________ ___________
(Chairperson)

3
DECLARATION
I, the undersigned, declare that this thesis is my original work and has not been presented for a
degree in any other university.
Name: Sultan Suleman Wega
Signature: _______________
This thesis has been submitted for examination with approval as a University Advisor.
Name: Prof. Farghaly Addel-Hamid Omar
Signature: ________________________
Place and Date of Submission: Addis Ababa, Ethiopia, June 2005

i
ACKNOWLEDEMENTS
My heartfelt appreciation and gratitude goes to my advisor Prof. Farghaly Addel-Hamid Omar
who has been a constant source of inspiration and action and for his advice as well as follow up.
I am grateful to the Department of Drug Quality Control and Toxicology [Ethiopian Drug
Administration and Control Authority (DACA)] and all its staffs as a whole that showed me full
cooperation and positive thinking, and Ethiopian Pharmaceuticals Manufacturing Company for
rendering me full willing of cooperation and Phenobarbital reference substance.
Special acknowledgement is for the School of Graduate Studies of Addis Ababa University for
sponsoring me the total work of the study and School of pharmacy for coordinating the
managerial and technical aspects of the work.
Finally, I would like to thank and appreciate all of those who in one way and the other facilitated
this study and special dedication goes to my fiancė Lubaba Nuru, who has been giving me
strength and moral of work.

ii
CONTENTS
Pages
ACKNOWLEDGEMENTS I
CONTENTS II
LIST OF TABLES V
LIST OF FIGURES VI
ACRONYMS VII
ABSTRACT VIII
1. INTRODUCTION 1
1.1. Epilepsy 1
1.1.1. Epilepsy and Seizures 1
1.1.2. Etiology of epilepsy 2
1.1.3. Epidemiology: prevalence, incidence and mortality of Epilepsy 3
1.1.4. Treatment of epilepsy 4
1.1.5. Treatment failures with antiepileptic drugs 4
1.2. Pharmaceuticals Quality, Effectiveness and Trading 5
1.2.1. Therapeutic Effectiveness and Quality of Pharmaceuticals 5
1.2.2. Pharmaceuticals Quality and Trading 6
1.3. Antiepileptic drugs: Carbamazepine and Phenobarbitone 7
1.3.1. Carbamazepine 7
1.3.1.1. Chemistry of Carbamazepine 8
1.3.1.2. Pharmacokinetic profile of Carbamazepine 8
1.3.2. Phenobarbitone 9
1.3.2.1. Chemistry of phenobarbitone 9
1.3.2.2. Pharmacokinetic profile of phenobarbitone 10
1.3.3. Therapeutic Drug Monitoring (TDM) of

iii
carbamazepine and phenobarbitone 10
1.4. Quality Control parameters and Properties of tablet dosage forms 11
1.4.1. Hardness and Friability 12
1.4.2. Uniformity of dosage units: content uniformity and
weight variation 13
1.4.3. Disintegration 13
1.4.4. Assay of active ingredients 14
1.4.5. Dissolution and Dissolution tests 14
1.4.5.1. Dissolution process and rate 14
1.4.5.2. Factors affecting tablet dissolution 15
1.4.5.3. Dissolution Test as Quality Control Parameters 17
1.4.5.3.1. Dissolution characteristics of Carbamazepine 18
1.4.5.4. Dissolution, Bioavailability and Bioequivalence 18
1.5. Bioavailability assessment and in vitro/ in vivo correlations 21
1.5.1. In vitro methods of assessing bioavailability 21
1.5.1.1. Disintegration test method of assessing bioavailability 22
1.5.1.2. Dissolution test for assessing bioavailability 22
1.5.1.2.1. Official dissolution methods 22
1.5.1.2.2. Limitations of dissolution testing 24
1.5.2. In vitro-in vivo correlations 24
1.6. Objectives 25
1.6.1. General Objectives 25
1.6.2. Specific Objectives 25
2. EXPERIMENTAL 27
2.1. Materials and Methods 27
2.1.1. Materials 27
2.1.1.1. Tablets and reference standards 27
2.1.1.2. Solvents / Chemicals/ Reagents 28
2.1.1.3. Instruments 28
2.1.2. Methodology 28
2.1.2.1. Identification 29

iv
2.1.2.2. Tablet hardness and friability 30
2.1.2.3. Dosage form uniformity test (weight variation and
content uniformity) 30
2.1.2.4. Disintergration test 31
2.1.2.5. Assay of the tablets 31
2.1.2.6. Dissolution studies 32
2.2. Data Analysis 33
3. RESULTS AND DISCUSSION 34
3.1. Identification test 34
3.2. Hardness and Friability Test 37
3.3. Disintegration test 38
3.4. Weight variation and Dosage unit uniformity 39
3.4.1. Weight variation 39
3.4.2. Dosage unit uniformity 41
3.5. Assay of the tablets 43
3.6. Dissolution studies 45
3.6.1. Dissolution profile of Carbamazepine tablets 45
3.6.2. Dissolution profile of Phenobarbital tablets 47
3.6.3. Dissolution parameters 49
CONCLUSION 51
SUGGESTIONS FOR FURTHER WORK 52
REFERENCES 53
ANNEXES 66

v
LIST OF TABLES
Pages
Table 1.1: Minimum Quality Control Tests for Pharmaceutical Preparations 12
Table 2.1: Carbamazepine 200 mg tablets 27
Table 2.2: Phenobarbitone 100 mg tablets 27
Table 3.1: Absorption maxima [λmax] of
Carbamazepine and Phenobarbital tablets 34
Table 3.2: Melting point of Carbamazepine and Phenobarbital tablets 36
Table 3.3: Summary of hardness and friability tests of the tablets 37
Table 3.4: Disintegration time (minute) of Carbamazepine and
Phenobarbital tablets 38
Table 3.5: Weight variation and dosage uniformity of carbamazepine and
Phenobarbital 40
Table 3.6: Percentage claim potency of the active ingredient per tablet
weight of Carbamazepine (200 mg) and Phenobarbital
(100 mg) tablets 42
Table 3.7: Assay results of carbamazepine and Phenobarbital tablets 44
Table 3.8: Statistical analysis results of assay values of different
Carbamazepine and Phenobarbital tablets 44
Table 3.9: Percentage drug release of different brands of carbamazepine
tablets at different times 46
Table 3.10: Percentage drug release of different generic products of
Phenobarbital tablets at different times 48
Table 3.11: The t50% and t90% of carbamazepine and Phenobarbital tablets 50

vi
LIST OF FIGURES
Pages
Figure 1.1: The Structural Formula of Iminostilbene 8
Figure 1.2: The Structural Formula of Carbamazepine 8
Figure 1.3: The structural formula for phenobarbitone 9
Figure 1.4: Schematic Illustration of Dissolution of solid dosage forms 15
Figure 1.5: Schematic representation of dissolution Apparatus I (Basket method) 23
Figure 1.6: Schematic representation of dissolution Apparatus II (Paddle method) 23
Figure 3.1: Dissolution profiles of different brands of carbamazepine 47
Figure 3.2: Dissolution profile of different generic products of Phenobarbital
tablets 49

vii
ACRONYMS
DACA Drug Administration and Control Authority
FDA Food and Drug Administration
USPDQI United States Pharmacopoeia Drug Quality and Information
AUC Area under the Curve
Cmax Maximum Concentration
SAR Structure-Activity-Relationship
TDM Therapeutic Drug Monitoring
GC Gas Chromatography
LC Liquid Chromatography
TLC Thin Layer Chromatorgraphy
HPTLC High Performance Thin layer chromatography
LAL Lumulus Amoebosite Lysate
ICH International Conference on Harmonization
USP United States Pharmacopoeia
RSD Relative Standard Deviation
USCDC United States Center for Disease Control
GMP Good Manufacturing Practices
TGA Therapeutic Goods Act
API Active Pharmaceutical Ingredient
BP British Pharmacopoeia
IP International Pharmacopoeia
SD Standard Deviation
PhB Phenobarbitone
NPCB National Pharmaceutical Control Bureau
GABA Gamma Amino Butyric Acid
viii
ABSTRACT
Several literature reports show that up to 30% of epileptic patients may not respond to drug
therapy, or inadequate control of their seizures, even if there is increasing prevalence and
incidence rates of epilepsy. But why this happens and whether it can be predicted is unknown.
Studies show that patients who have many seizures before therapy or who have an inadequate
response to initial treatment with antiepileptic drugs are likely to develop refractory epilepsy
(resistance epilepsy) of unknown origin. In this investigation, trial has been undertaken for the
prediction of the reasons of treatment failures by virtue of controlling the drug quality aspects.
Evaluation studies provide a means of identifying quality differences between same products
obtained from various manufacturers. Quality analysis and evaluations are the most important
tasks to be performed when various reports of therapy indicate problems and failures of
treatment.
Different products of antiepileptic drugs, carbamazepine and Phenobarbital tablets were
evaluated for their in vitro quality so that a base line data was developed to quote the reasons for
the therapeutic failures with antiepileptic drugs from the drug quality point of view. Different
brands of carbamazepine tablets and different generic products of Phenobarbital tablets marketed
in Addis Ababa were analyzed for their identification, hardness and friability, disintegration,
dosage form uniformity (weight variation and/or content uniformity), assay (drug content), and
in vitro dissolution profiles. In addition, values of t50% and t90% for drug release were determined
for all the tablets. Weight variation test was performed for all the tablets analyzed while content
uniformity test was performed for two of the Phenobarbital tablets: East Africa Pharmaceutical
and Cadila products. With respect to identification, hardness and friability, disintegration test and
dosage form uniformity, all the tablets evaluated were in good agreement with the official
specification. From the carbamazepine tablets analyzed, Tegral was found to be below the drug

ix
content specification, while the other brands of carbamazepine and all the Phenobarbital tablets
analyzed were in accordance with their respective specifications. The dissolution tests performed
indicated that Tegral tablet and two of the Phenobarbital tablets (East Africa Pharmaceutical and
Cadila products) did not release the required drug content within the specified time. Taver from
the carbamazepine tablets and the Epharm product Phenobarbital had good dissolution profiles,
while the other products showed slower dissolution rates as compared to the above two drugs.
The study indicated that the tablets analyzed were bioinequivalent to each other with respect to
the in vitro quality studies as some were found to be substandard and some were unable to
release the required content at the specified time. Therefore, utilization of the substandard ones
or interchange use of the bioinequivalent drug products could have contribution to treatment
failures.
The present study will be of paramount importance provided further in vivo bioavailability
evaluation of the indicated brands and generic tablet formulations are performed and correlated
with the in vitro findings. Stability studies of the products should be investigated to identify if
possible to quantify degraded products, continued quality surveillance of the brand and generic
tablet formulations of antiepileptic drugs from different regions of the country should be
conducted to ensure quality thereby improve clinical efficacy.

1
1.1. Epilepsy
1.1.1. Epilepsy and Seizures
Epilepsy is a neurological disorder that affects people in every country throughout the world.
Epilepsy is also one of the oldest conditions known to mankind. It is characterized by a tendency
to recurrent seizures and it is defined by two or more unprovoked seizures. The belief widely
held in many countries is that a person with epilepsy is seized by a supernatural force or power.
This ancient belief is reflected in the name of the disorder the word "epilepsy" being derived
from the Greek word "epilambanein" which means, "to seize or attack". We now know, however,
that seizures are the result of sudden, usually brief, excessive electrical discharges in a group of
brain cells (neurons) and those different parts of the brain can be the site of such discharges. The
clinical manifestations of seizures will therefore vary and depend on where in the brain the
disturbance first starts and how far it spreads. Transient symptoms can occur, such as loss of
awareness or consciousness and disturbances of movement, sensation (including vision, hearing
and taste), mood or mental function [WHO. 2001].
Seizures may vary from the briefest lapses of attention or muscle jerks to severe and prolonged
convulsions. They may also vary in frequency, from less than one a year to several per day.
Seizures are classified according to where in the brain they arise, for instance: Partial or focal
seizures arise from an electric discharge of one or more localized areas of the brain regardless of
whether the seizure is secondary generalized. Depending on their type, they may or may not
impair consciousness. Whether seizures are partial or focal, they begin in a localized area of the
brain, but then may spread to the whole brain causing a generalized seizure. The electrical
discharge, which leads to these seizures, involves the whole brain and may cause loss of
consciousness and/or muscle contractions or stiffness. They include what used to be known as
"grand mal" convulsion and also the brief "petit mal" absence of consciousness. The other type is
status epilepticus, which is characterized by a state in which a person has frequent seizures
without recovery of consciousness between each episode. It is a dangerous state and if not treated
may lead to brain damage or death [Eeg-Olofsson et al., 1995].
It is unclear why particular seizures occur at a particular age or time and not at other ages or
times. Provocative factors, however, are recognized in some patients. For example, certain

2
flashing lights (television, video games etc.), over-breathing, over-hydration, loss of sleep,
and/or emotional and physical stress, may stimulate seizures. Although these are not causes of
epilepsy, they may influence the timing and frequency of seizures [WHO. 2001].
Different epileptic syndromes are based on the age of onset, the type of seizure, the presence or
absence of detectable brain disease and genetic background. However, medical science is only at
an early stage in understanding these different types [Allen et al., 2000].
1.1.2. Etiology of epilepsy
Epilepsy is often, but not always, the result of an underlying brain disease [Artemowicz et al.,
2002]. Any type of brain disease can cause epilepsy, but not all people with the same brain
disease will have epilepsy. In view of the fact that only a proportion of people who have a brain
disease experience seizures as a symptom of that disease, it is suspected that those who do have
such symptomatic seizures are more vulnerable due to biochemical/neurotransmitter reasons.
There are still many people for whom the cause of their epilepsy cannot, as yet, be identified. In
such cases, the theory most commonly accepted is that this epilepsy is the result of an imbalance
of certain chemicals in the brain (especially chemical messengers known as neurotransmitters)
causing them to have a low convulsive threshold [Henry, 2001, Richard, 2002].
Children and adolescents are more likely to have epilepsy of unknown or genetic origin. The
older the patient, the more likely it is that the cause is an underlying brain disease, such as a
brain tumour or cerebrovascular disease, or is the result of head injury. Trauma and brain
infection can cause epilepsy at any age, and as mentioned previously may account for a higher
incidence of epilepsy in developing countries. For example, a common cause in Latin America is
neurocysticercosis cysts on the brain caused by tapeworm infection, while in Africa, malaria and
meningitis are common causes. In India neurocysticercosis and tuberculosis often lead to
epilepsy. Febrile illness of any kind can trigger seizures in young children. About 3% of children
who have febrile convulsions go on to develop epilepsy in later life. Studies in Ethiopia indicate
that epilepsy is the commonest cause of neurological disability in rural Ethiopia [WHO, 2001,
Tekle-Haimanot, et al., 1991].

3
1. 1. 3. Epidemiology: prevalence, incidence and mortality of epilepsy
Epilepsy knows no geographical, racial or social boundaries. It occurs in men and women and
can begin at any age, but is most frequently diagnosed in infancy, childhood, adolescence and
old age. Anyone can be affected by seizures. In fact, up to 5% of the world's population may
have a single seizure at some time in their lives, but a diagnosis of epilepsy is reserved for those
who have recurring seizures, at least two unprovoked ones [Annegers, et al.,1999].
The prevalence of a disorder is the proportion of a population with that disorder at a given point
in time. From many studies around the world it has been estimated that the mean prevalence of
active epilepsy (i.e. continuing seizures or the need for treatment) is approximately 8.2 per 1,000
of the general population. However, this may be an underestimate as some studies in developing
countries (such as Colombia, Ecuador, India, Liberia, Nigeria, Panama, United Republic of
Tanzania and Venezuela) suggest a prevalence of more than 10 per 1,000. Thus, it is likely that
around 50 million people in the world have epilepsy at any one time. The lifetime prevalence of
epilepsy (i.e. the number of people presently in the world who have epilepsy now or have had it
in the past or will experience it in the future) is approximately 100 million people [WHO. 2001,
Kwan, et al., 2000]. Epidemiological studies in Ethiopia are localized more to the central part of
the country and may underestimate the prevalence rate to 5.2 per 1000 [Shibru, et al., 2004].
The incidence of a disorder is the number of new cases at a given time. Studies in developed
countries suggest an annual incidence of epilepsy of approximately 50 per 100,000 of the general
population [Kotsopoulos, et al., 2002, Hauser, et al., 1993, Hauser, et al., 1996, Olafsson, et al.,
1996]. However, studies in developing countries suggest that this figure is nearly double that at
100 per 100,000. One of the main reasons for the higher incidence of epilepsy in developing
countries is the higher risk of experiencing a condition, which can lead to permanent brain
damage. These conditions include neurocysticercosis, meningitis, malaria, pre and perinatal
complications and malnutrition. A study by Tekle-Haymanot, et al. (1997) indicated that there
are high incident rates in the study areas of Ethiopia comparable to that in the rest of the World
[Tekle-Haimanot, et al., 1997].

4
Epilepsy is associated with an increased risk of mortality. Death may be related to: an underlying
brain disease, such as a tumour or infection; seizures in dangerous circumstances, leading to
drowning, burns or head injury; status epilepticus; sudden and unexplained causes, or a possible
respiratory or cardio-respiratory arrest during a seizure; suicide. Whilst studies on this subject are
rare, epilepsy-related deaths in young adults in the UK, for example, are 3 times higher than
standard age-related mortality rates [WHO. 2001].
1.1.4. Treatment of Epilepsy
Recent studies in both developed and developing countries have shown that upto 70% of newly
diagnosed children and adults with epilepsy can be successfully treated (i.e., their seizures can be
completely controlled for several years) with anti-epileptic drugs. Antiepileptic drugs are fully
effective in controlling seizures in 50-80% of patients. Patients with epilepsy usually need to
take drugs continuously for many years. There is a need for more specific and effective drugs,
and several new drugs have been recently introduced for clinical use. The main well established
antiepileptic drugs are phenobarbitone, phenytoin, carbamazepine, valproate, and ethosuximide.
The newer drugs, whose place in therapy is still being evaluated, include vigabatrin, gabapentin,
lamotrigine, felbamate, tiagabine and topiramate [Rang, et al., 2002, Patsalos, 1999]. Studies
regarding treatment of epilepsy in rural Ethiopia by Shibru, et al.(2004) revealed that
Phenobarbitone is the only available antiepileptic drug in the study areas and further reports
show that phenobarbitone, phenytoin and carbamazepine are mostly prescribed [Shibru, et al.,
2004, Shibru , et al., 2002].
Standard Treatment Guidelines of Ethiopia puts phenobarbitone 60-180 mg/day per oral in
divided doses as a first line antiepileptic drug and phenytoin 5mg/kg/day per oral in a single or
divided doses OR carbamazepine 600-1,800 mg/day per oral in 2 divided doses as alternative
medications [DACA Ethiopia, 2004].
1.1.5. Treatment failures with antiepileptic drugs
After 2-5 years of successful treatment, drugs can be withdrawn in about 70% of children and
60% of adults without relapses. However, up to 30% of people may not respond to drug therapy,
or inadequate control of their seizures. Reasons for their anomalous behaviour could not be

5
predicted. Studies show that patients who have many seizures before therapy or who have an
inadequate response to initial treatment with antiepileptic drugs are likely to develop refractory
epilepsy (resistance epilepsy), and why this happens is not known. Results from studies in rural
central Ethiopia by Tekle-Haimanot, et al. (1997) showed some treatment failures leading to
high mortality. Other critical problem with antiepileptic drugs is the development of tolerance
with the established drugs, thus efficacy and tolerability with the newly discovered antiepileptic
drugs is on evaluation and establishment [Tekle-Haimanot, et al., 1997, French, et al., 2004].
Further studies on the new drugs on patients indicated that there is an increase in seizures when a
new antiepileptic drug is added to their therapy, which may be the drugs effect [Ernest, et al.,
2002]. Thus the possible cause of this inadequate control of seizures and tolerance developments
to antiepileptic drugs may be viewed from the quality aspect of the drugs. Reports from
pharmaceutical care services show that there are bioavailability problems leading to therapeutic
failures. There has been reported a continued breakthrough of seizures associated with
subtherapeutic phenytoin concentrations, and non-compliances. Such drug therapy problems may
occur because the patient has become refractory to the present drug therapy; the patients is
receiving a drug that is effective but not the least costly that he/she could not afford to buy and
complete the dosage regimen; the patients serum drug concentration is below the desired
therapeutic range. The latter might be attributed to drug release problems, too low drug content
of the dosage form, and drug, dose or formulation conversions were inappropriate for the patients
[Robert, et al., 1998].
1.2. Pharmaceuticals Quality, Effectiveness and Trading
1.2.1. Therapeutic Effectiveness and Quality of Pharmaceuticals
For a drug to be effective, enough of it needs to reach its site(s) of action and stay there long
enough to be able to exert its pharmacological effects. Many factors have been found to
influence the rate and extent of absorption, and hence the time course of a drug in the plasma
and, therefore, at its site(s) of action. These include the foods eaten by the patient, the effect of
the disease state on drug absorption, the age of the patient, the sites of absorption of the
administered drug, the co administration of other drugs. In addition, the physical and chemical
properties of the drug, the type of dosage form, the composition and method of manufacture of

6
the dosage form, the size of the dose and frequency of administration are among the factors,
which are almost addressed in quality assessment studies [Ashford, 2002, FDA, 1997].
The presence of substandard pharmaceutical products in the drug distribution chain may produce
a danger to public health. Drug quality reports by the United States Pharmacopoeia Drug Quality
and Information Program in different countries e.g. Benin, Ghana, Nigeria, Bangladesh,
Cambodia, China revealed that a large number of drugs failed quality testing. Some of these
drugs were found to contain active ingredients outside the appropriate limits and most of them
below the limits. Such drug products have therapeutic as well as social and economic
implications [WHO, 1999, USPDQI, 2003].
The quality of drugs in less developed settings is inadequate. Reasons for the availability of poor
quality drugs could be the widespread counterfeiting of medicines, decomposition of the active
ingredient in drug dosage form due to high temperature and humidity of the storage condition,
and inadequate quality assurance systems during the manufacture of pharmaceutical products
[Robert, 2001, Risha, et al., 2003]. For instance, in the study of effects of humidity and
temperature on the in vitro quality of carbamazepine tablets revealed that high humidity and
temperature have a profound effect on tablet disintegration and dissolution which are affecting
the release pattern and which in turn affect bioavailability and effectiveness of the drugs.
Stability of the drugs also depends on packaging and storage [Wang, et al., 1993, al-Zein, et al.,
1999]. Counterfeiting can also influence drug quality because such drugs have bypassed
regulatory control for quality assurance, thus resulting in products with correct active ingredient
but too little or with wrong ingredient or with fake packaging [WHO, 1992, Albert, et al., 2004].
1.2.2. Pharmaceuticals Quality
Pharmaceuticals play an important role in improving human health and promoting well- being.
However, to produce the desired effect, they have to be safe, efficacious and of acceptable
quality, and have to be used rationally. The use of ineffective and poor quality drugs will
endanger therapeutic treatment and may lead to treatment failures. Thus, the production, storage,
and distribution of drugs in each country need to be regulated by the government drug regulatory
authority. Challenges to these drug regulatory authorities are the flourishing of many

7
pharmaceutical industries and distribution channels during the past few years in the world,
leading to an increased number of products circulating in national and international drug
markets. In the same manner, the presence of counterfeit and substandard drugs in those markets
has increased substantially as a result of ineffective regulation of the manufacturers and trading
of pharmaceutical products by both exporting and importing countries [WHO, 1999].
Marketing of poor quality drugs is high in developing countries, especially of Africa and Asia
because of weak drug regulatory systems [Reidberg, et al., 2001]. Thus, in countries like
Ethiopia, where drug regulatory control is weak, the quality of marketed drug products cannot be
guaranteed. Quality assessment studies on some of the marketed drug products could give an
insight into the quality of the pharmaceutical products marketed within the distribution chain and
consumed. Such studies could provide basis for corrective measures taken by drug regulatory
authorities.
1.3. Antiepileptic drugs: Carbamazepine and Phenobarbitone
The term antiepileptic is used synonymously with anticonvulsant to describe drugs that are used
to treat epilepsy. Studies have shown that particular types of epileptic seizures in humans
respond best to a particular antiepileptic drug. The mechanism of action of each antiepileptic
drug varies from drug to drug and thus their choice for therapeutic significance. The main drugs
in current use like carbamazepine and phenytoin act by blocking Calcium ion (Ca++
) channels
thus reducing electrical excitability of cell membranes; and phenobarbitone act by enhancing
Gamma Amino Butyric Acid (GABA) action thus reducing electrical activity of neurons within a
chemically induced epileptic focus [Rang, et al., 2002, Mervyn, et al., 1989]. It could be better,
therefore, to consider carbamazepine and phenobarbitone from these drugs.
1.3.1. Carbamazepine
Carbamazepine is a white or yellowish white crystalline powder with molecular weight of 236.3
daltons. It may exhibit polymorphism, which has considerable effect on the physical properties
and release pattern of the drug. Comparative study for photostability of carbamazepine
polymorphs indicated that the surface of pellets of all crystalline forms turned gradually from
white to yellow orange upon exposure to light, revealing unstability of the drugs polymorphs to
8
light. The drug has a melting point range between 189 and 193oC [Clarke, 1986, Matsuda, et al.,
1994].
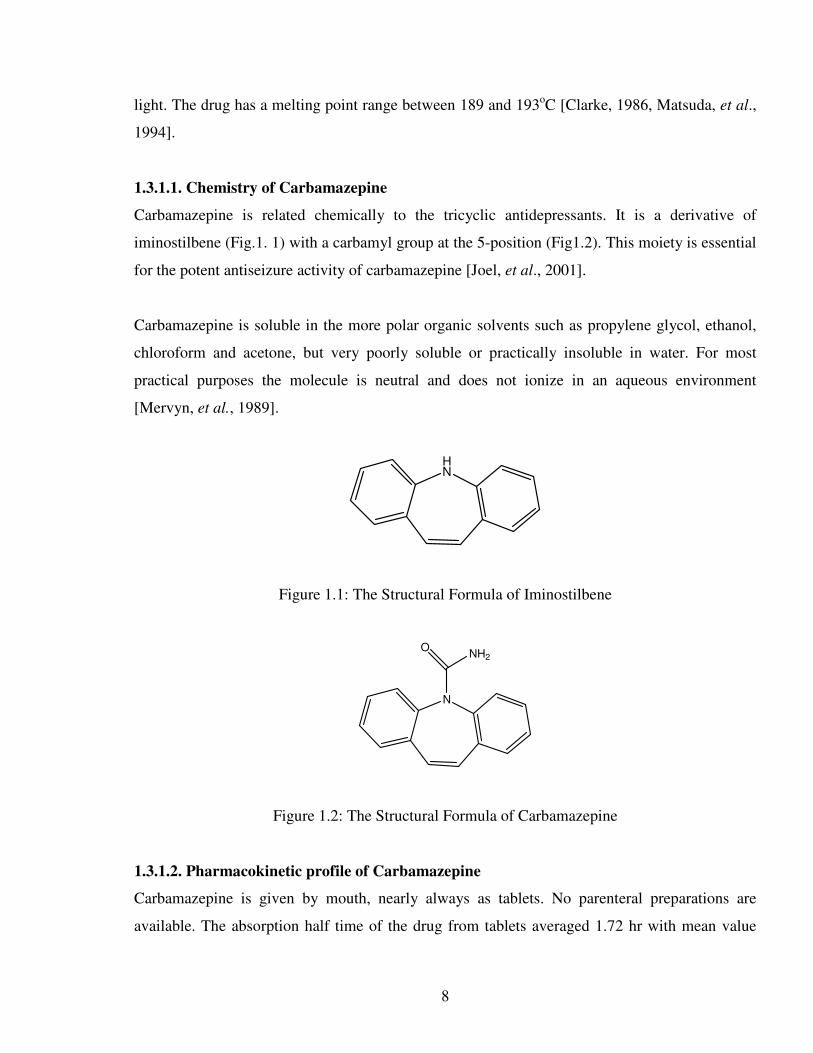
1.3.1.1. Chemistry of Carbamazepine
Carbamazepine is related chemically to the tricyclic antidepressants. It is a derivative of
iminostilbene (Fig.1. 1) with a carbamyl group at the 5-position (Fig1.2). This moiety is essential
for the potent antiseizure activity of carbamazepine [Joel, et al., 2001].
Carbamazepine is soluble in the more polar organic solvents such as propylene glycol, ethanol,
chloroform and acetone, but very poorly soluble or practically insoluble in water. For most
practical purposes the molecule is neutral and does not ionize in an aqueous environment
[Mervyn, et al., 1989].
HN
Figure 1.1: The Structural Formula of Iminostilbene
N
NH2O
Figure 1.2: The Structural Formula of Carbamazepine
1.3.1.2. Pharmacokinetic profile of Carbamazepine
Carbamazepine is given by mouth, nearly always as tablets. No parenteral preparations are
available. The absorption half time of the drug from tablets averaged 1.72 hr with mean value

9
range of 1.42±0.34 hrs. The mean Tmax increases as the dose of carbamazepine increases,
indicating dose dependent absorption half time. Carbamazepine particle size in tablet
preparations can influence the rate of absorption of the drug. Dam, et al (1981) noted that there
are differences in steady state plasma drug levels produced by different brands of carbamazepine
tablets [Mervyn, et al., 1989, Dam, et al., 1981]. Research results indicate that carbamazepine
has an oral bioavailability of 58-85%. Bioavailability studies with different brands and generic
formulations of carbamazepine tablets revealed that there are significant differences in the rate
and extent of absorption and bioinequivalencies with each other. These differences were critical
for carbamazepine tablets with a history of clinical failures when their bioavailability profiles
were compared with the innovator product [Morselli, et al., 1975, Oluka, et al., 1996, Meyer, et
al., 1992, Saavedra, et al.,1990, Revankar, et al.,1999, Meyer, et al., 1998].
1.3.2. Phenobarbitone
Phenobarbitone is a white or colorless crystalline powder with molecular weight of 232.23
daltons. It has somewhat bitter taste and may exhibit polymorphism. Studies on the effect of
polymorphism of drugs on the physical properties and drug release of Phenobarbital tablets
indicated that the physical properties of the tablets were different according to the modification
of the tablets. Phenobarbitone has a melting point range of 174-178oC [Mervyn, et al., 1989,
Clarke, 1986, Szabo-Revesz, et al., 1987].
1.3.2.1. Chemistry of phenobarbitone
Phenobarbitone is a barbituric acid derivative, 5-phenyl-5-ethylbarbituric acid (Fig1. 3). The
Structural Activity Relationship (SAR) of barbiturates indicates that maximal antiseizure activity
is attained by phenyl group at position 5 [Joel, et al., 2001].
HN NH
CH3
O
OO5
Figure 1.3: The structural formula for phenobarbitone

10
Phenobarbitone is poorly soluble in water but dissolves in organic solvents such as ethanol,
diethylether and chloroform. It has a pka value of 7.2. It is sometimes administered as its sodium
salt, which is more water soluble than the parent substance [Mervyn, et al., 1989].
1. 3. 2. 2. Pharmacokinetic profile of phenobarbitone
Orally administered phenobarbitone is fully bioavailable. The maximum plasma phenobarbitone
level is attained 6-12 hrs after an oral dose of the drug. Pharmacokinetic studies in healthy
volunteers showed that phenobarbitone administered as a tablet has almost complete
bioavailability. The absorption rate of the drug usually depends on formulation. Absorption from
suspension dosage form is faster than that from the tablet which is comfirmed from higher
concentration maximum (Cmax) and Area under the Curve (AUC) for the former [Mervyn, et al.,
1989, Shah, et al., 1994]. Drug product equivalence and clinical significance of plasma levels of
phenobarbitone revealed that there were increased plasma levels following the change between
the tablets which were matched by a decrease in the number of seizures. Minor changes between
any two different tablet formulations could influence drug absorption and thus drug
bioavailability [Stewart, et al., 1975, Lazowski, et al., 1978, Meyer, et al., 1984].
1.3.3. Therapeutic Drug Monitoring (TDM) of carbamazepine and phenobarbitone
The application of pharmacokinetic principles in conjuction with monitoring of plasma drug
concentrations has led to major advances in the treatment of epilepsy with antiepileptic drugs
like carbamazepine and phenobarbitone. Since antiepileptic drugs have a narrow therapeutic
index and complex pharmacokinetic properties, wide fluctuations in their plasma concentration
can lead to either toxic effects or loss of therapeutic efficacy [Gogtay, et al., 1999].
Carbamazepine and phenobarbitone are currently considered to be drugs of choices for different
types of epileptic seizures. Large interindividual differences in apparent plasma half-life linked
to a narrow therapeutic range make these drugs suitable candidates for Therapeutic Drug
Monitoring (TDM). Therapeutic drug monitoring helps the physicians in optimizing the dose for
a better seizure control in epileptic patients. TDM involves quantification of serum drug
concentration. Anticonvulsants are currently quantified in serum by different techniques of
physicochemical methods including gas chromatography (GC), liquid chromatography (LC), thin

11
layer chromatorgraphy (TLC), high performance thin layer chromatography (HPTLC), etc [Garg,
et al., 2000, USCDC, 1985].
1.4. Quality Control Parameters and Properties of Tablet dosage forms
The need for precisely defined and acceptable specifications for production control during
manufacturing processes and for the final products, in order to assure reproducibility in the wide
context of drug safety, is recognized. This is required not only by the pharmaceutical industry
but also by national drug regulatory bodies and international organizations actively concerned
with the quality control of medicines moving in the international commerce. The assurance of
quality of medicines is the primary responsibility of the manufacturers (internal quality control).
However, it is recognized in most countries that the national health authorities must exercise
comprehensive surveillance by legislative methods over pharmaceutical manufacturers within
their jurisdiction, in order to ensure observance of good manufacturing practices and quality
control of products. During research, development and formulation, physicochemical analysis
and analytical profiles of drug substances provide good quality control data on which good
decisions can be established [Deasy, et al., 1976, Ayers, et al., 1977].
Assessment of quality, safety and efficacy constitutes an important component of pharmaceutical
product evaluation, which is based on quality control tests. The minimum quality control tests for
pharmaceutical preparations are illustrated in Table1.1 [Ayers, et al., 1981, Berita Ubat-ubatan,
1999].
Tablets have some apparent features, like certain amount of hardness and resistance to friability
to withstand mechanical shocks encountered during their production, packaging and handling
prior to use. In addition to these apparent features, they must meet other physical specifications
and quantity standards. These include criteria for tablet dosage form uniformity (weight
variation, content uniformity), disintegration, and drug dissolution [Howard, et al., 1999,
Lachman, et al., 1990]. Each property will influence the other as hardness has influence on both
friability and drug dissolution. All are tablet properties that can be utilized as parameters for drug
quality control [Souto, et al., 1989].

12
Table 1.1 Minimum Quality Control Tests for Pharmaceutical Preparations
Types of pharmaceutical preparations
Types of tests
1. Tablet, Capsule, Lozenges Identification of active ingredient (s),
Uniformity of weight, Friability, Hardness,
Disintegration, Dissolution, Assay of active
ingredient (s).
2. Injectable
(Liquid)
Identification of active ingredient(s), pH,
Extractable volume, Particle Count,
Pyrogen / LAL, Sterility, Effectiveness of
microbial preservatives, Assay of active
ingredient (s)
3.Cream, Ointment Identification of active ingredient (s),
Viscosity, Homogeneity, pH, Release rate,
Sterility, Microbial limit test, Effectiveness
of preservatives (if present)
4. Aerosol, Inhalation, Spray Identification of active ingredient (s), Net
contents, Particle size and tests for foreign
particles, Delivery rate, Leak testing,
Pressure testing, Limit test for degradation
products/ impurities (where applicable),
Moisture determination, Assay of active
ingredient (s)
1.4.1. Hardness and Friability
Tablets require certain degree of strength and resistance to friability to withstand mechanical
shocks of handling during manufacturing, packaging, shipping and utilization by the patient.
Adequate tablet hardness and friability are necessary requisites for customer acceptance [Getie,
et al., 1998] and have adequate impact on drug product quality. There are factors, which may
alter tablet hardness and friability. These are changes in particle size, distribution of the
granulation mix and lubricants, etc. Large particles of low density will produce softer tablets
whereas smaller particles of high density granules will produce relatively stronger tablets

13
[Lachman, et al., 1990, James, 1996]. Studies with Phenobarbital tablets quality control showed
that duration of mixing with lubricant, maximal compression force and compression rate have
influence on various properties of the tablets. These variables of tablet manufacturing process are
found to have a marked influence on hardness, friability, disintegration, and dissolution
properties [Souto, et al., 1989, Shah, et al., 1977].
1.4.2. Uniformity of dosage units: content uniformity and weight variation
This term includes both the mass of the dosage form and the content of the active substance in
the dosage form. These are expressed in terms of content uniformity or weight variation; which
are among the parameters of tablet quality control [ICH, 1999, Irem, et al., 2000]. Weight
variation requirements may be applied where the product to be tested contains 50 mg or more of
an active ingredient comprising 50% or more, by weight, of the dosage form unit, and otherwise
content uniformity. The United States Pharmacopoeia (USP) contains a test for the determination
of dosage form uniformity for uncoated tablets. Ten tablets are weighed individually and the
average weight calculated. The tablets are assayed and the content of active ingredient in each of
the ten tablets is calculated assuming homogeneous drug distribution. USP also provides that for
content uniformity ten dosage units are individually assayed for their content according to the
assay method described in the individual monograph. Unless otherwise specified in the
monograph, the requirements for content uniformity are met if the amount of active ingredient in
each dosage unit lies within the range of 85% to 115% of the label claim and relative standard
deviation (RSD) is less than 6.0 % [USP, 2003, Kovacs, et al., 1980].
1.4.3. Disintegration
For the active medicinal agent in a tablet to become fully available for absorption, the tablet must
first disintegrate and discharge the drug to the body fluids for dissolution. Tablet disintegration
also provides drug particles with an increased surface area for localized activity within the
gastrointestinal tract [Howard, et al., 1999]. Before a tablet goes into solution it must breakdown
into smaller particles or granules by the process of disintegration. Complete tablet disintegration
is the state in which any residue of the tablet is a soft mass having no palpably firm core.
Disintegration testing is more appropriate when a relationship to dissolution has been established
and it is a limiting factor of drug dissolution, particularly with low aqueous solubility drugs like

14
carbamazepine. For tablets to be disintegrated, it is necessary to overcome the cohesive forces
introduced into the mass by compression and by any binder present, which is usually practiced
by incorporating disintegrants. Disintegration could be affected by formulation factors and
properties and concentration of excipients, in particular. Studies done on paracetamol and
oxytetracycline tablets revealed that variations with various formulation and processing variables
and excipients led to variations in physical properties like disintegration [Lachman, et al., 1990,
Esezobo, et al., 1977, Esezobo, 1985]. Porousity, hydrophilicity, swelling ability of particles and
interparticle forces are important factors for tablet disintegration. Tablet porousity is related to
water absorption, which is an important step of disintegration process. There are factors related
to the inner structure of the tablets and hydrophilicity of excipients affecting wettability of the
formulation and playing a vital role in the process of disintegration [Yunxi, et al., 1996, Fell, et
al., 1978, Lopez-Solis, et al., 2001, Bi, et al., 1999].
1.4.4. Assay for the active ingredients
Assay is a critical step in analytical sciences. It is the determination of the strength or content of
the active ingredient within the dosage form. The quantitative determination of a drug dosage
form is preferentially performed by physicochemical methods. Such analytical techniques are
very diverse and successfully applied to the assay of the active medicinal agent in the
pharmaceutical tablets. The technique should provide specificity, accuracy, precision and
sensitivity to the particular ingredient of interest within the dosage form [USCDC, 1985, Sang, et
al., 2003, John, 2002].
1.4.5. Dissolution and Dissolution tests
1.4.5.1. Dissolution process and rate
Dissolution is defined as the process by which a solid substance enters into the solvent to yield
solution, i.e., the process by which a solid substance dissolves [Banakar, 1992]. The process
involved in the dissolution of solid dosage form could be described as in Figure 1.4. The scheme
illustrates that the tablets must break down into smaller particles through disintegration and
render greater surface area to the dissolving media to bring the tablets into solution. Thus, this
solution will be absorbed into the blood stream that dissolution must be related to the availability
of the drug to the body [Alton, 2002]. The amount of drug substance that goes into solution per

15
Figure 1.4: Schematic Illustration of Dissolution of solid dosage forms
unit time under standardized conditions is called dissolution rate. This depends on several factors
like ageing, excipient type (surfactants, disintegrants, etc.), tablet integrity, other drugs, etc.
Some excipients like sorbitol and sodium lauryl sulfate increase dissolution rate. A study with
paracetamol tablet showed that mode of excipient incorporation also influences the rate. External
addition of aerosil led to increased dissolution rate while internal addition resulted in decreased
dissolution rate of the tablet. Naggar, et al. (1980) studied the effect of some drugs on the
dissolution rate of nitrofurantoin. The study showed that drugs like nicotinamide and sodium
salicylate have increased the dissolution rate of the drug. Aminophenazone, paracetamol, and
aminophylline possessed a retardation effect on the rate of dissolution of the drug [Esezobo,
1985, Chowhan, 1980, Gordon, et al., 1993, Mandal, 1996, Naggar, et al., 1980].
1.4.5.2. Factors affecting tablet dissolution
There are various intrinsic characteristics of the drug affecting dissolution. These could be
primarily solubility and permeability of the drug substance in the dissolution medium. High
solubility and high permeability of drugs are necessary for the appropriate and rapid in vitro
16
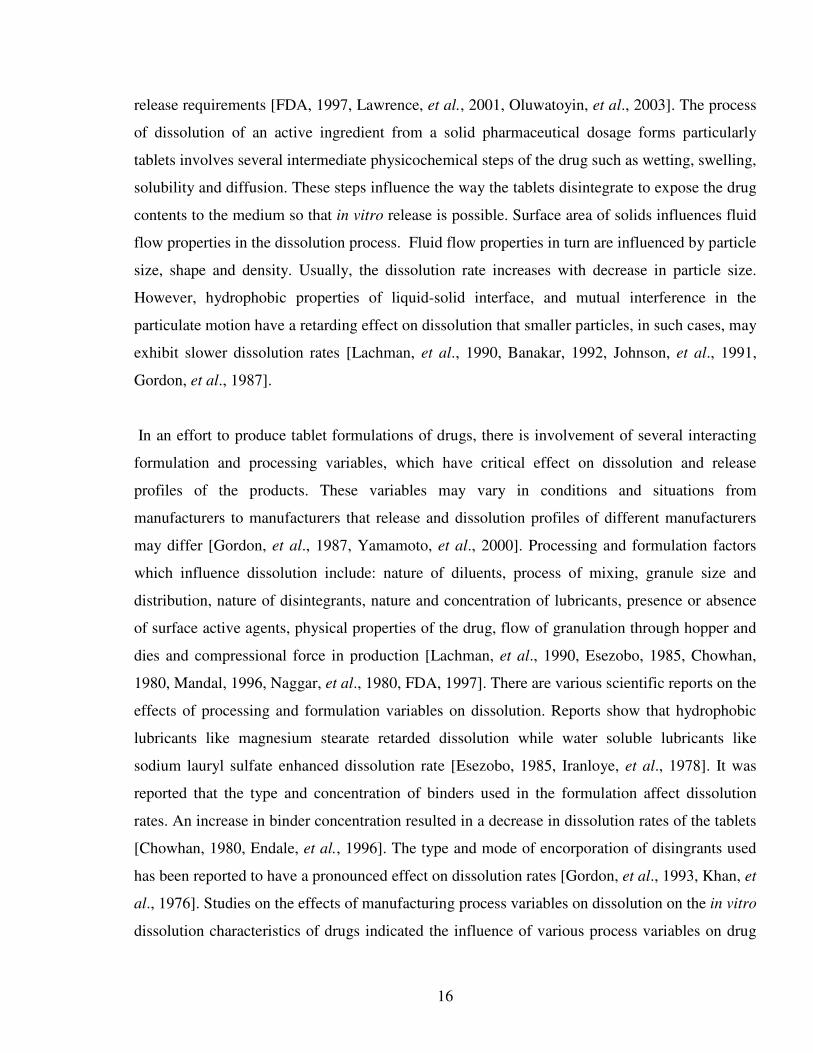
release requirements [FDA, 1997, Lawrence, et al., 2001, Oluwatoyin, et al., 2003]. The process
of dissolution of an active ingredient from a solid pharmaceutical dosage forms particularly
tablets involves several intermediate physicochemical steps of the drug such as wetting, swelling,
solubility and diffusion. These steps influence the way the tablets disintegrate to expose the drug
contents to the medium so that in vitro release is possible. Surface area of solids influences fluid
flow properties in the dissolution process. Fluid flow properties in turn are influenced by particle
size, shape and density. Usually, the dissolution rate increases with decrease in particle size.
However, hydrophobic properties of liquid-solid interface, and mutual interference in the
particulate motion have a retarding effect on dissolution that smaller particles, in such cases, may
exhibit slower dissolution rates [Lachman, et al., 1990, Banakar, 1992, Johnson, et al., 1991,
Gordon, et al., 1987].
In an effort to produce tablet formulations of drugs, there is involvement of several interacting
formulation and processing variables, which have critical effect on dissolution and release
profiles of the products. These variables may vary in conditions and situations from
manufacturers to manufacturers that release and dissolution profiles of different manufacturers
may differ [Gordon, et al., 1987, Yamamoto, et al., 2000]. Processing and formulation factors
which influence dissolution include: nature of diluents, process of mixing, granule size and
distribution, nature of disintegrants, nature and concentration of lubricants, presence or absence
of surface active agents, physical properties of the drug, flow of granulation through hopper and
dies and compressional force in production [Lachman, et al., 1990, Esezobo, 1985, Chowhan,
1980, Mandal, 1996, Naggar, et al., 1980, FDA, 1997]. There are various scientific reports on the
effects of processing and formulation variables on dissolution. Reports show that hydrophobic
lubricants like magnesium stearate retarded dissolution while water soluble lubricants like
sodium lauryl sulfate enhanced dissolution rate [Esezobo, 1985, Iranloye, et al., 1978]. It was
reported that the type and concentration of binders used in the formulation affect dissolution
rates. An increase in binder concentration resulted in a decrease in dissolution rates of the tablets
[Chowhan, 1980, Endale, et al., 1996]. The type and mode of encorporation of disingrants used
has been reported to have a pronounced effect on dissolution rates [Gordon, et al., 1993, Khan, et
al., 1976]. Studies on the effects of manufacturing process variables on dissolution on the in vitro
dissolution characteristics of drugs indicated the influence of various process variables on drug

17
release from the tablets. The results indicated that a change in the manufacturing process could
yield significantly dissimilar dissolution profiles for the same formulation [Huang, et al., 2003].
1.4.5.3. Dissolution Test as Quality Control Parameters
Drug absorption from a solid dosage form after oral administration depends on the release of the
drug substance from the drug product, the dissolution or solubilization of the drug under
physiological conditions, and the permeability across the gastrointestinal tract. Thus in vitro
dissolution may be relevant to the prediction of in vivo performance. In vitro dissolution tests for
immediate release dosage forms, such as tablets, are used to assess lot to lot quality of drug
product and ensure continuing drug product quality and performance after certain changes such
as changes in formulation, the manufacturing process and the site of manufacture [FDA, 1997].
Dissolution tests are valuable tools in ensuring the quality of a drug product. Generally, product
to product variations are due to formulation factors such as particle size differences, excessive
amounts of lubricants and coatings. These factors are reactive to dissolution testing [Huang, et
al., 2003].
Dissolution testing is performed as a quality control test to check whether they comply with
pharmacopieal specifications or not. Pharmacopieal in vitro dissolution specifications are
established to ensure product to product and batch to batch consistency of pharmaceutical
products and to signal potential problems with in vivo bioavailability [USP, 2004].
In general, in vitro dissolution rate measurements have been used in a variety of ways including:
� To study the effects of physicochemical variables of the pure drug on dissolution rates.
� To study variables such as manufacturing processes, tablet coating, excipients, on
dissolution characteristics of the dosage form.
� To screen potential dosage form candidates for in vivo bioavailability studies.
� As a retrospective study to explain clinical failures of a particular dosage form.
� As a sensitive quality control procedure to detect changes in the release characteristics
due to lot-to-lot variations, formulation changes, or storage conditions, which may or
may not be detected in less sensitive in vivo absorption.

18
� To provide an indication of differences in in-vivo absorption characteristics of the drug
and serve as a secondary standard to detect dosage forms with a potential for poor
bioavailability [Jollow, et al., 1972].
1.4.5.3.1. Dissolution characteristics of Carbamazepine
Dissolution tests are measures of the amount of drug released into the dissolution medium with
time. For routine quality control tests single point (release of the drug at the pharmacopieally
specified time) could be used, especially for highly soluble and rapidly dissolving drugs. Two
point specifications could be used for characterization of the quality of drug products and as a
routine quality control test for certain types of drugs such as carbamazepine. For carbamazepine,
USP specifies the drug release at two points: 15 minutes (drug release between 45%- 75%) and
60 minutes (drug release greater than 75%). For accepting product similarity and to waive
bioequivalence requirements especially for lower strengths of a dosage form, usually dissolution
profile comparisons are performed. Dissolution profiles involve measurements of the amount of
drug release at different points in increasing time order [USP, 2004, FDA, 1997, Michael, et al.,
2003].
Reports indicated that carbamazepine tablets with lower dissolution profiles when given to
epileptic patients were associated with the breakthrough of seizures and higher incidence of
neurological side effects. This could reveal that those drugs with better dissolution profiles have
better bioavailability than those with lower dissolution profiles. Poor control of epileptic seizures
with those carbamazepine tablets with smaller dissolution profile was also reported [Oluka, et
al., 1996, Meyer, et al., 1992, Hartely, et al., 1991]. A lot of products after postmarketing drug
surveillance could fail pharmacopieal dissolution test specification and may get very different
dissolution profiles with each other indicating bioavailability differences when bioavailability
tests are performed on such products [Oluka, et al., 1996, Meyer, et al., 1992, Stewart, et al.,
1975, Soryal, et al., 1992].
1.4.5.4. Dissolution, Bioavailability and Bioequivalence
Drug release properties, which can be characterized by dissolution, have influence on the
systemic exposure of drug products, i.e. absorption is governed by the amount of drug substances

19
in solution (solubility). Thus, the rate-limiting step in absorption could be the rate at which the
solid drug enters the bulk solution [Lawrence, et al., 2001, Jollow, et al., 1972]. Dissolution
influences the amount of the drug substance that goes to solution before it is absorbed and thus
governs the blood levels of the drug. Therefore, it can function as the in vitro controlling factor
in determining the magnitude of pharmacological response elicited, i.e., the clinical effectiveness
which can be addressed by bioavailability. Bioavailability is a pharmacokinetic term that
describes the rate and extent to which the active drug ingredient is absorbed from a drug product
and becomes available at the site of drug action. Since pharmacological response is generally
related to the concentration of a drug from a dosage form at the receptor site, the bioavailability
of the drug is a critical element of a drug product’s clinical efficacy. Before rendering this
therapeutic effect, the drug must be absorbed, and before absorption, the drug must be dissolved
to solution (dissolution) [Banakar, 1999].
Literatures showed that there might be variations in clinical response among orally administered
drug products that contain chemically equivalent amounts of a drug due to differences in their
dissolution rates. This is a useful indication of the influence of dissolution rate on absorption and
bioavailability of drugs for clinical use [Banakar, 1992].
The physical and chemical characteristics of a drug together with formulation factors are
affecting bioavailability because they can affect dissolution and the absorption characteristics of
the drug. There may be effects of dosage form type, particle size, diluents and process on the
bioavailability of the drug products [Mendes, et al., 1978]. Neuvonen, et al. (1977) indicated that
particle size and several other formulation factors are important for dissolution rate and
absorption characteristics of phenytoin products and confirmed that the properly performed
measurement of the in vitro dissolution rate can be used as a preliminary screening test in
predicting the bioavailability of pharmaceutical drug products [Chakrabarti, et al., 1980,
Neuvonen, et al., 1977]. Usually pharmaceutical products of the same dosage form and strength
but with different bioavailability data could be marketed for therapeutic purposes. For instance, a
study by Stewart and co-workers (1975) indicated that there was significant increase in plasma
phenytoin levels following change of tablets from generic to a brand product [Stewart, et al.,
1975]. In order for a drug product to be interchangeable with the pioneer (innovator or brand

20
name) product, it must be both pharmaceutically equivalent and bioequivalent to it. According
to FDA, ‘’Pharmaceutical equivalents’’ are drug products that contain identical active
ingredients and are identical in strength or concentration, dosage form and route of drug
administration. However, pharmaceutical equivalents do not necessarily contain the same
inactive ingredients; various manufacturers’ dosage forms may differ in colour, flavour, shape,
and excipients. The terms ‘’Pharmaceutical equivalents’’ and ‘’Chemical equivalents’’ are often
used interchangeably [Banakar, 1999].
‘’Bioequivalence’’ is a comparison of the bioavailability of two or more drug products. Thus,
two products or formulations containing the same active ingredient are bioequivalent if their
rates and extents of absorption are the same. For a drug product to be considered bioequivalent to
a pioneer product there must be no statistical differences (as specified in the accepted criteria)
between their plasma concentration-time profiles, with some degree of acceptable tolerance
limits. Since in vitro dissolution test is designed to accurately reflect the dissolution process in
the gastrointestinal tract, dissolution profiles could be utilized to predict the plasma
concentration-time profile and thus reflect a drug’s bioavailability [Welling, 1991, FDA, 1994].
In general, the FDA considers two products to be ‘’Therapeutic equivalents’’ if they each meet
the following criteria:
� They are pharmaceutical equivalents,
� They are bioequivalent (demonstrated by a bioavailability measurement or an in
vitro dissolution),
� They are in compliance with compendial standards for strength, quality, and
identity,
� They are adequately labeled, and
� They have been manufactured in compliance with Good Manufacturing Practices
(GMP) [Banakar, 1999].
Dissolution testing, therefore, has not only been recognized as a valuable quality control test but
also proved itself as a useful indicator of differences in bioavailability. This is because of the fact
that drug absorption after oral administration depends on the release of the drug substance from

21
the drug product, the dissolution or solubilization of the drug under physiological conditions and
the permeability across the gastrointestinal tract. The dissolution rate of per-oral solid dosage
forms is the rate-limiting step in the absorption process [Endale, et al., 1996]. Whenever a
significant difference in bioavailability has been found among expectedly identical products, the
dissolution test most of the time has been able to discriminate among these products. In fact,
dissolution is so sensitive to formulation factors that bioequivalent formulations show
differences in their dissolution profiles [Amidon, et al., 1995, FDA, 2000].
1.5. Bioavailability assessment and in vitro/ in vivo correlations
Pharmaceutical scientists have for many years been attempting to establish a correlation between
some physicochemical properties of a dosage form and the biological availability of the drug
from that dosage form. The term commonly used to describe such relationship is in vitro/in vivo
correlation (see section 1.5.2). If such correlation could be established, it would be possible to
use in vitro data to predict a drug’s in vivo bioavailability. This would drastically reduce, or in
some cases, completely eliminate the need for bioavailability tests. The desirability for this
becomes clear when one considers the cost and time involved in administering drugs to healthy
subjects or patients. It would certainly be preferable to be able to substitute quick, inexpensive in
vitro tests for in vivo bioavailability studies [Banakar, 1999].
1.5.1. In vitro methods of assessing bioavailability
Evidences provided us with formulation variables that can greatly affect the bioavailability and
thus the clinical efficacy of many important therapeutic agents [Chakrabarti, et al., 1980,
Neuvonen, et al., 1977]. Various in vivo and in vitro physical methods have been developed to
assess these effects. The release of a drug from the dosage form into solution in the
gastrointestinal fluids is often the rate-limiting step in determining the rate and extent of
absorption and thus in vitro measurements on disintegration and dissolution provide a rapid,
sensitive and reproducible means to study and assess the bioavailability without involvement of
human experimentation [Jollow, et al., 1972].

22
1.5.1.1. Disintegration test method of assessing bioavailability
The early attempts to establish an indicator of drug bioavailability focused on disintegration as
the most pertinent in vitro parameter. It is true that a solid dosage form must disintegrate before
significant dissolution and absorption can occur, meeting the disintegration test requirements.
However, this only ensures that the tablet dosage form will break up into sufficiently small
particles in a specified length of time. It does not ensure that the rate of dissolution of the drug is
adequate to produce suitable blood levels of the active ingredient. Therefore, while the test for
tablet disintegration is very useful for quality control purposes in manufacturing, it is a poor
index of bioavailability [Rasma, 1999]. Such testing is intended to demonstrate the effective
breakup of the solid formulation (tablet) [performance of disintegration after administration].
The test procedure should be described in the pharmacopoeia and requirements and
disintegration test specifications for maximum disintegration time should also be included in the
general monographs of the pharmacopoeia [EMEA, 1999, TGA, 1989].
1.5.1.2. Dissolution test for assessing bioavailability
Dissolution test is currently considered to be the sensitive and reliable in vitro parameter most
likely to correlate with bioavailability. Since dissolution of a dosage form in vivo is often a rate-
limiting factor determining the physiologic availability of a drug, measurement of the in vitro
dissolution rate is more likely to offer a meaningful indication of physiologic availability.
Dissolution testing is implemented in the assessment and evaluation of the release rates and
bioavailability of a variety of conventional tablets. It is believed that if a tablet does not dissolve
properly in in-vitro test, it certainly will not do so in in-vivo tests for dissolution [Banakar, 1992].
This could be evidenced by a study by Brandau and Wehnert in their studies on dissolution and
availability of phenytoin preparations. The study indicated that there was a correlation between
the in vitro dissolution and the bioavailability of the preparations. The research showed that the
results of the in vitro test gave good information about bioavailability [Brandau, et al., 1979].
1.5.1.2.1. Official dissolution methods
Dissolution tests provide an indication for differences in in-vivo absorption characteristics of the
drug and serve as a secondary standard to detect dosage forms with a potential for poor
bioavailability. It involves official methods. There are two official USP dissolution methods:

23
Apparatus-1 (Basket method) and Apparatus-2 (Paddle method) (Figure 1.5 and 1.6).
Carbamazepine and Phenobarbital tablets dissolution study is carried out using Dissolution
apparatus II. Another official method is USP apparatus-3, which has been evaluated to produce
similar dissolution profiles to USP apparatus-2 [USP, 2004, Lawrence, et al., 2002].
Figure 1.5: Schematic representation of dissolution Apparatus I (Basket method)
Figure 1.6: Schematic representation of dissolution Apparatus II (Paddle method)

24
1.5.1.2.2. Limitations of dissolution testing
Limitation with dissolution testing could be problems, which make in vitro dissolution
correlation with in vivo bioavailability difficult. These could be related firstly to instrument
variance and the absence of a standard method. There are tests described in the USP, but a few of
the large number of dissolution methods are proposed to predict bioavailability. Since dissolution
rate of a dosage form is dependent on the methodology used in the dissolution test, changes in
the apparatus, dissolution medium, etc can dramatically modify the results. Another significant
problem is related to the difference between the in vitro and in vivo environment in which
dissolution occurs. In vitro studies are generally carried out under controlled conditions in one,
or perhaps two, standardized solvents. The in vivo environment, the gastrointestinal tract, on the
other hand, is a continuously changing complex environment. There are many variables, which
can affect the dissolution rate of a drug in the gastrointestinal tract, including pH, enzyme
secretions, surface tension, motility, presence of other substances and absorption surfaces. Thus,
drugs frequently dissolve in the body at rates quite different from those observed in an in vitro
test situation. Most of the official dissolution tests tend to be acceleration dissolution tests, which
bear limited or no relationship with in vitro dissolution [Banakar, 1999].
1.5.2. In vitro-in vivo correlations
When dissolution tests are utilized to assess possible differences in bioavailability of
pharmaceutical products, the main requirement is a high degree of correlation between in vitro
and in vivo methods and the selectivity of the method to reject poor products but not acceptable
ones. It will be much more difficult to find general methods that will be applicable to all products
as a compendial standard to assure comparable performance of many different brands of drugs
than a method that can be used by a particular manufacturer for his product alone [Banakar,
1992].
There are, thus two important characteristics of a given drug dissolution method: the sensitivity
of the method to detect differences and the correlation of observed differences to those in in-vivo
bioavailability. The sensitivity and extent of correlation between in vitro dissolution methods and
in vivo absorption parameters will depend on the complex inter-relationship between the

25
numerous variables of the drug and the dosage form, the apparatus and experimental conditions
of the in vitro method and the mechanism of absorption in the species tested [Banakar, 1999]..
Various literature reviews indicated that there are good in vitro/in vivo correlations with drugs
like nitrofurantoin, chlorothiazide, methenamine, and carbamazepine tablets with the
pharmacokinetic data taken for all the products in healthy volunteers [Karasulu, et al., 1996,
Yau, et al., 1981, Gladigau, et al., 1978, Lake, et al., 1999].
This work is initiated to investigate the Comparative Quality Assessment Studies which depends
on Identification and Evaluation of Physical Properties and In vitro Dissolution Profiles of
Different Products of the Commonly Prescribed Antiepileptic Drugs: Carbamazepine and
Phenobarbital tablets in Various Drug Retail Outlets in Addis Ababa.
1.5. Objectives
1.5.1. General Objectives
To assess the quality of imported and locally manufactured antiepileptic drugs by confirming
whether they comply with the Pharmacopoeial specifications or not and determine the level of
substandard products within the distribution chain.
1.5.2. Specific Objectives
The specific objectives of the study are:
� To identify the active pharmaceutical ingredient of different formulations of the
commonly prescribed antiepileptic drugs: Carbamazepine and Phenobarbital tablets.
� To evaluate the physical properties [hardness, friability, uniformity of dosage form
(weight variation or content uniformity)] of the different tablets.
� To evaluate and compare disintegration time of the tablet formulations.

26
� To assay and quantity of Active Pharmaceutical Ingredient (API) in different products the
tablets.
� To study the dissolution profiles of the tablets of different manufacturers.

27
2.1. Materials and Methods
2.1.1. Materials
2.1.1.1. Tablets and reference standards
The following tablets of Carbamazepine and Phenobarbitone were purchased from drug retail
outlets in Addis Ababa [Table 2.1 and Table 2.2].
Table 2.1 Carbamazepine 200mg tablets
Brand Manufacturer Batch
No
Mfg.
date
Exp.
date
Country Local
agent
Tegretol200mg Novartis pharma
AG
105 10/2002 10/2007 Switzerland Ageca
Tegral200mg Chemical Industries
Development
T2094
07/2003 07/2007 Egypt Ramada
Trading
Taver200mg Medochemie Ltd,
Limassol
A8C014 03/2004 03/2009 Cyprus Pharmid
Table 2.2 Phenobarbitone 100mg tablets
Generic name Manufacturer Batch No Mfg.
date
Exp. date Country Local
agent
Phenobarbitone
BP 100 mg
Epharm 406285-2 06/2004 06/2007 Ethiopia Pharmid
Phenobarbitone
BP 100 mg
Cadila
Pharmaceuticals
E2005 11/2002 10/2006 India Pharmid
Phenobarbitone
BP 100 mg
East Africa
Pharmaceuticals
PVT. Ltd. Co.
20/091 01/2002 01/2005 Ethiopia Pharmid
The USP reference standard of phenobarbital and working standard of carbamazepine were
kindly donated by Ethiopian Pharmaceutical Manufacturing Company (Epharm) and Ethiopian
Drug Administration and Control Authority (DACA), Department of Drug Quality Control and
Toxicology, respectively.

28
2.1.1.2 Solvents / chemicals/ reagents
Acetone (TECHNO PHARMACHEM®
, 231295,India) Ammonia (Reidel-de Haen AG, 05002,
Germany), Ethanol (Alpha CHEMIKA®
, Product No 04856, India), Cobalt (II) chloride
(PROLABO®
Products, No 22.896, France), Nitric acid (ANALYTICALS CARLO ERBA,
Code 408071, Italy), Sulfuric acid (ANALYTICALS CARLO ERBA, Code 410306, Italy),
Sodium Nitrate (MERCK 7464527, Germany), Methanol (SIGMA-ALDRICH LABO
CHEMIKALIEN GmbH, Germany), Sodium lauryl sulphate (Riedel-deHaen®
, 62862 SIGMA-
ALDRICH LABO CHEMIKALIEN GmbH, Germany), Boric acid [LOBA CHEMIE PVT Co.,
Batch No 59264, India], Sodium carbonate(anhydrous) (TECHNO PHARMACHEM,
231265,India), Silver nitrate (BDH, General Purpose reagent, Product 30087, England),
Potassium chloride [BDH AnalaR®
, England], Sodium hydroxide (LOBA CHEMIE PVT Co.,
Batch No 59265, India) , Sodium Chloride (AVONDALE LABORATORIES, 930102, England)
2.2.1.3. Instruments
Melting Point Apparatus (STAURT SCIENTIFIC Melting Point Apparatus SMP3, United
Kingdom), Hardness Tester (CALEVA®
THT-2, British), Friability Tester (ERWEKA®
TAR 20,
Germany), Disintegration Tester (CALEVA®
DISTIL 1.14, British), Analytical Balance
(AB204-S®
and WAGTECH®
AAA250L, England; Sartorius CP224S, Germany), UV
Spectrophotometer (CECIL®
CE 1021 Spectrophotometer, England and SPECTRONIC®
GENESYSTM
5 Spectrophotometer, New York), Automatic Potentiometeric Titrator
(METRHOM®
799 GPT Titrino, Switzerland), Dissolution Apparatus (CALEVA®
10ST
Dissolution Tester, British and PHARMA TEST Dissolution Tester PTWII, Germany), pH meter
(SCHOTT®
CG843P Laboratory pH meter, Germany), Vacuum Oven (JOUAN®
Vacuum Oven
E-50, Germany).
2.1.2. Methodology
The following quality parameters were evaluated using official and non-official methods [BP
2001, IP 2003, USPXXVII, Clarke, 1986].

29
2.1.2.1. Identification tests
a) Carbamazepine
The identification test for carbamazepine tablets was performed according to British
Pharmacopoeia (BP) 2001 that is summarized as follows. A quantity of powdered tablet
containing 0.2 g of carbamazepine was boiled with 15 ml of acetone. The hot solution was
filtered and the filter was washed with two 5 ml quantities of hot acetone. The combined filtrates
was evaporated to 5 ml and cooled in ice. The crystals were dried in an oven by keeping the
temperature at 70oC and a pressure of 2 kpa for 30 minutes. Then the melting point of the
crystals was taken in a melting point apparatus. About 0.1 g of these crystals was heated with 2
ml of nitric acid in a water bath for 3 minutes and the colour formed was observed and recorded.
On the other hand, the fluorescence of the powdered tablets was observed under ultraviolet light
at 366 nm, according to the BP specification. The UV spectrum of the solution of powdered
tablets prepared in the same procedure was also taken as a means of identification [BP, 2001].
b) Phenobarbital
Phenobarbital identification test was performed according to the specification in The
International Pharmacopoeia (IP) 2003. 10 ml of dehydrated ethanol was added to a quantity of
powdered tablets equivalent to about 0.4 g of Phenobarbital, and the mixture was shaked and
filtered. The filtrate was evaporated to dryness and the residue was dried at 105oC for 1hour in an
oven to be utilized for identification tests. The melting point of the residue was taken and 20mg
of the residue was dissolved in 5 ml methanol. One drop of Cobalt (II) Chloride and 3-4 drops of
ammonia were added to the solution and the colour produced was observed and recorded. On the
other hand, 2 ml of sulfuric acid and 20 mg of sodium nitrate were added to 0.2 g of the residue
and allowed to stand for 30 minutes. The colour produced was taken as one of the identification
test requirements [IP, 2003].
Ultraviolet spectrophotometric spectrum scan of the Phenobarbital tablets was taken according to
the procedure indicated in Clarke’s Isolation and Identification of drugs, which provides that
Phenobarbital in 1M NaOH (pH=13) has A(1%, 1cm)=342 at a wavelength maximum λmax of
254 nm. Based on this fact, and considering the UV spectrophotometric linearity range (0.4-0.5),

30
1M Sodium hydroxide (NaOH), pH=13, was prepared and the tablets powder equivalent to
7.5mg Phenobarbital was dissolved in 25 ml of the prepared sodium hydroxide solution. The
mixture was filtered quantitatively and made upto volume in a 50 ml volumetric flask. 5ml of
this solution was taken and diluted to 50ml. The final diluted solution UV spectrophotometric
spectrum was then taken [Clarke, 1986].
2.1.2.2. Tablet hardness and friability
Six tablets were individually placed carefully in a hardness tester and the degree of force
required to break the tablets was recorded from the resulting visual reading display screen of the
instrument [Howard, et al., 1999].
Twenty tablets from each product (brand and/or generic) were dedusted and weighed initially
before undergoing friability test on analytical balance. The tablets were then placed in the drum
of the friability tester and rotated at 25 revolutions per minute (100 times). The tablets from each
product batch were dedusted and reweighed. The percent loss of total weight was calculated
[James, 1996].
2.1.2.3. Dosage form uniformity test (weight variation and content uniformity)
The uniformity of dosage units was demonstrated according to USP by weight variation and/or
content uniformity.
For the determination of dosage form uniformity by weight variation, 10 tablets from each
product were individually weighed, and the average weight was calculated. The content of the
active ingredient in each of the ten tablets was calculated from the results of the assay obtained
as directed in the individual monographs assuming homogeneous distribution of the active
ingredient. The percent weight variation and standard deviations [standard deviation (SD) and
relative standard deviation (RSD)] were calculated.
The determination of dosage form uniformity by content uniformity tests were performed on ten
individual tablets from each product that contain an active ingredient less than 50% by weight of
the tablets [Phenobarbital (Cadila) and Phenobarbital (East Africa Pharmaceuticals PVT. Ltd.

31
Co.)]. Each of the ten tablets of the two products were powdered and dissolved in 20ml methanol
and 7.5 ml of freshly prepared solution of 30 mg of anhydrous sodium carbonate per ml. The
Phenobarbital content was determined potentiometrically by titrating with 0.1M silver nitrate
solution (International Pharmacopoeia (IP) 2003). The percent of drug contained in each tablet
relative to the labeled potency (100mg) was calculated and checked if it was within the range
specified in USP XXVII (85-115%).
2.1.2.4. Disintegration test
The mean disintegration times of six tablets from each product were determined using
CALEVA®
disintegration apparatus (CALEVA®
Distil 1.14). The disintegration media for all the
products comprised of distilled water maintained at 37±1oC. Tablets were considered completely
disintegrated when all particles passed through the wire mesh.
2.1.2.5. Assay of the tablets
a) Carbamazepine
For the assay of the carbamazepine tablets BP 2001 was used. Twenty tablets from each brand
product were weighed and powdered. A quantity of the powder containing 60 mg of
carbamazepine was boiled with 25 ml of 96% ethanol for a few minutes. The hot mixture was
stirred in a closed flask for 10 minutes and filtered through sintered glass. The flask and the filter
were washed with 96% ethanol and sufficient 96% ethanol was added to the cooled filtrate to
produce 100 ml. 5 ml of this solution was diluted to 250 ml with 96% ethanol and the absorbance
of the resulting solution was measured using an ultraviolet spectrophotometer (SPECTRONIC®
GENESYSTM
5 Spectrophotometer, New York) at the wave length maximum, λmax, of 285 nm.
Then the content of carbamazepine C15H12N2O was calculated taking 490 as the value of A (1%,
1cm) at the λmax of 285 nm [BP 2001].
b) Phenobarbital
The assay of Phenobarbital tablets was performed in accordance with IP 2003. Twenty tablets
from each generic products of Phenobarbital were weighed and powdered. 40 ml methanol and
15 ml of a freshly prepared solution of 30 mg of anhydrous sodium carbonate per ml was added
to a quantity of powdered tablets equivalent to about 0.2 gram of Phenobarbital. The solution

32
was then titrated with 0.1M volumetric solution of silver nitrate, which was initially standardized
with sodium chloride according to the BP 2001, determining the end point potentiometrically.
Standardization of 0.1M silver nitrate solutions
About 17.0 gram of silver nitrate was dissolved in distilled water in a 1L volumetric flask and
sufficient distilled water was added to make upto volume so that the expected 0.1M silver nitrate
solution was to be obtained. To ascertain the exact concentration of silver nitrate solution, 0.1
gram of sodium chloride (AVONDALE LABORATORIES, 930102, England) was dissolved in
30 ml of distilled water and titrated with the silver nitrate solution determining the end point
potentiometrically.
2.1.2.6. Dissolution studies
The dissolution rates of the tablets (carbamazepine and Phenobarbital) were determined
according to USP XXVII specifications. The dissolution medium consisted of 900 ml of 1%
sodium lauryl sulfate in a thermostatically controlled water bath at 37±0.5oC that was being
stirred at 75 rpm for the different brands of carbamazepine tablets using dissolution apparatus II
(PHARMA TEST Dissolution Tester PTWII, Germany). For the different generic products of
Phenobarbital tablets the dissolution apparatus II (CALEVA®
10ST Dissolution Tester, British)
was used. The medium consisted of 900 ml distilled water in a thermostatically controlled water
bath at 37±0.5oC that was being stirred at 50 revoluton per minute.
The amount of carbamazepine and Phenobarbital released from the respective tablet products put
in dissolution media were determined by sample withdrawal at different times. Samples (5 ml)
were withdrawn after 5, 10, 15, 20, 30, 45, and 60 minutes for Phenobarbital tablets while an
additional sample was taken further at 75 minutes for carbamazepine tablets, and an equivalent
amount of water and 1% sodium lauryl sulfate solution were immediately introduced,
respectively, as replacement. The samples were filtered and suitably diluted with 1% sodium
lauryl sulfate for carbamazepine samples and freshly prepared alkaline borate buffer (pH=9.6)
for Phenobarbital tablet samples for the assay of drug contents.

33
The assay for carbamazepine released from the tablets was performed by measuring the
absorbance at 288 nm using SPECTRONIC®
GENESYSTM
5 Spectrophotometer, New York
Spectrophotometer. 1% sodium lauryl sulfate was used as a blank and the necessary correction
for dilution was made when calculating the amounts of drug released. The drug content was
calculated using comparison method with the reference standard of carbamazepine.
Amount of Phenobarbital released from the tablets was assayed by measuring absorbance at 240
nm using CECIL®
CE 1021 Spectrophotometer (England). Alkaline borate buffer (pH=9.6) was
used as blank and drug content calculation was made by comparison with USP Phenobarbital
reference standard and making all the necessary correction for dilution.
Preparation of alkaline borate (pH=9.6) buffer
Boric acid and potassium chloride solution, 0.2M, was initially prepared by dissolving 12.37
gram of extra pure boric acid (H3BO3) [LOBA CHEMIE PVT Co., Batch No 59264, India] and
14.91 gram of potassium chloride (KCl) [BDH AnalaR®
, England] in distilled water, and diluted
with water to 1000 ml. Secondly, 0.2M sodium hydroxide solution was prepared by dissolving 8
gram of extra pure sodium hydroxide (NaOH) [LOBA CHEMIE PVT Co., Batch No 59265,
India] pellets in 1000 ml of distilled water. Then, 50 ml of the boric acid and potassium chloride
solution (0.2M) was placed in a 200 ml volumetric flask. 36.9 ml of sodium hydroxide solution
(0.2M) was added and made upto volume with distilled water to produce an alkaline borate
buffer (pH=9.6). The pH was checked using pH meter.
2.2. Data Analysis
The data were analyzed using Micrsoft Excel-2000, GraphPad InStat Demo- [DATASET-1SD]
and Origin Graphing and Scientific Software and comparison was made between content
uniformity, assays, and dissolution profiles of the tablets using GraphPad InStat Demo-
[DATASET-1SD].

34
3.1. Identification test
The ultraviolet Spectrophotometric spectrum of the investigated tablets (Carbamazepine and
Phenobarbital) showed absorption maxima as indicated in Table 3.1.
Table 3.1 Absorption maxima [λmax] of Carbamazepine and Phenobarbital tablets
Carbamazepine tablets
[Conc. 0.01 mg/ml]
Phenobarbital tablets
[Conc. 0.015 mg/ml]
Drugs
Tegretol Tegral Taver Ref. PhB,
Epharm
PhB,
Cadila
PhB, East
Africa
Ref.
Absorption
λmax, nm
285 285 286 285 256 256 256 256
Two of the carbamazepine tablets, Tegretol and Tegral, have shown absorption λmax at 285 nm
and Taver at 286 nm. All the Phenobarbital tablets showed absorption maxima at λmax of 256. All
the tablets pass the UV Spectrum identification test as all are in the range λmax ± 2nm (BP 2001).
The UV spectrum of the tablets is annexed.
The melting points of the tablets are indicated in Table 3.2. All of the investigated tablet
formulations pass their respective melting point specifications, 191oC for carbamazepine and
174oC for Phenobarbital tablets according to BP 2001 and IP 2003, respectively.
The powdered tablets of carbamazepine tablets when seen under ultraviolet light at the
wavelength of 365 nm, all the three investigated brands show intense blue fluorescence
complying with the BP 2001 specification requirement. Upon reaction with nitric acid all the
three carbamazepine (Tegretol, Tegral and Taver) tablet formulations analyzed gave orange red
colour, which is also in accordance with the BP specification.
Structural specific identity reaction depends on heating an acidic solution (HCl or HNO3)
resulting in the formation of 9-Methylacridine as the final product. The reaction involves
rearrangement of the molecule after hydrolysis of the coloured carbamate moiety as illustrated in
the following scheme:

35
N
H+, Heat
CO2
NH3
NH
H+
O NH2
N+
HH
NH+
H H
H
NH
H+
NH+
H
H
H
N
CH3
H
H
- H+
One of the known identification methods of barbituric acid derived drugs like Phenobarbital is
what is known as Zwikker reaction. The reaction depends on treatment of the respective
barbituric acid derivatives with alkaline solution of Co (II) salts. A coloured complex will be
formed, having the general formula (Barb)2Co and the chelate is stabilized as solvate or diamine
complex. BP and IP have adopted this method on the basis of its high sensitivity and relative
simplicity. The coloured complex is illustrated in the following scheme [Roth, et al., 1981]:

36
N
HN
O Co N
NH
O
O
OO
O R2
N
N
H
R R
H
R R
R1
R2
R1
For all the three tablets of Phenobarbital violet colour was produced upon addition of methanol,
cobalt chloride and ammonia solutions. Yellow colour was produced with the reaction with
sulfuric acid and sodium nitrate, which is satisfying the IP 2003 specification.
Table 3.2 Melting point of Carbamazepine and Phenobarbital tablets
Drugs Melting Point Reading (oC)
[n = 5]
Tegretol 190.8 ± 0.1
Tegral 190.7 ± 0.1
Carbamazepine
tablets
Taver 190.7 ± 0.2
PhB, Epharm 173.5 ± 0.1
PhB, Cadila 173.6 ± 0.2
Phenobarbital
tablets
PhB, E. Africa 173.5 ± 0.2
Carbamazepine
working standard 190.9 ± 0.1
References
PhB USP
reference standard 173.8 ± 0.2

37
In general, all the tablets analyzed, carbamazepine (Tegretol, Tegral and Taver) and
Phenobarbital (Epharm, Cadila and East Africa), passed the BP 2001 and the IP 2003
identification tests, respectively.
3.2. Hardness and Friability Test
The mean hardness values of the tablets of carbamazepine and Phenobarbital in this study are
shown in Table 3.3. It is indicated that for the carbamazepine tablets studied the lowest hardness
is that of Tegretol which is 60.7 (± 2.0) N, and the highest is that of Tegral (103.5 ± 9.4 N).
Taver showed a hardness of 89.2 ±6.6 N. The hardness test for the Phenobarbital tablets indicates
maximum value of 84.7 ±11.6 N for the East African pharmaceutical Pvt. ltd. Company product
and a value of 65 ±7.2N for the Epharm product. The Cadila product Phenobarbital tablet gave
an average hardness value of 50.5 ± 7.8N.
Similarly, the weight loss of the tablets, after friability test expressed as percent friability, is also
indicated in Table 3.3. The lowest percent friability for the carbamazepine tablets has been
obtained for Taver (0.07) while Tegretol and Tegral percent friability are 0.47 and 0.51,
respectively.
Table 3.3 Summary of hardness and friability tests of the tablets
Tablet name Hardness (N*)
[±RSD]
Friability
F%
Tegral 103.5 (9.4)
0.5126
Tegretol 60.7 (2.0)
0.4688 Carbamazepine
tablets
Taver 89.2 (6.6)
0.0740
Phenobarbitone
(East Afr.)
84.7 (11.6)
0.2306
Phenobarbitone
(Epharm)
65.0 (7.2)
0.1722
Phenobarbital
tablets
Phenob. (Cadila) 50.5 (7.8) 0.2942
*N: Newton

38
The percent friability of the Phenobarbital tablets analyzed is 0.17 for the Epharm product, and
0.23 and 0.29 for the East African Pharmaceuticals product and the Cadila product, respectively.
Usually, tablets require a certain degree of strength and resistance to friability to withstand
mechanical shocks of handling during manufacturing, packaging, shipping, storage and finally
consumption by the patient. Adequate tablet hardness as well as reasonable friability is the
necessary requisites for a consumer acceptance. For conventional compressed tablets, a hardness
of 50N is the minimum requirement for a satisfactory tablet product and must not lose more than
1% of its weight after friability test. Limits of < 1% friability are often set, but < 0.1% is a
realistic goal (James, 1996).
Phenobarbital tablet of Cadila product hardness is very close to the lower limit 50N. The %
friability of Taver is 0.07, which is <0.1%, an ideal specification limit. Generally, all the studied
tablets passed the hardness and friability test specification of tablet dosage forms [BP 2001].
3.3. Disintegration test
Carbamazepine and Phenobarbital tablets, like any other solid dosage forms, need to disintegrate
in the gut and go into solution before they are completely absorbed. Disintegration, therefore, is
an important process in making the drug available for absorption. The official requirement in the
British Pharmacopoeia disintegration test is that uncoated tablets should disintegrate in less than
15 minutes (BP 2001). As shown in Table 3.4, the disintegration times for the studied
Carbamazepine tablets are: Tegretol (1.0 ± 0.0 minute), Tegral (4.5 ±1.5 minutes) and Taver (4.3
± 0.5 minutes) and tablets are: Phenobarbital EPHARM (2.8±0.4minutes), Phenobarbital East
Table 3.4 Disintegration time (minute) of Carbamazepine and Phenobarbital tablets
Disintegration time (minute)
Carbamazepine tablets (±SD) Phenobarbitone tablets (±SD) Drugs
Tegral Tegretol Taver East Africa Epharm Cadila
Average 4.5 (1.5) 1.0 (0.0) 4.3 (0.5) 4.8 (0.8) 2.8 (0.4) 2.3 (0.5)

39
that of Phenobarbital East African Pharmaceuticals (4.8 ± 0.8 minutes) and Phenobarbital Cadila
(2.3 ± 0.5 minutes).
As evident from the results, all the tablets pass the BP specification. The results indicate that
disintegration time for carbamazepine tablets increases in the order Tegretol (1.0 minute), Taver
(4.3 minutes) and Tegral (4.5 minutes) while that of Phenobarbital tablets increases in the order
of Cadila (2.3 minutes), Epharm (2.8 minutes) and East African Pharmaceuticals (4.3 minutes).
The values from the hardness test of the tablets also increase in the same order: Tegretol (60.7N),
Taver (89.2N) and Tegral (103.5N) for carbamazepine tablets; and Cadila (50.5N), Epharm
(65.0N) and East African Pharmaceuticals (84.7N) for Phenobarbital tablets. Thus, the results of
the study indicate that there is direct relationship between disintegration time and hardness.
3.4. Weight variation and Dosage unit uniformity
3.4.1. Weight variation
As illustrated in Table 3.5, the average weight of the tablets varies from product to product. For
Carbamazepine tablets, the average weight is 256.8 mg (Taver), 276.2 mg (Tegral) and 279.2 mg
(Tegretol) where the official standard strength for all the three products is 200 mg. Similarly, for
the Phenobarbital tablets the average weight is 152.5 mg (Epharm), 203.4 mg (East Africa
Pharmaceutical) and 214.2 mg (Cadila). The variations in average weights of the tablets could be
accounted due to the use of different kinds and/or amounts (varying proportions) of excipients in
the tablets investigated. In case of the analyzed brands of carbamazepine tablets analyzed, the
weight variation may be because of the use of different kinds/varying proportion of excipients by
manufacturers. For Phenobarbital tablets, all of the products analyzed are generic, which means
the different manufacturers used the same excipient and formula to manufacture the products.
However, they may use varying proportions of the same kind of excipient or there may be
variations in Good Manufacturing Practices (GMP), which possibly contribute to the weight
variations. The GMP influences especially processing and manufacturing variables that have
direct or indirect effect on the tablets weight and responsible for the weight variations.
The percent mean deviations (RSD) for the products tested is less than 1% for the three
carbamazepine tablets and less than 4% for the Phenobarbital tablets analyzed. The compendial

40
Table 3.5 Weight variation and dosage uniformity of carbamazepine and Phenobarbital
tablets
Drugs a b c
Taver 256.8 (1.0)
99.7 (1.0)
-
Tegral 276.2 (0.8)
90.7 (0.8)
-
Carbamazepine
tablets
Tegretol 279.2 (0.5)
95.9 (0.5)
-
Epharm 152.5 (3.8)
94.1 (3.8)
-
E. Africa 203.4 (2.1)
97.2 (2.1)
95.1 (2.5)
Phenobarbital
tablets
Cadila 214.2 (1.3)
91.1 (1.3)
90.9 (4.1)
Key: a) Tablet average weight, mg (±RSD)
b) %content (±RSD) from weight variation method
c) %content (±RSD) from content uniformity method.
specicification for uniformity of weight is that the weight of each of the tablets analyzed should
not deviate from the average value by more than 5.0% (USP XXVII). This implies that all the
tablets comply with USP XXVII specifications for weight variation. The relatively small weight
variations indicate reasonable control system in the GMP of the manufacturers.
Statistical comparison of the weights of the three brands of the carbamazepine tablets and the
three generic products of Phenobarbital tablets indicate that at 95% confidence interval there is
significant difference in the weight of Tegretol and Tegral, East Africa Pharmaceutical
Phenobarbital and Epharm Phenobarbital, and Epharm and Cadila Phenobarbital (P<0.05).
Extremely significant differences have been observed for the weights of Tegretol and Taver,
Tegral and Taver, and East Africa Pharmaceutical Phenobarbital and Cadila Phenobarbital

41
(P<0.001). The statistical results indicate that there are variations between individual tablets of
the products investigated.
3.4.2. Dosage unit uniformity
The uniformity of dosage units can be demonstrated by either of the two methods, weight
variation tests or content uniformity test. For tablets of high dose drugs (pharmaceutical products
like tablets, capsules, etc., which contain 50 mg or more of an active ingredient comprising 50%
or more, by weight, of the dosage form unit), weight variation test is recommended by the USP
XXVII, as an effective means of assuring uniform potency. For tablets of low dose drugs (tablet
formulations containing less than 50 mg of an active ingredient comprising less than 50% by
weight of the dosage form), excipients make up the bulk of the tablets weight. In this case,
therefore, content uniformity test has to be performed. According to USP XXVII specification,
the requirements for dosage form uniformity are met if the amount of the active ingredient in
each of the ten dosage units as determined from the weight variation or content uniformity
method lies within the range or 85.0% to 115.0% of the labeled claim and the relative standard
deviation (RSD) less than or equal to 6.0%.
The percentage contents of different brands of carbamazepine tablets and different generic
products of Phenobarbital tablets calculated using weight variation and/or content uniformity
method is indicated in Table 3.5. The percentage content according to the weight variation
method was calculated for all of the tablets as they contain 200 mg (carbamazepine tablets) and
100 mg (Phenobarbital tablets), both of which contain more than 50 mg weight. The percentage
contents for the carbamazepine tablets are Tegral (89.9-91.5%), Tegretol (95.4-96.4%), and
Taver ((98.7-100.7%); and that of Phenobarbital tablets are East Africa Pharmaceuticals
Phenobarbital (95.1-99.3%), Epharm Phenobarbital (90.4-97.9%), and Cadila Phenobarbital
(89.8-92.4%). These results indicate that all the tablet products analyzed pass the USP XXVII
specification requirements for dosage form uniformity by weight variation.
In order to achieve the relatively wider content uniformity range (i.e. 85.0-115.0% of the labeled
potency) for potent low dose drugs, it needs special effort to uniformly distribute them through
out the powder mixture, to avoid segregation or drug excipient separation during the

42
manufacturing process or to control all the variables that bring about tablet weight variation.
These variables could be utilized as a quality control parameter so that the marketed
pharmaceutical products should fulfill the requirements.
To check whether or not weight variation method is sufficient to assure dosage form uniformity,
the claimed potency, 200 mg for the carbamazepine tablets and 100 mg for the Phenobarbital
tablets, was divided for the weight of each tablet. The results showed that for tablets of East
Africa pharmaceuticals Phenobarbital (49.2 %) and Cadila Phenobarbital (46.7 %), the
proportion of active ingredient to the tablet weight was found to be less than 50 % (Table 3.6).
Thus, content uniformity was utilized for further dosage unit uniformity test, as indicated in
Table 3.5. The percentage contents calculated using content uniformity method for these tablets
were Cadila Phenobarbital (86.8-95.0 %) and East Africa pharmaceuticals Phenobarbital (96.2-
95.0 %). These results reveal that content uniformity has higher strength than weight variation in
determining dosage form uniformity as lower percentage content ranges for content uniformity
(86.8-95.0 %) when compared to the weight variation result (89.8-92.4 %) for Cadila
Phenobarbital were obtained. Even at these lower ranges both the tablets also pass the
requirements for dosage form uniformity using content uniformity method.
Table 3.6 Percent claim potency of the active ingredient per tablet weight of
Carbamazepine (200mg) and Phenobarbital (100mg) tablets
Carbamazepine tablets Phenobarbital tablets Tablet type
Tegral Tegretol Taver East Africa Epharm Cadila
Average weight,
mg
276.2 279.2 256.8 203.4 152.5 214.2
%Claim potency
per tablet weight
72.4 71.6 77.9 49.2 65.6 46.7
Statistical analysis of the percentage contents obtained from the tablets analyzed by both weight
variation method and content uniformity method indicate that there has been extremely
significant differences between the percentage contents calculated using weight variation method
from the three brands of carbamazepine tablets as well as between that of the three generic

43
products of Phenobarbital tablets. The percentage content using content uniformity test for the
two generic products: Cadila and East Africa Pharmaceuticals was compared using unpaired t-
test and found to have very significant difference (P=0.0082) at 95% confidence interval. The
results of the percentage contents of both methods (weight variation and content uniformity) for
these two products were also compared and found that there is no significant difference
(P=0.9014) for the Cadila product while significant difference was obtained for the percentage
contents of East Africa Pharmaceuticals Phenobarbital (P=0.0453). The statistical results indicate
that the products analyzed are not equivalent with respect to dosage form uniformity.
3.5. Assay of the tablets
Assay of active ingredients in pharmaceutical products is possible using different instrumental
methods. For the assay of the investigated products, carbamazepine and Phenobarbital tablets,
different official Pharmacopias set techniques like gravimetric analysis, uv spectrophotometric
analysis, potentiometric titration and the like. In this study, depending on cost and availability of
the instruments, the methods described in BP 2001 and IP 2003 have been chosen. The British
Pharmacopoeia states that carbamazepine tablets must contain not less than 95.0% and not more
than 105.0% of carbamazepine stated on the label while the International Pharmacopoeia states
that Phenobarbital tablets must contain not less than 90.0% and not more than 110.0% of the
amount of Phenobarbital of the label claim [BP, 2001, IP, 2003]. The results of analysis of the
three brands of carbamazepine tablets and the three generic products of Phenobarbital tablets
analyzed according to the BP 2001 and IP 2003 methods, respectively, are represented in Table
3.7. From the results of assay of carbamazepine tablets, Tegretol (95.9 ± 0.4%) and Taver (99.5
± 1.0%) passed the BP specification i.e. they contain the required amount of carbamazepine
while Tegral (91.9±0.7%) fail to pass the specification on percentage content as it has lower
percentage than the BP specification limit. The highest content has been achieved for Taver
tablets.
The assay results for Phenobarbital tablets indicate that all the tablets analyzed pass the IP
specification. The highest percentage content was obtained from the East Africa Pharmaceuticals
Phenobarbital product (98.0±0.1%), while intermediate value and lower value have been

44
Table 3.7 Assay results of carbamazepine and Phenobarbital tablets [n = 3]
Drugs Product type Assay Result,
%w/w (±RSD)
Tegretol 95.9 ± 0.4
Tegral 91.9 ± 0.7
Carbamazepine tablets,
200mg
Taver 99.5 ± 1.0
Epharm 93.7 ± 0.1
East African Pharmaceutical 98.0 ± 0.1
Phenobarbital tablets,
100mg tabs
Cadila 91.4 ± 1.0
obtained for Epharm Phenobarbital (93.7±0.1%) and Cadila Phenobarbital (91.4±1.0%),
respectively.
Table 3.8 Statisitical analysis results of assay values of different carbamazepine and
Phenobarbital tablets [n = 3]
Drugs
Minimum Maximun Mean Standard
deviation
Median
Tegretol 95.4 96.5 95.9 0.4 95.8
Tegral 91.4 92.0 92.0 0.7 91.6
Carbamazepine
tablets
Taver 98.3 100.7 99.3 0.9 99.5
Epharm 93.6 93.8 93.7 0.1 93.8
East Africa 97.9 98.1 98.0 0.1 98.0
Phenobarbital
tablets
Cadila 90.4 91.9 91.4 0.9 91.9
P<0.001 for comparison of: Tegretol vs Tegral, Tegretol vs Taver, Tegral vs Taver, Epharm PhB
vs East Africa PhB and East Africa PhB vs Cadila PhB and P<0.01 for Epharm PhB vs Cadila
PhB at 95% confidence interval.

45
Statistical analysis of the assay results using GraphPad InStat Demo- [DATASET-1SD] and
comparison of the different brands of carbamazepine tablets and the different generic products of
Phenobarbital tablets at 95% confidence interval is indicated in Table 3.8. With 95% confidence
interval the assay results showed that there is extremely significant difference in percentage
content of the three brands of carbamazepine tablets analyzed: Tegretol vs Tegral, Tegretol vs
Taver, Tegral vs Taver; and from the generic products of Phenobarbital tablets: East Africa
Pharmaceuticals Phenobarbital vs Epharm Phenobarbital, and Africa Pharmaceuticals
Phenobarbital vs Cadila phenobarbital (P<0.001). At the same confidence interval (95%), there is
very significant difference with P<0.01 between Epharm Phenobarbital and Cadila
Phenobarbital.
The statistical analysis as shown above reveals that the different brands of carbamazepine tablets
analyzed: Tegretol, Tegral and Taver; and the three different generic products of phenobarbital
tablets tested: Epharm, East Africa and Cadila have showed no equivalency with respect their
assay values.
3.6. Dissolution studies
3.6.1. Dissolution profile of carbamazepine tablets
The dissolution profile of carbamazepine tablets is depicted in Figures 3.1. The USP
specification for the release of carbamazepine from the brands of carbamazepine tablets is that
between 45% and 75% of the label claim of carbamazepine should be dissolved in 15minutes;
and not less than 75% of the labeled amount of carbamazepine is dissolved in 60minutes. From
the three brands of carbamazepine tablets analyzed both Tegretol and Taver passed the above
USP requirement but Tegral has failed to release its contents in the tolerance limits specified as a
dissolution requirement. Tegretol tablet released 58.3% of its content at the 15th
minute and
80.6% at the 60th
and Taver tablets released 77.6% at the 15th
minute and 84.1% at the 60th
minute. Tegral tablet has released 43.0% of its content at the 15th
minute and 71.6% at the 60th
minute. These results are below the tolerance limits at both time references.

46
The dissolution data of carbamazepine tablets when treated statistically revealed that at 95%
confidence interval there is extremely significant difference between the three tablets (P<0.05) at
the pharmacopoeially specified times, 45 and 60minutes.
Table 3.9 Percent drug release of different brands of carbamazepine tablets at different
times
% Carbamazepine Released Time (minute) of
sampling Tegretol Tegral Taver
0 0 0 0
5 44.8 20.9 34.2
10 51.7 33.4 69.6
15 58.3 43.0 77.6
20 63.2 48.1 80.6
30 70.7 56.7 84.0
45 75.7 64.8 84.0
60 80.6 71.6 84.1
75 82.5 75.4 84.2

47
0
10
20
30
40
50
60
70
80
90
0 20 40 60 80
Time (minutes)
% D
rug
Re
lea
se
d
Tegretol
Taver
Tegral
Figure 3.1: Dissolution profiles of different brands of carbamazepine tablets
3.6.2. Dissolution profile of Phenobarbital tablets
The dissolution profile of the different generic products of Phenobarbital tablets are shown in
Table 3.10 and Figures 3.2. The USP specification for the release of Phenobarbital from the
tablet pharmaceutical products of phenobarbital is that less than 75% of the label claim of
phenobarbital should be dissolved in 45 minutes.
From the three generic products of Phenobarbital tablets analyzed it is only the Epharm product
which passed the above USP requirement but the East Africa Pharmaceuticals Phenobarbital and
the Cadila Phenobarbital have failed to release their contents in the time specified the tolerance
limits required as a dissolution requirement. The Epharm product Phenobarbital tablet released
87.0% of its content at the 45th
minute, which is in the requirement range. The East Africa
Pharmaceuticals Phenobarbital tablet and the Cadila Phenobarbital tablet have released 61.7%
and 19.3%, respectively, at the 45th
minute, which are results below the tolerance limits at the
pharmacopoeially specified time references.

48
Table 3.10 Percent drug release of different generic products of Phenobarbital tablets at
different times.
% Phenobarbital Released Time (minute) of
sampling Epharm East Africa pharm. Cadila
0 0 0 0
5 27.2 17.0 6.1
10 58.5 34.8 7.8
15 74.3 44.9 10.4
20 78.7 51.2 14.5
30 82.1 56.3 16.9
45 87.0 61.7 19.3
60 87.2 63.4 20.3
The statistical treatment of the release profile at the pharamacopoeially specified time, 45
minutes, of the different generic products of phenobarbital tablets indicated that at 95%
confidence interval there is extremely significant difference (P<0.001) between all the three.
These statistical results indicate that all of the three generic products of phenobarbital are not
equivalent with respect to their in vitro release profile.

49
0
10
20
30
40
50
60
70
80
90
100
0 20 40 60 80
Time (minutes)
% D
rug
Re
lea
se
PhB, E. Africa
PhB, Epharm
PhB, Cadila
Figure 3.2: Dissolution profiles of different generic products of Phenobarbital tablets
3.6.3. Dissolution parameters
The t50% and t90% are the dissolution parameters that can be utilized to analyze dissolution profile
of different pharmaceutical products. The t50% is the time required for release of 50% of the
contents of the tablets analyzed and t90% is the time required for the release of 90% of the
contents. Very long t50% and t90% values of pharmaceutical products dissolution profile indicate
that the product may manifest lower rate and extent of bioavailability in the body.
The t50% and t90% of the different brands of carbamazepine tablets and the different generic
products of Phenobarbital tablets analyzed were calculated using Origin Graphing and
Scientific Software and are shown in Table 3.11. The results of carbamazepine tablets showed
that, since 50% release has been achieved within relatively short period of time for Taver (t50%
=7.1) and Tegretol (t50% =9.6), they are expected to be absorbed and became bioavailable within
a short period of time. Relatively longer t50% value (22.4min) has been obtained for Tegral
implying slower rate and extent of bioavailability relative to Taver and Tegretol. Similar trends
could happen with respect to t90% values.

50
Table 3.11 The t50% and t90% of carbamazepine and Phenobarbital tablets
Dissolution parameter Product
t50% (min) t90% (min)
Taver 7.1 117.8
Tegretol 9.6 146.9
Carbamazepine
tablets
Tegral 22.4 127.3
Epharm 9.5 96.1
East Africa Pharmaceuticals 19.2 141.8
Phenobarbital
tablets
Cadila 83.3 352.6
Epharm Phenobarbital product has shorter t50% (9.5 min) and t90% (96.1 min) relative to the other
two Phenobarbital products. East Africa Pharmaceuticals Phenobarbital has intermediate t50%
(19.2 min) and t90% (141.8 min) values with respect to the larger t50% (83.3 min) and t90% (352.6
min) of the Cadila product. From these values we can expect that the rate and extent of
bioavailabilty of the Epharm product Phenobarbital is relatively higher than that of the two
products: East Africa Pharmaceuticals and Cadila Phenobarbital.
In summary, proof of bioequivalence can involve in vitro dissolution studies, in vivo
bioavailability studies, or combination of these. Carefully designed in vitro dissolution tests can
be used as an index of the physiological availability of active constituents from orally
administered formulations. In addition, in at least some situations, in vitro tests have been used to
meet FDA quality requirements for proof of bioequivalence. However, an in vivo dissolution and
absorption tests would likely give a more complete evaluation of solid formulations than could
an in vitro test. Therefore, further in vivo studies should be conducted for obtaining a complete
picture of bioequivalence of the carbamazepine and Phenobarbital tablets analyzed [Getie, et al.,
1998].
51
4. Conclusion
In general, the overall aspect of the study has attempted to make a comparative assessment of the
quality in terms of identification, physical properties and in vitro bioequivalence of some
antiepileptic drug products, carbamazepine and Phenobarbital tablets, available in drug retail
outlets in Addis Ababa. All the tablets met the quality specification with respect to identification,
hardness and friability, disintegration, and dosage form uniformity (weight variation and/or
content uniformity). With respect to drug content (assay), from the carbamazepine tablets
analyzed, Tegral was found to be out of the specified tolerance limit, while the other
carbamazepine tablets and all the Phenobarbital tablets evaluated were within the tolerance limits
of content. Thus, Tegral was found to be substandard. The brand was also found to be not within
the tolerance limits of dissolution test requirement since it did not release the specified contents
within the specified time. The East Africa pharmaceuticals Phenobarbital and the Cadila
Phenobarbital have also result outside the dissolution test specifications. Thus, the different
brands of carbamazepine tablets and the different generic products of Phenobarbital tablets
analyzed were found to be bioinequivalent with respect to the in vitro dissolution test.
Therefore, one possible cause of the inadequate control of seizures and tolerance developments
to antiepileptic drugs may be attributed to the quality aspect of the drugs. The different brands
and generic tablet formulations utilized by the epileptic patients if not bioequivalent, but
interchangeably utilized, or use of substandard drugs could lead to treatment failures. The
present study will be of paramount importance provided further in vivo bioavailability evaluation
of the indicated brands and generic tablet formulations are performed and correlated with the in
vitro findings.

52
5. Suggestions for further work
• The in vivo bioavailabilty of the investigated tablet products should be studied in order to
obtain their complete picture on their bioequivalence and clinical efficacy.
• Stability studies of the products should be investigated to identify if possible to quantify
degraded products.
• Continued quality surveillance of the brand and generic tablet formulations of
antiepileptic drugs from different regions of the country should be conducted to ensure
quality thereby improve clinical efficacy.
• Any drugs particularly from different boarder regions which are expected to be
susceptible to drug smuggling should be assessed to get an overall control of counterfeit
drug product chains.

53
REFERENCES
Albert IW, Thomas MS, and Nicole MC. (2004) Counterfeit pharmaceuticals update on
current status and future projections. Business Briefing: Pharmaceutics.
Allen CMC, Leuck CJ (2000) Diseases of the nervous system. In: Davidson’s principles
and practice of medicine, Christopher H, Edwin RC, John AA, Hanter, Nicholas AB. (eds),
18th edn, Harcourt Publishers Ltd., New York, pp. 942-948.
Alton ME. (2002) Pharmaceutics, The science of dosage forms design, 2nd
edn., Harcoust
publishers Ltd., London, PP.18-21.
Al-Zein H, Riad LE, Abd-Elbary A. (1999) Effect of packaging and storage on the stability
of carbamazepine tablets. Drug Dev Ind pharm. 25: 223-7.
Amidon GL, Lennernas H, Shan VP, Crison JP. (1995) A theoretical basis for a
biopharmaceutic drug classification: The correlation of in vitro drug product dissolution and
in vivo biosvailabiltiy. Pharm Res.12: 413 - 20.
Annegers JF, Dubinsky S, Coan SP, Newmark ME, Roht L. (1999) The incidence of epilepsy
and unprovoked seizures in multiethnic, urban health maintenance organizations. Epilepsia
40:502-6.
Artemowicz B, Sobaniec W, Kuroczycki-Saniutycz S. (2002) Analysis of the etiology,
clinical picture and treatment of epilepsy in children in the Northeastern region of Poland.
Rocz Akad Med Bialymst. 47:130-138.
Ashford M.(2002). Introduction to biopharmaceutics, In: Pharmaceutics: The science of
dosage form design. Aulton ME. (eds), 2nd
edn, Churchill Livingstone, UK, pp.213-216.
Ayers G, Burnett D, Griffiths A, Richens A.(1981) Quality control of drug assays. Clin
Pharmacokinet.6: 106-17.

54
Ayers GJ, Goudie JH, Reed K, Burnett D. (1977) Quality control in the simultaneous assay
of anticonvulsants using an automated gas chromatographic system with a nitrogen detector.
Clin Chim Acta.76: 113-24.
Banakar UV. (1992) Pharmaceutical dissolution testing, Marcel Dekker, Inc, NewYork, pp.1-
8, 347 - 421.
BanakarU. (1999) Bioavailability, bioequivalence, and drug selection. In: Basic
Pharmacokinetics, Rasma C, Michael C. Makoid Publishers, New York, pp.1-111.
Bi YX., Sunada H, Yonezawa Y, and Danjo K. (1999) Evaluation of rapidly disintegration
tablets prepared by a direct compression method. Drug dev. Ind. pharm.25: 571 – 81.
Brandau R, Wehnert HV. (1979) Dissolution rates and bioavailability of phenytoin
preparations. Arzneimittel forschung. 29: 552-5.
British Pharmacopiea (BP) 2001, Vol. II, Her Majesty’s Stationary Office, London.
Chakrabarti S, Belpaire F, Moerman E. (1980) Effect of formulation on dissolution and
bioavailability of phenytoin tablets. Pharmazie.35: 627 - 9.
Chowhan ZT.(1980) Role of binders in moisture-induced hardness increase in compressed
tablets and its effect on in vitro disintegration and dissolution. J Pharm Sci.69:1-4.
Chowhan ZT. (1980) The effect of low- and high-humidity ageing on the hardness,
disintegration time and dissolution rate of dibasic calcium phosphate- based tablets. J Pharm
Pharmaco. 32: 10-4.
Clarke’s Isolation and Identification of drugs. (1986) 2nd
edn., The Pharmaceutical Press.
London.

55
Dam M, Kristensen CB, Helles A, Jaeger SA, Schmiegelow M. (1981) Carbamazepine: A
clinical biopharmaceutical study. Eur J Clin Pharmacol. 20: 59-64.
Deasy PB, Timoney RF. (1976) The Quality control of medicines. Elsevier scientific
publishing company, New York, pp.1, 3.
Eeg-Olofsson O, Bergstrom T, Osterland CK, Andermann F, Olivier A. (1995) Epilepsy
etiology with special emphasis on immune dysfunction and neurovirology. Brain Dev 17: 58-
60.
Endale A and Gebre maram T. (1996) Dissolution of chloroquine phosphate prepared using
enset starch as a binders and disintegrant. Eth. Pharm. J. 14: 1-15.
Ernest R, Somerville F. (2002) Aggravation of partial seizures by antiepileptic drugs: Is there
evidence from clinical trials? Neurology 59:79-83.
Esezobo S, Pilpel N. (1977) Formulation factors affecting strength and dissolution of
uncoated oxytetracycline tablets. J Pharm Sci.66: 852-8.
Esezobo S. (1985) The effect of some excipients on the physical properties of a paracetamol
tablet formulation. J Pharm Pharmaco. l37: 193-5.
Ethiopian Drug Administration and Control Authority (DACA) (2004) Standard treatment
guideline for zonal hospital, (eds), 1st edn, , Addis Ababa, Ethiopia.
FDA (1997) Guidance for Industry. Dissolution testing of immediate release solid oral
dosage forms. http://www.fda.gov/cder/guidance.htm.
FDA (2000) Guidance on bioavailability and bioequivalence studies for orally administered
drug products-general considerations, Center for drug evaluation and research.

56
Fell JT and Etentakis E. (1978) The wetting of powders of acetylsalicylic acid, salicylic acid,
phenacetin and paracetamol. J pharm pharmacol. 30: 538 –41.
French JA, Kanner AM, Bautista J, Abou-Khalil B, Browne T, Harden CL, Theodore WH,
Bazil C, Stern J, Schachter SC, Bergen D, Hirtz D, Montouris GD, Nespeca M, Gidal B,
Marks WJ, Turk WR, Fischer JH, Bourgeois B, Wilner A, R. Faught E, Sachdeo RC,
Beydoun A, Glauser TA. (2004) Efficacy and tolerability of the new antiepileptic drugs I:
Treatment of new onset epilepsy. Neurology 62:1252-1260.
Garg SK, Gupta MC, Handu SS,Bhargava VK. (2000) Therapeutic drug monitoring of
antiepileptic drugs- a preliminary experience. Indian J pharmacol. 48: 28-30.
Getie M, Gebre-Mariam T. (1998) In vitro comparative evaluation of some tablets available
in drug retail outlets of Addis Ababa: physical properties, content uniformity, and dissolution
profiles. Eth Pharm J.16: 22-4.
Gladigau V, Gebhardt U. (1978) In vitro and in vivo investigations with different
nitrofurantoin formulations. Arzneimittel forschung. 28: 1771-8.
Gogtay, Kshirsagar, Dalvi. (1999) Therapeutic drug monitoring in a developing country: an
overview BJCP. 48: 649.
Gordon MS, Chowhan ZT. (1987) Effect of tablet solubility and hygroscopicity on
disintegrant efficiency in direct compression tablets in terms of dissolution. J Pharm Sci.76:
907-9.
Gordon MS, Rudraraju VS, Dani K, Chowhan ZT. (1993) Effect of the mode of super
disintegrant incorporation on dissolution in wet granulated tablets. J Pharm Sci. 82: 220-6.
Guidance for industry, Drug metablolism/Drug interaction studies in the development
process: Studies in vitro, US Food and drug administration center for drug evaluation and

57
research center for biological evaluation and research, 1997.
http://www.fda.gov/cder/guidance.htm
Hartely R, Aleksandrowicz J, Bowmer CJ, Cawood A, Forsythe WI. (1991) Dissolution and
relative bioavailability of two carbamazepine preparations for children with epilepsy. J
pharm pharmacol. 43:117-9.
Hauser WA, Annegers JF, Kurland LT. (1993) Incidence of epilepsy and unprovoked
seizures in Rochester, Minnesota: 1935-1984. Epilepsia 34: 453-68.
Hauser WA, Annegers JF, Rocca WA. (1996) Descriptive epidemiology of epilepsy:
contributions of population-based studies from Rochester, Minnesota. Mayo Clin Proc. 71:
576-86.
Henry R. (2001) The Role of Consanguinity in the Etiology of Epilepsy, Hysteria, Idiocy,
and Imbecility. BJP. 178: 381.
Howard CA, Loyd VA, Nicholas GP. (1999) Pharmaceutical dosage forms and drug delivery
systems. (eds), 7th
edn. Lippincott Williams and Wilkins, New York, pp.203-9.
Huang Y, Khanvilkar KH, Moore AD, Hilliard-Lott M. (2003) Effects of manufacturing
process variables on in vitro dissolution characteristics of extended-release tablets formulated
with hydroxypropyl methylcellulose. Drug Dev Ind Pharm.29: 79-88.
Iranloye TA, Parrott EL. (1978) Effects of compression force, particle size, and lubricants on
dissolution rate. J Pharm Sci.67: 535-9.
Irem Y, Sema C, Yılmaz C. (2000) Quality Control of Conventional and Controlled -
Release Carbamazepine Tablets Available in Turkish market. http://yunus.hacettepe
.edu.tr/~scalis/Abstract/SC26.htm.

58
James IW. (1996) Tablet Testing. In: Encyclopedia of pharmaceutical Technology. James S,
James CB. (eds), Vol 14, Marcel Dekker, Inc., New York. pp.411-2.
Joel GH, Lee EL, and Goodman Gilman A. (2001) Goodman and Gilmal’s. The
Pharmacological basis of therapeutics. (eds), 10th
edn., McGraw-Hill Companies Inc., New
York.. pp.531-3.
John FW. (2002) Primary standardization of assays for Anticonvulsant drugs: comparison of
accuracy and precision. Clin chem. 48: 1963-9.
Johnson JR, Wang LH, Gordon MS, Chowhan ZT. (1991) Effect of formulation solubility
and hygroscopicity on disintegrant efficiency in tablets prepared by wet granulation, in terms
of dissolution. J Pharm Sci.80: 469-71.
Jollow DJ and Brodie BB. (1972) Mechanisms of drug absorption and a drug solution.
Pharmacology 8: 21-32.
Karasulu HY, Ertan G, Kose T, Guneri T. (1996) In vivo/in vitro correlations of
nitrofurantoin matrix tablet formulations. Eur J Drug Metab Pharmacokinet.21: 27-31.
Khan KA, Rooke DJ. (1976) Effect of disintegrant type upon the relationship between
compressional pressure and dissolution efficiency. J Pharm Pharmacol 28: 633-6.
Kotsopoulos IA, van Merode T, Kessels FG, de Krom MC, Knottnerus JA. (2002)
Systematic review and meta-analysis of incidence studies of epilepsy and unprovoked
seizures. Epilepsia.43:1402-9.
Kovacs I, Hadady KK, Darbai MJ. (1980) Application of content uniformity test to tablet
preparations. Pharmazie.35: 609-12.

59
Kwan P, Brodie MJ. (2000) Early Identification of refractory Epilepsy. N Engl J Med
342:314-9.
Lachman L, Schwarts JB. (1990) Pharmaceutical dosage forms, Tablets. (eds), 2nd
edn.,
vol.2, Marcel Dekker, Inc. USA. pp 201-25, 246-313, 349-570.
Lake OA, Olling M, Barends DM. (1999) In vitro/ in vivo correlations of dissolution
data of carbamazepine immediate release tablets with pharmacokinetic data obtained in
healthy volunteers. Eur J Pharm Biepharm. 48: 13-9.
Lawrence XY, Christopher DE, Dale PC, Larry JL and Ajaz SH. (2001) Influence of drug
release properties of conventional solid dosage forms on the systemic exposure of highly
soluble drugs, AAPS Pharm Sci. 3: 115-23.
Lawrence XY, Jin TW, Ajaz SH. (2002) Evaluation of USP apparatus 3 for dissolution
testing of immediate release products. AAPS Pharm Sci .4:1-5.
Lazowski J, Lypka A, Zadrozynka E, Pakszys W. (1978) Evaluation of the bioavailability of
polfa phenytoin tablets. Euro J Clin Pharmacol. 9: 251-5.
Lopez-Solis J, and Villafuerte-Robles L. (2001) Effect of disintegrants with different
hygroscopicity on dissolution of norfloxacin /pharmatose DCL11 tablets. Int. J. pharm. 216:
127-216.
Mandal TK. (1996) Effect of tablet integrity on the dissolution rate of sustained-release
preparations. J Clin Pharm Ther. 21:155-7.
Matsuda Y, Akazawa R, Teraoka R, Otsuka M. (1994) Pharmaceutical evaluation of
carbamazepine modifications: comparative study for photostability of carbamazepine
polymorphs by using Fourier-transformed reflection-absorption infrared spectroscopy and
colorimetric measurement. J Pharm Pharmacol. 46:162-7.

60
Mendes RW, Masih SZ, Kanumuri RR. (1978) Effect of formulation and process variables
on bioequivalency of nitrofurantoin I: preliminary studies. J Pharm Sci.67: 1613- 6.
Mervyn JE, John HT.(1989) Anticonvulsant therapy pharmacological basis and practice.
(eds), 3rd
edn., Churchill Livingstone, London, pp.41-5.
Meyer MC, Straugh AB, Mhatre RM, Shah VP, Williams RL, Lesko LJ. (1998) The relative
bioavaiability and in vivo-in vitro correlations for four marketed carbamazepine tablets.
Pharm Res 15:1787-91.
Meyer MC, Straughn AB, Jarvi EJ, Wood GC, Pelsor FR, Shah VP.(1992) The
bioinequivalence of carbamazepine tablets with a history of clinical failures. Pharm
Res.9:1612-6.
Meyer MC, Straughn AB, Raghow G, Schary WL, Rotenberg KS. (1984) Absorption of
Phenobarbital tablets from tablets and elixirs. J pharm Sci. 73: 485-8.
Michael AO, Olajire AA, Remilekum BA, Oluwatoyin AO and Oludele AI. (2003)
Comparative analysis 0f eight brands of sulfadoxine-Pyrimethamine tablets. Trop J pharm
Res.2: 161–7.
Morselli PL, Gerna M, De Maio D, Zanda G, Viani F, Geraffin S. (1975) Pharmacokinetic
studies on carbamazepine in volunteer and in epileptic patients. In: Clinical pharmacology of
antiepileptic drugs. Schneider H, Janz D, Gardner TC, Meinardi H, Sherwin AL (eds)
Springer, Berlin, pp.166-79.
Naggar VF, Shams-Eldeen MA. (1980) A study of the effect of some drugs on the
dissolution rate of nitrofurantoin. Pharmazie 35: 550-2.

61
National Pharmaceutical Control Bureau (NPCB) of Malasia, Berita Ubat-ubatan. (1999)
Overview of Regulatory Quality Control. http://www.bpfk.gov.my/versibm/berita%20-
%20berita/June%201999%20overview.htm.
Neuvonen PJ, Pentikainen PJ, Elfbing SM. (1977) Factors affecting the bioavailability
of phenytoin. Int J clin pharmacol Biopharm. 15: 84-9.
Olafsson E, Hauser WA, Ludvigsson P, Gudmundsson G. (1996) Incidence of epilepsy in
rural Iceland: a population-based study. Epilepsia 37: 951-955.
Oluka MO, Mitema ES, Kibwage IO, Kwasa TO, Kokwaro GO. (1996) A comparative
bioavailability of four Carbamazepine tablet formulations available in the Kenyan market.
East Afr Med J. 73:323-6.
Oluwatoyin AO and Oludele AI. (2003) Effects of interacting variables on the tensile
strength and the release properties of paracetamol tablets. Trop J Pharm Res 2: 147 - 153.
Patsalos PN. (1999) Therapeutic drug monitoring in epilepsy (part I). Ann clin biochem
36:10-19.
Rang HB, Dale MM, Ritter DM. (2002) Pharmacology. (eds), 4th
edn, Churchill Livingstone,
London, pp. 566-78.
Reidberg MM., Connors BA. (2001) Counterfeit and substandard drugs, Clin Pharmacol
Ther.69: 189-93.
Revankar SN, Desai ND, Bhatt AD, Bolar HV, Sane SP, Gupta C, Kamat DV. (1999)
Comparison of absorption rate and bioavailability of two brands of carbamazepine. J Assoc
Physicians India.47: 699-702.

62
Richard E. (2002) Seizure-related Injuries in Children with Newly Diagnosed and
untreated Epilepsy. Epilepsia 43:764.
Risha PG, Vervaet C, Vergote G, Bortel LV, Remon JP. (2003) Drug formulations intended
for the global market should be tested for stability under tropical climatic conditions. Eur J
Clin Pharmacol. 59: 135–41.
Robert JC, Linda MS, Peter CM. (1998) Pharmaceutical care practice. (eds), McGraw Hill,
New York, pp.99, 113.
Robert T. (2001) Fake and poor quality drugs common in less developed countries, The
Lancet. p1948.
Rockville MD. (1994) Approved Drug products with therapeutic equivalence evaluations,
14th
ed. FDA, Center for drug evaluation and research.
Roth HJ, Eger K, Tzoschütz R. (1981) Pharmaceutical Chemistry II, Drug Analysis
(Reactivity, Stability and Analysis), Thieme Verlug, pp.223, 565.
Saavedra I, Passalacqua A, Chavez H, Biagini L, Galdames D. (1990) Carbamazepine: the
bioavailability of 4 oral pharmaceutical products. Rev Med Chil. 118:1123-8.
Sang HL, Ming L, and Jung KS. (2003) Determination of carbamazepine by
chemiluminescence detection using chemically plcpared tris (2, 21 - bipyrixine)- ruthenium
(III) as oxidant. Analytical sciences 19:903-6.
Shah AC, Meodozeniec AR. (1977) Mechanism of lubrication: Influence of duration of
lubricant-excipient mixing on processing characters of powders and properties of compressed
tablets. J pharm Sci. 66:1377-8.

63
Shah NH, Carvajal MT, Patel CI, Infeld MH, Malick AW. (1994) Self-emulsifying drug
delivery systems with polyglycolyzed glycerides for improving in vitro dissolution and oral
absorption of lipophilic drugs. Int J.Pharm. 106: 7-14.
Shibru B, Martin P. (2004) Treatment of Epilepsy in Rural Ethiopia: 2 Year Follow-up
Ethiop. J. Health Dev18:31-4.
Shibru B, Shitaye A, Jilalu A, Martin P. (2002) Primary care treatment of epilepsy in Rural
Ethiopia. Ethiop.J.Health Dev16:235-40.
Soryal I, Richens A. (1992) Bioavailability and dissolution of proprietary and generic
formualtions of phenytoin. J Neurol Neurosurg paychiatry. 55: 688–91.
Souto C, Gomez-Amoza JL, Landin M, Vila-Jato JL, Concheiro A, Martinez-Pacheco R.
(1989) Use of the crushing strength parameter for quality control of phenobarbital-
microcrystalline cellulose tablets. Farmaco.44: 731-7.
Stewart MJ, Ballinger BR, Delvin EJ, Miller AY, Ramsay AC. (1975) Bioavailabilty of
phenytoin. A comparison of two preparations. Euro J Clin pharmacol. 9: 209-12.
Summary report for 1984 SPD SOP. (1985) Therapeutic drug monitoring. Report of 389
laboratories on premidone, US. Department of Health and Human Services, CDC, Atlanta,
GA.
Szabo-Revesz P, Pintye-Hodi K, Miseta M, Selmexzi B, Kedvessy G, Traue J, Kala H,
Wenzel U. (1987) The polymorphism of drugs in powders and tablets. The effect of
polymorphism of drugs on the physical properties and release of phenobarbital tablets.
Pharmazie 42: 179-81.
Tekle-Haimanot R, Forsgren L, Ekstedt J. (1997) Incidence of epilepsy in rural central
Ethiopia. Epilepsia 38: 541-6.

64
Tekle-Haimanot R,, Abebe M, Gebre Mariyam, A. (1991) Community based study of
neurological disorders in rural central Ethiopia, Neuroepidemiology 9: 263-77.
The european agency for the evaluation of medicinal products veterinary medicines
evaluation unit. (1999) Development of pharmaceuticals for veterinary medicinal
products. EMEA/CVMP/315/98.
The European Agency for the Evaluation of Medicinal products, Evaluation of medicines for
human use. (1999), London. CPMP/ICH/367/96Corr.
The International Pharmacopoeia (IP) 2003, Vol.5, 3rd
edn., WHO, Geneva.
The United States Pharmacopoeia XXVII. (2004) The United States Pharmacopoeial
convention, Inc. Bethesda, MD, USA.
The United States Pharmacopoeial convention (2004) Drug quality report matrix of USAID-
assisted countries by the US Pharmacopoeia drug quality and information (USP-DQI)
program, Washingtone DC, USA.
Therapeutic goods administration (TGA). Therapeutic goods act (1989). Therpeutic goods
order no 56. General standards for tablets, pills and capsules.
Wang JT, Shiu GK, Ong-Chen T, Viswanathan CT, Skelly JP. (1993) Effects of humidity
and temperature on in vitro dissolution of carbamazepine tablets. J Pharm sci. 82: 1002-5.
Welling PG. (1991) In vitro methods to determine Bioavailabiltiy. In: In vitro - in vivo
corellations, in pharmaceutical Bioequivalence, Welling PG, Tse FLS, Dighe SV. (eds),
Marcel Dekker, Inc., New York, pp.225-32.
World Health Organization Media Center Fact Sheet No 165 (2001) Epilepsy: Aetiogy,
Epidemiology and Prognosis. http://www.who.int/mediacentre/factsheets/ fs165/en/.

65
World Health Organization. (1992) Counterfeit drugs: Report of a joint WHO/IFPMA
workshop. WHO/DMP/CFD/92.
World Health Organization. (1999) Counterfeit and Substandard drugs in Mayanmar and
Vietnam, Report of a study carried out in cooperation with the governments of Mayanmar
and Vietnam.. WHO/EDM/QSM/99.3.
World Health Organization. (1999) Guidelines for the development of measures to combat
counterfeit drugs, Department of Essential drugs and other medicines, WHO, Geneva,.
WHO/EDM/QSM/99.1.
Yamamoto CH, Pinto TJ, Alves MS. (2000) Dissolution evaluation of marketed
teteracyclines solid oral dosage forms. Boll chim farm. 139: 81-4.
Yau MK, Meyer MC. (1981) In vivo-in vitro correlations with a commercial dissolution
simulator. I: Methenamine, nitrofurantoin, and chlorothiazide. J Pharm Sci.70: 1017-24.
Yunxi BI, Sunada H, Yonexawa Y, Danjo K, and Iida K. (1996) Preparation and evaluation
of a compressed tablet rapidly disintegrating in the oral cavity. Chem. Pharm. Bull 44: 2121-
7.

66
ANNEX
The UV Spectrophotometric Spectra of Carbamazepine working standard; Phenobarbital
reference standard; Carbamazepine in the tablets of Tegretol, Tegral, Taver; and
Phenobarbital in the generic tablets of Epharm PhB, East Africa Pharmaceuticals PhB and
the Cadila PhB are depicted below. In addition here attached is the potentiometric titration
curves of the investigated generic tablet formulations of Phenobarbitone.
1. UV Spectrum of Carbamazepine working standard
2. UV Spectrum of Phenobarbital reference standard
3. UV Spectrum of Carbamazepine in Tegretol tablets
4. UV Spectrum of Carbamazepine in Tegral tablets
5. UV Spectrum of Carbamazepine in Taver tablets
6. UV Spectrum of Phenobarbital in Epharm PhB generic tablets
7. UV Spectrum of Phenobarbital in East Africa Pharmaceuticals PhB generic tablets
8. UV Spectrum of Phenobarbital Cadila PhB generic tablets
9. The potentiometric titration curve of Epharm PhB
10. The potentiometric titration curve of East Africa Pharmaceuticals PhB
11. The potentiometric titration curve of Cadila PhB

67
Annex 1. UV Spectrum of Carbamazepine working standard

68
Annex 2. UV Spectrum of Phenobarbital reference standard

69
Annex 3. UV Spectrum of Carbamazepine in Tegretol tablets

70
Annex 4. UV Spectrum of Carbamazepine in Tegral tablets

71
Annex 5. UV Spectrum of Carbamazepine in Taver tablets

72
Annex 6. UV Spectrum of Phenobarbital in Epharm PhB generic tablets

73
Annex 7. UV Spectrum of Phenobarbital in East Africa Pharmaceuticals PhB generic tablets

74
Annex 8. UV Spectrum of Phenobarbital Cadila PhB generic tablets

75
Annex 9. The potentiometric titration curve of Epharm PhB

76
Annex 10. The potentiometric titration curve of East Africa Pharmaceuticals PhB

77
Annex 11. The potentiometric titration curve of Cadila PhB