business jacket design: preferences of working women
183
BUSINESS JACKET DESIGN: PREFERENCES OF WORKING WOMEN by SEULHEE YOG, B.H.E., M.S. A DISSERTATION IN CLOTHING, TEXTILES, AND MERCHANDISING Submitted to the Graduate Faculty of Texas Tech University in Partial Fulfillment of the Requirements for the Degree of DOCTOR OF PHILOSOPHY Approved Accepted December, 1999
-
Upload
khangminh22 -
Category
Documents
-
view
2 -
download
0
Transcript of business jacket design: preferences of working women

BUSINESS JACKET DESIGN: PREFERENCES
OF WORKING WOMEN
by
SEULHEE YOG, B.H.E., M.S.
A DISSERTATION
IN
CLOTHING, TEXTILES, AND MERCHANDISING
Submitted to the Graduate Faculty of Texas Tech University in
Partial Fulfillment of the Requirements for
the Degree of
DOCTOR OF PHILOSOPHY
Approved
Accepted
December, 1999

ACKNOWLEDGMENTS
This dissertation could not have been accomplished without the benefit
of cooperative and collaborative efforts of my research committee members
and their timely encouragement and support. Although language is an
insufficient means to convey my gratitude toward each member of the
committee, I would like to thank and acknowledge each member's contribution
to this research.
I am so grateful to my committee chair. Dr. Denise Bean, who provided
me with consistent help from the proposal development to the completion of
this research. Considering her responsibilities as a fashion design program
coordinator, a teacher, and a researcher, it could net have been easy to take
on the responsibilities of a doctoral committee chair and spend extra hours
working en this project. I will always appreciate her guidance and support for
this project, and passion for teaching and learning.
A warm and a very special thank you to Dr. JoAnn Shroyer, the
department chair, for taking en the responsibilities of committee co-chair when
she was tied up with ether departmental duties. I married and had a child
during my graduate work at Texas Tech University, and Dr. Shroyer has been
a great role model in balancing work and family. I will always appreciate her
mother-like guidance, encouragement, and support. I especially want to thank

her for the graduate assistantshlps and scholarships, which have been of
immense help for me to complete my doctoral studies.
A special acknowledgment goes to Dr. Shelley Harp. Her extensive
knowledge in retail management and merchandising, data collection
techniques, and research instrument evaluation has been of great assistance.
Her uncanny ability for detail minimized sampling and measurement error
during the data collection process. In addition, I would like to thank Dr. Harp
and the Leather Research Institute for providing a graduate fellowship during
the summer of 1999. The fellowship covered a considerable portion of the
data collection expenses. I am also thankful to Jill Blacksteck at LRI for her
personal support.
My sincere appreciation is extended to Dr. Peter Westfall for his
interest in this project and willingness to serve as a committee member. His
insight and leadership during the initial development of the project and
contribution during data analysis has been imperative for the completion of the
project.
I am greatly in debt to my mother, Meenja Song, who always expected
more of me than I expected of myself. She set a career goal for me and
guided me into the career path I am in now. I also thank her for providing
personal and financial support, encouragement, and loving advice throughout
my study in the United States. Her role as a friend and a mentor has been
and always will be dear.
ill

I deeply thank my husband, Dr. Jaewook Nam, for his timely support
and patience In putting up with me and taking care of our daughter, JoAnn, for
many nights and weekends without complaint. Without his help, I would never
have been able to accomplish this goal. I am very lucky to have him as my
lifelong companion. We will cherish all the memories we had at Texas Tech
as long as we live.
I could not have dene this feat without the smile of my little JoAnn, the
greatest gift from God. A big hug and kiss from her has been an essential
part of my daily life, bringing me much joy and happiness.
Finally, I am grateful to my Father in heaven for all of his gracious
blessings. As can be seen. He provided many people to shape and guide me.
I humbly dedicate this achievement to Him. Thank you!
IV

TABLE OF CONTENTS
ACKNOWLEDGMENTS ii
ABSTRACT , viii
LIST OF TABLES x
LIST OF FIGURES xi
CHAPTER
I. INTRODUCTION 1
Statement of the Problem 4
Purpose of the Study 5
Hypotheses 6
Limitations 8
Definition of Terms 8
II. REVIEW OF LITERATURE 12
Women in the Workforce and Consumer Behavior 12
Profile of Women's Labor Force Participation 13
Impact of Women's Employment on Consumer Behavior 17
The Role of Clothing for Working Women 24
Aesthetics and Consumer Behavior 26
Consumer Aesthetic Evaluation 28
Fashion and Aesthetics 30

Elements Fundamental to Aesthetic Quality of Apparel 31
Individual Differences and Aesthetic Preferences 35
Summary 43
III. METHODOLOGY 45
Proposed Research Model 45
Research Design 46
Selection of Sample 50
Research Instruments 51
Visual Stimuli 52
The Questionnaire 57
Pilot Test 60
Collection of Data 61
Variables for the Study 62
Statistical Analysis of Data 71
IV. RESULTS 72
Reliability of the Scales 74
Description of the Sample 76
Analysis of Hypotheses 108
Summary of the Findings 128
V. SUMMARY, CONCLUSIONS, AND RECOMMENDATIONS 133
Summary of the Study 133
Summary of the Findings 135
vi

Profile of the Respondents 135
Hypotheses Testing 138
Conclusions and Implications 139
Recommendations for Further Research 142
REFERENCES 143
APPENDICES 153
A. QUESTIONNAIRE 153
B. PRELIMINARY POSTCARD 165
C. MONEY ORDER ENTRY FORM 167
D. FOLLOW-UP POSTCARD 169
VII

ABSTRACT
Consumer evaluation of apparel is believed to be affected by three
factors: the aesthetic quality of apparel, personal characteristics of the viewer,
and the environment. The majority of empirical studies document design
factors influencing the aesthetic quality of apparel. A limited number of
investigations have focused on individual characteristics of the viewer. Since
individual subjectivity may influence the aesthetic evaluation process, this
research investigated consumer characteristics in relation to aesthetic
preference of apparel, the business jacket in particular.
A national cross-section of 1,500 working women was drawn for the
study through a random sampling technique by National Demographics &
Lifestyles. Nine hypotheses were formulated to address the relationships
between consumer design preference and: (a) design attributes, (b) personal
characteristics, (c) psycho-social identity, (d) job-speclfic-situational
characteristics, and (e) physical characteristics. The research instrument
consisted of two parts: visual stimuli and a self-administered questionnaire.
Visual stimuli were 18 black-and-white computer-generated drawings of
business jackets developed to measure design preference. The questionnaire
assessed design attributes and preferences utilizing Likert-type scales
adapted from previous investigations. Questions were developed to
determine physical characteristics, demographics, and consumer
viii

characteristics. Dillman's mail survey technique was utilized for collection of
the research data. The final data base was comprised of 265 female
respondents who wore business jackets to work at least once a week.
Significance was identified through the use of repeated measures of
analysis of variance with an unstructured covariance matrix, as fit by PROG
MIXED of SAS/STAT®. The denominator degrees of freedom for conducting
the F-tests of hypotheses used Satterthwaite Approximation.
Jacket length, pattern, silhouette, neckline drop, and collar styles were
found to be significant. The significant interactions were: jacket length and
pattern, jacket length and collar style, jacket pattern and silhouette, jacket
pattern and neckline drop, jacket silhouette and collar style, jacket neckline
drop and collar. None of the personal characteristics were found to be
significant. However, three interactions were significant: age and jacket
pattern, age and jacket silhouette, and ethnicity and jacket length. Ability to
modify self-presentation and overall self-monitoring were also found to be
significant including two interactions: self-monitoring and jacket collar style,
and ability to modify self-presentation and jacket collar. None of the job-
speclfic-situational characteristics or interactions were found to be significant.
Figure type was significant. The interactions between figure type and jacket
silhouette, figure type and jacket neckline drop, and figure type and jacket
collar style were significant.
IX

LIST OF TABLES
1. Labor Force Participation Rates of Married Women with Husband Present: 1960 to 1996 (by percentage) 14
2. Labor Force Participation Rates of Married Women by Age of Children: 1960 to 1996 (by percentage) 14
3. Illustration of Possible Jacket Design Combinations Using 5 Attributes with 3 Levels 54
4. Eighteen Jacket Design Combinations Formulated Using Orthogonal Fractional Factorial Design Catalog Developed by Hahn and Shapiro (1966) 55
5. Correlation Among Five Design Attributes Using 18 Jacket Design Combinations by 3 Orthogonal Fractional Factorial Experimental Design 56
6. Comparison of Instrument Reliability of Current Study to
Peterson (1994) 75
7. Personal Characteristics of Working Women 78
8. Business Jacket Purchase and Consumption Behavior 89
9. Psycho-Social Identity 96
10. Job-Specific Situational Characteristics of Working Women 100
11. Job-Specific Situational Characteristics of Working Women: Corporate Culture 101
12. Physical Profile of Working Women 104
13. Means and Standard Deviation of Business Jacket Design Preference 106
14. Summary of Canonical Correlation Analysis 107

LIST OF FIGURES
1. Sproles' General Model of the Consumer's Fashion Adoption Process 47
2. Proposed Research Model: Consumer Aesthetic Preference in Relation to Personal Characteristics, Psycho-Social Identity, Job-Specific Situational Characteristics, and
Physical Profile 48
3. Hypotheses and Variables 73
4. Age Distribution of the Respondents 81
5. Educational Attainment of the Respondents 82
6. Marital Status of the Respondents 83
7. Employment Status of the Respondents 84
8. Career Orientation of the Respondents 84
9. Presence of Career Objectivity of the Respondents 85
10. Occupation of the Respondents 85
11. Geographic Location of the Respondents 86
12. Ethnic Background of the Respondents 86
13. Household Size of the Respondents 87
14. Number of Children of the Respondents 87 15. Financial Contribution of the Respondents to the Total
Household Income 88
16. Frequency of Wearing Business Jacket Per Week 92
17. Season During Which Business Jackets Are Worn Most Frequently by the Respondents 92
XI

18. Number of Jackets In Inventory 93
19. Apparel Items Most Frequently Worn with Jackets by the Respondents 93
20. Garment Set with which Business Jacket is Most Frequently Purchased by the Respondents 94
21. Preferred Retail Store Type for Purchasing Professional Apparel by the Respondents 94
22. Payment Type Used for Purchasing Professional Apparel by the Respondents 95
23. Percentage of the Total Household Income Spent on Professional Apparel Annually by the Respondents 95
24. Illustration of Canonical Correlation 109
25. The Interaction Effect between Jacket Length and Jacket pattern 114
26. The Interaction Effect between Jacket Length and Jacket Collar Style 114
27. The Interaction Effect between Jacket Pattern and Jacket Silhouette 116
28. The Interaction Effect between Jacket Pattern and Jacket Neckline Drop 116
29. The Interaction Effect between Jacket Silhouette and Jacket Collar Style 118
30. The Interaction Effect between Jacket Neckline Drop and
Jacket Collar Style 118
31. The Interaction Effect between Jacket Pattern and Age 121
32. The Interaction Effect between Jacket Silhouette and Age 121
33. The Interaction Effect between Jacket Length and Ethnicity 124
XII

34. The Interaction Effect between Jacket Collar Style and Self-Monitoring 124
35. The Interaction Effect between Jacket Collar Style and Ability to Modify Self-Presentation 129
36. The Interaction Effect between Jacket Silhouette and Figure Type 129
37. The Interaction Effect between Jacket Neckline Drop and Figure Type 130
38. The Interaction Effect between Jacket Collar Style and Figure Type 130
XIII

CHAPTER I
INTRODUCTION
The number of women entering the work force has steadily increased
over the last two decades. Since 1980, the proportion of working women
(51.2%) has exceeded non-working women (Norwood, 1980). In 1996,
approximately sixty percent of all women sixteen years of age and over were
labor force participants (U.S. Bureau of the Census, 1997). As more women
join the work force, many popular press and empirical studies have addressed
this phenomenon in regard to clothing practices, perception of professional
image, clothing consumption and information search patterns, shopping
orientations, daily wardrobe selection, and apparel evaluation criteria of
employed women (Cassill & Drake, 1987; Dillon, 1980; Ericksen & Sirgy,
1985; Forsythe, Butler, & Schaefer, 1990; Forsythe, Drake & Cox, Jr, 1984;
Kelley & Anselmo, 1977; Kelley, Blouin, Glee, Sweat & Arledge, 1982;
Kundel, 1976; Rabolt & Drake, 1984-85; Rabolt & Drake, 1985; Shim & Drake,
1988; Solomon & Douglas, 1985; Sweat & Zentner, 1985; Thurston, Lennon,
& Clayton, 1990).
The focus of this study was to assess the differences in business jacket
design preferences of working women. In addition, relationships among four
types of characteristics were investigated in relation to the design differences:

(1) personal, (2) psycho-social, (3) job-specific situational, and (4) physical.
The business jacket was chosen as a sole representation of business attire,
because the jacket has been considered the hallmark of American business
women, serving the same functions for women as business suits do for men
(Molloy, 1996). According to the survey conducted by Molloy, a majority of
business men and women (93% and 94%, respectively), no matter what they
themselves were wearing, assumed that women wearing jackets outranked
women without jackets.
Today the workplace is more informal. A climate of informality is
viewed as central to corporate culture. Proponents claim that such a climate
can boost employee morale, creativity, and even overall performance
(David, 1988; Deirdre, 1998). The jacket has easily joined the current trend in
business casual attire due to its versatility and the ease of putting it on and
taking it off.
Traditionally, clothing has been viewed as a utilitarian product that has
evolved into a medium for expressing individual creativity and taste as well as
conforming to the preferences of a society or reference group
(Eckman, 1992). The majority of research on clothing has been directed at
identifying characteristics of clothing popular at various points in time, and
studying the influence of social, psychological, and economic factors on
clothing choices. Since Holbrook (1981) and Sproles (1981b) first suggested

that research should focus on aesthetic attributes of products (e.g., color, line,
silhouette, or fabric) and how aesthetic preferences for clothing are formed,
many researchers have specifically studied how consumers evaluate design
elements and how these elements interact to form a complete image of a
garment in the consumer's mind (Eckman, 1992, 1997; Eckman, Damhorst &
Kadolph, 1990; Holbrook, 1986; Holbrook & Dixon, 1985; Morganosky &
Postlewait, 1989). These studies confirmed the notion that aesthetic
attributes are key factors in consumption behavior and are a significant
influence in the selection and purchase of apparel.
An understanding of consumer aesthetic preference is essential for
efficient communication among consumers and decision makers in the textile
complex. First, consumers can benefit from such knowledge by being able to
purchase clothes that best meet their needs and wants with minimal
expenditure of time, money, effort, and psychological costs. Second, the
identification and description of female consumers' preferred styles can help
designers and retailers match consumers' needs and wants with regard to
design. Third, understanding the consumers' style evaluation process may
also help designers and retailers develop strategies to facilitate the
acceptance of designs and product assortments. Finally, retailers can make
effective, economical, and efficient buying decisions by knowing generally
preferred design characteristics such as particular colors, silhouettes, or lines.

statement of the Problem
Clothing plays an important role in women's lives, especially working
women. It not only serves a protective purpose but meets a variety of social
and psychological needs. Generally, people have a strong desire for
self-enhancement. Appearance, including Individual body characteristics and
clothing, affects the way Individuals feel about themselves. Appearance also
projects an Individual's self-image (Humphrey, Klaasen & Creekmore, 1971;
Kersch, 1984). Clothing that projects a professional image may also reinforce
a woman's self-confidence and feeling of competence in the job, thus leading
to improved work performance (Solomon & Douglas, 1985).
The framework, proposed by Sproles (1979), illustrates the consumers'
fashion adoption process, modeling how fashion-oriented consumers make
decisions based on the information-processing paradigm. Information-
processing paradigm refers to a systematic process by which a stimulus
(e.g., fashion products) is received, interpreted, stored in memory, and later
retrieved (Engel, Blackwell, & Miniard, 1993). Sproles' model of fashion
adoption process, along with other early theoretical works on fashion,
provides a good base for the development of fashion theory (Eckman, 1997).
Several researchers (Eckman, 1992/1997; Holbrook, 1981; Sproles,
1979) have suggested that preference for a fashion object such as clothing,
results from a complex combination of factors. Within the fashion object.

preference may be formed by each design element that creates the object
(e.g., color, silhouette, line, and fabrication). When consumer behavior is
analyzed during the fashion process, interacting forces surrounding
consumers, such as consumer demographics, psycho-social motivation,
consumer physical profiles, and job-specific characteristics, may affect
consumer preferences. Although many researchers agree on the notion that
aesthetic attributes are key factors in consumer consumption behavior
including apparel purchase and selection, it is not conclusive which factors are
the most influential on the consumer's decision-making process. Design
attributes such as line, color, silhouette, and fabric, are important, but
consumer characteristics such as psycho-social motivation and physical
characteristics are important as well. Therefore, research on consumer
aesthetic evaluation process and formation of aesthetic preference should
include both product characteristics and consumer characteristics.
Purpose of the Study
The purpose of this study was to assess the differences in the business
jacket design preferences of working women. In addition the study
investigated whether, and to what degree, selected variables affected the
business jacket design preferences of working women. The objectives of the
study were:

1. to assess business jacket design details (e.g., line, silhouette, fabric,
style, etc.) that affect aesthetic evaluation of working women in clothing
choices;
2. to assess personal characteristics (e.g., age, marital status,
education, income, clothing expenditure, ethnicity, and occupation, etc.) that
affect the business jacket design preferences of working women;
3. to assess psycho-social characteristics (e.g., self-confidence,
perceived importance of clothing, self-monitoring, and employment
orientation, etc.) that affect the business jacket design preferences of working
women;
4. to identify physical characteristics (e.g., body weight, body height,
body silhouette, eye color, and hair color, etc.) that affect the business jacket
design preferences of working women;
5. to identify the job-speclfic-situational characteristics (e.g., visibility to
superiors and public. Implicit dress code, length of time in career, etc.) that
affect the business jacket design preferences of working women.
Hypotheses
In order to accomplish the objectives of the research, the following
hypotheses were generated:
Hia. Jacket length affects the subjects' business jacket design preference.

Hib. Jacket pattern affects the subjects' business jacket design preference.
Hie. Jacket silhouette affects the subjects' business jacket design
preference.
Hid. Jacket neckline drop affects the subjects' business jacket design
preference.
Hie. Jacket collar style affects the subjects' business jacket design
preference.
H2. The personal characteristics of the subjects affect the subjects'
business jacket design preference.
H3. The psycho-social characteristics of the subjects affect the subjects'
business jacket design preference.
H4. The job-specific-situatienal characteristics of the subjects affect the
subjects' business jacket design preference.
H5. The physical characteristics of the subjects affect the subjects'
business jacket design preference.

Limitations
This research was based on the following limitations:
1. In judging the attractiveness of jacket designs, subjects evaluated
the given alternatives in terms of design elements, and integrated visual
evaluations of each design element. Subjects' preferences were based on
complex tradeoffs among the alternatives.
2. The visual presentation of jacket designs to subjects was not
identical but similar to the decision-making environment of the market place in
which consumers' actual evaluation takes place.
3. The jacket design details selected in the study did not include
infinite numbers of all possible jacket design combinations but did represent
available alternatives in the current retail market.
4. The term "career women" or "working women" used in this study
was limited to working women who wear business jackets to work at least
once a week.
Definition of Terms
This research was based on the following definitions:
Aesthetic Evaluation: Appraisal of aesthetic quality of a product
(Flore & Kimie, 1997).
8

Aesthetic Experience: "The sensitive selection or appreciation of
formal, expressive, or symbolic qualities of the product or environment,
providing non-instrumental benefits that result in pleasure or satisfaction"
(Fiore & KimIe, 1997, p. 4).
Aesthetic Preference: Comparative evaluation of aesthetic quality of a
product or environment against others. Favorable judgment of one aesthetic
product or environment over other options (Fiore & KimIe, 1997).
Career-Oriented Working Women: Women who consider their work a
career. Women in management, executive sales or other positions where
there is the desire to advance one's career (Rabolt, 1984). In this study, the
terms, career women, business women, and professional women have been
used interchangeably.
Clothing Fashion: "A clothing fashion is a style of dress that is
temporarily adopted by a discernible proportion of members of a social group,
because that chosen style is perceived to be socially appropriate for the time
and situation" (Sproles, 1979, p.5).
Clothing Involvement: A person's perceived relevance of clothing
based on inherent needs, values, and interests (Zaichkowsky, 1985).
Consumer Behavior: All activities involved in acquiring, using, and
disposing of products (Holbrook, 1987).

Design Elements: Visual definers that provide perceptual definition to
parts of the visual form (DeLong, 1987). A design is a unique combination of
silhouette, construction, fabric, and details that distinguishes a single object
from all other objects of the same class (Sproles, 1979). In this study, design
attributes and aesthetic attributes have been used interchangeably.
Diffusion: The spread of an innovation within and across social
systems. It is a process in which many people decide to adopt an innovation
(Rogers, 1962).
Implicit Dress Code: Dress expectations that management sets by
implication rather than by explicit writing (Rabolt, 1984).
Information Processing Paradigm: refers to a systematic process by
which a stimulus is received, interpreted, stored in memory, and later
retrieved. The information processing paradigm can be broken down into five
basic stages: exposure to a stimulus, attention to the incoming stimulus,
comprehension of the stimulus, acceptance of the stimulus, and retention of
the stimulus (Engel, Blackwell, & Miniard, 1993).
Information Search Pattern: refers to consumers' pattern of gathering
information about products. There are five types of information search
patterns: print-oriented searcher, the audio-visual oriented searcher, the store
intensive searcher, the professional advice searcher, and the pal advice
searcher (Shim & Drake, 1988).
10

"Just a Job" Working Women: Women who consider their work "just a
job."
Length of Time in Career: The length in months or years an individual
has worked in a particular career.
Perceived Importance of Clothing: The degree to which a career
woman believes one's dress operates in positive ways to help advance one's
career or help establish good working relations with others (Rabolt, 1984).
Self-Monitoring: Sensitivity to the self-presentation of self and others,
and use of social cues as behavioral guidelines.
Self-Confidence in Career Dressing: Confidence in one's ability to
dress professionally and according to the given business situation.
Style: A style is a characteristic mode of presentation that typifies
several similar objects of the same class (Sproles, 1979).
Textile Complex: refers to "the industry chain from fiber, to fabric,
through end uses of apparel, interior furnishings, and industrial products"
(Dickerson, 1999, p. 18).
Working Women: The operational definition used for this study included
both career-oriented working women and just-a-job working women who wear
business jackets to work at least once a week.
11

CHAPTER II
REVIEW OF LITERATURE
This chapter presents a review of literature relevant to the study. The
areas reviewed in this section include: (1) women in the work force and
consumer behavior, (2) aesthetics and consumer behavior, and (3) the
summary.
Women in the Workforce and Consumer Behavior
The proportion of women in the labor force have increased dramatically
during the twentieth century, and factors affecting labor force participation
rates have continually changed. Particularly, married women have entered
the labor force in greater numbers since 1970. Women who have never been
married have traditionally had higher employment rates and continue to do so.
In fact, the employment rate of single women currently approximates the
employment rate for men. The dramatic growth of employment rates for
married women has also steadily increased. This increase has been
associated with women's increasing educational attainment and employment
opportunities, an increasing demand for services provided by traditionally
female dominated occupations, changes in family and life patterns, and
changing social norms (Lazer & Smallwood, 1977; Mandelson, 1996).
12

Profile of Women's Labor Force Participation
Before 1900, women made up less than twenty percent of the civilian
labor force, but In 1996 approximately sixty percent of all women sixteen
years of age and over were labor force participants (U.S. Bureau of the
Census, 1997) (refer to Table 1). The most notable changes in the labor force
during this century have been the increasing participation of married women.
Since the 1960s, the labor force participation of younger married women has
increased dramatically (refer to Table 1). In addition, married women with
young children have more than tripled labor force participation to nearly sixty
percent (refer to Table 2).
Goldin (1990) stated that marriage itself has been the determining
factor of women's labor force status for most of U.S. history, because the
majority of women have dropped out of the labor force upon marriage. Some
researchers assume that the proportion of working wives has a lot to do with
the presence and age of children at home. However, statistics do not clearly
support this assumption. Several researchers have hypothesized that the
amount of the husband's earnings has been, in fact, a significant determinant
of whether a wife has been in the labor force (Lazer & Smallwood, 1977;
Bartos, 1977). However, Lazer and Smallwood (1977) suggested that the
determining factors most directly related to female labor force participation has
been higher educational attainment and growing occupational demand for
13

Table 1. Labor Force Participation Rates of Married Women with Husband Present: 1960 to 1996 (by percentage)
Year
1960 1970 1980 1990 1996
Total
31.9 40.5 49.8 58.4 61.2
16-19 years
27.2 37.8 49.3 49.5 48.6
Participatior
20-24 years
31.7 47.9 61.4 66.1 66.0
) Rate by Percentage
25-34 years
28.8 38.8 58.8 69.6 71.7
35-44 years
37.2 46.8 61.8 74.0 75.8
45-64 years
36.0 44.0 46.9 56.5 63.7
65 and over
6.7 7.3 7.3 8.5 9.0
Table 2. Labor Force Participation Rates of Married Women by Age of Children: 1960 to 1996 (by percentage)
Year
1960 1970 1980 1990 1996
Married Women
30.5 40.8 50.1 58.2 61.1
Married Women with
Children
27.6 39.7 54.1 66.3 70.0
Children 6 to 17 only
39.0 49.2 61.7 73.6 76.7
Children under 6
18.6 30.3 45.1 58.9 62.7
14

females. Married women with children between the ages of six and
seventeen had a labor force participation rate of over seventy percent by
1996, negating association between the presence and age of children at
home and the labor force participation of married women (U.S. Bureau of the
Census, 1997).
Nonetheless, according to Mandelson (1996), reasons behind the
remarkable changes of female status in the labor force has not been clearly
identified. Researchers are uncertain whether related factors are the cause or
effect of women's increasing labor force participation. Mandelson agreed on
the notions made by previous researchers. First, higher educational
attainment has been associated with increasing women's labor force
participation. The more education a woman has, the more likely she is to be
in the labor force. This is due to the fact that one can recognize higher returns
of one's educational Investment throughout increasing life spans. Based on
the statistics reported by the U.S. Bureau of Census (1997), the number of
women who joined the labor force upon completion of four or more years of
college education has increased more than twenty percent since 1970.
Approximately sixty-one percent of females joined the labor force in 1970
upon completion of four or more years of college education, while more than
eighty percent of females joined in 1990. Even if it is not certain higher
education attainment is the cause or the effect, there is a strong positive
15

relationship between educational attainment and the increasing labor force
participation of women.
Second, the demand for workers in service, clerical, and other
white-collar areas, which tend to be predominantly female, has increased. It
is natural for women to join the work force when there are more traditionally
female dominant jobs available with less competition from male counterparts.
Third, although cause and effect are not clear, demographic changes have
also been associated with increasing labor force participation of women.
According to Blau and Ferber (1991), more men and women have married at
an older age, and consequently, have children at an older age. The birth rate
has declined over years, resulting in a smaller number of children per family.
As a result, more women stay in the labor force for a longer period of time.
Finally, traditional employers' perceptions and social norms regarding
appropriate behavior for single and married women have changed in the labor
force. Because women have quit their jobs upon marriage or pregnancy
during most of the 20 ^ century, the working woman's status has been viewed
as temporary or marginal. Employers have been less likely to hire and invest
in training female workers. However, the women's movement in the 1960s
and 1970s and public policies such as the Equal pay Act of 1963, the Civil
Rights Act of 1964, Affirmative Action of 1965, and Title IX (Education
Amendments of 1972) have forced institutional and social change and
16

protected women from discrimination in education and the labor force
(Mandelson, 1996).
Impact of Women's Employment on Consumer Behavior
Bartos (1977/1982) called the demographic and social change of
women "a quiet revolution." Because of the increasing proportion of women in
the work force, marketers have identified the group as a target and considered
this in product development, product positioning, and communications
strategies. However, to better understand the impact of work force
participation on women as consumers, one must understand the changes in
the qualities of women who work, not simply the increased quantity of working
women over the last thirty years (Bartos, 1977).
Many researchers have addressed the consumer behavior of working
women juxtaposed to non-working women. Researchers have segmented the
female population into separate sub-groups to acknowledge each sub-group's
specific characteristics and to provide different perspectives. For example,
Joyce and Guiltinan (1978) focused on professional women, separating the
group from general working women. The research compared the shopping
orientation of professional working women as opposed to non-professional
working women. The researchers argued that professional working-women
have great potential as a marketing target. The proportion of professional
17

working-women has grown, and they currently make more money than
non-professional working women. In addition, professional working-women
have the tendency to marry professional men which results in increased
discretionary income.
Bartos (1976/1977) categorized the general female population into four
sub-groups: career-oriented working women, just-a-job working women,
plan-to-work housewives, and stay-at-home housewives. Bartos proposed
that consumers behaved differently depending on their employment
orientation. Several studies support the notion. Cassill and Drake (1987)
found that the two categories, working women and non-working women, were
less accurate than the four categories created by Bartos. Cassill and Drake
also reported that the employment orientation of working women significantly
Influenced individual women's lifestyles and apparel evaluation. The
employment orientation of female consumers influenced the way women
spent their money and time. In addition, the evaluative criteria used in social
apparel purchases differed based on women's employment orientation.
Bartos also characterized career-oriented working women as cautious,
well-planning, and brand-loyal consumers, housewives as economy-minded
consumers, and just-a-job working women as the most experimental
consumers.
18

Reynolds, Crask, and Wells (1977) employed a traditional versus
modern dichotomy of women. They found that most women categorized as
modern types worked outside home, while only twenty-six percent of women
classified as traditionalists held jobs. McCall (1977) suggested the need to
segment married working women from general working women, naming this
sub-group, work-wife. She characterized the work-wife as a consumer prone
to convenience, quality, assortment, and time constraints.
A considerable amount of research has been conducted dividing
female consumers into different segments to assess the different quantitative
and qualitative dimensions of working women. There is no doubt that working
women comprise a significant consumer segment in the U.S. market.
However, working women could be further segmented into sub-groups using
classification guidelines based on occupational divergence, such as clothing
design preference, self-confidence, or job features rather than employment
orientation. Jenkins (1973) and Cassill and Drake (1987) found that women
employed in higher occupational levels placed more importance on the
suitability and appropriateness of the garments they purchase than women in
lower occupational levels. Therefore, segmenting career-oriented working
women by occupational levels provides different perspectives of this
consumer group for apparel designers, manufacturers, and retailers to use in
product development and product advertising. In addition, gaining further
19

insight Into career-oriented professional women is necessary, because this
consumer group is found to differ significantly from housewives and women
with nonprofessional jobs in terms of shopping attitudes, activities, and
behavior.
Changes in Financial Practices of Working Women
Women's employment status has impacted their financial activities.
First, working women have been more likely to have savings accounts,
checking accounts, and credit cards than non-working women, although
working women have not felt as secure as non-working women regarding
government savings bonds. Second, among working women, employment
orientation has impacted financial activities. Career-oriented working women
have dominated financial activities when compared to just-a-job working
women. Career-oriented working women more likely have their own savings
accounts, checking accounts, credit cards, and investments, whereas
just-a-job working women are less likely to have such financial accoutrements.
(Bartos, 1977).
Working women have been more likely to have a driver's license, have
two or more cars in their garages, buy their own cars, purchase luggage, use
travelers checks, travel in the United States by airplane, and stay at a hotel.
Career-oriented working women have been the most likely to make their own
20

purchase decision for cars when compared to just-a-job working women,
plan-to-work housewives, and stay-at-home housewives. Among all married
women, married working women without children at home are the best
customers for travel services and products. The combination of available
income from employment and no children at home has allowed women to
travel more frequently (Bartos, 1977; Reynolds, Crask, & Wells, 1977).
With the rising labor force participation by women, particularly married
women, marketers and researchers have made enormous efforts to
understand and address the needs of this particular consumer segment. As
women join the work force they have spent more on clothing for work. In
1988, working women accounted for seventy percent of female apparel sales
in the U.S. (Kantrowitz, Witherspoon, & King, 1988). Depending on the work
force environment, women may have spent money that they would not have
spent othen /ise, to obtain attire that is acceptable for work. Fortunately,
working women have had access to additional income that can be spent on
themselves. Peacock (1980) stated that women making $10,000 per year
spent more on clothes than non-salaried wives of men making $40,000 to
$50,000 a year.
On the contrary, U.S. News & World Report ("Designing for Dollars,"
1994) noted that as baby boomers approach their 50s, many have shifted
their financial resources to children's college education rather than apparel.
21

In addition, more working women in the work force has meant a time
constraint on consumers' lifestyles that has directly affected time spent on
shopping. Today's consumers have also looked for value as well as price.
Value-for-price has replaced fashion as the prime concern for price-conscious
consumers. The results of a survey administered by Glamour magazine in
1994 (cited In U.S. News & World Report. 1994), clearly illustrated the shift of
consumers' concern from fashion to value-for-price. The results indicated that
thirty-four percent of Glamour readers increased shopping at off-price stores
like Marshalls, T.J. Maxx, and Filene's Basement. In fact, the amount of
money spent by consumers on apparel as a percentage of income dropped
from 8.1 percent in 1960 to 6.1 percent in 1980 and 5.3 percent in 1993.
Overall, the increase in working females has also caused an increase
in available income and purchasing power. Research has established that
women's employment ratios increase aggregate household clothing
expenditures when income and other variables are fixed (Hafstrom & Dunsing,
1965; Dardis, Derrick, & Lehfeld, 1981; Abdel-Ghany & Foster, 1982; Bellante
& Foster, 1984; Cassill & Drake, 1987; DeWeese, 1987; Norton, & Park, 1987;
DeWeese & Norton, 1991).
22

Apparel Shopping Orientation of Working Women
McCall (1977) identified that married working women have been more
likely to accept self-service, shop in the evenings, be more price conscious,
purchase in a department store rather than a specialty shop, and use the
same store for all their clothing purchases. McCall's findings suggest that the
convenience of one-stop shopping has been of prime importance to working
women, and flattering styles of clothing and appropriateness for work have
been far more important to working women than price. Older and more
experienced female consumers have been more interested in directed and
focused time shopping for apparel. They have expressed greater interest in
using catalogs, buying agents, or other shopping services (Solomon, 1987).
According to Rabolt (1984), career women's wardrobe selection has
been motivated and influenced by somewhat different forces than women's
regular fashion dressing. Rabolt found that career dressing has been
influenced by sources closest to the career setting (i.e., work associates) In
addition to retail sources (i.e., displays in business clothing departments).
Shim and Drake (1988) reported that working women were different in
their information search patterns for the selection of business wardrobe. The
findings indicated five types of information search patterns: the print-oriented
searcher, the audio-visual oriented searcher, the store intensive searcher, the
professional advice searcher, and the pal advice searcher. The diversified
23

information processing view of consumer choice Implied various marketing
strategies that could be used for employment apparel advertising and
promotion.
The Role of Clothing for Working Women
Clothing has been regarded as one of the basic consumer goods and
services. In conjunction with food and housing. Clothing has been an
influential factor In a job situation, and appropriate attire has been important to
job success. Many researchers have found that a person's positive
appearance results In favorable inferences about the person (Johnson,
Nagasawa, & Peters, 1977; Lapitsky & Smith, 1981; Johnson & Roach-
Higgins, 1987a, 1987b; Workman & Johnson, 1989a, 1989b; Lennon, 1990).
When an individual has formed favorable inferences about the personality
characteristics of another person based on that person's clothing, the
Individual also may have formed favorable Inferences about other
nonobservable aspects of the person's life. In addition, researchers have
reported one's appearance has affected the formation of one's self-concept
and self-confidence. Clothing has been manipulated to arouse one's feelings
of self-confidence (Horn & Gurel, 1981).
According to Bixler (1997), appearances counted, not only in the
formation of first impressions but also in ongoing interactions. Bixler reported
24

a research study conducted by sociollnguist, Albert Mehrabian, in which
fifty-five percent of communication messages came from the speaker's
appearance and body language, followed by vocal tone (38%) and words
(7%). Bixler also stated that appearance counted for starting salary and
career advancement, and that job applicants with effective business
appearances were offered eight to twenty percent higher starting salaries.
Many times, the workplace environment has operated against women,
having different expectations for women as opposed to men. (Molloy, 1977).
For men, there has been minimal variation in business attire. An acceptable
business wardrobe has been more determined, providing a reliable
barometer. On the contrary, women have not had the same benefit of a
business uniform (Dillon, 1980). Johnson, Crutsinger, and Workman (1994)
reported that female managers, who appeared masculine by wearing either a
necktie or a scarf, received positive evaluations with respect to managerial
competencies and promotability. The researchers suggested that working
women should adopt some level of masculinity in appearance to communicate
professional equality to men. However, masculinity in appearance portrayed
by working women should be consistent with the feminine gender role.
25

Aesthetics and Consumer Behavior
Traditionally, humans have produced utilitarian goods that meet basic
human needs, such as food, clothing, and shelter. However, the human
desire for self-actualization has further created goods that are aesthetically
pleasing as well as utilitarian. Aesthetics originated as a philosophical
discipline and an endeavor to understand human motivation for creating
beautiful objects.
Fiore, KimIe, and Moreno (1996a/1996b/1996c) surveyed aesthetics
literature inside and outside the field of textiles and clothing. They
summarized five categories that represent multi-dimensional aspects of
aesthetics found in the literature. The categories were: creator, creative
process, object, appreciation process, and appreciator. The creator referred
to an individual who develops an aesthetic object. This category incorporated
psychological and socio-cultural factors of the creator. The creative process
referred to the internal processes that take place within the creator during
development of an aesthetic object. This category included the logical and
unconscious mental components of the creator.
The object referred to the formal, expressive, and referential elements
of the physical object. Formal aspects of the object were physical
characteristics such as color, proportion, and complexity. Formal aspects of
the aesthetic object were of primary Importance in the consumption process
26

for many apparel products (Eckman, Damhorst, & Kadolph, 1990). Formal
qualities of the object and interactions among formal qualities, apparel, and
the body were the underlying evaluative criteria used in the apparel
consumption process (Eckman et al., 1990; Littrell, 1980; Morganosky, 1984).
Expressive aspects of the object referred to the feelings and emotions
emitted by the object (Kose, 1984), while referential aspects of the object
referred to the symbolic nature of the object. The expressiveness of the
object contributed to the pleasingness of the object ("What Makes," 1980),
while the referential characteristics of the object conveyed information about
external realities or ways to attend to the worid.
The appreciation process focused on the internal processes that take
place during the aesthetic response to an object. This process included the
cognitive, emotional, and psychological components of aesthetic experience.
The appreciator referred to an individual who views the object. The
appreciator category included psychological and socio-cultural factors of an
individual Involved in the appreciation process. Sensitivity to aesthetic
features, preference and evaluation of aesthetic objects were Included in the
appreciator category (Fiore, KimIe, & Moreno, 1996a).
27

Consumer Aesthetic Evaluation
Aesthetic aspects of apparel were key factors that determine the
consumer's selection and purchase of apparel (Eckman, Damhorst, &
Kadolph, 1990). Fiore and Damhorst (1992) reported that aesthetic aspects
of apparel were related to perceived quality and affect consumer satisfaction
with apparel products. Fiore and KimIe (1997) summarized three important
contributors of consumer aesthetic experience: apparel product, body, and the
environment. They suggested that apparel professionals should consider
these three contributors in assessing consumer aesthetic experience.
According to Fiore and KimIe (1997), during the apparel purchase
decision-making process, consumers evaluated aesthetic features of apparel,
such as color, fabric, or silhouette in terms of their usage and organization.
During the process, consumers were simultaneously exposed to apparel and
the environment in which it is presented. Consumer purchase decisions were
influenced by factors other than apparel design elements, such as special
promotions, unique store displays, lighting, and models used in advertising.
Therefore, in assessing consumer aesthetic evaluation of apparel, aesthetic
quality should be investigated in conjunction with the environment in which
apparel is presented.
The interaction between apparel and body were also considered,
because the effect of apparel on the body was important to consumers when
28

evaluating the product. Consumers judged the reinforcing effect of apparel on
their own bodies and also made assumptions about this effect based upon the
images found in promotional environments. According to Flore and KimIe
(1997), consumer satisfaction with apparel depended on the aesthetic appeal
of the interaction between the body and the apparel. Eckman, Damhorst, and
Kadolph (1989) reported that the aesthetic aspects of apparel products
determined what consumers tried on, but the interaction of clothing on the
body determined consumers' final purchase decision.
Consumer aesthetic evaluation has been affected by several other
factors. First, the desired or expected benefits sought by consumers has
affected aesthetic evaluation (Fiore & KimIe, 1997). Benefits considered
important in the purchase decision process have varied among consumers
and have differed across product category (Bell, Holbrook, & Solomon, 1991;
Holbrook 1994). Second, aesthetic value attached to the product has affected
aesthetic evaluation. Morganosky (1984) found positive association between
aesthetic value and the price consumers were willing pay. Finally, the
intended use of the product also affected aesthetic evaluation (Bell et al.,
1991).
29

Fashion and Aesthetics
Although researchers have argued about the origins of dress and
adornment, many believe that, like food and shelter, the earilest garments
were developed out of necessity for protection. When the physical needs
were met, creation was manifested in adornment. Thereafter, many people
used clothing as a medium to express self and beauty. Therefore, the
discipline of aesthetics has been applied to the creation and the selection of
fashionable clothing (Eckman, 1992).
The traditional discipline of aesthetics has been concerned with the
creation of artistic objects, for instance the organization of artistic details
(e.g., line, shape, and color). The focus of fashion analysis has involved the
design of fashion objects, such as clothing or fashion accessories. The
difference between aesthetics and fashion analysis has been that fashion is
affected by time. Sproles (1979) defined fashion as a way of behaving that is
temporarily adopted by a discernible portion of members of a social group
because that behavior is perceived to be appropriate for the time and
situation. In his study of clothing fashion, the term fashion was used to
indicate both the clothing and the processes of consumer behavior linked to
clothing.
In the study of aesthetics, the evaluation of an object has not changed
as much as it has in fashion analysis. Therefore, when aesthetics theory has
30

been applied to a fashion object, fashion has been viewed as a process as
well as an object.
Elements Fundamental to Aesthetic Quality of Apparel
In order to understand how aesthetics has influenced fashion-oriented
purchase decisions, consideration has been given to the design elements
fundamental to apparel. DeLong (1987) referred to design elements as visual
definers that provide perceptual definition to parts of the visual form. The work
done by Dondls (1983) and Feldman (1973) has implied that an individual's
interpretation of visual image is influenced by the characteristics and
organization of design elements such as color, texture, unity, and proportion.
Sproles (1981b) has included color, line, silhouette, and design details such
as embellishments and texture. In a study of female evaluation of garment
attractiveness, Wagner, Anderson, and Ettenson (1990) reported jacket
length, silhouette of bottom (e.g., skirt or pants), pattern of bottom, pattern of
jacket, silhouette of jacket, color, and jacket details to be important factors.
Just as individual design elements have affected aesthetic evaluation
of garments, the relationship of one design element to others may have
influenced the consumer purchase decision-making process. Thus, the
number, size, and location of design elements may have been important
modifiers of aesthetic evaluation (DeLong, 1987). Eckman (1992) found the
31

interaction of jacket silhouette with jacket pattern, color, and neckline shape to
be significant in consumer aesthetic judgment of apparel. This interaction of
jacket silhouette with jacket pattern was the highest, dominating consumer
aesthetic evaluation. The Interaction effect was greater than the main effects
for any single design element.
The findings of Eckman (1992) were in agreement with the notion
made by Holbrook and Dixon (1985), that the evaluation of fashion is a
gestalt-like phenomenon. Consumer aesthetic evaluation of apparel resulted
from the interrelationships among design elements.
Color
Color was the first thing that a consumer noticed about a garment
(Tate, 1989). According to Sproles (1981B), color was the second important
design element in the consumer decision-making process. Sproles believed
silhouette to be the primary element influential to consumers and noted that
once consumers chose a silhouette they found attractive, color was the design
element that dominated consumer decisions regarding clothing. When
deciding whether to accept or reject a style, consumers depended mostly on
their evaluations of color. Eckman, Damhorst, and Kadolph (1990) reported
color to be the most important aesthetic criteria for apparel preference. Fiore
and KimIe (1997) pointed out that color may have the greatest impact on our
32

perception, because we recognize color simultaneously with form.
Manufacturers could change colors readily, and new colors can stimulate
sales.
Line
According to Davis (1996), line referred to the edge or the outline of a
garment and the style lines that divide the space within a garment. Line
variations created physical and psychological effects and visual illusions that
influenced figure size, shape, and dimensions. The height of a line
lengthened or shortened a figure, while the width of a line can make a figure
seem thinner or heavier. Line leads the eye and has been used in apparel
design to reinforce the theme of a garment (Tate, 1989). Preferences for
styles have depended on the number of lines, line placement, and consumer's
design experience or training (Sailor, 1971).
Design Detail
The third design element that influenced consumers' aesthetic
evaluation of clothing was design detail. Examples of design detail included
embellishments such as buttons and belts, fabric characteristics like texture
and luster, and construction features such as darts (Eckman, 1992). Little
research has been done on the influence of design detail on consumer
33

purchase behavior toward dress, perhaps because of the variety of design
details or the possible Insignificance of them in aesthetic evaluation. Although
fashion trends occurred in design details, many consumers did not pay as
much attention to them as color and line. However, design details that
stimulated consumers' interest and enjoyment facilitated the acceptance of a
new style (Sproles, 1981b).
Texture
According to Eckman, Damhorst, and Kadolph (1990), texture referred
to the actual or implied characteristics of surface and was described as
smooth, rough, shiny, or dull. Texture, along with other design elements,
made a significant contribution to the aesthetic satisfaction of apparel. Fabric
and garment construction details were the main sources of texture in apparel
and textile products. Fabric surface was usually determined by fiber content,
yarn, fabric structure, fabric finish, and construction details like seams,
gathers, or pleating (Fiore & KimIe, 1997).
Clothing textures interacted visually with each other, with personal
textures, and with body contour and structure. Psychological effects of
textural touch, sight, and sound greatly affected the mood of a garment
(Davis, 1996). Soft textures were generally viewed as formal or relaxing,
while firmer textures were viewed as businesslike or sporty.
34

Pattern
Davis (1996) stated that pattern refers to the arrangement of line,
space, or shape on the surface of a fabric. Pattern consisted of basic design
elements that could be broken down into Individual elements, therefore,
technically, it was not a basic element. However, Davis suggested that
pattern could be used as a medium to manipulate physical and psychological
effects with its own visual effects. Depending on the way each component of
pattern was used, pattern strengthened, weakened, or made the overall effect
of apparel more subtle or versatile. Pattern combined physical and
psychological effects to create its own Impressions which reinforced, modified,
or countered the effects of individual elements (Davis, 1996). In that sense,
pattern was considered a single design element.
Individual Differences and Aesthetic Preferences
The dynamics of aesthetic evaluation has been complex. Aesthetic
evaluation has been affected by product qualities and characteristics of
individuals who perceive them (Bell, Holbrook, & Solomon, 1991). Product
qualities included product specific attributes, such as color, line, shape, and
texture. Individual characteristics have been examined from various
perspectives, including personal characteristics, psycho-social characteristics,
physical characteristics, or situational characteristics.
35

Individual differences, such as age, body image, gender, education,
and personality, have affected aesthetic preferences (Fiore & KimIe, 1997).
These characteristics, considered demographic and psychographic variables,
have been used In marketing profiles of consumers for the development and
promotion of products. In addition, an individual's socio-cultural and personal
experiences affected evaluation of or preference for products aesthetic
qualities (DeLong, 1987; Holbrook, 1986). Socio-cultural attributes that
affected individual aesthetic preferences include geographic location,
ethnicity, religion, and sexual orientation (Fiore & KimIe, 1997)
Age
Several researchers have found that age has an effect on preferences
for aesthetic products, such as music, fragrance, and apparel (Furukawa,
1995; Holbrook & Schlndler, 1989; Schindler & Holbrook, 1993). According to
Holbrook and Schindler, development of personal preference and enduring
tastes were formed during a critical period in a consumer's life. In particular,
taste for certain aesthetic forms was developed eariy in life and influenced
preferences for a lifetime. Schindler and Holbrook (1993) found enduring
preferences for personal appearance were formed around the age of 41.
Horridge, Khan, and Huffman (1981), in a study of clothing
preferences, found that females less than 35 years old were more aware of
36

fashion than older women. In addition, the largest portion of fashion opinion
leaders among female homemakers was less than 30 years old. Fashion
opinion leadership decreased as females got older.
Socio-Economic Factors
The effect of socio-economic variables, such as income, education,
and occupation, on aesthetic preference was not conclusive. Contradicting
results reported by Morganosky (1984/1987) proved uncertain association
between socio-economic factors and aesthetics. Morganosky (1987) reported
a positive relationship between income and aesthetics and a negative
relationship between income and functionality. This finding was contradictory
to her 1984 findings. Moreover, Morganosky (1987) could not find enough
evidence to show the effect of demographic differences among participants on
fashionability or aesthetic aspects of clothing.
Geographic Location
Physical environment, like climate condition or historical events of a
particular area has affected aesthetic preferences of an individual (Fiore &
KimIe, 1997). Differences in aesthetic preferences among consumers in
California, New York, New Mexico, and Texas could be considered.
Consumers in New York preferred the conservative, professional, and neutral
37

colored styles, while consumers In California or Texas have preferred the
contemporary, sporty, and bright colored styles (Flore & KimIe, 1997).
Ethnicity
Due to the fact that ethnic diversity in the United States has continued
to increase, a considerable number of products have been designed and
promoted with the preferences of specific ethnic markets in mind. It has been
a necessary marketing tool in recent global marketing paradigms. Several
researchers have established that there are differences in consumers'
decision-making criteria among different cultures. For instance, Asian and
Hispanic cultures have been strongly group-oriented, compared to
individualistic North American counterparts. Asian and Hispanic Americans
shopped more as a group, with family in particular, and individual
consumption decisions were affected by family elders (Doran, 1994; Yau,
1988).
Several researchers have reported Anglo American consumers are
price conscious, while Asian American consumers are somewhat
quality-oriented. Braun (1991) and Miller (1993) reported that quality was the
most important product attribute for Asian Americans in making purchase
decisions overall. However, Fisher (1993) reported contradicting results.
When purchasing food, beverages, and household products, price was the
38

most important product attribute for Asian Americans. These conflicting
findings Indicate the possible existence of confounding variables, such as
diverse ethnic backgrounds within Asian Americans, as well as different levels
of acculturation.
Kang and Kim (1998) examined the decision-making patterns of Asian
American sub-groups, Chinese, Japanese, and Koreans in relation to
acculturation levels. The findings indicated different decision-making patterns
among the three sub-groups: Korean and Chinese consumers considered
product-related appeal more important than Japanese consumers. In
addition, perceived Importance of store attributes in making purchase
decisions was affected by acculturation level for all three sub-groups.
Due to the fact that a consumer's ethnic background affected
purchase-decision patterns, a consumer's aesthetic evaluation process may
have also been affected by ethnicity. Fiore and KimIe (1997) suggested that
differences in ethnic background affected aesthetic preferences of consumers.
Body image
Several researchers defined body image as the mental picture or
perception we have of our bodies at any given moment in time (Fiore & KimIe,
1997; Kaiser, 1997). Domzal and Kernan (1993) reported that body image
affected people's feelings about themselves and influenced general desire for
39

aesthetic products. How people viewed their bodies affected their pursuit of
beauty and, consequently, their desire for products and services that enhance
the body.
Thompson (1986) believed that the concept of body image differed
between the self and others' perceptions of that body. He indicated that some
people may think they are obese when others perceive their bodies as
average or standard figures. People with a variety of shapes and sizes have
had distorted images of their bodies. Most commonly, there has been a
tendency to overestimate the size of one's body. Those with anorexia or
bulimia were examples. Thompson reported that women overestimated their
body size more on average than men.
According to Kaiser (1997), the body has been regarded as a link
between the inner person and some of society's most important values.
Cultural ideology, social relations, and personal activities have determined the
way people feel about their bodies. The desirability of certain body forms and
how the body should be displayed have been Influenced by cultural and social
norms. For example, people have based their perception of idealistic body
forms on the figures represented in fashion magazines, beauty contests, and
television commercials. In this context, people have used their bodies as a
medium for self-assessment along with clothing.
40

Depending on the self-image, clothing has been perceived differently
by Individuals. Different clothing styles have been chosen with the intention of
hiding certain parts of the body one perceives as flawed. Even shopping has
had different meaning to people with little or no satisfaction with their
body-Image. Millman (1980) reported that many obese women disliked
shopping, because It is a context that forces them to confront the reality that
they are ovenA/eight.
Body Silhouette
There has been an agreement that body figures are different from one
individual to another, and almost nobody has an exactly average, perfect, or
ideal body. Consumer figure variation has affected aesthetic preferences, due
to the interaction between the aesthetic qualities of apparel and the aesthetic
qualities of the body (Fiore & KimIe, 1997). The interaction between apparel
and body has tended to determine consumer purchase decisions (Eckman,
Damhorst, & Kadolph, 1989).
According to Fiore and KimIe (1997), the human body form consisted of
colors, textures, and proportions that interacted with perceivable tactile
qualities of apparel. The interaction between the body form and apparel had a
great impact on the body's attractiveness and affected consumer aesthetic
preferences.
41

Sproles (1979) suggested that the function of fashion related products
has been to enhance the body form by manipulating aesthetic qualities.
Consumers have considered their skin tone, eye color, and hair color in the
selection of apparel and fashion accessories. Consumer height, weight, and
body proportion has also been considered during the apparel purchase
decision-making process and has affected aesthetic preferences. Consumer
visual evaluation of their own bodies in relation to apparel, has been
influenced by the public climate of what is perceived to be ideal or acceptable.
Rasband (1994) stated that the term, ideal body, has been used as a frame of
reference for comparison. However, in many cases, the term has been
wrongfully used as a barometer to group normal versus abnormal figures.
Rasband (1994) reported that figures were different from one individual
to another, and few people had an average, perfect, or ideal body. The term
"figure variation," as Rasband described, referred to the individual figure
deviations from the average body. The individual figure difference, that was
characterized by height, bone size or structure, weight, proportional body
areas, contour and figure type, and posture, affected aesthetic preferences for
apparel.
42

Summan/
The number of women in the workforce has increased steadily In the
last thirty years. This has been due to: (a) the attainment of higher
educational levels by women, (b) a greater demand for women in traditionally
female occupations, and (c) an increase of women In non-traditional male
dominated occupations. Traditionally, women have quit work upon marriage
or child bearing. Currently, women continue to work after marriage and
children. The result of greater numbers of working women has been a rise in
the discretionary income among families. This additional income has often
been spent on the purchase of apparel for work.
As women have become entrenched in careers, they have spent the
largest proportion of their apparel dollars on career clothing. Many studies
have examined the apparel purchases of working women, focusing on either
the aesthetic attributes of apparel or the consumer characteristics of working
women. However, few researchers have examined the interrelationship
between the aesthetic quality of apparel and consumer characteristics.
Therefore, this study seeks to: (a) investigate areas such as consumer
job-speclfic-situational characteristics, and physical profile in relation to
aesthetic preference of apparel, business jackets in particular, (b) assess
consumer psycho-social motivation in relation to aesthetic preference of
jackets, and (c) provide additional data for the development of the consumer
43

aesthetic evaluation model and to provide Industry and academia with new
information in the area of aesthetics and consumer behavior.
44

CHAPTER III
METHODOLOGY
This research investigated the differences in the jacket design
preferences of working women. The study also assessed the factors that
affected different jacket design preferences. Described in this chapter are the
proposed research model, research design, sample selection, measurement
instrument, data collection procedure, variables for the study, and statistical
analysis.
Proposed Research Model
The research model used in this study was based on a general model
of the consumer's fashion adoption process (Sproles, 1979) (refer to Figure
1). With other early theoretical works on fashion, the Sproles model
contributed to the development of fashion theory. Sproles (1981) suggested
that Individual attributes influence decision making for fashion goods. In his
framework, silhouette was the critical aesthetic attribute for fashion design.
Holbrook (1986) suggested that aesthetic attributes are the key factors
in consumption behavior. Several other empirical studies also documented
the importance of aesthetics in clothing design evaluation (Eckman, 1992/
1997; Eckman, Damhorst, & Kadolph, 1989; Morganosky & Postlewait, 1989).
45

Eckman et al. showed that aesthetic attributes (e.g., color, pattern, and
styling) surpassed utilitarian attributes (e.g., versatility and appropriateness) in
point-of-purchase decisions by consumers.
The consumer's fashion adoption process model (refer to Figure 1)
mapped the individual's role in that process and is the conceptual foundation
of this research. The model for this study consisted of four components that
contain variables related to consumer aesthetic preference: (a) personal
characteristics, (b) psycho-social identity, (c) job-specific situational
characteristics, and (d) physical profile (refer to Figure 2). The model
proposed linkages between aesthetic preference and the selected variables.
The solid line indicated sequential direct relationships, while the dotted lines
represented indirect relationships among sequential variables. The model
viewed consumer aesthetic preference as an outcome of personal
characteristics, psycho-social identity, job-specific situational characteristics,
and physical profile.
Research Design
The methodological approach utilized in this study was a
cross-sectional survey using a self-administered questionnaire. A
cross-sectional study has been the best known and most important descriptive
design, and has been best distinguished by its use of sample elements from
46

o
<o>
Major compontnt of the fashion proceu
Pre.«xiiting conditions
Directing influences on the fashion process
Central channel of consumer decision making
Influences from adopter's ENVIRONMENT
LIFESTYLES
SOCIOCULTURAL CHANGE
THE FASHION MARKETING SYSTEM
Start of consumer's information seeking and
decision making
—Select stores to shop —Currently available styles -Purposeful information
seeking —Evaluation at the store —Narrowing the choice
Critical characteristic(s) considered: style, fit, price, brand, physical characteristics, climate of use, maintenance
. ^ I D E N T I F I C A T I O N ^ OF ALTERNATIVES'
Acquisition (purchase, sew, gift)
• TIME OF ADOPTION
ADOPTER'S IDENTITY AS.
Innovator Early Conformist Late Follower f
Opinion Leader Mass Market Consumer Laggard, Isolate
Current level of acceptance of style by
fashion leaders and other coruumers
New style Low acceptance to
Estatslished fashion, HigS acceptance
Adopter's identity: age. sex, socioeconomic characteristics, physical profile (body size/ shape, appearance, etc.)
Adopter's psychosocial MOTIVATIONS
ADOPTER'S COGNITIVE ORIENTATIONS TOWARD DRESS: awareness, interest, knowledge, innov ativeness, perceived risk, expectations^attitudes, values
ADOPTER'S PSVCHOLOGICAL IDENTITY: self<oncept, personality, individuality-conformity
SOCIAL INFLUENCES ON ADOPTER: collective behavior, socialization, refererice groups, social communications and opinion leadership
Reject (Begin again or save information for later decision)
Identify clothing arxJ fashion needs
' Specific roles and activities
DIMENSIONS OF CHANGE:
New fashion object emerges, changing lifestyles, changing level of acceptance, social termination of trend, physical obsolescence
Repeat acquisitions of same/similar style
Influence on other POTENTIAL ADOPTERS
NEW FASHION PROCESS BEGINS . (Return to start)
Figure 1. Sproles' General Model of the Consumer's Fashion A(Joption Process.
Source: Excerpted from George G. Sproles, "Fashion: Consumer Behavior Toward Dress," 1979, p. 197
47

PERSONAL CHARACTERISTICS
Age Mahtal Status Educational Attainment Number of Children Age of Children Ethnicity Contribution to Household Income Household Size Professional Wardrobe Expenditure Employment Status Employment Orientation Occupation Geographic Region
PSYCHO-SOCIAL IDENTITY
Seif-Confidence in Dressing Self-Monitoring Perceived Importance of Clothing Presence of Career Objectivity Job Satisfaction
i
•
;
I
1
i
i
JACKET DESIGN ELEMENTS
Jacket Length Jacket Pattern Jacket Silhouette Jacket Neckline Drop Jacket Collar Style
.
DESIGN PREFERENCES
JOB-SPECIFIC SITUATIONAL CHARACTERISTICS
Implicit Dress Code Visibility to Superiors and Public Length of Time in Career Corporate Culture
PHYSICAL PROFILE
Body Weight Body Height Body Silhouette Hair Color Eye Color Dress Size Body Frame Size
i k i L
Figure 2. Proposed Research Model: Consumer Aesthetic Preference in Relation to Personal Characteristics, Psycho-Social Identity, Job-Specific Situational Characteristics, and Physical Profile. Model developed by the researcher.
48

the population of interest, where the elements are measured at a single point
in time (Fraenkel & Wallen, 1996). Fraenkel and Wallen (1996) indicated that
survey results can be interpreted as an accurate representation of the opinion
of the entire population if scientific sampling techniques are used.
External validity refers to "the extent that the results of a study can be
generalized from a sample to a population" (Fraenkel et al., 1996, p.111).
Most researchers intend to generalize their findings to appropriate
populations. However, researchers can never be sure that their sample is
representative of the population. There are always some differences between
the sample and the population. The threats to external validity
(e.g., sampling error) were controlled by randomly selecting a large sample for
the study. Therefore, the selected sample can be considered representative
of the population, and the results of the study can be generalized.
Internal validity refers to the extent that observed differences in the
dependent variable are directly related to the independent variable, and not
due to another unintended variable. When a study has internal validity, the
interpretation of the outcome is legitimate. In this study, threats to internal
validity were minimized by using a consistent instrumentation process and
assessing detailed information on subject characteristics.
Measurement error refers to inconsistencies in measurements.
Measurement error occurs when invalid and unreliable instruments are used
49

to measure variables in a study. A slight variation in measured scores due to
a variety of factors such as differences in motivation, energy, anxiety, and
different testing situations is inevitable. Such factors result in measurement
errors. For this study, measurement error was controlled by employing
instruments that have been validated by other researchers and that are
believed to be reliable. In addition, Cronbach's alpha coefficients were
calculated for variables with multiple items to address internal consistencies
among those items. The visual stimuli were developed by the researcher.
Therefore, the instruments containing visual stimuli were validated by 11
current design experts across the nation to control possible measurement
errors.
Selection of Sample
A target population, also called an actual population, refers to the group
to which the study results are intended to apply, while a sample refers to the
group on which information is obtained (Fraenkel & Wallen, 1996). The target
population for this study was working women in the United States who wear
business jackets to work at least once a week.
The accessible population was defined as working women who wear
business jackets to work at least once a week and whose names were in the
data base of National Demographics & Lifestyles (NDL). A national
50

cross-section of 1,500 working women was randomly drawn for the study by
NDL. All subjects had an equal and independent chance of being selected for
the sample.
The target sample size was a minimum of 200. The sample size was
determined after utilizing power analysis at the moderate power level. Based
on the number of variables used in the hypotheses testing and the number of
categories included for nominal variables, 200 was the minimum sample size
recommended.
Research Instruments
The research instruments for this study consisted of two parts: visual
stimuli and a self-administered questionnaire. Visual stimuli that contained 18
black and white CAD drawings of business jackets were developed to
measure design preference, the dependent variable. Although color was
believed to have a great impact on consumer aesthetic evaluation of apparel,
only black and white CAD drawings were utilized due to variability in color.
Visual stimuli were placed at the beginning of the survey, so subjects'
responses to each jacket design would be independent of the questions
asked in the questionnaire. The subjects evaluated 18 jacket designs based
on a 5-point Likert-type scale, 1 indicating not attractive and 5 indicating very
attractive. The questionnaire was developed to measure consumers' personal
51

characteristics, psycho-social identities, job-specific situational characteristics,
and physical profiles.
Visual Stimuli
Eighteen black-and-white CAD drawings of business jackets were
created as stimuli. The term business jacket referred to a suit jacket that is
commonly accepted for business or formal social occasions. The business
jacket was chosen as a sole representation of business attire because the
jacket has been considered the hallmark of American business women
(Molloy, 1996). Today, the jacket serves the same functions for women that
the suit does for men. The jacket identifies its wearer as a serious career
woman with power, authority, and potential. According to a survey conducted
by Molloy, ninety-three percent of business men and ninety-four percent of
business women, no matter what they themselves were wearing, assumed
that women wearing jackets outranked women without jackets.
Five jacket design elements were used in this study and included jacket
length (short, hip, and tunic level), jacket pattern (plaid, stripe, and solid),
jacket silhouette (fitted, semi-fitted, and loosely fitted), jacket neckline drop
(low/waist deep, medium/below bust, and high/above bust), and jacket collar
style (no collar, notched collar, and shawl collar). These selected design
elements were found to influence consumers' aesthetic evaluation of fashion
52

objects, silhouette, line, and design detail (Davis, 1996; Richardson, 1980;
Sproles, 1981). Color was believed to be one of the key factors in consumer
aesthetic evaluation, however, it was dropped in this study due to the high
variability and cost of reproduction. The visual stimuli were placed at the
beginning of the questionnaire in a booklet format.
By using five jacket design elements at three levels each, a total of 243
jacket design combinations could be generated from a full factorial plan
(refer to Table 3). Of the 243 possible combinations, only a fraction
(18 jacket designs) were selected for this study. The eighteen jacket design
combinations, presented in Table 4, were formulated using the 3 fractional
factorial experimental design catalog developed by Hahn and Shapiro (1966).
To estimate main effects, some of the interactions were assumed to be
negligible. From the design catalog (Hahn & Shapiro, 1966), the first 5
columns in plan number 6 was used.
All the designs in the catalog were orthogonal which means of the 243
possible design combinations, only the ones that were totally different from
each other were chosen. Each level in each factor had equal chance to be
selected. Therefore, the 18 design combinations selected for the study were
balanced and representative of the 243 possible combinations. This was
further tested utilizing correlation analysis. The results are reported in
Table 5.
53

Table 3. Illustration of Possible Jacket Design Combinations Using 5 Attributes with 3 Levels
Design Elements Levels Number of Possible Combinations
Jacket Length
Jacket Pattern
Jacket Silhouette
Jacket Neckline Drop
Jacket Collar Style
Short, hip level, tunic
Plaid, pin-striped, solid
Fitted, semi-fitted, loosely-fitted
Low / waist deep. Medium / below bust. High / above bust
No lapel, notched, shawl
3
9
27
81
243
54

Table 4. Eighteen Jacket Design Combinations Formulated Using Orthogonal Fractional Factorial Design Catalog Developed by Hahn and Shapiro (1966)
Combination Number
Description of Jacket Design
00000
01121
02212
10111
11202
12020
20221
21012
22100
00210
01001
02122
10022
11110
12201
20102
21220
22011
Short, plaid, fitted, waist deep, no lapel
Short, pin-striped, semi-fitted, above bust, notched collar
Short, solid, loosely-fitted, below bust, shawl collar
Hip level, plaid, semi-fitted, below bust, notched collar
Hip level, pin-striped, loosely-fitted, waist deep, shawl collar
Hip level, solid, fitted, above bust, no lapel
Tunic level, plaid, loosely-fitted, above bust, notched collar
Tunic level, pin-striped, fitted, below bust, shawl collar
Tunic level, solid, semi-fitted, waist deep, no lapel
Short, plaid, loosely-fitted, below bust, no lapel
Short, pin-striped, fitted, waist deep, notched collar
Short, solid, semi-fitted, above bust, shawl collar
Hip level, plaid, fitted, above bust, shawl collar
Hip level, pin-Striped, semi-fitted, below bust, no lapel
Hip level, solid, loosely-fitted, waist deep, notched
Tunic level, plaid, semi-fitted, waist deep, shawl collar
Tunic level, pin-striped, loosely-fitted, above bust, no lapel
Tunic level, solid, fitted, below bust, notched collar
Note: The five digit combination number indicates levels in each variable: first digit indicates jacket length (0 being short, 1 being hip level, 2 being tunic level); second digit indicates jacket pattern (0 being plaid, 1 being pin-striped, 2 being solid); third digit indicates jacket silhouette (0 being fitted, 1 being semi-fitted, 2 being loosely fitted); fourth digit indicates jacket neckline drop (0 being low/waist deep, 1 being medium/below bust, 2 being high/above bust); and the last digit indicates jacket collar style (0 being no lapel, 1 being notched collar, 2 being shawl collar). Each level in each attribute has an equal chance to be chosen.
55

Table 5. Correlation Among Five Design Attributes Using 18 Jacket Design Combinations by 3® Orthogonal Fractional Factorial Experimental Design
F1
F2
F3
F4
F5
F1
1.00000 0.0
F2
0.00000 1.0000
1.00000 0.0
F3
0.00000 1.0000
0.00000 1.0000
1.00000 0.0
F4
0.00000 1.0000
0.00000 1.0000
0.00000 1.0000
1.00000 0.0
F5
0.00000 1.0000
0.00000 1.0000
0.00000 1.0000
0.00000 1.0000
1.00000 0.0
Note: F1 through F5 indicates jacket length, jacket pattern, jacket silhouette, jacket neckline drop, jacket collar style, respectively. Eighteen design combinations (refer to Table 4) were generated using 3 orthogonal fractional factorial design catalog developed by Hahn and Shapiro (1966).
56

In creating black-and-white drawings of the 18 jacket designs, two
computer graphic programs were used, Smartsketch 95 and Coreldraw. After
18 jacket designs were completed, the designs were evaluated by apparel
design experts across the nation. The eighteen business jacket designs, one
jacket printed on each page, were mailed to fifteen designers. The designers
were asked to identify the design elements used in terms of five factors and
three levels. Of the fifteen designers, eleven returned the survey. Most
designers identified the design elements correctly. When more than one
designer incorrectly identified design elements in a particular jacket, the jacket
design was modified to best describe the intended design by the researcher.
This validation process was employed to control possible measurement errors
in visual stimuli.
For the main study, each subject received a booklet that contained 18
drawings of business jackets. The subjects rated their degree of preference
for each jacket design on a 5-point Likert-type scale, 1 indicating not attractive
and 5 indicating very attractive. The assigned scores were used as
responses for each dependent variable.
The Questionnaire
A self-administered questionnaire was developed to elicit information
regarding working women's (a) personal characteristics, (b) psycho-social
57

identity, (c) job-specific situational characteristics, and (d) physical profile.
The questionnaire was formatted into a booklet containing a front cover
followed by eight sections. Since a mail survey to individuals was chosen as
the data collection mode, the visual stimuli were placed in the questionnaire
sections I and II, and the actual questionnaire begun in section III. A copy of
the questionnaire may be found in Appendix A.
The third section of the questionnaire consisted of 20 questions related
to (a) self-confidence in dressing (3 items - Q01, Q06, Q10), (b) ability to
modify self-presentation (7 items - Q04, Q09, Q11, Q12, Q14, Q16, Q20),
(c) sensitivity to the expressive behavior of others (4 items - Q02, Q03, Q07,
Q13), and (d) perceived importance of clothing (6 items - Q05, Q08, Q15,
Q17, Q18, Q19). The items related to self-confidence in dressing and
perceived importance of clothing were adapted from Rabolt (1984), and the
items related to ability to modify self-presentation and sensitivity to the
expressive behavior of others were adapted from Snyder (1974) and Lennox
and Wolfe (1984).
The fourth section elicited information regarding the respondent's
business jacket purchase and consumption behavior. Business jacket design
elements important in business jacket purchase decision (Q01), factors
important in business jacket purchase (Q02), frequency of wearing business
jackets per week (Q03), seasons in which business jackets are most often
58

worn (Q04), number of business jackets in inventory (Q05), colors of business
jackets in inventory (Q06), apparel items most frequently worn with business
jackets (Q07), business jackets purchased as a suit or separate (Q08),
preferred retail store type for purchasing professional apparel (Q09), payment
type used for purchasing professional apparel (Q10), and professional apparel
expenditures (Q11) were included in this section.
The fifth section elicited information regarding visibility to superiors and
the public (2 items - Q01, Q04), implicit dress codes (Q09), and job
satisfaction (8 items - Q02, Q03, Q05, Q06, Q07, Q08, Q10, Q11). Questions
number 03 and 05 in this section were reverse coded. The items for visibility
to superiors and the public and implicit dress codes were adapted from Rabolt
(1984). The items for job satisfaction were adapted from Bagozzi (1980),
Dubinsky and Hartley (1986), and Lucas, Babakus, and Ingram (1990).
The sixth section was designed to elicit information concerning the
respondents physical profile. Height (Q01), weight (Q02), body frame size
(Q03), dress size (Q04), hair color (Q05), eye color (Q06), and torso silhouette
(Q07) were included in this section. Questions 01 through 06 were developed
by the researcher, and question 07 was adapted from Rasband (1994).
The seventh section contained questions related to work and work
environment. Size of the firm (Q01), degree of conservativeness at work
(Q02), male and female ratio (Q03), years at firm (Q04), years in career
59

(Q05), occupation (Q06), job title (Q07), employment status (Q08), career
orientation (Q09), presence of career objectivity (Q10), number of
customers/clients encountered daily at work (Q11), and number of
superiors/colleagues encountered daily at work (Q12) were included in this
section.
The eighth section was designed to elicit information concerning
Individual characteristics. Age (Q01), marital status (Q02), educational
attainment (Q03), ethnic background (Q04), residence area (Q05), household
size (Q06), number and age of children (Q07), and financial contribution to
household income (Q08) were included in this section.
Pilot Test
A pilot study was conducted in June of 1999 in Lubbock, Texas to test
for (a) the content of the instruments regarding clarity in wording,
(b) comprehension of the instructions and terminology, and (c) fatigue. Two
sets of questionnaires were prepared for this part of the study. A convenience
sample of 43 subjects was recruited. A drop-off/pick-up method of distribution
was used to deliver the questionnaires. A total of 43 questionnaires, 24 type
A and 19 type B were returned.
Based on the analysis of the pilot study, the visual stimuli section was
reformatted for sizing of each jacket design and placement in the
60

questionnaire. The eighteen jacket designs were scaled down, and all of the
designs were placed on two pages facing each other, so the respondents
could review all the available options. In addition, question 07 in section VI
was revised. Instead of using statements to describe each torso silhouette,
black and white figure drawings were utilized.
Collection of Data
Dillman's mail survey technique (Salant & Dillman, 1994) was utilized
for collection of the research data. A self-administered questionnaire was
mailed to randomly selected representatives of working women in the United
States. The subjects were drawn from a data base consisting of a
cross-section of consumers, ages 25 and over. During the summer of 1999, a
total of 1500 questionnaires were mailed to randomly selected working female
consumers. Participation was voluntary and respondents were informed of
confidentiality of the investigation. In order to prompt the response and
increase the response rate, respondents were informed of a drawing for one
$100 money order for participants who returned completed questionnaires.
(See Appendix D for a copy of the entry form.)
A complete implementation theme was planned. All correspondence
was personalized and all questionnaires were numbered so that
non-respondents could be identified. A preliminary postcard was mailed to
61

inform the respondents of the upcoming questionnaire and research purpose,
and to ask for participation. The actual survey was mailed exactly one week
after the preliminary postcard was mailed. The survey booklet included visual
stimuli, the questionnaire, the money order entry form, and a business reply
envelope. Two weeks later, a yellow postcard follow-up was mailed to all
non-respondents. (See Appendix E for a copy of follow-up postcard.) Six
weeks after initiating data collection, 312 questionnaires were processed, and
the data were tabulated and subjected to statistical analysis.
Variables for the Studv
The variables for the study were:
1. Jacket design preference was measured by responses to 18 business
jacket designs in section I of the questionnaire. Jacket design preference
data was analyzed to determine attractiveness of each jacket design. The
data was measured on a five-point Likert-type scale with 5 indicating very
attractive and 1 Indicating not attractive. This variable was treated as a
continuous variable.
62

2. Perceived importance of clothing was measured by responses to items
(Q05, Q08, Q15, Q17, Q18, Q19) in section III of the questionnaire.
Individuals who perceive clothing to be Important in their work situation are
expected to be different in their selection of preferred designs. The items
were adapted from Rabolt (1984) and Rabolt and Drake (1985). Subjects
indicated their agreement with each statement on a seven-point Likert-type
scale, 7 representing strong agreement and 1 representing strong
disagreement. The sum of all items was calculated for statistical testing and
treated as a continuous variable.
3. Self-confidence in dress was measured by responses to three items
(Q01, Q06, Q10) in section III of the questionnaire. Consumers low in
self-confidence are thought to be different in their selection of preferred
designs. A specific self-confidence scale was used to measure one's
confidence in performing a specific task such as purchasing an automobile or
clothing. The items were adapted from Rabolt (1984) and Rabolt and Drake
(1985). Subjects Indicated their agreement with each statement on a
seven-point Likert-type scale, 7 representing strong agreement and 1
representing strong disagreement. The sum of all items was calculated for
statistical testing and treated as a continuous variable.
4. Self-monitoring was measured from two perspectives using the concept
defined by Lennox and Wolfe (1984). Snyder (1974) first defined
63

self-monitoring of expressive behavior and self-presentation as individuals'
self-observation and self-control guided by situational cues to social
appropriateness. Snyder (1974) originally developed a self-monitoring scale
to discriminate individual differences within three domains: (a) social
appropriateness, (b) sensitivity to the expression and self-presentation of
others in social situations as cues to social appropriateness of
self-expression, and (c) use of these cues as guidelines for monitoring and
managing self-presentation and expressive behavior.
Lennox and Wolfe (1984) later revised the self-monitoring scale
restricting the concept of self-monitoring to the ability to modify
self-presentation and sensitivity to the expressive behavior of others. They
believed this narrow definition of the construct to be more reflective of the high
self-monitor.
Following the definition by Lennox and Wolfe, the self-monitoring scale
employed in this study consisted of two parts, self-monitoring in terms of
sensitivity to expressive behavior of others and self-monitoring in terms of
ability to modify self-presentation. Seven items (Q04, Q09, Q11, Q12, Q14,
Q16, Q20) in section III measured ability to modify self-presentation, while
four items (Q02, Q03, Q07, Q13) measured sensitivity to the expressive
behavior of others.
64

Subjects responded to the statements on a seven-point Likert-type
scale with 7 representing the highest level of self-monitoring and 1
representing the lowest level of self-monitoring. Sum of responses to all items
was calculated and used in statistical testing. The variable was treated as a
continuous variable.
5. Job satisfaction was measured by responses to eight items (Q02-Q03,
Q05-Q8, Q10-Q11) in section V of the questionnaire. The items were adapted
from Bagozzi (1980), Dubinsky and Hartley (1986), and Lucas, Babakus, and
Ingram (1990). Subjects indicated their agreement with each statement on a
seven-point Likert-type scale, 7 representing strong agreement and 1
representing strong disagreement. Sum of responses to all items was
calculated and used in statistical testing. The variable was treated as a
continuous variable.
6. Job-specific situational characteristics elicited the respondents
information regarding corporate culture. The variables, presence of implicit
dress codes (Q09) and visibility to superiors and public (Q01, Q04), were
placed in section V of the questionnaire. Subjects indicated their agreement
with each statement on a seven-point Likert-type scale, 7 representing strong
agreement and 1 representing strong disagreement. Sum of responses to all
items was calculated and used in statistical testing. The variable was treated
as a continuous variable.
65

Size of the firm (Q01), degree of conservativeness at work
(Q02), male and female ratio (Q03), years at firm (Q04), years In career
(Q05), occupation (Q06), job title (Q07), employment status (Q08), career
orientation (Q09), number of customers/clients daily encountered at work
(Q11), and number of superiors/colleagues daily encountered at work (Q12)
were included in section VII.
A. Size of firm - The size of firm variable consisted of (1) small,
(2) medium, (3) large, and (4) other. This variable was treated as a nominal
variable.
B. Conservativeness - The conservativeness variable was measured
on a seven-point Likert-type scale, 7 representing extremely conservative
work environment and 1 representing not at all conservative work
environment. The variable was treated as a continuous variable.
C. Male and female ratio - The male and female ratio variable was
measured as an open-ended question. Subjects filled out blanks indicating
the percentage ratio of males to females at work. Since each ratio totaled
100%, only one of the variables was used for canonical correlation analysis to
eliminate multicollinearity. This variable was treated as a continuous variable.
D. Years at firm and years in career - The years at job and years in
career variables were measured on an open-ended question format. These
variables were also treated as continuous variables.
66

E. Number of customers/clients encountered daily at work and number
of superiors/colleagues encountered daily at work - These variables were
measured on an open-ended question format. The variables were treated as
continuous variables.
F. Occupation and job title - The occupation and job title variables
were also measured on an open-ended question format. The occupation
variable was later classified into two categories; professionals and
non-professionals. Professionals were classified as professional or technical,
manager or administrator, and sales worker. Non-professionals were
classified as clerical worker, craft worker or machine operator, service worker,
and government or military worker. Responses to job title further helped to
clarify any ambiguity in occupation. The job title variable was subsided into
occupation and was not used in data analysis. The occupation variable was
treated as a nominal variable.
G. Employment status - The employment status variable consisted of
(1) full-time, (2) part-time, and (3) other. This variable was treated as a
nominal variable.
H. Career orientation - The career orientation variable consisted of
(1) just-a-job, and (2) career. This variable was treated as a nominal variable.
1. Presence of career objectivity - This variable was measured by
response to item 10 in section VII of the questionnaire. The presence of
67

career objectivity variable consisted of (1) yes and (2) no. This variable was
treated as nominal variable
7. Physical characteristics were measured responses to items (Q01-Q07) in
section VI of the questionnaire. The variables included were height, weight,
body frame size, garment size category, average dress size, eye color, hair
color, and torso silhouette. Height (Q01) and weight (Q02) were measured on
an open-ended question format. Height was measured in inches, while weight
was measured in pounds. These variables were treated as continuous
variables.
A. Body frame - The body frame variable consisted of (1) petite,
(2) small, (3) medium, (4) large, and (5) extra-large. This variable was treated
as a nominal variable.
B. Garment size category - The garment size category variable
consisted of (1) petite, (2) tall, (3) misses, and (4) women's. This variable was
also treated as a nominal variable.
C. Dress size - The dress size variable was measured on an
open-ended question format, and treated as a continuous variable.
D. Hair color - The hair color variable consisted of (1) blonde,
(2) brown, (3) black, (4) red, and (5) other. This variable was treated as a
nominal variable.
E. Eye color - The eye color variable consisted of (1) brown, (2) blue.
68

(3) green, (4) black, and (5) other. This variable was also treated as a
nominal variable.
F. Torso silhouette - The torso silhouette variable consisted of eight
black and white figure drawings: (1) ideal figure type, (2) triangular figure type,
(3) inverted triangular figure type, (4) rectangular figure type, (5) hourglass
figure type, (6) diamond shaped figure type, (7) tubular figure type, and
(8) rounded figure type. This variable was also treated as a nominal variable.
8. Personal characteristics were measured responses to items (Q01-Q08) in
section VIII of the questionnaire. The variables included were age (Q01),
marital status (Q02), educational attainment (Q03), ethnic background (Q04),
geographic location (Q05), household size (Q06), number of children (Q07),
and percentage of financial contribution to total annual household income
(Q08). These variables were treated as continuous variables.
A. Age - The age variable was measured on an open-ended question
format. The variable was treated as a continuous variable.
B. Marital status - The marital status variable consisted of (1) single,
never married, (2) divorced, (3) married, (4) widowed, (5) separated, and
(6) cohabiting. The variable was treated as a nominal variable.
C. Educational attainment - The educational attainment variable
consisted of (1) less than high school, (2) some high school, (3) high school
diploma, or equivalent, (4) some college work, (5) associate degree.
69

(6) bachelor's degree, (7) post-graduate professional training, (8) some
graduate work, (9) master's degree, (10) doctoral degree, (11) post doctoral
work, and (12) other. The variable was treated as a nominal variable.
D. Ethnic Background - The ethnic background variable consisted of
(1) Caucasian, (2) African-American, (3) Hispanic, and (4) Asian. The variable
was treated as a nominal variable.
E. Geographic Location - The geographic location variable was
measured on an open-ended question format. The variable was later
classified into four categories: (1) west states, (2) north-east states,
(3) north-central states, and (4) south states. The variable was treated as a
nominal variable.
F. Number of Children - The number of children variable was
measured on an open-ended question format. The variable was treated as a
continuous variable.
G. Financial Contribution to Household Income - The financial
contribution variable consisted of (1) 10% or below, (2) 11%-20%,
(3) 21%-30%, (4) 31%-40%, (5) 41%-50%, (6) 51%-60%, (7) 61%-70%,
(8) 71%-80%, (9) 81%-90%, and (10) 91%-100%. The variable was treated
as a nominal variable.
70

statistical Analysis of Data
Descriptive statistics, such as frequency, percentage distribution, mean
scores, and standard deviation were utilized to assess personal,
psycho-social, job-specific situational, and physical characteristics of the
respondents. Business jacket purchase and consumption behavior were also
assessed during this preliminary assessment process. Cronbach's alpha
coefficient was calculated to examine internal consistency for self-confidence
in dressing, self-monitoring, perceived importance of clothing, and job
satisfaction scales. Canonical correlation was utilized to assess overall
relationships between business jacket design preference and each set of
variables (personal characteristics, psycho-social identity, job-specific
situational characteristics, and physical profile). Only continuous variables
from each set were included in canonical correlation analysis.
For hypotheses testing, repeated measures analysis of variance with
an unstructured covariance matrix, as fit by PROC MIXED of SAS/STAT® was
utilized. The denominator degrees of freedom for conducting F-tests of
hypotheses testing used Satterthwaite Approximation. When repeated
measures ANOVA with an unstructured covariance matrix could not provide
estimates for F-tests, repeated measures ANOVA with compound symmetry
covariance matrix was utilized to estimate F statistics.
71

CHAPTER IV
RESULTS
The purpose of the study was to investigate the differences in jacket
design preferences of working women. A national cross-section of working
women were sampled with regard to business jacket design preference,
psycho-social identity, job-specific situational characteristics, physical
characteristics, and personal characteristics. Questionnaires were distributed
to 1,500 working females across the nation during the summer of 1999. A
copy of the questionnaire can be found in Appendix A.
Descriptive statistics, including frequency, percentage distribution,
mean scores, and standard deviation were tabulated to describe the sample.
Data were also treated with inferential statistics to test the hypotheses as
proposed in the research model (refer to Figure 3). Nine hypotheses were
formulated for this study to determine: (1) jacket design factors affecting jacket
design preference, (2) psycho-social motivation affecting jacket design
preference, (3) job related situational characteristics affecting jacket design
preference, and (4) physical characteristics affecting jacket design preference.
The results of the study are reported in four sections: (1) reliability of the
scales, (2) description of the sample, (3) analysis of the hypotheses, and
(4) summary of the findings.
72

PERSONAL CHARACTERISTICS
Age Marital Status Educational Attainment Number of Children Age of Children Ethnicity Contribution to Household Income Household Size Professional Wardrobe Expenditure Employment Status Employment Orientation Occupation Geographic Region
H2
PSYCHO-SOCIAL IDENTITY
Self-Confidence in Dressing Self-Monitoring Perceived Importance of Clothing Presence of Career Objectivity Job Satisfaction
H3
JACKET DESIGN ELEMENTS
Jacket Length (H1a) Jacket Pattern (H 1b) Jacket Silhouette (Hie) Jacket Neckline Drop (Hid) Jacket Collar Style (H1e)
H1
DESIGN PREFERENCES
JOB-SPECIFIC SITUATIONAL CHARACTERISTICS
Implicit Dress Code Visibility to Superiors and Public Length of Time in Career Corporate Culture
H4
PHYSICAL PROFILE
Body Weight Body Height Body Silhouette Hair Color Eye Color Dress Size Body Frame Size
H5
Figure 3. Hypotheses and Variables.
73

Reliabiiitv of the Scales
There has been virtual consensus among researchers that a scale
needs to be reliable to be valid and to possess practical utility. Reliability has
been defined as "the degree to which measures are free from error and
therefore yield consistent results" (Peter, 1979, p.6). According to Peterson
(1994), acceptable or sufficient level of reliability varies depending upon a
function of research purpose, whether the research is exploratory or applied,
for example. Peterson summarized the most commonly practiced level of
reliability in behavioral research. The average coefficient alpha, summarized
by Peterson, served as a guideline for comparing the reliability obtained in this
study (refer to Table 6).
In addition, the mean coefficient alpha for varying research design
characteristics was also compared. The research design characteristics
compared were: sample size (a = .78), type of sample (a = .74), number of
scale categories (a = .75), number of items (.73 < a < .81), scale type
(a = .76), scale format (a = .77), nature of scale (a = .78), administration mode
(a = .77), scale orientation (a = .76), nature of construct (a = .79), and type of
research (a = .77). The coefficient alpha in the parenthesis indicates the
average alpha level suggested for the research characteristics used in this
study (Peterson, 1994). The instrument reliability was calculated utilizing
Cronbach's coefficient alpha.
74

Table 6. Comparison of Instrument Reliability of Current Study to Peterson (1994)
Construct
Self-Confidence in Dressing
Self-Monitoring / Sensitivity to Expressive Behavior of Others
Self-Monitoring / Ability to Modify Self-Presentation
Self-Monitoring*
Visibility to Superiors and Public
Job Satisfaction
Perceived Importance of Clothing
Mean a Peterson (1994)
.76
.71
.71
.71
.74
.82
.76
a Current Study
.85
.84
.83
.82
.88
.88
.84
Note: Self-monitoring was measured from two perspectives using the concept defined by Lennox and Wolfe (1984): sensitivity to expressive behavior of others and ability to modify self-presentation. Self-monitoring with asterisk (*) indicates overall self-monitoring after combining sensitivity to expressive behavior of others and ability to modify self-presentation.
75

Overall alpha coefficient for the seven instruments tested exhibited high
reliability (a = .87): self-confidence in dressing (a = .85), self-monitoring
(a = .82), self-monitoring regarding ability to modify self-presentation (a = .82),
self-monitoring regarding sensitivity to the expressive behavior of others
(a = .84), perceived importance of clothing (a = .83), job satisfaction (a = .88),
and visibility to superiors and public (a = .88). The reliability of the
instruments, used in this study, were proven to be acceptable and sufficient,
according to the Peterson's study (1994).
Description of the Sample
The population for this study was working women in the United States
who wear business jackets to work at least once a week. The sample
(n=1,500) was randomly drawn from the consumer data base of National
Demographics and Lifestyles. Questionnaires were distributed to the sample
group during the summer of 1999. Participation was voluntary and
respondents were informed of confidentiality of the investigation.
(See Appendix A.)
Of the 1,500 questionnaires distributed, a total of 312 questionnaires
were returned by the respondents, of which 265 were deemed usable, yielding
a 20.8% response rate. Of the 47 questionnaires that were deemed unusable,
31 did not wear business jackets to work at least once a week, 7 were not
classified as working, and 9 were incomplete.
76

The respondents ranged in age from 22 to 65. The mean age of the
respondents was 44 years (SD = 9.63). As presented in Table 7, the largest
percentage were in either the 36-45 (32.2%) or 46-55 (33.7%) age category.
Approximately half of the respondents (46.7%) had a bachelor's degree or
higher. The majority of the respondents were married (77.4%), working
full-time (81.4%), career-oriented (77.2%), Caucasian (89.8%), had at least
one child (78.9%), had a professional job (professional/technical,
manager/administrator, and sales worker) (75.9%), had two to four family
members (78.1%), and contributed at least 50% of household income (61.5%).
Personal characteristics are outlined in Figures 4 through 15.
Table 8 provides a summary of working women's responses to
business jacket purchase and consumption. Working women wore business
jackets to work 2-3 times a week (jVl = 2.54, SD = 1.38). The majority (76.0%)
of the respondents wore jackets during winter season, followed by fall (20.9%).
The average number of jackets in inventory was approximately 10 (M = 9.9,
SD =11.2). More than half of the respondents wore business jackets with
skirts (54.3%), while approximately 42% of the respondents wore jackets with
pants. More than half of the respondents (61.1%) purchased business jackets
as separates rather than part of a suit. The majority (70.8%) of the
respondents preferred department stores for purchasing professional apparel.
When purchasing professional apparel, the largest group of respondents paid
by either cash or check (42.3%) or bank credit card (44.5%).
77

Table 7. Personal Characteristics of Working Women
Characteristics
Age 18-25 years 26-35 years 36-45 years 46-55 years 56+ No response
Education Less than high school Some high school High school Some college Associate degree Bachelor's degree Post-graduate professional training (Law, Medicine, etc) Some graduate work Master's degree Doctoral degree Post doctoral work Other No response
Marital Status Single, never married Divorced Married Widowed Separated Cohabiting No response
Employment Status Full-time Part-time Other No response
Career Orientation Just-a-job Career No response
n
4 51 85 89 36
0
0 0
31 83 27 56
8
16 30
5 1 8 0
20 27
205 7 3 3 0
215 48
1 1
60 203
2
%
1.5 19.3 32.2 33.7 13.8 0.0
0.0 0.0
11.7 31.3 10.2 21.1
3.0 '
6.0 11.3
1.9 0.4 3.0 0.0
7.5 10.2 77.4
2.6 1.1 1.1 0.0
81.4 18.2 0.4 0.4
22.8 22.80
0.8
78

Table 7. (cont.)
n
141 122 1 1
115 68 15 40 2
15 6 4
%
53.4 46.2 0.4 0.4
44.1 26.1 5.7 15.3 0.8
5.7 2.3 1.6
Characteristics
Career Objectivity Yes No Other No response
Current Occupation Professional / technical Manager / administrator Sales worker Clerical worker Crafts worker / machine operator Service worker Government / military worker No response
Geographic Location West states 28 10.6 (MT, WY. ID, NV, UT, CO, AZ, NM, WA, OR, CA, AK, HI) North-East states 58 21.9 (ME, VT, MA, Rl, CT NH, NY, PA, NJ) North-Central states 86 32.5 (Wl, Ml, IL, IN, OH, ND, SD, lA, MN, NE, KS, MO) South states 93 35.1 (VW, VA, NC, SC, GA, FL, MD, DE, KY, TN, MS, AL, TX, OK, AR, LA) No response 0 00
Ethnic Background Caucasian African-American Hispanic Asian Other No response
238 12 4 2 9 0
89.8 4.5 1.5 0.8 3.4 0.0
79

Table 7. (cont.)
Characteristics n
Household Size 1 32 2 87 3 59 4 61 5 20 6 5 7 1 No response 0
Children Yes 209 No 56 No response 0
Number of Children 0 56 1 55 2 84 3 43 4 20 5 3 6 0 7 1 8 2 No response 1
Percentage of Financial Contribution to the Total Household Income
10% or below 17 11%-20% 20 21%-30% 27 31%-40% 36 41%-50% 58 51%-60% 32 61%-70% 18 71%-80% 4 81%-90% 6 91%-100% 42 No response 5
%
12.0 32.8 22.3 23.0
7.5 1.9 0.4 0.0
78.9 21.2
0.0
21.2 20.8 31.8 16.3 7.6 1.1 0.0 0.4 0.8 0.4
6.5 7.7
10.4 13.8 22.3 12.3 6.9 1.5 2.3
16.2 1.9
Note: The percentage total for each characteristic may not add up to 100 due to the rounding. The no response rate was excluded from the frequency and percentage calculation.
80

0) O) CO
0)
o
40 35 30 25 20 15 10 5 0
18-25 years
26-35 years
36-45 years
46-55 years
56+
Age
Figure 4. Age Distribution of the Respondents.
81

35
30
25 (D S) 20 3 CD ' ^ O Q 10 a.
5 zt (O ' 3 -(A
o O o
CO o 3 (D O
g . (5"
(Q
Q. (/>
(Q O
CD
W a. 0) CD o
CD ? en
"0 o
r.^ (A
^ . (Q
^ Q. (Q £ •
0) 0
—1
0) Q. c 0)
^ (D
o
o 3 CD
(D 0) t o J2. (5 (D
CD O (Q O
CD Q] O
"0 o IT
CD
O
O 0)
Educational Attainment
Figure 5. Educational Attainment of the Respondents.
82

(D
B O
Q.
90
80
70
60
50
40
30
20
10
0 Single Divorced Married Widowed Separated Cohabiting
Mantal Status
Figure 6. Marital Status of the Respondents.
83

O) (0 c O 0
100
80
60
40
20
H
Full-time Part-time
Employment Status
Other
Figure 7. Employment Status of the Respondents.
100
^ o^ 0) O) (D
+-» C
o ^ 0) Q.
80
60
40
?n
Just-a-job Career
Career Orientation
Figure 8. Career Orientation of the Respondents.
84

60
50
iT 40
B 30
I 20 0) CL 10
Yes No Other
Career Objectivity
Figure 9. Presence of Career Objectivity of the Respondents
m
o
CL
50
40
30
20
10
Occupation
Figure 10. Occupation of the Respondents.
85

40
35
Ci 30
^ 25 B 20 § 15 ^ 10
1 West North-East North-Central South
Geographic Location
Figure 11. Geographic Location of the Respondents
100 ^ 90 ^ 80 ^ 70 g) 60 iS 50 § 40 o 30 0) 20 °- 10
0 Caucasian African- Hispanic Asian Other American
Ethnic Background
Figure 12. Ethnic Background of the Respondents.
86

1 2 3 4 5 6
Household Size
Figure 13. Household Size of the Respondents.
8
Number of Children
Figure 14. Number of Children of the Respondents.
87

0)
0)
(D Q.
10% or 11%- 21%- 31%- 41%- 51%- 61%- 71%- 81%- 91%-below 20% 30% 40% 50% 60% 70% 80% 90% 100%
Financial Contribution to Household Income
Figure 15. Financial Contribution of the Respondents to the Total Household Income.
88

Table 8. Business Jacket Purchase and Consumption Behavior
Characteristics
Frequency of Wearing Business Jacket 1 2 3 4 5 6 7 8 No response
Season During Which Business Jackets are Worn Most Frequently
Spring Summer Fall Winter No response
Number of Business Jackets in Inventory
2-5 jackets 6-10 jackets 11-15 jackets 16-20 jackets 21-25 jackets 26-30 jackets More than 30 jackets No response
Apparel Items Most Frequently Worn with Business Jackets
Dress Skirt Pants Other No response
Business Jacket Purchased as a Suit or Separate
Suit Separate No response
n
78 59 62 33 26
2 0 1 4
4 3
55 200
3
119 71 35 16 4 9 9 2
10 144 110
1 0
103 162
0
%
29.9 22.6 23.8 12.6 10.0 0.8 0.0 0.4 1.6
1.5 1.1
20.9 76.0
1.1
45.2 27.0 13.4 6.1 1.6 3.4 3.6 0.8
3.8 54.3 41.5
0.4 0.0
38.9 61.1
0.0
89

Table 8. (Cont.)
Characteristics
Preferred Retail Store Type for Purchasing Professional Apparel
Specialty store Discount store Department store Catalog Other No response
Payment Type Used for Purchasing Professional Apparel
Cash or check Bank credit card Store or catalog card Other No response
Percentage of the Total Household Income Spent on Professional Apparel
10% or below 11%-20% 21%-30% 31%-40% 41%-50% 51%-60% 61%-70% 71% or more No response
n
27 22
187 20
8 1
112 118 35
0 0
140 81 36 4 1 1 0 0 0
%
10.2 8.3
70.8 7.6 3.0 0.4
42.3 44.5 13.2 0.0 0.0
53.2 30.8 13.7 1.5 0.4 0.4 0.0 0.0 0.0
Note: The percentage may not exactly match up with frequency due to the rounding occurred in combining categories. The percentage total for each characteristic may not add up to 100 due to the rounding. The no response rate was excluded from the frequency and percentage calculation.
90

The largest portion (84%) of the respondents spent less than 20% of the total
household income on professional apparel. Figures 16 through 23 present
graphs for each item.
A summary of working women's responses to questions related to
psycho-social identity are presented in Table 9. For all of the items included,
the majority (69.1% to 97.8%) of the respondents answered on scale point 5,
6, or 7. More than half of the working women answered on scale point 7 for
the item stated "At work, I try to make a good impression by my appearance"
(56.2%), "I notice the inappropriateness of women's attire in business
situation" (52.8%), and "It is especially important for those dealing with the
public or clients to portray a professional appearance" (63.4%).
Tables 10 and 11 provide summaries of job-speclfic-situational
characteristics of working women. The majority of the respondents (78.5%)
indicated that they interact with the public or clients. A majority (83%)
indicated they interact with superiors. More than half (57.6%) of the
respondents indicated they feel to a relatively high degree that there is an
unwritten but expected dress code at work. The average size of the firms or
corporations was "Medium" (M = 2.1, SD = 0.87). The respondents indicated
a moderate level of conservativeness at work (M = 4.4, SD = 1.6). The
average male to female ratio at work was 38.5% (male) to 61.4% (female).
The average length respondents worked in their current job (M = 8.87,
SD = 7.84) and career (M = 8.3 SD = 7.32) was 9 years.
91

Jacket Per Week
Figure 16. Frequency of Wearing Business Jacket Per Week.
0
c o
80 70 60 50 40 30 20 10 0
Spring Summer Fall Winter
Season
Figure 17. Season During Which Business Jackets are Worn Most Frequently by the Respondents.
92

0)
(D O
50 45 40 35 30 25 20 15 10
2-5
jackets
6-10
jackets
±5 11-15
jackets
16-20
jackets
21-25
jackets
26-30
jackets
More
than 30
jackets
No
response
Jackets
Figure 18. Number of Jackets in Inventory.
Dress Skirt Pants
Apparel Itenn
other
Figure 19. Apparel Items Most Frequently Worn with Jackets by the Respondents.
93
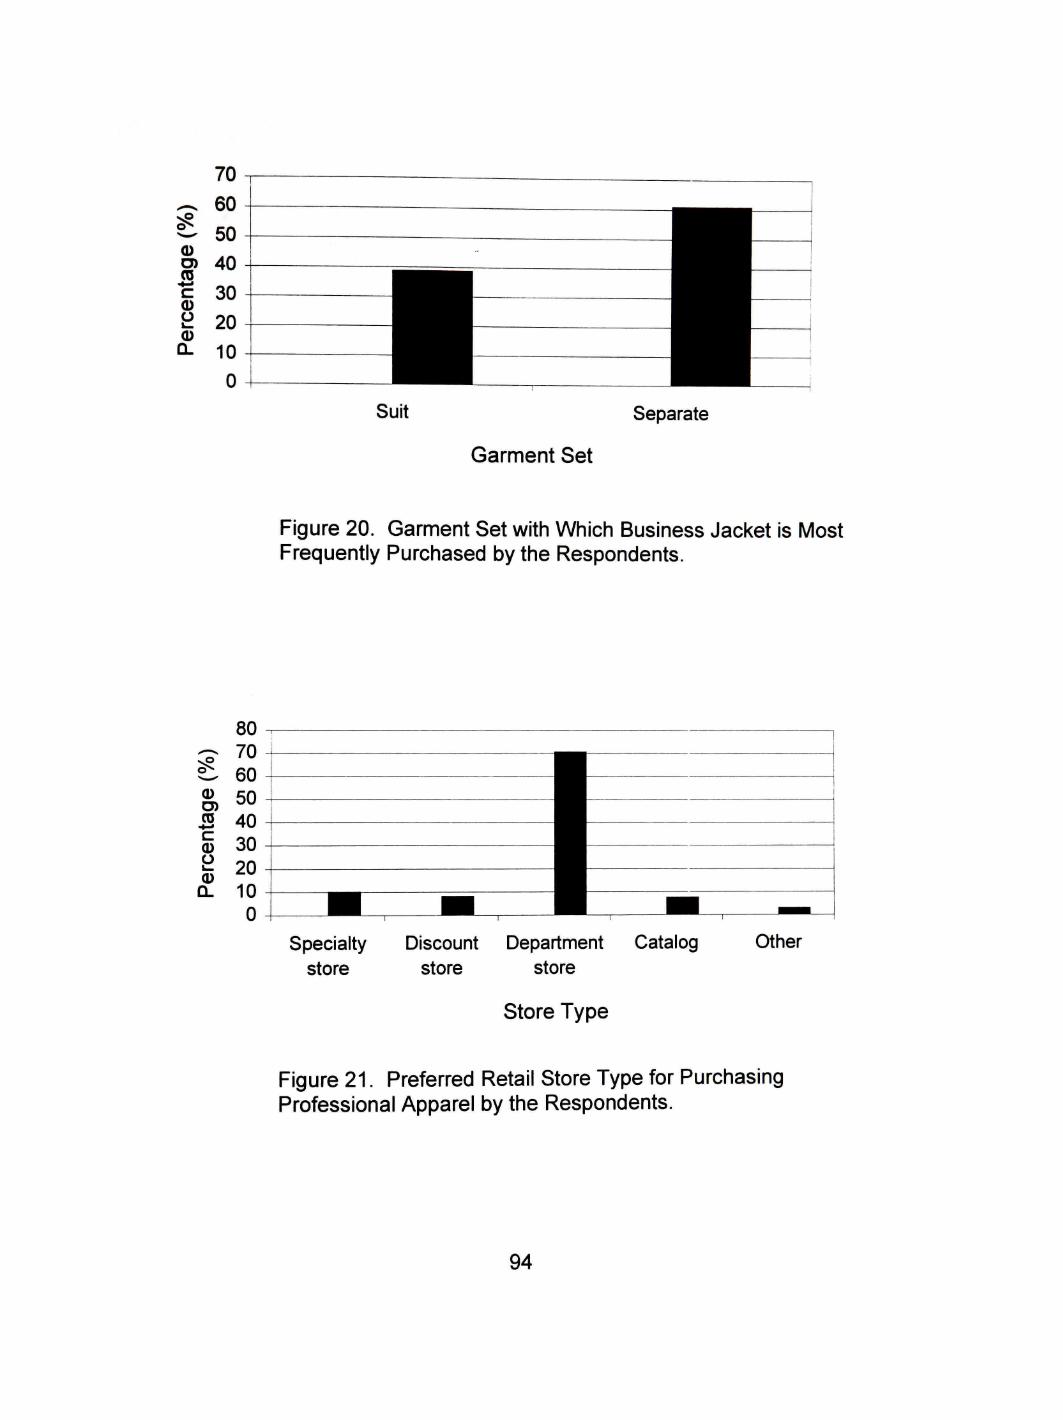
0) O) (0 c 0) o 0)
0 -
70 60 50 40 30 20 10 0
Suit Separate
Garment Set
Figure 20. Garment Set with Which Business Jacket is Most Frequently Purchased by the Respondents.
0) O) (0 c 0)
o a.
80 70 60 50 40 30 20 10 0
Specialty Discount Department Catalog store store store
Store Type
other
Figure 21. Preferred Retail Store Type for Purchasing Professional Apparel by the Respondents.
94

50 45 40
5:^ 35 0) 30 f 25
20 0 O 15 0) 10
Q- 5
0 1 Cash or check Bank credit
card
Store or catalog
card
other
Payment Type
Figure 22. Payment Type Used for Purchasing Professional Apparel by the Respondents.
o D)
c O 0
60
50
40
30
20
10
0 =t 10% or 11%- 2 1 % -
below 20% 30%
3 1 % -
40%
4 1 % -
50%
5 1 % -
60%
6 1 % -
70%
71% or
more
Portion of the Total Household Income
Figure 23. Percentage of the Total Household Income Spent on Professional Apparel Annually by the Respondents.
95

"o I-
c i
265
h-
t CM O)
265
00
265
"*
CO
265
r«-r
265
CM
CM
CD
265
1^
265
"* d CM
m
c 0) E o
c
(0
E (D
Li . M—
o >»
CD CO Oi a> CO 00
C I
in o^
^ s^
C I
CO
CO CM
S
.^
OC) '"
00
N. h-: '"
o CO
oo CM
m
CM
ai • ^
In
.^
in • ^
o
o> rr
CM
CM
cxi • ^
in
Ti-
ai
m CM
CM "^
CI 00 CO
o CO CM 00
in
CM
m CD
in CM
CO CO
TT <D
in CO
CO
in
CM
in (D
h.;
-
CO
CO
cvi
00 CM
m
a> 04
CD CD
CM <J>
In
r««. in
CM CO
1^ CO
CM r ^ CM
CM
o "«t
CO
ai Tf
CD in CO
c CM CD CM
a> o> o CO
00
d
CO o o
CO I o .c o CO
Q.
C I
C I
00 d
CM
in
00 d
est
CO
00 c>
CM
CO
o CO
00
CO 00 CM
o d
CO CO
J)
c
<D
c .2>
O)
E 0)
(0 (0
£ o
0) u c 0) "O
c o o
H i 0) V)
.£2
c -^ <u $^
T 3 CO
8§
d) (0
S QL
C3)
c "(0 o o
T3 o o a> E (0
o T3 c
o
CO
c o (/> M
o Q.
0) o c (0 k.
? 0) • ^ Q. c ca.
K^ .Eg c-2
c o 8 ^ ^ ! !
> l <u "5 **- o
(0
o
o
I" < O)
c •c c o o .t: 'is
l l 2 0) ^L (0 — 0) o> c
CO Q .
v> V)
5 g c o jo 25
OJ "(0 OJ
3 W O
E CO
c 0)
(0 0) c
•tf)
^ » CO x >
o • >
CO
CO
is .c o *»-— • > "O
C (1) CD
TO >. .52 3 E 0)
CO * i • " (A (0 O)
.isl Eii E c- -Q O
. = CO (0
-fE" O i 0)
0) C (A
0 - 0 "- c .t;
S CD CJ) *- i: c (0 t CO
-c 2 .c <D E .>»
^ CO 15 (0
— CO rt
(1) ' ^ ^ .c <o c -JS > E «J ?
IH c >- c (0 a) o
— * - (0
CO OJ . t i
£ O w
_ 00 (0
96

"o
C I
CD
C I
in o^
C I
C I
CO
c
O
CJ> CO
CM ^
C I
265
CM CD
m
149
r in CM
00 CD
CM
d
CM
CM h-i
CJ)
"«a-d
265
o d
106
^ CO CM
CM CD
^_
00
00
oo CM
CO
00 CO
d o d
265
46.0
12
2 30
.6
00
14.7
C3> C O
1 ^
in
in
T -
• ^
265
52.8
14
0
27.2
CM
15.8
CM
CJ)
''"
in
"sf d
265
48.3
12
8 29
.1
r ^ r ^
13.6
CD CO
in h-i
o CM
00
d
265
34.3
O)
20.4
m
18.9
o in
o -"i-'
CO
o d
265
32.5
CD 00
18.9
o in
17.7
O) 00
o in
O)
r
265
63.4
16
8 21
.9
00 in
12.5
C O C O
in • ^
"^
00
d
CO
CO
d
CM
d
CD
m
CM
CM
CO
CJ)
CM
o d
o d
CJ) 00 d
in d
C3) oo d
o d
C I
(0 E a>
m
c o
"to (0 0) Q.
E TJ O O O) (0 0)
CO 0)
2 2 >» to
^ Q . Q.
^ (0
Ir < X I
(O
Ii §2 'to "(J <" 2? (0 0) 0) "-c ^
'to Q. 5 o
.O 0) c Q .
^ 5
51 >s to (0 0) 5 0 ) 0) (0
>
(0
S! a X
UJ o
>
0) c V (0 «..
ing
k
B
i2 0)
0th
o
i.2
( 0 CQ
CM
to .2> CD * -
£ to-O C O (0 CO CL
0) O ) . o
i c « -
£ CO . i ^ o c o
>^ o .co^
£ to i_ (D " O
o Si ~ c to O CO . "C ~ 3 JK: — X 3 CO
CO c o
c « <u
CO
(0 C S CO
S- = &.E (0 <u c . t 0) ro £ to (D t O 0)
o S f i
•o i 2 o ro o Q) C Q. 0) CL to ro to , - 0) c to ro . CO 1 ro
ro
m
O)
c Ic -o o •
CM
^^
c to 0 ) CO E ^ <u o _ Q. _
CO
men
' if
wo
o
Iity
ro zs CJ" 0)
^_
ice
. o c ^
«*-
.fin
e
C3)
oi CO c o '.^ ro 3
•Jo CO CO
c "co 3 .a
j5 o)
0) o c
o a E
"O 0)
> o k i 0)
Q.
CO
3 O
JZ CO
•g '2.2 5 l o <c
O - •=; a, ro ro o O CO
. C CO
to 2
CL CO
E 2 ILI -O
O)
_c "ro
(D ro CO LT
r Q. £2 . c «2 S ro c c •c (D ro
c " S ^ ^ ro .ro -Q "TO t^ Q £=
Q. 0} M 5fi £ «« Q) - ^ 0)
w £ o
97

B "o
•>5
CI
CD
CI
in
CI
-a- «3-
CO ^
c o o^
ai J) .a (D
I -
Cl
CM
m CO CM
CD CO CO
CJ)
00 CD CM
CI
o CM
CO in
CM
d
CM
CO
CJ)
CJ)
in
m CD Cvj
CM
d CO
o 00
CO
ob CM
in
CD
cvi CM
o CD
CD
d
00 CM
Oi
CO
CJ)
in
m CD CM
oo Cvi m
o
00 CO CM
CO CD
in in
CO in
CJ)
m
00 d
CM
m CD CM
CO in
o CM
00
(6 CM
00 in
CM
CJ)
CM
in
00
d
CM
m CD CM
CO CM
CM CD
00
00
h-"*
CO
00 d
oo
265
o d
106
CJ)
CM
OO
in
00
d CM
in in
CM
d
CM
CM
-^
V
. _ T-^
265
o d
106
^
c^
CD in
00
ai
CD CM
00 O)
CD CM
O)
d
O) CM
o CO
265
00
d CM
in in
CM 00
00
m CM
CO CO
00
d CM
m m
in CM
CO CO
-«»•
d
265
CO CM
113
00 in CO
m O)
in cvi
CO CO
00
d
00
"^ d
T—
" d
265
CO
?)
CO 00
CJ)
CM
00 in
CD CO
CD CO
in 00
CJ)
" d
r-
CJ) • ^
CO 00 CO
in o d
00 d
in CJ) CO in 00
in CO
CI CO CM CM in CO CM
CJ)
to E tu
ro
ro
ays
portr
ro o o 5 0) ro E 0) r" o)
It is
impo
rtant
fo
pr
ofes
sion
al im
a
E
ng h
elps
w
ork.
ot
hi
sa
t a
id
then
W
earin
g p
rofe
ssio
n
gain
res
pect
from
o
ager
s lly
is
gs w
ith m
am
prof
essi
ona
C CJ) -.;= c 5> to E 0)
Whe
n a
ttend
ing
or
col
leag
ues,
d
Impo
rtan
t.
ro
doth
ing
na
l' ss
io
p
1 co
nsid
er m
y pr
*-*
good
inve
stm
en
c c
c to — fll
vels
d
dn
S-3 = o ire
.
Em
ploy
ees
at a
l O
rgan
izat
ion
sh
P
rofe
ssio
nal a
tt
ob S
atis
fact
ion
fied
ery
satis
> E
dng,
1 a
G
ener
ally
spe
al
with
my
job.
«
1 m
y jo
b.
tting
f q
ui
o
1 fr
eque
ntly
thi
n
ing.
* k
of q
uitt
thin
fte
n
o X)
Peo
ple
in m
y jo
do
f h
the
kin
Iw
it sf
iec
1 am
gen
eral
ly s
atii
X) o^
wor
k 1
do in
my
E ro
path
that
<D
can
ro 0)
My
job
offe
rs m
pl
ease
d w
ith.
98

^
c o o^
0)
TabI
tal
o 1 -
r^
C I
^ C D ^
C I
in °^
C I
N O
• ' I" o
C I
C O ^
c\
CM ^
C I
C I
to
E B
m CO CM
CJ)
d m
m CO
00 CO CM
CO CD
2.5
T "
CO CO
h-; 00
CO CM
2.6
r-
1 < ^
CM
0.8
CM
o 0)
^
sz
1 o
and
resu
lt
1 V ro 1 TJ 1 ' 58 1 Q. ro 1 u— ^^
nse
o ih
men
<1) w< <«=Q.
1 fe
el a
ac
com
1
m CD CM
CM i n • ^
o -*
CO oc> "^
CJ)
2.3
CM
O) i n
T -
d CM
CJ) CD
1.0
• ^
CJ) CM
CO
CO
O
3.0
00
T3
sfie
^ ro to
^ 0)
ba
rev
o^
this
c 6 (1) ^ "5.
o • g
i n CD CM
CD
d ' "
"* "«*•
a> 00
' "
o i n
7.0
^
i n "*
r-iri CM
00 CD
0.9
^~
O) CM
CO
iri 5.
7
i n
^ (U
c ro
Oi 0) C C
d lo
oki
ir to
mi
c ro (D r =
a fr
i si
m
0) ^
& 1 ^ 0) -n iS
O Q . . C - = _
<u o ^ 5 - 9 £ 2 5 - . 2 ,
C3) C
se c
odi
exhi
bit
^B > c 0) 0) • - TJ
x: o • ^ Q . VT to
afte
e
re
spon
se
ctio
n th
ts
' re
atis
fa
C to
It
espo
le
ss
"- 0) <D JO
£ *^ ^ .52"
e in
dica
nu
mbe
r
0) (U • ^ £ "O 1 -Oi 0) •c 5 o o Q . — 0) 0) *- .c
ures
b
it.t
th
e fig
i its
exh
i fo
re,
nden
.
The
re
e re
spo
se c
oded
fa
dio
n th
u: to
eve
sati
2 o
5 s ^.^ o
teris
k (*
s,
the
m
</) —
tha
iber
<n c E <D B J= r t i * ^
The
ig
hei
ote:
h
eh
Z h-
99

c (D E o
c
J) E (D
LL
cn o (0
'u. 0) t5 i _
O
"TO c o
"cD • ^
CO O
O (U Q .
CO I
o - 3
(0 h-
B "o
C I
CD
C I
in o^
C I
-^ ^
C I
CO
C I
CM
C I
to E 0)
n 3
Q. "O c (0
12
0)
a 3 (0 o
'55 • >
265
o 1^ m
151
CM
d
CM
CO T—
o CO
CNJ NI
265
CD CO
m
142
^
CM
CD in
CO OC)
CM CM
CJ) h>l
CJ)
CO
in
in
CM
m
CM
0) o B
B "c 2 T3-d I - o o 5 .2 >, S E
(D to x: c *- o .t; ro
c V — o
CM
CD
CM
m
CJ)
CO
0) o
.ro
CO ^
.2 o
Q. > .
>,.9 E CO
£i
( 0 CO
.E ro
0) •a o O (0 0)
CD CM
CM
CM
s
CD 00
CJ)
00
CJ) CO
CD
d
CJ)
00 ai
CD CM
d
CD
o CM
>» E c
TJ —
o c
0) E Q. O
c-g ^.2 ~ CO > CO
3 P
c ro 52 0) c.
a. u.
B o TJ
£ | 8 _ CO 0) CO ^
0) p E _ T J «;=
a E
CD CO c o CL CO
o c
0) 3
TJ i n CD CM
o Q. 3
TJ TJ ro o c CO 0)
o TJ (U
TJ O O CO CO Oi
o • Q .
E
ro o >» o c Oi 3 CT 0) i : Oi
Oi
o
z
100

Table 11. Job-Specific-Situational Characteristics of Working Women: Corporate Culture
Characteristics n %
Size of the Firm / Corporation Small Medium Large Other No response
Conservativeness of the Firm / Corporation
1 (Not at all conservative)
2 3 4 5 6 7 (Extremely conservative) No response
Male Ratio 10% or below 11%-20% 21%-30% 31%-40% 41%-50% 51%-60% 61%-70% 71%-80% 81%-90% 91%-100% No response
Female Ratio 10% or below 11%-20% 21%-30% 31%-40% 41%-50% 51%-60% 61%-70% 71%-80% 81%-90% 91%-100% No response
81 70 110 3 1
30.7 26.5 41.7 1.1 0.3
14 19 28 89 46 40 28 1
64 19 22 41 43 30 15 17 5 4 5
7 14 17 31 41 39 18 32 21 40 5
5.3 7.2 10.6 33.7 17.4 15.2 10.6 0.4
24.6 7.3 8.4 15.8 16.5 11.6 5.8 6.5 1.9 1.6 1.9
2.8 5.4 6.5 12.0 15.8 15.0 6.9 12.3 8.1 15.4 1.9
101

Table 11.
Characteristics
Years in the Firm / Corporation Less than 1 year 1-2 years 3-5 years 6-10 years 11-15 years 16-20 years 21-25 years More than 26 years No response
Years in Current Career Less than 1 year 1-2 years 3-5 years 6-10 years 11-15 years 16-20 years 21-25 years More than 26 years No response
Number of Customers / Clients Daily Encounter
No interaction 1-10 11-20 21-30 31-40 41-50 More than 50 No response
Number of Supervisors / Colleagues Daily Encounter
No interaction 1-10 11-20 21-30 31-40 41-50 More than 50 No response
(cont.)
n
23 42 57 54 43 21 11 13
1
20 39 68 65 37 10 A A
14 9 '5 3
20 102 47 28 10 1 w
14 37
7
20 169 36 13 9 7 8 3
%
8.7 16.0 21.7 20.4 16.3 8.0 4.2 5.0 0.4
7.5 15.0 26.0 24.8 14.1 3.8 5.3 3.5 1.2
7.8 39.6 18.3 10.9 3.9 5.4
14.6 2.7
7.6 64.6 13.7 5.0 3.4 2.7 3.2 1.2
L- u^ro^torictir mav not add up to 100 due to the rounding
102

The average number of customers encountered daily at work was 55
(SD = 203.59), while the average number of colleagues encountered daily at
work was 19 (SD = 123.95).
The subjects' physical profiles are summarized in Table 12. The
respondents had an average height of 5'4" (SD = 1.45) and an average weight
of 154.9 lbs (SD = 36.69). Approximately half of the respondents (46.4%) had
a medium-sized body frame. The most purchased garment size category was
misses (44.5%), followed by petite (27.5%) and women's (20.4%). The
average dress size purchase was size 12 (SD = 5.57). More than half of the
respondents had brown hair (56.6%), followed by blonde (24.9%).
Approximately half of the respondents had brown eyes (47.3%), followed by
blue (29.5%), and green (20.8%). Approximately twenty-five percent of the
respondents had a triangular figure type, followed by an ideal type (17.5%),
rounded type (16.0%), and hourglass type (11.0%).
The subjects' responses to the 18 business jacket designs are
summarized in Table 13 in terms of means and standard deviations. The
business jacket design codes are listed in the order of their appearance in
section I of the questionnaire. To further describe the respondents' jacket
design preference, canonical correlation was utilized. The results of the
canonical correlation analysis are summarized in Table 14. There was only
one canonical linear combination found to be significant (Likelihood ratio = .67,
F(54, 718.9) = 1.9, p < .0001) with a correlation coefficient of .48.
103

Table 12. Physical Profile of Working Women
Characteristics n %
Height 5'or shorter 12 4.6 5'1"-5'4" 105 39.9 5'4"-5'7" 119 45.1 57" or taller 28 10.7 No response 1 0.4
Weight 100 lbs or less 4 1.6 101 lbs-120lbs 38 14.6 121 lbs-140lbs 44 16.8 141 lbrs-160lbs 78 29.6 161 lbs-180lbs 58 22.0 181 lbs-200lbs 21 8.0 201 lbs or more 21 8.1 No response 1 0.4
Body Frame Size Petite 33 12.5 Small 40 15.1 Medium 123 46.4 Large Extra-Large No response
Other No response
Generally Purchased Dress Size Size 2 or smaller Size 3-Size 4 Size 5-Size 6 Size 7-Size 8 Size9-Size 10 Size 11-Size 14 Size 16-Size20 Size 22-Size 26
53 20.0 16 6.0 0 0.0
Generally Purchased Garment Size Category
Petite 73 i(.^ Tall 19 7.2 Misses 118 44.5 Women's 54 20.4
1 0.4 0 0.0
5 1.9 11 4.2 17 6.4 38 14.4 35 13.3 90 34.0 53 20.0 13 4.9 " 1 2
Size 28 or larger ^ ^ Q No response
104

Table 12. (cont.)
Characteristics n %
Hair Color Blonde Brown Black Red Other No response
Eye Color Brown Blue Green Black Other No response
Figure Type Ideal type Triangular type Inverted-triangular type Rectangular type Hourglass type Diamond shaped type Tubular type Rounded type No response
66 150 19 14 16 0
125 78 55 3 3 1
46 65 20 15 29 22 24 42 2
24.9 56.6 7.2 5.3 6.0 0.0
47.3 29.5 20.8 1.1 1.1 0.4
17.5 24.7 7.6 5.7 11.0 8.4 9.1 16.0 0.8
Note: The percentage total for each characteristic may not add up to 100 due to the rounding. The no response rate was excluded from the frequency and percentage calculation.
105

Table 13. Means and Standard Deviation of Business Jacket Design Preference
Business Jacket Design Code
12020
21220
10111
22011
00000
11110
12201
20221
02212
00210
21012
22100
11202
02122
20102
01121
10022
01001
N
265
265
265
265
265
265
265
265
265
265
265
265
265
265
264
265
264
265
M
3.649057
1.973585
3.698113
3.090566
3.766038
3.437736
2.177359
1.577359
2.426415
2.309434
2.796226
3.249057
2.166038
3.6
2.924242
3.611321
3.291667
3.883019
SD
0.996
1.191
1.007
1.29
1.11
0.955
1.088
0.889
1.178
1.074
1.36
1.183
0.989
1.036
1.215
1.027
1.002
1.025
Note- Five-digit jacket design code indicates levels in each variable: first digit indicates jacket length (0 being short. 1 being hip level. 2 being tunic level); second digit indicates jacket pattern (0 being plaid. 1 being pin-striped, 2 being solid); third digit indicates jacket silhouette " g fitted. 1 being semi-fitted. 2 being loosely fitted); fourth digit indicates jacket neck me drop (0 being ow/waist deep. 1 being medium/below bust. 2 being h'9h/aboye bus ), ^ ^ ^ ^ last digit indicates jacket collar style (0 being no lapel. 1 being nof^^dcoNar_2 being shawl collar) The respondents rated their degree of preference for each jacket design on 1 to 5 Likert type scale, 1 indicating not attractive and 5 indicating very attractive.
106

Table 14. Summary of Canonical Corelation Analysis
Variables
Standardized Canonical Coefficients for the "VAR" Variables (VI)
Standardized Canonical Coefficients for the "WITH" Variables (Wl)
12020
21220
10111
22011
00000
11110
12201
20221
02212
00210
21012
22100
11202
02122
20102
01121
10022
01001
Age
Height
Dress Size
0.0995
0.5599*
0.0639
-0.6474*
-0.2294*
0.0149
-0.0479
-0.0044
-0.2522*
0.0660
0.1395
-0.0118
0.0838
-0.2694*
0.0724
-0.0845
-0.0049
-0.0185
0.7238*
0.0014
0.5227"
Note: Canonical correlation coefficient between VI and Wl was .48, and the 'ikenh°od ratio was .67 (p < .0001). Variables with asterisk (*) are considered to be fairly significant variables for the linear combination VI and Wl.
107

As illustrated in Figure 24, the respondents who were older in age and
larger in dress size exhibited a relatively high preference for jacket design
#21220 (tunic level length, pin-striped pattern, loosely-fitted silhouette, above
bust neckline, and no lapel collar style). The same respondents exhibited a
relatively low preference for jacket design #22011 (tunic length, solid, fitted,
below bust neckline, and notched collar style), #00000 (short length, plaid
pattern, fitted silhouette, waist deep neckline drop, and no lapel collar style),
#02212 (short length, solid pattern, loosely-fitted silhouette, below bust
neckline, and shawl collar), #02122 (short length, solid pattern, semi-fitted
silhouette, above bust neckline, and shawl collar). The results were reversed
for respondents who are younger in age and smaller in dress size.
Analvsis of Hypotheses
Nine hypotheses were analyzed using SAS/STAT^ (refer to Figure 3).
The hypotheses were tested using repeated measures Analysis of Variance
with an unstructured covariance matrix, as fit by PROC MIXED of
SAS/STAT^ . The denominator degrees of freedom for conducting F-tests for
hypotheses testing used Satterthwaite Approximation. When repeated
measures ANOVA with an unstructured covariance matrix could not provide
estimates for F-tests, repeated measures ANOVA with compound symmetry
covariance matrix was utilized to estimate F statistics.
108

D)
a> N
w (0
res
< Q c '^ T) O
CD m L_
ro
(D N
0) W O) CO
< w c a?
o E > - CO
c
o O
CO
ro o 'c o c ro
O
y^ c o
ro CO
S T- O CM CM ^j ' ^ O T- CN 1 ^ O O CM •«-
CM O CM CM CM CM O O O
0 )$ $ $ $
~ o o o o
O T- O CM CM CNI T- O T- CM CM O O CM T-•»- CM O CM CM CN CM O O O > .c jz .c x: g O) D) O) O)
_J X X X X
CN 0
109

Due to the fact that this study employed 18 jacket designs among 243
possible designs, and the five design factors (jacket length, jacket pattern,
jacket silhouette, neckline drop, and collar style) were crifical in fitting the
statistical model, the five factors were constantly included in the model. In
addition, each independent factor (e.g., age, self-confidence in dressing,
implicit dress code, height, etc) was entered into the model one at a time. For
the convenience of stating the statistical models tested, jacket design
preference, jacket length, jacket pattern, jacket silhouette, neckline drop, and
collar style will, here after, be termed as Pref, F1 (Fn, F12), F2 (F21, F22), F3
(F31, F32), F4 (F41, F42), and F5 (F51, F52), respecfively. The statistical model
used to test hypotheses la through hypothesis 1e was:
Pref = Po + P11F11 + P12F12 + P21F21 + P22F22 + P31F31 + P32F32
+ P41F41 + P42F42 + P51F51 + P52F52 + E-
The statistical models used to test hypothesis 2 through 5 are reported in the
order of their appearance.
For this study, only two factor interactions were included in the
hypotheses testing because there were too many parameters being estimated
and the repeated measures ANOVA could not provide estimates for more than
two factor interactions. Although using 18 jacket design combinations of 243
possible combinations was the most efficient way of esfimating parameters for
the variables included in the study, in some cases, it could not provide enough
information to estimate the parameters for two factor interaction terms.
Therefore, not all of the two factor interaction terms could be estimated.
110

Repeated measures Analysis of Variance was used to identify significant
Interaction terms in explaining variance in jacket design preference.
Significant interactions between nominal variables were further
examined by comparing Least Squares Means. Significant Interactions among
continuous variables were investigated using the "Solution" option in
SAS/STAT® procedures. The solution option provided beta estimates for the
factors fitted in the model creating dummy variables for 5 design factors
(nominal variables). To calculate the predicted value for jacket design
preference, several values between minimum and maximum values for the
continuous variables were plugged into the model. For the convenience in
calculation, the excluded categories (F1 = 2, F2 = 2, F3 = 2, F4 = 2, and
F5 = 2) were used to calculate the predicted value.
Hvpothesis la
Jacket length (F1) affects the subjects' business jacket design
preference. Jacket length was found to be significant (F(2,264) = 65.42,
p < .0001). Therefore, hypothesis la was accepted.
Hvpothesis 1b
Jacket pattern (F2) affects the subjects' business jacket design
preference. Jacket pattern was found to be significant (F(2,264) = 12.16,
p < .0001). Therefore, hypothesis lb was accepted.
I l l

Hvpothesis 1c
Jacket silhouette affects the subjects' business jacket design
preference. Jacket silhouette was found to be significant (F(2,264) = 329.05,
p < .0001). Therefore, hypothesis 1c was accepted.
Hvpothesis 1d
Jacket neckline drop affects the subjects' business jacket design
preference. Jacket neckline drop was found to be significant (F(2,264) = 9.02,
p = .0002). Therefore, hypothesis Id was accepted.
Hvpothesis 1e
Jacket collar style affects the subjects' business jacket design
preference. Jacket collar style was found to be significant (F(2,264) = 8.27,
p = .0003). Therefore, hypothesis 1e was accepted.
Interactions Related to Hypotheses l a - l e
The interaction effect among the five factors were tested. Six
interactions related to hypothesis la through 1e were significant.
1. Interaction between Jacket Length and Jacket Pattern.
The statistical model used to test this interaction was:
Pref = Po + P11F11 + P12F12 + P21F21 + P22F22 + P31F31 + P32F32
+ P41F41 + P42F42 + P51F51 + P52F52 + p6FrF2 + s.
112

The interaction between jacket length and jacket pattem was significant
(F(4, 264) = 13.37, p < .0001). According to the Least Squares Means
Analysis (refer to Figure 25), the respondents greatly preferred the short
jacket length with solid pattern and the hip level jacket with plaid pattem.
Overall, the tunic level jacket was least preferred among the three jacket
lengths, and its preference level was consistent regardless of the patterns
used in the design.
2. Interaction between Jacket Length and Jacket Collar Style.
The statistical model used to test this interaction was:
Pref = po + P11F11 + P12F12 + P21F21 + P22F22 + P31F31 + P32F32
+ P41F41 + P42F42 + P51F51 + P52F52 + P6FrF5 + 8.
The interaction between jacket length and jacket collar style was significant
(F(4, 264) = 13.37, p < .0001). Overall, the respondents preferred the short
jacket regardless of the collar style (refer to Figure 26). Preference for the hip
level jacket decreased when combined with a shawl collar. The tunic length
jacket was preferred the most when combined with no lapel, and preferred the
least when combined with a shawl collar. The notched collar style was
preferred more with short and hip length jackets.
3. Interaction between Jacket Pattern and Jacket Silhouette.
The statistical model used to test this interaction was:
Pref = Po + P11F11 + P12F12 + P21F21 + P22F22 + P31F31 + P32F32
+ P41F41 + P42F42 + P51F51 + P52F52 + P6F2*F3 + 8.
113

•Jacket Length: Short
•Jacket Length: Hip
Jacket Length: Tunic
Plaid Pin-striped
Jacket Pattern
Solid
Figure 25. The Effect of Interaction between Jacket Length and Jacket Pattern.
No Lapel Notched Collar
Collar Style
Shawl Collar
-•—Jacket Length: Short
-•— Jacket Length: Hip Jacket Length: Tunic
Figure 26. The Effect of Interaction between Jacket Length and Jacket Collar Style.
114

The interaction between jacket pattem and jacket silhouette was found to be
significant (F(4, 264) = 18.47, p < .0001). Overall, the respondents preferred
the fitted and semi-fitted jacket silhouettes regardless of the patterns used in
the design. The loosely-fitted silhouette was the least preferred silhouette.
Jacket design preference for the loosely-fitted silhouette dramatically dropped
regardless of the patterns (refer to Figure 27).
4. Interaction between Jacket Pattern and Jacket Neckline Drop.
The statistical model used to test this interaction was:
Pref = Po + P11F11 + P12F12 + P21F21 + P22F22 + P31F31 + P32F32
+ P41F41 + P42F42 + P51F51 + P52F52 + P6F2*F4 + 8.
The interaction between jacket pattern and jacket neckline drop was found to
be significant (F(4, 264) = 14.44, p < .0001). As illustrated in Figure 28, the
respondents' preference for plaid and solid patterns was consistent regardless
of the changes in neckline drop. Preference for pin-striped patterns decreased
when combined with below bust necklines. Pin-striped patterns were
preferred when combined with either the waist deep or above bust neckline.
Below bust neckline designs were preferred the most for solid patterns.
5. Interaction between Jacket Silhouette and Jacket Collar Style.
The statistical model used to test this particular interaction was:
Pref = Po + P11F11 + P12F12 + P21F21 + P22F22 + P31F31 + P32F32
+ P41F41 + P42F42 + P51F51 + P52F52 + P6F3*F5 + 8.
115

-Jacket Pattem: Plaid
•Jacket Pattem: Pin-striped
Jacket Pattem: Solid
0) >*— CL c
(D Q *-• 0)
J^ o ro
Fitted Semi-fitted Loosely-fitted
Jacket Silhouette
Figure 27. The Effect of Interaction between Jacket Pattern and Jacket Silhouette.
(D O C
*=: 3
4
.5
3
2.5
2
1.5
•Jacket Pattern: Plaid
•Jacket Pattern: Pin-striped
Jacket Pattern: Solid
Waist Deep Below Bust
Neckline Drop
Above Bust
Figure 28. The Effect of Interaction between Jacket Pattern and Jacket Neckline Drop
116

The interaction between jacket silhouette and jacket collar style was found to
be significant (F(4, 264) = 13.98, p < .0001). As depicted in Figure 29, the
loosely-fitted silhouette was preferred the least among the three silhouettes.
Particularly, the loosely-fitted silhouette with a notched collar was the least
preferred combination. The fitted and semi-fitted jacket was consistently
preferred regardless of the collar style used.
6. Interaction between Jacket Neckline Drop and Jacket Collar Style.
The statistical model used to test this particular interaction was:
Pref = Po + P11F11 + P12F12 + P21F21 + P22F22 + P31F31 + P32F32
+ P41F41 + P42F42 + P51F51 + P52F52 + P6F4*F5 + 8.
The interaction between jacket neckline drop and jacket collar style was found
to be significant (F(4, 264) = 18.61, p < .0001). Based on the results, the
notched collar was the most preferred collar style for the below bust neckline
design and was the least preferred collar style for the above bust neckline
design. No lapel was the most preferred collar style for the above bust
neckline design, while it was the least preferred collar style for the below bust
neckline design (refer to Figure 30).
Hvpothesis 2
The personal characteristics of the subjects affect the subjects'
business jacket design preference. The statistical model used to test the
hypothesis was:
117

-Jacket Silhouette: Fitted
•Jacket Silhouette: Semi-fitted
Jacket silhouette: Loosely-fitted
No lapel Notched Collar Shawl Collar
Collar Style
Figure 29. The Effect of Interaction between Jacket Silhouette and Jacket Collar Style.
0) o c (D
CL
c
(D
a
3.5
2.5
Kjf p
1.5
- Neckline Drop: Waist deep
-Neckline Drop: Below bust
Neckline Drop: Abo\e bust
No lapel Notched Collar
Collar Style
Shawl Collar
Figure 30. The Effect of Interaction between Jacket Neckline Drop and Jacket Collar Style.
118

Pref = Po + P11F11 + P12F12 + P21F21 + P22F22 + P31F31 + P32F32 + P41F41
+ P42F42 + P51F51 + P52F52 + PePersonal Characteristics + 8.
All hypothesized personal characteristics (refer to Figure 3) were tested by
entering one variable at a time into the model. None of the personal
characteristics were found to be directly significant. However, several
interactions between personal characteristics and jacket design elements were
significant.
Interactions Related to Hypothesis 2
The interaction effect between each personal characteristic and five
design factors were tested. Three interactions related to hypothesis 2 were
found to be significant.
1. Interaction between Jacket Pattern and Age.
The statistical model used to test this interaction was:
Pref = Po + P11F11 + P12F12 + P21F21 + P22F22 + P31F31 + P32F32
+ P41F41 + P42F42 + P51F51 + P52F52 + PeAge + P7Age*F2 + E.
The interaction between jacket pattem and age was significant (F(2, 259) =
5.30, p = .0055). The Solution option of SAS/STAT® was utilized to further
investigate the interaction effect. The result was plotted, and the results are
presented in Figure 31. Preference for the plaid and pin-striped patterns were
not significantly affected by age. However, younger respondents preferred the
solid pattern more than older respondents (refer to Figure 31).
119

2. Interaction between Jacket Silhouette and Age.
The statistical model used to test this interaction was:
Pref = po + P11F11 + P12F12 + P21F21 + P22F22 + P31F31 + P32F32
+ P41F41 + P42F42 + P51F51 + P52F52 + PeAge + P7Age*F3 + s.
The interaction between jacket silhouette and age was found to be significant
(F(2, 259) = 9.94, p < .0001). To further examine the interaction effect, the
Solution option of SAS/STAT® procedure was utilized. The results were
plotted and presented in Figure 32. Overall, the fitted and semi-fitted jacket
silhouettes were preferred more than the loosely-fitted silhouette. Preference
for the loosely-fitted silhouette increased as age increased, while preference
for the fitted and semi-fitted silhouette decreased as age increased. In other
words, younger respondents prefer the fitted and semi-fitted silhouettes more
than the loosely-fitted silhouette, while older respondents prefer the
loosely-fitted silhouette more than the fitted and semi-fitted silhouette (refer to
Figure 32).
3. Interaction between Jacket Length and Ethnicity.
The statistical model used to test this particular interaction was:
Pref = Po + P11F11 + P12F12 + P21F21 + P22F22 + P31F31 + P32F32
+ P41F41 + P42F42 + P51F51 + P52F52 + PeEthnicityTI + 8.
The interaction between jacket length and ethnicity was found to be significant
(F(12, 260) = 2.06, p = .0200).
120

CD ^ 3.5 CD
o CD ^
S 2.5 O) (O CD Q 2 • 4 - '
(D
ro I^Ll
25 35 45
Age
55 65
^ Jacket Pattern: Plaid
_H—Jacket Pattern: Pin-striped
^^—Jacket Pattem: Solid
Figure 31. The Interacfion Effect between Jacket Pattern and Age.
CD O
c CD CD
<+-(D i—
CL
O) Oi CD
Q
% O ro
.Jacket Silhouette: Fitted
.Jacket Silhouette: Semi-fitted
Jacket Silhouette: Loosely-fitted
Figure 32. The Interaction Effect between Jacket Silhouette and Age.
121

Because of the relatively low F ratio and high p-value when compared with
other interactions, the results needed to be interpreted with caution. The
interaction effect was further investigated by comparing Least Squares Means
(refer to Figure 33). The results indicated that Caucasian, African-American,
and Hispanic working women preferred short and hip length jackets. Asian
working women were the only group that preferred the tunic length the most
and the short length the least.
Hvpothesis 3
Psycho-social characteristics of the subjects affect the subjects'
business jacket design preference. The statistical model used to test the
hypothesis was:
Pref = po + P11F11 + P12F12 + P21F21 + P22F22 + P31F31 + P32F32 + P41F41
+ P42F42 + P51F51 + P52F52 + PePsycho-Social Identity + e.
All hypothesized psycho-social characteristics (refer to Figure 3) were tested
by entering one variable at a time into the model. Ability to modify
self-presentation (F(1, 263) = 9.49, p = .0023) and self-monitoring (F(1, 263) =
9.18, p = .0027) were found to be significant in explaining variance in jacket
design preference.
122

Interactions Related to Hvpothesis 3
The interaction effect between each psycho-social characteristic and
the five design factors were tested. Two interactions related to hypothesis 3
were significant. To further examine the interaction effect, the Solution option
of SAS/STAT® procedure was utilized.
1. Interaction between Jacket Collar Style and Self-Monitoring.
The statistical model used to test this particular interaction was:
Pref = Po + P11F11 + P12F12 + P21F21 + P22F22 + P31F31 + P32F32 + P41F41
+ P42F42 + P51F51 + P52F52 + PeSM + P7SM*F5 + 8.
The interaction between jacket collar style and self-monitoring was found to be
significant (F(2, 263) = 3.55, p = .0301). Because of the relatively low F ratio
and high p-value when compared with other interaction terms, the results were
interpreted with caution. The results indicated that preference for the no lapel
style was preferred regardless of the changes in self-monitoring. The no lapel
style was preferred more by respondents with low self-monitoring. The
notched and shawl collars were preferred the least by low self-monitors.
Preference for the notched and shawl collar increased as the respondents'
degree of self-monitoring increased (refer to Figure 34).
3. Interaction between Jacket Collar Style and Ability to Modify
Self-Presentation.
The statistical model used to test this particular interaction was:
Pref = po + P11F11 + P12F12 + P21F21 + P22F22 + P31F31 + P32F32 + P41F41
123

Caucasian African- Hispanic Asian American
other
-^—Jacket Length: Short
-f l—Jacket Length: Hip
-4—Jacket Length: Tunic
Ethnicity
Figure 33. The Interaction Effect between Jacket Length and Ethnicity.
(D O C (D
3.5
(D
<D ^ 3
c O) CO (D
Q • * - •
CD
O
ro
2.5
10 20 30 40 50
Self-Monitoring
60 70
Jacket Collar Style: No lapel
Jacket Collar Style: Notched
Jacket Collar Style: Shawl
Figure 34. The Interacfion Effect between Jacket Collar Style and Self-Monitoring.
124

+ P42F42 + p5iF5i + P52F52 + PeAMSP + p7AMSP*F5 + s.
The interaction between jacket collar style and ability to modify
self-presentation was found to be significant (F(2, 263) = 6.25, p < .0022).
The results Indicated that preference for the no lapel style was preferred
regardless of the changes in ability to modify self-presentafion. The no lapel
style was preferred more by respondents with low ability to modify
self-presentation. The notched and shawl collars were preferred the least by
respondents with a low ability to modify self-presentation. Preference for the
notched and shawl collar increased as the respondents' ability to modify
self-presentation increased (refer to Figure 35).
Hvpothesis 4
Job-speclfic-situational characteristics of the subjects affect the
subjects' business jacket design preference. The statistical model used to test
the hypothesis was:
Pref = Po + P11F11 + P12F12 + P21F21 + P22F22 + P31F31 + P32F32 + P41F41
+ P42F42 + P51F51 + P52F52 + PeJob-Specific Situafional Characterisfics + 8.
All hypothesized job-related situafional characteristics (e.g., implicit dress
code, visibility to superiors and public, length of fime in career, and corporate
culture, etc) were tested by entering one variable at a fime into the model.
None of the hypothesized variables were found to be significant.
125

Interactions Related to Hvpothesis 4
The interacfion effect between each job-specific-situational
characteristic and the five design factors were also tested, and none of them
were found to be significant.
Hypothesis 5
Hypothesis 5 stated physical characteristics of the subjects affect the
subjects' business jacket design preference. The statistical model used to test
the hypothesis was:
Pref = po + P11F11 + P12F12 + P21F21 + P22F22 + P31F31 + P32F32 + P41F41
+ P42F42 + P51F51 + P52F52 + PePhysical Characterisfics + 8.
All hypothesized physical characteristics (refer to Figure 3) were tested by
entering one variable at a fime into the model. Figure type (F(7, 255) = 2.13,
p = .0406) had a low level of significance in explaining variance in jacket
design preference.
Interactions Related to Hypothesis 5
The interaction effect between each physical characteristic and the five
design factors were also tested. Least Squares Means were used to further
investigate the interaction effect. Three interactions related to hypothesis 5
were found to be significant.
126

1. Interacfion between Jacket Silhouette and Figure Type.
The statistical model used to test this interaction was:
Pref = Po + P11F11 + P12F12 + P21F21 + P22F22 + P31F31 + P32F32 + P41F41
+ P42F42 + P51F51 + P52F52 + PaFlgure Type*F3 + s.
The interacfion between jacket silhouette and figure type was found to be
significant (F(21, 255) = 2.10, p = .0039). Because of the relatively low F rafio
and high p-value when compared with other interaction terms, the results were
interpreted with caution. Generally, the fitted and semi-fitted silhouettes were
preferred over the loosely-fitted silhouette regardless of figure type (refer to
Figure 36). Preference for the loosely-fitted silhouette slightly increased when
a respondent had a diamond shaped figure.
2. Interacfion between Jacket Neckline Drop and Figure Type.
The statistical model used to test this interaction was:
Pref = Po + P11F11 + P12F12 + P21F21 + P22F22 + P31F31 + P32F32 + P41F41
+ P42F42 + P51F51 + P52F52 + PeFlgure Type*F4 + 8.
The interacfion between jacket neckline drop and figure type was found to be
significant (F(21, 255) = 1.65, p = .0394). However, because of the relatively
low F ratio and high p-value when compared with other interaction terms, the
results were interpreted with caution. The results indicated that individuals
with triangular and diamond figure types preferred the below bust neckline,
while individuals with rectangular figure types spurned the below bust neckline
(Figure 37). The low F ratio suggested relatively weak support for the results.
127

3. Interacfion between Jacket Collar Style and Figure Type.
The statistical model used to test this particular interaction was:
Pref = Po + P11F11 -f P12F12 + P21F21 + P22F22 + P31F31 + P32F32 + P41F41
+ P42F42 + P51F51 + P52F52 + PeFlgure Type*F5 + 8.
The interaction between jacket collar style and figure type was found to be
significant (F(21, 255) = 2.65, p = .0002). The Least Squares Means
comparison indicated that individuals with diamond shaped bodies preferred
the no lapel style the most among the three collar types (Figure 38).
Individuals with rectangular body shapes least preferred the shawl collar.
However, the low F ratio suggests the results are not strongly supported.
Summary of the Findings
In summary, significance was identified through the use of repeated
measures of analysis of variance with an unstructured covariance matrix, as fit
by PROC MIXED of SAS/STAT®. The denominator degrees of freedom for
conducting the F-tests of hypotheses used Satterthwaite Approximation.
When repeated measures ANOVA with an unstructured covariance matrix
could not provide estimates for F-tests, a compound symmetry covariance
matrix was utilized to estimate the F statistics.
Hypotheses la through 1e tested the effect of jacket design factors on
business jacket design preference. Jacket length, pattern, silhouette.
128

-^—Jacket Collar Style:
No lapel
.^1—Jacket Collar Style: Notched
-^—Jacket Collar Style: Shawl
10 20 30 40
Ability to Modify Self-Presentation
Figure 35. The Interacfion Effect between Ability to Modify Self-Presentafion and Jacket Collar Style.
0)
o c (D (D
«<— CD
C D) U) (D
Q 0)
o (0
2.5
2
1.5
1
. . . ^ — J a c k e t S i lhouet te :
Fitted
. Jacke t S i l l iouet te :
Semi- f i t ted
Jacke tS i l houe t t e ;
Loosely- f i t ted
^ # . # . # ^ J'
Figure Type
Figure 36. The Interacfion Effect between Jacket Silhouette and Figure Type.
129

^ .^ J J # .<• k 'y >^ ' " 9"
^ &
Figure Type
^ Neckline Drop:
Wa ist dee p
. Neckline Drop:
Be lowbus t
-^£—Neck l ine Drop: A bove bust
Figure 37. The Interacfion Effect between Jacket Neckline Drop and Figure Type.
\i> # ^ # N.^ X ^ AT'
^ . •O /-N" ^
^ ^ i<& ^^" o
/ y
^ ^ ^
Figure Type
Collar style: No lapel
Collar style: Notched
Collar Style: Shawl
Figure 38. The Interacfion Effect between Jacket Collar Style and Figure Type.
130

neckline drop, and collar styles were found to be significant. Six interacfions
were found to be significant: jacket length and pattern, jacket length and collar
style, jacket pattern and silhouette, jacket pattern and neckline drop, jacket
silhouette and collar style, jacket neckline drop and collar. Therefore,
hypotheses 1a through 1e were accepted.
Hypothesis 2 tested the effect of personal characteristics on business
jacket design preference. None of the personal characteristics were found to
be significant. However, three interactions were significant: age and jacket
pattern, age and jacket silhouette, and ethnicity and jacket length. Therefore,
hypothesis 2 was accepted.
Hypothesis 3 tested the effect of psycho-social characteristics on
business jacket design preference. Ability to modify self-presentation and
overall self-monitoring were found to be significant. Two interactions were
found to be significant: self-monitoring and jacket collar style, and ability to
modify self-presentafion and jacket collar. Consequently, hypothesis 3 was
accepted.
Hypothesis 4 tested the effect of job-speclfic-situational characteristics
on business jacket design preference. None of the job-specific-situational
characterisfics were found to be significant. In addifion, none of the
interacfions were significant.
Hypothesis 5 tested the effect of physical characteristics on business
jacket design preference. Among the hypothesized variables tested, only
131

figure type was found to be significant. The Interactions between figure type
and jacket silhouette, figure type and jacket neckline drop, and figure type and
jacket collar style were found to be significant. Therefore, hypothesis 5 was
accepted.
132
CHAPTER V
SUMMARY, CONCLUSIONS, AND RECOMMENDATIONS
Consumer evaluafion of apparel has been affected by three sources:
the aesthetic quality of garments, personal characteristics of the viewer, and
the environment. Many empirical studies have documented design factors
influencing the aesthefic quality of apparel, but few have focused on individual
characteristics of the viewer. Due to the fact that individual subjectivity may
influence the aesthefic evaluafion process, this research was intended to
investigate consumer characteristics in relation to the aesthetic preference of
apparel. This chapter includes the following five aspects of the study:
(a) summary of the study, (b) summary of the findings, (c) conclusions and
implicafions, and (d) recommendafions for further research.
Summary of the Study
The overall purpose of the study was to investigate the differences in
jacket design preferences of working women. An understanding of consumer
aesthetic preference is essential for efl'icient communicafion between
consumers and decision makers in the texfile complex. Using the proposed
research model, the study was designed to determine (1) how design
attributes affect consumer jacket design preference, and (2) how consumer
characterisfics affect consumer jacket design preference.
133

The populafion for the study was working women who wear business
jackets to work at least once a week. A national cross-section of 1,500 was
drawn for the study through a random sampling technique by Nafional
Demographics & Lifestyles.
Nine hypotheses were formulated for testing the proposed research
model. Hypotheses addressed the relafionships between consumer design
preference and: (a) design attributes, (b) personal characteristics,
(c) psycho-social identity, (d) job-specific-situational characteristics, and
(e) physical characteristics.
A self-administered quesfionnaire was developed to elicit informafion
from working women. A pilot study was conducted to test (a) the contents of
the instruments regarding clarity in wording, (b) comprehension of the
instrucfions and terminology, and (c) fatigue. As a result, revisions were
made.
Collecfion of research data followed an adaptafion of the Dillman
Method for implemenfing mail surveys (Salant & Dillman, 1994). During the
summer of 1999, a total of 1,500 quesfionnaires were mailed to randomly
selected consumers. A preliminary postcard was mailed to inform the subjects
of the upcoming quesfionnaire and the research purpose, and to ask for
participafion. The actual survey was mailed one week after the postcard. Two
weeks after mailing the survey, a postcard reminder was sent. Six weeks after
inifiafing data collecfion, a total of 312 quesfionnaires were processed, and the
data were tabulated and subjected to statistical analysis.
134

Descriptive stafistics were ufilized during the preliminary assessment.
Cronbach's alpha coefficient was calculated to examine internal consistency
for self-confidence in dressing, self-monitoring, perceived importance of
clothing, and job safisfaction scales. Canonical correlation was also ufilized to
assess overall relafionships between business jacket design preference and
each hypothesized variable.
Statistical tests were calculated using statistical procedures of
SAS/STAT®. Repeated measures analysis of variance with an unstructured
covariance matrix was utilized for hypotheses testing. In the case an
unstructured covariance matrix could not provide esfimates, compound
symmetry covariance matrix was used. Least Squares Means were compared
when significance was detected for two factor interaction terms.
Summary of the Findings
Profile of the Respondents
1. Respondents were working women who ranged in age from 22 to 65
with a mean age of 44 (SD = 9.63), were married (77.4%), had
children (78.9%), had 2 to 4 family members (78.1%), and
contributed to at least 50% of household income (61.5%).
2. Approximately half of the respondents (46.7%) had a bachelor's
degree or higher. The respondents worked full-time (81.4%), had a
professional job (75.9%), and were career-oriented (77.2%).
135

3. Respondents wore business jackets to work 2-3 times a week on
average and had approximately 10 jackets in the closet on average.
4. The majority (76.0%) wore jackets during winter season most
frequently. The respondents wore business japkets with either a
skirt (54.3%), or pants (41.5%).
5. The majority purchased business jackets separately as opposed to
a suit (61%) and preferred department stores for purchasing
professional apparel (70.8%). Less than half of the respondents
paid by cash, check, or bank credit card (44.5%). A large
percentage of the respondents (84%) spent less than 20% of the
total household income on professional apparel annually.
6. The majority (ranging from 69.1% to 97.8%) of the respondents
exhibited high self-confidence in dressing, self-monitoring, and
perceived importance of clothing. More than half of the subjects
strongly agreed that they try to make a good impression by their
appearance (56.2%), and noticed the inappropriateness of women's
attire in business situafions (52.8%). The majority (63.4%) indicated
that it is especially important for those dealing with the public or
clients to portray a professional appearance.
7. The majority of the respondents interacted with the public or clients
in face-to-face situafions in their work (78.5%), and interacted with
their superiors in face-to-face situations in their work (83%). The
average number of customers encountered daily at work was 55
136

(SD - 203.59), while the average number of colleagues
encountered daily at work was 19 (SD = 123.95).
8. More than half (57.5%) of the respondents indicated a relatively high
degree of an unwritten but expected dress code for professional
dressing at work.
9. The average size of the firm for which the respondents worked was
"Medium" (M = 2.1, SD = 0.87), and the respondents indicated a
moderate level of conservativeness at work (M = 4.4, SD = 1.6).
10. The average male to female ratio at work was 38.5% (male) to
61.4% (female). The average length in current job (M = 8.87,
SD = 7.84) and career (M = 8.3, SD = 7.32) was approximately 8 to
9 years.
11. The older and larger respondents exhibited a relatively high
preference for jacket design #21220 (tunic level length, pin-striped
pattern, loosely-fitted silhouette, above bust neckline, and no lapel
collar style). The same respondents exhibited a relafively low
preference for jacket design #22011 (tunic length, solid, fitted, below
bust neckline, and notched collar style), #00000 (short length, plaid
pattern, fitted silhouette, waist deep neckline drop, and no lapel
collar style), #02212 (short length, solid pattern,
loosely-fitted silhouette, below bust neckline, and shawl collar), and
#02122 (short length, solid pattern, semi-fitted silhouette, above
bust neckline, and shawl collar).
137

12. The respondents had an average height of 5'4" (SD = 1.45) and an
average weight of 154.9 lbs (SD = 36.69). Approximately half of the
respondents (46.4%) had a medium-sized body frame. The most
purchased garment size category was misses (44.5%), followed by
petite (27.5%) and women's (20.4%). The average dress size
purchase was 12 (SD = 5.57).
13. More than half of the respondents had brown hair (56.6%), followed
by blonde (24.9%). Approximately half of the respondents had
brown eyes (47.3%), followed by blue (29.5%) and green (20.8%).
14. Approximately twenty-five percent of the respondents had a
triangular figure type (24.7%), followed by an ideal type (17.5%),
rounded type (16.0%), and hourglass type (11.0%).
Hypotheses Testing
1. With regard to the impact of design attributes on consumer design
preference, all of the variables (jacket length, pattern, silhouette,
neckline drop, and collar styles) were found to be significant. In
addifion, six interacfions were found to be significant: jacket length
and pattern, jacket length and collar style, jacket pattern and
silhouette, jacket pattern and neckline drop, jacket silhouette and
collar style, jacket neckline drop and collar.
2. On testing the impact of personal characterisfics on business jacket
design preference, none of the personal characteristics were
138

significant. However, three interactions were found to be significant:
age and jacket pattern, age and jacket silhouette, and ethnicity and
jacket length.
3. Regarding the impact of psycho-social characterisfics on business
jacket design preference, ability to modify self-presentafion and
overall self-monitoring were found to be significant. The significant
interacfions were: self-monitoring and jacket collar style, and ability
to modify self-presentation and jacket collar.
4. No significant impact of job-specific-situafional characterisfics on
business jacket design preference was detected. None of the
job-specific-situational characterisfics were found to be significant.
In addition, no interaction term was found to be significant.
5. With regard to the impact of physical characterisfics on business
jacket design preference, figure type only was found to be
significant. The interacfions between figure type and jacket
silhouette, figure type and jacket neckline drop, and figure type and
jacket collar style were also found to be significant.
Conclusions and Implicafions
Based on the analyses of data and findings, the following conclusions
are appropriate.
1. Design attributes affect consumer preferences. In addition, one
design element within a jacket style impacts other design elements.
139

This supports the findings by other researchers (Eckman, 1992;
Holbrook & Dixon, 1985; Sproles. 1981b; Wagner, 1990).
2. Although the present study did not find that any personal
characteristic, by itself, impacted design preference, the interaction
between some of the design elements and two personal
characterisfics, age and ethnicity, were significant. These
interactions support the nofions made by Behling (1985-86) and
Fiore and KimIe (1997). Consumer aesthetic evaluation of apparel
results from the interrelafionships among design elements and
consumer personal characteristics, suggesting that consumer
subjectivity in apparel evaluafion plays an important role. In addition
consumers evaluate each design element separately. Single factors
in design draw a consumer's preference, not the design as a whole.
In addifion, as women age, they prefer more loosely-fitted silhouette.
This may be due to changes in body structure, as well as changes in
lifestyle. The fact that Asian women prefer tunic length styles may
reflect a preference for garments that reflect the tunic length
historical costume of many Asian cultures.
3. Empirical studies (Cassill & Drake, 1987; Forsythe, Bufier, & Kim,
1991; Rabolt & Drake, 1984-85, Shim & Drake, 1988; Sproles,
1979) suggest that adopter motivafion or psychological identity
(e.g., self-confidence in dressing, perceived importance of clothing,
career orientafion) and social forces (implicit dress code, visibility to
140

superiors and public, length of fime In career, corporate culture)
influence consumer evaluation and selection of apparel. The
present study failed to find significant evidence to support this
nofion. Self-monitoring in general and ability to modify
self-presentafion were the only two variables found to be significant.
However, a relatively low F rafio and high p-value suggest further
Investigation needs to follow.
4. Figure type, one of the consumer physical characterisfics, and its
interacfion with some of the design elements, was found to be
significant with a relatively low F ratio and high p-value. This also
suggests that consumers evaluate each design element separately
and subjectively. They are particularly concerned with how design
elements affect the appearance of their figures. The respondents
with a diamond shaped figure preferred loosely-fitted silhouettes.
This may be due to the fact that the fitted and semi-fitted jacket does
not fit the diamond shaped figure type well.
5. Although there was no significance found regarding the impact of
job-specific-situafional characterisfics on working women's design
preference, overall the hypothesized model has value in predicfing
consumer design preference. Therefore, the proposed research
model can be used to explain consumer design preference in
general.
141

Recommendations for Further Research
This study extended the research in the area of consumer aesthetic
evaluation process and preference formation process. Significant results were
found through hypotheses tesfing. Further research could:
1. replicate a study of similar design with various ethnic groups, Asians
or Hispanic in particular. The findings might provide more detailed
informafion to be used for exploring marketing opportunities for U.S.
manufacturers and retailers.
2. replicate a study of similar design with subjects who have a
nonprofessional occupafion. The results could show similarities and
differences between professional and nonprofessional groups that
may be used for fashion markefing.
3. replicate a study of similar design including color in visual sfimuli.
The current study had to drop color from the study due to infinite
variability in color and extremely high cost in reproducfion. Color
may be a design variable that significantly impact consumer
aesthefic evaluafion of apparel.
4. replicate a study of similar design by obtaining a subject list with
e-mail addresses, and collect data through e-mail or by posting on a
web site to reduce cost of reproduction.
142

REFERENCES
Abdel-Ghany, M., & Foster, A. (1982). Impact of income and wife's education on family consumpfion expenditures. Journal of Consumer Studies and Home Economics. 6. 21-28.
Bagozzi, R. P. (1980). Performance and safisfacfion in an industrial salesforce: An examinafion of their antecedents and simultaneity. Journal of Markefing. 44 (spring), 65-77.
Bartos, R. (1976, May-June). Insight in selling the working women. Marketing Times. 23. 3-7.
Bartos, R. (1977). The moving target: The impact of women's employment on consumer behavior. Journal of Markefing. 41. 46-54.
Bartos, R. (1982). The moving target: What every market should know about women. New York: The Free Press.
Baumgarten, S. A. (1975). The innovative communicator in the diffusion process. Journal of Markefing Research. 12 (February), 12-18.
Bell, S. S., Holbrook, M. B., & Solomon, M. R. (1991). Combining esthetic and social value to explain preferences for product styles with the incorporafion of personality and ensemble effects. Journal of Social Behavior and Personality. 6(6). 243-274.
Bellante, D., & Foster, A. (1984). Working wives and expenditures on Services. Journal of Consumer Research. 11(2). 700-707.
Bixler, S. (1997). The new professional image. Holbrook, MA: Adams Media Corporation.
Blau, F. D., & Ferber, M. A. (1991). Career plans and expectafions of young women and men: The earnings gap and labor force participation. Journal of Human Resources. 26. 581-607.
Braun, H. (1991). Markefing to minority consumers. Discount Merchandiser. 31(2), 44-46. 74.
Cassill, N., & Drake, M. F. (1987). Employment orientation's influence on lifestyle and evaluafive criteria for apparel. Home Economics Research Journal. 16(1). 23-35.
143

Dardis. R., Derrick, F.. & Lehfeld, A. (1981). Clothing demand in the United States: A cross-sectional analysis. Home Economics Research Journal. 10. 212-222.
David, M. (1998, January/February). Getting serious about going casual on the job. Business Horizon. 41. 51-56.
Davis. M. L (1996). Visual design in dress. Upper Saddle River, NJ: Prenfice Hall.
Deirdre, M. (1998, January/February). Cross (purpose) dressing. CA Magazine. 131. 9.
DeLong, M. R. (1968). Analysis of costume visual form. Journal of Home Economics. 60 (December), 784-788.
DeLong, M. R. (1977). Clothing and aesthetics: Perception of form. Home Economics Research Journal. 5 (June), 214-224.
DeLong, M. R. (1987). The way we look. Ames, lA: Iowa State University Press.
Designing for dollars. (1994, November 14). U.S. News & World Report, pp. 103-104, 106-107.
DeWeese, G., & Norton, M. (1991). Impact of married women's employment on individual household member expenditures for clothing. The Journal of Consumer Affairs. 25(2). 235-257.
DeWeese, G. (1987). The impact of married women's employment on household expenditures for clothing. Unpublished doctoral dissertation. Virginia Polytechnic Institute and State University, Blacksburg, Virginia.
Dickerson, K. (1999). Textiles and apparel in the global economy. Upper Saddle River, NJ: Merrill, Prenfice Hall.
Salant, P., & Dillman, D. A. (1994). How to conduct your own survey. New York: John Wiley & Sons, Inc.
Dillon, L. S. (1980). Business dress for women corporate professionals. Home Economics Research Journal. 9(2). 124-129.
Domzal, T. J., & Kernan, J. B. (1993). Variafions on the pursuit of beauty: Toward a corporal theory of the body. Psychology & Markefing, 10(6). 495-511.
144

Dondls, D. A. (1983). A primer on visual literacy. Cambridge: MIT Press.
Doran, K. B. (1994). Exploring cultural differences in consumer decision making: Chinese consumers. In C. Allen & D. R. John (Eds.), Advances in Consumer Research (Vol. 21, pp. 318-322). Prove, UT: Associafion for Consumer Research.
Dubinsky, A. J.. & Hartley, S. W. (1986). A path-analytic study of a model of salesperson performance. Journal of Applied Marketing Science. 14(Spring), 36-46.
Eckman, M. (1992). Consumers' aesthetic evaluafion of clothing: The effect of age, sex, and fashion involvement. Unpublished doctoral dissertafion. University of Maryland, College Park, MD.
Eckman, M. (1997). Attractiveness of men's suits: The effect of aesthefic attributes and consumer characteristics. Clothing and Textiles Research Journal. 15(4). 193-202.
Eckman, M., Damhorst, M. L., & Kadolph, S. J. (1990). Toward a model of the in-store purchase decision process: Consumer use of criteria for evaluafing women's apparel. Clothing and Textiles Research Journal. 8(2), 13-22.
Engel, J., Blackwell, R., & Miniard, P. (1993). Consumer Behavior (7*^ed.). Niles, IL: The Dryden Press.
Ericksen, M. K., & Sirgy, M. J. (1985). Achievement motivation and clothing preferences of white-collar working women. In M. R. Solomon (Ed.), The Psychology of Fashion (pp. 357-367). Lexington, MA: D.C. Heath.
Ericksen, M. K., & Sirgy, M. G. (1992). Employed females' clothing preferences, self-image congruence, and career anchorage. Journal of Applied Social Psychology. 22. 408-422.
Feldman, E. B. (1973). Varieties of visual experiences. Englewood Cliffs, NJ: Prentice Hall.
Fiore, A. M., & Damhorst, M. L. (1992). Intrinsic cues as predictors of perceived quality of apparel. Journal of Consumer Satisfaction. Dissatisfaction and Complaining Behavior. 5. 168-178.
145

Fiore, A. M., & KimIe, P. A. (1997). Understanding aesthetics for the merchandising and design professional. New York: Fairchild Publications.
Fiore, A. M., KimIe, P. A., & Moreno, J. M. (1996a). Aesthetics: A comparison of the state of the art outside and inside the field of textiles and clothing. Part one: Creator and creative process. Clothing and Textiles Research Journal. 14(1). 30-40.
Fiore, A. M., KimIe, P. A., & Moreno, J. M. (1996b). Aesthetics: A comparison of the state of the art outside and inside the field of textiles and clothing. Part two: Object. Clothing and Textiles Research Journal. 14(2). 97-107.
Fiore, A. M., KimIe, P. A., & Moreno, J. M. (1996c). Aesthetics: A comparison of the state of the art outside and inside the field of textiles and clothing. Part three: Appreciafion process, appreciator and summary comparisons. Clothing and Textiles Research Journal. 14(3). 169-184.
Fisher, C. (1993, February 15). Poll: Hispanics stick to brands. Advertising Age, 6.
Forsythe, S., Butler, S., & Kim, M. (1991). Fashion adoption: theory and Pragmatics. Clothing and Textiles Research Journal. 9(4). 8-15.
Forsythe, S., Butler, S., & Schaefer, R. (1990). Surrogate usage in the acquisition of women's business apparel. Journal of Retailing. 66(4). 446-469.
Forsythe, S. M., Drake, M. F., & Cox, Jr., C. (1984). Dress as an influence on the perceptions of management characteristics in women. Home Economics Research Journal. 13(2). 112-121.
Fraenkel, J. R., & Wallen N. E. (1996). How to design and evaluate research in education. New York: McGraw-Hill, Inc.
Furukawa, T. (1995, October 6). Lighter fragrances, looser import rules spark sales in Japan. Women's Wear Daily, pp. 1, 4.
Goldin, C D . (1990). Understanding the gender gap: An economic histon/ of American women. New York: Oxford University Press.
146

Hafstrom, J., & Dunsing, M. (1965). A comparison of economic choices of one-earner and two-earner families. Journal of Marriage and the Family. 27(3). 409-413.
Hahn, G.. & Shapiro, S. (1966). A catalog and computer program for the design and analysis of orthogonal asymmetric fractional factorial designs (Report No. 66-C-165). Schenectady, NY: General Electric Corporation.
Holbrook, M. B. (1981). The aesthetic imperative in consumer research. In E. C. Hirschman & M.B. Holbrook (Eds.), Symbolic Consumer Behavior (pp. 36-37). Provo, UT: Association for Consumer Research.
Holbrook, M. B. (1986). Aims, concepts, and methods for the differences in aesthetic responses to design features. Journal of Consumer Research. 13. 337-347.
Holbrook, M. B. (1987). What is consumer research? Journal of Consumer Research. 14(June). 128-132.
Holbrook, M. B. (1994). Axiology, aesthetics, and apparel: Some reflections on the old school tie. In M. R. Delong & A. M. Fiore (Eds.), Aesthetics of textiles and clothing: Advancing multidisciplinarv perspectives (pp. 131-141). Monument, Co: International Textiles and Apparel Association (special publication #7).
Holbrook, M. B., & Dixon, G. (1985). Mapping the market for fashion: Complementarity In consumer preferences. In M. R. Solomon (Ed.), The Psychology of Fashion (pp. 109-126). Lexington, MA: D.C. Heath and Company.
Holbrook, M. B. & Schindler, R. M. (1989). Some exploratory findings on the development of musical tastes. Journal of Consumer Research. 16. 119-124.
Horn, M. J., & Gurel, L. M. (1981). The second skin (3rd ed.). Boston: Houghton-Mifflin.
Horridge, P. E., Khan, S.. & Huffman, K. E. (1981). An assessment of fashion awareness of females based on selected demographic factors. Journal of Consumer Studies and Home Economics. 5. 310-310.
Humphrey, C . Klaasen. M.. & Creekmore, A. M. (1971). Clothing and self concept of adolescents. Journal of Home Economics. 63. 246-250.
147

Jenkins. M.C. (1973). Clothing and textile evaluative criteria: Basis for benefit segmentation and reflection of undertving values. Dissertafion Abstracts Internafional, 34, 5547B.
Johnson, B., Nagasawa, R., & Peters, K. (1977). Clothing style differences: Their effect on impressions of sociability. Home Economics Research Journal. 6. 58-63.
Johnson, K., Crutsinger, C, & Workman, J. (1994). Can professional women appear too masculine? Clothing and Textiles Research Journal. 12(2). 27-31.
Johnson, K., & Roach-Hlggins. M. (1987a). The influence of physical attractiveness and dress on campus recruiters' impressions of female job applicants. Home Economics Research Journal. 16. 87-95.
Johnson, K., & Roach-Hlggins. M. (1987b). Dress and physical attractiveness of women in job interviews. Clothing and Textiles Research Journal. 5. 1-8.
Joyce, M., & Guilfinan, J. (1978). The professional women: A potenfial market segment for retailers. Journal of Retailing. 54(2). 59-70.
Kaiser, S. B. (1997). The social psychology of clothing. New York: Fairchild Publicafions.
Kang, J., & Kim, Y. (1998). Ethnicity and acculturation: Infiuences on Asian American consumers' purchase decision making for social clothes. Family and Consumer Sciences Journal. 27(1). 91-117.
Kantrowitz, B., Witherspoon, D., & King, P. (1988, December 5). A fashion revolt. Newsweek, pp. 60-65.
Kelley, E. A., & Anselmo, D. C. (1977). Career appearance education for women who aspired to white-collar positions. Home Economics Research Journal. 6(1). 64-75.
Kelley, E., Blouin, D.. Glee. R., Sweat, S., & Arledge, L (1982). Career appearance: Perceptions of university students and recruiters who visit their campuses. Home Economics Research Journal. 10(3). 253-263.
Kersch, E. A. (1984). An invesfigafion of the clothing problems of tall women. Unpublished master's thesis. Virginia Polytechnic Institute and State University, Blacksburg, Virginia.
148

Kose, G. (1984). The psychological investigation of art: Theorefical and methodological Implications. In W. R. Crozier & A. J. Chapman (Eds.), Cognitive processes in the perception of art (pp. 27-44). NewYord: Elsevier Science
Kundel, C. (1976). Clothing practices and preferences of blue-collar workers and their families. Home Economics Research Journal. 4(4). 225-234.
Lapitsky, M. & Smith, C. (1981). Impact of clothing on impressions of personal characteristics and writing ability. Home Economics Research Journal. 9. 327- 335.
Lazer, W., & Smallwood, J. (1977). The changing demographics of women. Journal of Marketing. 41(3). 14-22.
Lennon, S. J. (1990). Effects of Clothing Attractiveness on Perceptions. Home Economics Research Journal. 18(4). 303-310.
Lennox, R. D., & Wolfe, R. N. (1984). Revision of the self-monitoring scale. Journal of Personality and Social Psychology. 46. 1349-1364.
Littrell, M. A. (1980). Home economists as cross-cultural researchers: A field study of Ghanaian clothing selecfion. Home Economics Research Journal. 8. 307-317.
Lucas, G. H., Babakus, E., & Ingram, T. N. (1990). An empirical test of the job satisfacfion-turnover relafionship: assessing the role of job performance for retail managers. Journal of Applied Markefing Science. 18 (summer). 199-208.
Mandelson, D. A. (1996). Women's changing labor-force participafion in the U.S. In P. J. Dubeck & K. Borman (Eds.), Women and work (pp. 3-7).
McCall, S.H. (1977). Meet the "work wife." Journal of Markefing. 41. 55-65.
Miller, C. (1993, May 10). Researchers say U.S. is more of a bowl than a Pot. Markefing News, p. 6.
Millman, M. (1980). Such a pretty face: Being fat in America. New York: W. W. Norton & Co.
Molloy, J. T. (1977). Women's dress for success. New York: Warner Books.
149

Molloy, J. T. (1996). New women's dress for success. New York: Warner Books.
Morganosky, M. A. (1984). Aesthetic and ufilitarian qualities of clothing: Use of a multidimensional clothing value model. Home Economics Research Journal. 13. 12-20.
Morganosky. M. A. (1987). Aesthefic, funcfion, and fashion consumer values: Relationships to other values and demographics. Clothing and Textiles Research Journal, 6 (Fall), 15-19.
Morganosky, M. A., & Postlewait, D. S. (1989). Consumers' evaluations of apparel form, expression, and aesthetic quality. Clothing and Textiles Research Journal. 7(2). 11-15.
NoHA/ood, J. L. (1980). Perspectives on working women: A data book. U.S. Department of Labor, Bureau of Statistics, October, Bulletin 2080.
Peacock, M. (1980, June). Personal style. jVls, 83-90.
Peter, J. P. (1979). Reliability: A review of psychometric basics and recent marketing practices. Journal of Marketing Research. 16. 6-17.
Peterson, R. A. (1994). A meta-analysis of Cronbach's coefficient alpha. Journal of Consumer Research. 21. 381-391.
Petty, R. E. & Capicoppo, J. T. (1981). Issue involvement as a moderator of the effects on attitude of advertising content and context, in Kent B. Monroe (Ed.), Advances in Consumer Research. 8. 20-24. Ann Arbor, Ml: Association for Consumer Research.
Rabolt, N. J. (1984). Career-oriented women's dress: Input. Influence, and mediating forces. Unpublished doctoral dissertation. The University of Tennessee, Knoxville.
Rabolt, N. J., & Drake, M. F. (1984-85). Reference person influence on career women's dress. Clothing and Textiles Research Journal. 3(2). 11-19.
Rabolt, N. J., & Drake, M. F. (1985). Information sources used by women for career dressing decisions. In M. R. Solomon (Ed.), The Psychology of Fashion (pp. 371-385). Lexington, MA: D.C. Heath and Company.
Rasband, J. (1994). Fabulous fit New York: Fairchild Publications.
150

Reynolds. F. D., Crask, M. R., & Wells, W. D. (1977). The modern feminine life style. Journal of Marketing. 41. 38-45.
Rogers. E. M. (1983). Diffusion of Innovations. New York: The Free Press.
Sailor, P. J. (1971, December). Perception of line in clothing. Perceptual and Motor Skills. 33. 987-990.
Schindler, R. M., & Holbrook, M. B. (1993). Critical periods in the development of men's and women's tastes in personal appearance. Psychology & Marketing. 10(6). 549-564.
Seitz, V. A. (1992). Your executive image. Holbrook, MA: Bob Adams, Inc.
Shim, S. & Drake, M. F. (1988). Apparel selection by employed women: A typology of information search pattern. Clothing and Textiles Research Journal. 6(2). 1-9.
Snyder, M. (1974). Self-monitoring of expressive behavior. Journal of Personality and Social Psychology. 30(4). 526-537.
Solomon, M. (1987). The wardrobe consultant: Exploring the role of a new retailing partner. Journal of Retailing. 63. 110-127.
Solomon, M. R., & Douglas, S. P. (1985). The female clotheshorse: From aesthetics to tactics. In M. R. Solomon (Ed.), The Psychology of Fashion (pp. 387-401). Lexington, MA: Lexington Books.
Sproles, G. B. (1979). Fashion: Consumer behavior toward dress. Minneapolis: Burgess.
Sproles, G. B. (1981^). Analyzing fashion life cycles: Principles and perspectives. Journal of Marketing. 45 (Fall), 116-124.
Sproles, G. B. (1981^). The role of aesthetics in fashion-oriented consumer behavior. In Perspectives of Fashion (pp. 120-127). Minneapolis: Burgess.
Sproles, G. B., & Kendall, E. L (1986). A methodology for profiling consumers' decision-making styles. The Journal of Consumer Affairs. 20(2), 267-279.
Sweat S J ,& Zentner, M. A. (1985). Female appearance presentation: Gender differences in social attribution and situational choice. Home. Economics Rp^parch Journal. 14(2). 175-186.
151

Tate. S. L (1989). Inside fashion design (3rd FH ) New York: HarperCollins Publishers. Inc.
Thompson. J. K. (1986). Larger than life. Psychology Today. 70. 38-39. 42. 44.
Thurston, J., Lennon, S., & Clayton, R. (1990). Influence of age, body type, fashion, and garment type on women's professional image. Home Economics Research Journal. 19(2). 139-150.
U.S. Bureau of the Census. (1997). Statistical Abstract of the United States (117th ed.) Washington, D.C: U.S. Bureau of the Census.
U.S. Bureau of the Census. (1998). Statistical Abstract of the United States (118th ed.) Washington, D.C: U.S. Bureau of the Census.
Wagner, J., Anderson, C, & Ettenson, R. (1990). Evaluating attractiveness in apparel design: A comparison of Chinese and American consumers. In P. E. Horridge (Ed.), ACPTC Proceedings National Meeting (p. 97). Monument, CO: Association of College Professors of Textiles and Clothing.
What makes a woman beautiful? (1980, November). Art News. 128-131.
Workman, J., & Johnson, K. (1989a). The role of clothing in perpetuating ageism. Journal of Home Economics. 81. 11-15.
Workman, J., & Johnson, K. (1989b). The role of clothing in extended inferences. Home Economics Research Journal. 18(2). 164-169.
Yau, O. (1988). Chinese cultural values: Their dimensions and marketing implications. European Journal of Marketing. 22(5). 44-57.
Zaichkowsky. J. L. (1985). Measuring the involvement construct. Journal of Consumer Research. 12(3). 341-352.
152

APPENDIX A
QUESTIONNAIRE
153

- A 1999 STUDY OF AMERICAN CONSUMERS -
Each time you purchase business attire, you make decisions regarding where to shop, what Style and color to buy, and how much to spend. This sun/ey is being conducted as part of an educational endeavor, by research associates at Texas Tech University in Lubbock, Texas, to better understand female professionals' design preferences and purchase intentions for business jackets. We would appreciate it if you would take about 15 minutes to fill out the survey completely.
This questionnaire is not designed to sell you anything or solicit money from you in any way! You are part of a carefully selected sample of female consumers across the nation, so that the results accurately represent the opinions of working women. It is very important that each questionnaire be completed and returned. It is also important that you, the person to whom the questionnaire is addressed, are the person that completes the survey.
Participation is voluntary. You may be assured of complete confidentiality. The questionnaire has an identification number for mailing purposes only. This number is necessary so that we may check your name off the mailing list when the questionnaire is returned. Your name will never be placed on the questionnaire.
There are no right or wrong answers. If you have any questions, please call Lori Yoo at (806) 795-4579. After you have completed the questionnaire, please return it in the enclosed, pre-addressed, postage-paid envelope within a week. Thank you very much for your support of our research project and you can be assured that your input will be beneficial to all involved.
If you complete and return this survey, and want to be entered in a drawing to win a $100 money order being given in appreciation to one respondent drawn from entries post marked on or before August 13, 1999, please complete the enclosed entry card and return it with the completed questionnaire.
"1
0
o
o
o
Department of Merchandising, Environmental Design and Consumer Economics
Texas Tech University Box 41162
Lubbock, Texas 79409-1162
154

Section I. This section contains 18 thumbnail sketches of business jacket designs. Using the scale provided evaluate the Attractiveness of each jacket. The lower the score the less attractive the jacket, the higher the score the more attractive the jacket. NOTE: A skirt is shown in each sketch to illustrate the jacket length. Please do not consider the skirt design in your evaluation of jacket attractiveness.
EXAMPLE:
Please evaluate the Attractiveness of each jacket design independent of your body characteristics. Do not attempt to picture each jacket on your figure. (Circle only One response for each jacket design.)
Key: 1 = Not Attractive / NA 2 = Somewhat Not Attractive 3 = Neutral / N 4 = Somewhat Attractive 5 = Very Attractive / VA
NA N VA
1 2 3 4 5
NA N VA
1 2 3 4 5
NA N VA
1 2 3 4 5 1
NA N VA
1 2 3 4 5
NA N VA
1 2 3 4 5
NA N VA
1 2 3 4 5
NA N VA
1 2 3 4 5
NA N VA
1 2 3 4 5
155

NA N VA
1 2 3 4 5 1 NA N VA
1 2 3 4 5
NA N VA
1 2 3 4 5
NA N VA
1 2 3 4 5 1
NA N VA
1 2 3 4 5
NA N VA
1 2 3 4 5
NA N VA
1 2 3 4 5
NA N VA
1 2 3 4 5 1
NA N VA
1 2 3 4 5 1
156

Section II. This section contains 18 thumbnail sketches of business jacket designs. Using the scale provided assess the probability of your Purchasing each jacket. The lower the score the less purchase intention, and the higher the score the greater purchase intention. NOTE: A skirt is shown in each sketch to illustrate the jacket length. Please do not consider the skirt design in your evaluation of jacket purchase intention.
EXAMPLE:
Please address your Purchase Intention in conjunction with your body characteristics. Consider how each jacket would look on your figure. (Circle only One response for each jacket design.)
Key: 1 = Definitely Not Purchase / DNP 2 = Probably Not Purchase 3 = Neutral / N 4 =: Probably Purchase 5 = Definitely Purchase / DP
=% II *
DNP N DP
1 2 3 4 5
DNP N DP
1 1 2 3 4 5 DNP N DP
1 2 3 4 5
DNP N DP
1 2 3 4 5
DNP N DP
1 2 3 4 5 1
DNP N DP
1 2 3 4 5 DNP N DP
1 2 3 4 5 I
DNP N DP
1 2 3 4 5
157

DNP N DP
1 2 3 4 5
DNP N DP
1 2 3 4 5
:
z
1: 1
DNP N
1 2 3
DP
5
DNP N DP
1 2 3 4 5 DNP N DP
1 2 3 4 5
DNP N DP
1 2 3 4 5
DNP N DP
1 2 3 4 5
DNP N OP
1 2 3 4 5
DNP N DP
1 2 3 4 5
DNP N DP
1 2 3 4 5
158

Section III. This section includes statements about business clothing and business situations. Please place a check mark on the scale to indicate your agreement with each of the following statements. It is extremelv important that vou answer all the questions in order to interpret the results.
strongly Strongly
Disagree Agree
01. My self-confidence is high in selecting professional attire • • • • • • •
02. I notice the fit of other women's clothes in business situations (e.g., tight pants, tight skirts, or loose jackets, etc.) • • • • • • •
03. I notice the inappropriateness of women's attire
in business situations • • • • • • •
04. At work I try to make a good impression by my appearance • • • Q • • •
05. Employees who are low paid should still dress in professional attire • • • • • • •
06. Undoubtedly, I am good at choosing professional attire for work • • • • • • •
07. I remember if a woman appeared professional in a business encounter Q • • • • • •
08. It is especially important for those dealing with the public or clients to portray a professional appearance Q Q • • • • •
09. When I am uncertain how to dress in a business situation, I look to the behavior of other women for cues • • • • • • •
10. I feel very confident in putting together a professional appearance • • • • • • •
11. In business situations, I have the ability to alter my behavior if I feel that something else is called for • • • • • • •
12. When I feel that the professional image I am portraying isn't working, I can readily change it to something that does • • • • • • •
13 I notice the quality of women's clothing in business situations • (e.g.. fine fabric). • • • • • • •
14 The wav I dress in business situations changes the way • people react to me • • • • • • •
15. It is important for me to always portray a professional image at work • • • • • • Q
16. I have found that I can adjust my behavior to meet the requirements of any business situation I find myself in. • • • • • " Q •
17. Wearing professional clothing helps me gain respect from others at work a • • • • • •
18. When attending meetings with managers or colleagues, n n n n n n dressing professionally is important Q • • u u u u
19. I consider my professional clothing a good investment Q ^ • • • • •
20. Employees at all levels in an organization should dress in n n n n Q • Q professional attire
159

Section IV. The following questions concern business jacket purchase and consumption patterns. Please fill in the blank or check the appropriate box to indicate your candid response to each question. It is extremelv important that vou answer all the questions in order to interpret the results.
01. When you purchase a jacket for business purposes, to what extent do the design factors listed below influence your purchase decision? Please prioritize the factors from MOST-TO-LEAST influential in your purchase decision. First, read all five factors listed below, then, in the space provided to the left of each factor, assign a number from 1 Most Important / Influential to 5 Least Important / Influential) in the order of importance. Use a number only One time.
Jacket Length Jacket Silhouette Fabric Pattern / Color Jacket Neckline Shape Jacket Neckline Depth
02. Listed below are factors one might consider when purchasing business jackets. Please place a check mark on the scale which best reflects your thoughts. Check only One response per item.
Not Important Important Very Important
Brand • • • • • • •
Color • • • • • • •
Latest Fashion • • • • Q • •
Style • • • • • • •
Price • • • • • • •
Attractiveness • • • • • • •
Construction • • • • • • •
Versatility • • • • • • •
Jackets in Wardrobe • • • • • • •
FiberContent • • • • • • •
Fit • • • • • • • Ease-of-Care • • • • • • •
03. How often do you wear a business jacket to work per week? times per week
04. During which season do you most often wear a business jacket? (Check One)
• Spring • Summer • Fall • Winter
05. How many business jackets do you have in your wardrobe? jackets
Approximately how many of these business jackets do you wear for each season? (Jackets worn in more than one season should be counted in each season.)
1. Spring jackets 2. Summer jackets 3. Fall jackets 4. Winter jackets
06. What color are the business jackets in your wardrobe? (Check All that apply and specify the Number of jackets)
a Black a Gray • Navy • Beige • Brown • Green • Red • White • Other (Please specify)
160

07. When you wear a business jacket, which one of the clothing items below, do you most often wear? (Check One)
• Dress • Skirt • Pants • Other (Please specify)
08. When you purchase a business jacket, do you most often purchase the jacket as a suit or as a separate? (Check One)
• 1. Suit • 2. Separate
09. In what type of store do you most often shop for professional apparel? (Check One)
• 1. Specialty Stores • 3. Department Stores • 5. Other (Please specify) • 2. Discount Stores • 4. Catalogs
10. How do you usually pay for your professional apparel? (Check One)
Q l . Cash or Check • 3. Store or Catalog Card • 2. Bank Credit Card (Master Card / VISA) • 4. Other (Please specify)
11. What percentage of the total annual household income did you allocate for professional apparel for yourself last year? (Check One)
• 1.10% or below • 3. 21%-30% • 5. 41%-50% • 7. 61%-70% • 2. 11% - 20% • 4. 31% - 40% • 6. 51% - 60% • 8. 71% or more
Section V. This section includes statements about work. Please place a check mark on the scale to indicate your agreement with each of the following statements. It is extremelv important that vou answer all the questions in order to interpret the results.
strongly Strongly Disagree Agree
01. I interact with the public or clients in face-to-face situations in my work • • • • • • •
02. Generally speaking, I am very satisfied with my job • • • • • • •
03. I frequently think of quitting my job • • • • Q • •
04. I interact with my superiors in face-to-face situations in my work • • • • • • •
05. People in my job often think of quitting • Q • • • • •
06. I am generally satisfied with the kind of work I do in my job • • • • • • •
07. My job offers me a career path that I am pleased with • • • • • • •
08. I feel a sense of pride and accomplishment as a result of the type of the work I do • • • • • • a
09. I feel there is an unwritten, expected dress code for professional women in my firm • • • • • • •
10. Most people in this job are very satisfied with the job Q • • • • • a 11. I would advise a friend looking for a new job to take one similar to mine Q • • • Q • Q
161

Section VI. This section includes questions about physical profile. Please fill in the blank or check the appropriate box to indicate your candid response to each question. It is extremelv important that vou answer all the questions in order to interpret the results.
01. What is your height?
02. What is your weight?
ft in
lbs
03. What would you estimate is the size of your general body frame? (Judge on the basis of bone size or wvrist size) (Check One)
• 1. Petite • 2. Small • 3. Medium • 4. Large • 5. Extra-Large
04. What is your average dress size? (Example: petite size 14 or woman's size 14) (Check One and specify the Size)
• 1. Petite Size • 2. Tall Size • 3. Misses Size • 4. Women's Size
05. What color is your hair? (Check One)
• 1. Blonde • 2. Brown Q 3. Black Q 4. Red • 5. Other.
06. What color are your eyes? (Check One)
• 1. Brown • 2. Blue • 3. Green • 4. Black • 5. Other.
07. Whrch of the following 8 figure types best describes your torso silhouette? (Check One)
G G G
162

Section VII. This section includes questions about job related information. Please fill in the blank or check the appropriate box to indicate your candid response to each question. It is extremelv important that vou answer all the questions in order to interpret the results.
01. How would you rate the size of the firm / corporation you work for? (Check One)
• 1. Small 0 2. Medium • 3. Large • 4. Other (Please specify)
02. How would you rate the corporate culture in terms of conservativeness at your firm / corporation? (Check One)
Not at all conservative ® ® (D ® © © ® Extremely Conservative
03. What is the percentage of male to female employees at your firm / corporation?
% Male : % Female = 100%
04. Approximately how long have you worked for the firm / corporation? • Month(s) • Year(s)
05. Approximately how long have you been in your current career position? • Month(s) •Year(s)
06. What is your occupation?
07. What is your job title?
08. What is your employment status? (Check One)
• 1. Full-time • 2. Part-time • 3. Other (Please specify)
09. Is the work you do "just a job" or is it a "career"? (Check One)
Q 1. Just a job a 2. Career
10. Do you have a specific career objective for the future? (Check One)
• Yes • No
11. Approximately how many customers / clients do you daily encounter at work?.
12. Approximately how many supervisors / colleagues do you daily encounter at work?
Section VIII. This section includes questions about socio-demographic characteristics. Please fill in the blank or check the appropriate box to indicate your candid response to each question. (It is extremelv important that vou answer all the questions in order to interpret the results.)
01. What is your age? Years Old
02. What is your marital status? (Check One)
• 1. Single, Never Married • 2. Divorced
• 3. Married • 4. Widowed
• 5. Separated • 6. Cohabiting
03. What is the highest level of education that you have completed? (Check One)
• 1. Less than high school • 2. Some high school • 3. High school diploma or equivalent • 4. Some college work a 5. Associate degree • 6. Bachelor's degree
• 7. Post-graduate professional training (Law, Medicine, etc)
• 8. Some graduate work • 9. Master's degree • 10. Doctoral degree • 11. Post doctoral work • 12. Other (Please specify)
163

04. What is your ethnic background? (Check One)
• 1. Caucasian • 2. African-American • 5. Other (Please specify)
• 3. Hispanic • 4. Asian
05. In which state do you reside?
06. How many individuals live in your household, including children?
07. Do you have children? (Check One)
• Yes • No
If Yes, how many children do you have? Child / Children
What is the age of each child/children? : : :
_Member(s)
08. What was your financial contribution in terms of percentage to the total annual household income last year? (Check One)
• 1.10% or below • 2.11%-20% • 3. 21%-30%
• 4. 31%-40% • 5. 41%-50% • 6. 51%-60%
• 7. 61%-70% • 8. 71%-80% • 9. 81%-90%
• 10. 91%-100%
THANK YOU FOR YOUR COOPERATION. PLEASE MAIL THE QUESTIONNAIRE IN THE SELF-ADDRESSED, POSTAGE-PAID ENVELOPE ON OR BEFORE AUGUST 13,1999. IF THE POSTAGE-PAID, SELF- ADDRESSED ENVELOPE IS MISPLACED, PLEASE RETURN THIS QUESTIONNAIRE TO:
LORI YOO 5202 BANGOR AVENUE #A302
LUBBOCK, TEXAS 79414
164

APPENDIX B
PRELIMINARY POSTCARD
165
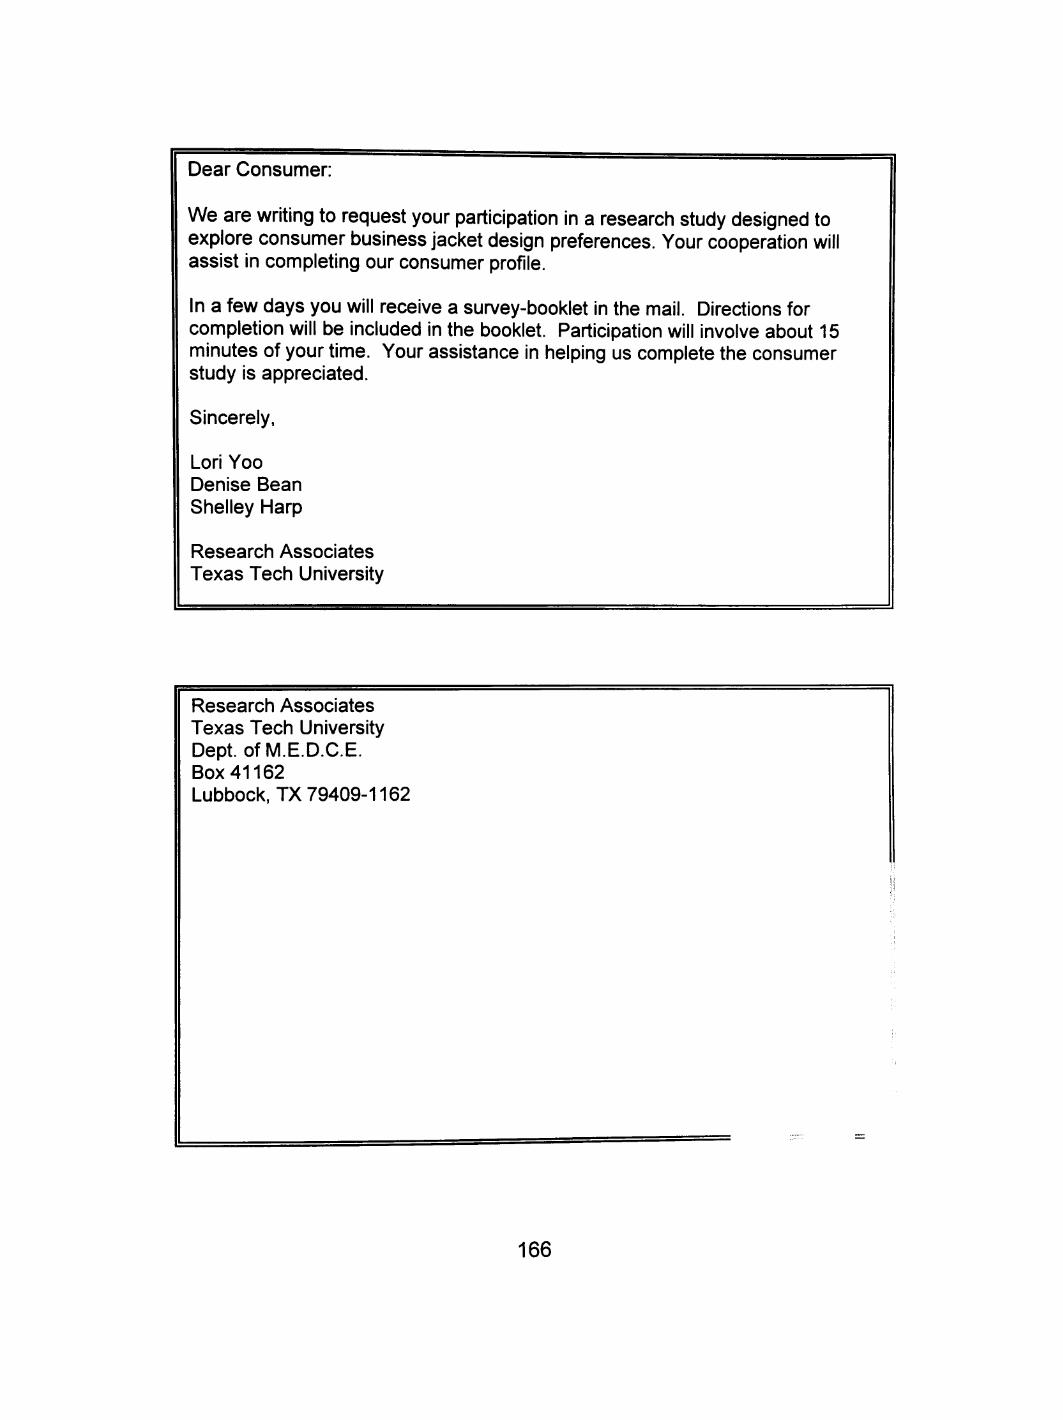
Dear Consumer:
We are writing to request your participation in a research study designed to explore consumer business jacket design preferences. Your cooperation will assist in completing our consumer profile.
In a few days you will receive a survey-booklet in the mail. Directions for completion will be included in the booklet. Participation will involve about 15 minutes of your time. Your assistance in helping us complete the consumer study is appreciated.
Sincerely,
Lori Yoo Denise Bean Shelley Harp
Research Associates Texas Tech University
Research Associates Texas Tech University Dept. ofM.E.D.C.E. Box 41162 Lubbock, TX 79409-1162
166

APPENDIX C
MONEY ORDER ENTRY FORM
167

MONEY ORDER ENTRY FORM
To be eligible for the $100 Money Order drawing, you must return this entry form with your completed questionnaire. Winners will be notified by telephone and the money order will be fon/varded to you by September 17, 1999. Please print the information below.
Name:
Mailing Address,
Telephone Number £
168

APPENDIX D
FOLLOW-UP POSTCARD
169

ATTENTION! ATTENTION!
Recently, a questionnaire seeking information about your business jacket design preference was mailed to you. Your name was drawn from a random sample of consumers in the U.S.
If you have already completed and returned the questionnaire, please accept ou sincere thanks. If not, please do so today. Because it has been sent to a small, but representative sample of consumers, it is extremely important that you b included in the study if the results are to accurately represent the America consumer.
Thank you very much for your support of this research project.
Sincerely,
Denise Bean, Shelley Harp, Lori Yoo Research Associates Texas Tech University
170