Comparative study on a jacket launching operation in South ...
15
شده توسط ارائه: ه فا سايت مرجع جديد شده ه مقا ت معت ت از ن
-
Upload
khangminh22 -
Category
Documents
-
view
1 -
download
0
Transcript of Comparative study on a jacket launching operation in South ...

:ارائه شده توسط
ه فا �� سايت ��
� مرجع �� ه شده جديد�� �� مقا�ت ��
ت معت � �# از ن%$

Ocean Engineering 111 (2016) 335–347
Contents lists available at ScienceDirect
Ocean Engineering
http://d0029-80
n CorrE-m
journal homepage: www.elsevier.com/locate/oceaneng
Comparative study on a jacket launching operation in South China Sea
Zhihuan Hu, Xin Li n, Jun Li, J.M. YangState Key Laboratory of Ocean Engineering, Shanghai Jiao Tong University, Shanghai 200240, China
a r t i c l e i n f o
Article history:Received 12 May 2015Accepted 18 November 2015Available online 1 December 2015
Keywords:Jacket launching operationField measurementModel testNumerical simulationComparative study
x.doi.org/10.1016/j.oceaneng.2015.11.02118/& 2015 Elsevier Ltd. All rights reserved.
esponding author.ail address: [email protected] (X. Li).
a b s t r a c t
Launching is an essential initial operation for mega deep-water jackets. The forces and motion responsesof key points were measured during such a launching operation, which can serve as a benchmark for theexperimental and numerical results and hence can provide more confidence in following operations. Thispaper presents a comprehensive study in which field measurements, numerical and experimental resultsare compared to investigate the dynamic process of launching a mega jacket. The differences betweenthe field measurement data and experimental results are investigated. The sensitivity analyses includingthe barge trim and draft and the friction coefficient along the skid-ways are performed using the cali-brated numerical model. Attempts are made to clarify the effect of the drag coefficient in the Froude-similarity models through a comparison of the scaled model tests and the specific numerical simulations.
& 2015 Elsevier Ltd. All rights reserved.
1. Introduction
Launching is one of the critical tasks during offshore installa-tion of a jacket and involves considerable risks and technicalchallenges, particularly for mega jackets. As the jacket slides alongthe skid-ways, the draft and trim of the launching barge keepchanging, thereby affecting the motion response of the barge.Once the jacket begins to tip on the rocker arms, which is the mosthazardous stage of the operation, the rocker arm loads reach theirpeak values. After separating from the barge, the jacket oscillatesand dives to reach its maximum dive depth, where it could collidewith the seabed. Therefore, it is important to reliably predict theforces and motion responses of such a launching system.
To correctly predict the key motion responses, numerous stu-dies of jacket launching operation have been conducted. Hambro(1982) proposed a method to compute the jacket motions bydifferentiating the constraints of the mechanical systems twice.A model test was selected to determine the accuracy of thenumerical simulations. Liu et al. (1986) established three-dimensional equations of motion for a jacket by combiningquadratic differentiation of the restraints with momentum equa-tions. Good agreement was achieved between the numerical andexperimental results. Based on the Kilauea jacket launching, Sircaret al. (1990) described the method and results of the transporta-tion, launching, self-upending and set-down stability analyses.Honarvar et al. (2008) compared a model test and a numericalsimulation of jacket launching operation. The differences between
the experimental and numerical results were identified, and thecorrelation between the Reynolds number (Re) and the hydro-dynamic drag coefficient (CD) was discussed.
When considering the structural loads and the motionresponses, model tests and numerical simulations were also per-formed for the launching operation. Jo et al. (2001) presented theeffects of various parameters (the dimensions of the barge andjacket and the initial condition of the barge) on the launchingoperation based on the analysis software SACS. The results showedthat the mean load and impact load acting on the jacket could bereduced by increasing the draft and trim angle, whereas the trimangle and draft had a marginal effect on the dive depth of thejacket. Xiong et al. (2013) investigated a typical jacket launchingprocess by comparing model tests and numerical simulations.These authors reported good agreement between the amplitudesof the pitch motion and structural load using two differentmethods. A time delay was also observed in the model test due tothe scale effect. He et al. (2010) presented an optimization studyand a parametric sensitivity study of 3-D time-domain launchingand self-upending analyses through the commercial softwareMOSES. In the optimization study, the optimal initial conditionswere determined for the jacket launching and upending.
To obtain a better understanding of jacket launching, effortshave been made to develop reliable techniques for field mea-surements. Based on the field measurements of the Liwan 3-1mega jacket launching, a series of the jacket launching analyseswas conducted. He et al. (2013) performed a comparative studybased on numerical analyses and field measurements, whichindicated that the effect of the kinetic friction coefficient (Cf ) alongthe skid-ways was significant. Zhang et al. (2013) conducted anexperiment to investigate the launching trajectories and further

Z. Hu et al. / Ocean Engineering 111 (2016) 335–347336
compared the experimental results with field measurements. Thisstudy indicated that Cf along the skid-ways should be reduced to0.04 to ensure kinematic similarity. A method of processing theoriginal data from the field measurement was proposed by Chenet al. (2013). In their study, the composite Simpson's rule wasapplied to obtain the trajectory motions of the jacket and barge.These trajectory motions were obtained from the field measure-ment of the Liwan 3-1 jacket launching and were presented byChen et al. (2014b).
Field measurements of offshore structures and their dynamicresponses in real sea states are desirable for validating numericalsimulations and for applying to marine engineering design pro-blems (Drazen et al., 2012). However, due to various technical andeconomic challenges, more emphasis has been placed on the in-operation platform monitoring than on the field measurements ofoffshore installation procedures, such as jacket launching.
This paper presents a comparative study of field measure-ments, scaled model tests and numerical simulations based on thefield measurements obtained from the launching of the Panyu 34-1 mega jacket. Section 2 briefly describes the jacket launchingsystem in terms of the launching stages, the launching barge andthe jacket and the initial launching condition. The experimentalsetups are briefly presented in Section 3. The environmentalconditions during the launching operation are also clarified in thissection. To validate the experimental results and to furtherunderstand the dynamics of the launching, the field measure-ments were performed and time series of the barge and jacketmotions and the rocker arm loads were measured as part of thefield measurements. Section 4 discusses the configuration of thefield measurement system. It is extremely important to ensurethat the measurements obtained during the jacket launchingoperation are sufficiently reliable and valid and thus the mea-surement equipment and measurement errors are also given inSection 4. Based on the field measurement data, the numericalsimulations are validated and calibrated. Section 5 briefly gives thetheoretical background of the jacket launching under theassumption of the stationary sea state and two-dimensionalmotion. By means of the calibrated numerical model, sensitivityanalyses are performed to clarify the influences of the barge trimangle and draft, the jacket center of gravity (COG) and the kineticfriction coefficient along the skid-ways. The drag coefficients inthe scaled models and prototype are discussed and the effects ofCD in the Froude-similarity models are also investigated in Section6. Conclusions are presented based on the results and discussionsto guide safe launching operations, and for the future offshoreinstallations.
Fig. 1. Launching syst
2. Jacket launching system
The jacket was successfully launched and installed in 190 m-deep waters with the assistance of the launching barge. Todescribe the motion of the jacket launching system, two coordi-nate systems are introduced: the global coordinate system(og�xgygzg) and body-fixed coordinate system. As shown in Fig. 1,the former system is fixed with respect to the earth, and its x–y-plane coincides with the water surface. The jacket-fixed coordi-nate system (oj�xjyjzj) moves with the jacket and its x–y-planecoincides with the jacket waterline. In addition, the barge-fixedcoordinate system (ob�xbybzb) moves with the barge and its x–y-plane coincides with the barge keel. The origin of each coordinatesystem is located in the central plane for simplicity.
2.1. Launching barge and jacket
The T-shaped launching barge features its narrower bow halfand wider stern half, which contributes to a larger displacementand a better transverse stability (Xu et al., 2013). Its trim angle canbe adjusted using the ballast tanks to initiate launching and toensure the stability of the entire launching system. The transversemetacentric height of the barge is 11.6 m in the initial launchingcondition (draft¼11.12 m, trim¼4.25°). The barge is equippedwith skid-ways, two identical rocker arms and installation aidsand ancillary equipment. Tilting beams and a pair of rocker armsare attached in the stern of the barge. The length of each rockerarm is 41.14 m and the depth of the tilt beam is 7.54 m. Theprincipal parameters of the barge are described in Table 1.
The eight-legged jacket is 203.5 m tall and is secured to theseafloor with 16�ø108″(2743 mm)�143.3 m foundation piles. Itsreserve buoyancy is approximately 12.31% under the condition ofvoid members. The principal parameters of the jacket are descri-bed in Table 2.
2.2. Launching condition
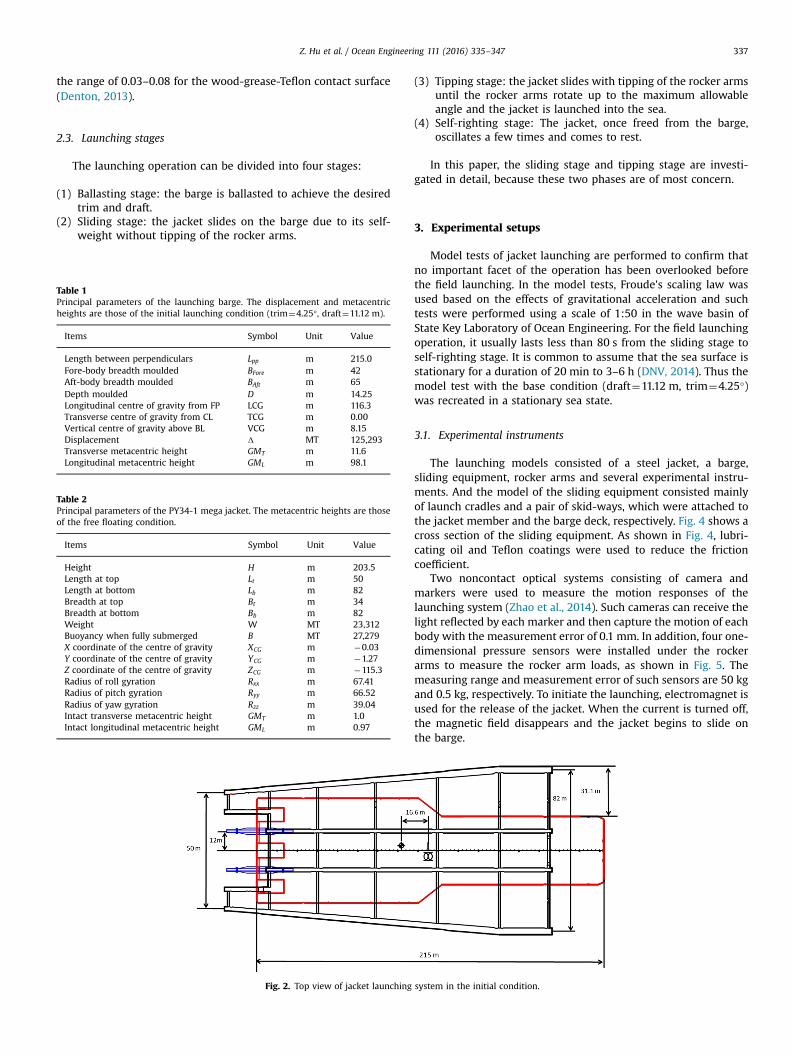
To initiate the launching, the barge was ballasted to thelaunching condition with the mid-ship draft of 11.12 m and trim of4.25°. Fig. 2 shows the top view of the initial launching system. Asshown in Fig. 2, the horizontal distance between the jacket COGand the mid-ship section is approximately 16.6 m.
There is a pair of steel skid-ways on the barge deck. The hor-izontal interval between the two skid-ways is 24 m and the overalllength of each one is 150 m. Fig. 3 shows a cross section of theskid-way. As shown in Fig. 3, a pair of steel cradle is welded ontothe jacket member and slides along with the jacket. The greaseand Teflon coating are applied to the contact surface of the skid-ways and the launch cradles. The kinetic friction coefficient are in
em configuration.
Z. Hu et al. / Ocean Engineering 111 (2016) 335–347 337
the range of 0.03–0.08 for the wood-grease-Teflon contact surface(Denton, 2013).
2.3. Launching stages
The launching operation can be divided into four stages:
(1) Ballasting stage: the barge is ballasted to achieve the desiredtrim and draft.
(2) Sliding stage: the jacket slides on the barge due to its self-weight without tipping of the rocker arms.
Table 1Principal parameters of the launching barge. The displacement and metacentricheights are those of the initial launching condition (trim¼4.25°, draft¼11.12 m).
Items Symbol Unit Value
Length between perpendiculars Lpp m 215.0Fore-body breadth moulded BFore m 42Aft-body breadth moulded BAft m 65Depth moulded D m 14.25Longitudinal centre of gravity from FP LCG m 116.3Transverse centre of gravity from CL TCG m 0.00Vertical centre of gravity above BL VCG m 8.15Displacement Δ MT 125,293Transverse metacentric height GMT m 11.6Longitudinal metacentric height GML m 98.1
Table 2Principal parameters of the PY34-1 mega jacket. The metacentric heights are thoseof the free floating condition.
Items Symbol Unit Value
Height H m 203.5Length at top Lt m 50Length at bottom Lb m 82Breadth at top Bt m 34Breadth at bottom Bb m 82Weight W MT 23,312Buoyancy when fully submerged B MT 27,279X coordinate of the centre of gravity XCG m �0.03Y coordinate of the centre of gravity YCG m �1.27Z coordinate of the centre of gravity ZCG m �115.3Radius of roll gyration Rxx m 67.41Radius of pitch gyration Ryy m 66.52Radius of yaw gyration Rzz m 39.04Intact transverse metacentric height GMT m 1.0Intact longitudinal metacentric height GML m 0.97
Fig. 2. Top view of jacket launching
(3) Tipping stage: the jacket slides with tipping of the rocker armsuntil the rocker arms rotate up to the maximum allowableangle and the jacket is launched into the sea.
(4) Self-righting stage: The jacket, once freed from the barge,oscillates a few times and comes to rest.
In this paper, the sliding stage and tipping stage are investi-gated in detail, because these two phases are of most concern.
3. Experimental setups
Model tests of jacket launching are performed to confirm thatno important facet of the operation has been overlooked beforethe field launching. In the model tests, Froude's scaling law wasused based on the effects of gravitational acceleration and suchtests were performed using a scale of 1:50 in the wave basin ofState Key Laboratory of Ocean Engineering. For the field launchingoperation, it usually lasts less than 80 s from the sliding stage toself-righting stage. It is common to assume that the sea surface isstationary for a duration of 20 min to 3–6 h (DNV, 2014). Thus themodel test with the base condition (draft¼11.12 m, trim¼4.25°)was recreated in a stationary sea state.
3.1. Experimental instruments
The launching models consisted of a steel jacket, a barge,sliding equipment, rocker arms and several experimental instru-ments. And the model of the sliding equipment consisted mainlyof launch cradles and a pair of skid-ways, which were attached tothe jacket member and the barge deck, respectively. Fig. 4 shows across section of the sliding equipment. As shown in Fig. 4, lubri-cating oil and Teflon coatings were used to reduce the frictioncoefficient.
Two noncontact optical systems consisting of camera andmarkers were used to measure the motion responses of thelaunching system (Zhao et al., 2014). Such cameras can receive thelight reflected by each marker and then capture the motion of eachbody with the measurement error of 0.1 mm. In addition, four one-dimensional pressure sensors were installed under the rockerarms to measure the rocker arm loads, as shown in Fig. 5. Themeasuring range and measurement error of such sensors are 50 kgand 0.5 kg, respectively. To initiate the launching, electromagnet isused for the release of the jacket. When the current is turned off,the magnetic field disappears and the jacket begins to slide onthe barge.
system in the initial condition.

Fig. 3. Details of skid-ways.
Fig. 4. Cross section of sliding equipment.
Z. Hu et al. / Ocean Engineering 111 (2016) 335–347338
3.2. Calibration of launching system
In all stages, the dimensions and mass characteristics (mass,COG and inertia) of the jacket, barge and rocker arms were care-fully measured and calibrated in accordance with the designvalues. Specifically, lead bars were adopted and the locations ofthese lead bars were adjusted inside the jacket members. Theinertial properties of barge were also verified by weighting thebarge model.
The friction coefficient along the skid-ways is also one of themain parameters for the launching operation. In the model test, an
Atwood machine with dragging a block over a horizontal surface(Eagleson, 1945). As shown in Fig. 6, the block of mass m1 isinitially accelerated when connected to a driving weight of massm2. Once the driving weight reaches a specified distance h, themoving block slows to a stop. Then, the kinetic friction coefficientcan be given by:
Cf ¼m2h
m1hþðm1þm2Þdð1Þ
Based on the tests for determining the coefficients of slidingfriction, Cf along the skid-ways was 0.06.

Fig. 5. Schematic of pressure sensors.
Fig. 6. Sliding friction coefficient measurement setup.
Z. Hu et al. / Ocean Engineering 111 (2016) 335–347 339
4. Field measurement system configuration
4.1. Integrated GPS and INS system
An inertial navigation system (INS) can be integrated with aglobal positioning system (GPS) to estimate the generalized posi-tion and velocity in 6 degrees of freedom (DOFs) (Fossen, 2011).More specifically, the GPS is capable of accurately recording thepositions from two GPS antennas without drift error. However,GPS functions only above the water surface because the satellitesignals are poor underwater. Meanwhile, the INS, which is housedinside a watertight barrel, can effectively record underwatermotions. For the integrated GPS and INS system, the positionerrors are 2.0 m in horizontal direction and 4.0 m in verticaldirection, respectively. And its attitude error is 0.1°. The steel alloybarrel is capable of withstanding water pressures of 3.0 MPa andfeatures mechanical seal equipment and watertight connectorsthat prevent water from entering the barrel through screw threadsor coaxial cables. Additionally, when fully charged, the Li-ionbattery in the barrel can power the GPS/INS device for 24 h.Details of the integrated GPS/INS device are shown in Fig. 7.
In the field, two sets of the integrated GPS/INS devices werewelded onto the jacket and one was installed on the barge. Fig. 7shows the installation locations of the jacket-mounted GPS/INSsystems. The locations of the GPS antennas were purposelyselected to ensure adequate timing to receive GPS signals andensure the shortest distance to the integrated GPS/INS device. The
signal amplifier was designed to address the problem of signalattenuation. And the signal shielding was relatively weak due tothe angle (θ) between the GPS antennas and the jacket member.For ease of access to the integrated GPS/INS device after launching,the jacket-mounted systems were installed approximately 39 mbelow the top of the jacket. After launching, the jacket was liftedby the crane until it reached the upright position. Fig. 8 illustratesthe upending stage and the upright position of the jacket. Asshown in Fig. 8, the depths of the integrated GPS/INS devicesranged from 2 to 4 m, which facilitated the removal of the inte-grated GPS/INS devices from the jacket.
4.2. Stress measurement
Fibre Bragg grating (FBG) strain sensors provide detailed straininformation with minimal intrusion on the host structure (Tyleret al., 2013). Fig. 9 shows the installation positions of the straingauges on each rocker arm. To minimize the random error due totemperature variations, temperature-compensating sensors wereinstalled with the strain gauges. Specifically, the A1 and B1 sensorswere used to offset the influences of water temperature and theA5 and B5 sensors provided compensation for air temperature. Thesensor surfaces were covered with waterproof silica gel. Theresidual errors for offset corrections are typically on the order of1–2 pm (Micron Optics, 2012).
5. Theoretical background of jacket launching operation
Under the assumption of two-dimensional motion in the ver-tical plane, the equation of motion in the time domain can bewritten as
I €qþC _qþKq¼ s ð2Þwhere, q is a vector of 3 degrees of freedom. This implies that thedynamics associated with the motion in roll, yaw and sway areneglected. I is the 3�3 mass matrix; C and K are the damping andstiffness matrices, respectively. The vector s is called theexcitation force.
In the case where incident waves are absent, the excitationforce on the barge can be written as
s¼ �A €q�Z t
0D t�τð Þ _q τð Þdτ ð3Þ

Fig. 8. Upending stage.
Fig. 9. Installation position of strain gauge.
Fig. 7. GPS/INS system device.
Z. Hu et al. / Ocean Engineering 111 (2016) 335–347340
where, A is the added mass matrix; The kernel of the convolutionterm D tð Þ, linked to memory effects, is the matrix of retardationfunctions (Chen et al., 2014a).
Jo et al. (2002) described the loads applied to such a jacket, oneof which is the friction in the tangential direction.
Ff ¼ Cf FN ð4Þ
where, Cf is the friction coefficient and FN is the normalreaction force.
The hydrodynamic force on the jacket consists of drag, addedmass and the hydrodynamic interactions between the two bodies.The hydrodynamic interactions are neglected in the launchinganalysis. The hydrodynamic force can be calculated using theequation
Fh ¼ CMρV _U�12CDρA U Ujj ð5Þ
where, ρ is the fluid density; V and A are the submerged volumeand area, respectively; U is the relative velocity between the jacket

Fig. 10. Jacket launching model.
Fig. 11. Time series of the field measured longitudinal motions.
Fig. 12. Comparison of the jacket pitch motions.
Z. Hu et al. / Ocean Engineering 111 (2016) 335–347 341
member and the outer flow; CD and CM are called the drag coef-ficient and added mass coefficient, respectively.
Time domain analysis is performed using the computer soft-ware MOSES. The Newmark method is employed to provide aneffective solution for the motion equations (Nachlinger, 2006).Dynamic and sensitivity analyses are also performed when con-sidering the jacket and barge trajectory motions and the rockerarm loads. A simulation case with the parameters (Cf ¼0.037,CD ¼ 1.20, Trim¼4.25° and draft¼11.12 m) is chosen for thenumerical analysis. Fig. 10 presents the MOSES models used for thenumerical simulation.
6. Results and discussions
In this section, the statistical analyses of the field data arepresented. Based on the field data, the numerical methods arecalibrated and validated. Efforts are made to clarify the influencesof the initial condition and friction coefficient on the launchingresponses. Moreover, an investigation of the effect of the dragcoefficient is presented.
6.1. Trajectory motions
The time series of pitch motions obtained from the numericalsimulation and the experiment are compared with those from thefield measurements. Furthermore, the trajectory motions of the
jacket forward point (FP) and endpoint (EP) and the transversemotion response of the launching system are investigated.
6.1.1. Pitch motionsFor a successful launching operation, the pitch motions should
be investigated to ensure the stability of the jacket and barge.Fig. 11 shows the time series of pitch motions and the relativesliding distance between the two bodies recorded in the fieldmeasurements. The tipping time, when the relative angle betweenthe jacket and barge begins to increase significantly, occurs at23.2 s. Meanwhile, the relative distance between the two bodiesreaches 90.1 m (the initial distance between the jacket COG andtilting beam is 88.1 m), indicating that the jacket COG just passesover the tilting beam. The separating time, when the jacket pitchangle reaches its peak, occurs at 34.4 s. The maximum values ofthe pitch motion for the jacket and barge are 18.2° and 6.8°,respectively. The pitch angle of the barge stays within the designrange (8.0°), which indicates the stability of the barge duringlaunching.
The time series of the jacket pitch motion obtained from thenumerical simulation, the experiment and field measurements arecompared in Fig. 12. It can be seen from Fig. 12 that the numericalresults agree well with the field results. The experimental resultsalso exhibit good qualitative agreement with the field measure-ments. However, the launching operation in the experiment ismuch longer in duration than the field launching operation.

Fig. 13. Time series of relative roll and yaw motions.
Fig. 14. Time series of jacket vertical positions in field measurement (FP and EPindicate endpoint and forward point).
Fig. 15. Time series of FP and EP recorded by three methods.
Z. Hu et al. / Ocean Engineering 111 (2016) 335–347342
Moreover, the maximum pitch angle in the experiment (20.6°) isslightly larger than that in the field measurements. It is reportedthat Cf along the skid-ways can introduce such discrepancies inthe tipping time and separating time (He et al., 2013; Zhang et al.,2013).
6.1.2. Relative roll and yaw motionsTo investigate the transverse motion responses in the field
measurements, the time series of the relative roll and yaw motionsbetween the jacket and barge are plotted in Fig. 13. As shown inFig. 13, the relative roll angle varies between �3.0° and 0.2°, andthe relative yaw angle varies within 1.0°. This demonstrates goodstability of the launching operation in the transverse direction.When sliding on the skid-ways, the jacket is constrained to thebarge. Therefore, the relative roll angle between the two bodies isclose to 0°. Once the jacket separates from the rocker arms, minorroll and yaw angles tend to be generated due to the asymmetry ofthe jacket structure, such as the deviation of the transverse centreof gravity or the environmental conditions. Considering the smallamplitudes of roll and yaw motions, the launching motion can besimplified to two-dimensional motion in the vertical plane. Itshould be noted that many undesirable events, including thestructural failure or overturning of the barge, could occur if con-siderable relative roll and yaw motions occur between the twobodies. As the jacket weight and dimensions increase, the jacketand barge specifications should be checked to ensure the safety ofthe launching operation.
6.1.3. Dive depthIt is important to ensure sufficient separation between the
jacket and the seabed to avoid any damage to the structure. Thevertical positions of the jacket FP and EP are examined by plottingthe trajectories of the two points in Fig. 14. As shown in Fig. 14, themaximum dive depths of these two points are 76.8 m and 93.8 m,respectively. This demonstrates the safe bottom clearance in the195 m-deep waters. The vertical position of the jacket EP begins todramatically increase at approximately 34.2 s, when the jacketseparated from the barge. It oscillates and finally stabilizes at awater depth of 93.3 m. Accordingly, the maximum depth of the FP(87.2 m) is 41.4 s, and it later reaches its equilibrium position(18.7 m).
The trajectory motions obtained from the three methods arefurther compared in Fig. 15. For the EP, the trajectory motion in thenumerical simulation strongly agrees with that in the field
measurements, whereas there is a time offset of approximately15 s in the experiment. For the FP, similar motions in the verticaldirection can be observed in Fig. 15(b). To more clearly describe

Fig. 16. Comparisons of vertical positions of FP and EP.
Fig. 17. Time series of jacket velocity and rocker load.
Fig. 18. Comparisons of rocker loads (tipping time and separating time indicate therocker loads at the tipping time and separating time, respectively).
Z. Hu et al. / Ocean Engineering 111 (2016) 335–347 343
the jacket motion in the vertical direction, the maximum andequilibrium values of the jacket FP and EP are presented in Fig. 16.The dive depths of these two points at equilibrium, which can bedetermined from the centre of buoyancy and the centre of gravityof the jacket, are essentially consistent. However, the maximumdive depths of the FP in the numerical simulation (88.5 m) and inthe experiment (97.3 m) are larger than that in the field mea-surement (76.1 m). Generally, the discrepancy among the threetools is more evident at the FP. Clearly, the distance between thejacket COG and the FP is much larger than that between the COGand EP. This indicates that the vertical motion of the FP is relatedto not only the vertical motion of jacket COG but also the jacketpitch when the jacket separates from the barge. As discussedearlier, when the jacket separates from the rocker arms, its pitchangle in the experiment (20.6°) is slightly larger than that in thenumerical simulation (18.8°) and field measurement (18.2°). Thelarger the jacket tips, the greater depth the FP tends to reach.Moreover, there might be some influence from the field waveswhich have been ignored in the model tests and numericalsimulations. The wave-induced motions of the barge may affectthe initial launching condition, thereby affecting the jacket pitchmotion and the vertical motion of the FP.
6.2. Rocker arm loads
The recorded time series of the rocker loads and the jacketvelocities are presented in Fig. 17. As shown in Fig. 17, the
maximum rocker load (6956 MT) occurs at 25.6 s. Meanwhile, thejacket slides rapidly at a speed of 4.46 m/s. The reaction forceschange rapidly during the tipping stage because the buoyancy,friction and hydrodynamic force constantly change as the jacketsimultaneously rotates on and slides down the rocker arms.
To further understand the rocker arm loads, a comparisons ofthe three sets of results are presented in Fig. 18. Generally, goodagreement is observed among the maximum values obtained fromthe three tools. The maximum reaction force in the numericalsimulation is 0.5% larger than that recorded in the field mea-surement. By contrast, the maximum reaction force in theexperiment is smaller than that observed in the field measure-ment. As discussed before, the rocker loads are decided by manyfactors including the sea state and the motion of the two bodies. Inthe following discussion, the numerical sensitivity analyses con-sidering the effect of the initial launching conditions and dragcoefficient on the maximum rocker load will be presented. Ingeneral, the maximum reaction force acting on each rocker arm isestimated to account for 29% of the jacket weight.
6.3. Sensitivity study
The initial conditions include the barge trim and draft, thelongitudinal position of the jacket COG (LCG) and the kineticfriction coefficient along the skid-ways. To quantify the effects ofthese parameters, the critical launching responses, including thejacket pitch motion, the dive depth and the maximum rocker loadunder the specified conditions, are investigated. The non-dimensional values describing every type of launching responseunder various conditions depend on the ratio of every value to itsmaximum value. The sensitivity analyses are conducted using thenumerical method and the relevant initial conditions are listed inTable 3.
6.3.1. Barge trim and draftVariations of the critical launching responses against the barge
trims are presented in Fig. 19. Through a comparison of these fivetrim conditions, one can conclude that the initial trim has a slighteffect on the maximum rocker load. Taking the maximum rockerload under the trim of 3.25° as the reference, the correspondingvalues in case 1-2, 1-3, 1-4 and 1-5 are reduced by 1.65%, 4.80%,8.04% and 12.9%, respectively. Clearly, a large trim leads to areduction in the maximum rocker load. Similar trends are evidentin the tipping time and separating time: a larger trim correspondswith more rapid launching. By contrast, the trim exerts nonoticeable effect on the maximum dive depth. A possible con-tribution to this interesting phenomenon may be the jacketgravity. As the initial trim angle increases, the friction on the jacketdecreases, which results in a higher sliding velocity. Moreover, theeffect of increasing displacement and velocity during the tipping

Table 3Parameters of the initial conditions.
Items Cases Trim(deg)
Draft (m) LCG devia-tion (m)
Cf Cd Cm
Base condition Case 0 4.25 11.12 0.0 0.037 1.20 1.0Initial trimcondition
Case 1-1 3.25 11.12 0.0 0.037 1.20 1.0Case 1-2 3.75 11.12 0.0 0.037 1.20 1.0Case 1-3 4.25 11.12 0.0 0.037 1.20 1.0Case 1-4 4.75 11.12 0.0 0.037 1.20 1.0Case 1-5 5.25 11.12 0.0 0.037 1.20 1.0
Initial draftcondition
Case 2-1 4.25 9.50 0.0 0.037 1.20 1.0Case 2-2 4.25 10.00 0.0 0.037 1.20 1.0Case 2-3 4.25 10.50 0.0 0.037 1.20 1.0Case 2-4 4.25 11.12 0.0 0.037 1.20 1.0Case 2-5 4.25 11.50 0.0 0.037 1.20 1.0
LCG condition Case 3-1 4.25 11.12 þ2.0 0.037 1.20 1.0Case 3-2 4.25 11.12 þ1.0 0.037 1.20 1.0Case 3-3 4.25 11.12 0.0 0.037 1.20 1.0Case 3-4 4.25 11.12 �1.0 0.037 1.20 1.0Case 3-5 4.25 11.12 �2.0 0.037 1.20 1.0
Frictioncoefficient
Case 4-1 4.25 11.12 0.0 0.025 1.20 1.0Case 4-2 4.25 11.12 0.0 0.030 1.20 1.0Case 4-3 4.25 11.12 0.0 0.035 1.20 1.0Case 4-4 4.25 11.12 0.0 0.037 1.20 1.0Case 4-5 4.25 11.12 0.0 0.040 1.20 1.0Case 4-6 4.25 11.12 0.0 0.045 1.20 1.0Case 4-7 4.25 11.12 0.0 0.050 1.20 1.0Case 4-8 4.25 11.12 0.0 0.055 1.20 1.0Case 4-9 4.25 11.12 0.0 0.060 1.20 1.0
Dragcoefficient
Case 5-1 4.25 11.12 0.0 0.060 1.40 1.0Case 5-2 4.25 11.12 0.0 0.060 1.20 1.0
Fig. 19. Variations in launching responses versus the barge trims. Fig. 20. Variations in launching responses versus the barge drafts.
Z. Hu et al. / Ocean Engineering 111 (2016) 335–347344
stage, thereby increasing the hydrodynamic force on the jacket,directly reduces the maximum rocker load.
Fig. 20 shows the influences of the barge draft on the jacketmotion and the maximum rocker load. A slight correlation isobserved between the draft and the maximum rocker load. Morespecifically, compared with case 2-1, the maximum rocker loads incases 2-2, 2-3, 2-4 and 2-5 are reduced by 1.10%, 2.10%, 3.42% and4.41%, respectively. This indicates that a large draft can also reducethe maximum rocker load. The opposite relationship is observedbetween the tipping time and the draft. In addition, there is noexplicit correlation between the maximum dive depth and draft.One possible reason for this phenomenon may be that the buoy-ancy increases due to the larger displacement, which results in alonger tipping time. Correspondingly, the maximum rocker loaddecreases slightly with a larger draft due to the compensation forthe jacket weight by the buoyancy.
One of the interesting findings is that the trim angle has agreater effect than the draft in terms of the maximum rocker load.With cases 1-1 and 2-1 as references, the load ratios versus var-iations in the trim and draft are illustrated in Fig. 21. For a 3%increase in the maximum rocker load, the variations in the draftand trim angle are 1.31 m and 0.73°, respectively. This indicatesthat a smaller trim variation results in the same rocker load var-iation. A similar phenomenon was observed in the numericalsimulations performed by Jo et al. (2002).
6.3.2. Longitudinal position of the jacket COGFig. 22 shows the influences of the jacket LCG on the motion
responses and rocker loads. A positive LCG deviation means that itmoves closer to the barge stern, whereas a negative value indicatesa farther distance from the barge stern. As shown in Fig. 22, themaximum dive depth of the FP is reduced by 11.3% as the deviation

Fig. 22. Variations in launching responses versus the jacket LCG deviations.
Fig. 23. Variations in launching responses versus friction coefficients.
Fig. 24. Drag coefficient of a circular cylinder for various values of the surfaceroughness parameters ks/D. (Achenbach and Heinecke, 1981).
Fig. 21. Comparison of the effects of trim and draft on the maximum rocker load.
Z. Hu et al. / Ocean Engineering 111 (2016) 335–347 345
of the jacket LCG changes from þ2.0 m to �2.0 m, and the cor-responding value of the EP increases by 1.44% with the same LCGvariation. In addition, a longer duration will be generated whenthe jacket COG moves farther from the barge stern. According tothese data, the jacket LCG is closely related to the jacket pitch
motion. As the jacket COG moves farther from the barge stern, thejacket pitch angle increases (bow down) and, consequently, themaximum dive depth of the FP increases. Another interestingphenomenon observed in Fig. 22 is that the jacket pitch motion isclearly related to the maximum dive depth of the FP. Similar trendsare observed in the variations of the maximum pitch angle and themaximum dive depth of the FP versus the LCG deviation. Thistrend indicates that the vertical motion of the FP can be greatlyaffected by the jacket pitch motion.
From the structural load perspective, the maximum rockerloads in cases 3-2, 3-3, 3-4 and 3-5 are reduced by 1.04%, 2.06%,3.09% and 4.16%, respectively, versus the case 3-1. Moreover, thetipping time increases by 5.0% as the jacket LCG deviation variesfrom þ2.0 m to �2.0 m. As discussed above, when the jacket COGpasses over the tilting beam, the jacket starts to tip on the rockerarms. At the tipping time, the effect of the negative LCG deviation,thereby increasing the displacement of the jacket, is to increasethe buoyancy and hydrodynamic forces and therefore reduce therocker loads.
In general, the jacket LCG plays a very important role in alaunching operation from the perspective of motion and structuralload. It is desirable to move the jacket COG towards the barge bowto optimize the rocker loads and the subsequent upendingoperation.
6.3.3. Kinetic friction coefficient (Cf )To investigate the influence of Cf along the skid-ways, the
variations in the rocker load and motion response under certainCf conditions are presented in Fig. 23. As shown in Fig. 23, thejacket motion responses are significantly affected by Cf , particu-larly the tipping time and separating time. As Cf increases from0.025 to 0.060, the tipping time and separating time increase by56.4% and 42.4%, respectively. Rodríguez et al. (2014) investigatedthe dynamic friction coefficient and its influences on the jack-upplatform launching using an experimental approach. Theseauthors reported that a smaller Cf could shorten the slidingduration of the jacket along the launch-ways. Additionally, noclear effect of Cf on the maximum rocker load and the maximumjacket pitch is observed. The friction coefficient must be suffi-ciently low to enable such gravity-driven launching.
6.4. Drag coefficient (CD)
From the above results, there are differences in the launchingbehaviours between the experiment and field measurement.Several possible reasons for these differences in the Froude-

Fig. 25. Comparisons of pitch motions recorded in experiment, numerical case 5-1and case 5-2.
Table 4The launching responses recorded in the experiment, the numerical case 5-1 andcase 5-2.
Items Units Experiments Case 5-1 Case 5-2
Tipping time s 36.9 36.4 34.7Separating time s 49.5 47.7 47.5Max jacket pitch deg 20.8 18.0 21.0Max dive depth at FP m �97.3 �81.6 �99.3Max dive depth at EP m �94.4 �92.7 �95.4Max rocker load MT 6333.0 6141.4 6365.1Percent of jacket weight % 27.2% 26.3% 27.3%
Z. Hu et al. / Ocean Engineering 111 (2016) 335–347346
similarity models include Cf and CD. As discussed before, thehydrodynamic force acting on the jacket is closely related to CD.The estimated Re in the prototype is 2:5�106, and that in thescaled model is approximately 8:5�103. CD is a function of the Reand roughness parameter (ks=D), where ks is the Nikuradseequivalent sand roughness (Sumer, 2006). Fig. 24 shows CD plottedas a function of these parameters (Achenbach and Heinecke, 1981).As shown in Fig. 24, CD ranges from 1.4 to approximately 1.0 in thecase of employing a rough cylinder with ks=D¼3�10�3. Toinvestigate the effect of CD, the numerical simulations in the fullscale (Case 5-1 and 5-2) are performed and compared with theexperiment.
Fig. 25 shows the time series of the pitch motions observed inthe experiment, case 5-1 and case 5-2, respectively. As shown inFig. 25, the launching operations in case 5-2 progress a little morerapid than that in case 5-2 and experiment. The tipping time incase 5-2 is approximately 34.7 s, while the jacket begins to tip at36.4 s in case 5-1 and at 36.9 s in the experiment. And the max-imum pitch angle in case 5-2 (21.0°) is slightly larger than that inthe experiment (20.8°) and case 5-1 (18.0°). A possible explanationfor the differences may be that the larger hydrodynamic forces onthe scaled model can slow down the launching and marginallyreduce the pitch motion in the case of employing the same frictioncoefficient (0.06).
To further understand the effect of CD, the statistics of thelaunching responses in case 5-1, case 5-2 and experiment aresummarized in Table 4. It can be seen from Table 4 that themaximum dive depth of the FP in case 5-2 is larger than that in theexperiment and case 5-1, which shows a correlation between themaximum dive depth of the FP and the maximum pitch angle.
With regard to the maximum rocker loads, the comparisons showthat CD can have a modest influence.
As discussed before, the difference in Cf may induce a markeddiscrepancy in the launching duration between the model testsand field measurements. A larger Cf in the model test can intro-duce a significant time delay for the jacket launching operation.While the influence of CD on the launching response could bequite modest. In general, gravity and friction are predominantduring the sliding stage, and thus the effect of Cf is more reflectedin the tipping time. While the buoyancy, friction and hydro-dynamic forces are important during the tipping stage. The effectof CD may be more reflected in the launching response during thetipping stage.
7. Conclusions
By comparing the jacket launching behaviours obtained fromthree different methods, the motion responses and the rocker armloads are comprehensively investigated. This study yields the fol-lowing conclusions:
1. Field measurements successfully captured dynamic launchingprocesses when 6 DOFs motions and rocker loads are measured,which confirmed the safe operation of mega jacket launching.Moreover, field data provided more valuable information forfuture numerical simulations and model tests for jacketlaunching operations.
2. The model tests underestimate the maximum rocker load andover-predict the time needed to reach the tipping stage.Specifically, Cf along the skid-ways exhibits obvious influenceon the time delay in the model test. Therefore, it is suggestedthat several sets of model tests with different Cf be carried out.Moreover, the differences in the environmental conditions andCD could have a modest influence on the launching responses. Itis also suggested that the launching tests be performed in adesign sea state to predict the full-scale launching as compre-hensively as possible. Although the model tests differ from thefield launching in the launching duration, such tests couldprovide the quantification of the maximum rocker load andthe maximum dive depth of the jacket.
3. As revealed by a sensitivity study, the jacket pitch motions andthe maximum dive depths of the forward point and endpointare sensitive to the LCG deviations of the jacket, which maypose a challenge in jacket design and fabrication. From the loadsperspective, a larger barge trim and draft and a negative LCGdeviation are favourable.
It should be recalled, however, that the measurement errors ofthe integrated GPS and INS system are not negligible, especiallywhen the jacket reaches a great dive depth. The maximum divedepths obtained from the field measurement could be ratherapproximate. Further research is needed to improve the mea-surement methods and to bring better understanding to the jacketlaunching.
Acknowledgement
The authors would like to acknowledge the support of theNational Natural Science Foundation of China (Grant nos.51239007). Special thanks are given to Prof. Longfei Xiao and Mr.Lingzhi Xiong for their constant support and valuable suggestions.

Z. Hu et al. / Ocean Engineering 111 (2016) 335–347 347
References
Achenbach, E., Heinecke, E., 1981. On vortex shedding from smooth and roughcylinders in the range of Reynolds numbers 6�103 to 5�106. J. Fluid Mech.109, 239–251.
Chen, M.S., Taylor, R.E., Choo, Y.S., 2014a. Time domain modeling of a dynamicimpact oscillator under wave excitations. Ocean. Eng. 76, 40–51.
Chen, Y., Chen, G., Yang, J., Li, X., Jiang, X., 2014b. Research on field measurement ofmega jacket launch. Ocean. Eng. 32 (6), 10–15.
Chen, Y., Li, X., Chen, G., Li, G, Zhang, D., 2013. The use of INS and GPS and the post-processing method in field measurement of mega jacket launch. In: Proceed-ings of 32nd International Conference on Ocean Offshore and Arctic Engi-neering. Nantes, France, OMAE 2013-11482.
Denton, G.N., 2013. Guidelines for the Transportation and Installation of SteelJackets. GL Noble Denton.
DNV, 2014. Environmental Conditions and Environmental Loads. Det Norske Ver-itas, Norway.
Drazen, D., Eric, T., Don, W., Hazard, J., Cook, T., Scott, S., 2012. Full-scale mea-surements of wave impact loading on a flat plate. ASME J. Offshore Mech. Arc.Eng., 449–458.
Eagleson, H.V., 1945. An experimental method for determining coefficients ofsliding friction. Am. J. Phys. 13 (1), 43–44.
Fossen, T.I., 2011. Handbook of Marine Craft Hydrodynamics and Motion Control.John Wiley & Sons.
Hambro, L., 1982. Jacket launching simulation by differentiation of constraints.Appl. Ocean. Res. 4 (3), 151–159.
He, M., Li, H., Wang, A.M., Liang, Y., Li, X., Li, J., 2013. A comparative study of launchanalysis and field measurement for liwan 3-1 mega jacket launch in southchina sea. In: Proceedings of the 23rd International Offshore and Polar Engi-neering Conference. Anchorage Alaska, USA, pp. 822–831.
He, M., Li, H., Wu, Z., Yu, W., Qian, J., Wang, A.M.,2010. Jacket launch and self-upending analyses with small-hole flooding scheme. In: Proceedings of the20th International Offshore and Polar Engineering Conference. Beijing, China,pp. 400–407.
Honarvar, M., Pirooz, M.D., Bahaari, M.R., 2008. A physical and numerical modeling for launching of jackets (Case Study on Balal PLQ Platform). ASME J. Offshore Mech. Arc. Eng. 130 (3), 031004.
Jo, C.H., Kim, K.S., Lee, S. Criterion of offshore jacket launching analysis. In: Pro-ceedings of the 11th International Offshore and Polar Engineering Conference. Stavanger, Norway, pp. 90–96.
Jo, C.H., Kim, K.S., Lee, S., 2002. Parametric study on offshore jacket launching. Ocean. Eng. 29 (15), 1959–1979.
Liu, Y., Yabin, G., Shuhua, G., 1986. Theoretical calculation and model test of jacket launching process. Shipbuild. China 1, 000.
Micron Optics, 2012. User Guide, Revision 1.138.. Micron Optics, Inc. 1852 Century Place NE, Atlanta, Ga. 30345 USA.
Nachlinger, R., 2006. How MOSES Deals with Technical Issues. Ultramarine Inc. Rodríguez, C.A., Moura, M., Esperança, P.T.T., Raigorodsky, J., 2014. An experimental
approach for the offshore launching of jack-ups. ASME J Offshore Mech. Arc. Eng. 136 (2), 021301.
Sircar, S., Chandra, T., Mills, T., Roberson, W., 1990. Transportation launch and self-upend analysis of the kilauea jacket using proven analytical techniques. In: Proceedings of Offshore Technology Conference (OTC) 1990, Houston, Texas.
Sumer, B.M., 2006. Hydrodynamics Around Cylindrical Structures. World Scientific. Tyler, S., Silvia, T., Claire, D., 2013. Strain measurements using fibre Bragg gratings
during full-scale structural testing of an F/A-18 centre barrel. Key Eng. Mater. 558, 510–521.
Xiong, L., Yang, J., Li, X., Xu, X., 2013. Study on numerical simulation of jacket launching progress. In: Proceedings of 32nd International Conference on Ocean, Offshore and Arctic Engineering. Nantes, France, OMAE 2013-11178.
Xu, X., Yang, J., Li, X., Lu, H., 2013. Investigation on hydrodynamic performance of T-shaped barge in topside transportation. J. Ship Mech. 17 (12), 1426–1438.
Zhang, D., Li, X., Li, D., Liang, Y., Yang, Z., Sun, X., Wang, A.M., 2013. A model test study for liwan 3-1 mega jacket launch in South China Sea. In: Proceedings of the 23rd International Offshore and Polar Engineering Conference. Anchorage, Alaska, USA, pp. 814–821.
Zhao, W., Yang, J., Hu, Z., Tao, L., 2014. Coupling between roll motions of an FLNG vessel and internal sloshing. ASME J Offshore Mech. Arc. Eng. 136 (2), 021102.

� مقا�، از �ی � ه مقا�ت ا �� ن سايت شده �� ��ه فاراي �� در PDFكه #� فرمت ميباشد ��
ان قرار � ايل ميتوانيد #� 6يک �� روی د3ه های ز�� گرفته است. اختيار -, عز�� از در صورت :�
اييد:سا�� مقا�ت � استفاده :� ن<�
ه شده از �� � مقا�ت �� � ه فا ؛ مرجع جديد�� �� ت معت<� خار�B سايت �� �# ,Dن