bulletin eif aquitaine - Société géologique de France
305
bulletin DES CENTRES DE RECHERCHES EXPLORATION-PRODUCTION eif aquitaine North Sea Barents Sea Baltic Sea „ Black Sea AN PLAIN CENTRAL ASIA Bull. Centres Rech. Explor.-Prod. elf aquitaine elf aquitaine, 31360 Boussens/France BCREDP U’ C\ wlv|| wjL * { ft* wmSiiius^- *>£. | / & fflf
-
Upload
khangminh22 -
Category
Documents
-
view
0 -
download
0
Transcript of bulletin eif aquitaine - Société géologique de France

bulletin DES CENTRES DE RECHERCHES EXPLORATION-PRODUCTION eif aquitaine
NorthSea
BarentsSea
Baltic Sea „
BlackSea
AN PLAIN
CENTRALASIA
Bull. Centres Rech. Explor.-Prod. elf aquitaine
elf aquitaine, 31360 Boussens/FranceBCREDP
U’C\ w lv|| wjL *
{ ft*wmSiiius^ - *>£. | / &fflf

Couverture/Cover: Conception: R. CurnelleRéalisation/Design : B. Caffier (cf. article/paper Avkhimovitch et al.)
Bulletin des Centres de Recherches Exploration-Production elf aquitaine
De 1967 à 1976: From 1967 to 1976:«Bull. Centre Rech. Pau-SNPA» (vol. 1-10)
Revue semestrielle pour la diffusion de résultats d’intérêt général, issus d’études menées par elf aquitaine production (en particulier aux Centres de Recherches) ou par des chercheurs travaillant en collaboration avec elf aquitaine production.
Half-yearly review publishing the results of general interest arising from research undertaken by elf aquitaine production particularly at the Research Centres, or by scientists working in collaboration with elf aquitaine production.
Editeur: elf aquitaine production, 31360 Boussens/France.Rédacteur en chef : Robert Curnelle, elf aquitaine édition, 31360 Boussens/France.Rédacteur : Jean-Paul Sévérac.Conseil éditorial: H. Arnaud, A.W. Bally, W.A. Berggren, R. Blanchet, G. Boillot, H. Chamley, J. Dercourt P. Dubois, G. Grau, P. Homewood, S. Jardiné, R. Joyes, P. Mechier, H.J. Oertli A Perrodon J Philip’ R A. Price, C. Puigdefabregas, N.C. Wardlaw, M.'Zimmermann.Imprimeur: Louis-Jean, 05003 Gap.Le «Bulletin des Centres de Recherches Exploration-Production elf aquitaine» peut être obtenu soit par échange, soit par achat (prix du fascicule indiqué au dos de chaque numéro), soit par souscription annuelle (170 FF). Paiement par chèque postal (3 volets; elf aquitaine production, 1368689 L Paris), chèque ou carte bancaire.
Sponsor-Publisher : elf aquitaine production, 31360 Boussens/France.Chief Editor : Robert Curnelle, elf aquitaine édition, 31360 Boussens/France.Editor: Jean-Paul Sévérac.Scientific advisory board : H. Arnaud, A.W. Bally, W.A. Berggren, R. Blanchet, G. Boillot, H. Chamley, J. Dercourt, P. Dubois, G. Grau, P. Homewood, S. Jardiné, R. Joyes, P. Mechier, H.J. Oertli, A. Perrodon, j. Philip, R.A. Price, C. Puigdefabregas, N.C. Wardlaw, M. Zimmermann.Printer: Louis-Jean, 05003 Gap/France.The «Bulletin des Centres de Recherches Exploration-Production elf aquitaine» is available by individual issue, by annual subscription (170 FF, 35 US $) or on an exchange basis.«Copyright» ©En application de la loi du 11 mars 1957, il est interdit de reproduire intégralement ou partiellement la présente publication sans autorisation de l’Editeur ou du Centre Français d’exploitation du droit de copie (6bis rue Gabriel-Laumain, F-75010 Paris).Copyright statement (valid for users in USA)The appearance of the code at the bottom of the page of an article in this journal indicates the copyright owner’s consent that copies of the article may be made by libraries for the flat base of US $ 0.20 per page (no base fee). All articles published prior to 1981 may be copied for a per-copy fee of US $ 2.25.Payments should be sent directly to the Copyright Clearance Center, 21 Congress St., Salem, MA 01970 (tel. : (617) 744-3350). Copying done for other than personal or internal reference use (general distribution, resale, promotion purposes, etc.) needs the expressed permission of elf aquitaine production.Request for special permission or bulk orders should be addressed to the Editor.
Text type: Univers 45 (photocomposition)Text paper: Périgord mat 115 g Cover: Carte couché 275 g Circulation: 2 000 copies
Key words through kind cooperation of BRGM, Orléans'n ' Chemical Abstracts; Petroleum Abstracts; Coal Abstracts; Institute of Scientific Information (ISI)•
Bull. Signal. CNRS; GEOREF; GEOARCHIVES; Pascal-Géode (BRGM/INIST); Analyt. Rev. Inst. Scient Inform Acad. Sci. RUSSIA.
Effective publication date of the last issue (vol. 16, no. 2, 24 December 1992)© 1993 by elf aquitaine production
Le Directeur de la publication: Guy Feneyrou

APPORTS DES TECHNIQUES 3D DE LA TÉLÉDÉTECTIONDANS LA RECHERCHE DES BLOCS BASCULÉSDU FOSSÉ NORD TANGANYIKA, RIFT EST-AFRICAIN, ZAIRE.
3D REMOTE SENSING TECHNIQUES AS AN AID FOR THE RESEARCH OF TILTED BLOCKSOF THE NORTH TANGANYIKA TROUGH, EAST AFRICAN RIFT, ZAIRE.
Patrick REYNES, Joël ROLET, Jean-Paul RICHERT,Pierre GRUNEISEN, Jean-Michel PALENGAT et Dominique COQUELET
REYNES, P„ ROLET, J., RICHERT, J.-P., GRUNEISEN, P., PALENGAT, J.-M. & COQUELET, D. (1993). - Apports des techniques 3D de la télédétection dans la recherche des blocs basculés du fossé Nord Tanganyika, Rift est-africain, Zaïre [3D remote sensing techniques as an aid for the research of tilted blocks of the North Tanganyika trough, East African Rift, Zaire], - Bull. Centres Rech. Expior.- Prod. Elf Aquitaine, 17, 1, 1-17, 18 fig.; Boussens, June 24, 1993. - ISSN : 0396- 2687. CODEN : BCREDP.Remote sensing is an ever-developing geological interpretation tool. This study
was aimed at testing and highlighting new, 3D remote sensing techniques through the structural analysis of the North Tanganyika trough - graben of the East African Rift. The geological research focused on the tilted blocks of the western rift shoulder. The initial pattern of steplike tilted blocks is considerably altered by erosion. As a result, block geometry and arrangement was difficult to detect with conventional 2D studies (aerial photographs, satellite images).
Using a stereopair of SPOT images, elevation data on the study area were obtained by diverse calculation methods through the building of a Digital Elevation Model (DEM) and production of associated ortho-image. From these digital data, 3D image processing software (VUE3D®) helped create and handle relief maps as well as to quantify planar parameters such as dips and strikes of faults or sedimentary beds.
DEM-derived digital data served as a basis for producing a shaded relief map and a slope image of the study area, thereby identifying erosional tilted blocks.
These tools added to a morphotectonic analysis of 3D views provided a neo- tectonic structural map of the subsiding Uvira area (Zaïre). Digitizing the Za'irian shoulder uplift was also possible using the DEM-derived elevation data.
It appears from the structural analysis of the North Tanganyika trough that the tools and 3D methods used in this particular case are most efficient for the study of morphologically complex areas where geology is masked. More generally, DEM and associated tools complement the conventional remote sensing techniques while opening up a new range of possibilities for geological analyses.Patrick Reynes, Joël Rolet, Université de Bretagne Occidentale, GDR 910 et URA
CNRS D 1278 « GEDO », 6, Avenue Le Gorgeu, BP 452, F-29275 Brest cedex; Jean-Paul Richert, Pierre Gruneisen, Jean-Michel Palengat, Dominique Coquelet, Elf Aquitaine Production, Centre Scientifique et Technique Jean Feger, F-64018 PAU cedex. - February 15, 1993.
Key words: Spatial remote sensing, spot, Altimetry (Digital elevation model), Tilted blocks, Neotectonics, Graben, Rift, Uplift, Normal faults, Kenya, East African Rift.
0396-2687/93/0017-0001 $ 3.40 © 1993 elf aquitaine production, F-31360 Boussens

2 P. REYNES, J. ROLET, J.-R RICHERT, P. GRUNEISEN, J.-M. PALENGAT ET D. COQUELET BCREDP 17 (1993)
RÉSUMÉ
La télédétection est un outil d'interprétation géologique en pleine évolution. L'objectif de cette étude est de tester et de mettre en valeur les nouvelles techniques 3D de la télédétection à travers l'analyse structurale du fossé Nord Tanganyika, graben du Rift est- africain. La recherche géologique est axée sur la mise en évidence des blocs basculés affectant l'épaulement ouest du rift dans cette région. Le schéma de base des blocs basculés en •• marches d’escalier » est largement défiguré par l’érosion. De ce fait, la géométrie de ces blocs et leur agencement est difficile à mettre en évidence par les études classiques en 2D (photos aériennes, images satellitaires).
L’existence d'un couple stéréoscopique d'images SPOT sur la zone d’étude a permis, par divers procédés de calcul, d’accéder à l’information altimétrique grâce à la réalisation du Modèle Numérique de Terrain (MNT) correspondant et à l’ortho-image (image corrigée) numérique associée.
A partir de ces fichiers de données numériques un logiciel de traitement d’image en 3D (VUE3D®) permet de créer et de manipuler des paysages en relief. Il permet en outre de quantifier des paramètres de plan tels que pendages et orientations de failles ou de couches sédimentaires.
Les données numériques du MNT sont à l'origine du calcul d’une image ombrée du relief et d’une image des pentes de la zone étudiée qui sont autant d’aides à la recherche des blocs basculés érodés.
L'utilisation de ces outils et une étude morphotectonique sur les vues en 3D permettent de dégager un schéma structural de la néotectonique en effondrement dans la région d’Uvira (Zaïre). Une quantification du soulèvement de l’épaulement zaïrois est aussi rendue possible avec les altitudes fournies par le MNT.
L’analyse structurale du fossé Nord Tanganyika montre, dans ce cas précis, l’efficacité des outils et méthodes 3D dans l’étude des zones affectées d’une morphologie compliquée masquant la géologie. Plus généralement, le MNT et les outils associés constituent un large complément à la télédétection classique et ouvrent un nouvel éventail de possibilités d’analyses géologiques.Mots-clefs : Télédétection spatiale, spot, Altimétrie (Modèle numé
rique terrain), Bloc basculé, Néotectonique, Graben, Rift,Exhaussement, Faille normale, Kenya, Rift est africain.
TABLE DES MATIÈRES — CONTENTS
INTRODUCTION..................................................................... 21. - CADRE GÉOGRAPHIQUE ET GÉOLOGIQUE - GEO
GRAPHIC AND GEOLOGIC FRAMEWORK................... 21.1. Le Rift est-africain - East African Rift................... 21.2. Le fossé du Tanganyika - Tanganyika trough........ 3
1.2.1. Aspects structuraux - Structural features ... 31.2.2. Aspects morphotectoniques - Morphotec-
tonics........................................................... 41.3. La région d'Uvira et les témoins de blocs basculés
- Uvira region and the remnants of tilted blocks. 4
2. - MÉTHODES DE TRAVAIL, LA TÉLÉDÉTECTION 3D -METHODS, 3D REMOTE SENSING............................... 42.1. L’imagerie spot - Spot imagery............................. 52.2. La perception du relief - Relief perception........... 5
2.2.1. Le modèle numérique de terrain - Digitalelevation model........................................... 5
2.2.2. L’ortho-image - Ortho-image...................... 62.2.3. Le logiciel «VUE3D» - “VUE3D" software. 7
2.2.3.1. Aspects qualitatifs - Qualitativeaspects........................................... 7
2.2.3.2. Aspects quantitatifs - Quantitativeaspects........................................... 8
2.3. Les outils de travail, intérêts du relief numérique-Work tools, advantages of digital elevation analysis 8
3. - UN EXEMPLE D’UTILISATION DES TECHNIQUES 3DSUR LA ZONE D’UVIRA - EXAMPLE OF 3D TECHNIQUE APPLICATION IN THE UVIRA REGION.................. 123.1. Recherche des blocs basculés - Search for tilted
blocks.............................................................. 123.2. Réalisation d’un schéma structural - Structural
mapping.......................................................... 133.3. Analyse structurale - Structural analysis....... 13
4. - DISCUSSION.......................................................... 145. - CONCLUSION........................................................ 156. - RÉFÉRENCES......................................................... 17
INTRODUCTION
L’objectif de cette étude est de tester et de mettre en valeur les récentes techniques 3D de la télédétection à travers l’analyse structurale du fossé Nord Tanganyika, graben du Rift est-africain. La recherche géologique est axée sur la mise en évidence et la cartographie des blocs basculés affectant l’épaulement ouest du fossé (région d’Uvira, Zaïre).
Dans cette région, où les accès sont souvent difficiles, les missions de terrain Tanganydro n’ont permis d’observer que très localement des blocs basculés de petites dimensions (communication orale J. Rolet & C. Coussement, 1991). Les abords du lac sont soumis à une forte érosion qui a disséqué les reliefs, en réentaillant la surface prérift et défigurant ainsi les structures et la morphologie des blocs basculés.
Les études menées jusqu’à présent en télédétection à partir de photos aériennes ou d’images satellitaires (Choro- wicz et al., 1990; Bouroullec et al., 1991) ont connu de grandes difficultés devant ces problèmes d’érosion.
L’existence, sur la zone d’étude, d’un couple stéréoscopique d’images SPOT et la réalisation du Modèle Numérique de Terrain (MNT) correspondant, apporte des informations nouvelles. En effet le MNT, associé au logiciel VUE3D, permet une étude géomorphologique en trois dimensions. Cette étude, semblable à une mission de terrain effectuée par des vols avion à basse altitude, permet donc de pousser plus loin les investigations et de saisir l'agencement général des blocs effondrés.
1 — CADRE GÉOGRAPHIQUE ET GÉOLOGIQUE
1.1. LE RIFT EST-AFRICAIN
Le Rift est-africain est une vaste structure d’amincissement et de déchirement de la lithosphère attestant l'instabilité du continent africain. Long de 4 500 km, il s’étend depuis la jonction Mer Rouge-Golfe d’Aden jusqu’à la marge mozambicaine (Fig. 1). Il est composé de deux parties essentielles que sont les branches orientales et occidentales.

BCREDP 17 (1993) LA TÉLÉDÉTECTION 3D ET LA STRUCTURE DU FOSSÉ DU TANGANYIKA 3
Figure 1
Le Rift est-africain (d'après Chorowicz, 1983, modifié). The East African Rift (after Chorowicz, 1983, modified).
II tend à individualiser le bloc est-africain sous l’influence d’une contrainte d’extension globalement orientée NW-SE à WNW-ESE (Chorowicz et al., 1987). Les grands accidents prennent naissance sur les zones fragilisées que sont les « bourrelets orogéniques » précambriens ceinturant les cra- tons stables. Les segments NE-SW et N-S s'expriment sous la forme de fossés d’effondrement reliés entre eux par des failles de transfert de direction NW-SE actives en décrochement. C’est le cas notamment du grand linéament TRM (série des lacs Tanganyika-Rukwa-Malawi) dont le décrochement dextre (Chorowicz et al., 1983) est un relai entre la partie sud et la partie nord de la branche occidentale. Ce linéament, affecté de failles normales décrochantes est jalonné d’une série de fossés en régime transtensif.
1.2. LE FOSSÉ DU TANGANYIKA
Le fossé du lac Tanganyika appartient à la branche occidentale du Rift est-africain. Il est à cheval sur la partie nord de la branche occidentale et le linéament TRM (Fig. 2).
Figure 2
Aspects structuraux du fossé du Tanganyika (d’après Morley, 1988) et de la zone couverte par l’image SPOT utilisée dans
cette étude (d’après Rolet et al., 1991, modifié).Structural features of the Tanganyika trough (after Morley, 1988)
and of the SPOT image study area (after Rolet et al., 1991, modified).
1.2.1. Aspects structuraux
Le fossé du Tanganyika ne s’est pas développé sur un domaine homogène, mais sur un socle ancien structuré par les orogènes successifs du Précambrien (Fig. 3). Les terrains affectés par un ou plusieurs épisodes tectoniques constituent des anisotropies au sein de la croûte continentale. Ces anisotropies, directions de fragilité maximum, sont préférentiellement utilisées par les nouvelles déformations (McConnell, 1967, 1972, 1980).
Des études structurales du fossé ont été menées in situ et à partir d’images satellitaires LANDSAT MSS (Chorowicz et al., 1983; Chorowicz et al., 1990; Bouroullec et al., 1991; Mondeguer, 1991) et de profils sismiques (Le Fournier, 1986, rapport interne Elf Aquitaine). La moitié sud du lac s’ouvre sur le linéament TRM (Fig. 2). Son effondrement est contrôlé par des accidents normaux décrochants de direction N135°E, soumis à une extension NW-SE à WNW-ESE. La partie sud du fossé Tanganyika s’inscrit en fait dans un couloir structuré par les orogènes de l’Ubendien et du Ruzizien (1 800 - 2100 Ma) entre les cratons zambien et tanzanien (McConnell, 1950; Daly, 1988) (Fig. 3). Ce sont donc les directions structurales NW-SE de ces chaînes qui sont réactivées dans les mouvements néotectoniques du linéament TRM, obéissant au champ de contrainte actuel.
La moitié nord du lac s’ouvre à l’intersection des chaînes kibarienne (directions structurales NE-SW, 1 400 - 900 Ma) et ruzizienne (Klerkx 1988; Klerkx & Nanyaro, 1988) (Fig. 3). Dans cette zone des accidents N-S se développent. C’est sans doute la combinaison des trois directions NW-SE, NE- SW et N-S qui influence l’ouverture subméridienne du fossé à cet endroit (Fig. 2).

4 P- REYNES, J. ROLET, J.-P. RICHERT, P GRUNEISEN, J.-M. PALENGAT ET D. COQUELET BCREDP 17 (1993)
Figure 3
Héritage des structures anciennes par le fossé du Tanganyika (d'après McConnell, 1972; Klerkx, 1988; Kroner, 1975;
Geological map of UNESCO, 1972-75).Pre-existing structures inherited by the Tanganyika trough
(after McConnell, 19/2; Klerkx, 1988; Kroner, 19/5; Geological map from UNESCO, 19/2-/5).
1.2.2. Aspects morphotectoniques
Le bassin du Tanganyika est issu de la coalescence de plusieurs sous-bassins actuellement séparés par des horsts sous-aquatiques ou émergés (Mondeguer, 1991; Tiercelin & Mondeguer, 1991; Bouroullec, et ai, 1991; Tanganydro group 1992). Chacun de ces sous-bassins présente quasi systématiquement un caractère asymétrique très marqué (Ebin- ger, 1989; Rosendahl et al., 1986).
Un examen morphologique des bordures conduit à distinguer, d’un côté, un versant abrupt et, du côté opposé, un versant en pente douce; abrupt et pente douce alternant d’un sous-bassin à l’autre. Le versant abrupt d’origine tectonique traduit l’existence d’un accident normal majeur dont le rejet vertical peut atteindre quelques kilomètres. Le versant en pente douce, souvent qualifié de versant flexuré, est également taillé mais il s’agit généralement d’une série d’accidents normaux mineurs résultant d’une déformation beaucoup plus diffuse. Les dénivelés topographiques les plus importants s’observent du côté du versant abrupt de même que les plus fortes profondeurs d’eau.
Le lac Tanganyika est donc constitué d’une succession de sous-bassins s’ouvrant en demi-graben dont les caractères d’asymétrie s’inversent presque systématiquement de l’un à l’autre.
Le sommet des épaulements du rift présente une morphologie de plateau et l’altitude y est relativement importante par rapport à l’altitude moyenne de la région.
Certaines études (Le Fournier, 1986, rapport interne Elf Aquitaine) ont montré que leur soulèvement, était récent et d’origine essentiellement thermique. En effet, la zone du lac emplie de sédiments se comporterait comme un écran thermique et les lignes de flux de dégagement de chaleur seraient donc anormalement concentrées sur les bordures pour entrainer leur dilatation thermique.
1.3. LA RÉGION D’UVIRA ET LES TÉMOINS DE BLOCS BASCULÉS
La région d’Uvira, partie extrême nord du lac, est constituée des terrains métamorphiques (granite, gneiss, schiste, quartzite) très structurés du socle précambrien.
Sur le plan de la néotectonique, dans les cas les plus favorables, le Rift est-africain s’exprime suivant le schéma classique des blocs effondrés en « marches d’escalier » (lac Baringo, Kenya) (Tiercelin et al., 1987). Les observations de terrain effectuées sur la zone d’Uvira lors de la campagne Tanganydro 1991, ont montré que le problème est ici plus compliqué.
Du côté Zaïre, versant abrupt affecté par l’accident majeur d’Uvira, l’érosion a largement disséqué toutes les structures. Le schéma de base en « marches d’escalier » est défiguré, presque effacé.
Du côté Burundi, versant flexuré, les structures étaient au départ beaucoup moins marquées et, à l’érosion importante, s’est surimposé un drapage des reliefs par une formation rouge de dépôts de pente. De ce côté, le schéma de base, déjà moins franc, a presque disparu, soit masqué, soit érodé.
La Figure 4 montre l’aspect que prennent généralement les blocs basculés (ou plutôt blocs effondrés) dans la morphologie du paysage. Chaque « marche d’escalier » érodée est réduite à une suite de crêtes sensiblement parallèles et présentant les mêmes ruptures de pente. Chacune de ces ruptures de pente délimite une « marche d’escalier »; la pente forte a pour origine le miroir de faille érodé et la pente faible constitue un vestige de la paléo-surface prérift (Fig. 4, surfaces 1 et 2). Les observations de terrain montrent que ces vestiges, soulignés par des cailloutis de pénéplanation, sont pentés vers le fossé. Les failles normales limitant les blocs basculés sont synthétiques.
L’absence de niveaux repères tels des couches sédimen- taires ou la présence de coulées basaltiques dans la région rend d’autant plus difficile le repérage des blocs effondrés.
2 — MÉTHODES DE TRAVAIL, LA TÉLÉDÉTECTION 3D
Les images satellitaires les plus couramment utilisées en géologie sont celles des satellites LANDSAT et SPOT. Les images LANDSAT, de 180 km de côté, sont utilisées pour des études d’échelle régionale, alors que celles de SPOT, 9 fois plus petites, mais de meilleure résolution, sont plutôt recherchées pour les études de détail. L’étude fine du fossé Nord Tanganyika a été réalisée à partir d’une image SPOT.

BCREDP 17 (1993) LA TÉLÉDÉTECTION 3D ET LA STRUCTURE DU FOSSÉ DU TANGANYIKA 5
Figure 4
Expression des blocs basculés dans la morphologie. Morphological expression of tilted blocks
2.1. L'IMAGERIE SPOT
Les satellites SPOT sont équipés de deux instruments de prises de vue. Chaque instrument couvre une bande de 60 km de large en visée verticale et les scènes sont découpées tous les 60 km. Chaque image SPOT représente donc un carré de 60 km de côté.
Chaque instrument est composé d’un certain nombre de capteurs alignés sur une barrette transverse à la trace au sol du satellite. Ces capteurs mesurent le rayonnement réfléchi par les objets à la surface de la terre. L’enregistrement des lignes les unes après les autres par la barrette au fur et à mesure du mouvement du satellite permet l’enregistrement d'une scène SPOT en données numériques. Chaque ligne comporte donc un certain nombre de points élémentaires ou pixels, chaque pixel correspondant à un capteur.
Deux modes d’observation sont utilisés : le mode panchromatique « P » et le mode multibande « XS ». Une scène SPOT est composée de 3 000 lignes de 3 000 pixels de 20 mètres en mode XS et de 6 000 lignes de 6 000 pixels de 10 mètres en mode P.
En mode P, l’observation est réalisée dans une seule bande spectrale (0.51 pm < I <0.73 |im) correspondant à la partie visible du spectre sans le violet ni le bleu. Cette prise de vue dans un seul canal donne des images en noir et blanc.
En mode XS, l’observation est réalisée dans trois bandes spectrales. Les plages sélectionnées s’étendent de 0,50 à 0,59 |j,m (vert) pour la bande 1, de 0,61 à 0,68 |um (rouge) pour la bande 2 et de 0,79 à 0,89 (rm (proche infra-rouge) pour la bande 3.
Chaque objet à la surface du sol (roche, eau, végétation, etc.) présente une réponse spectrale bien particulière, il répondra donc différemment dans chacune des trois bandes. Chaque canal étant affecté d’une couleur arbitraire (rouge, vert ou bleu), la combinaison de ces trois canaux permet la réalisation d’images en compositions colorées. L’avantage de ces images est de mieux souligner les unités lithologiques ou végétales, chaque couleur ayant une signification particulière.
2.2. LA PERCEPTION DU RELIEF
Depuis peu les techniques de la télédétection évoluent vers l’application de la 3D grâce aux modèles numériques de terrain. Les applications sont multiples et vont de la géologie à la simulation de vol militaire en passant par les études d’aménagement.
2.2.1. Le Modèle Numérique de Terrain (MNT)
Le satellite SPOT, par sa capacité de visée oblique, permet de réaliser des couples stéréoscopiques d’images. Chacun de ces couples est composé de deux prises de vue d’une même zone acquises sous deux angles différents.
Les MNT sont réalisés par la Société ISTAR (Imagerie STéréo Appliquée au Relief). La première étape d’élaboration du MNT consiste à mettre les deux images du couple en correspondance, c’est-à-dire à rechercher les points homologues entre les deux images (les couples de points représentant le même objet à la surface de la terre). La position différente des points de chaque couple d’une scène

6 P, REYNES, J. ROLET, J.-P. RICHERT, P. GRUNEISEN, J.-M, PALENGAT ET D. COQUELET BCREDP 17 (1993)
à l’autre est due à l’effet de l’altitude et de la différence d’angle de prise de vue. Les deux angles de prise de vue sont connus et une étape de modélisation mathématique du système terre-satellite donne accès à l’information altimétrique de chaque point de la zone.
Cette information est stockée sous forme numérique dans un fichier qui constitue le MNT. Le MNT utilisé dans cette étude est construit à partir d’images panchromatiques (image droite du 10/01/90; image gauche du 09/01/90), sa résolution est de 20 m au sol (taille du pixel) et sa précision de l’ordre de 10 m en altitude. La résolution d'un MNT élaboré à partir d’images XS serait de 40 m.
2.2.2. L’ortho-image
L’ortho-image (réalisée par ISTAR) est créée à partir d’une des images du couple stéréoscopique qui a été corrigée géométriquement comme si elle avait été prise verticalement et remise dans une projection cartographique donnée. (UTM ZONE 35 - ellipsoïde WGS72). Elle doit de plus être parfaitement superposable au MNT.
L’ortho-image utilisée dans cette étude (Fig. 5) est réalisée à partir de l’image droite du couple stéréoscopique, sa résolution est de 10 m.
10 Km
Figure 5
L’ortho-image (ISTAR) réalisée à partir de l’image SPOT panchromatique droite (datée du 10/01/90) du couple stéréoscopique. Ortho-image (ISTAR) produced from SPOT panchromatic stereopair (dated Jan. 10, 1990).

BCREDP 17 (1993) LA TÉLÉDÉTECTION 3D ET LA STRUCTURE DU FOSSÉ DU TANGANYIKA 7
2.2.3. Le logiciel « VUE3D «
Elaboré par la Société ISTAR, ce logiciel permet de manipuler les Modèles Numériques de Terrain et les images associées. Ses options multiples constituent une passerelle entre l’imagerie satellite et la géologie.
2.2.3.1. Aspects qualitatifs
Un premier niveau d’étude est offert à l’utilisateur avec le travail en deux dimensions. Une carte des altitudes, qui est une représentation 2D du MNT codée en niveaux de gris (Fig. 6), et l’ortho-image (Fig. 5) sont en effet disponibles à l’écran. La panoplie peut aussi être élargie avec d’au-
Figure 6
La carte des altitudes, visualisation du MNT (réalisation ISTAR), et le graphisme du logiciel VUE3D. Elevation map, DEM visualization (by ISTAR), and VUE3D software graphies.

8 P. REYNES, J. ROLET, J.-R RICHERT, P, GRUNEISEN, J.-M. PALENGAT ET D. COQUELET BCREDP 17 (1993)
très images superposables au MNT comme des cartes de pentes ou de réseau hydrographique, des cartes géologiques scannérisées, etc.
Le travail à l'écran sur ces documents et la création des plans graphiques permettent de concrétiser les interprétations (Fig. 6).
L’intérêt de ce logiciel réside cependant dans sa capacité à restituer des vues en relief. Tout d’abord, lorsque le mode 3D est sélectionné, il propose une perspective composée de facettes moulant approximativement la topographie de la zone choisie (Fig. 7). Cette représentation simplifiée peut être manipulée dans l’espace en temps réel jusqu’à présenter une vue satisfaisante pour l’utilisateur (Fig. 8 et 9). Ensuite l’ortho-image est projetée sur cette représentation du MNT pour réaliser un paysage en relief (Fig. 10). Les plans graphiques interprétatifs sont eux aussi projetables sur les vues en 3D.
Il est ainsi possible, à partir d’images satellites, de prendre connaissance des aspects morphostructuraux d’une région donnée (Fig. 11), un peu à la façon d’une mission de terrain.
2.2.3.2. Aspects quantitatifs
Un module de géologie intégré au logiciel permet, après report graphique de l’intersection d’un plan géologique (faille, surface structurale) avec la topographie, de quantifier le pendage et la direction de ce plan.
Si les limites inférieures et supérieures d’une formation géologique sont bien visibles sur l’image, l’épaisseur lithologique peut être approchée.
Il est aussi possible de calculer le tracé de l’intersection entre le relief et un plan dont les paramètres ont été calculés ou entrés manuellement. Au même titre que les plans graphiques, ce tracé est aussi bien disponible en 2D qu’en 3D. Cette fonction est intéressante car elle permet de définir le prolongement possible des limites de formations (ou de couches) dans des zones où ces limites sont masquées (végétation, dépôts quaternaires...).
2.3. LES OUTILS DE TRAVAIL - INTÉRÊTS DU RELIEF NUMÉRIQUE
Le logiciel VUE3D, le MNT et l’ortho-image de l’extrême nord du lac constituent les outils de base de cette étude. Ce logiciel permet en outre de dessiner des coupes topographiques à partir des données du MNT (Fig. 12 et 13).
Comme il a été exposé au paragraphe 1.3., la morphologie des bordures du lac Tanganyika dans la zone d’investigation est particulièrement difficile à décrypter. Les blocs basculés ne sont pas visibles de façon évidente. Il faut donc, avant de les identifier, procéder à la recherche d’indices tels que des suites de crêtes, des ruptures de
Figure 7
Représentation simplifiée du relief : la perspective à facettes (logiciel VUE3D). Representation of simplified relief: facet perspective view (VUE3D software).

BCREDP 17 (1993) LA TÉLÉDÉTECTION 3D ET LA STRUCTURE DU FOSSÉ DU TANGANYIKA 9
Figure 8
Même zone que Fig. 7 avec un angle de vue différent, (logiciel VUE3D). Same area as Fig. 7 viewed from a different angle (VUE3D software).
Figure 9Grossissement de la Fig. 8 et projection de l’interprétation sur le relief (logiciel VUE3D).
Zoom on Fig. 8 and superposition of the interpretation (VUE3D software).

10 P. REYNES, J. ROLET, J.-P. RICHERT, P GRUNEISEN, J.-M. PALENGAT ET D. COQUELET BCREDP 17 (1993)
Figure 10
Projection de l'ortho-image sur le relief définis à la figure 9 (logiciel VUE3D). Ortho-image projection onto the Fig. 9 relief map (VUE3D software).
pente ou des contacts brutaux entre des zones présentant un décalage altimétrique important. De ce fait il a rapidement été nécessaire de développer des traitements complémentaires, spécialement adaptés au cas qui nous occupe.
Les données numériques prennent ici une importance non négligeable et ouvrent un large éventail de possibilités d’analyse géologique. Elles rendent possible le calcul de
tout paramètre morphologique quantifiable et donc la création des images représentant ces paramètres. Le logiciel CP IMAGE® a permis de calculer une image ombrée du relief (extrait présenté Fig. 14) et une image des pentes (extrait présenté Fig. 15).
Chaque pixel de l’image des pentes, codé en couleur, représente la valeur absolue de la pente suivant la ligne

BCREDP 17 (1993) LA TÉLÉDÉTECTION 3D ET LA STRUCTURE DU FOSSÉ DU TANGANYIKA 11
Figure 11
Morphologie du fossé nord du lac Tanganyika, vue du coté burundais vers le SW (image réalisée avec le logiciel VUE3D). Morphology of the trough to the north of Lake Tanganyika, SW view from the Burundian side (using the VUE3D software).
de plus grande pente en chaque pixel du MNT. Le rouge représente les pentes faibles; le gris et le blanc les pentes fortes. Cette image est réalisée pour mettre en évidence des ruptures de pente et des zones de faible ou forte déclivité.
L'image ombrée est une image de simulation d’ensoleillement. Le soleil se trouve dans une position choisie (à l'est
sur la Figure 14), les zones éclairées apparaissent en blanc et les zones à l’ombre en noir en passant par tous les dégradés de gris. Cette image a pour but de renforcer les effets du relief et donc de souligner les structures tectoniques.
Ces deux images sont insérées dans VUE3D au même titre que l’image des altitudes et l’ortho-image.

12 P. REYNES, J. ROLET, J.-P. RICHERT. P. GRUNEISEN. J.-M. PALENGAT ET D. COQUELET BCREDP 17 (1993)
Figure 12
Localisation des différentes images et de la coupe C-C’ présentées dans cette étude. La flèche indique le point de vue de la figure indiquée. Location map of the images and cross-section C-C mentioned in the study. The arrow shows the point viewed on the indicated figure.
altitude (m)
Coupe topographique C-C’ transverse au fossé du Tanganyika (réalisée à partir du MNT) montrant l'asymétrie du rift. Topographie section C-C tranverse to the Tanganyika trough (derived from DEM) showing rift asymmetry
3 - UN EXEMPLE D’UTILISATION DES TECHNIQUES 3D SUR LA ZONE D’UVIRA
L’asymétrie du rift s’ouvrant en demi-graben (§ 1.2.2. et 1.3.) apparaît nettement sur la vue en relief réalisée avec le logiciel VUE3D (Fig. 11) et sur la coupe transverse au fossé (Fig. 13) obtenue à partir des données du MNT. La bordure zaïroise, affectée par l’accident majeur d’Uvira, est très abrupte. La bordure burundaise, flexurée, montre des reliefs en pente plus douce.
La région d’Uvira, bordure ouest du lac Tanganyika, a été choisie pour tester les techniques 3D de la télédétection présentées précédemment. Toutes les vues en 3D présentées ici sont affectées d’une amplification du relief égale à deux. Un plan de situation de toutes les images 2D ou 3D se trouve Figure 12. Toutes les valeurs d’altitude proviennent du MNT.
3.1. RECHERCHE DES BLOCS BASCULÉS
Cette recherche débute par une étude régionale de la zone d’investigation par les observations simultanées et corrélatives de toutes les images disponibles dans VUE3D
(image ombrée, image des pentes, des altitudes et orthoimage). C’est lors de cette phase que les indices de bloc basculé (ruptures de pente, décalages altimétriques, linéaments) sont mis en évidence. Le cheminement adopté pour le repérage des blocs est illustré par un exemple localisé sur la Figure 12 et représenté sur les Figures 14 à 17. L’ortho-image n’est pas utilisée ici car elle apporte peu d’informations.
Au nord d’Uvira, sur l’image ombrée (Fig. 14), un linéament A-A nord-sud se détache très nettement dans le relief. Il individualise un objet rectangulaire entre les hauts massifs montagneux à l’ouest et la faille d’Uvira B-B effondrant la plaine de la Ruzizi à l’est.
Sur l’image des pentes (Fig. 15) du même secteur que la Figure 14, le même objet rectangulaire apparaît bordé par des pentes importantes (gris clair) au niveau du linéament A-A et de la faille B-B. Sa surface présente une teinte rouge assez marquée montrant sa faible déclivité.
Sur l’image des altitudes (Fig. 16), cet objet se caractérise par une altitude relativement faible (gris foncé sur la Figure 16a et jaune sur la Figure 16b). Il se situe directement au contact d’un massif beaucoup plus élevé à l’ouest (gris très clair - Fig. 16a ou pourpre - Fig. 16b) au niveau du linéament A-A. Il est bordé, à l’est, par la faille d’Uvira B-B et la plaine de la Ruzizi située nettement en contrebas (noir ou gris).

BCREDP 17 (1993) LA TÉLÉDÉTECTION 3D ET LA STRUCTURE DU FOSSÉ DU TANGANYIKA 13
Figure 14
Image ombrée du relief du secteur au NW d'Uvira avec un éclairage venant de l'est (réalisée avec le logiciel CP IMAGE).
Localisation des failles A-A et B-B.Shaded relief image of NW Uvira with east lighting (produced using the CP IMAGE software). Location of faults A-A and B-B.
Cet objet rectangulaire s'insère dans une morphologie en « marches d’escalier » et semble correspondre à un bloc basculé. La manipulation suivante consiste à passer en mode 3D pour réaliser l’étude géomorphologique sur les vues en relief de la zone ainsi repérée.
La vue en 3D vers le SW de la Figure 17 montre nettement la dépression de la plaine de la Ruzizi et la première « marche » (l’objet mis en évidence précédemment) correspondant bien à un bloc basculé. Sa largeur est d’environ 5 km. La surface sommitale de ce bloc, très disséquée par l’érosion, semble globalement pentée vers l’intérieur du rift. Elle se trouve fortement décalée vers le bas par rapport aux reliefs d’arrière plan plus élevés. Ce décalage qui atteint parfois la valeur de 600 mètres, donne un ordre de grandeur du rejet vertical de la faille A-A. L’arrêt brutal de ce bloc sur la plaine de la Ruzizi souligne l’accident majeur d'Uvira B-B contrôlant le demi-graben à cet endroit.
3.2. RÉALISATION DU SCHÉMA STRUCTURAL
La méthode appliquée à l’exemple précédent et étendue à l’ensemble de la zone étudiée a permis de comprendre l’agencement des blocs basculés et de réaliser un schéma structural (Fig. 18).
Les failles normales limitent les blocs basculés observés et leur tracé est déduit de l’image ombrée et de celle des altitudes sur lesquelles la géomorphologie apparaît le mieux.
Figure 15
Image des pentes du secteur au NW d’Uvira (réalisée avec le logiciel CP IMAGE). Pentes faibles en rouge, pentes fortes
en blanc et gris.Image showing slopes in NW Uvira with low angle slopes in red and high angle slopes in white and grey (generated by the CP
IMAGE software).
Les dénivelés indiqués représentent la différence d’altitude entre une surface basculée et, soit le sommet de la pente forte qui la surmonte, soit la surface de la « marche d’escalier » supérieure lorsqu’elle existe. Si les deux « marches d’escalier » successives sont conservées et si leur érosion différentielle est nulle, ce chiffre peut représenter le rejet vertical de la faille normale qui les a décalées. L’absence de niveau repère décalé (couche sédimentaire, coulée volcanique) rend d’autant plus difficiles les essais d’évaluation de rejet.
La ligne de plus grande pente de la surface sommitale disséquée des blocs est estimée visuellement sur les vues en relief de VUE3D. Ces surfaces sont souvent réduites à une suite de crêtes et c’est alors la pente globale de cet ensemble de crêtes qui est indiquée par une flèche. Lorsque ces crêtes sont peu nombreuses et plutôt éloignées les unes des autres, c’est la pente de chaque crête qui est reportée sur le schéma (symbole « Pc » accompagnant une flèche).
Les points cotés figurant sur le schéma structural sont issus du MNT.
3.3. ANALYSE STRUCTURALE
La morphologie zaïroise est très abrupte avec des dénivelés de l’ordre de 2300 m sur la distance horizontale d’une dizaine de kilomètres qui sépare le lac (767 m d’altitude) de la bordure du plateau. Ce dernier culmine à une altitude maximum de 3 240 m.

14 P. REYNES, J. ROLET, J.-P. RICHERT, P, GRUNEISEN, J.-M. PALENGAT ET D, COQUELET BCREDP 17 (1993)
Figure 16
Image des altitudes du secteur au NW d’Uvira (réalisation ISTAR). a : représentation en noir et blanc, b : représentation en
couleur.Image showing elevations in NW Uvira (ISTAR). a : black and
white, b : colour.
La cuvette congolaise, vaste dépression drainée par le fleuve Zaire au NNW du lac Tanganyika (Fig. 1), est une zone stable d’une altitude moyenne de 600 m. Le niveau de base de la pénéplaine pré-rift étant à une altitude inférieure sous des sédiments, il est possible d’évaluer un soulèvement minimal des épaulements du fossé de l’ordre de 2500 m.
Les failles limitant les blocs cartographiés du côté zaïrois reprennent exactement les directions structurales du socle précambrien. Cette observation rejoint l’idée déjà admise du contrôle de la néotectonique par les structures fragiles anciennes. Les trois orientations de faille observées sont :
N0° +/- 10°N30°E à N40°E (direction kibarienne)N140°E (direction ruzizienne)
Ces accidents présentent des pendages vers l’est, donc vers l’intérieur du bassin. Les dénivelés reportés sur le schéma structural montrent que la valeur par défaut mesurée pour certains rejets verticaux de failles normales est de l’ordre de 600 m. Les valeurs réelles de ces rejets sont donc peut-être d’ordre kilométrique.
Les surfaces sommitales des blocs effondrés sont presque systématiquement pentées vers le lac. Si ces dernières représentent bien la pénéplaine pré-rift, celle-ci serait basculée vers l’intérieur du fossé. Cette observation semblerait donc en contradiction avec les modèles classiques de rifting.
4 — DISCUSSION
Les blocs basculés présentés sur le schéma structural, ont été individualisés par les techniques 3D à partir d’hypothèses géomorphologiques seules (absence de carte géologique et de couche repère). Il s’agissait de retrouver une morphologie en « marches d’escalier » dans le relief ou, plus exactement, ses vestiges disséqués par l'érosion, exprimés sous la forme d’une suite de crêtes.
Les blocs observés sont de grandes dimensions. Les directions des failles les contrôlant reprennent exactement les directions structurales du socle précambrien. Ce résultat cohérent crédite les hypothèses de départ pour des objets de grande dimension. En revanche, pour des objets plus petits, il est probable qu’elles soient inutilisables pour deux raisons :
Problème d'échellePlusieurs objets de lithologie différente en contact peu
vent prendre l’allure de marches d’escalier après une érosion différentielle et être interprétés comme des blocs effondrés. Cette source d’erreur est présente à toutes les échelles, mais plus fréquente et l’erreur plus difficile à éviter, pour des objets de petites dimensions, surtout en l’absence de carte géologique.
Limite de résolution du MNTLa deuxième limite d’utilisation de ces hypothèses est la
limite de résolution du MNT. Ainsi, des surfaces vues sur le terrain affectées d’un décalage vertical de 3 à 4 m sur une longueur de plusieurs centaines de mètres ne sont pas visibles sur les vues en 3D.

BCREDP 17 (1993) LA TÉLÉDÉTECTION 3D ET LA STRUCTURE DU FOSSÉ DU TANGANYIKA 15
Figure 17
Vue en 3D vers le SW du secteur au NW d'Uvira (image réalisée avec le logiciel VUE3D). 3D view of the SW area of NW Uvira (generated by the VUE3D software).
5 — CONCLUSION
Le but de cette étude était la mise en application des récentes techniques 3D de la télédétection sur la zone test du fossé Nord Tanganyika. L'objectif géologique consistait, grâce aux données SPOT, de contrôler et de compléter les observations structurales réalisées lors de la campagne Tan- ganydro et d’aboutir à un schéma structural néotectonique cohérent.
La recherche des grandes structures affectant la surface pré-rift à partir d’études classiques 2D (photos aériennes, images satellitaires) était rendue difficile par les effets de l’érosion ayant disséqué et défiguré les structures. Le travail de géomorphologie 3D réalisé ici grâce à l’utilisation du MNT associé au logiciel VUE3D a permis de mettre en évidence une série de grands blocs et de grandes lanières effondrées en «marches d'escalier». L’existence de ces blocs basculés avait déjà été soupçonnée sur le terrain,

16 P. REYNES, J. ROLET, J.-P. RICHERT, P. GRUNEISEN, J.-M, PALENGAT ET D, COQUELET BCREDP 17 (1993)
Figure 18
Schéma structural de la bordure ouest du lac Tanganyika dans la région d’Uvira. 1 : point coté en mètres (d’après le MNT); 2 : dénivelé en mètres (voir texte); 3 : sens de pendage de surface sommitale de bloc basculé (surface prérift); 4 : sens de pendage de crêtes
(voir texte); 5 : faille normale hypothétique, observée; 6 : fracture hypothétique, observée.Structural features of the western margin of Lake Tanganyika in the Uvira area. 1 : ground point in meters (from DEM); 2 : relative height in meters (see report); 3 : direction of the dip of tilted block top (pre-rift surface); 4 : direction of crestal dip (see report); 5 : hypothetical
normal fault observed; 6 : hypothetical fracture observed.

BCREDP 17 (1993) LA TÉLÉDÉTECTION 3D ET LA STRUCTURE DU FOSSÉ DU TANGANYIKA 17
mais sur des exemples de dimensions plus modestes. Grâce aux images des pentes et reconstitution des morphologies par érosion, on montre que l’essentiel de ces blocs présentent leur surface basculée vers le centre du lac, autrement dit dans le môme sens que le plongement de la faille qui le limite. Cette anomalie de basculement est probablement due à une déformation (par flexure) de la surface pré-rift durant le fonctionnement de ces grandes failles normales, dont certaines atteignent des rejets de l’ordre du kilomètre.
De plus le MNT permet la création de toute une gamme de produits nouveaux liés au relief, livrant des informations qui n’étaient, jusqu’alors, pas accessibles en télédétection classique. Ainsi, outre la réalisation des vues en 3D, il est possible de produire des cartes en courbes de niveaux, des cartes de réseau hydrographique et, plus particulièrement dans cette étude, de dessiner des coupes topographiques, de calculer tout paramètre géomorphologique quantifiable et d’en créer la carte. Il a donc été réalisé une image ombrée du relief et une image des pentes qui ont efficacement guidé la recherche et abouti à la cartographie des blocs basculés. Il est aussi possible d’effectuer d'autres mesures quantitatives telles des calculs de pendages, de directions, d’épaisseurs de couches ou, comme sur la région d’Uvira, une approche du soulèvement et des rejets de failles.
L’analyse structurale du fossé Nord Tanganyika montre, dans ce cas précis, l’efficacité des outils et méthodes 3D dans l’étude des zones affectées d’une morphologie compliquée masquant la géologie. Plus généralement, le MNT et les outils associés constituent un large complément à la télédétection classique et ouvrent un nouvel éventail de possibilités d’analyses géologiques.
6 — RÉFÉRENCES
Bouroullec, J.L., Rehault, J.-P., Rolet, J. & Tiercelin, J.-J. (1991). — Quaternary sedimentary phenomena and dynamics in the northern part of the Lake Tanganyika trough, East African Rift system. — Bull. Centres Rech. Explor.-Prod. Elf Aquitaine, 15, 2, 343-368.
Chorowicz, J., Le Fournier, J., Le Mut, C., Richert, J.R, Spy- Anderson, F. & Tiercelin, J.J. (1983). — Observation par télédétection et au sol de mouvements décrochants NW- SE dextres dans le secteur transformant Tanganyika-Ruk- wa-Malawi du rift Est-Africain. — C.R. Acad. Sc. (Paris),2., 296, 997-1002.
Chorowicz, J., Le Fournier, J. & Vidal, G. (1987). — Paleos- tress orientation and model of the rift development in Eastern Africa. — Geol. J. Thematic issue, 22, 495-513.
Chorowicz, J., Lavreau, J., Tamain, G., Theunissen, K., Bardinet, C., Girault, F., Klerkx, J., Lepage, A., Nanyaro, J., Nimpa- garitse, G., Nkanira, T., Ntungigimpaye, A., Roggeri, I., Ru- dant, J.P, Ruder, J., Tack, L., Temu, E., Thouin, C., Trefois, P. & Yanda, P. (1990). — The evaluation of satellite imagery and field spectro-radiometer data for the study of the lithology and the ancient and reactivation tectonic in the vicinity of the East African Rift. — ISPRS J. Photogrammetry and Remote Sensing, 45, 355-381.
Daly, M.C. (1988). — Crustal shear zones in central Africa : a kinematic approach to Proterozoic tectonics. — Episodes, 11, 1, 5-11.
Ebinger, C.J. (1989). — Geometric and cinematic development of border faults and accomodation zones, Kivu-Ru- sizi Rift, Africa. — Tectonics, 8, 1, 117-1.
Klerkx, J. (1988). — The influence of Lower Proterozoic structures on the evolution of the Kibaran belt. — I.G.C.P. n° 255, Newsletter Bull., 1, 27-31.
Klerkx, J. & Nanyaro, J.T. (1988). — The Ukinga group in South-western Tanzania : a shear belt of Middle Proterozoic age?. — I.G.C.P. n° 255, Newsletter Bull., 1, 37-41.
Kroner, A. (1975). — Late Precambrian formations in the western Richtersveld, northern Cape Province. — Trans, roy. Soc. S. Afr, 41, 375-433.
McConnell, R.B. (1950). — Outline of the Geology of Ufipa and Ubende. — Bull. Geol. Surv. Tanganyika, 19, 1-62.
McConnell, R.B. (1967). — The East African Rift System.— Nature, 215, 578-581.
McConnell, R.B. (1972). — Geological development of the rift system of Eastern Africa. — Bull. geol. Soc. Amer., 83, 2549-2572.
McConnell, R.B. (1980). — A resurgent taphrogenic lineament of Precambrian origin in Eastern Africa. — J. geol. Soc. London., 137, 483-489.
Mondeguer, A. (1991). — Bassins sédimentaires en contexte extensif décrochant : l’exemple du « complexe des fossés Sud-Tanganika », Rift Est-Africain. Morphostructures et sedimentation. — Thèse Doct. Sci. Univ. Brest, 273 pp.
Morley, C.K. (1988). — Variable extension in Lake Tanganyika. — Tectonics, 7, 4, 785-801.
Rolet, J., Mondeguer, A., Bouroullec, J.-L., Bandora, T, Coussement, C., Rehault, J.-P. & Tiercelin J.-J. (1991). — Structure and different kinematic development faults along the Lake Tanganyika rift valley (East African Rift System). — Bull. Centres Rech. Explor. Prod. Elf Aquitaine, 15, 2, 327-342.
Rosendahl, B.R., Reynolds, D., Lorber, P, Burgess, C., McGill, J., Scott, D., Lambiase, J. & Derksen, S. (1986).— Structural expressions of rifting : lessons from Lake Tanganyika, Africa. — In : Frostik, L.E., Reid, I., Renaut R.W. & Tiercelin, J.J. (eds.) : Sedimentation in the African Rifts. — Spec. Publi. Geol. Soc. London, 25, 29-43.
Tanganydro group (1992). — Sublacustrine Hydrothermal Seeps in Northern Lake Tanganyika, East African Rift : 1991 Tanganydro expedition, (Hydrothermalisme sous- lacustre dans le nord du lac Tanganyika, Rift est-africain).— Bull. Centres Rech. Explor. Prod. Elf Aquitaine, 16, 1, 55-81.
Tiercelin, J.J,, Vincens, A., (Coordonnateurs), Barton, C.E., Carbonnel, P., Casanova, J., Deübrias, G., Gassé, F., Gros- didier, E., Herbin, J.P, Hue, A.Y., Jardiné, S., Le Fournier, J., Mélières, F., Owen, R.B., Page, P, Palacios, C., Paquet, H., Péniguel, G., Peypouquet, J.P, Raynaud, J.F., Renaut, R.W., De Reneville, P, Richert, J.P, Riff, R., Robert, P, Seyve, C., Vandenbroucke, M., & Vidal, G., (1987). — Le demi-graben de Baringo-Bogoria, Rift Gregory, Kenya. 30 000 ans d’histoire hydrologique et sédimentaire. (The Baringo-Bogoria half-graben, Gregory Rift, Kenya. 30.000 years of hydrological and sedimentary history). — Bull. Centres Rech. Explor. Prod. Elf Aquitaine, 11,2, 249-540.
Tiercelin, J.J. & Mondeguer, A. (1991). — The geology of the Tanganyika trough. — In : Coulter, G.IV. (ed.) : Lake Tanganyika and its Life. — British Museum (Natural History). — Publications and Oxford University Press, 7-48.

ANALYSE STRUCTURALE DE LA PARTIE MÉRIDIONALE DU BASSIN DE SORIA (ESPAGNE)
STRUCTURAL ANALYSIS OF THE SOUTHERNMOST PART OF THE SORIA BASIN (SPAIN)
Véronique MIEGEBIELLE, Yves HERVOUET et Jean-Paul XAVIER
MIEGEBIELLE, V., HERVOUET, Y. & XAVIER, J.-P. (1993), - Analyse structurale de la partie méridionale du bassin de Soria (Espagne). [Structural analysis of the southern most part of the Soria basin (Spain)]. - Bull. Centres Rech. Explor.-Prod. Elf Aquitaine, 17, 1, 19-37, 16 fig. ; Boussens, June 24, 1993. - ISSN : 0396-2687. CODEN : BCREDP.This study of the southern part of the Soria basin (from bibliographic references,
field work, remote sensing and aerial photography), documents the effects of Oli- go-Miocene compressive tectonics. The area displays different detachment levels in the Mesozoic cover that created different structural geometries. The mild deformation generated anticlinal structures (fault propagation folds) with axial directions, either parallel to faults and structural trends (La Cuenca, Calatanazor, western part of Nodalo referred to here as type 1), or oblique to these trends (eastern part of Nodalo, Las Fraguas, Las Cuevas de Soria referred to here as type 2). These structures developed foreland synclines (on the front) and «piggy back» synclines (on the back), which were filled by Oligo-Miocene detritic sediments. In the first type of anticline the ramp directions are N90-N100. In the second type ramps of the same orientation have a reverse-sinistral sense of motion. In one area (San Marcos) where the shortening amount is locally relatively large, an imbricate system with a duplex geometry was observed. This change in structural style is related to the location of the Odemira-Avila-Soria fault trend, which inhibited the southward propagation of thrusts in the cover during the Cenozoic and permits two different structural styles to be identified as follows :
— in the southwest, the décollement style consists of fault propagation folds; shortening occurs over a relatively wide area, before thrusting is stopped at the basement uplift along the Odemira-Avila-Soria trend;
— in the southeast, a similar amount of shortening (5,3 km) occurs in a shorter distance before encountering the Odemira-Avila-Soria trend (compared with the southwest), the deformation style here being dominated by imbricates and duplexes.Véronique Miegebielle, Yves Hervouet, Université de Pau, Département des Sciences
de la Terre, Avenue de l’Université, F-64000 Pau ; Jean-Paul Xavier, Elf Aquitaine Production, Département interprétation structurale, CST JF, F-64018 Pau Cedex - February 3, 1993.
Key words : Folds (fault propagation folds), Anticlines, Décollement, Compression tectonics, Imbricate tectonics, Duplex, Soria province (Soria basin, Spain).
0396-2687/93/0017-0019 $ 3.80 © 1993 elf aquitaine production, F-31360 Boussens

20 V. Ml EG EBI ELLE, Y. HERVOUET ET J.-P. XAVIER BCREDP 17 (1993)
RÉSUMÉ
L'étude de l’extrémité méridionale du bassin de Soria (à partir des données bibliographiques, des travaux de terrain, des documents satellitaires et des photographies aériennes) permet de mettre en évidence les effets de la tectonique compressive oligomiocène. Le secteur est caractérisé par des décollements différenciés de couverture, à l’origine de styles tectoniques différents. Ainsi, une déformation faible génère des structures anticlinales (plis d’amortissement) dont les directions axiales sont soit parallèles (La Cuenca, Calatahazor, Nodalo occidental), soit obliques par rapport à celle des accidents (Nodalo oriental, Las Fraguas, Las Cuevas de Soria). Elles donnent naissance à des gouttières d’avant-fosse (à l'avant, côté externe) et des gouttières « piggy back » (à l’arrière), remplies de sédiments détritiques oligo-miocènes. Dans le premier cas, la direction des rampes est N90-N100. Dans le deuxième cas, les rampes (N60-N70) ont un jeu inverse senestre. Lorsque le taux de raccourcissement augmente, on observe un empilement d’écailles assimilables à des duplex (structure de San Marcos). Cette tectonique différentielle est due à la présence de l'accident d’Odemira-Avila-Soria (vestige de l’ancien bord sud-est du bassin crétacé de Soria) qui bloque au Cénozoïque les glissements de la couverture vers le sud :
— au sud-ouest, les décollements matérialisés par des plis d'amortissement vont parcourir de plus grandes distances avant de rencontrer l’accident ancré dans le socle;
— au sud-est, l’espace plus réduit induit une tectonique de type duplex pour une valeur de déplacement (5,3 km) vraisemblablement identique au secteur occidental.Mots-clefs : Pli (Pli amortissement), Anticlinal, Décollement,
Compression tectonique, Tectonique imbriquée (Duplex), Province Soria (Bassin de Soria, Espagne)
TABLE DES MATIÈRES — CONTENTS
1. - INTRODUCTION. SITUATION GÉOGRAPHIQUE -INTRODUCTION. GEOGRAPHIC SETTING................... 20
2. - CADRE GÉNÉRAL - GENERAL CONTEXT................... 242.1. Lithostratigraphie - Lithostratigraphy.................... 24
2.1.1. Jurassique - Jurassic................................. 242.1.2. Wealdien (Kimméridgien-Valanginien infé
rieur) - Wealdian (Kimmeridgian-Lower Va- langinian)..................................................... 24
2.1.3. Crétacé (Albien-Maastrichtien) - Cretaceous(Albian- Maastrichtian)................................ 24
2.1.4. Oligo-Miocène - Oligo-Miocene.................. 252.1.5. Quaternaire - Quaternary............................ 25
2.2. Structure régionale - Regional structure............... 252.2.1. Le secteur septentrional - Northernmost
sector........................................................... 252.2.2. Le secteur médian - Median sector.......... 25
2.2.2.1. L’anticlinal de Cuenca - Cuencaanticline.......................................... 25
2.2.2.2. L’anticlinal de Calatahazor - Calatahazor anticline............................. 26
2.2.2.3. La structure de Nodalo - Nodalostructure......................................... 262.2.2.3.1. L’accident septentrional
Northernmost fault zone............................... 26
2.2.2.3.2. L’accident méridional -Southernmost fault zone 26
2.2.2.4. L’anticlinal de Las Fraguas - LasFraguas anticline............................ 26
2.2.2.5. La structure de Las Cuevas de Soria - Las Cuevas de Soria structure 26
2.2.3. Le secteur oriental : la Sierra de San Marcos- Eastern sector : San Marcos Sierra......... 27
2.2.4. Le secteur nord-oriental (alentours de Soria)- Northeastern sector (around Soria)......... 27
3. - INTERPRÉTATIONS GÉOMÉTRIQUES ET MODÉLISATIONS - GEOMETRIC INTERPRETATIONS AND MODELISATIONS....................................................................... 283.1. Cadre tectono-sédimentaire - Tectono-sedimentary
setting..................................................................... 283.2. Les plis d’amortissement - Fault propagation folds 293.3. Résultats - Results................................................. 31
3.3.1. Anticlinal de La Cuenca - La Cuenca anticline.............................................................. 31
3.3.2. Calatahazor et Nodalo - Calatahazor andNodalo.......................................................... 33
3.3.3. Anticlinal de Las Fraguas - Las Fraguasanticline........................................................ 35
3.3.4. Las Cuevas de Soria - Las Cuevas de Soria 353.3.5. Sierra de San Marcos - San Marcos Sierra 35
4. - INTERPRÉTATION GÉNÉRALE. CONCLUSION - GENERAL INTERPRETATION. CONCLUSION.......................... 354.1. Chronologie des événements - Chronology of tec
tonic events............................................................ 354.2. Interprétation - Interpretation................................. 36
5. - RÉFÉRENCES - REFERENCES...................................... 37
1 — INTRODUCTION. SITUATION GÉOGRAPHIQUE
Situé à l’ouest de Soria, ce secteur représente « l’ancienne » extrémité méridionale du bassin crétacé inférieur de Soria (Bassin de Los Cameras) (Fig. 1). La topographie dont le niveau de base est relativement élevé (environ 1 000 m), est caractérisée par la présence de buttes culminant entre 1 100 et 1 300 m. Chaque butte correspond à une structure tectonique particulière (pli, pli-faille, faille), constituée par des formations sédimentaires dont l’âge varie du Jurassique au Néogène. La plupart des structures pli- catives ont une orientation WNW-ESE à ENE- WSW.
L’étude est facilitée par l’analyse et l’interprétation d’images satellites et de photographies aériennes qui permettent de cibler sur le terrain la reconnaissance des objets géologiques. Cette nouvelle approche, complétée par des missions de terrain a permis d’étudier plus particulièrement certaines structures : ces affleurements présentent des conditions d’accès favorables et ne sont pas toujours dissimulés sous une végétation arbustive dense.
Ainsi, un travail de cartographie a été effectué en s’appuyant d’une part sur les résultats de terrain et les données bibliographiques (Beltran Cabreja et ai, 1978) et d'autre part sur l’analyse de télédétection. A partir de la composition colorée des canaux 3, 4, 7 de l’image Landsat TM 200- 31 du 29-01-1989 (Fig. 2a), l’extrémité sud du bassin de Soria a fait l’objet d'une interprétation qui a permis d’établir une carte géologique (Fig. 2b).

elorado
E. de VÉIbqrnedo
;caray%rlanzôn
Torrecilla ^/\\\ en Cameros g' e Arlâ nzôn
£. de Gonzàlez Lacasa
Cerver-a dsl Rl>de Rëtuei
-----------;*
secteur de Soriai
Soria ^
S,'de Cabrejasrefîara,
Figure 1
Cadre géographique et géologique du secteur d’étude : extrait de la carte géologique d’Espagne au 1 : 1 000 000, IRGME, Madrid, 1980.Légende: q : Quaternaire; m4-q : Plio-quaternaire; m4 : Pliocène; m3-4 : Mio-Pliocène; m3 ; Miocène; m2 : Oligocène; m1 : Eocène-Paléocène; c2 : Crétacé supérieur; c1 et c :Crétacé inférieur; j3 : Malm; j2-3 ; Dogger-Malm; j2-j et j ; Dogger; j1 : Lias; t3 : Keuper; t2-3 : Muschelkalk-Keuper; t : Muschelkalk; t1 : Bundsandstein; h3 : Westphalien; cb :
Cambrien.Geographical and geological overview of study area : from the geological map of Spain, scale : 1 : 1 000 000, IRGME, Madrid, 1980.
Legend: q : Quaternary; m4-q : Quaternary-Pliocene: m4 : Pliocene: m3-4 : Pliocene-Miocene: m3 : Miocene: m2: Oligocène: ml : Paleocene-Eocene: c2 : Upper Cretaceous:d and c : Lower Cretaceous: : Malm: j2-3 : Dogger-Malm: j2-j and j : Dogger: j1 : Lias: t3 : Keuper: t2-3 : Muschelkalk-Keuper: t: Muschelkalk: t1 : Bundsandstein:
h3 : Westphalian: cb : Cambrian.
BCR
EDP 17 (1993)
ANALYSE STR
UC
TUR
ALE DU BASSIN D
E SOR
IA - ESPAGN
E

an \\\\i\m>n
22 V. MIEGEBIELLE, Y. HERVOUET ET J.-P. XAVIER BCREDP 17 (1993)
E3c«cOc-O
CO
Quaternaire : formations alluviales.Oligo-Miocène : le Miocène est constitué de marnes
rouges et de calcaire sableux à lentilles congloméra- tiques, l’Oligocène renferme des conglomérats et des marnes rouges.
Maastrichtien : faciès marneux dolomitique, calcaréo- gréseux.
Campanien : calcaires à rudistes et dolomies calcaires massives.
Santonien : calcaires à rudistes et arénites calcaires.
Coniacien : calcaires bien stratifiés, parfois argileux ou noduleux, présentant des surfaces durcies.
Turonien supérieur : calcaires bien stratifiés, parfois argileux ou noduleux, présentant des surfaces durcies.
Turonien inférieur: alternance d'argiles et de marnes.Cénomanien supérieur : calcaires bien stratifiés, à sur
faces durcies.Cénomanien moyen : argiles sableuses et calcaires gré
seux à huîtres.Albien-Cénomanien inférieur : formation sableuse à
passées conglomératiques d’éléments quartzitiques présentant des stratifications entrecroisées.
Urbion (Valanginien inférieur) : ensemble fluvio-lacustre (grès, silts) à gros bancs conglomératiques.
T~T
Oncala (Berriasien) : alternance de sables, de conglomérats et d’argiles.
Tera (Kimméridgien) : brèche à éléments de calcaires, liés par une matrice calcaréo-sableuse. Calcaires à oncolithes en bancs de 30 cm.
- Bajocien-Bathonien : 10 m de calcaires argileux et de calcaires avec veines de recristallisations et silex, sur-
® monté par 10 m de calcaires beiges à microfilaments _çr en bancs de 20 à 40 cm. Calcaires pseudooolithiques«j de teinte blanchâtre.2 Toarcien : marnes et calcaires de ton gris à beige clair.
L Lias : alternance de calcaires et de calcaires argileux gris à beige.
Quaternary : alluvial formations.Oligo-Miocene : Miocene : red shales, sandy limestones
with conglomeratic lenses, Oligocène : conglomerates and red shales.
Maastrichtian : dolomitic shale facies, sandy limestones.
Campanian : limestones with rudistid and dolomitic limestones.
Santonian : limestones with rudistid and limestone arenites.
Coniacian : stratified limestones, sometimes argillaceous or knobbly with hard grounds.
Upper Turonian : stratified limestones, sometimes argillaceous or knobbly with hard grounds.
Lower Turonian : alternated shales and siltstones.Upper Cenomanian : stratified limestones, hard grounds.
Middle Cenomanian : sandy shales and sandy limestones with oysters.
Albian-Lower Cenomanian : sandy formation with conglomeratic beds cross-bedded with quartzitic materials.
Urbion (Lower Valanginian) : fluvio lacustrine formation (sandstones, siltstones) with thick conglomeratic beds.
Oncala (Berriasian) : alternated sands, conglomerates and shales.
Tera (Kimmeridgian) : calcareous breccia in a sandy limestone matrix. 30 cm oncolith limestone beds.
Bajocian-Bathonian :10 m argillaceous limestones and cherty limestones with calcite veins, topped by 10 m light brown limestones with 20 to 40 cm microfilaments. Pseudooolithic white limestones.
Toarcian : grey to light brown shales and limestones.Lias : alternated grey to light brown limestones and
clayey limestones.
Trias. Trias.
Socle. Socle.
Faille reconnue
Faille supposée
Fracturation
Faille normale
Faille avec sens de mouvement
Accident chevauchant
Limite de formations
Axe synclinal
Axe anticlinal
Pendage
Trace des coupes géologiques
Réseau hydrographique
Fault
Hypothetical fault
Fracturing
Normal fault
Strike-slip fault
Thrusting fault
Limit of formations
Synclinal axis
Anticlinal axis
Dip
Location of cross-section
Hydrographic network
Légende commune aux illustrations. General legend for illustrations.

BCREDP 17 (1993) ANALYSE STRUCTURALE DU BASSIN DE SORIA • ESPAGNE 23
bFigure 2
Le secteur méridional de Soria.a: composition colorée des canaux 3, 4 et 7 (image Landsat TM 200-31 du 29-01-1989) affectés respectivement en rouge, vert et bleu
(Echelle de restitution graphique), b : carte géologique (données de terrain, de télédétection, de photographies aérienneset bibliographiques).
The southernmost part of the Soria basin, a : coloured composite (Landsat TM image 200-31 of 29-01-1989) of channels 3 in red, 4 in green, 7 in blue (Graphic scale restitution), b : geological map (derived from field mapping, remote sensing, aerial photographs
and reference data).

24 V. MIEGEBIELLE, Y. HERVOUET ET J.-P. XAVIER BCREDP 17 (1993)
2. — CADRE GÉNÉRAL
2.1 LITHOSTRATIGRAPHIE
Le Crétacé supérieur affleure largement dans la région (Floquet, 1978, 1979, 1980, 1982). Quelques pointements de Jurassique sont cependant observables (Fig. 3).
2.1.1. Jurassique
Le Lias est constitué par une alternance de calcaires et de calcaires argileux gris à beige surmonté au Toarcien par des marnes et des calcaires gris à beige clair.
Le Bajocien-Bathonien comprend 10 m de calcaires argileux et de calcaires à silex à veines de calcites, surmontés par 10 m de calcaires beiges à micro-filaments en bancs de 20 à 40 cm. Le reste de la formation est représenté par des calcaires pseudô-oolithiques de teinte blanchâtre.
2.1.2. Wealdien (Kimméridgien-Valanginien inférieur)
Trois groupes sédimentaires sont Identifiables :— Tera (Kimméridgien) se présente sous forme de
brèches à éléments calcaires, liés par une matrice calca- réo-sableuse. On rencontre également des calcaires à oncolithes en bancs de 30 cm ;
— Oncala (Berrlaslen) est constitué par une alternance de sables, de conglomérats et d'argiles;
— Urbion (Valanginien inférieur) correspond à un ensemble fluvio-lacustre (grès, silts) à gros bancs conglomérati- ques.
2.1.3. Crétacé (Albien-Maastrichtien)
L’Albien-Cénomanien inférieur est constitué par une formation continentale sableuse à passées conglomératiques à éléments quartzitiques, présentant des stratifications entrecroisées.
Le Cénomanien moyen se présente sous forme d'argiles sableuses et de calcaires gréseux à huîtres.
Les calcaires bien stratifiés du Cénomanien supérieur présentent de nombreuses surfaces durcies.
Le Turonien inférieur (alternances d’argiles et de marnes) est surmonté par des calcaires bien stratifiés, parfois argileux ou noduleux, à surfaces durcies (Turonien supérieur et Coniacien).
Le Santonien est constitué de calcaires à rudistes et d'arénites calcaires.
Le Campanien comprend des calcaires à rudistes et des dolomies calcaires massives.
Le Maastrichtien a un faciès marneux dolomitique, cal- caréo-gréseux.
Les couches de passage au Paléocène (Garumnien-Da- nien) montrent la continentalisation des dépôts, phénomène lié au début de l’orogenèse pyrénéenne. On observe des calcaires lacustres, des argiles sableuses rouges ou des conglomérats parfois discordants et difficiles à distinguer des dépôts cénozoïques.
Colonne lithostratigraphique. Stratigraphie column.
200 m
0

BCREDP 17 (1993) ANALYSE STRUCTURALE DU BASSIN DE SORIA - ESPAGNE 25
2.1.4. Oligo-Miocène
Formé de dépôts détritiques continentaux (contemporains et/ou postérieurs à la tectonique compressive pyrénéenne), il repose en discordance sur le Mésozoïque. Les datations sont rares et imprécises voire contradictoires (Beltran Cabreja et ai, 1978; carte géologique d’Espagne au 1 : 1 000 000, IRGME, Madrid, 1980) :
— l’Oligocène vraisemblable renferme des conglomérats et des marnes rouges;
— le Miocène se présente sous forme de marnes rouges et de calcaires sableux à lentilles conglomératiques.
2.1.5. Quaternaire
Le Quaternaire correspond à des formations alluviales, des colluvions et des éboulis.
2.2. STRUCTURE RÉGIONALE
La région étudiée peut être divisée en quatre secteurs (Fig. 2b) présentant des styles tectoniques différents :
— un secteur septentrional (Sierra de Cabrejas) ;— un secteur médian, occidental et méridional situé au
sud-ouest d’un accident N150, la faille d'Ocenilla;— un secteur oriental (Sierra de San Marcos) ;— un secteur nord oriental (alentours immédiats de la
ville de Soria). La partie sud-est de la région est caractérisée par une famille d’accidents N 60 limitant le bassin et accompagnée de plis d’orientation sensiblement E-W. La partie sud-ouest est caractérisée par des accidents N 110 et des plis de même direction.
2.2.1. Le secteur septentrional
La Sierra de Cabrejas montre une allure générale syn- clinale. Les séries du Crétacé supérieur qui la compose présentent des ondulations caractérisant une succession d’anticlinaux et de synclinaux de faible amplitude. La ter
minaison orientale de la structure (Picofrentes) est perturbée par la présence d’une succession de petits accidents parallèles à la faille d’Ocenilla d’orientation NNW-SSE. Cette faille décrochante à jeu apparent dextre décale les axes des plis et affecte les terrains du Crétacé inférieur et supérieur (Fig. 2b). Urbion n’existe pas au nord-est de cette faille qui semble donc avoir une certaine importance paléogéographique. De plus, vers le sud-est, elle sépare le secteur médian et le secteur nord-oriental.
2.2.2. Le secteur médian
Au SW de Soria, cinq structures anticlinales ont été individualisées. Du NW au SE on rencontre : La Cuenca, Nodalo, Calatanazor, Las Fraguas, Las Cuevas de Soria (Fig. 2b).
2.2.2.1. L'anticlinal de Cuenca
L’anticlinal de La Cuenca est situé au sud de la cuvette synclinale de la Sierra de Cabrejas. La structure érodée se distingue bien dans le paysage, avec des couches céno- mano-turoniennes concentriques, de formes ovales. Le cœur de l’anticlinal forme une dépression constituée d’Albien sableux (Fig. 2b et 4).
Cette structure N100 est dissymétrique avec un flanc nord à pendage faible (32°), et un flanc sud plus redressé (50°) voire renversé (70°) dans le Rio Avion (partie la plus basse topographiquement observée), parallèlement à un accident mettant en contact le Sénonien subvertical et l’OIi- go-Miocène plongeant faiblement vers le sud (20°). Les observations de terrain et les données de télédétection révèlent l’existence d’un accident plus méridional, sub-parallèle au premier (N90-N100), au sud du cœur de l’anticlinal, près du village de Cuenca. Ces accidents, non matérialisés sur les données existantes pouvaient être pressentis. La coupe N-S de la carte géologique au 1 : 50 000 (Beltran Cabreja et al., 1978) montre une variation d’épaisseur au sein des formations albiennes, depuis la bordure nord de la Sierra de Cabrejas jusqu’au sud de la coupe. La réduction des séries se réalise brutalement sur le flanc sud de l’anticlinal de La Cuenca (forage de La Cuenca I) (Beltran Cabreja et al., 1978). Cette réduction matérialiserait la limite du bassin
Figure 4
Coupe géologique de La Cuenca. Geological cross-section of the La Cuenca area.

26 V. MIEGEBIELLE, Y. HERVOUET ET J.-P. XAVIER BCREDP 17 (1993)
de Soria à l'Albien, limite qui correspondrait à des accidents rejouant à différentes époques, et en particulier au cours de la compression cénozoïque. Vers l’est, l’Oligo-Miocène, affecté par l’accident du Rio Avion, vient recouvrir celui-ci ainsi que l’anticlinal érodé de Villabuena (Fig. 2b).
2.2.2.2. L’anticlinal de Calatanazor
Directement au nord du village de Calatanazor, dans le lit du Rio Avion (Fig. 2b), les formations du Crétacé supérieur sont plissées et chevauchent les formations tertiaires (Fig. 5) selon un plan N100, 80°N, témoignant d’un dernier jeu en faille dextre. Par endroit l'OIigo-Miocène est affecté par la faille alors que dans d’autres secteurs il la fossilise.
2.2.2.3. La structure de Nodalo
La partie occidentale de la structure de Nodalo fait suite vers l’est à la structure de Calatanazor (Fig. 2b).
Les parties centrales et orientales sont les plus complexes. Un ensemble de plis est encadré par deux accidents (Fig. 6a).
2.2.2.3.1. L'accident septentrional
Au sud de la route nationale 122, un accident vertical N75 sépare le Crétacé du Tertiaire. Au contact de la faille, le pendage dans les formations tertiaires est subvertical. En s’éloignant de l’accident, de nombreux galets striés au sein de la formation détritique traduisent un jeu normal avec un effondrement du compartiment nord, c’est à dire côté bassin oligo-miocène (Fig. 6a et b).
2.2.2.3.2. L’accident méridional
Au nord du village de Nodalo, les séries cénozoïques présentent un fort pendage (N95-N100, 70°S). Le contact Crétacé supérieur-Tertiaire est matérialisé par une faille de direction sensiblement E-W qui présente des miroirs subverticaux ondulant tantôt au nord, tantôt au sud. Les stries visibles sur les miroirs indiquent un jeu essentiellement dextre (Fig. 6c).
Directement au nord du contact se développe, dans les terrains crétacés, une succession de plis formée par deux anticlinaux et un synclinal déversés vers le sud (Fig. 6a).
2.2.2.4. L’anticlinal de Las Fraguas
La structure de Las Fraguas est constituée par un anticlinal à cœur jurassique, délimité au sud par un accident majeur NE-SW (Fig. 7a). Le long de l’accident qui met en contact les formations jurassiques avec les formations crétacées, de nombreux miroirs de failles NE-SW présentent de forts pendages ondulant soit vers le nord, soit vers le sud. Les stries traduisent plusieurs jeux (Fig. 7b).
Aux abords de l’accident, des plis à axes verticaux témoignent de l’existence d’une bande cisaillante, qui fonctionne selon le cas en mouvement dextre ou senestre.
Le panorama (Fig. 7c), au SE de l’accident, met en évidence une succession d’anticlinaux et de synclinaux chevauchants vers le sud, par l’intermédiaire d'accidents N90-N100. Ces événements sont localisés au nord de l’accident cisaillant N60-80. Ils reflètent la tendance chevauchante de l’accident principal.
Au village de Villabuena, dans le prolongement de l’accident principal, les miroirs de failles subverticaux montrent un jeu senestre. Certaines stries en coup de balai traduisent un jeu inverse senestre (compartiment nord remonté). Les plis à axes verticaux confirment la tendance cisaillante.
Le jeu décrochant senestre correspond à la phase compressive principale : il est compatible avec la direction de raccourcissement subméridienne donnant naissance aux plis.
Les formations albiennes reposent en concordance sur les formations jurassiques (Dogger). L’absence de Wealdien montre que cette zone est restée en position haute du Dogger à l’Albien, et marque à cette époque la bordure sud du bassin qui coïncide actuellement avec l’accident majeur de Las Fraguas.
2.2.2.5. La structure de Las Cuevas de Soria
La structure de Las Cuevas de Soria est installée sur l’accident majeur N 60-70 de Soria (Fig. 2b). Cette structure peut être considérée comme la structure frontale du bassin, synchrone des dépôts oligo-miocènes. En effet, le jeu décro- chant-chevauchant du système individualise un motif tecto- no-sédimentaire marqué par :
N S
0 500 m1 ___________ I
Figure 5
Coupe géologique de Calatanazor. Geological cross-section of the Calatanazor area.

BCREDP 17 (1993) ANALYSE STRUCTURALE DU BASSIN DE SORIA - ESPAGNE 27
Figure 6
Structure de Nodalo
a : coupe géologique, b : analyse des stries de l'accident septentrional, c : analyse des stries de l’accident méridional.
Nodalo structure, a : geological cross-section, b : slickenside analysis of the northernmost part of Nodalo, c : slickenside analysis
of the southernmost part of Nodalo.
— un anticlinal redoublé en cours de soulèvement et d’érosion, l’anticlinal de Sima (Fig. 8);
— un bassin très développé dans laquelle les formations continentales dépasseraient 500 m.
Directement au sud-ouest du village de Las Cuevas, un dispositif en discordance progressive des sédiments détritiques tertiaires a pu être mis en évidence sur le bord septentrional (actif) du bassin, le long de l’accident de Soria.
2.2.3. Le secteur oriental : la Sierra de San Marcos
La structure tectonique de la Sierra de San Marcos est la plus compliquée du secteur étudié (Fig. 2b). Elle est limitée au SW par la faille N140 d’Ocenilla, subverticale, à jeu apparent dextre (Fig. 9a). Cette faille évolue vers le sud- est en accident chevauchant N60. La partie N140 correspond à une rampe latérale d’un système structuré en écailles dont la rampe frontale est parallèle à l’accident de Soria et vient chevaucher le bassin oligo-miocène. Vers le NE cette rampe frontale reprend une direction N140 à pen- dage relativement faible (50° au SW), à jeu senestre. Il s’agit là d’une autre rampe latérale qui sépare en deux unités emboîtées (occidentale et orientale) la Sierra de San Marcos (Fig. 9 b et c). Chaque unité est composée par un empilement d’écailles. Deux rampes hectométriques sont clairement visibles à proximité du bassin oligo-miocène dans l’unité orientale de San Marcos.
2.2.4. Le secteur nord-oriental (alentours de Soria)
Le style tectonique est nettement différent de ceux des secteurs précédents. Il correspond à un couloir de cisaillement senestre N60, dans lequel les formations méso- cénozoïques sont prises en navettes et parfois redressées à la verticale.

28 V. MIEGEBIELLE, Y. HERVOUET ET J.-P. XAVIER BCREDP 17 (1993)
Figure 7
Structure de Las Fraguas
3. — INTERPRÉTATIONS GÉOMÉTRIQUES ET MODÉLISATION
Le bassin wealdien de Soria s’est ouvert à la fin du Jurassique sur un relais de décrochements N60 senestres (Guiraud, 1983; Guiraud & Seguret, 1985; Miegebielle et al., 1991) associés à des failles normales N120. Il en aurait résulté un amincissement crustal important, responsable d’une forte subsidence et de dépôts continentaux compréhensifs (environ 6 000 m). Le fonctionnement de ce bassin s’est arrêté consécutivement à l’ouverture du golfe de Gascogne et de l’Atlantique central face à l’Ibérie (Malod, 1989 a; 1989b; Malod & Mauffret, 1990; Olivet et al., 1982). La compression pyrénéenne au cours du Cénozoïque aboutit à la mise en altitude de ce bassin (Picos de Urbion, 2 223 m, Sierra de los Cameras) par épaississement de la croûte continentale. Le raccourcissement entraîne une expulsion du matériel sédimentaire mésozoïque par décollement vers le nord (Guimera & Alvaro, 1990) et vers le sud (cette étude) suivant un modèle général proche de celui proposé au sud-est des Ibérides par Viallard (1989).
Les décollements de couverture génèrent différents types de structures suivant l’intensité de la déformation et du raccourcissement : plis d’amortissement lorsque la déformation est faible (secteur médian et occidental), et lorsque le taux de raccourcissement devient plus important : empilement d’écailles (San Marcos) ou vastes plans de chevauchements (partie nord du bassin; Guimera & Alvaro, 1990).
Le secteur médian et occidental présente un certain nombre de structures anticlinales se développant parallèlement à des accidents et des bassins à remplissage continental synchrone et/ou postérieur à leur formation. Le modèle développé par Specht et al. (1991) sur le flanc sud des Pyrénées et modélisé récemment (Hervouet & Al Saffar, 19,92) nous semble pouvoir être appliqué partiellement pour ce secteur. Toutefois, il ne faut pas oublier que certains accidents associés aux structures plicatives ont un jeu majeur coulissant.
3.1. CADRE TECTONO-SÉ DIM ENTAI RE
a : coupe géologique, b : analyse des stries de l’accident, c : panorama de la structure de Las Fraguas : côté SE de l’accident
frontal, dans le Sénonien.Las Fraguas structure, a : geological cross-section, b : slickenside analysis of the Las Fraguas fault, c : panoramic view of the Las
Fraguas structure : SE of frontal fault, in Senonian series.
Specht et al. (1991) ont proposé une méthode d’analyse de l’évolution tectonique et sédimentaire des bassins d’avant-pays. L’évolution de ces bassins dépend de l’individualisation et de la migration d’un motif tectono-sédimen- taire (Fig. 10) qui comprend : un chevauchement basal

BCREDP 17 (1993) ANALYSE STRUCTURALE DU BASSIN DE SORIA - ESPAGNE 29
N-NW S-SE
E’
500'500 m
1000
500
Figure 8
Coupe géologique de Las Cuevas. Geological cross-section of the Las Cuevas area.
associé à un anticlinal d’amortissement en cours de soulèvement et d’érosion, séparant deux gouttières de sédimentation (gouttière d’avant pays et gouttière « piggy back»). Dans ces gouttières interfèrent deux systèmes de dépôts : un système syn-orogénique, à matériaux immatures et gra- vitaires, en discordance progressive sur le bord actif (Riba, 1976) et un système rétrogradant sur le bord stable.
3.2. LES PLIS D’AMORTISSEMENT
Un certain nombre d’auteurs ont décrit la géométrie des plis d'amortissements que l’on peut considérer comme de première génération (Suppe & Medwedeff, 1984, 1990; Mitra, 1986, 1990; Jamison, 1987). Ces plis sont créés lorsqu’une faille chevauchante se propage graduellement tel qu’à tout instant, le raccourcissement tend vers zéro au bout de la faille (Suppe & Medwedeff, 1990).
Suivant les cas, la faille chevauchante peut monter plus ou moins haut dans les formations sédimentaires. Ce phénomène est engendré par les propriétés mécaniques et géométriques des formations (lithologie, épaisseur...). Quand la propagation de la faille cesse, la déformation peut se poursuivre soit par plissement, soit suivant un mode cassant («breakthrough anticline») (Suppe & Medwedeff, 1990).
La structure de La Cuenca appartiendrait à ce premier type de plis d’amortissement (Fig. 4).
Un pli d’amortissement de 2e génération (AL Saffar, 1992 a, 1993) sera créé si le pli de première génération garde sa géométrie. L’effet de l’érosion doit alors être minime. Ce cas est rencontré lorsque la propagation s’effectue dans un bassin et/ou lorsqu'elle est relativement rapide. L’anticlinal « breakthrough » apparaît lorsque l’érosion est active et enlève la partie supérieure du pli de première génération. Ainsi, elle facilite la cassure du pli le long de son plan axial.
Les plis d’amortissement ont été analysé (Al Saffar, 1993) dans le but de les modéliser. Un logiciel (PLAM) (Al
Saffar, 1992 b) fondé sur les hypothèses suivantes a été élaboré :
— les plis d'amortissement de 2e génération apparaissent, dans le temps, en continuité des plis d’amortissement de 1re génération;
— les couches se déplacent sur une deuxième faille qui représente un plan mécaniquement faible. Ce plan est l’un des plans axiaux des plis de 1re génération;
— les couches avant déformation ont une épaisseur constante. Cette épaisseur peut changer seulement dans le flanc d’avant-pays du pli d’amortissement de 1re génération (apparition d’une schistosité et/ou étirement des strates) ;
— la déformation se poursuit d’un pli de 1re génération à un pli de 2e génération en supposant que l’érosion n'ait pas changé la géométrie du pli de 1re génération, ce qui implique une déformation relativement rapide.
Les structures de Calatanazor, Nodalo, Las Fraguas et Las Cuevas, plus évoluées, peuvent être assimilées à des plis d’amortissement de 2e génération.
Une série de plis d’amortissement de 1re ou de 2e génération peut-être modélisée quelque soit la polarité de leur succession (interne ou externe). La détermination de la valeur des paramètres introduit dans le logiciel s’effectue à partir des données de terrain, lorsqu’ils sont mesurables, ou indirectement par approches successives. Les paramètres utilisés sont les suivants :
1 - longueur initiale de la coupe : évaluée à partir de la carte géologique ; elle est rectifiée au cours des derniers stades de calcul ; on doit impérativement tenir compte de la distance inter-rampes actuelle;
2 - nombre de formations et puissance cumulée de ces formations (F1, F1+F2, F1+F2+F3...) : la coupe sera d’autant plus précise que le nombre de formations sera élevé (cf largeur d’affleurement au § 5). Ce nombre dépend des zones traversées ;
3 - niveau de décollement (un seul niveau par coupe). Il est fonction des terrains impliqués dans la structure pli- cative, de la largeur des affleurements et de la nature lithologique des formations. Les niveaux de décollement sont situés ici dans :

30 V. Ml EG EBI ELLE, Y. HERVOUET ET J.-P. XAVIER BCREDP 17 (1993)

BCREDP 17 (1993) ANALYSE STRUCTURALE DU BASSIN DE SORIA - ESPAGNE 31
Figure 9
Structure de San Marcosa : carte géologique, b : coupe de l’unité occidentale, c : coupe de l'unité orientale de San Marcos.
San Marcos structure, a : geological map, b : geological cross-section of the westernmost part, c : geological cross-section of theeasternmost part.
— le Trias à Las Fraguas (Lias impliqué) et à Las Cuevas qui se trouve situé plus au sud ;
— l’Albien pour les structures de Nodalo, Calatanazor et Cuenca ;
4 - angle de chaque rampe : l'angle des rampes est fixé à partir de :
a) la valeur du pendage des strates de part et d’autre de l’anticlinal ;
b) du pendage des contacts chevauchants ;
5 - point d’amortissement des rampes : ce niveau est déterminé par l'âge des terrains affleurant au cœur des anticlinaux de rampes, la largeur des affleurements et leur altitude actuelle ;
6 - point de départ des rampes par rapport au début de la coupe : il est calculé à partir de la position actuelle de chaque portion de coupe ;
7 - rapport entre les épaisseurs finales et initiales du flanc d’avant-pays : dans le secteur d’étude, il n’existe pas de déformations notables sur le flanc chevauché (étirement, schistosité). Nous considérons ce rapport égal à 1.
Dans le cas du secteur considéré, les deux hypothèses de bases sont acceptables : l’épaisseur de chaque couche est constante si l’on considère des segments de faibles longueurs (chacune des unités tectoniques précédemment
définies est considérée comme une entité indépendante) et la déformation s’est effectuée pour l’ensemble du secteur pendant une durée relativement courte (sans que l’érosion modifie suffisamment la géométrie des plis).
Cette modélisation permet d’effectuer des coupes restaurées et de calculer le raccourcissement de façon assez précise (dans la mesure où les paramètres introduits sont proches de la réalité).
Remarque : Des limitations à la méthode sont toutefois à signaler. Ainsi, le logiciel ne modélise pas toujours les plissements existant à l’arrière de la structure majeure, ce qui peut induire une perte de matière. La valeur du raccourcissement proposée correspond donc à une estimation minimale. De plus, la méthode ne permet pas de quantifier les modifications du système lorsque celui-ci est repris en décrochement.
3.3. RÉSULTATS
3.3.1. Anticlinal de La Cuenca
La structure de La Cuenca, à déformation relativement faible, implique les formations cénozoïques situées sur son bord méridional dans la cluse du Rio Avion. Plus à l’est, au niveau de la route menant au village de La Cuenca, elles

32 V. MlEGEBIELLE, Y. HERVOUET ET J.-P. XAVIER BCREDP 17 (1993)
BASSIN D'AVANT - PAYS
GOUTTIERE PIGGY-BACK-------------------------------►
bord stable
anticlinal d'amortissem ent GOUTTIERE D'AVANT PAYS
bord actifFacies synorogénique
I + II : Imbrications d'ordre 1 6 km
Figure 10
Motif élémentaire tectono-sédimentaire d’après Specht et al., 1991 l-ll : chevauchements majeurs déterminant des imbrications d’ordre 1, 1, 2, 3, T et 2'; imbrications de chevauchement «overstep» à l'intérieur des anticlinaux d’amortissements.Chaque gouttière est remplie par un groupe de séquences de dépôt lié au fonctionnement du chevauchement majeur.
A l’intérieur, les séquences D1, D2, D3 sont liées au fonctionnement des chevauchements secondaires «overstep».Geometry of a syndepositional thrust system from Specht et al., 1991. I-II : major thrusts forming first order imbricates, 1, 2, 3, V et 2'; second order imbricates due to overstep thrusting in the fault propagation anticlines. The foreland and piggy-back syncline are infilled by a sequence deposited synchronously with the main thrust movement. In a sequence set, the D1, D2 and D3 sequences are in rela
tion with the second order thrust motion.
Figure 11
Modélisation de la structure de La Cuenca. Computer modelling of the La Cuenca structure.

BCREDP 17 (1993) ANALYSE STRUCTURALE DU BASSIN DE SORIA - ESPAGNE 33
N s
al
b)
Figure 12
Modélisation des structures
a : de Calatanazor, b : de Nodalo.Computer modelling of structures : a : Calatanazor, b : Nodalo.
semblent sceller le contact. Ainsi, les formations oligo-miocènes continentales correspondent aux sédiments déposés dans le bassin « piggy back» de la structure de Calatana- zor-Nodalo. Le décollement s’effectue dans le Crétacé inférieur et le raccourcissement est de l’ordre de 1 km (Fig. 11).
3.3.2. Calatanazor et Nodalo
Ces deux structures sont dans le prolongement l’une de l’autre. Elles forment des plis d’amortissement de 2e génération avec décollement dans le Trias (Fig. 12a et b). Le
raccourcissement est identique pour les deux structures (1,4 km). Ces deux structures génèrent à l’avant une gouttière (côté externe), remplie de sédiments détritiques tertiaires, et à l’arrière une gouttière « piggy back » (Specht et al., 1991). Ce dispositif est compatible avec la formation d’une gouttière d’avant-pays, au sud de l’accident méridional de Nodalo. De plus, aux abords de cet accident, les crachons qui se développent dans le Tertiaire confirment ce mouvement. Ils pourraient correspondre à un dispositif en discordance progressive des sédiments détritiques sur le bord actif.

34 V. MIEGEBIELLE, Y. HERVOUET ET J.-P. XAVIER BCREDP 17 (1993)
0.5
Rac. (unités) = 1.9 Km
1. 0
Figure 13
Modélisation de la structure de Las Fraguas. Computer modelling of the Las Fraguas structure.
TTTT'U U u u u,0 0 0 0 000000000000 000000000000
0 0 00 0 0 0
3 0 0 0
Rac. (unités) = 1.4 Km
Figure 14
Modélisation de la structure de Las Cuevas de Soria. Computer modelling of the Las Cuevas de Soria structure.

BCREDP 17 (1993) ANALYSE STRUCTURALE DU BASSIN DE SORIA - ESPAGNE 35
Au cours du Cénozoïque, différentes phases tectoniques doivent donc être envisagées :
— formation de plis d’amortissement et des gouttières sédimentaires ;
— effondrement de l’anticlinal de rampe (deuxième jeu de l’accident méridional cf. § 2.2.2.3.2.).
3.3.3. Anticlinal de Las Fraguas
Le cœur liasique de l’anticlinal implique un décollement sous le Lias, que nous situons dans le Trias (Fig, 13). Le raccourcissement est ici le plus important puisque qu’il atteint 1,9 km. Ceci est confirmé sur le terrain par l’existence de nombreuses petites failles plates à caractère chevauchant au sein des formations du Crétacé supérieur.
3.3.4. Las Cuevas de Soria
La structure frontale de Las Cuevas de Soria forme un pli d’amortissement de 2e génération avec décollement dans le Trias (Fig. 14). Elle déforme de façon synchrone les dépôts oligo-miocènes avec apparition d’un dispositif en discordance progressive des sédiments détritiques sur son bord méridional. Le raccourcissement est estimé à 1,4 km.
3.3.5. Sierra de San Marcos
La Sierra de San Marcos est constituée de deux unités emboîtées chacune présentant un empilement d’écailles. L’unité occidentale est limitée par deux rampes latérales N140 (faille d’Ocenilla au sud-ouest subverticale à jeu dex- tre, faille de San Marcos au nord-est chevauchante vers le nord-est à jeu senestre). Le niveau de décollement se situe à la limite Albien-Kimméridgien continental comme en témoigne l’intense déformation des formations fluviatiles redressées à la verticale près de Golmayo. Les galets de quartzites (Fig. 15) sont intimement cisaillés par des plans subhorizontaux parallèles au décollement.
4 — INTERPRÉTATION GÉNÉRALE - CONCLUSION
4.1. CHRONOLOGIE DES ÉVÉNEMENTS
L’absence de datation précise des formations oligo-miocènes continentales interdit une reconstitution chronologique précise.
Cependant, plusieurs phases peuvent être différenciées :— un jeu crétacé inférieur se manifeste par des diffé
rences d'épaisseurs au sein des formations wealdiennes et albiennes, très épaisses au nord, réduites au sud. Ce phénomène a pu être mis en évidence par les résultats du sondage de La Cuenca I (Beltran Cabreja et al., 1978). On note, dans le Crétacé supérieur de Las Cuevas de Soria, des épandages localisés de mégabrèches. Elles peuvent être assimilés à des éboulis de bas de talus, à proximité de l’accident d’Odemira-Avila-Soria, témoignant de la pérennité de l’instabilité tectonique;
Figure 15
Galets de quartzites cisaillés par des plans subhorizontaux (formation Oncala-Golmayo).
Example of quartzitic pebbles sheared by subhorizontal planes (Oncala formation-Golmayo).
— une première phase de compression cénozoïque, avec formation d’anticlinaux assimilés à des plis d’amortissements, générant de petits bassins. Classiquement, dans les plis d’amortissement, la direction axiale est parallèle à la direction des accidents : c’est le cas à La Cuenca, Ca- latanazor et dans la partie occidentale de Nodalo (Fig. 2b). La direction de la contrainte est perpendiculaire aux structures et peut être estimée à N10-N20.
L’originalité des autres structures (Nodalo oriental, Las Fraguas, Las Cuevas de Soria) réside dans le fait que la direction des rampes (N60-N70) est oblique par rapport à celle des anticlinaux (N70 à N90) (Fig. 2b). Ces failles, parallèles à la bordure sud-est du bassin à remplissage de matériel d’âge crétacé, sont vraisemblablement héritées de i’histoire mésozoïque. La compression subméridienne cénozoïque les réactive en décrochement senestre inverse. Apparemment il n’y a pas de dépôts oligo-miocène associés. Au sud-est de l’accident de Soria, le bassin oligo-miocène est principalement dû à une inversion de relief : l’épaississement crustal cénozoïque est cantonné au nord- ouest de l’accident et comparativement, la partie sud-est s’enfonce recueillant les produits de l’érosion de la chaîne naissante. Toutefois, à Las Cuevas de Soria, cet enfoncement peut être accentué par le fonctionnement des plis d’amortissement situés au nord de l’accident principal (discordance progressive dans l’Oligo-Miocène marquant un jeu de l’accident dans le plan vertical).
Le raccourcissement a pu être estimé à environ 5,5 km pour la zone la plus simple (secteur médian), entre La Cuenca et Las Cuevas de Soria, soit un taux de raccourcissement inférieur à 30%. Pour la Sierra de San Marcos, relativement

36 V. Ml EG EBI ELLE, Y. HERVOUET ET J.-P. XAVIER BCREDP 17 (1993)
Compression subméridienne
a)
Secteur méridional du bassin losangique de Soria.a et b : schémas interprétatifs à différentes échelles, c : coupe du décalage des niveaux de décollement le long de l’accident
Odemira-Avila-Soria.The southernmost part of the pull-apart Soria basin, a and b : schematic tectonic setting at two different scales, c : the cross-section illustrates the different décollement levels that occur along the Odemira-Aviia-Soria trend.
proche, si nous admettons que la valeur du raccourcissement est identique, le taux atteindrait 40 % de cette longueur initiale.
Une deuxième phase en compression, plus tardive peut être envisagée : le rejeu décrochant dextre de l'accident frontal E-W de Nodalo en serait la preuve, la direction de raccourcissement pouvant être alors assimilée aux mouvements subactuels (N120 au niveau européen).
4.2. INTERPRÉTATION
La structuration du coin méridional du bassin de Soria est issue de sa fermeture qui débute dans l’Oligocène. La compression tertiaire se produit obliquement aux limites du bassin (Fig. 16a et b). L'accident de Soria (prolongement de la faille d’Odemira-Avila) qui en constitue sa limite sud-
orientale rejoue en décrochement senestre (alentours de Soria). L’épaississement crustal au nord-ouest de cet accident entraîne :
— le décollement de la couverture sur le socle le long des anciennes failles normales mésozoïques et sa mise en altitude. Le coin SE du bassin va présenter une structure complexe en décollement- décrochement;
— la structuration en creux relatif de la partie située au sud-est de l'accident de Soria dans laquelle va se déposer les produits de démantèlement de la chaîne de Los Cameras en cours d’élaboration formant ainsi un vaste bassin oligo-miocène.
Le taux de raccourcissement sera d’autant plus grand que l’on se rapprochera du coin méridional de l’ancien bassin, l’accident d’Odemira-Avila-Soria bloquant par décalage

BCREDP 17 (1993) ANALYSE STRUCTURALE DU BASSIN DE SORIA - ESPAGNE 37
des niveaux préférentiels de décollement (Trias, Crétacé inférieur) le glissement vers le sud de la couverture (Fig. 16c). La Sierra de San Marcos présente le plus fort raccourcissement et le style tectonique est différent de part et d’autre de ce secteur.
Vers le sud-ouest, les décollements pourront parcourir de plus grandes distances avant de rencontrer l’accident d’Odemira-Avila-Soria. La valeur du raccourcissement étant vraisemblablement identique, le taux de raccourcissement sera inférieur et l'empilement d’écailles sera remplacé par la naissance de plis d’amortissement relativement simples.
Au nord-est de San Marcos (alentours de la ville de Soria), parallèlement au bord décrochant de l’ancien bassin mésozoïque, se développe un couloir de décrochement senestre dans lequel les terrains mésozoïques et cénozoï- ques pris dans des navettes sont souvent redressés à la verticale.
5 — RÉFÉRENCES
Al Saffar, M. (1992 a). — Géométrie et modélisation des chaînes intracontinentales d’Algérie. — 14e Réunion des Sciences de la Terre, Toulouse; Soc. géol. France, Paris (éd.), 5.
Al Saffar, M. (1992 b). — PLAM. — A fortran 77 program to model fault. — Propagation folding written by AL SAFFAR, M. — Dept Sciences de la Terre, Lab. de Géol. Struct., Univ. de Pau.
Al Saffar, M. (1993). — Fault propagation folds : method and application. — Tectonophysics (in press).
Beltran Cabrera, F.J., Rios Mitchell, J.M., & Rios Aragues,L.M. (1978). — Mapa Geologico de ESPANA, Hoja 349, Cabrejas del Pinar.
Floquet, M. (1978). — La sédimentation de plate forme au Crétacé Supérieur dans la Vieille Castille (Espagne) : évolution verticale, variation horizontale, implications paléogéographiques. — Bull. Soc. géol. France, 20, 5, 779- 783.
Floquet, M. (1979). — La série carbonatée Coniacien supérieur à Santonien dans la région de Soria (Chaînes Ibériques Septentrionales) : analyses et interprétations. — Cuad. Geol. (iberical), 5, 365-383.
Floquet, M. (1980). — Un modèle de comblement de plate forme interne carbonatée : Santonien Supérieur-Campa- nien des chaînes Ibériques Nord. — Cretaceous research, 3, 69-81.
Floquet, M. (1982). —Transgressions, regressions et eustatisme-tectonique-sédimentation sur la plate forme nord castillane du Crétacé Supérieur (régions Ibéro-Cantabri- ques, Espagne). — Palâont. Abh., 165, 1, 125-146.
Guimera, J. & Alvaro, M. (1990). — Structure et évolution de la compression alpine dans la chaîne ibérique et la
chaîne côtière catalane (Espagne). — Bull. Soc. géol. France, 8, 6, 2, 339-348.
Guiraud, M. (1983). — Evolution tectono-sédimentaire du bassin wealdien (Crétacé inférieur) en relais de décrochements de Logrono-Soria (NW de l’Espagne). — Thèse 3e Cycle, Montpellier, Univ. Sci. Techn. Languedoc, 183 pp.
Guiraud, M. & Seguret M. (1985). — A releasing solitary overstep model for the late Jurassic-early Cretaceous (Wealdian) Soria strike-slip basin (northern Spain). — In : Biddle, K.T. & Christie-Blick N., (eds.) : Strike-slip Deformation, Basin Deformation and Sedimentation — Soc. Econ. Paleont. Mineral., spec. Pub!., 37, 159-177.
FIervouet Y. & Al Saffar M. (1993). — Les plis d’amortissement de deuxième ordre : essai d’application sur le flanc sud des Pyrénées occidentales. — Bull. Soc. géol. France, (à paraître).
Jamison, W.R. (1987). — Geometric analysis of fold development in over thrust terranes. — J. struct. Géol., 9, 2, 207-219.
Malod, J.A. (1989 a). — Iberian kinematics during the Cretaceous. Paleogeographic consequences. — In : Wied- mann J., (ed.) : Cretaceous of the Western Tethys, Tübingen, 1987, 3-16.
Malod, J.A. (1989 b). — Ibérides et plaque ibérique. — Bull. Soc. géol. France, 8, 5, 927-934.
Malod J.A. & Mauffret A. (1990). — Iberian plate motions during the Mesozoic. — Tectonophysics, 184, 261-278.
Miegebielle, V, Hervouet, Y. & Xavier, J.P., (1991). — Individualisation jurassique du bassin wealdien de Soria, chaîne ibérique nord-occidentale, Espagne. — Bull. Centres Rech. Explor.-Prod. Elf Aquitaine, 15, 1, 69-82.
Mitra, S. (1986). — Duplex structures and imbricate thrust systems : geometry structural position and hydrocarbon potential. — Bull. amer. Assoc. Petroleum Geol., 70, 1087-1112.
Mitra, S. (1990). — Fault propagation folds: geometry, kinematic evolution and hydro carbon traps. — Bull. amer. Assoc. Petroleum Geol., 74, 921-945.
Olivet, J.L., Bonnin, J., Beuzart, P. & Auzende, J.M. (1982). — Cinématique des plaques et paléogéographie : une revue. — Bull. Soc. géol. France, 7, 24, 5-6, 875-892.
Riba, O. (1976). — Syntectonic unconformities of Alto Car- dener, Spanish Pyrenees : a genetic interpretation. — Sediment. Geol., 15, 213-233.
Specht, M., Deramond, J. & Souquet, P. (1991). — Relations tectonique-sédimentation dans les bassins d’avant pays : utilisation des surfaces stratigraphiques isochrones comme marqueurs de la déformation. — Bull. Soc. géol. France, 162, 3, 553-562.
Suppe, J., Medwedeff, D.A. (1984). — Fault propagation folding. — Bull. geol. Soc. Amer., 16, 670.
Suppe, J., Medwedeff, D.A. (1990). — Geometry and kinematics of fault propagation folding, — Eclogae geol. Fielv., 83, 3, 409-454.
Viallard, P. (1989). — Décollement de couverture et décollement intracrustal dans une chaîne intraplaque : variations verticales du style tectonique des Ibérides (Espagne). — Bull. Soc. géol. France, 8, 5, 5, 913-918.

IMAGE GLOBALE DE LA CROÛTE CONTINENTALE FRANÇAISE ENTRE LE BRABANT ET LE PAYS BASQUE
GLOBAL IMAGE OF THE FRENCH CONTINENTAL CRUST BETWEEN BRABANT AND THE BASQUE COUNTRY
Jean-Pierre LEFORT
LEFORT, J.-R (1993). - Image globale de la croûte continentale française entre le Brabant et le Pays Basque. [Global image of the French Continental crust between Brabant and the Basque Country], - Bull. Centres Ftech. Explor.-Prod. Elf Aquitaine, 17, 1, 39-52, 6 fig.; Boussens, June 24, 1993. - ISSN : 0396-2687. CODEN : BCREDP.A new impression of the French crust, resulting from various, recent, geological
and geophysical findings together with a compilation and reinterpretation of the data obtained between Brabant and the Basque Country, is presented in this article. A first image of the basement, down to fourty-five kilometers, is proposed. This section gives a complete picture of the Hercynian orogen, especially its fan-like shape. The divergent thrusts are bounded by the old Brabant and Ebro-Aquitain cratons and coincide with two previous plate boundaries. The lower part of the orogen is limited by the layered lower crust of Permian age. Close to the surface, the Hercynian orogen is partly buried by two continental margins. The Parentis graben is the only noticeable disturbance that can be seen along these margins.Jean-Pierre Lefort, Laboratoire de Tectonophysique, Géosciences - Rennes, Univer
sité de Rennes 1, Campus de Beaulieu, F-35042, Rennes, cede*. - Marsh 18, 1993.
Key words : Geophysical surveys, Continental crust, Thrust fault, Hercynian Orogeny, Sutures zones, France.
RÉSUMÉ
La synthèse, la réinterprétation et l’acquisition de nouvelles données géologiques et géophysiques entre le Brabant et le Pays Basque permettent de proposer une première image de la croûte continentale française entre zéro et quarante cinq kilomètres de profondeur. Cette image montre une coupe complète de la chaîne hercynienne et notamment la forme en éventail des chevauchements tardifs. Ceux-ci, limités par les cratons du Brabant et Ebro-Aquitain affectent ou transposent deux sutures de plaque anciennes. Vers le bas cet édifice est limité par une croûte inférieure horizontale litée, témoin de la relaxation permienne de la chaîne. Vers le haut le socle est caché sous deux marges continentales peu épaisses, seulement perturbées par le profond graben de Parentis.
Mots-clefs : Levé géophysique, Croûte continentale, Chevauchement, Orogénie hercynienne, Suture tectonique, France.
SOMMAIRE — CONTENTS
INTRODUCTION...................................................................... 401. - LES DONNÉES DÉJÀ CARTOGRAPHIÉES - DATA
ALREADY PUBLISHED.................................................... 401.1. Données géologiques - Geological data............... 401.2. Données gravimétriques - Gravity data................ 401.3. Données magnétiques - Magnetic data............... 401.4. Données du flux de chaleur - Heat flow data..... 42
2. - LES PROFILS ANALYTIQUES - DATA SECTIONS....... 422.1. Coupe géologique - Geological section................ 422.2. Coupe sismique - Seismic line drawing................. 432.3. Synthèse des données géophysiques - Geophysical
compilation.............................................................. 443. - LE •• TRANSECT » - THE TRANSECT.......................... 464. - CONCLUSIONS ET DIAGRAMME ÉVÉNEMENTIEL
ESPACE-TEMPS - CONCLUSIONS AND TIME-SPACE DIAGRAM........................................................................ 48
5. - RÉFÉRENCES................................................................ 51
0396-2687/93/0017-0039 $ 2.80 © 1993 elf aquitaine production, F-31360 Boussens

40 J.-P. LEFORT BCREDP 17 (1993)
INTRODUCTION
Le projet international « Global Geosciences Transect » lancé au Canada par J. M. Monger dans les années 80, avait pour but d’établir des coupes synthétiques complètes basées sur les données géologiques, géochronologiques, géochimiques et géophysiques réunies dans la croûte continentale ou océanique, au niveau de structures majeures (Monger, 1986), éventuellement au travers de plusieurs territoires nationaux.
Le « transect « français est maintenant achevé (Lefort et al., 1992), il a donné lieu à la production d’un poster à l’échelle du 1/1 000 000e, montrant notamment, quatre corridors analytiques et cinq coupes synthétiques qui intègrent toutes les informations existantes entre zéro et quarante cinq kilomètres de profondeur. Ces données constituent la matière de base du présent article.On doit préciser que les coupes géologiques et géophysiques présentées ne s’appuient pas seulement sur les informations déjà publiées mais incorporent aussi de nombreuses données inédites qui sont le fruit de recherches récentes suscitées par le « transect » lui-même.
1 LES DONNÉES DÉJÀ CARTOGRAPHIES
La Figure 1 montre le trajet qui a été adopté pour dessiner le « transect’ ». Celui-ci suit, sur un peu plus de mille kilomètres, les profils sismiques acquis lors de différents programmes ecors. Il traverse le Bassin de Paris, le Massif Armoricain, le nord du Bassin d’Aquitaine, le Golfe de Gascogne et la marge nord de l’Espagne. La seule lacune, large de 60 kilomètres, se trouve à l’ouest de la Rochelle, là où les fonds étaient insuffisants pour la prospection sismique à deux navires. L’ensemble des informations ayant déjà donné lieu à cartographie sont présentées dans quatre corridors larges de 50 km de part et d'autre du tracé du « transect ».
1.1. DONNÉES GÉOLOGIQUES
Pour des raisons de simplification (Fig. 2), nous n’avons, dans le socle, distingué que le Précambrien (PL), le Paléozoïque (P), les granites (Gr), les roches basiques et ultra- basiques (en noir) et les rhyolites (P). En précisant toutefois, dans les régions ou le métamorphisme était appréciable, soit la présence du faciès « greenschist » de niveau moyen à supérieur (y), soit celle du faciès « amphibolite » (a). La Figure 3a montre la nature des données géologiques utilisées, elles sont en majorité extraites de la carte de France au 1/1 000 000 (brgm, 1968). Dans la couverture mésozoïques et cénozoïque nous avons repris à quelques très rares exceptions prés (par exemple sur la marge nord espagnole), les contours de la carte au 1/1 000 000. Cette carte montre de plus, recoupant le profil lui-même, quelques failles supplémentaires qui n’apparaissent pas sur le document publié par le BRGM mais qui correspond à des traits structuraux importants, reconnus par sismique grand angle, et vérifiés sur le terrain avec l'aide de P. Bouton, R. Brossé,M. Colchen, C. Le Corre, J. Le Gall, G. Mary, P. Meidon et P. Poncet.
On note que le « transect » ne traverse le socle affleurant que sur un tiers de sa longueur; la coupe de croûte que nous proposons plus loin, et qui descend jusqu'à 45 km de profondeur, devra donc beaucoup à la géophysique tant pour ce qui est de la localisation du toit du socle sous les bassins qu'en ce qui concerne la définition des horizons profonds.
1.2. DONNÉES G RAVI MÉTRIQUES
La Figure 3b reprend l’ensemble des données gravimé- triques publiées à terre (brgm, 1975) et en mer. Dans le Golfe de Gascogne il s’agit non pas de l’anomalie de Bou- guer mais de l’anomalie à l’air libre, ces valeurs se raccordent naturellement au niveau du trait de côte.
Au nord du Bassin de Paris, caractérisé par ses anomalies négatives liées à la présence des sédiments mésozoïques et cénozoïques, on notera, dans la région de Beauvais, le gradient NW-SE qui se superpose à la faille du Bray. Plus au sud, à l’est d’Alençon, les anomalies négatives orientées d’ est en ouest montrent l’extension des granites mancelliens sous la couverture. A I’ est du Massif Armoricain, les anomalies négatives sont généralement associées à des granites, les anomalies positives au Paléozoïque et au Briovérien.
Dans le Golfe de Gascogne et sur la marge espagnole la carte de gravimétrie à l’air libre rend compte de la nature des terrains sous-jacents mais aussi de la topographie. La marge sud armoricaine présente des caractéristiques proches de celles du Bassin de Paris. Par contre au sud, la forte anomalie négative allongée d’ est en ouest correspond au Gouf de Cap Breton; les fortes anomalies positives qui la bordent sont liées, l'une à la remontée de socle qui forme le Seuil des Landes, l’autre à l’amincissement de croûte qui accompagne le graben de Parentis.
1.3. DONNÉES MAGNÉTIQUES
La Figure 4a reprend de façon simplifiée la carte magnétique de la France (brgm, 1971). Le trait marquant en est l’anomalie du Bassin de Paris dont l’origine est mal connue et que l’on peut suivre entre Evreux et Chartres; son dessin suit à peu près celui de la faille de la Seine.
A I' est du Massif Armoricain, les anomalies sont de plus courte longueur d’onde, elles montrent que le socle magnétique est plus proche de la surface que dans le Bassin Parisien. Les deux anomalies importantes situées de part et d’autre d’Angers sont associées, l’une, au nord, à du minerai de fer et l’autre, au sud, à des coulées rhyolitiques, matériel toujours très magnétiques. Les linéations NW-SE qui caractérisent cette région sont liées aux divers branches de la zone broyée sud armoricaine et aux failles qui leur sont associées.
Dans le Golfe de Gascogne la longueur d’onde des anomalies s’accroît de nouveau prouvant ainsi que le socle s’approfondit régulièrement vers le sud.Le trait magnétique le plus marquant de cette zone, d’orientation N130°, est connu sous le nom d’anomalie du Médoc (Curnelle, 1984); comme celle du Bassin de Paris, l’anomalie du Médoc pourrait correspondre à une ancienne suture de plaque.

BCREDP 17 (1993) IMAGE GLOBALE DE LA CROÛTE CONTINENTALE FRANÇAISE 41
Figure 1
Localisation du transect Géoscience. Location of Geoscience transect.

42 J.-P. LEFORT BCREDP 17 (1993)
1.4. DONNÉES DU FLUX DE CHALEUR
La Figure 4b représente la distribution des anomalies du flux de chaleur de part et d'autre du profil Géoscience (Lucazeau & Vasseur, 1989). L’orientation de l’anomalie majeure localisée entre Paris et Angers ne rappelle aucune des informations livrées par le champ potentiel. De fait le nombre de données existantes ne permet pas d’attacher une signification structurale à la forme de cette anomalie. On peut tout au plus postuler que les faibles valeurs de flux pourraient être liées à l’extension des granites cadomiens sous le Bassin de Paris, puisqu’un tel déficit est connu dans la Mancellia elle-même.
Dans le Golfe de Gascogne, zone traversée par le profil, il n’existe aucune donnée relative au flux de chaleur. La grande plage de valeurs inférieures à 80mW/m2 figurée en mer ne reflète probablement donc pas les variations auxquelles on pourrait s’attendre dans une région caractérisée par un amincissement crustal important.
Le bilan des données existantes à permis d’évoquer certains des grands problèmes que soulève ce « transect », tel que celui de l’extension de la Mancellia vers I’ est, la possibilité de sutures au niveau des fortes anomalies magnétiques allongées ou la nature du socle sous la marge aquitaine. La précision de ces informations est néanmoins insuffisante pour permettre une confrontation fructueuse entre données géologiques et données géophysiques profondes. Cette confrontation ne pourra se faire qu’avec l'introduction des profils analytiques, que l’on va maintenant commenter.
2 — LES PROFILS ANALYTIQUES
Ces profils résument les informations détaillées qui ont été réunies au niveau de la coupe ou à sa proximité immédiate. Lorsque les données utilisées étaient situées à plus de 5 km du « transect » cela a été précisé, On n’a toutefois rabattu les données que lorsqu'elles étaient absentes du profil et que la structure sur laquelle elles étaient échantillonnées recoupait celui-ci.
Toutes les informations ont été reportées sous un levé topographique à base courbe, qui reflète ainsi mieux la rotondité de la terre.Cette base suppose un globe sphérique d’un rayon égal à 6 400 km. L’échelle verticale a été choisie égale à l’échelle horizontale, tout au moins quand elle pouvait être exprimée en kilomètres, afin qu’il n’apparaisse aucune anamorphose dans le « transect » final résultant des profils analytiques.
2.1. COUPE GÉOLOGIQUE
Les données géologiques de surface ont été prolongées dans la mesure du possible jusqu’à cinq kilomètres de profondeur (Fig. 5a), bien que la coupe comporte trois régions pour lesquelles les critères d’extrapolation vers le bas sont différents. Dans le Massif Armoricain, le prolongement s’est effectué à partir des informations structurales de surface ainsi que cela est habituel en tectonique.Dans les bassins
par contre, la connaissance des formations profondes repose sur la compilation des résultats de forages d’origines diverses. Malgré les vingt deux forages répertoriés le long du profil, on note que l’information est assez pauvre dans ces régions, notamment pour ce qui concerne le socle, puisque seuls dix puits l’ont atteint dans le Bassin de Paris (Cazes & Toreilles, 1988) et deux sur la marge aquitaine (Lefort et al., 1993b). De plus et compte-tenu de l’échelle choisie, les formations mésozoïques et cénozoïques ne peuvent être figurées en détail. On a pris bien soin à ce stade de l’analyse, à ne pas introduire les résultats de la sismique réflexion qui eussent rompu l’homogénéité de l’information.
Dans le Bassin Parisien sous une couverture épaisse en moyenne de 1,5 km, apparaissent au nord et au toit du socle les formations schisteuses du synclinal de Dinant. Plus au sud, les bassins permo-triasiques reconnus dans la région de Banthelu reposent très probablement sur des terrains appartenant à la Mancellia, puisqu'on a trouvé à faible distance, et par deux fois, des schistes peu métamorphiques qui pourraient appartenir au Briovérien. Ceci est surtout soutenu par la présence d'orthogneiss hercyniens datés à 320 Ma, qui se sont développés aux dépends d’un granite âgé de 570 Ma (Matte et al., 1986). La question de savoir si les failles de la Somme et de la Seine, de même orientation que la faille du Bray, représentent comme elle (c’est cette faille qui au forage d’Aux-Marais est à l’origine de la déformation de l'orthogneiss hercynien) des cisaillements carbonifères dextres, sera discutée plus loin.
La coupe à travers le Massif Armoricain montre que la zonation tectonique que l’on peut reconnaître dans les zones bordières du Bassin Parisien, du Poitou et de Vendée, ne diffère pas sensiblement d’une coupe type qui aurait été effectuée au travers de la Bretagne, si ce n’est que chaque zone est ici plus largement représentée. Au nord, les formations paléozoïques des Coêvrons, dont les séries de base sont très largement développées, sont en contact anormal avec le Briovérien de la Mancellia; il en est de même des formations primaires du Basin de Laval qui sont déversées et charriées vers le nord sur le Protérozoïque supérieur (on ne discutera pas ici l’éventualité d’un âge paléozoïque très inférieur pour le Briovérien).
Des Bourleries jusqu’à Thouarcé, tous les contacts anormaux, autres que les failles verticales, semblent correspondre à des chevauchement carbonifères orientées vers le nord (encore que celui qui est localisé entre Thouarcé et le Pont-de-Cé, puisse aussi être interprété comme un accident décrochant). A Thouarcé, la faille du Layon qui se dédouble, génère, et encadre le sillon houiller namurien, met en contact les formations paléozoïques angevines avec le Briovérien des Mauges. Cette faille semble jouer un rôle fondamental dans la structuration varisque du sud du Massif Armoricain,même si le déversement des séries protérozoïques qui la borde au sud continue de s’orienter vers le nord.
La zone granitisée, principalement mais pas exclusivement Carbonifère, qui s'étend de là jusqu’à Mareuil-sur - Le-Lay (situé un peu à l’ouest de notre coupe), ne sera pas détaillée, ni du point de vue de la pétrographie ni de celui de la chronologie des intrusions, elle est très affectée par l’effet des jeux transcurrents dextres d’âge tardi-carbonifère. Ces jeux oblitèrent totalement le déversement antérieur des séries métamorphisées vers le sud tel qu’on peut encore les voir dans le Bas-Bocage. Notons seulement la présence d'amphibolites et d’éclogites actuellement en position de

BCREDP 17 (1993) IMAGE GLOBALE DE LA CROÛTE CONTINENTALE FRANÇAISE 43
horst (haut des Essarts) le long de la faille de Chantonnay qui témoignent de l’existence d’un arc volcanique ou d’un bassin arrière-arc (Godard, 1984) d’âge possiblement silurien.
Le graben de Saintes/Cognac, comblé de Namurien (Le Pochât, 1984) et contrôlé par des failles dont l'orientation est typiquement armoricaine, constitue une frontière entre les zones métamorphiques du sud de la Bretagne et les terrains à peine épimétamorphiques de la marge sud armoricaine (Lefort & Poulpiquet, 1993). Seuls deux forages ont atteints le socle dans le Golfe de Gascogne. L’un à Albatros, a permis de carotter des formations volcano- sédimentaires acides schistosées qui pourraient appartenir soit au Cambrien soit à l’Ordovicien et qui n’ont peut-être pas d’équivalent ailleurs dans le socle du Bassin d’Aquitaine (Rolet, 1993); l’autre à Danu localisée sur le seuil des Landes a livré des quartzites paléozoïques, semble-t-il peu métamorphiques, qui pourraient dater du Carbonifère (Rolet, 1993).
Les forages réalisés par l’industrie pétrolière sur la marge du Golfe de Gascogne ont permis de bien comprendre l’évolution de la subsidence du Bassin de Parentis tout au moins dans sa partie terminale; son histoire profonde au niveau du profil devant beaucoup plus à la sismique réflexion qu’aux prélèvements. On sait ainsi que la sédimentation carbonatée post-rift du Jurassique, qui est interrompue au Valanginien et à l’Hautérivien par un hiatus très marqué (Curnelle, 1984), a été suivie par une période de subsidence importante lors de l’Albo-Aptien (que l’on peut estimer à plusieurs milliers de mètres à la longitude de la coupe). Suit au Crétacé supérieur un épisode détritique qui est à l’origine de séries localement très développées. Enfin la subsidence s’achève au Tertiaire, elle est marquée par d’épaisses séries terrigènes et des molasses. Sur le seuil des Landes, le Crétacé supérieur et le Tertiaire sont par contre directement transgressifs sur le Trias.
En fin de compte notre coupe présente une certaine symétrie, puisque l’on retrouve de part et d’autre de la remontée médiane de socle, deux régions qui ont été sub- sidentes au cours de l’histoire mésozoïques et cénozoïque. Cette symétrie se retrouve aussi dans l’édifice hercynien,puisque les formations métamorphisées et plissées connues dans le Massif Armoricain sont bordées au nord et au sud par des séries à peine épizonales. On devine donc déjà que les zones les plus extérieures de la chaîne, qui sont aussi celles qui devraient être affectées par les chevauchements les plus plats, se trouveront localisées sous les Bassins de Paris et d’Aquitaine.
2.2 COUPE SISMIQUE
Ce profil (Fig. 5b), réuni l’ensemble des informations sismiques connues, autres que celles de la sismique réfraction. Il incorpore au nord, le pointé du profil de sismique réflexion EcoRS-Nord de la France dans sa version migrée (Cazes & Torreille, 1988) auquel on a superposé très localement les informations livrées par les essais de sismique grand angle (FHirn, 1988). Cette façon peu orthodoxe de procéder a pour but de mieux montrer, dans la partie méridionale, la continuité qui existe entre la sismique réflexion verticale acquise sous le Bassin de Paris et les résultats de la sismique grand angle enregistrée seule sous le Massif Armoricain (cet artifice ne concerne de fait que la région située au sud de
Courgent). Au nord, sous les Ardennes, nous avons aussi porté le réflecteur oblique profond bien enregistré par la sismique grand angle et que Cazes et at.( 1988) interprètent comme la trace d’un paléo-Moho d’âge possiblement précambrien. De tels essais de corrélation entre les deux types de sismique avaient d’ailleurs été tentés par FHirn (1988).
Sur ce segment on remarque, ainsi que cela avait déjà été souligné par l’équipe de profil (Cazes & Toreilles, 1988), quatre ensembles de réflecteurs bien distincts. Au nord, les réflecteurs plats, peu profonds, à légers pendages vers le sud, peuvent être interprétés grâce aux données des forages et à la coupe de la vallée de la Meuse (Ardennes), comme des chevauchements pelliculaires d’âge hercynien. Sous ceux-ci, la zone sourde presque dépourvue de réflexions semble correspondre au socle précambrien et calédonien du Brabant qui pourrait, comme on l’a déjà dit, être limité vers le bas par un Moho ancien, penté, et très profond. Au sud de la zone à tectonique pélliculaire, l’enracinement des structures assimilables à des chevauchements s’approfondit jusqu’au toit de la croûte inférieure qui est, ici, clairement litée. Ce litage parait caractériser en gros la Mancellia.
La partie supérieure de la Mancellia est marquée par de nombreuses structures en V dont les branches méridionales disparaissent toutefois souvent après migration conventionnelle (Cazes & Torreilles, 1988). Sachant que certaines de ces structures en V sont réelles à l’est du Massif Armoricain, et qu’il ne s’agit pas toujours d’artefacts que la migration doit faire disparaître, une nouvelle migration a été proposée (Lefort & Vigneresse, 1993). Les conséquences qu’impliquent cette nouvelle étude seront discutées lors de la présentation du « transect ».
Le pointé sismique est enfin interrompu sur ce segment, et en de nombreux endroits, par des discontinuités verticales qui ont été interprétées comme des failles transcur- rentes hercyniennes (Matte & FHirn, 1988), la plus importante se localisant en bordure de l’anticlinal du Pays de Bray. On ne peut toutefois affirmer que ces discontinuités descendent toutes jusqu’au Moho.
Les régions est-armoricaines, recoupées par le profil de sismique grand angle (FHirn, 1988), montrent clairement une distribution des réflecteurs en éventail, ceux-ci ont été assimilés à des chevauchements divergents (Matte & FHirn, 1988) sans pourtant les corréler avec des structures précises sur le terrain. Cet ensemble est lui aussi affecté de discontinuités verticales que l’on peut interpréter comme des cisaillements verticaux tardi-hercyniens. Le centre de la zone divergente ne montre pas de réflecteurs qui pourraient être assimilés au Moho, ce qui pose le problème de la transition manteau supérieur-croûte inférieure litée dans l’axe de la chaîne. Nous reviendrons sur cette question lors de la discussion sur le « transect ».
Dans le Golfe de Gascogne, la sismique verticale migrée et le pointé qui en a été tiré montrent jusqu’au bassin de Parentis une image très semblable, bien que symétrique, à celle qui a été enregistrée sous le Bassin de Paris. Là, le chevauchement le plus méridional semble émerger au toit du socle à la limite nord du bassin (Lefort & Poulpiquet, 1993; Lefort et al., 1993b), notamment parce qu’au sud, sur les données de détail, on ne perçoit plus que des réflecteurs à pendage sud sous une couverture ne dépassant jamais 2 km d’épaisseur. Nous serions là, à l’émergence du front varisque méridional (Lefort et al. 1993b).

44 J.-P. LEFORT BCREDP 17 (1993)
Cette région est caractérisée en profondeur par une croûte inférieure litée très structurée, localement interrompue par une lacune d’enregistrement. La relation nette entre chevauchements varisques à rampes plates et croûte inférieure très réfléchissante rappelle ce qui avait été noté sous la Mancellia. Ici par contre, les discontinuités crustales verticales sont absentes, nous serions hors de la zone cisaillante tardi-hercynienne. Le socle qui borde le Bassin de Parentis montre aussi quelques structures mal définies en forme de « coins », qui suggèrent l’existence possible de blocs basculés antérieurs à la formation de la structure de Parentis elle-même et donc d’une phase de distension importante intrapaléozoïque.
Au niveau du Bassin de Parentis on distingue nettement la dissymétrie du rifting initiai, les blocs basculés affectant le toit du socle étant largement plus développés au sud qu’au nord (Pinet et al., 1987). On note aussi, même à cette échelle, deux épisodes différents de remplissage sédimen- taire, perturbés par des structures halocinétiques. Au sud du Seuil des Landes, qui ne paraît recouvert que par une très fine couverture tertiaire, la région du Gouf de Cap Breton montre à nouveau de forts épaississements de sédiments récents. Sous la dépression morphologique associée à cette fosse, une discontinuité verticale importante, qui ne paraît pas résulter sismiquement du trait topographique superficiel, sépare une croûte à nombreux réflecteurs pen- tés vers le nord du socle de Parentis (Lefort et al., 1993b). Des réflecteurs profonds à pendage nord ont aussi été retrouvés sur le profil ECORS-Pyrénées (Groupe ecors-Pyrénées, 1988) où ils sont indubitablement d’âge carbonifère. Au-dessus on remarque l’avancée des premiers chevauchements pyrénéens qui affectent la couverture.
La Figure 5c résume l’ensemble de nos observations en montrant de façon simplifiée la «fabrique» sismique que l’on peut déduire des différents pointés. La croûte inférieure litée, dont l’épaisseur est à peu près constante et de l’ordre de 7 km, montre trois lacunes majeures. L’une au nord, à la hauteur du Brabant, pose indirectement le problème de la nature du réflecteur profond figuré sur le pointé sismique. Sachant que l’on observe un Moho plat sur toutes les coupes sismiques du domaine hercynien et que le réajustement isostatique de la chaîne est probablement antérieur au Mésozoïque (Bois et al., 1991), il est difficile d’admettre que le réflecteur profond puisse figurer un paléo-Moho non réajusté, antérieur à l’Hercynien. Dans notre esprit il s’agit plus probablement d’un réflecteur intramantellique localisé sous un craton sans croûte inférieure litée ainsi que cela a déjà été observé ailleurs (Stewart et al., 1986).
L’absence de croûte litée sous l’axe de la chaîne est peut-être due à l’abondance des cisaillements verticaux connus au centre du Massif Armoricain, qui découpent cette croûte en tronçons de trop petite taille pour générer des réflections claires à cette profondeur (Hirn, 1988).
Enfin, c'est à la création du Bassin de Parentis et à la remontée subséquente de Moho que l’on peut attribuer les amincissements enregistrés au droit des bordures du bassin. Le réflecteur profond qui recoupe la croûte inférieure litée au sud de ce bassin et que l’on pensait constituer la racine des nappes hercyniennes à vergence sud enregistrées sous les Pyrénées, est maintenant attribué à un multiple du toit du socle.
On remarquera que la croûte située entre la faille verticale du Gouf de Cap Breton et le dernier chevauchement hercynien localisé au nord de Parentis est, mise à part les
perturbations liées au bassin lui même, relativement pauvre en réflections internes, rappelant ainsi le socle du Brabant. Il s’agit sans aucun doute là du craton Ebro-Aquitain, recherché par les géologues (Riding, 1974) et sur lequel, tant en Espagne qu’en France, viennent mourir les nappes méridionales les plus externes de la chaîne hercynienne (Lefort et al., 1983b,c).
La divergence des réflecteurs assimilés à des chevauchements est remarquable et a déjà été notée.Cette symétrie grossière est connue depuis longtemps et a été récemment rappelée par Matte & Hirn (1988). L’ensemble de cette zone est affectée en son centre par des discontinuités verticales qui font partie de la large zone cisaillante orienté E-W qui affecte l’ensemble de la Bretagne (Gapais & Le Corre, 1980). Le point Important est qu’il ne semble pas y avoir de corrélation structurale entre les dernières nappes varisques superficielles du nord de Parentis et les nappes profondes figurées au sud; ce point sera longuement discuté lors de l’exposé concernant le « transect ».
Enfin la «fabrique» sismique particulière qui caractérise le Bassin de Parentis a été schématisée; par contre l’épaisseur des sédiments est trop faible tant dans le Bassin de Paris que sur la marge aquitaine, pour que l’on puisse, à cette échelle, donner une idée globale de l’organisation des réflecteurs.
2.3. SYNTHÈSE DES DONNÉES GÉOPHYSIQUES
Cette section (Fig. 5d) réunit toutes les informations géophysiques, autres que celles de sismique verticale ou de grand angle, collectées ou modélisées le long du profil.
Les données de sismique réfraction réunies dans le Golfe de Gascogne (Marillier et al., 1988) montrent, au sud, une stratification classique des vitesses de la croûte, tandis qu’au nord, l’absence de zonation apporte un argument supplémentaire pour considérer cette région comme un craton. On note encore, que l’épaisseur de la croûte inférieure litée est mieux définie sous les chevauchements varisques. L’amincissement crustal que l’on note sous Parentis s'est fait pour une large part aux dépends de cette croûte inférieure, ce qui prouve de façon indubitable son antériorité par rapport à la formation du bassin.
Les enregistrements de sismique réfraction réalisés en 1971 au sud de la Bretagne et qui n’avaient été que sommairement étudiés, ont donné lieu récemment à une réinterprétation et à de nouvelles modélisations (Fowler et al., 1993). Le litage de la croûte est ici très prononcé et suggère, si l’on corréle les données entre elles, un possible pendage vers le sud, en accord avec les interprétation de la sismique grand angle (bien que les valeurs des pendages ne soient pas les mêmes). Les vitesses calculées pour la croûte.inférieure litée sont homogènes avec celles qui ont été obtenues dans le Golfe de Gascogne.
On notera que la profondeur du Moho est de 40 km sous les nappes du Bassin de Paris (Hirn, 1988); c’est aussi à cette profondeur que l'on peut le suivre jusqu’au Mans en sismique grand angle. Au sud de la Bretagne cet interface se trouve à 36 km (Fowler et al., 1993), pour n’atteindre que 33 à 34 km de profondeur sous la marge aquitaine (Marillier et al., 1988). On voit donc que s’il a existé une extension locale au niveau de Parentis, (responsable d’une remontée de Moho de l’ordre de 14km), il semble qu’il s'en

BCREDP 17 (1993) IMAGE GLOBALE DE LA CROÛTE CONTINENTALE FRANÇAISE 45
soit développée une autre, de plus grande longueur d’onde, qui aurait été responsable d’un amincissement de la croûte, de l’ordre de 5 km, de part et d’autre du bassin.Il s’agit probablement là d’une des conséquences de l’ouverture du Golfe de Gascogne qui se serait ainsi faite sentir loin de la zone d’extension principale.
Plusieurs interprétations gravimétriques ont aussi été proposées le long de la coupe géophysique. Ainsi, au nord certaines modélisations ont été tentées pour visualiser le prolongement des granites cadomiens sous la couverture du Bassin de Paris (Galdeano & Guillon, 1988). Toutefois, parce que l’on avait alors attribué à ces granites une densité de 2,62, plus proche de ce que l’on mesure à propos des leucogranites sud armoricains que des granodiorites cado- miennes, d’autres modélisations seront proposées car elles sont basées sur des densités obtenues à partir de prélèvements effectués dans la Mancellia (Lefort & Vigneresse, 1993). Ces modèles montrent que les granites cadomiens s’enracinent habituellement entre et 6 et 7 km sous le niveau du sol; les profondeurs et les formes des granites sont confirmées par les données de la sismique réflexion verticale. Tous les massifs mancelliens traités montrent des caractéristiques assez homogènes, encore que celui qui est situé le plus au nord soit un peu singulier. Celui-ci, avec des densités qui peuvent varier entre 2,56 et 2,62 ne peut pas correspondre à une granodiorite classique, mais suggère plutôt l’existence de leucogranites cadomiens ou hercyniens en profondeur. Parce qu’on ignore l’âge exacte de ce granite, on ne peut affirmer avec certitude que la limite de la Mancellia s’avance aussi loin vers le nord, encore que cela soit suggéré par la sismique réflexion.
On notera les fortes densités que l’on est contraint d’introduire entre la Mancellia et le Brabant et qui à notre avis ne correspondent qu’en partie aux sédiments paléozoïques denses qui constituent la nappe de Dinant. Les principales différences d’interprétation entre ce modèle et celui déjà proposé par Galdeano & Guillon (1988) est que nous envisageons l’existence de sédiments profonds, restes de la zone rhéno-hercynienne initiale, sous la nappe de Dinant, et que nous n’excluons pas pour la Mancellia, selon l'âge du granite le plus septentrional, la possibilité d'une limite située légèrement plus au nord que celle qui a été proposée antérieurement.
L’existence possible de sédiments résiduels autochtones encore préservés au toit du Brabant est extrêmement probable; elle avait d’ailleurs aussi été suggérée par Matte & Hirn (1988). Ajoutons enfin que les limites inférieures de la Mancellia et du Brabant sont peu contraintes par la gravimétrie.
La zone sud-armoricaine, et plus particulièrement la Vendée a aussi donné lieu à modélisation, notamment au travers des formations cristallophyliennes des Essarts (Marchal, 1986). La coupe rabattue que nous présentons intercepte aussi plusieurs granites hercyniens et le cisaillement sud- armoricain (Wyns, 1985). On constate d’abord que les granites de Thouars, de Bressuire, de la Roche-sur-Yon, de Mortagne et d’Argenton sont en général enracinés à 5 ou 6 km de profondeur (Bollo & Goguel, 1946; Vigneresse, 1978) et qu’ils sont relativement légers (d = 2,59 à 2,65). Par ailleurs la modélisation précise du matériel du complexe cristallophyllien est tout à fait compatible avec l’existence d’écailles en profondeur.Remarquons toutefois que l’on est obligé, du point de vue des densités, de découper ces écailles en structures verticales, ce qui est parfaitement cohérent avec l’observation de surface selon laquelle les
anciennes structures tangentielles seraient profondément affectées par les jeux décrochants des failles associées au cisaillement sud-armoricain.
La modélisation détaillée des structures très profondes n’est généralement pas possible, toutefois l’inversion du champ gravimétrique de basse fréquence et le filtrage des données permet d’avoir une idée sur la répartition des masses en profondeur même si on ignore leur géométrie précise (Marchal, 1986).C’est ainsi que nous avons pu localiser sommairement un corps lourd de densité 3,2 au- dessus du Moho sismique au N-E de La Rochelle. Cet objet serait à l’origine de l’axe gravimétrique lourd orienté NW-SE connu dans la région et qui a parfois été considéré comme un témoin de l’ancienne suture océanique sud-armoricaine (Lefort & Poulpiquet, 1993). Les mêmes techniques ont aussi permis de confirmer l’amincissement de croûte de part et d’autre du Bassin de Parentis (Marchal, 1986).
Les modélisations magnétique sont plus rares. Certaines sont anciennes et montrent par exemple à Angers, l’existence de « filons » de grès à magnétite probablement situés dans l’Ordovicien (Weber, 1972). Un peu plus au sud, l’anomalie magnétique associée au corps lourd de la Rochelle a été étudiée en détail (Poulpiquet & Lefort, 1989), elle est clairement liée à des roches basiques caractérisées par une aimantation rémanente nette, à inclinaison sud, qui suggère un âge Ordovico-Silurien pour le matériel situé en profondeur. Cette conclusion est intéressante car l’âge de ce corps, que l’on a souvent assimilé, ainsi que cela a été dit plus haut, à la suture océanique sud-armoricaine, serait alors tout à fait compatible avec l’âge de l’océan que l’on est contraint d’envisager, au sud de la Bretagne, pour expliquer le magmatisme et le volcanisme d’âge paléozoïque moyen (Lefort, 1979). De fait le modèle magnétique indique l’existence de deux « filons » à pendage NE, cohérent avec le sens de plongement de l’ancienne subduction sud-armoricaine (Poulpiquet & Lefort, 1989).
Le graben de Saintes/Cognac, responsable de la désorganisation des réflecteurs sismiques hercyniens plats enregistrés par la technique du grand angle, est localisé entre ces deux corps ultrabasiques. On sait que ce graben qui préserve du Namurien schistosé (Le Pochât, 1984) est régulièrement réactivé, car il borde la zone d’OIéron caractérisée par sa séismicité actuelle. La petite anomalie du Médoc située en mer montre des caractéristiques magnétiques identiques à celles de Saintes, ce qui suggère une origine commune avec les filons décrits à terre. Dans notre esprit le corps lourd et profond de La Rochelle, les filons pentés de Saintes et l'intrusion tabulaire du Médoc, font partie du même édifice structural et visualisent la suture sud-armoricaine mise en place lors de la collision ligéro- acadienne (Lefort, 1989). Les nombreuses évidences en faveur de sa mobilisation carbonifère seront évoquées plus loin.
L’anomalie magnétique du Bassin de Paris est connue depuis longtemps. Bien que de forte amplitude, sa principale caractéristique est de ne causer qu’une faible perturbation du champ gravimétrique (Galdeano & Guillon, 1988). Plusieurs hypothèses ont été suggérées pour expliquer son origine (Autran et al., 1986), elles font appel à l’existence d’un « rift », d’une suture ophiolitique ou à la présence d’une formation de quartzites ferrugineux. Les données récentes réunies au sud du Bassin de Paris (Autran & Chantraine, 1988) n’apportent aucune certitude tant pour ce qui est de son âge que de sa genèse. Le seul point qui paraisse

46 J.-P. LEFORT BCREDP 17 (1993)
acquis est que le corps magnétique semble de faible épaisseur et qu’il montre une forme allongée,ce qui, avec l’aide des données sismiques, suggère, tout au moins au niveau de la coupe, la possibilité d’un laminage entre des chevauchements varisques à vergence nord.
Si l’on s’en tient en tous cas aux seules données géophysiques, l’hypothèse qui semble la plus raisonnable est celle d'un corps d’origine sédimentaire ou volcano-sédimen- taire. Il semble étonnant que les nombreux auteurs qui se sont penchés sur son interprétation aient admis implicitement qu’une suture de plaque devait nécessairement être scellée par des roches basiques ou ultrabasiques. Il est pourtant des sutures parfaitement documentées qui, pour des raisons de degré de suturation, de niveau d’érosion ou de composition minéralogique, ne montrent aucune expression en champ potentiel (Lefort, 1989). C’est par exemple le cas dans le Golfe du Maine, aux Etats-Unis, où la seule anomalie magnétique cartographiable est celle produite par l’arc volcanique associé à la suture (Lefort et al., 1993a). S’il en était ainsi sous le Bassin de Paris, l’absence d’anomalie gravimétrique positive concomitante s’expliquerait par le fait que le matériel volcanique montre généralement des densités inférieures à celle du matériel océanique.
La caractérisation de la suture sud armoricaine ne pose pas ce type de problème puisque le corps lourd localisé en base de croûte est probablement trop profond pour générer une anomalie magnétique, compte-tenu de la température à laquelle il se trouve. Par ailleurs, les corps responsables des anomalies magnétiques superficielles ont une masse trop faible pour provoquer des anomalies gra- vimétriques conséquentes. De plus, parce que l’on connaît ici, grâce aux données géologiques, le sens du pendage de la subduction initiale et la place de l’arc volcanique, aucune confusion n’est possible dans la localisation de l’arc et de la suture.
Les zones de séismicité naturelle les plus significatives ont enfin été figurées au-dessus des modélisations géophysiques. La plus importante est située au niveau de la suture sud-armoricaine (Delhaye, 1976; Veinante-Delhaye & Santoire, 1980). L’analyse des mécanismes au foyer montre qu’il existe une distribution planaire des séismes et que ce plan, situé au voisinage de nie d’OIéron, a un pendage NE de l’ordre de 70 / 80°. Sa trace est parallèle à l’anomalie du Médoc et orientée N 115°. Ce pendage est encore le même que celui qui a été enregistré localement à la hauteur des épontes du graben de Saintes/Cognac. Le plan en question se superpose ainsi pratiquement à l’un des corps magnétiques déjà décrits. Il est extrêmement probable que cette discontinuité sismique réutilise l’ancienne suture armoricaine ou l’une des failles parallèles qui lui sont associées. La profondeur à laquelle on peut suivre les séismes montre clairement qu’il s'agit ici d’un accident d’échelle crustale. La réactivation actuelle de certaines sutures fossiles et la localisation de nombreux séismes en bordure des anciennes limites de plaque est un phénomène connu (Kane et al.,1972); il est attribué à la facile remobilisation du matériel serpentinisé qui est généralement associé aux ophiolites cicatricielles.
Notons qu’il n’existe pas de réactivation identique à la hauteur de la suture suspectée sous le Bassin de Paris, encore que cela puisse s'expliquer par les pendages très plats enregistrés en sismique réflexion verticale. Les résultats de l’étude séismologique réalisée entre Cholet et Thouarcé, montrent que le cisaillement sud-armoricain est
toujours actif et que ses jeux sont dextres. La faible profondeur à laquelle on enregistre les séismes tout au long de son parcours pourrait constituer un argument pour ne pas prolonger les failles verticales tardi-hercyniennes trop profondément dans la croûte.
3. — LE « TRANSECT »
Cette coupe (Fig. 5e) ne représente pas une coupe géologique au sens propre du terme. D’abord parce qu’elle montre le résultat des corrélations que l’on peut établir entre les données géologiques de surface et la modélisation des diverses mesures géophysiques profondes, mais aussi parce qu’elles soulignent les grandes unités structurales reconnues lors de ces corrélations, et non pas l’âge des terrains. C’est ainsi que l’on a distingué : les zones orogéniques, les cratons, les restes de croûte océanique, les anciennes marges continentales, les « rifts » et les arcs magmatiques.
La caractéristique la plus évidente de ce « transect » est de montrer une croûte plus épaisse au nord qu’au sud. Si l’on admet que le réajustement isostatique qui a suivi l'orogenèse hercynienne n’avait pas de raison de préserver localement des zones épaissies sous la chaîne, force est de conclure que l’amincissement noté au sud est d’âge mésozoïque ou cénozoïque. Au niveau du Bassin de Parentis, cet amincissement est patent, mais il existe d’autres arguments montrant que la formation du bassin pourrait avoir été précédée par un bombement de grande longueur d’onde affectant la croûte hercynienne au moins jusque sous le Médoc (et donc les zones situées au sud de La Rochelle sur le « transect »). On sait en effet, qu’au nord du bassin d’Aquitaine, les nappes hercyniennes les plus externes ne sont pas, comme on pourrait s’y attendre, les moins métamorphiques (Lefort et al., 1993 b,c). Les nappes situées le plus au nord sont de fait les plus superficielles (Paris et al., 1988; Lefort et al., 1993 b,c). Cette anomalie s’explique aisément si l’on imagine l’existence d’une intumescence lithosphérique (peut être d'âge triassique), qui aurait provoqué une érosion décroissante des terrains entre Parentis et le Médoc. Cette érosion (que l’on retrouve probablement aussi au sud du Golfe), aurait été à l’origine de l’inversion apparente de la zonation du métamorphisme. La diminution d’épaisseur de la croûte résiduelle au droit du Golfe de Gascogne ne serait donc probablement pas contemporaine de celle du bassin de Parentis qui montre une histoire plus complexe et globalement plus récente.
On sait grâce aux profils de sismique réflexion verticale, que la croûte hercynienne ouest-européenne est caractérisée par une croûte inférieure litée bien développée; le « transect » montre un phénomène identique. Cette croûte inférieure laminée s’est probablement développée lors de l’écroulement (peut-être Permien) de la chaîne hercynienne (Rey, 1992). Cette croûte est en tous cas antérieure à l’amincissement mésozoïque qui à accompagné la formation du Bassin de Parentis (Marillier et al., 1988). On a déjà remarqué qu’elle était peu développée ou absente sous les cratons du Brabant et Ebro-Aquitain, ce qui est cohérent avec la notion d’écroulement de chaîne, puisque ceux-ci n’étaient que peu ou pas recouverts par les nappes varis-

BCREDP 17 (1993) IMAGE GLOBALE DE LA CROÛTE CONTINENTALE FRANÇAISE 47
ques, et que l’écroulement a donc été minimal à ce niveau. Cet effondrement ne semble pas avoir été symétrique : on note en effet que la divergence de la chaîne, déjà évoquée, admet un axe différent de part et d’autre de la croûte inférieure litée. L’approfondissement du Moho, net à la hauteur de La Flèche (et qui pourrait correspondre à un résidu de racine de la chaîne, Agarwal & Lefort, 1993) est en effet décalé par rapport à l’éventail des chevauchements superficiels.
Sachant d’une part que l’absence de croûte inférieure litée sous le Brabant plaide en faveur d’une absence de découplage croûte-manteau, mais que les décalages horizontaux enregistrés de part et d’autre de cette croûte sous la Bretagne constituent plutôt des arguments en sa faveur, il faudrait admettre des processus complexes de transfert de matière pour passer d’une zone à l’autre. Nous ne les aborderons pas tant que nous n’aurons pas certitude qu’il ne s’agit pas là de problèmes liés à la définition des réflecteurs en sismique profonde.
Des structures internes apparaissent parfois dans les cratons résiduels recoupés par le profil. Les « fantômes » de bloc basculés pointés en profondeur, de part et d’autre du Bassin de Parentis (Lefort et al., 1993b) montrent en général des regards vers le nord. Ceci laisse penser que le moteur principal de l’extension auquel ils sont liés se trouvait situé dans cette direction. Il semble raisonnable d’attribuer l'origine de ces blocs basculés possibles à l'ouverture de l’océan sud-armoricain (Lefort, 1979). On rappellera que l’existence de cet océan siluro-dévonien est démontrée par les effets de la subduction anté-ligérienne enregistrés au sud de la Bretagne (Cogné & Lefort, 1985). Ces blocs sont actuellement alignés, à une centaine de kilomètres de la suture sud-armoricaine, ce qui renforce notre interprétation. Ils n’ont pu être représentés en détail sur la coupe faute de pouvoir identifier les bassins «syn- rifts» auxquels ils sont généralement associés. Seul le sommet des blocs basculés (dont l’un est indubitable) a été figuré.
Au sud du bloc du Brabant, que l’on peut considérer, au regard de sa forme, comme une ancienne marge continentale passive, aucune information ne laisse supposer l'existence de blocs basculés sous le Paléozoïque sédimen- taire para-autochtone (Cazes et al., 1988). A moins que les quelques pendages nord Inclinés à 45° que l’on y trouve ne représentent, eux aussi, que des « fantômes » de blocs basculés, ce qui serait cohérent avec la présence d’ une marge passive. S’il en est ainsi, le para-autochtone supposé du Brabant n’incluerait peut-être pas le Paléozoïque inférieur comme cela a été suggéré par les auteurs. En tous cas, on ne peut soutenir en même temps que la marge Inactive du Brabant s'interrompt au niveau de Montdidier (Cazes et al., 1988) et que la « suture » septentrionale de la chaîne varisque s’enracine au SE de Dreux, à 300 km de là (Matte & Hirn, 1988), à moins de faire intervenir un bloc intermédiaire entre ces deux régions.
Si l’on prend en compte, à la fois, la géométrie de la partie méridionale du socle du Brabant qui suggère l'existence d’une marge fossile, et les résultats de la modélisation gravimétrique qui plaident en faveur d’une fosse paléozoïque au sud de celui-ci (Lefort & Vigneresse, 1993), il faut imaginer une séparation nette entre Brabant et Mancellia.
Le bloc mancellian, peut-être limité au nord et au sud par des sutures, montre en tous cas un comportement sismique très différent de celui du Brabant, puisqu’il est affecté
dans toute sa masse par des chevauchements varisques. Il n’y a malheureusement aucun argument décisif pour savoir s’il a existé ou non de la croûte océanique entre les blocs du Brabant et de la Mancellia, même si l’on envisage que l’anomalie gravimétrique positive d’origine profonde qui se situe au sud du Brabant, tire son origine, à la fois d’une fosse paléozoïque (origine possible du synclinorium de Dinant), et d’un reste de matériel ultrabasique profond.
La suture sud-armoricaine n’apparaît pas, comme le corps magnétique à l'origine de l’anomalie du Bassin de Paris, transposée par les chevauchements hercyniens, mais découpée en tronçons par ceux-ci. La profondeur à laquelle s'effectue le premier tronçonnement n’est pas très assurée puisque l’on doit, pour corréler la sismique grand angle enregistrée au niveau de La Rochelle et les nappes définies sous la marge sud armoricaine, traverser une lacune d’information large de 60 km. Le décalottage des corps magnétiques de Saintes/Cognac par un chevauchement et leur transport vers le sud est par contre parfaitement contrôlé par le magnétisme (l’anomalie du Médoc et celle de Saintes/Cognac ne peuvent être modélisées qu'en terme d’aimantation rémanente compte-tenu de leurs pentes) et par le résultat des forages. On sait en effet (Poulpiquet & Lefort, 1989), que la faille de la Garonne (expression superficielle de ce chevauchement) provoque à terre, dans le sondage d’Avensac, la superposition de l’Ordovicien moyen sur du Carbonifère (Paris et al., 1988) et dans celui de Clairac de nombreux plans de cisaillement horizontaux entre 2100 et 2 400 m de profondeur.
Le déplacement que l’on constate, dans notre interprétation, entre la base et le sommet de la suture sud-armori- caine et que l’on peut estimer à 150 km, suppose, comparé à la flèche totale de la vergence sud-armoricaine, un raccourcissement de l’ordre de 50 %. Il faut néanmoins noter que ce raccourcissement intègre peut-être, à la fois certains effets de la collision ligérienne (dévonienne) et ceux de l’orogénèse hercynienne.La divergence de l’orogène déjà soupçonnée est prouvée pour la première fois sur cette coupe grâce aux corrélations précises que l’on peut faire entre chevauchements de surface et réflecteurs sismiques. On notera que l'on ne dispose ainsi que d’une image tardive de l’orogenèse varisque et que mis à part les sutures, les structures antérieures aux chevauchements divergents sont toujours oblitérées. La symétrie générale de l’édifice que l’on constate en profondeur est souvent perturbée en surface par l’existence des massifs granitiques.
Ceux-ci ont à l’origine, notamment au sud de la Bretagne, de nombreux déversements ou chevauchement antithétiques locaux. Les figures les plus intéressantes de ce point de vue sont les « entonnoirs » qui entourent les granites cadomiens de la Mancellia (Lefort & Vigneresse, 1993). Ils montrent par leur géométrie en « pop up » que le mode de raccourcissement qui affecte ce socle est différent là où les terrains sont les plus cratonisés. La tectonique tangentielle enregistrée en profondeur est remplacée en surface par des échappements vers le haut. Il s'agit bien là, en tous cas, de structures tectoniques, les granites ne montrant habituellement pas en sismique de contours net par rapport à leur encaissant (Stewart et al., 1986).
L’image générale des deux systèmes varisques déversés, clairement allochtones et symétriques sur des cratons structurés, est perturbée par la présence des chevauchements hercyniens à vergence sud sous le front des Pyrénées actuelles. Parce que ces chevauchements méridionaux

48 J.-P. LEFORT BCREDP 17 (1993)
sont profondément enracinés, l’hypothèse d’une corrélation avec la nappe superficielle reconnue sur la marge sud- armoricaine, n’est pas envisageable, d’autant plus que ces nappes profondes semblent interrompues par une faille verticale au sud du Seuil des Landes. Sachant que sous l’Aquitaine l’axe de l’orogène varisque est orienté selon une direction N 130° (Lefort et al., 1993b) et que la faille verticale du Gouf de Cap Breton paraît prolonger vers l’ouest la Faille nord-pyrénéenne tardi-hercynienne orientée d’E-W (Mattauer & Seguret, 1971), on peut imaginer que la structuration varisque de la marge nord - espagnole correspond à une zone plus interne de la chaîne, transportée tardivement à la suite de jeux dextres le long de cette faille.
Au front varisque septentrional, représenté par la Faille du Midi correspond donc un front varisque méridional qui surgit au nord du Bassin de Parentis. Il convient néanmoins de garder à l’esprit qu’il s'agit là de limites d’érosion, puisque l’on sait qu'il existe en Irlande, au nord du front varisque, des klippes résiduelles jusqu’à Dublin (Max & Lefort,1984), et qu’au sud du front varisque méridional, à la hauteur du forage Albatros, du Paléozoique supérieur (?) schis- tosé a été prélevé, prouvant ainsi que ce front s’avançait légèrement plus au sud sur le craton aquitain.
L’ensemble de l’édifice hercynien apparaît recoupé, notamment vers son centre, par de nombreuses failles verticales, tardi-hercyniennes qui juxtaposent des segments orogéniques initialement éloignés les uns des autres. Cette fracturation ne désorganise cependant pas complètement la divergence initiale car la trace des failles décrochantes est pratiquement parallèle à l’axe de l’orogène. Bien que l’effet de ce tronçonnement tectonique soit net sur les données de sismique grand angle, on ne peut affirmer pour des raisons de méthodes que toutes ces failles atteignent la croûte inférieure.
Nous avons déjà donné l’exemple du cisaillement sud- amoricain, qui d’après ses séismes, paraît relativement superficiel. A l’inverse l'étude détaillée de la faille du Bray (Cazes et al., 1988) montre que certains cisaillements peuvent affecter le Moho et la croûte inférieure litée. Parce que l’on sait que la majeure partie des failles verticales sont d'âge tardi-hercynien et que la croûte inférieure litée date de l’effondrement, probablement permien, de la chaîne, on ne devrait pas trouver de structures verticales recoupant l’interface croûte-manteau. Force est donc d’admettre que certaines failles verticales profondes sont le résultat de rejeux mésozoïques ou cénozoïques. L’Eocène verticalisé de l’île de Wight, dont le basculement a été contrôlé à I’ est par des failles parallèles à la faille du Bray (Lefort, 1989) prouve la réalité de ces rejeux.
Il est enfin un exemple de structure profonde qui rappelle ce que Meissner (1986) a décrit comme des « crocodiles » tectoniques; il est localisé à la limite de l’ancienne marge du Brabant et dessine une forme divergente à axe horizontal. Meissner a considéré que la géométrie de ces réflecteurs était un argument en faveur d’un mécanisme d’imbrication de croûte, ce qui est vraisemblable puisqu’ils sont souvent localisés à la limite de cratons anciens. On peut cependant aussi se demander s’il ne s’agit pas là de niveaux de décollement antithétiques, développés dans l’autochtone sous l’action des chevauchements superficiels; de telles structures sont d’ailleurs visibles sur les données de détail au nord de Parentis. La limite entre ces deux concepts, qui sont mécaniquement très proches, dépend en fin de compte de la quantité de déplacement mesurée au niveau des che
vauchements profonds. Les images sismiques sont malheureusement trop frustes pour que l’on puisse quantifier les déplacements en question et choisir entre ces deux explications.
L’histoire sommaire du Bassin de Parentis a déjà été évoquée. Il ne semble pas que les modèles actuellement proposés pour expliquer son développement soient entièrement satisfaisants et il est très possible qu’une composante cisaillante importante soit venu compliquer au Trias la phase d’extension initiale (Curnelle, 1983).
Selon le tracé de notre coupe, les Bassins de Paris et d’Aquitaine n’ont en tous cas rien d’une morphologie de bassin mais apparaissent plutôt comme l’extension des marges continentales qui les bordent à I’ ouest.
Le chevauchement frontal des Pyrénées est, quant à lui, trop isolé de son contexte pour que nous puissions commenter de façon utile son mode de mise en place.
4 CONCLUSIONS ET DIAGRAMME ÉVÉNEMENTIEL ESPACE-TEMPS
Le résumé de l’évolution cinématique des terrains traversés par le « transect » tiendra lieu de conclusion (Fig. 6).Cette reconstitution devrait permettre d’imaginer dans le temps et en trois dimensions, l’histoire des séparations et des collages qui ont affecté la croûte française depuis l’essaimage gondwanien jusqu’à la collision pyrénéenne.
Du Précambrien supérieur à l’Ordovicien moyen, les régions situées entre les Pyrénées et le Brabant faisaient partie du continent gondwanien (Perroud et al, 1984), elles sont aujourd’hui caractérisées par un socle cadomien que l’on appelle encore panafricain en Afrique (Cogné & Wright, 1980). On ignore encore en partie l’origine des déformations que l’on y enregistre, leur climax se situe vers 620 Ma. Ces déformations pourraient résulter de fermetures localisées de part et d’autre d’océans de petite taille de type Mer Rouge. De cette époque nous restent la Mancellia avec ses granites cadomiens et les cratons du Brabant et d’Aquitaine. Ailleurs le socle a été trop transformé par les orogenèses phané- rozoïques pour que l’on puisse encore en discerner l’organisation originelle. Le métamorphisme y est généralement de bas degré.
Pendant le Cambrien des volcanites acides accompagnent les mouvements de distension qui se sont fait sentir à la périphérie du Gondwana.
L’individualisation de la microplaque Armorica qui englobe tous les terrains que nous avons décrits et qui est caractérisée par de larges épandages gréseux, pourrait se situer aux environs de l’Ordovicien supérieur (Noblet & Lefort, 1989).Cet éloignement du Gondwana a pour effet d’ouvrir l’océan sud-armoricain entre la Bretagne et l’Aquitaine (Lefort, 1979). Il est possible que la séparation que l’on a envisagé entre Brabant et Mancellia, si elle est réelle,date de cette époque.
L’histoire de la partie française du bloc ardennais qui pourrait garder la trace d’une collision calédonienne est mal connue. On sait par contre que la fermeture de l’océan sud- armoricain lors du Dévonien moyen (responsable de l’oro

BCREDP 17 (1993) IMAGE GLOBALE DE LA CROÛTE CONTINENTALE FRANÇAISE 49
genèse ligérienne ou acadienne) résulte d’une subduction vers le N-E.Cette subduction qui s’est déroulée au cours du Silurien et du Dévonien inférieur, comme en témoignent les volcanites sud-armoricaines affleurantes et submergées et les déformations d’âge dévonien moyen à supérieur enregistrées en Vendée et en Bretagne (Cogné & Lefort, 1985), a laissé une cicatrice probablement ophiolitique au sud du Massif Armoricain.
A partir de cette époque, la région qui nous intéresse va subir une compression progressive du sud vers le nord.Celle-ci va d’abord fermer la zone océanisée dont les traces ont été retrouvées à Couy au sud du Bassin de Paris (cette zone n’est pas recoupée par le profil), et peut-être rapprocher la Mancellia du Brabant. Il est difficile d'imaginer les rapports qui pouvaient exister entre cet zone océanisée et l’océan sud-armoricain. Pour des raisons de cohérence régionale, de chronologie et de zonation tectonique, nous pensons que cette zone océanisée représentait un bassin arrière-arc dépendant de l’océan sud-armoricain situé plus au sud. Dans ce schéma l’arc des Essarts, recoupé par le « transect », séparait donc l’océan sud-armoricain de la distension localisée au sud du Bassin de Paris.
Ce mouvement va se prolonger pendant tout le Carbonifère, induire un état de contrainte paroxismique et développer des déformations en mode hypercollisionnel. C’est de cette époque que datent les chevauchements hercyniens divergents précédemment décrits. Ce sont les déformations intraplaques varisques qui vont segmenter et transposer les sutures déjà cicatrisées.
Au Carbonifère supérieur l’état de contraintes sera tel, que le raccourcissement ne pourra plus se faire qu'en développant un régime d'échappement latéral avec la création, en Bretagne,de couloirs de cisaillement orientés E-W. C’est selon nous, à cette époque, qu’une partie plus interne de l’orogène a été transportée, par coulissage dextre, des régions situées à l'est de la Montagne Noire vers le Pays Basque (Lefort et al., 1993b).
L’évolution de l’ensemble du système varisque selon un modèle de type « flower structure » ne pourra être démontrée que lorsqu’on pourra disposer de données sismiques fines pour l'ensemble de la lithosphère.
Le début de la période pangéenne verra perdurer cet assemblage bien que les reliefs créés au Carbonifère commencent alors à s’effondrer selon un processus gravi- taire (Rey, 1992), cet état va durer pendant tout le Permien. L’effondrement permien est probablement à l’origine du litage de la croûte inférieure; il paraît aussi contemporain du réajustement isostatique de la chaîne. Le Moho subhorizontal tel qu’il a été dessiné sur la coupe finale daterait donc du Permo-Trias (Bois et al., 1989).
Cette période de quiétude orogénique s’achèvera au Trias par les prémices de l’ouverture du Golfe de Gascogne qui semblent avoir débutés par une phase d'intumescence entre La Rochelle et les Pyrénées. Suivront deux phases de « rifting » au Trias supérieur et au Crétacé inférieur. L’ouverture du Golfe de Gascogne et l’individualisation effective de la plaque ibérique vers le Crétacé supérieur (Williams, 1975) vont accélérer l’évolution du Bassin de Parentis (Cur- nelle, 1984). Ailleurs la transgression mésozoique recouvrira les zones les plus errodées du Massif Armoricain et notamment l’ouest du Bassin Parisien.
L’orogenèse pyrénéenne à la fin du Mésozoïque et au début du Tertiaire résultera de la fermeture partielle du Golfe de Gascogne (Le Pichon et al., 1978) et sera à l’origine des chevauchements enregistrés au sud du profil. Il est probable que cette époque est aussi celle de la réactivation de nombreuses failles tardi-hercyniennes verticales qui vont alors affecter la croûte inférieure litée.
L’histoire du Tertiaire terminal et du Quaternaire montre qu’il va se développer des structures mineures aux dépends des dépôts sédimentaires précédents; leurs tailles sont telles qu’elles ne sont toutefois pas discernables à l’échelle du « transect ».

Légende Cartes et coupe
Quaternaire
Mio-Pliocène
Oligocène
Eocène
Crétacé supérieur
Crétacé inférieur
Jurassique
Permo-Trias
Carbonifère
Dévonien
Silurien
Ordovicien
Cambrien
Protérozoïque supérieur Schistes verts et amphibolitesRhyolite
Granites synorogéniques
Roches basiques
Coupe interprétativeZone orogénique Plateau continental
Socle cratonique Rift
Socle océanique Arc magmatique
0I--------------
75--------------------- 1 I L
150 km
M
CDV—
-t—*i_0
CD3g'oNoC/3
-CD
œoo
CO
Figure 2
Découpage stratigraphique et structural utilisé dans les Figures 1, 3a, 5a et 5e. Stratigraphie and structural subdivisions used for Figures 1, 3a, 5a and 5e.

Figure 3 Cartes.
a : synthèse des données géologiques de part et d’autre du profil Géoscience; b : gravimétrique simplifiée montrant les valeurs du champ de part et d'autre du profil Géoscience. (Carte dessinée avec la collaboration de J.L. Vigneresse). Echelle 1/1 500 000.
Maps, a : geological synthesis on both sides of the Geoscience transect; b : smoothed gravity map on both sides of the Geoscience transect, (Compiled with the cooperation of J.L Vigneresse). Scale 1/1 500 000.

a) Géologie
b) Gravimétrie
Failles' ! récemment reconnues sur le terrain
nT, mGal, m W/m

Figure 4 Cartes.
magnétique montrant les valeurs du champ de part et d’autre du profil Géosciences; b : flux de chaleur le long du profil Géoscience, (Carte dessinée avec la collaboration de J.L. Vigneresse). Echelle 1/1 500 000.
Maps, a : Magnetic map on both sides of the Geoscience transect; b : Heat flow data on both sides of the Geoscience transect. (Compiled with the cooperation of J.L Vigneresse). Scale 1/1 500 000.

0°
Alençon
a) Magnétisme
Le Mans EvreuxLa RochelleIle d'OIéron
Amiens/»Beauvais
hartres
Versailles
b) Flux de chaleur
nT, mGal, m W/m1

Figure 5 Coupes.
a : géologique au travers de l’est du Massif Armoricain et des bassins de Paris et d’Aquitaine.(Entre Longny et La Rochelle la coupe a été établie avec l’aide de P. Bouton, R. Brossé, M. Colchen, C. Le Corre, G. Mary, P. Meidon et D. Poncet); b : pointé sismique synthétique intégrant les données de la sismique réflexion verticale migrée et les enregistrements de sismiques grand angle (au centre); c : «fa
brique» sismique. Echelle 1/1 500 000.Sections : a : geological section across the easternmost part of Massif Armoricain and Paris and Aquitaine Basins. (Between Longny and
La Rochelle geological data were provided by P. Bouton, R. Brossé, M. Colchen, C. Le Corre, G. Mary, P. Meidon and D. Poncet); b : line drawing incorporating migrated vertical and wide angle seismic reflection data (centre); c : seismic fabric. Scale 1/1 500 000.

a) Coupe géologique
plateau continentalPLA CANTABRIQUE
Golto de Biscaya
SEUIL DES LANDESBASSIN DE PARENTIS
Pelican Pingouin Frégate Ibis
PLATEAU CONTINENTAL
Albatros
P
BAS-BOCAGE HAUT-BOCAGE

Figure 5 (suite)Coupes.
d : interprétations géophysiques; e ; transect. Echelle 1/1 500 000. Sections, d : geophysical interpretations; e : transect. Scale 1/1 500 000.

d) Interprétations géophysiquesMASSIF ARMORICAIN
e) Transect
Ceinture pyrénéenne
Plateau continental cantabrique
Avant-pays hercynien aquitain
bassin de parentis
Zone hercynienne méridionale
plateau continental aquitain GRABEN DE SAINTE-COGNAC
BAS-BOCAGE
Zone hercynienne centrale
HAUT-BOCAGE
Ceinture cadomienne
BASSIN DE LAVAL COEVRONS MANCELLIA
Zone hercynienne septentrionale
BASSIN DE PARIS
Avant-pays hercynien du Brabant
Seuil des Landes
ARDENNES

BCREDP 17 (1993) IMAGE GLOBALE DE LA CROÛTE CONTINENTALE FRANÇAISE 51
□ Plaque armoricaine
□ Plaque ibérique
paléozoïque
Bordure nord du Gondwana
Plaque ibérique
■ Plaque Eurasie
Pangée
rifting
suture
absencede sédimentation
sel
roches volcaniques.
sédimentation quasi continue
plissements
plissements et métamorphisme
plutons
Figure 6
Diagramme événementiel espace-temps montrant l’évolution de la croûte continentale traversée par le transect. Time-space diagram of the French crust along the transect.
5. — REFERENCES
Agarwal, B.N.P. & Lefort, J.P. (1993). — Gravity evidence for remnant rooting in the variscan orogen (en préparation).
Autran, A., Castaing, Ch., Debeglia, N„ Guillen A., & Weber, Ch. (1986). — Nouvelles contraintes géophysiques et géodynamiques pour l’interprétation de l’anomalie magnétique du Bassin de Paris : hypothèse d’un rift paléozoïque refermé au Carbonifère. — Bull. Soc. géol. France, 8, 2, 125-141.
Autran, A., & Chantraine, J. (1988). — L’anomalie du Bassin de Paris et le sondage de Sancerre-Couy. — Géologie Profonde de la France. — Doc. Bur. Rech. géol. min., 137, 253-270.
Bois, Ch., Pinet, B. & Roure, F. (1989). — Dating lower crustal features in France and adjacent areas from deep seismic profiles. — In : Mereu, R.F., Muller, S. & Fountain, D.M., (eds.) : Properties of earth’s lower crust — Geo- phys, Monogr. Am. Geophys. Un., 51, 17-31.
Bois, Ch., Cazes, M. Gariel, O., Lefort, J.P, Le Gall, B., Pinet, B., & Sibuet, J.C. (1991). — Principaux apports scientifiques des campagnes SWAT et WAM à la géologie de la mer Celtique, de la Manche et de la marge Atlantique. — In : Etude de croûte terrestre par sismique profonde, SWAT et WAM. — Soc. géol. France, Mém. 159, 185-217.
Bollo, R. & Goguel, J. (1946). — Atlas de gravimétrie. Recueil d’abaques pour l’interprétation. — Rapport Bur. Rech. géol. min, (inédit).
Bureau de Recherches Géologiques et Minières (brgm) (1968). — Carte géologique de la France à l’échelle du 1/1000 000, 5e édition.
Bureau de Recherches Géologiques et Minières (brgm) (1971). — Carte magnétique de la France à l’échelle du 1/1000 000, Ve édition.
Bureau de Recherches Géologiques et Minières (brgm) (1975). — Carte gravimétrique de la France à l’échelle du 1/1000 000, (Anomalies de Bouguer), 1re édition.
Cazes, M., Mascle, R. & Raoult, J.F. (1988). — Interprétation de la vibrosismique réflexion. — In : Etude de la croûte terrestre par sismique profonde. — Technip, Paris,260 pp.
Cazes, M. & Toreilles, G. (1988). — Etude de la croûte terrestre par sismique profonde — Profil Nord de la France. — Technip, Paris, 260 pp.
Cogné, J. & Lefort, J.P. (1985). — The ligerian orogeny : a proto-variscan event, related to the Siluro-Devonian evolution of the Thetys I Ocean. — In : Gee, D. & Sturt, B., (eds.) : The Caledonide orogene. — Wiley-Chichester, 1185-1193.
Cogné, J. & Wright, A.E. (1980). — L’orogène Cadomien. — Bur. Rech. géol. min., Mém. 108, 29-55.
Curnelle, R. (1983). — Evolution structuro-sédimentaire du Trias et de l'infra-Lias d’Aquitaine. — Bull. Centre Rech. Explor.-Prod. Elf Aquitaine, 7, 1, 69-99.
Curnelle, R. (1984). — Rapport d’implantation du profil ECORS Golfe de Gascogne. — Rapport interne Elf Aquitaine, 16 pp.
Delhaye, A. (1976). — Etude de la sismicité récente de la région d'OIéron. — Thèse 3e cycle, Univ. Paris VI, 61 pp.
Fowler, C.M.R., Sapin, M. & Ansorge, J. (1993). — Crustal structure of N.W. France from seismic refraction experimentation. — Tectonophysics (soumis).
Galdeano, A., & Guillon, J.C. (1988). — Interprétation des données magnétiques et gravimétriques. — In : Etude de la croûte terrestre par sismique profonde, profil Nord de la France. — Technip., Paris, 127-140.
Gapais, D. & Le Corre C. (1980). — Is the Hercynian belt of Brittany a major shear zone ?. — Nature, 288, 574-575.
Godard, G. (1984). — Lambeaux probables d’un croûte océanique subductée : les éclogites de Vendée (Massif Armoricain). — Thèse 3e cycle, Univ. Nantes, 153 pp.
Groupe ecors Pyrénées (1988). — The ecors deep reflection seismic survey across the Pyrénées. — Nature, 331, 508- 511.

52 J.-P. LEFORT BCREDP 17 (1993)
Hirn, A. (1988). — Les opérations de sismique grand angle. — In : Etude de la croûte terrestre par sismique profonde. — Technip, Paris, 109-126.
Kane, M.F., Yellin, M.J., Bell, K.G. & Zietz, I. (1972). — Gravity and magnetic evidence of lithology and structures in the Gulf of Maine region. — U.S. Geol. Surv. Prof. Pap. 726B, 1-22.
Lefort, J.P. (1979). — Iberian-Armorican Arc and Hercynian orogeny in Western Europe. — Geology, 7, 384-388.
Lefort, J.P. (1989). — Basement correlations across the North Atlantic. — Springer-Verlag, Berlin, 150 pp.
Lefort, J.P, Bouton, R, Brosse, R., Colchen, M., Lecorre, C., Legall, J., Meidon, R, & Poncet, P. (1992). — The French global Geosciences Transect. — Congrès Géologique de Kyoto, Il 6/9, n°6231, 460.
Lefort, J.P. & Poulpiquet, J. (1993). — Correlations between ECORS-Gascogne and EcoRS-Nord de la France seismic lines across the South Armorican suture. — Rapport ecors- Gascogne, — Mém. Soc. géol. France (sous presse).
Lefort, J.P, Ben Salmia, M. & Miller, H.G. (1993a). — Age and mode of emplacement of the Collector Anomaly (Canada) : Is it the northwestern boundary of Gondwana ? — Can. J., Earth. Sc., (soumis).
Lefort, J.P., Bois, Ch. & Gariel, O. (1993b). — Contribution of the ECORS-Bay of Biscay deep seismic profile to the location of the southern variscan front beneath the Aquitaine basin (France). Rapport EcoRS-Golfe de Gascogne. — Mém. Soc. geol. France (sous presse).
Lefort, J.P., Liewig, N., Peucat, J.J, Cazes, M., & Pinet, B. (1993c). — Contribution of geochronology to a better understanding of the deep aquitaine structures. — Rapport ECORS-Gascogne. — Mém. Soc. géol. France, Paris (sous presse).
Lefort, J.P. & Vigneresse, J.L. (1993). — Réinterprétation de la partie méridionale du profil ECORS-Nord de la France : ie rôle des structures cadomiennes. — Bull. Soc. géol. France (sous presse).
Le Pichon, X., Bonin, J. Francheteau, J. & Sibuet, J.C. (1971). — Une hypothèse d’évolution tectonique du Golfe de Gascogne. — In : Histoire structurale du Golfe de Gascogne. — Technip. Paris, VI, 11-1-44.
Le Pochât, G. (1984). — Bassins paléozoiques cachés sous l’Aquitaine. Géologie profonde de la France. — Doc. Bur. Rech. géol. min., Rapport 81-7, 64 pp.
Lucazeau, F. & Vasseur, G. (1989). — Heat flow density data from France and surrounding margins. — Tectonophy- sics, 164, 251-258.
Marchal, F. (1986). — Apport de la gravimétrie à la connaissance des structures profondes sous le Bassin Aquitain : Extension de la chaîne hercynienne. — Thèse Univ. Montpellier, 195 pp.
Marillier, F, Tomassino, A., Patriat, Ph. & Pinet, B. (1988). — Deep structure of the Aquitaine sheif : constraints from expanding spread profiles on the ECORS Bay of Biscay transect. — Mar. Pet. Geol., 5, 65-74.
Mattauer, M. & Seguret, M. (1971). — Les relations entre chaîne des Pyrénées et le Golfe de Gascogne. — In : Histoire structurale du Golfe de Gascogne, I. — Technip. Paris, IV-4/IV-24.
Matte, Ph. & Hirn, A. (1988). — Généralités sur la chaîne Varisque d'Europe, coupe complète de la chaîne sous l’Ouest de la France. — In : Etude de la croûte terrestre par sismique profonde. — Technip, Paris, 197-222.
Matte, Ph., Respaut, J.R, Maluski, J., Lancelot, J. & Brunel, M. (1986). — La faille NW-SE du Pays de Bray: un décrochement ductile dextre hercynien : déformation à 320 Ma d’un granite à 570 Ma, dans le sondage du Pays de Bray. — Bull. Soc. géol. France, 8, 2, 1, 55-69.
Max, M.D. & Lefort, J.P. (1984). — Does the Variscian front in Ireland follow a dextral shear zone ? — In : Hutton, D.W. & Sanderson, D.J., (eds.) : Variscan tectonics and the North Atlantic region. — Geol. Soc. Lond. Sp. Pub., 14, 177-183.
Meissner, R. (1986). — The continental crust : a geophysical approach. — Academic Press, London. — Geol. Soc. London, Sp. Pub., 24, 1-11.
Monger, J. (1986). — The global Geoscience Transect prospect. — Episodes, 9, 4, 217-222.
Noblet, Ch. & Lefort, J.P. (1989). — Sedimentological evidence for a milited separation between Armorica and Gondwana during early Ordovician. — Geology, 18, 303- 306.
Paris, F, Le Pochât, G. & Pelhate, A. (1988). — Le socle Paléozoïque nord aquitain : caractéristiques principales et implications géodynamiques. — C.R. Acad. Sc., (Paris), 306, 597-603.
Perroud, H., Van Der Voo, R. & Bonhommet, N. (1984). — Paleozoic evolution of the Armorican plate on the basis of paleomagnetism data. — Geology, 2, 579-582.
Pinet, B., Montadert, L. & Le Groupe ecors (1987). — Deep seismic reflection and refraction profiling along the Aquitaine shelf (Bay of Biscay). — Geophys. J.R. Astr. Soc., 89, 305-312.
Poulpiquet, J. & Lefort, J.P. (1989). — Modelling of structures representing the South Armorican suture. — Tecto- nophysics, 165, 93-203.
Rey, P. (1992). — Effondrement de la chaîne varisque dans les Vosges, et fabrique sismique de la croûte continentale. — Thèse Univ. Grenoble, 165 pp.
Rolet, J. (1993). — The concealed basement of Aquitaine. Rapport ECORS-Gascogne. — Mém. Soc. géol. France (sous presse).
Riding, R.(1974). — Model of the Hercynian fold belt. - Earth Planet. Sc. Lett., 24, 125-135.
Stewart, D.B., Unger, J.D., Philipps, J.D., & Godsmith, R. (1986). — The Québec-Western Maine seismic reflection profile : setting and first year results. — In : Barazangi,M. & Brown, L. (eds.) : Reflection seismology : the continental crust. — Geodynamics, Series 14, Amer. Geophys. Un., 189-199.
Veinantes-Delhaye, A. & Santoire, J.P. (1980). — Séismicité récente de l’arc Sud-Armoricain et du Nord-Ouest du Massif Central, mécanisme au foyer et néotectonique. — Bull. Soc. géol. France, 7, 22, 93-102.
Vigneresse, J.L. (1978). — Gravimétrie et granites armoricains : structure et mise en place des granites hercyniens. — Thèse Doct. Univ. Rennes, 91 pp.
Weber, Ch. (1972). — Le socle antétriasique sous la partie sud du Bassin de Paris, d’après les données géophysiques. — Thèse Univ. Paris VI, 343 pp.
Williams, C.A. (1975). — Sea floor spreading in the Bay of Biscay and its relationship to the north Atlantic. — Earth Planet. Sc. Lett., 24, 440-456.
Wyns, R. (1981). — Contribution à l’étude du haut bocage Vendéen : le Précambrien et le Paléozoïque de la région de Chantonnay (Vendée). — Thèse 3e cycle, Univ. Paris VI, 120 pp.

HEAT FLOW, HYDROTHERMAL VENTS AND STATIC STABILITY OF DISCHARGING THERMAL WATER IN LAKE BAIKAL (SOUTH-EASTERN SIBERIA)
Vladimir A. GOLUBEV, Jean KLERKX and Rolf KIPFER
GOLUBEV, V.A., KLERKX, J. & KIPFER, R. (1993). - Heat flow, hydrothermal vents and static stability of discharging thermal water in Lake Baikal (south-eastern Siberia). - Bull. Centres Rech. Explor.-Prod. Elf Aquitaine, 17, 1, 53-65, 11 fig., 1 tab,; Boussens, June 24, 1993. - ISSN : 0396-2687. CODEN : BCREDP.Lake Baikal is located in the tectonically active Baikal rift depression.The average heat flow, based on nearly 600 measurements which were mainly
obtained by using a non-autonomous cable thermoprobe, is 71 ± 21 mW/m2. The heat flow is not randomly distributed over the basin : in the southern and middle basins, the positive heat flow anomalies are located near the eastern shore of the lake and are supposed to be connected with border faults; in the northern basin, the heat flow is fairly low and poorly variable along the lake axis. Heat flow maxima occur at intersections between the regional border fault and transverse faults. These high heat flow anomalies, reaching up to 8.6 W/m2, are related to hydrothermal discharge.
Two sites of high heat flow - Frolikha Bay and Kukui Canyon - have been investigated in detail. The Frolikha Bay heat flow anomaly is associated with hydro- thermal discharge along the slope of the basin resulting in temperature anomalies of the near-bottom water. Chemical evidence shows that the feeding zones of hydrotherms are located on the ridges bordering the lake, the meteoretic water permeating the basement rocks down towards the rift basin, where it discharges along the subwater slope.
CTD-profiling in the Frolikha Bay area shows that the hydrotherm which is characterized by anomalous temperature and salinity, constitutes a dense layer which remains at the bottom of the water column and flows towards the deeper parts of the basin.
Based on the observed increase in temperature and in mineralisation of the nearbottom water in Frolikha Bay, theoretical considerations confirm that the observed dense layer is able to flow down the slope to reach the deepest part of the northern basin up to depths of 700 meters.
Not all the hydrotherms discharging along the slopes of the basin may have a sufficient excess in mineralisation to reach the bottom : some of them may, after flowing down part of the slope, constitute a wedge-like layer of hot and mineralised water. Others, discharging at great depth, will move upwards until their density equals that of the ambient water.
The influence on the density of hydrotherms by mixing with ambient water is also evaluated. As a consequence of mixing with the lake water, the density of hydrotherms increases, which facilitates stagnation at the bottom or offers an additional possibility of flowing downslope towards greater depths.Vladimir Golubev, Institute of the Earth’s Crust, Siberian Branch of the Russian Aca
demy of Sciences, Lermontov St. 128, 664033 Irkutsk, Russia; Jean Klerkx, Department of Geology and Mineralogy, Royal Museum of Central Africa, B-3080 Tervuren; Rolf Kipfer, EAWAG, Eidgenossische Technische Hochschulen, CH-8600 Dübendorf. - March 26, 1993.
Key words : Heat flow, Thermal waters, Vents (Hydrothermal vents), Stability (Static stability), Fresh water, Rift zones, Lake Baikal, Baikal rift zone, Siberia.
0396-2687/93/0017-0053 $ 2.60 © 1993 elf aquitaine production, F-31360 Boussens

54 V.A. GOLUBEV, J. KLERKX AND R. KIPFER BCREDP 17 (1993)
CONTENTS INTRODUCTION
INTRODUCTION.......................................................................... 54
1. - METHODS.......................................................................... 551.1. Correction of the heat flow value............................ 55
2. - HEAT FLOW DISTRIBUTION............................................ 56
3. - GEOLOGICAL AND GEOTHERMAL SETTING OF THESITES OF HIGHEST HEAT FLOW..................................... 563.1. The Frolikha Bay vent................................................ 563.2. The Kukui Canyon..................................................... 58
4. - BOTTOM WATER TEMPERATURE AND CHEMICALCOMPOSITION IN FROLIKHA BAY DISCHARGE AREA 59
5. - STATIC STABILITY OF NEAR-BOTTOM WATER........... 606. - INCREASE IN DENSITY OF HYDROTHERMS BY DILU
TION..................................................................................... 62
7. - CONCLUSIONS................................................................. 638. - REFERENCES.................................................................... 64
High conductive heat flow and hydrothermal circulation are meaningful evidence of tectonic activity in oceanic and continental rift zones. Important progress has been made through the last two decades in studying these two components of heat output in oceanic rifts (Lalou & Brichet, 1982; Rona & Lowell, 1980; Sleep & Wolery, 1978, etc.). It was shown that up to 80 % of total heat output in axial zones of mid-oceanic ridges is transported by hydrothermal convection (Williams et al., 1979).
Continental rift zones have been much less investigated than oceanic rifts, although convective heat output is also present in continental rift lakes. Among them, Lake Baikal, which is located in a continental environment, seems most interesting due to its extraordinary cold and fresh water (Fig. 1). Lake Baikal occupies the central part of the tecto-
Vitim,KropotkinTun9'
,BodayboMama'Mamakan'
‘KirenskKamenka Ust'-llimsk,^BoguchanyiKarabula
Bambuyka
_7 Zheleznogorsk-^ \ llimskiy^Bratskoye } Wodokh rani hs hch e
__^vNj2hneangarsk , Seyerobaykal'skBratsk
VikhorevkaAban< Kansk_,Krasnoyarsk /®
>pka
zhnyaya’olymav-Aksënovo-Zilovskoye
Bukachacha£PokosnyyZhigalovo
Chernyshevsk1 SretenskRomanovka*NizhneucJinsk Tulun*Barguzin
~ *Ust'-Barguzin Sosnovo-Ozerskoye Turks
\ oyarskoyt! iramlishfhe
Kachug Kholbon,
.ChitaManzurkaAtêmovsk
Priarc\ Cheremkhovo àvO ' - ' VUsol'yeXTvx *Ust'-0rdynskiy
Sibirskoye®^-.Angarsk®^gJ rkutsk
^ OlovyannayaI} ro vya n ay a A 9 ' n*skoye ^-^esnogorsi
Borzya/ut, r.y .rjlao0O,C Solov’yevsk^^*-—^) /Eroeril
linusinsk
anogorskmarëmushki .Petrovsk-
!abaykal'skiyKultMkJ>
Jvtondy Slyudyank^
.3»5 ??tHovsyol ' Nuur
ManzhMOUNTAINS Gusinoozërsk Yamarrivka ’ /
Khapcheranga . • M$ngut
o ,Kyakhta’Dalakhay Naushk'V
Zakamensky»^. * / ;
Choybalsai'jSUvs l Nuur
Ulaanbaatar
Slg,;.■ jSst?
Figure 1
Location map of Lake Baikal.

BCREDP 17 (1993) CHARACTERISTICS OF DISCHARGING THERMAL WATER IN LAKE BAIKAL 55
nically active Baikal rift zone in south-eastern Siberia. Large, normal faults flank the lake basin. The Baikal tectonic depression is thought to have formed as early as the Oligocène. The lake corresponds to an area of considerable neotectonic activity as evidenced by its seismicity, continued uplifting and elevated heat flow. Two bottom uplifts divide the lake into three segments; northern, middle and southern basins, with maximum depths of 920, 1620 and 1415 m respectively (Fig. 2). The bordering ranges rise 1-2 km above the level of the lake. Rift-related Cenozoic volca- nism was not found within the basin nor on its slopes; quite large amounts of Cenozoic volcanics are present at distances of more than 100 km from the lake (Logatchev et al., 1983).
More than 50 hot springs have been mapped in the Baikal rift zone. Many of them are close to the lake itself (Fig. 2). Flydrothermal discharge has been observed locally on the bottom of the lake and appears to be connected with local, positive heat flow anomalies. So far, almost 600 heat flow measurements have been obtained in the lake. Part of the data has been published in detail (Golubev, 1979, 1982a, 1982b, 1984, 1987, 1990, 1991, 1992, 1993; Duchkov et ai, 1976; Crane et al., 1991a, b). The referred papers consider conditions of formation and discharge of hydrothermal water on the bottom of Lake Baikal and on shore, conditions of stagnation of near-bottom thermal water with regard to increase in density by the mixing of thermal and ambient
Map of Lake Baikal showing the subdivision in three basins according to the bathymetry. The blue dots locate the stations where near-bottom water temperatures were studied between
1976 and 1990. Vertical profiles of near- bottom water temperatures in these stations are given in figure 6. Dashed line in
northern basin contours the area where dt/dZ > O as was evidenced between 1976 and 1984. Triangles represent on-shore
hot springs.
water, and to the fact that the temperature of Baikal water is close to that of maximum density for fresh water.
In the present paper we give a brief summary of all data on heat flow and hydrothermal discharge obtained up until now in Lake Baikal. Part of the paper is devoted to in situ measurements of temperature and electrical conductivity in the water column near Frolikha Bay. Conditions of stagnation of thermal water in the deepest parts of the lake are discussed.
1 — METHODS
In the course of almost 30 years of geothermal studies on Lake Baikal, different kinds of probes have been used (Liubimova & Sheliagin, 1966; Golubev, 1982a, 1987). Nearly 90 % of the measurements were carried out by a non-auto- nomous cable thermoprobe with 4 or 5 temperature sensors. Each sensor is a needle probe with constant heat power, permitting both temperature and heat conductivity in situ measurements. Three or four of the sensors penetrate the sediments (the lowest to a depth of 3 meters), and the upper sensor measures the temperature of the near-bottom water. The thermistors are connected to a Wheatstone bridge aboard the vessel by an armoured three-wire cable and a step relay inside a watertight container. Similar equipment was used earlier (Morgan et al., 1977). The thermistors of the probe are accurate to within ± 0.03 °C with a resolution of 0.002 °C. The sensor heaters are fed by an on-board storage battery. The angle of penetration is monitored by a tiltmeter.
The instrument error in heat flow measurements with the above techniques is about 15 %. It has to be noted however that sediments in Baikal greatly differ from those in oceans and in other rift lakes. The 0.5-1.0 m thick loose sediments are often underlain by dense clays and sands, likely to be of glacial origin. Thermal conductivity of these dense sediments sometimes attains 1.2 - 1.4 W/m°K which is twice the conductivity of the overlying recent loose mud. The instrument error of heat flow measurements in such sediments is sometimes up to 20 % due to high vertical variations of thermal conductivity, large amounts of friction heat, and often because the probe is not penetrating deep enough. Temperature, electrical conductivity and water pressure within the water column were measured by a non-autono- mous Seabird CTD probe.
1.1. CORRECTION OF THE HEAT FLOW VALUE
Sedimentation, topography and perhaps variations in bottom water temperatures considerably affect the heat flow through the bottom of Baikal (Golubev, 1982a). Multichannel seismic profiling (Hutchinson et ai, 1992) indicates that the thickness of the sediments over half of the lake area is not less than 2-3 km, locally reaching 6-7 km near its northwestern edge.
Assuming that sediments in Baikal are sands and clays which have been deposited since the Oligocène, and using the nomograms from Hutchison (1985), it appears that

56 V.A. GOLUBEV, J. KLERKX AND R. KIPFER BCREDP 17 (1993)
sedimentation effects result in a 10-25 % decrease in heat flow as compared to heat flow at great depth. On the other hand, it is shown (Golubev, 1982a) that, due to topographic effects and refraction, the measured heat flow at the base of the steep north-western edge of the Baikal basin must be 20 to 30 % higher than the deep one. The effect of bottom water temperature variations can be neglected at this stage of investigation, taking into account the great depth of the lake and the fact that nearly all the measurements were taken at depths of more than 300 m.
Therefore sedimentation must be of major importance among the effects mentioned. Their total effect decreases the measured heat flow on average by 10 %.
However, this paper will not consider the deep heat flow as it will focus on measured high heat flow anomalies found in locations where the flux exceeds the average value several, or even several dozens of times.
It is supposed that such heat flow anomalies are related to zones of hydrothermal discharge dominated by convective heat transfer which is controlled mainly by fluid velocity. As the above mentioned corrections stem from the idea of heat transported mainly by conduction, they are not applicable for zones of hydrothermal discharge where mainly convective heat transfer is present.
2 — HEAT FLOW DISTRIBUTION
Up until now, heat flow in Baikal has been measured in 595 sites. The sites where the flux exceeds the average value several times have been investigated in greater detail.
Most of the heat flow stations are along transverse sections. Spacing of the stations varies greatly within the lake; in the anomalous areas the density of the stations is greatly increased. An areal mean, qs, therefore, better represents the mean heat flow over the lake than an arithmetic mean. To calculate the areal mean, the lake area was divided into rectangles of 10’ (in latitude) by 6’ (in longitude). The qs calculated as arithmetic mean over these rectangles is 71 ± 21 mW/m2.
In the southern basin, the heat flow is rather low near the western shore (from 50 to 70 mW/m2), but increases to 100, sometimes 150 mW/m2, towards the eastern shore of the lake.
In the middle basin, a narrow thermal anomaly zone, more than 100 km long and 8-10 km wide, extends along the lake axis near the eastern shore. It has been suggested that this anomaly is related to a vertical fault along which hot water was ascending from depths of about 4 km with a total discharge of 100 to 1000 I/s (Golubev, 1987). The anomaly of Kukui canyon (2500 mW/m2) is related to this fault (Fig. 2 and 3).
A quite different situation is found in the northern basin, where the heat flow is fairly low and poorly variable along the lake axis but increases towards the borders of the lake, being particularly high at the eastern side. In different locations the flux attains 0.3 to 1.0, sometimes 8.6 W/m2 (Golubev, 1993) and even 37 W/m2 (Crane et ai, 1991b). It has been observed that these high heat flow values are related to hydrothermal discharge (Golubev, 1982a, 1984; Crane et al., 1991a and b).
These local heat flow anomalies in the northern basin extend along canyons which are subwater prolongations of on-shore river valleys. On-land hot springs are aligned along these valleys. Another peculiarity lies in the fact that the depths of all the heat flow anomalies near the eastern shore fall within the range of 220 to 420 m, which corresponds to the median part of the subwater slope.
The high heat flow sites, associated with subwater hot springs, are connected to intersections of regional border faults with transverse faults along the river valleys.
A similar tectonic setting is shown by two heat flow highs along the western coast (Fig. 3).
3 — GEOLOGICAL AND GEOTHERMAL SETTING IN THE SITES OF HIGHEST HEAT FLOW
Frolikha Bay and Kukui Canyon are two sites where the highest heat flow was observed in Lake Baikal.
3.1. THE FROLIKHA BAY VENT
The vent is located at the bottom of a canyon in the north-eastern segment of northern Baikal. Two on-land hot springs exist 7 km and 20 km to the east of the vent in the valley of the Frolikha river which flows into the bay (Fig. 3). The bottom of the bay is covered by sands and boulders deposited by Holocene glaciers. These sediments are covered by a layer of recent loose mud up to 0.5 m thick. The vent was discovered more than 10 years ago. It was evidenced by high heat flow and temperature anomalies (> 0.1 °C) of the near-bottom water (Golubev, 1982a, 1984). Bottom photographs reveal the presence of a bacterial mat, encrusting sponges which are absent in areas outside the vent field. In the center of the vent field, a temperature as high as 16 °C (compare with 3.5 °C of the bottom water) was measured at a depth of 0.5 m within the sediments. The heat flow here attains 37 W/m2 (Crane et al., 1991b).
Heat flow measurements were performed in Frolikha Bay with a short probe because of the sandy and pebbly bottom sediment.
Reliable results were obtained at a station located at 55°31.1’ E and 109°46.3’ N (Fig. 4). The temperature of the near-bottom water (t0) here was 3.55 °C, and that taken by the upper (tu), middle (tm) and lower (t,) thermistors at depths of 0.05, 0.30 and 0.55 m in sediments were 4.03, 7.39 and 8.81 °C respectively (Fig. 5). The appropriate thermal conductivities were almost identical and amounted 0.9 W/m° K. The average heat flow calculated between t, and tm and between tm and tu sensors is 5.1 and 12.1 W/m2 respectively. The difference in the heat flow and the non-linearity of the temperature/depth profile (Fig. 5) are indicative of a high velocity of thermal water ascending to the surface through the bottom sediments. This velocity can be calculated through formula (Bredehoeft & Papondopulos, 1965; Williams et al., 1979) :

BCREDP 17 (1993) CHARACTERISTICS OF DISCHARGING THERMAL WATER IN LAKE BAIKAL 57
Figure 3
Contour map of measured heat flow in Lake Baikal.Minimum and maximum contour lines correspond to 50 and 200 mW/m2 respectively.
where K is the thermal diffusivity of sediments assumed to be 3 x 10⁻⁷ m2/s, AZ = Zm - Zu = - Zm = 0.25 m, and tu, tm and t, are temperatures measured at depths Zu, Zm, Zh The solution of formula (1) yields V = 1.06 x 10’6 m/s. Total flux produced by the ascending thermal water (convective flux) and by conductivity of sediments (conductive flux) can be found as follows (Williams et at., 1979) :
_ (tm - to)2 - (tu - to) (t| - t0)q«o,a, - qconv + qCond - ^ ^ _ y _ ^ _ y (t| _ y < )
Assuming the volumetric thermal capacity of the sediments (C) to be 3 x 10⁶ J/m3 °C, the solution of equation (2) yields a total flux of 18.9 W/m2, which is much higher than the measured conductive heat flow.
It is worth noting that at other stations, no farther than several dozens of meters from the one considered, the heat flow was as low as 0.5 to 2.0 W/m2 and showed a two-fold increase with depth. The increase may account for infiltration of the lake water into the sediments. Such a high

58 V.A. GOLUBEV, J. KLERKX AND R, KIPFER BCREDP 17 (1993)
Figure 4The Frolikha Bay area : heat flow and near-bottom water anomalies. Circles represent heat flow measurements (in W/m2) : open circles are by cable thermistor probe (Golubev, 1991,1993), bold circle corresponds with measurements from submersible (Crane et al., 1991b). Blue triangles correspond to locations of CTD profiles with normal near-bottom water, red triangles are locations of anomalous near-bottom water.
Figure 5
Temperatures of sediments and near-bottom water in Frolikha Bay (1) and Kukui Canyon (2). The measurements were perfor
med by the cable thermistor probe (Golubev, 1991, 1993).
variability of the heat flow within short horizontal and vertical distances testifies to active movements of water in the uppermost sediments in Frolikha Bay involving intensive mixing of thermal water with the ambient water.
3.2. THE KUKUI CANYON
Another bottom site with a high flux was found in Kukui Canyon at 52°31’ N, 106°34’ E at depths of 680-700 m in the Middle Baikal basin near the Selenga delta (Fig. 2, 3). The sediments in the delta are several km thick. The Selenga delta displays the highest tectonic activity in the whole of Baikal. In this place the two strongest earthquakes have occurred during the last 130 years (Solonenko, 1978). The western slope of the northeast trending canyon dips at nearly 40°, and high flux is traced along the axis of the canyon for about 300 m. The upper 0.5 m layer of sediments is composed of clays underlain by denser rocks, perhaps sands and gravels. Like in Frolikha Bay, we only managed to penetrate the sediments with a short probe.
No increase of the bottom water temperature was observed. The temperature at the bottom along the canyon axis is 3.35 °C, reaching 5.21 °C at 0.6 m down into sediments (Fig. 5). The average heat flow measured between lower and upper thermistors is 2.5 W/m2. The temperature increase in the sediments is non-linear, like in Frolikha Bay.

BCREDP 17 (1993) CHARACTERISTICS OF DISCHARGING THERMAL WATER IN LAKE BAIKAL 59
From equations (1) and (2), the velocity of the thermal water discharging through the bottom of Kukui Canyon is1.18 x 106 m/s and the total heat flow is 7.1 W/m2.
The above data from Frolikha Bay and Kukui Canyon leave no doubt about the hydrothermal nature of local heat flow highs in Baikal.
It is important to note that, unlike in mid-oceanic rifts, the sites of hydrothermal discharge are located along the borders of the rift basin and are absent in its axial parts. This suggests different sources producing the anomalies in oceans and in Lake Baikal.
In oceans, the hydrotherms transfer the heat they take off the magmatic bodies intruding into the upper crust beneath the axes of mid-oceanic rift valleys. Low mineralisation of subaerial vents (from 0.2 to 0.7 g/l) and the absence of Cenozoic volcanism within the Baikal basin are not in favour of a magmatic nature for the hot springs along the lake border. Further evidence against the magmatic origin of hot springs is provided by relatively low temperatures of hydrotherm formation, as calculated from measurements by Na-K-Ca and Si02 geothermometers. Their average value over 53 hot springs in the Baikal rift zone is 99 °C. Such temperatures are characteristic of the thermal water at a depth of 4 km if it is formed of meteoretic water within the regional geothermal field with an average geothermal gradient of 25 °C/km (Golubev, 1982b).
Flelium isotope studies show that mantle type helium only contributes 1-2 % of the helium excess found in the hydro- thermal springs around the lake (Polyak et al., 1992). This confirms the hypothesis that the hydrotherms of the region are mainly generated by water movement within the uppermost crust.
Calculations (Golubev, 1990) show that the regional-scale permeability of the upper crust in the Baikal rift zone is 10-17 to 10-16 m2, providing an intense flow of ground water off
the ridges down towards the rift basin. The fact that hydrotherm feeding zones are located on the ridges is also evidenced by low contents of 8D and S180 isotopes in the pore water of the Frolikha Bay vent (Shanks & Callender, 1992). Such a regional flow of ground water is responsible not only for the hydrothermal discharge along the border of the rift basin, but also for the cooling of the earth's interior in the zones of infiltration on adjacent ridges. Due to the off-flow of the heat transported towards the basins by ground water, the heat flow measured in shallow boreholes on the rift shoulders is as low as 20 to 40 mW/m2 (Golubev, 1990). Such a redistribution of heat by ground water was observed elsewhere (Ingebritsen et ai, 1992; Smith & Chapman, 1983).
4 — BOTTOM WATER TEMPERATURE AND CHEMICAL COMPOSITION IN FROLIKHA BAY
DISCHARGE AREA
Bottom water temperatures around Frolikha Bay have been investigated by CTD-profiling. The thermal profile at the site of the vent shows a slow increase in temperature over a distance of almost 100 meters above the bottom, with a stronger increase over the last tens of meters. This temperature increase parallels an increase in salinity (Fig. 6).
The near-bottom increase in temperature and salinity does not appear to be randomly distributed : it has not been observed at depths less than 390 meters, which is the site where hydrothermal venting was observed. Furthermore, the anomaly in temperature and salinity corresponds to the deepest points of the Frolikha Bay basin in that area. This suggests that the hydrothermal outflow constitutes a dense layer
Electric conductivity (nS/cm)
aa)"O
Figure 6
Example of CTD profile in Frolikha Bay, showing the increase in temperature and electrical conductivity near the bottom.

60 VA. GOLUBEV, J. KIERKX AND R. KIPFER BCREDP 17 (1993)
remaining at the base of the water column and flowing along the slope towards the deeper parts of the basin (Klerkx et al., 1993) (Fig, 4), This is in contradiction with the conclusions of Crane et at. ( 1991 a,b), who assume that the thermal outflow acts as a plume and spreads laterally, remaining at the same level.
The near-bottom water in the locations where a temperature and salinity anomaly was observed near Frolikha Bay, analysed for minor elements, exhibits geochemical anomalies which follow a trend similar to the water of the nearby Flakhusi hydrothermal spring on land (Klerkx et al., 1993),
The recent results of CTD studies confirm earlier temperature measurements of northern Baikal water.
The temperature measurements were performed, along with geothermal studies, by means of the thermoprobe. All the thermal soundings have shown vertical temperature gradients of bottom water in the southern and middle Baikal basins to be either negative or about zero (Fig. 7). Through 1976-1984, the temperature distribution in the northern basin had shown a positive gradient at depths from 15 to 80 m above the bottom (Golubev, 1982a, 1987). Some stations showed a 0.02 °C increment in bottom water temperatures (Fig. 7). Positive bottom gradients were especially high over the sites with high heat flow, suggesting that the hydrothermal discharge may be responsible for the regional-scale increase in bottom water temperatures in the northern basin.
Figure 7
Vertical variations of near-bottom water temperature in southern (1), middle (2) and northern (3 and 3’) Baikal basin. Station locations
are shown in Figure 2. Curve 3 results from observations in station 3 between 1976 and 1984; curve 3' refers to results
obtained at the same station through 1985-1990.
The positive gradient layer of bottom water also occurred over the deepest segment of northern Baikal (Fig. 2).
Since 1985, measurements have shown negative gradients (Fig. 7). Such disappearance of positive gradients may be accounted for by the lowering in static stability of the near-bottom water followed by its overturn. Similar overturns of near-bottom water are recurrent and have been observed elsewhere (Golubev, 1992; Steinhorn et at., 1979).
5. — STATIC STABILITY OF NEAR-BOTTOM WATER
The previous data suggest that the hydrothermal water discharging in Frolikha Bay constitutes a dense layer at the base of the water column, which possibly moves towards the deeper parts of the lake.
The behaviour of the thermal water inside the ambient Baikal water is determined first of all by their density relationship. It is known that at normal air pressure, the density of fresh water reaches its maximum at 3.98 °C. This temperature (tMD) decreases with increasing pressure at a rate of about - 0.021 °C/bar (Eklund, 1963). A more precise relationship also considering mineralisation of the lake water is given by Chen & Millero (1986) :
tMD = 3.9839-1.9911x10⁻²P-5.822x10⁻⁶P2 (3)-(0.2219+1.106x10⁻⁴P) S,
where P is water pressure (bar) and S represents salinity(°/oo)*-
Water temperatures (t) in Baikal at depths greater than 300 m always exceed tMD and the difference t-tMD increases with depth (Fig. 8). This characteristic greatly affects the static stability of deep fresh-water lakes since the thermal expansion coefficient for fresh water increases rapidly with increase in the above temperature difference (Chen & Millero, 1977; Eklund, 1963, 1965). The static stability criterion for the fresh water lakes is yielded by the relationship (Chen & Millero, 1977, 1986; Eklund, 1963, 1965; Golubev, 1982a) :
2Cv (t - tM0) (dt/dZ - dta/dZ) < (- 8v/8S)P dS/dZ) (4)
where v is the water specific volume, C = 7.8 x 10“6I/°C2, dta/dZ is adiabatic temperature gradient, S and P are mineralisation and water pressure at depth Z. Non-equation (4) is a fairly accurate criterion for fresh water static stability within the temperature range of 3 to 4 °C (Eklund, 1963, 1965). The dta/dZ ratio hardly exceeds 2 x 10~5 °C/m in a fresh-water lake such as Baikal (Farmer, 1975); this is an order lower than that in oceans, which allows us to neglect it in the following calculations. If in equation (4), the specific volume of water (v) is replaced by its density p (v = 1/p), then the equation can be rewritten for increments At and Ap :
2Cp (t-tMD) At < (8p/8S)P AS (5)
* Because of the high rate of distillation, the salinity of Lake Baikal water S (%0, or g/Kg) has a numerical expression which is very close to the mineralisation (g/l). Further in the text we will use symbol S as mineralisation (g/l).

DEP
TH, K
MBCREDP 17 (1993) CHARACTERISTICS OF DISCHARGING THERMAL WATER IN LAKE BAIKAL 61
TEMPERATURE, °C
0 12 3 4
Figure 8
Vertical variations of temperatures through the entire water column in the northern (1), southern (2) and middle (3) basins of Lake Baikal. The blue (upper part) of the curve corresponds to summer conditions; the green (upper part) to winter conditions. The solid line tMD corresponds to the maximum density of fresh
water (Chen & Millero, 1986).
At the threshold point, where the static state of water turns from stable to unstable, criterion (5) becomes :
_ 2At Cp (t-tMD) (6)(5 p/8 S)p
In this equation we will assume p = 1 x 10³ Kg/m3 and the (8p/8S)P ratio can be calculated with an accuracy satisfactory to the following evaluation, by differentiating the equation of state for fresh water (Chen & Millero, 1986). The calculation shows that in the range of temperature, salinity and depth typical for Lake Baikal, the Sp/8S can be considered at a constant value of 0.81.
Mineralisation of Baikal water shows a low vertical variation and is, on average, as low as 96.4 mg/I (Votinzev, 1961). In the following calculations, this mineralisation is assumed
to be appropriate for all the Baikal water except for zones of hydrotherm influence. S values for water in hot springs near Baikal vary from 200 to 700 mg/I. The data obtained on electrical conductivity of bottom water (Fig. 6) and the results of pore water studies in Frolikha Bay vent (Shanks & Callender, 1992) indicate an elevated mineralisation of subwater hot springs.
According to equation (6), the static state of bottom water will remain constant provided that the increase in water temperature (At°C) is associated with an increase in mineralisation (AS mg/I). Assuming a maximum At increment of0.06 °C, as was measured by CTD in Frolikha Bay, equation (6) can be used to calculate the threshold excess mineralisation for different segments of Lake Baikal (Tab. I and Fig. 9).
It appears from Table I that the same increase in temperature has considerable varying effects on AS depending on depth.
If a hydrotherm discharges in a subwater slope at depths of 200 to 300 m, where t-tMD is near 0 all year round (Fig. 8), a mineralisation increment of 0.1-0.2 mg/I is enough to provide an excess density and to make it flow downslope.
Consequently, accepting that hydrotherms can flow down, the question remains as to whether they can reach the deeper parts of the lake where they concentrate as thermal brines.
Table I and Figure 9 suggest that the hydrotherms in Frolikha Bay should have AS no lower than 0.42 mg/I to acquire positive static stability with respect to the ambient near-bottom water of the bay. The increment should be no lower than 1.01 mg/I at the discharge point to make the thermal water moving 15 km westwards flow down the slope into the axial part of the lake, which is at a depth of 700 m.
The maximum excess of mineralisation, which was observed in Frolikha Bay (Fig. 6) and which was deduced from the electrical conductivity measurements, equals 1 mg/I at the discharge point at a depth of 390 meters.
Comparing these observations with the theoretical data of Table 1 and Figure 9, it appears that the dense layer observed at the bottom of the water column is able to flow down the slope and reach the axial part of the lake in the northern basin where the depth is 700 meters.
TABLE I
Mineralisation excess associated rise at temperature increment of 0.06 °C to provide static stability of near-bottom waterfor different segments of Lake Baikal.
Segments of Water tMD * tn** t = tn+At t-tMD ASBaikal depth (m) (°C) (°C) (°C) (°C) (mg/I)
Middle basin 1600 0.62 3.12 3.18 2.56 2.96
Southern basin 1400 1.06 3.34 3.40 2.34 2.70
Northern basin 900 2.12 3.42 3.48 1.36 1.57
Kukui Canyon 700 2.54 3.35 3.41 0.87 1.01
Frolikha Bay 400 3.16 3.46 3.52 0.36 0.42
Northern Basin slope 200 3.56 3.60 3.66 0.10 0.12
* Calculated by equation (3)** Normal near-bottom water temperatures (not affected by hydrothermal vents)

62 V.A. GOLUBEV, J. KLERKX AND R, KIPFER BCREDP 17 (1993)
EXCESS MINERALISATION, mg /1
Figure 9
Excess mineralisation of hydrotherms (AS) necessary to sustain their balance with the Baikal water, depending on the depth of
the hydrothermal discharge on slopes of the northern (1), southern (2) and middle basins (3) of Baikal. Calculations are
made by formula (6) based on the assumption that temperature of hydrotherms is 0.06 °C higher than that of the ambient water.
The possible concentration and stagnation of dense water in the axial part of the northern basin was confirmed by the increase in temperature and conductivity of the nearbottom water observed in 1992, as well as the regional-scale increase in temperature in the northern Baikal basin between 1976 and 1984 (Golubev, 1982a, 1987).
In the particular case of Frolikha Bay, the hydrothermal flow remains at the base of the water column and has the possibility of reaching the deeper parts of the lake. Nevertheless, not all the hydrotherms discharging at the subwater slopes of Lake Baikal have a sufficient excess of mineralisation, such that other possibilities can be considered.
Hydrotherms being at first more dense than ambient water will flow downslope, until the depth where their density equals that of the ambient water. Here they will constitute a wedge-like horizontal layer of water which is somewhat hotter and more mineralised than the ambient water (Fig. 10a).
Another situation is also possible. Hydrotherms without a sufficient excess of mineralisation and which discharge at great depth, will move upwards until, as a result of the decrease of (t-tMD), equation (6) becomes valid and consequently, the density of the hydrotherms becomes equal to that of the ambient water. The hydrotherms will stop ascending, and the layer will be fed from below and, at the same time, diluted by currents (Fig. 10b).
6 INCREASE IN DENSITY OF HYDROTHERMS BY DILUTION
As already mentioned, bottom water temperature in the Baikal basin at depths of more than 200-300 m is not affected by seasonal variations and is about 3.6 °C. It decreases by _ 0.2 °C in the northern, by „ 0.3 °C in the southern, and by „ 0.5 °C in the middle basin towards the bottom until the greatest depths (Tab. I).
Hence, on their way downslope, the hydrotherms will mix with water which gets colder and colder, thus affecting their density.
The influence of temperature on the specific volume of fresh water is increasing when t-tMD is increasing almost following a parabolic law. The influence of mineralisation on the density is almost linear, as it was assumed that :
(-8v/8S)P = (8p/SS)P = constant .
Consequently, the isodensity lines (Fig. 11) are curved. Each line (1-3) has been calculated for a specific pressure (depth) based on the equation of state for fresh water (Chen & Millero, 1986) and assuming that the average mineralisation of the normal Baikal water (Snorm) is constant along the entire water column.
Two examples in Figure 11 illustrate the process of den- sening of hydrotherms as a result of mixing with ambient water.
In the first case, the hydrotherm is assumed to discharge at great depth and to have a density equal to the density of ambient water (both points representing the hydrotherm, F, and the ambient water, M, are located on the same isodensity line 1). The process of mixing goes along the line FM which is located below the corresponding isodensity line 1 and consequently, the resulting mixture, represented by point L, will be denser than both ambient water and the original hydrotherm.
This example shows that if the original mineralisation of hydrotherms discharging at the bottom is high enough, mixing with the ambient water will increase their density and facilitate stagnation at the bottom.
The second case illustrates the situation considered in Figure 10a, where mixing also results in densening. A hydrotherm, represented by point C on isoline 3, during mixing with ambient water (E), will move along the line CE. This line is located below the corresponding isodensity line 3 and consequently represents a densening of the mixed hydrotherm. As a consequence of mixing, hydrotherms obtain an additional possibility to flow downslope towards greater depths.
A more accurate estimation of density increase also has to consider a vertical variation in mineralisation.
It must also be noted that the decrease in excess temperature of a hydrothermal layer flowing down a subwater slope, may be partly due to conductive transfer of heat to the water above the hydrotherms and down to bottom sediments.

BCREDP 17 (1993) CHARACTERISTICS OF DISCHARGING THERMAL WATER IN LAKE BAIKAL 63
FigureIO
Illustration of two modes of behaviour of hydrotherms (a) flowing downslope or (b) ascending, until the depth where they attain thedensity of the lake water.
7 — CONCLUSIONS
I. The detailed study of the heat flow distribution in the Baikal basin shows that there are no thermal highs which coincide with the axial part along the whole extent of the basin. In the southern segment of the lake, the highs were observed near the base of its south-eastern slope; in the middle basin they are located at the lower segment of the slope. Along the axis of the northern basin, the heat flow is low and nearly constant.
High and super-high flows were found locally in the middle and upper parts of the eastern slope of the northern basin, and near the base of its western slope. Extremely high flux in some localities of northern Baikal is connected to hydrothermal discharge; this is confirmed by elevated temperature and electrical conductivity of near-bottom water. On-shore hot springs are also associated with border faults of the rift basin.
Hydrotherms result from the permeation of meteoretic water through the ranges around Lake Baikal; they discharge along transverse faults, oblique to the border faults.
The high permeability of the upper crust (from 10~17 to 1CH6 m2) and large elevations of bordering ranges above the basin (1-2 km) provide intensive movement of the ground water towards the rift basin. This movement involves redistribution of the regional heat flow. Almost half of it is removed by ground water below the mountains and trans
ported to the basin. Such a mode of hydrotherm formation in the Baikal rift is evidenced by geothermal and hydrochemical data.
II. The hydrotherms discharging along the subwater slopes of Baikal can either ascend or flow downslope, depending on excess in mineralisation and temperature compared to the ambient water. Calculations based on the criterion of static stability of fresh water, show that the threshold increment in mineralisation should exhibit an almost linear increase with the depth of discharge. In this respect, the northern basin, the least deep, must be the most favourable for accumulation and stagnation of hydrotherms.
The hydrotherms mixing with the ambient water get somewhat denser and acquire a higher static stability. The increase in density is an additional force making the hydrotherms flow downslope. However, the increase in density is proportional to mixing-induced decrease in mineralisation. Increasing density must abate as the mixing progresses, because the excess mineralisation and temperature must diminish until they equal those of the ambient water.
III. CTD soundings performed in the Frolikha Bay vent show that the excess mineralisation and temperature in the vent are no higher than 1 mg/I and 0.06 °C, while they are a hundred times higher in the on-shore thermal springs. Such small excesses in mineralisation and temperature are due to repeated dilution of hydrotherms by the ambient water.

64 V.A. GOLUBEV, J. KLERKX AND R. KIPFER BCREDP 17 (1993)
3
Figure 11
Illustration of densening of hydrotherms due to their mixing with the ambient water. Curves 1,2,3 are isodensity lines. Each of the lines has been calculated for different pressures (depths)
based on the equation of state for fresh water (Chen & Millero, 1986) and assuming that the mineralisation of the normal Baikal
water (Snorm) is constant along the entire water column. Temperature of this water is decreasing with depth.
Case 1 : The hydrotherm F discharges at the bottom in the deep part of the lake and has a density which equals that of the
ambient water. (Both points : hydrotherm F and ambient water M are located on the same isodensity line 1). Mixing goes along line FM. The point of mixture (L) is below the representative
isodensity line 1 and, hence, corresponds to denser water. Due to mixing, the water acquires static stability with respect to the
overlying lake water.Case 2 : Hydrotherm discharges at the upper part of a slope and flows down to the depth where its density equals that of
ambient water. This hydrotherm (C) and ambient water (E) before mixing have t-s coordinates which belong to the same isodensity line 3. The volume of mixture is represented by point D. Transiting to a new t-s state, the hydrotherm decreases in mineralisation by AS,, and increases in density by a value proportional to the length of segment AS2. The calculations based on the equation of state for fresh water (Chen & Millero, 1986) show that AS2
constitutes on average 15 % of AS, for depths of 300 to 1 000 m. Resulting from the linear relationship of mineralisation/density/maximum depth achieved by hydrotherms, these
hydrotherms consequently have the possibility to increase their depth by 15 %. The isodensity line 2 corresponds to this greater
depth. The progressing mixture will go along line DO.
The hydrotherms having excess density, are forced to flow down the Frolikha canyon. This unidirected flow is diluted by near-bottom currents which involves mixing even greater amounts of lake water.
Theoretical estimates, based on the criterion of static stability of fresh water with regard to the mixing-induced density increase, show that the excess mineralisation and temperature in the Frolikha Bay vent, allow the hydrotherms to flow down to the deepest part of the northern basin.
Acknowledgements
Part of the presented results have been collected during field work performed in the frame of the project CASIMIR
(Comparative Analysis of Sedimentary Infill Mechanisms in Rifts), a joint research project between Siberia and Belgium, and of the Baikal International Centre for Ecological Research (BICER) at Irkutsk (Russia). We are indebted to academician N. Logatchev for providing logistic assistance during the cruise with R/V BARDIN. Prof. M. Grachev, Director of BICER is thanked for promoting part of this research. E. B. Karabanov, Institute of Limnology, Irkutsk, assisted with bathymetric measurements. The authors are grateful to V. Pyrog, Institute of Limnology, Irkutsk, and Mrs Cl. Brone, Royal Museum for Central Africa, Tervuren, for technical support during field work.
8. — REFERENCES
Bredehoeft, J.D. & Papondopulos, I.S. (1965). — Rates of vertical groundwater movement estimated from the earth’s thermal profile.— Water Ressources Research, 1, 325-328.
Chen, C.T. & Millero, F.J. (1977) — The use and misuse of pure water PVT properties for lake waters. — Nature, 226, 5604, 707-708.
Chen, C.T. & Millero, F.J. (1986). — Precise thermodynamic properties for natural waters covering only the lymnolo- gical range. — Limnol. and Oceanogr., 31, 3, 657-662.
Crane, K., Hecker, B. & Golubev, V. (1991a). — Flydrothermal vents in Lake Baikal. — Nature, 350, 281.
Crane, K., Hecker, B. & Golubev, V. (1991b). — Heat flow and hydrothermal vents in Lake Baikal. — EOS Transactions. AGU, 72, 52, 585.
Duchkov, A.D., Kazanzev, S.A. & Golubev, V.A. (1976). — Heat flow through the bottom of Lake Baikal. — Geol. and Geophys., 4, 112-121 (in Russian).
Eklund, H. (1963). — Fresh water : temperature of maximum density calculated from compressibility. — Science, 142, 3598, 632-633.
Eklund, H. (1965). — Stability of lakes near the temperature of maximum density. — Science, 149, 3684, 1457-1458.
Farmer, D.M. (1975). — Potential temperatures in deep fresh-water lakes. — Limnol. and Oceanogr., 20, 4, 634- 635.
Golubev, V.A. (1979). — Heat flow in Baikal basin. — Dokl. Akad. Nauk SSSR, 245, 6, 658-661 (in Russian).
Golubev, V.A. (1982a). — Geothermics of Baikal. — Nauka, Novosibirsk, 150 pp. (in Russian).
Golubev, V.A. (1982b). — Thermal and chemical properties of hydrothermal systems of the Baikal rift zone. — Sovetskaya Geoiogiya, 10, 100-108 (in Russian).
Golubev, V.A. (1984). — Hydrothermal investigation in Lake Baikal with the use of a thermal profiling sled. — Izv. Akad. Nauk SSSR, Fizika Zemli, 1, 104-107 (in Russian).
Golubev, V.A. (1987). — Geothermal and hydrothermal studies on Middle Baikal. — Izv. Akad. Nauk SSSR, Fizika Zemli, 7, 14-26 (in Russian).
Golubev, V.A. (1990). — Hydrothermal systems, permeability and thermal models of the crust in the Baikal rift zone. — Izv. Akad. Nauk SSSR, Fizika Zemli, 11, 23-33 (in Russian).
Golubev, V.A. (1991). — A deep water hydrothermal source at the Bottom of Kukui Canyon (Baikal). — Dokl. Akad. Nauk SSSR, 317, 4, 940-943 (in Russian).

BCREDP 17 (1993) CHARACTERISTICS OF DISCHARGING THERMAL WATER IN LAKE BAIKAL 65
Golubev, V.A. (1992), — Heat flow through the bottom of Khubsugul Lake and the bordering mountains (Mongolia). — Izv. Akad. Nauk SSSR, Fizika Zemli, 1, 48-60 (in Russian).
Golubev, V.A. (1993).. — Sources of subwater hydrothermal discharge and heat balance of North Baikal. — Dokl. Akad. Nauk Rossii, 328, 3, 315-318 (in Russian).
Hutchison, J. (1985). — The effects of sedimentation and compaction on oceanic heat flow. — Geophys. J.R. Astron. Soc., 82, 3, 439-459.
Hutchinson, D.R., Golmshtok, A.J., Zonenshain, L.R, Moore, T.C., Scholz, C.A. & Klitgord, K.D. (1992). —Depositional and tectonic framework of the rift basins of Lake Baikal from multichannel data. — Geology, 20, 589- 592.
Ingebritsen, S.E., Sherrod, D.R. & Mariner, R.H. (1992). — Rates and patterns of groundwater flow in the Cascade Range volcanic arc, and the effect on subsurface temperatures — J. Geophys. Res., 97, B4, 4599-4627.
Klerkx, J., Golubev, V. & Kipfer, R. (1993). — Hydrotherma- lism in Lake Baikal : investigation of the hydrothermal site of Frolikha Bay. — Mus. roy. Afr. centr., Tervuren (Belg.), Dépt. Géol. Min., Rapp. ann. 1991-1992, in press.
Lalou, C. & Brichet, E. (1982). — Ages and implications of East Pacific Rise sulfide deposits at 21 N. — Nature, 300, 169-171.
Logatchev, N.A., Zorin, Yu. A. & Rogozhina, V.A. (1983). — Baikal rift : active or passive ? Comparison of the Baikal and Kenya rift zones. — Tectonophysics, 94, 223-234.
Liubimova, S.A. & Sheliagin, V.A. (1966). — Heat flow through the bottom of Baikal Lake. — Dokl. Akad. Nauk SSSR, 171, 6, 1321-1325 (in Russian).
Morgan, P., Blackwell, D.D., Spafford, R.E. & Smitch, R.B. (1977). — Heat flow measurements in Yellowstone Caldera. — J. Geophys. Res., 82, 26, 3719-3733.
Polyak, B.J., Prasolov, E.M. & Tolstikhin, I.N. (1992). — He-isotopes in the fluids of the Baikal rift zone. — Izv. Akad. Nauk SSSR, Ser. Geologicheskaya, 10, 18-33 (in Russian).
Rona, P.A. & Lowell, R.P. (eds.) (1980). — Seafloor spreading cenetrs : hydrothermal systems. — Benchmark Papers in Geology, 56. Dowden, Hutchinson and Ross, Strassbourg, PA, 424 pp.
Shanks, W.C. & Callender, E, (1992). — Thermal springs in Lake Baikal. — Geology, 20, 495-497.
Sleep, N.H. & Wolery, T.J. (1978). — Egress of heat water from mid-ocean ridge hydrothermal systems : some thermal constraints. — J. Geophys. Res., 83, B12, 5913- 5922.
Smith, L. & Chapman, D.S. (1983). — On the thermal effects of groundwater flow. Regional scale systems. — J. Geophys. Res., 88, B1, 593-608.
Solonenko, V.P., (1978). — Seismicity and earthquake focal mechanisms in the Baikal rift. — Tectonophysics, 45, 1, 61-69.
Steinhorn, I., Assaf, G., Gart, J. & Nishry, A. (1979). — The Dead Sea : deepening of the mixolimnion signifies the ouverture to overturn of the water column. — Science, 206, 4414, 55-57.
Votinzev, K.K. (1961). — Hydrochemistry of Baikal Lake. — Acad. Nauk SSSR, 309 pp. (in Russian).
Williams, D., Green, K., Van Andel, T.H., Von Herzen, R.P., Dymond, J.R. & Crane, K. (1979). — The hydrothermal mounds of the Galapagos rift observations with DSPV Alvin and detailed heat flow studies. — J. Geophys. Res., 84, B13, 7467-7484.

LOWSTAND DEEP-WATER SILICICLASTIC DEPOSITIONAL SYSTEMS : CHARACTERISTICS AND TERMINOLOGIES IN SEQUENCE STRATIGRAPHY AND SEDIMENTOLOGY
Venkatarat KOLLA
KOLLA, V. (1993). - Lowstand deep-water siliciclastic depositional systems: characteristics and terminologies in sequence stratigraphy and sedimentology. - Bull. Centres Rech. Explor.-Prod. Elf Aquitaine, 17, 1, 67-78, 5 fig., 3 tablBoussens, June 24, 1993. - ISSN : 0396-2687. CODEN : BCREDP.La terminologie communément utlisée pour les systèmes sédimentaires silico-
clastiques en eaux profondes dans la méthodologie courante de Stratigraphie Séquentielle, «basin floor fan» et «slope fan», est ici discutée. Il est montré que cette terminologie est trop restrictive, à la fois littéralement et conceptuellement, pour recouvrir réellement tous les aspects des systèmes de dépôt de bas niveau en eaux profondes : emplacements physiographiques, unités stratigraphiques en relation avec les différentes étapes de variation du niveau marin lors de périodes de bas niveau et différents types de système de dépôt en relation avec leurs nombreuses possibilités de distribution de faciès réservoirs.
Le mélange de ces différents aspects à l’intérieur de ces deux termes couramment utilisés (« basin floor fan » and « slope fan ») a provoqué beaucoup de confusion dans les interprétations apparaissant dans la littérature. La terminologie existant déjà dans les articles sédimentologiques spécialisés sur les dépôts profonds est ici replacée dans la trame de la stratigraphie séquentielle.
Dans la même approche, cette terminologie est séparée de celle des unités stratigraphiques et de leur emplacement physiographique mais rattachée aux caractéristiques classiques des dépôts érosionnels ou dépositionnels des turbidites et leurs éléments associés à l’intérieur des systèmes sédimentaires de bas niveau : effondrement de la plate-forme continentale, canyons, chenaux, lobes, complexes de transport en masse, écoulement de débris évoluant en turbidites riches en sables ou en argiles (couverture de la base de la pente riche en sable ou en argile).
Les caractéristiques sédimentaires principales, en diagraphies et en sismique pour identifier ces critères de dépôts conduisent à répertorier trois catégories de systèmes de dépôts arbitraires mais chevauchantes :
• système de bas niveau en maximum de chute,• système de bas niveau précoce à moyen,• système de bas niveau tardif.Une procédure est présentée pour utiliser cette nomenclature.
Mots-clefs : Nomenclature, Sédimentation détritique, Composition siliceuse, Eustatisme (Stratigraphie séquentielle), Sédimentation pélagique, Turbidites, Cône sous-marin (Cône sous-marin bassin, Cône sous-marin talus).
Venkatarat Kolla, Elf Aquitaine Production, Département Géologie Sédimentaire, CSTJF, F-64018 Pau cedex. - February 12, 1993.
ABSTRACT
The terms commonly used for deep-water siliciclastic systems in the current sequence-stratigraphic methodology, “basin floor fan” and “slope fan”, are discussed and are shown to be too restrictive both literally and conceptually to represent the many aspects of deep-water, lowstand depositional systems : physiographic settings, stratigraphic units tied to different sea-level stages within lowstand and an array of many types of depositional systems with vastly varying reservoir distributions. The mix-up of these diverse aspects cast into the two pigeon-hole terms, “basin floor fan” and “slope fan”, has caused much confusion. A terminology that already exists in sedimentological literature is designed here to be used within sequence-stratigraphic framework. At the same time, this terminology is divorced from the names of stratigraphic units and their physiographic settings. Instead, it is based on observed characteristics, and consists of erosional/depositional features of turbidite and re
lated elements within the lowstand systems-tract : shelf-edge failures/canyons, channels, overbanks, lobes, mass-transport complexes, and debris-flow deposits grading into sand-or mud-rich turbidites (sand-rich or mud-rich, base-of-slope aprons).
The main seismic, log and sedimentary characteristics for identifying these features are listed under three arbitrary and overlapping categories of depositional systems :
• falling sea-level to maximum lowstand,• early-to-middle lowstand (maximum lowstand to middle rising
sea-level),• late lowstand (early to late rising sea-level).A procedure is outlined for utilizing the nomenclature.
Key words : Nomenclature, Detrital sedimentation, Siliceouscomposition, Eustasy (Sequence stratigraphy), Pelagic sedimentation, Turbidites, Submarine fans (Basin floor fan, Slope fan).
0396-2687/93/0017-0067 $ 2.40 © 1993 elf aquitaine production, F-31360 Boussens

68 V. KOLLA BCREDP 17 (1993)
CONTENTS
INTRODUCTION..................................................................... 681. - COMMONLY USED TERMS........................................... 68
2. - BASIN FLOOR FAN....................................................... 682.1. Validity of the criteria............................................. 682.2. Problems In the scope and use of the basin floor
fan concept............................................................ 70
3. - SLOPE FAN.................................................................... 713.1. Problems in the scope and use of -slope fan»
concept................................................................... 72
4. - PROPOSED NOMENCLATURE....................................... 734.1. A general procedure for using the nomenclature.. 73
5. - CONCLUSIONS.............................................................. 77
6. - REFERENCES................................................................. 77
INTRODUCTION
Sequence stratigraphy is an extremely powerful and useful tool to divide a sedimentary section into sequences and systems-tracts. The use of this approach to enhance the understanding of geologic relationships within a time-stratigraphic framework has achieved widespread acceptance in recent years (e.g. Posamentier, in press). However, the application of sequence-stratigraphic methodology has also caused a morass of terminology in practice, especially in regard to deep-water depositional systems.
In this paper, I discuss “basin floor fan” and “slope fan”, and other terms commonly used in sequence stratigraphy for deep-water depositional systems and point out the limitations in the use of these terms. I then propose a nomenclature based on the actual and observed seismic, log and sedimentary characteristics of depositional/erosional elements of turbidite and other related systems. This nomenclature recognizes the diversity of deep-water depositional systems and already exists in sedimentological literature. However it is redesigned here to be used within the sequence-stratigraphic framework, without, at the same time, the mix-up of names of stratigraphic units, physiographic settings and depositional systems that is characteristic of the current sequence-stratigraphic terminology. The proposed nomenclature is simply a call to pay attention to sedimentologic fundamentals within sequence-stratigraphic framework. The utility of sequence stratigraphy lies in the fact that it provides a chrono-stratigraphic framework and helps establish sediment transport pathways in which to look at seismic, log and other characteristics of a sedimentary section and to identify the turbidite elements. The sequence-stratigraphic framework also enables us to identify sequence boundaries and to provide some degree of predictable information on such aspects as sand/mud ratios and possible locations of depocenters at or below shelf edges in relation to sea-levels. All this information in conjunction with seismic, log and other characteristics helps to identify the type of turbidite element and to predict the distributions of reservoir lithologies. However, it must be noted that sea-level is not the only controlling factor in determining the sediment grainsize supplied and the type of turbidite element deposited.
1 — COMMONLY USED TERMS
“Basin floor fan” and “slope fan” (Fig. 1) are commonly used terms for deep-water siliciclastic systems in the practice of sequence-stratigraphic methodology, especially in the petroleum industry (Pacht et al., in press; Fig. 1) although not every sequence stratigrapher uses them. For example, Posamentier & Erskine (1991) prefer “lowstand fan” and “early lowstand wedge" for “basin floor fan” and “slope fan”, respectively. These terms have generally been less accepted in academia (e.g. Mum, 1992).
2 — “BASIN FLOOR FAN”
“Basin floor fan” literally means a fan deposited in a basin. However, according to its intended use (Vail, 1987, Vail et al., 1991), which is not always clearly spelled out, it simultaneously incorporates three separate concepts or characteristics :
1) it is the most basal stratigraphic unit within the lowstand systems-tract, deposited during a rapid sea-level fall (falling to maximum relative lowstand of sea-level) and overlies a sequence boundary;
2) it is located in a specific physiographic setting, i.e. basin;
3) it is a unique, fan-shaped, well-organized turbidite system with widespread sheet or sheet-mounded sands (Fig. 2; Tab. I).
I discuss first the validity of the criteria and characteristics usually utilized in identifying the “basin floor fan” (Tabl. I) and then the scope, limitations and use of the name and concept. The characteristics of the “lowstand fan” of Posamentier & Vail (1988) are very similar to those of the “basin floor fan”.
2.1. VALIDITY OF THE CRITERIA
The pitfalls in the seismic criteria for the recognition of “basin floor fans” (Tab. I) have been discussed by Mitchum (1985), Posamentier & Erskine (1991) and Sangree et al., (1991) and include: apparent mounding due to erosion, slump mounds, prograding lobate shelf-slope features, turtle structures, and a variety of canyon-fills with apparent mounding. If these pitfalls are taken into account and if deep-water environment is established, utilization of the criteria listed in Table I may often lead to successful predictions of significant sandy turbidites. However, the margin-pinching reflection geometry used to infer “basin floor fans” may be caused by increased clastic influx, not necessarily only sand influx, to paleo-lows by any of the several mechanisms operating along continental margins : turbid layer flows, turbidity currents of varying sediment concentrations, and hemipelagic sedimentation (see for example Pickering et al., 1989). Thus, there may be shales and thin or thick bedded sands which may all result in the seismic characteristics of the “basin floor fan”. Some turbidite systems with apparent “basin floor fan” seismic

BCREDP 17 (1993) LOWSTAND DEEP-WATER SILICICLASTIC DEPOSITIONAL SYSTEMS 69
SYSTEMS TRACTS
HST = HiGHSTAND SYSTEMS TRACT TST = TRANSGRESSIVE SYSTEMS TRACT
ivf = incised valley fill LST = LOWSTAND SYSTEMS TRACT
ivf = incised valley fillIsw = lowstand wedge-prograding complex sf = lowstand slope fan bf = lowstand basin floor fan
fc = fan channels fl = fan lobes
SMST = SHELF MARGIN SYSTEMS TRACT
SURFACES
(SB) SEQUENCE BOUNDARIES (SB 1) = TYPE 1 (SB 2) = TYPE 2
(DLS) DOWNLAP SURFACES(mfs) = maximum flooding surface (tbfs) = top basin floor fan surface (tsfs) = top slope fan surface
(TS) TRANSGRESSIVE SURFACE (First flooding surface above maximum progradation)
|lSt) Lowstand Systems Tract (LST)
[I l Lowstand Basin Floor Fan (bf)
| S o l Lowstand Slope Fan (sf)
Lowstand Wedge-Prograding Complex (Isw)
llüüiül Transgressive Systems Tract (TST)
\/\ Highstand Systems Tract (HST)
HI Shelf Margin Systems Tract (SMST)
Figure 1Sequence boundaries, other key surfaces and systems-tracts with “basin floor fan” and “slope fan” shown in relation to eustasy and
relative sea-level (Vail, 1987).
reflection characteristics have been proven to be shaly by drilling (Posamentier & Erskine, 1991).
The log characteristics of “basin floor fans” are reported to exhibit blocky shapes with sharp, flat base and top (Vail et al., 1991; Pacht et al., 1990; Fig. 2); however in reality, the log shapes may also be coarsening- or fining-upward
or cylindrical shapes (Selley 1979; Me Goveny & Radovich, 1985; Enjoiras et al., 1986), depending on the type and specific location on the turbidite system (channelled, unchannelled, margin etc.).
Although the “basin floor fans” are reported to consist of sheet to sheet-mounded turbidites with massive amalga-
SEISMICCHARACTERISTICS
LOGCHARACTERISTICS
SEDIMENTARYCHARACTERISTICS
LATERAL PINCHOUT REFLECTIONGEOMETRY ; HIGH-AMPLITUDE
REFLECTIONS ONLAPPING THE
BASIN MARGIN ; INTERNAL BIDIRECTIONAL DOWNLAP OR ONE
DIRECTION ABUTS AGAINST
DOWN-THROWN-SIDE OF A
GROWTH FAULT.SUBTLE EXTERNAL MOUNDING
OVERLYING TYPE 1 UNCONFORMI
TY and BELOW LOWSTAND SLOPEFAN OR A CONDENSED SECTION
BLOCKY LOG SHAPESWITH SHARP, FLAT BASE
AND TOP
SHEET TO SHEET-MOUNDED, BASINAL
TURBIDITES. MASSIVE AMALGAMATED
(B FACIES, MUTTI & RICCI LUCCHI, 1972)TO UNAMALGAMATED SANDS WITHSHALE BREAKS (C, D FACIES) FROM CENTRAL TO MARGINAL AREAS OF BASIN.
DEPOSITED BY UNCHANNELED and SOME
CHANNELED (WITHOUT SIGNIFICANT
OVERBANKS) TURBIDITY CURRENTS :
SOMETIMES ERODED BY BOTTOM CURRENTS. CORRESPONDS MAINLY TO TYPE I
BUT ALSO TYPE II (SYSTEMS OF MUTTI,
1985)
TABLE ISeismic, log and sedimentary characteristics of basin floor fan (from Posamentier & Erskine, 1991 ; Vail et al., 1991 ;
Pacht et al., 1990, in press; Sangree et al., 1991).

70 V. KOLLA BCREDP 17 (1993)
LOWSTAND SYSTEMS TRACT BASIN FLOOR FAN COMPLEX
SILICICLASTICS
Stream Profite - 1Stream Prolile - 2
Soil
Sand Flushed from Fluvial Systems by Sea Level Lowering Sand Reworked by Coastal Processes
Sediment Profile at the end o( Previous Highstand Systems Tract
Relative Sea Level -t
50-1 OOmi
BASINFLOORFAN
Original Depositional Mound Massive Sandsb: fine-grained interbeds
between massive sandsa: Massive Sands
EARLY RISE EUSTATIC SEA LEVEL CURVE
Figure 2Schematic characteristics of basin floor fan unit within the lowstand systems-tract with its position on the eustatic curve shown
(slightly modidied after Vail et al., 1991).
mated (B - facies of Mum & Ricci Lucchi, 1972) to unamalgamated sands with shale breaks (C, D - facies) from central or channelled portions to marginal areas of basins (Vail et al., 1991; Mc Goveny & Radovich, 1985) and are thought to be equivalent to Types I and II systems of Mum (1985) (e.g. Posamentier et al., 1991), the facies architecture of these fans has never been well-documented. Some of the turbidite elements such as base-of-slope, sand-rich aprons not included hitherto in the “basin floor fan” may have similar seismic expression as “basin floor fan”, and yet may have significantly different lithofacies distributions. It should be noted, however, that depending upon the sediment grainsize and volume, and other factors, the deposition of different turbidite and related elements may be very gradational (Reading, 1991; Nelson et al., 1991; Kolla et al., 1991) and therefore, these different elements may not always be easily compartmentalized.
Some of the basin floor fan sands, especially in the Frigg Fan, North-Sea, and Marlim Fan of the Compos Basin, offshore Brazil, have been interpreted by some authors, to be commonly and deeply reworked (e.g. Mutti, 1992; Vail et al., 1991) by contour currents. The evidences given by these authors are ; irregular sand sequences, erosional truncation on top of thick coarse sand, occasional cross laminations in otherwise massive sands; thin rippled sand laminations, channelling and the presence of interpretive “contour- mound-like” features on an occasional seismic line. It is possible that the contour currents could have reworked and redeposited relatively thin layers of sands on top of thick sand beds or in overbankbeds (Shanmugan et al., 1990). However, deep erosion, reworking and redeposition of thick
sand beds by contour currents in basin floor fans have not been well-documented.
2.2. PROBLEMS IN THE SCOPE AND USE OF THE BASIN FLOOR FAN CONCEPT
There are many draw-backs and problems in the name, scope and application of the “basin floor fan” concept. The characteristics listed in Table I may or may not lead to delineation of a fan-shaped turbidite system. Confusion exists in the usage of this name, and not infrequently, it is thought to indicate only one of the three intended aspects (Armen- trout et at., 1991; Morton, 1992; Mutti, 1992; Walker, 1992). This is probably because the term "basin floor fan” includes many aspects, not evident in the name itself.
One of the often-cited causes for the formation of “basin floor fan” is that the fluvial systems would supply sand-rich sediments directly to the shelf-edge during the maximum relative lowstand. However, a mud-rich supply system such as the Mississippi River, although likely to be more sand- prone during the maximum relative lowstand, might still have been mud-rich rather than sand-rich at that time.
“Basin floor fans” are typically deposited in basinal settings. However, depending on the tectonic setting, sediment grain size, shelf-slope gradients and volume of sediment- gravity flows, many types of mass-transport complexes (MTC’s) and sediment-gravity flow deposits (turbidites and related deposits) can also be laid down in basins during

BCREDP 17 (1993) LOWSTAND DEEP-WATER SILICICLASTIC DEPOSITIONAL SYSTEMS 71
the same sea-level phase as that of the “basin floor fan” : slides, slumps, debris-flow deposits, base-of-slope, mud- rich or sand-rich aprons, channel (small or large) -overbank systems, channel (leveed or unleveed)- attached lobes, with or without channels, suprafan lobes, detached lobes (Type I, System) (Nelson & Nilsen, 1984; Mum, 1985; Normark & Piper, 1985; Kolla & Coumes, 1987; Prior & Bornhold, 1989; Weimer, 1989; Kolla et al., 1991; Kenyon, 1992; Nelson et al., 1991; Twichell et al., 1991). The detached and suprafan lobes have been conceptually included in the “basin floor fan”. Other features such as lobes with subtle channels, lobes attached to leveed channels, subtle channels with overbanks, and base-of-slope, sand-rich aprons have not been included (see for example Vail et al., 1991), but their seismic and log expressions may be similar to those of basin floor fans (e.g. Kolla et al., 1991; Peres, 1990). However, the reservoir distributions of these depositional elements are not the same. On the other hand, it should be noted that the log shapes of basin floor fans are not unique (e.g. Me Goveny & Radovich, 1985), notwithstanding the claims by some researchers (e.g. Pacht et al., in press) to the contrary, and the facies architecture of these fans have never been well-documented. MTC’s and mud-rich aprons have different seismic and log expressions than those of the basin floor fan. Finally in some basins, probably away from sedimentary sources, shales and hemipelagic shales may be deposited during the same sea-level phase as that of “basin floor fan”. For example Morton (1992) reported that “basin floor fans” (apparently the usage here is for a stratigraphic unit related to maximum lowstand) in some late
Neogene intraslope basins of the Gulf of Mexico are sand- poor.
It is thus apparent that the name “basin floor fan” is very restrictive both literally and conceptually, and does not adequately take into account the variety of deep-water depositional elements and facies that can occur during rapid eustatic sea-level falls.
3. — SLOPE FAN AND EARLY LOWSTAND WEDGE
Conceptually, the “slope fan”, comprises three aspects (Fig. 3; Tab. II) (Vail, 1987; Vail et al., 1991; Pacht et al., in press) : a mix of physiographic settings, originally slope and basin, and currently platform as well; a stratigraphic unit deposited during the early rise of relative sea-level; and a variety of depositional systems : mass transport complexes (MTC’s), debris flows, channel-overbanks and leveed channel-attached lobes (Vail, 1987; Vail et ai, 1991). However, the current usage of “slope fan” also extends to deltaic deposits on the platform updip, and shales and hemipelagic shales in the basins downdip of the originally defined slope fan, as long as they were deposited during the early sea-level rise (Pacht et at, in press). The deltaic deposits updip may, in part, have supplied sediments to the downdip deep-water portion of the slope fan.
LOWSTAND SYSTEMS TRACT SLOPE FAN COMPLEX
SILICICLASTICS
Log Pattern of Slope Fan (Channel-overbank)
Resistivity Sonic
(Lobe)
Digitated
Stream Profite • 3 Stream Profile - 2
Soil
(Channel)
Turbidite Splay SandChannelAttached Lobes
Top Basin Floor Fan Surface
Plan View of Channel/Levee Lobe
HIGH
Figure 3Schematic characteristics of slope fan package (or mini-systems tract) within the lowstand systems-tract with its position on the eustatic
curve shown (slightly modified after Vail et at, 1991).

72 V. KOLLA BCREDP 17 (1993)
SEISMIC LOG SEDIMENTARYCHARACTERISTICS CHARACTERISTICS CHARACTERISTICS
1. CHANNELS EXHIBIT :GULL-WING MOUNDS, BOW-TIE SHAPED AND CONCAVE A REFLECTIONS :CHANNEL FILLS WITH HIGH AMPLITUDE REFLECTIONS ; LEVEE OVERBANKS —► DISCONTINUOUS TO SEMI-CONT REFLECTIONS WHICH DOWNLAP AWAY FROM THE CHANNELS ; LATERAL PIN CHOUT REFLECTION GEOMETRY MAY DEVELOP UKE IN BASIN-FLOOR FAN.
1. CRESCENT-SHAPED INTERVALS OF INDIVIDUAL CHANNEL/OVERBANK UNITS. BOTH THICKENING AND THINNING UNITS ; BLOCKY SHAPES AND BLOCKY SHAPES WITH FINING UPWARD CHARACTER IN CHANNELS ; DISTAL CHANNELS : ROUNDED BASE AND TOP; OVERBANKS : HIGHLY SERRATED, LAMINATED LOW SP ;ON THE WHOLE AGGRADATIONAL, BUT ALSO PROGRADATIONAL.
1. CHANNEL/OVERBANK/INTERCHANNEL CREVASSE-SPLAY DEPOSITS & LEVEED CHANNEL-ATTACHED LOBES ; CHANNEL FILLS MAY CONSIST OF MASSIVE SANDS (B AND TO SOME EXTENT A FACIES! and/or MUDSTONE FACIES.WITHIN CHANNEL-OVERBANK SYSTEMS, SANDS THICKEN AND THIN UPWARD ; LEVEED CHANNEL-ATTACHED LOBESCOULD BE THICKENING OR THINNINGUPWARD.
2. CHAOTIC , RANDOM DISCONT. SEISMIC REFLECTIONS ; HUMMOCKY
2. CHAOTIC FACIES : IF THEY ARE FORMEDBY SMALL CHANNEL-LEVEE COMPLEXES, EXHIBIT LOGSHAPES AS ABOVE ; IF PRODUCED MASS-WASTING, VARIABLE LOG SHAPES.
2. IF CHANNELS, CHARACTERISTICS AREAS ABOVE.MASS-TRANSPORT COMPLEXES EXHIBITDEFORMED BUT VARIABLE SEDIMENTARYCHARACTERISTICS.
3. UPDIP PLATFORM, PARALLEL, SEMI- CONTINUOUS TO CONT. REFLECTIONS
3. MAY EXHIBIT AGGRADATIONAL, COARSENING OR FINING UPWARD SEQUENCES: WITH STRATA CORRELATABLE OVERMANY MILES.
3. DELTAIC OR SHALLOW-WATER SYSTEMS, DEPOSITED CONTEMPERANEOUSLY WITHDEEP-WATER TURBIDITES.
4. PARALLEL, CONTINUOUS TO SEMI CONT. REFLECTIONS WITH MODERATE TO HIGH AMPLITUDES SIMILAR TO (3).
4. SHALY LOG INTERVAL 4. SHALES, SOMETIMES CARBONATE-RICH.
TABLE IISeismic log, and sedimentary characteristics of slope fan complex (Vail et al., 1991 ; Pacht et al., in press).
There do not appear to be any serious problems in the use of characteristics and criteria listed in Table II (Fig. 3), for identifying the gross, slope fan stratigraphic unit with the exception that the small or subtle channelled overbanks may be expressed by lateral-pinchout, seismic-reflection geometry similar to that of a basin floor fan. However, there are significant problems in the scope and use of the "slope fan” concept and name.
3.1. PROBLEMS IN THE SCOPE AND USE OF SLOPE FAN CONCEPT
Both terms, “early lowstand wedge" and “slope fan” represent deposits laid down during the early rise of relative sea-level (Posamentier & Erskine, 1991). The “early lowstand wedge” is indeed a name for a stratigraphic unit and can include, in principle, any number or type of deep-water depositional systems. Although “slope fan” is defined to connote a stratigraphic unit, the words “slope” and “fan” make it too restrictive to include a variety of depositional systems on the platform, on the slope and in the basin. Thus, the following critique applies to “slope fan” only :
1) the “slope fan” may not be a fan-shaped body, in which case it need not be called a fan;
2) if the “slope fan” can occur on the platform, on the slope and in the basin, there is no reason why it should be
called “slope fan” only. Incidentally, to quite a few researchers, “slope fan” implies a deep-water fan which only occurs on the slope (e.g. Walker, 1992);
3) in the modern ocean, fans have not commonly developed on the continental slopes, except for isolated gullies, channels and occasional mud-rich small fans, like the Crati Fan (Ricci Lucchi et al., 1985).
Most of the deep-sea fans in the modern ocean have developed in what are called continental rise or basinal settings, with gradients much lower than those of the continental slopes. Calling the Indus, Bengal, Mississippi, Amazon etc. Fans, “slope fans”, because they have channel-overbanks, is highly inappropriate. The usually low gradients (slopes) of these fan settings do not qualify them to be called “slope fans” because “slope” is normally understood to be the continental slope. It should be noted here that basins, especially the large ones, are never perfectly flat and usually have some gradients. It is also very probable that the “slopes” of the intra-slope basins, where the concepts of the occurrence of “slope fans” have originated, do not have the true gradients of the continental slopes but have the somewhat lower gradients of the continental rise as the sea-floor approaches the basinal areas. If so, the usage of the name “slope fan” is not even appropriate when relating to deposits on slopes of intraslope basins.
The “slope fan” systems-tracts, especially the deeper channel-overbank and slump components, may commonly

BCREDP 17 (1993) LOWSTAND DEEP-WATER SILICICLASTIC DEPOSITIONAL SYSTEMS 73
be deposited not only during the early rise as depicted in idealized sequence-stratigraphic models but also during the rapid fall of eustatic sea-level (i.e. during what is referred to as the "basin floor fan” time; e.g. Weimer, 1989). Moreover, depending on the physiography (presence of canyons and climate), turbidite deposition may often continue to be significant into the mid-to-late-sea-level rise (part of transgressive systems-tract), and even in to highstand times (Heezen et ai, 1964; Perlmutter, 1985; Kolla & Perlmutter, in press). The basin-specific unique conditions determine the actual timing and the type of turbidite systems (Posamentier, in press).
The term “slope fan” was originally applied to channel- overbank systems, channel-attached lobes and slumps in deep-water (Vail, 1987). Currently, the extended usage even includes deltas on the platform (shallow-water deposits), and deep-water shales and hemipelagic shales in the basins, deposited contemporaneously with channel-overbank complexes, MTC’s and slope aprons (Pacht et ai, 1990, in press). Thus, the “slope fan” stratigraphic unit presently encompasses many deep-water as well as shallow- water depositional systems with vastly varying distributions of reservoir-prone lithologies. On the other hand, channel- attached lobes and even channel (small)-overbanks classified as “slope fans” may resemble “basin floor fans” in seismic reflection facies, especially in the growth-fault, compartmentalized basins, because the channel signature may either be destroyed or is not resolvable.
In conclusion, “basin floor fan” and “slope fan terms”, as presently used in sequence stratigraphy, although sounding simple, represent conceptually many different aspects : physiographic setting, stratigraphic unit tied to a particular sea-level stage and an array of depositional systems. However, the terms themselves are too restrictive to embrace these many aspects and have therefore caused confusion. Also, none of the three aspects, physiographic setting, stratigraphic unit in relation to a sea-level stage and the variety of depositional systems can be uniquely assigned to one or the other of the two names. The names, “basin floor fan” and “slope fan” do not adequately take into account the dynamics and variability of sedimentary sources and processes, depositional systems and distribution of reservoir lithologies, their settings and timing of occurrence.
4 — PROPOSED NOMENCLATURE OF LOWSTAND DEEP-WATER SILICICLASTIC SYSTEMS
The lowstand deep-water siliciclastic depositional systems mainly consist of turbidity-current and related sediment-gravity flow deposits. The nomenclature proposed here emphasizes, within the sequence-stratigraphic framework, the seismic, log and sedimentary characteristics of the erosional/depositional features of the main turbidite and related elements commonly recognized (Mutt: & Normark, 1987; Mum, 1992; Tabl. Ill) : shelf-edge failures and canyons, channels, overbanks and lobes. Lobes are sheet or sheet-mounded (tabular) sand bodies, preferably with lobate outline and with no channels or with small channels having no overbanks. The lobes may or may not be attached to channels. To this list of turbidite elements, we also add mass-transport complexes (slides, slumps etc.), and debris flows grading into turbidites which may be mud-rich or
sand-rich, slope or base-of-slope aprons (Pickering et al., 1989; Nelson et ai, 1991). The distinction between the lobes of Mum (1985) and sand-rich aprons may be difficult to make in subsurface studies because of widespread occurrence of sands and lack of channels in both these elements. Also, depending on single or multiple sedimentary sources, their deposition may be gradational (Nelson et ai, 1991; Reading, 1991) and cannot always be separated.
The aforementioned turbidite and related elements within the lowstand systems-tract may be grouped into three convenient categories, depending on the relative sea-level stage (Fig. 4; Tab. Ill) : falling sea-level to maximum lowstand, early to middle lowstand (maximum lowstand through part of rising sea-level), and late lowstand systems (part of rising sea-level). The division between lowstand and transgressive systems tract (TST) adopted here is very arbitrary and is not always sensu stricto that of Posamentier & Vail (1988) because the turbidites initiated during the lowstand may continue to be significantly deposited in some areas well into what is normally defined as part of transgressive systems-tract time (Fig. 4 and 5) (Kolla & Perlmutter, in press). This late continuation in some areas can result from landward extension of canyons due to retrogradational slumping during the sea-level rise, when huge loads of sediment are fed into the canyon during déglaciation. In other areas without extensive and long canyons but with appropriate sedimentary sources and depocenters, the timing of turbidite sedimentation may be more similar to that depicted by models of Posamentier & Vail (1988) and Vail et ai, (1991). Thus, the proposed early-to-middle and late lowstand systems categories may include parts of the transgressive systems-tracts for some areas but not for others. Also, many depositional systems and facies occur during both the falling sea-level-to-maximum and early-to-middle lowstand stages (Fig. 4 and 5; Tab. Ill) or perhaps even later, because the type of facies and depositional elements depend not only on sea-level, but also on sediment grain size, physiography and tectonic setting (Kolla et ai, 1991). Thus, the limits between the maximum, early-to-middle and late lowstand categories of systems are arbitrary and overlap.
4.1 A GENERAL PROCEDURE FOR USING THE NOMENCLATURE
Based on condensed sections (of maximum flooding surface), unconformities and other key surfaces, a sedimentary section may be divided into sequences and systems-tracts (lowstand, highstand etc.; Vail, 1987). The subsequent, first step is to establish a paleodepositional profile which is divided into shallow and deep-water settings. Within this framework, the available data for the deep-water section of the lowstand systems-tract may then be examined for identifying depositional facies, elements and systems. Emphasis is placed on the observations of all available data sets. Observations should be made with the least interpretation, avoiding undue influence by models. The next step is to translate these observations into sedimentary characteristics, processes and depositional systems. For convenience, the lowstand systems-tract on seismic sections or on logs may be sub-divided into two or three smaller convenient divisions (mini-systems-tracts) on the basis of internal condensed sections, discordances or other key surfaces, if possible, and these individual mini-systems-tracts may be labelled falling sea-level-to-maximum lowstand, early to mid-

74 V. KOLLA BCREDP 17 (1993)
Figure 4Terminologies of deep-water systems of Vail et al. (1991), and Posamentier & Erskine (1991) in comparison to three categories
proposed here.
die lowstand, etc. If the data do not warrant this type of subdivision related to a sea-level stage, any other type of convenient subdivision, for example, lower, middle, and upper, slope to basinal systems, which merely refer to their positions in vertical sections within the lowstand system- tract, may be made. These individual mini-systems tracts or subdivisions may then be mapped. Identification of de- positional facies and elements within this framework may facilitate predictions of reservoir-prone lithologies. However, because the proposed nomenclature of depositional elements is divorced from the names of sea-level-tied stratigraphic units or physiographic settings, its use is not necessarily contingent upon any specific subdivision of the lowstand systems-tract.
In subsurface studies, if pelagic and hemipelagic shales are recognized and isolated in a deep-water environment, the other sediments may be considered, in a first approximation, as turbidites and related deposits. On the basis of more diagnostic characteristics in the data, further identification of the specific depositional facies is then attempted. For example, if gull-wing mounds or bow-tie concave upward reflections are observed on the seismic data, chan- nel-overbanks may be inferred. Log and core characteristics may confirm this. If, on the other hand, lateral pinchout reflection geometry, reflections onlapping the basin margins etc. (some or all the reflection characteristics listed in 1 under the maximum lowstand systems in Table III), are pre
sent, the system may be termed onlapping turbidite fill, and channel-overbanks with subtle channels may be inferred. Alternately, one may consider the same as sheet-mounded, onlapping fill and infer sheet or sheet-mounded turbidites, which may be lobe-like features, especially if they overlie the sequence boundary. The lobes may be attached, detached or “braided suprafan lobes" (Shanmugam, 1992; Mum,1985). The above reflection characteristics may also be indicative of sand-rich, base-of-slope aprons. Core, log, 3-D seismic characteristics and regional sequence stratigraphy may help to define more precisely the type of turbidite and related elements. However, the different types of lobes attached and channelled or detached and unchannelled (Mutti, 1985; Normark & Piper, 1985; Twichell et al., 1991), are not easily distinguished in the subsurface. Distinction between lobes on the one hand, and base-of-slope, sand- rich aprons in the subsurface on the other, may also be difficult, although Nelson et al., (1991) discussed in detail the characteristics of both the features. Recently, Kenyon (1992), from his world-wide side-scan data coverage, suggested that the sand-rich aprons in the present ocean may be analogous to the Type I system (detached lobes) of Mutti (1985) or basin floor fan of Vail (1987). However, the lateral and vertical facies changes in the sand-rich aprons of Kenyon (1992) have not yet been documented.
Identifying a depositional feature as a fan or a lobe from one seismic-section or one log interpretation is discouraged

BCREDP 17 (1993) LOWSTAND DEEP-WATER SILICICLASTIC DEPOSITIONAL SYSTEMS 75
here. Well-defined valleys and channels with lobes which, together, form a fan-shaped system, would ideally qualify for the use of the term”fan”. However, idealized characteristics and shapes are not frequently observed in reality. Even in the modern ocean, many fans are not actually fan-shaped. The physiography of the basin receiving the sediment dictates the shape of the turbidite systems. Fans in the modern ocean are complex features resulting from multiple sea-level changes and many sequences. When turbidite systems are framed into sequences, the fan shapes of these systems within each sequence may become even less obvious. Nelson et al., (1992) suggested that turbidite systems characterized by valleys (channels) in proximal areas and attached lobes in the distal areas, should be called fans. This suggestion requires that the morphology and depositional elements of the entire turbidite system be known. This definition does not address the question of whether the entire turbidite system should be fan-shaped or not. If we adopt Nelson et al., (1992) definition of fan for fan valley-attached lobe system only, what should one call the detached lobes of Muttls (1985) Type I turbidite system? It does not really matter whether or not we call a turbidite system a fan, as long as we identify and map the elements of the system. “Fan” or not, to further qualify the turbidite systems, the dimensions of the system (large, medium, small, etc., Nelson et al., 1992), as well as any other descriptors (eg. analogous but not necessarily identical to upper, middle and lower fan from updip to downdip of the system; Damuth et al., 1992), can be incorporated into the proposed nomenclature. Depositional features with lateral pinchout reflection geometry,
bidirectional reflection downlaps etc. (Posamentier & Erskine, 1991) may be designated as lobes if they are lobate in outline. Cores and logs may confirm their lithological nature. Qualifying descriptors can be used for less than ideal shapes of lobes. Although the characteristics listed in Table III are for identifying the gross depositional facies, more details on facies architecture from studies of cores, FMS (formation microscanner), logs and 3D seismics can also be included as they become available. Thus, the nomenclature is flexible enough to be modified and adopted for the increasing details of turbidite systems. Also, although the nomenclature is shown here for lowstand systems-tract, it can be used for any other systems-tracts if, indeed, the characteristics are present.
The terminology proposed here does not solve all the problems of nomenclature of deep-water siliciclastic systems in sedimentology and is by no means complete. For example, the contourite features are not even included. Also, the terminology does not guarantee the correct identification of turbidite elements. On the other hand, it is hoped that the proposed terminology helps to reconcile the sound principles of sequence stratigraphy, and the dynamics and variability of depositional systems, and helps to name the turbidite and related elements more objectively, without being too encumbered by models. If inferences cannot be made about the specific depositional facies or a particular turbidite element from the available data, one may simply cail it turbidite and related deposits, qualified by the observed seismic, log or other characteristics.
MFS: MAXIMUM FLOODING SURFACE TST: TRANSGRESSIVE SYSTEMS -TRACT HST: HIGHSTAND SYSTEMS -TRACT
Figure 5Schematic cross-sections showing the spatial and temporal arrangement of turbidite and related elements and systems-tracts of major
canyon and non-canyon areas.

STR
ATIG
RAP
HIC
UN
IT(M
INI-S
YSTE
MS
TRAC
TS)
DEPOSITIONAL SYSTEMSOR FACIES
SEISMIC CHARACTERISTICS LOG AND SEDIMENTARY CHARACTERISTICS
LATE
LOW
STAN
DSY
STEM
S(P
RO
GR
ADIN
GW
EDG
E)SHALLOW-WATER DELTA ANDPRODELTA CLAYS1) TOE OR SHINGLED TURBIDITES AND
RELATED DEPOSITS;SLOPE-CHANNEL TURBIDITES
2) MASS-TRANSPORT COMPLEXES -►SLOPE APRONS
3) PRODELTA CLAYS & WEDGE
1) & 2)SHINGLED TURBIDITES, MAY HAVE ONLAPPING CHARACTERON THE BOTTOM SETS OF PWC.MAY BE LARGELY SIMILAR TO 1) & 2) UNDER EARLY-TO-MIDDLELOWSTAND SYSTEMS BELOW
3) SIMILAR TO 2) ABOVE;ALSO PARALLEL REFLECTIONS
1) TOE TURBIDITES MAY BE SIMILAR TO 1) IN MAX LOWSTAND
SYSTEMS. OTHERWISE MAY RESEMBLE 1) & 2) IN EARLY-TO-MIDDLE LOWSTAND SYSTEMS BUT INTERLEAVED WITH CLINO-
FORMS.3) PRIMARILY SHALES
UP-DIP - DELTAIC AND OTHER SHALLOW-WATER DEPOSITS
(/)f— 1) TURBIDITES AND RELATED SEDIMENT 1) GULL-WING MOUNDS, BOW-TIE SHAPED & CONCAVE UP- 1) CRESCENT-SHAPED INTERVALS OF INDIVIDUAL CHANNEL /
> GRAVITY-FLOW DEPOSITS, WARD REFLECTIONS ; LEVEE-OVERBANKS - DISCONTINUOUS OVERBANK UNITS ; BOTH THICKENING AND THINNING LOGCO>■ Z CHANNELIZED, TO CONTINUOUS (VARIABLE AMPLITUDE) REFLECTIONS. SHAPES. BLOCKY LOG SHAPES AND BLOCKY LOG SHAPES</5 CO CHANNEL-OVERBANKS, DOWNLAP AWAY FROM THE CHANNELS. LATERAL PIN- WITH FINING UPWARD CHARACTER IN CHANNELS ; OTHLRz CO CHANNEL-ATTACHED LOBES WITH CHOUT REFLECTION GEOMETRY MAY DEVELOP LIKE IN BA- LOG SHAPES POSSIBLE. SEDIMENTARY CHARACTERISTICS
SUBTLE CHANNELS —►FANS, TYPE II SIN-FLOOR FAN. HUMMOCKY FACIES MAY DEVELOP DUE TO AS DESCRIBED IN "SLOPE FAN"s & III SYSTEMS OF MUTTI (1985) ; NUMEROUS CHANNELSO 2) MTC'S EXHIBIT VARIABLE LITHOLOGIES AND LOG SHAPESUJ
_J SLOPE-CHANNELS AND ATTACHED (eg. NAME : BOW-TIE ONLAPPING FILL etc...)LOBES 2) CHAOTIC, RANDOM DISCONT., HUMMMOCKY MOUNDED RE- 3) LITHOLOGIES MAY VARY FROM SILTY SHALE TO SHALE TO
g î> 2) SLUMPS, MTC'S, DEBRIS-FLOW FLECTIONS GRADING INTO PARALLEL, MODERATE - HIGH CARBONATE SHALES6
DEPOSITS & SOME TURBIDITES —► AMPLITUDE REFLECTIONScc SLOPE & BASE-OF-SLOPE, APRONS (eg. NAME : CHAOTIC ONLAPPING FILL)
3 (MUD TO SAND RICH), CANYON FILLS 3) LOW-AMPLITUDE, REFLECTIONS, LATERAL PINCHOUT RE-<lit 3) SHALES TO HEMIPELAGIC SHALES FLECTION MAY SOMETIMES DEVELOP. HEMIPELAGIC SHALES :
SHEET-DRAPING, HIGH-AMPLITUDE REFLECTIONS
1) TURBIDITES, DEBRIS-FLOW & SEDI- 1) LATERAL PINCHOUT REFLECTION GEOMETRY ; HIGH-AMPLITU- 1) BLOCKY SHAPES WITH SHARP FLAT BASE AND TOP. OTHER
MENT. GRAVITY FLOW DEPOSITS :DE REFLECTIONS ONLAPPING THE BASIN MARGIN ; LOG SHAPES, COARSENING OR FINING UPWARD OR CYLIN-
SHEET OR SHEET MOUNDED, UN- INTERNAL BIDIRECTIONAL DOWNLAP ; MAY ABUT THE DOWN- DRICAL LOG SHAPES MAY ALSO BE COMMON. SEDIMENTARYs CHANNELED OR WITH SUBTLE CHAN- THROWN SIDE OF GROWTH-FAULT ; SUBTLE EXTERNAL MOUN- CHARACTERISTICS AS DESCRIBED IN THE "BASIN-FLOORf—(fi h- NELS (LOBES OR OTHERSHAPES —►
DING (TO SHEET SHAPES) ; COULD BE HUMMOCKY WITH VA- FAN"U) >
CO FANS. TYPES I AND II OF MUTTI, 1985) RIARI F AMPI ITIIDF led. NAME : MOUNDED ONLAPPING FILLI2)
z z a) BOTH THICKENING AND THINNING UPWARD UNITS ; BLOCKYCO$
<m a) SUBTLE CHANNELS WITH OVERBANKS
a) SIMILAR TO 1) : LOG SHAPES, FINING UPWARD ; SEDIMENTARY CHARACTE-
o 6-►FANS
b) GULL-WING MOUNDS, BOW-TIE CONCAVE-UPWARD REFLEC- RISTICS AS DESCRIBED FOR "SLOPE" FAN
g CHANNEL-ATTACHED LOBES WITHTIONS (SEE 1) IN EARLY-TO-MIDDLE LOWSTAND SYSTEMS b) LOG SHAPES MAY BE SIMILAR TO 2a)ABOVE (eg. NAME : "BOW TIE" ONLAPPING FILL)Q OR WITHOUT SUBTLE CHANNELS 3)
1- -► FANS 3) a) VARIABLE LOG SHAPES AND LITHOLOGIES, GRADING DOWN-LU> 3 b) CHANNEL-OVERBANKS a) CHAOTIC, HUMMOCKY & MOUNDED REFLECTIONS GRADING DIP INTO SANDY TURBIDITES
_J INTO PARALLEL, MODERATE - HIGH AMPLITUDE REFLECTIONS b) MAY BE SIMILAR TO 1)LU —! 3) (eg. NAME : CHAOTIC MOUNDED ONLAP FILL)
ÜCO a) MASS-TRANSPORT COMPLEXES,
b) SIMILAR TO 1) c) THIN GRAVEL-PEBBLE DEPOSITS : LOG SHAPES : THAIN, WITHCO SLUMPS, DEBRIS FLOWS WITH SOME SHARP BASE & TOP.
TURBIDITES - BASE-OF-SLOPE APRONS. c) UNRESOLVABLE4) DEPOSITIONAL MECHANISMS MAY VARY FROM PELAGIC TO
b) SAND-RICH BASE-OF-SLOPE APRONS 4) LOW-AMPLITUDE REFLECTIONS.HIGH-DILUTE TURBIDITY-CURRENT DEPOSITION. LITHOLOGIES
(TURBIDITES AND DEBRIS-FLOW DE- LATERAL PINCHOUT REFLECTION GEOMETRY MAY ALSO DEVE- MAY VARY FROM CARBONATE-RICH SHALES TO SHALES TOLOP (eg. NAME : LOW-AMPLITUDE ONLAPPING FILL);HEMIPELA- SILTY SHALES.
c) LAG DEPOSITS IN CANYONS GIC SHALES : SHEET-DRAPING, HIGH AMPLITUDE REFLECTIONS4) SHALES TO HEMIPELAGIC SHALES (eg. NAME : SHEET DRAPES)
TABLE IIIProposed nomenclature of depositional facies and elements of turbidite and related systems with seismic, log and sedimentary characteristics. The turbidite and related elements are divided into three arbitrary categories or mini-systems-
tracts : falling to maximum lowstand, early to middle lowstand, and late lowstand.
I, KOLLA
BCR
EDP 17 (1993)

BCREDP 17 (1993) LOWSTAND DEEP-WATER SILICICLASTIC DEPOSITIONAL SYSTEMS 77
5 — CONCLUSIONS
The terms “basin floor fan” and “slope fan” are too restrictive, both literally and conceptually, to describe the many aspects of deep-water siliciclastic systems. Instead, a terminology based on seismic, log, core and outcrop characteristics of these depositional systems and the sedimentary processes inferred therefrom should be used within sequence-stratigraphic framework. This terminology consists of depositional/erosional features of turbidite and related elements : shelf-edge failures/canyons, channels, over banks, lobes, mass-transport complexes and sand-rich or mud-rich, base-of-slope aprons.
Acknowledgements
I thank Peter Homewood, Anne Schwab, H.W. Posamentier, P. Mauriaud and Tor Nilsen for critically reading the manuscript and making constructive comments.
6 REFERENCES
Armentrout, J.M., Malecek, J.J., Braithwaite, P. & Beeman, C.R.( 1991 ). — Seismic facies of slope basin turbidite reservoirs, East breaks 160-161 Field : Plio-Pleistocene Gulf Mexico. — In : Weimer, P. & Link, M.H. (eds.) : Seismic facies and sedimentary processes of submarine fans and turbidite systems. — Springer-Verlag, New-York, 223-239.
Damuth, J.E., Flood, R.D., Manley, PL. & Pirmez, C. (1992).— Proposed terminology for sedimentary and deep-sea fan elements based on studies of Amazon deep-sea fan.— Amer. Assoc. Petroleum Geol. Meeting; Abstracts 26- 27.
Enjoiras, J.M., Gouadain, J., Mum, E. & Pizon, J. (1986). — New turbidic model for lower Tertiary sands in South Viking graben. — In : Spencer, A.M. et al., (eds.) : Habitat of hydrocarbons on the Norwegian Continental Shelf. — Norwegian Petroleum Society; Graham & Trotman, London, 171-178.
Heezen, B.C., Menzies, R.J., Schneider, E.D., Ewing, W.M. & Granelli, N.C.L. (1964). — Congo Submarine Canyon. — Bull. amer. Assoc. Petroleum Geol., 48, 1126-49.
Kenyon, N.H., (1992). — Deep-sea silici-clastic systems : a plan view. — In : Sequence stratigraphy of European Basins, Dijon, Abstracts, 458-459.
Kolla, V. & Coumes, F. (1987). — Morphology, internal structure, seismic stratigraphy and sedimentation of the Indus Fan. — Bull. amer. Assoc. Petroleum Geol., 21, 650-677.
Kolla, V, Martin, R. & Weimer, P. (1991) — Lowstand deepwater clastic fans and related depositional systems : terminology, characteristics, processes and variability. — Gulf Coast Section Soc. econ. Paleont. Mineral. Foundation, eleventh annual research conference, 213-215.
Kolla, V. & Perlmutter, M.A., (in press). — Timing of turbidite sedimentation — Mississippi Fan. — Bull. amer. Assoc. Petroleum Geol.
Mc Goveny, J.E. & Radovich, G.J. (1985). — Seismic stratigraphy and facies of the Frigg Fan complex, North Sea.— In : Berg, O.R. & Woolverton, D.G. (eds.) : Seismic stratigraphy II. — Amer. Assoc. Petroleum Geol., Mem. 29, 139-156.
Mitchum, R.M. (1985). — Seismic stratigraphic recognition of submarine fans. — In : Berg, O.R. & Woolverton, D.G. (eds.) : Seismic stratigraphy-ll. — Amer. Assoc. Petroleum Geol., Mem. 39, 117-136.
Morton, R.A. (1992). — Contrasting styles of late Neogene deep-water sandstone deposition offshore, Texas. — Soc. econ. Paleont. Mineral. — Concepts in sedimentology, vol. 3, 288-295.
Mum, E. (1985). — Turbidite systems and their relations to depositional sequences. — In : Zufa, G.G. (ed.) : Pove- nance of arentes — Nato — ASI series, Riedel Publishing Co, Dordrecht, Netherlands, 65-93.
Mum, E. (1992). — Turbidite sandstones — AGIP publication, Instituto di Geologia, Universita di Parma.
Mum E. & Ricci Lucchi, F. (1972). — Le torbiditi deli’Appe- nino settentrionale : introduzione all’analisi di facies. — Soc. geol. Ital., Mem. 11, 161-199.
Mum, E. & Normark, W.R. (1987). — Comparing examples of modern and ancient turbidite systems : problems and concepts. — In : Leggett, J.K. & Zuffa, G.G. (eds.) : Marine clastic sedimentology : concepts and case studies. — Graham & Trotman, London, 1-38.
Nelson, C.H. & Nilsen, T.H. (1984). — Modern and ancient deep-sea fan sedimendation. — Soc. Econ. Paleont. Mineral. Short Course n° 14, 493 pp.
Nelson, C.H., Maldanado, A., Barber, J.H. & Alonso, B. (1991). — Modern sand-rich and mud-rich siliciclastic aprons : alternative base-of-slope turbidites systems to submarine fans. — In: Weimer, P. & Link, M.H. (eds.): Seismic facies and sedimentary processes of submarine fans and turbidite systems — Springer-Verlag, New-York, 171-190.
Nelson, C.H., O’Connell, S., Maldonado, A., Twichell, D.C. & Pulham, A. (1992). — Classification of turbidite systems : a suggestion for an old problem. — Amer. Assoc. Petroleum Geol. Meeting, Abstracts, 95.
Normark, W.R. & Piper, J.W. (1985). — Navy fan, Pacific Ocean — In : Bouma, A. et al., (eds.) : Submarine fans and related turbidite systems. — Sprinqer-Verlaq, New- York, 87-94.
Pacht, J.A., Bowen, B.E., Beard, J.H. & Shafer, B.L. (1990). — Sequence-stratigraphy of Plio-Pleistocene depositional facies in the offshore Louisiana South Additions. — Trans. Gulf Coast Assoc, geol. Soc., VXL, 643-659.
Pacht, J.A., Bowen, B.E., Shafer, B.L. & Pottorf, X.R. (in press). — Systems tracts, seismic facies and attribute analysis within a sequence-stratigraphic framework — Example from the offshore Louisiana (Gulf Coast). — In : Rhodes, E. (ed.) : Marine clastic reservoirs. — Springer- Verlag.
Peres, W.E. (1990). — Seismic-stragigraphic study of the Oli- gocene-Miocene shelf — fed turbidite systems of the Compose Basin, Brazil. — Ph. D. Thesis, Univ. of Texas, Austin, 188 pp.
Perlmutter, M.A. (1985). — Deep-water clastic reservoirs in the Gulf of Mexico : a depositional model. — Geo-marine Letters, 5, 105-112.
Pickering, K.T., Hiscott, R.N. & Hein, F.J. (1989). — Deep marine environments : clastic sedimentation and tectonics. — Unwin Hyman, New-York, 414 pp.
Posamentier, H.W, (in press). — An overview of sequence stratigraphic concepts : uses and abuses. — Int. Assoc. Sedimentology, spec. publ.
Posamentier, H.W. & Vail, PR. (1988). — Eustatic controls on clastic deposition II — Sequence and systems-tract models. — Soc. Econ. Palont. Mineral., spec, publ., 42, 125-154.

78 V. KOLLA BCREDP 17 (1993)
Posamentier, H.W. & Erskine, R.D. (1991). — Seismic expression and recognition criteria of ancient submarine fans. — In : Weimer, P. & Link, M.H. (eds.) : Seismic facies and sedimentary processes of submarine fans and turbidite systems. — Springer-Verlag, New-York, 197-222.
Posamentier, H.W., Erskine, R.D. & Mitchum, R.M. (1991). — Models for submarine-fan deposition within a sequence- stratigraphic framework. — In : Weimer, P. & Link, M.H. (eds.) : Seismic facies and sedimentary processes of submarine fans and turbidite systems. — Springer-Verlag, New-York, 127-136.
Prior, D.B. & Bornhold, B.D. (1989). — Submarine sedimentation on a developed Holocene fan-delta. — Sedimen- tology, 36, 1053-1096.
Reading, H.G. (1991). — The classification of deep-sea de- positional systems by sediment calibre and feeder system. — J. geol. Soc., London, 148, 427-430.
Ricci Lucchi, F., Colella, A., Gabbianelli, G., Rossi, S. & Nor- mark, W.R., (1985). — Crati Fan, Mediterranean. — In : Bouma, A.H. et al., (eds.) : Submarine fans and related turbidite systems. — Springer-Verlag, New-York, 51-58.
Sangree, J.B., Vail, P.R., & Mitchum, R.M. (1991). — A summary of exploration applications of sequence stratigraphy. — Gulf coast Section Soc. Econ. Paleont. Mineral Foundation 11th annual research conference, 321-327.
Selley, R.C., (1979). — Dipmeter and log motifs in North Sea submarine fan studies. — Bull. amer. Assoc. Petroleum Geol., 63, 905-917.
Shanmugam, G., Spalding, J., Kolb, R.A. & Lockrem, T.M. (1990). — Deep-water bottom current reworked sands :
their recognition and reservoir potential, Northern Gulf of Mexico. — Bull. amer. Assoc. Petroleum Geol., 74, 5, 762 (Annu. AAPG-SEPM Conv., abstr. only).
Shanmugam, G. (1992). — Submarine fan “lobes” — Amer. Assoc. Petroleum Geol. Meeting Abstracts, 118.
Twichell, D.C., Kenyon, N.H., Parson, L.M. & Me Gregor, B.A, (1991). — Depositional patterns of the Mississippi Fan surface : evidence from Gloria-ll and high-resolution seismic profiles. — In : Weimer, P. & Link, M.H. (eds.) : Seismic facies and sedimentary processes of submarine fans and turbidite systems. — Springer-Verlag, New-York, 349- 363.
Vail, P.R. (1987). —Seismic stratigraphy interpretation using sequence stratigraphy : Part I, Seismic stratigraphy, interpretation procedure. — Amer. Assoc. Petroleum Geol., Studies in Geology #29, Vol. 1, Atlas of seismic stratigraphy, Tulsa, Oklahama, 1-10.
Vail, P.R., Audermard, R., Bowman, S.A., Eisner, P.N. & Pe- rez-Cruz, G. (1991). — The stratigraphic signatures of tectonics, eustacy and sedimentation — an overview. — In : Einsele et al. (eds.) : Cyclic stratigraphy. — Springer- Verlag, New-York, 617-659.
Walker, R.J. (1992). — Turbidites and submarine fans. — In : Walker, R.G. & James, N.P. (eds.) : Facies models - Geol. Assoc. Canada, 239-264.
Weimer, P. (1989). — Sequence stratigraphy of the Mississippi fan (Plio-Pleistocene), Gulf of Mexico. — Geo-marine Lett., 9, 185-292.

MIDDLE AND UPPER DEVONIAN MIOSPORE ZONATION OF EASTERN EUROPE
Violetta I. AVKHIMOVITCH, Evgeny V. TCHIBRIKOVA, Tamara G. OBUKHOVSKAYA, Anna M. NAZARENKO, Valentina T. UMNOVA, Lydia G. RASKATOVA,Valentina N. MANTSUROVA, Stanislas LOBOZIAK and Maurice STREEL
AVKHIMOVITCH, V.I., TCHIBRIKOVA, E.V., OBUKHOVSKAYA, T.G., NAZARENKO, A.M., UMNOVA, V.T., RASKATOVA, L.G., MANTSUROVA, V.N., LOBOZIAK, S. & STREEL, M. (1993). - Middle and Upper Devonian miospore zonation of Eastern Europe - Bull. Centres Rech. Explor.-Prod. Elf Aquitaine, 17, 1, 79-147, 4 fig., 26 pi.; Boussens, June 24, 1993. - ISSN : 0396-2687. CODEN : BCREDP.Ce travail représente le résultat d’études collectives et extensives de miospores
dévoniennes trouvées dans diverses régions de l’Europe orientale. 14 zones et 21 subzones, principalement des acmé-zones, sont décrites et illustrées. Elles sont caractérisées par des zones d’assemblages de miospores correspondant à un intervalle stratigraphique allant de la base du Dévonien moyen au Dévonien supérieur (Famennien moyen).Violetta I. Avkhimovitch, Tamara G. Obukhovskaya, Belorussian Geological Prospec
ting Research Institute (BelNIGRI), Staroborisovsky Trakt 14, 220114 Minsk, Belarus; Evgeny V. Tchibrikova, ul. Karla Marxa 16, Kor. 2, 45000 Ufa, Bashkor- stan, Russian Federation; Anna M. Nazarenko, Valentina N. Mantsurova, Institute Volgograd Nepeneft, Prospekt Lenina 26, 400085 Volgograd, Russian Federation; Valentina T. Umnova, PGO “Tsentrgeologiya”, Varshavskoe Shosse 39a, 113105 Moscow, Russian Federation; Lydia G. Raskatova, Voronezhskiy Gosudarstvenniy Univesitet, Universityetskaya Oblast 1, 394693 Voronezh, Russian Federation; Stanislas Loboziak, Université des Sciences et Technologies de Lille, URA CNRS 1365, Flandres-Artois, Sciences de la Terre, F-59655 Villeneuve d’Ascq, cedex; Maurice Streel, Université de l'Etat, Laboratoire de Paléontologie, Place du 20 août, B-4000 Liège. - February 5, 1993.
Mots-clefs : Miospores, Biostratigraphie, Dévonien moyen, Dévonien supérieur, Plate-forme russe.
ABSTRACT
The present work is a result of collective and extensive studies of Devonian miospores found in various regions of Eastern Europe. 14 zones and 21 subzones, mainly acme-zones, are described and illustrated. These are characterized by zonal miospore assemblages which comprise a stratigraphic interval from the base of the Middle Devonian to the Upper Devonian (Middle Famennian).
Key words: Miospores, Biostratigraphy, Middle Devonian, Upper Devonian, Russian Platform.
CONTENTS
INTRODUCTION............................................................................ 80
1. - DESCRIPTION OF THE PALYNOLOGICAL ZONES ANDSUBZONES................................................................ 80
2. - BIOSTRATI GRAPHICAL RELATIONS BETWEEN THEEAST EUROPEAN PLATFORM AND THE ARDENNE- RHINE REGIONS...................................................... go
3. - LIST OF TAXA CITED IN TEXT AND PLATE EXPLANATIONS.................................................................... 90
4. - REFERENCES............................................................ 94
0396-2687/93/0017-0079 $ 13.80 © 1993 elf aquitaine production, F-31360 Boussens

80 V.l. AVKHIMOVITCH, E.V. TCHIBRIKOVA, T.G. OBUKHOVSKAYA, A.M. NAZARENKO, V.T. UMNOVA,L.G. RASKATOVA, V.N. MANTSUROVA, S. LOBOZIAK AND M, STREEL
BCREDP 17 (1993)
INTRODUCTION
Miospore zonation of the Devonian deposits in Eastern Europe was first worked out by a large group of palynolo- gists of the former Soviet Union in 1984 (Palynological meeting, 1984). In 1989, these miospore zones were used as biostratigraphic units in the compilation of the Unified Stratigraphic Devonian Scale of the East European Platform (Rzhonsnitskaya & Kulikova, 1991). The recently obtained palynological data have now made it possible to amend and refine the scale of zonal differentiation with more detail. In this study, the “Soviet” palynologists have used the morphological classification described by Potonié & Kremp (1954) instead of the earlier adopted classification by Naumova (1953).
To complete this study an ad-hoc group was established, whose objective was to collate and to synthesise all the palynological data obtained in the various regions of Eastern Europe : Pripyat Depression (Belarus), Central Devonian Field and Central regions of the East European Platform, Volga river valley near Volgograd, Timan-Pechora Province, Volga-Ural region (Russia) and Dnieper-Donetsk Depression (Ukraine) (Fig. 1).
The Unified Devonian Chronostratigraphic Scale of the East European Platform (Rzhonsnitskaya & Kulikova, 1991) is used in this study with the amendments based on the changes of miospore assemblages (Fig. 2).
The boundaries of some stratigraphic units, in particular the bases of the Eifelian, the Givetian and the Frasnian, do not exactly conform to the ones proposed by the International Subcommission on Devonian Stratigraphy. The Frasnian stage is divided into Early [C. optivus - S. krestovnikovii (OK) Zone and G. semilucensa - P. donensis (SD) Zone], Middle [A. ovalis - V grumosus (OG) Zone] and Late [C. detiquescens - V. evlanensis (DE) Zone] Frasnian. The Fras- nian/Famennian boundary is drawn at the base of the C. vimineus - G. vasjamica (VV) Zone which is only identified in the most complete sections of some regions. The Famen- nian deposits are divided into Early [C. vimineus - G. vasjamica (VV) Zone, C. cristifer - D. zadonica (CZ) Zone andL. immensus (Im) Zone], Middle [C. varicornata (CVa) Zone] and Late [D. versabilis - G. famenensis (VF) Zone and R. lepidophyta - H. explanatus (LE) Zone] Famennian.
The lowermost and uppermost intervals of the Devonian section are not considered in this paper. The Lower Devonian interval has not been documented by new materials while the Late Famennian interval has been comprehensively described by Avkhimovitch (in press) in the Pripyat Depression (Belarus).
1 DESCRIPTION OF THE PALYNOLOGICAL ZONES AND SUBZONES
The zonal index species were chosen for various reasons : lateral widespread and abundant occurrence (acme- zone), restriction to a definite (sometimes narrow) stratigraphic interval, characteristic first appearance or extinction,... A stratigraphic range of selected miospores is given in Figure 3.
Retusotriletes clandestinus (RC) Zone(PI. 1)
Age : Late Emsian
It was established as the second phytostratigraphic zone in the western slope of the Ural and near the Ural (Tchibri- kova & Naumova, 1974). Afterwards it was renamed R. clandestinus Zone (Arkhangelskaya, 1980). The “Middle Devonian” Takatin and Viazov deposits are assigned to this zone in the western slope of the Ural and in some areas near the Ural (Tchibrikova, 1972; Araslanova, 1976; Arkhangelskaya, 1985). The lowermost Ryazsk Florizon In the Central regions of the Russian Platform (Arkhangelskaya, 1985) and lower parts of the Vitebsk Horizon in Belarus also belong to this zone which corresponds to the Takatin and Viazov Horizons of the Unified Stratigraphic Scale.
The zonal miospore assemblage is characterized by abundant species of the genera Retusotriletes, Apiculiretu- sispora, Dibolisporites, many of which have indistinct area and numerous plicae. The zonal species R. clandestinus is a typical representative at this level. Miospores with filmy outer coatings are not abundant in this zone. Species of the genus Emphanisporites occur in the western parts.
In the eastern part, this zone is divided into two subzones.

Early
DEVO
NIA
N Middle
DEV
ON
IAN
La
te DE
VON
IAN
BCREDP 17 (1993) MIDDLE AND UPPER DEVONIAN MIOSPORE ZONATION - EASTERN EUROPE 81
A B C
oD. versabilis - G. famenensis
V F
S. papulosus SPPla vsk-1)
D. golubinicus DG
z C. lupinovitchi CL Optukhov
*-* T3Z .75
C. varicornalaC. bicornata G B Lcbediansk
U2
G.~ famenensis minutus G F Pet rikov
<u* L. im me ns us Irn Kletsk
>Nu C. cristifer - D. zadunica
C. zadonica Z a03
UJ cz G. nntata microspinosus GM
C. vimineus ■ C. vasjamica V V Volvograd
OJ C. deliquescens - V. evlanensisG. subsuta GS Liven
D E A. speciusa AS Evlanov
Z "M. radiatus M R Voronezh
A. uvalis ■ V. grumosus
OG
2 rs7 ^
C. vellasjanicus CVe Rechitsa
2,CO< S. bellus SB
u. G. semulicensa - P. donensis SD
>V
C. optivus - S. krestuvnikovii
O K
A. bucerus - A. variabilis insignis Sa rgaevo
LU B 1 Timan
A. incisa - G. micromanifesta 1 M Pashiya
z< C. triangulatus - C. serratus T S o M u 11 i n
C—, G. extensa
F yV. celeber - C. violabilis C V
ooure
Ardatov
o
t— A
c. magnificus - H. lichonovilschi MT Vorobiev
zR. langii R L
Chernoyar
ILIA
Late Mosolov
wU-
P. tortus G. naumuvii G N Klintsov
EarlyPT E. biformis B1 Biva
D. inassueta D 1 Koi vin
< u
CO C3
G. vanjaR. clandestinus
schkinensis - A. subreticularis VS Via/.ov2 -1
ÜJ RC A. divulgata plicata DP Takatin
Figure 2
Middle and Late Devonian miospore zonation of the East European PlatformA : Assemblage or acme-zonesB : Assemblage or acme-subzonesC : Unified Devonian Chronostratigraphic Scaleof the East European Platform, after Rzhonsnitskaya & Kulikova (1991)

Early DEVONIAN Middle DEVONIAN Late DEVONIANL .>
EMSIANLate
EIFELIANEarly | Late
GIVETIANEarly
FRASNIANMiddle Late
FEarly
AMENNIANMiddle Late
70O o"D-H
sor~
mX
o7\ COoOCD
om
A A
oN
3
O<o
<~n td
vsDP 3 CDz
TSC VMT s: 3 CO
CD
CVe 2
so>10 CD(/)
CD NÛC
B
GF or~ oo
CO“0
O roIfCD C CO O
§
Oc: cd _CO CO CD
H co” r 2 CD CO Ç
~7~\ ^ c_3Cj f/5CD C Xi
ST 03 jBCD h — O 1 CQ
® 'O 1 cd g-*CO O
NOOT3 Oç gO' CD
S Ç?
Q3CQ'
fÜ
O 03I*?S 2.5
Apiculîretusispora divulgata var. plicata Retusotriletes ctondestinus Azonomonoletes subreticutoris Grandispora endemics var. vanjaschkinensis
______ i Azonomonoletes microtubercukitus____________ Grandispora tonga va r. antiquus
Cafyptosporites tenerApiculîretusispora sterlibaschevensis Diaphanospora impoiita Diaphanospora inossueta Lanatisporites hispidus
______ Gneudnaspora diveitomedium______ Rhabdosporites mirus
Elenisporis biformis____ i Periplecotriletes tortus
Acinosporites acanthomammiltotus
Ca/yptosporites vetotus
Grandispora naumovii Hystricosporites setigerus
_________________________________ Rhabdosporites langii__________________ Cirratriradites monogrammos________________________________________________ I Densosporites devonicus
Verrucosisporites scurrusHymenozonotriletes tichonovitschi
____________________________ , Geminospora extenso_________________________________ Cymbosporites magnificus
Geminospora micromanifestaVaiiatisporitos celeber
__ Cristatisporites ? viotobiiis_____ l Corystisporites serratus
_i Cristatisporites triangulatusPerotrilites spinosus
_______ , Speiaeotriietes krestovnikovii________________________________ Ancyrospora incisa
_________ i Contagisporites optivusAcanthotriletes bucerus
___ , Archaeozonotriletes variabiiis var. insignisGeminospora semi/ucensa
Verrucosisporites grumosusArchaeoperisaccus mirandus
Archaeoperisaccus ovaiis
Perotrilites donensis_________ Verruciretusispora semilucensa______________________ Hymenozonotriletes argutus_____________________________i Cristatisporites deliguescens__________ L________________ | Cristatisporites trivia/is
Convolutispora crassitunicata Cymbosporites vetlasjanicus
Cyrtospora exp let a Auroraspora speciosa
Diducites radiatus
Membrabaculisporis radiatus ------------------------------------------Bulbosisporites bu/bosus ______________Kedoesporis imperfectus ___________________
Diducites mucronatus __________________________Diducites hopericus .___________ i
Verrucosisporites evlanensis |_______________ ,Cymbosporites acanthaceus ____
Chelinospora potymorpha var. lepidus _______Cymbosporites eximius ______
Grandispora subsuta ______Speiaeotriietes microgronosus ____
Geminospora notata var. microspinosus ____________Bulbosisporites volgogradicus ____________
Cristatisporites imperpetuus ______Converrucosisporites curvatus var. médius ___
Lophozonotriletes furssenkoi ___Corbulispora vimineus ____ _
Geminospora vasjamica ______Pustulatisporites famenensis ___
Diaphanospora zadonica __Auroraspora timpida __
Diaphanospora macrovarius _Cyrtospora cristifer __
Convolutispora zadonicaDiducites vishenensis
Ancyrospora ortovico Cornispora monocornata
Cristatisporites lupinovitchi Lophozonotriletes lebedianensis
Lagenoisporites immensus Auroraspora luteoto Auroraspora macro
Diducites commutatus Diducites compactus Diducites poljessicus
Knoxisporites dedateus Speiaeotriietes paputosusConvolutispora canceltothyris
Cornispora bicornata Grandispora famenensis var. minutas
Cornispora tricornataHymenospora intertextus _Discernisporites golubinicus
Diducites versabilis Grandispora distinctus
Grandispora echinata Grandispora famenensis
Retispora tepidophyta var. macroreticutotaGrandispora focilis Grandisporo lupata
Lophozonotriletes proscurrus
CD Oz
-0—1
2: o 3—i < CO
m oX
SB
CVe
MR AS
SO
0G DE
o o o o CO~n □0 r~ o u
o<D
VF
OTJ <LO
sao
O sa LOO
CD
ONto
Late
EMSIANEarly I Late
EIFELIAN GIVETIANEariy Middle
FRASNIANLate Eariy Middle
FAMENNIANLate
Early DEVONIAN Middle DEVONIAN Late DEVONIANoo00
V.l. AVKHIM
OVITC
H,
E.V. TCH
IBRIKO
VA, T.G. O
BUKH
OVSKAYA, A.M
. NAZAR
ENKO
, V.T. UM
NO
VA, BC
RED
P 17 (1993) BC
RED
P 17 (1993) M
IDD
LE AND U
PPER DEVO
NIAN M
IOSPO
RE ZO
NATIO
N - EASTERN EU
RO
PEL.G
. RASKATO
VA, V.N. M
ANTSU
RO
VA, S. LOBO
ZIAK AND M
, STREEL

84 V.l. AVKHIMOVITCH, E.V. TCHIBRIKOVA, T.G. OBUKHOVSKAYA, A.M. NAZARENKO, V.T. UMNOVA,L.G. RASKATOVA, V.N. MANTSUROVA, S. LOBOZIAK AND M. STREEL
BCREDP 17 (1993)
Apiculiretusispora divulgata plicata (DP) Subzone, (PI. 1, fig. 1-9).
The Takatin Horizon occurring in the western slope of the Ural and in the east of the Russian Platform conforms to this subzone. It is characterized by the presence of the subzonal and zonal species as well as Retusotriletes nau- movae, Apiculiretusispora aculeolata, A. microaculeolata, A. absurda and Dibolisporites capitellatus.
Corals of the Favosites regularissus Zone have been identified in this subzone (Kamaletdinov & Kamaletdinov, 1960). This subzone can be palynologically correlated with the lower portion of the Barrandian Daleje Shales in Czechoslovakia (Tchibrikova, 1982).
Grandispora endemica vanjaschkinensis - Azonomonotetes subreticularis (VS) Subzone (PI. 1, fig. 10-19)
This subzone corresponds to the Viazov Horizon occurring in the western slope of the Ural and in the eastern part of the Russian Platform. It is noted for abundant monolete miospores, among which Azonomonotetes subreticularis andA. microtuberculatus are the most characteristic. Large Grandispora endemica var. vanjaschkinensis and G. tonga var. antiquus are also common.
Conodonts of the Polygnathus serotinus Zone have been ascertained in this subzone in the Ural (Khalymbadja et at., 1985).
Diaphanospora inassueta (Dl) Zone(PI. 2-3)
Age : Late Emsian - Early Eifelian
This zone was established by Arkhangelskaya (1972). The zonal assemblage has been traced over the larger part of Eastern Europe. It occurs in the Koivin Horizon and the lower portion of the Biya Horizon in the east of the Russian Platform and the western slope of the Ural, in the lower and larger portion of the Ryazsk Horizon in the Central regions, in the Vitebsk Horizon in Belarus and the Rezekne Horizon in the Baltic region (Tchibrikova, 1962; Araslanova, 1971; Arkhangelskaya, 1985). In the Unified Stratigraphic Scale it corresponds to the Koivin and lower portion of the Biya Horizons.
Species of the genera Dibolisporites, Apiculiretusispora and Retusotriletes with distinct curvaturae are typical of the miospore assemblages. The index species Diaphanospora inassueta as well as accompanying species D. impolita have a wide occurrence and have not been found below and above the boundaries of the zone. Punctatisporites tortuo- sus, Lanatisporites hispidus, Retusotriletes tenerimedium, Stenozonotriletes incessus, Grandispora endemica, Calyp- tosporites tener, Archaeozonotritetes ignoratus, Rhabdo- sporites mirus and Gneudnaspora divellomedium are characteristic species of the zone. Apiculiretusispora sterli- baschevensis, Archaeozonotritetes polymorphus var. takati- nicus are particularly abundant in the east. Grandispora cf. douglastownense, G. parviconica, G. ludza and Hystrico- sporites mitratus have been discovered at this level in Belarus.
Conodonts of the undifferentiated Polygnathus costatus patulus - P. costatus partitus Zones have been identified within the Dl Zone in the western slope of the Ural (Khalymbadja et al., 1985).
Periplecotriletes tortus (PT) Zone(PI. 4-5)
Age : Early - lower Late Eifelian
This zone was established by Arkhangelskaya (1972). It is widespread over the entire territory of Eastern Europe. It corresponds to the upper portion of the Ryazsk and Morsov Horizons in the Central regions and Volga region near Volgograd (Arkhangelskaya, 1985; Umnova, 1987; Batanova et al., 1968), to the upper portion of the Biya and lower portion of the Afonin Horizons in the east of the Russian Platform (Araslanova, 1971; Tchibrikova, 1977), to the Adrov, Osveya and lower portion of the Gorodok Horizons in Belarus (Kedo & Obukhovskaya, 1981). The uppermost Biya and Klintsov Horizons are referred to this zone in the Unified Stratigraphic Scale.
The zonal assemblage is characterized by the appearance and constant presence of Periplecotriletes tortus and Caiyptosporites velatus together with abundant miospores of the genera Apiculiretusispora and Dibolisporites. Occasional specimens of Rhabdosporites langii are also present in this zone.
Over a larger part of the territory, this zone is divided into two subzones.
Etenisporis biformis (Bi) Subzone (PI. 4)
This subzone is distinguished by the presence of the index species E. biformis, Acinosporites acanthomammilla- tus as well as Sinuosisporites sinuosus, Rhabdosporites mirus and Gneudnaspora divellomedium. The latter species cease to exist at this level.
Grandispora naumovii (GN) Subzone (PI. 5)
This subzone has been identified by the presence of the index species Grandispora naumovii, together with Hystri- cosporites setigerus and Perotrilites bifurcatus. Rhabdosporites langii is constantly found in this subzone although in small numbers. Species of the genera Dibolisporites, Apiculiretusispora and Periplecotriletes become less numerous.
The lower Bi Subzone can be correlated with the Caiyptosporites velatus - Rhabdosporites langii Assemblage Zone of Richardson & McGregor (1986). The Upper GN Subzone may conform to the Densosporites devonicus - Grandispora naumovii Assemblage Zone.
Rhabdosporites langii (RL) Zone(PI. 6)
Age ; Late Eifelian
This zone was first established by Arkhangelskaya (1972) in the eastern regions of the Russian Platform. It conforms to the Mosolov and Chernoyar Horizons in the Central regions, the upper portion of the Afonin Horizon (Arkhangelskaya, 1985), the upper portion of the Gorodok and Kastiukovitchy Horizons in Belarus (Kedo & Obukhovskaya, 1981) and the Kiarnav Horizon in Lithuania (Vaitekunene, 1983).
The zonal assemblage is characterized by the maximum occurrence of the index species R. langii plus the presence of Cirratriradites monogrammos, C. punctomonogrammos, Retispora archaeoiepidophyta, Densosporites devonicus

BCREDP 17 (1993) MIDDLE AND UPPER DEVONIAN MIOSPORE ZONATION - EASTERN EUROPE 85
and Grandispora inculta. There are numerous species of the genera Camarozonotriletes and Diatomozonotriletes. Lopho- zonotriletes scurrus, Convotutispora tegula and Acanthotri- letes variaculeatus first appear in the upper portion of this zone.
Conodonts of the Polygnathus kockelianus Zone have been discovered in the deposits of this zone in the Central regions as well as Conodonts of the lower portion of the Polygnathus ensensis Zone (Aristov & Ovnatanova, 1985).
Based on the spore composition, this zone may be regarded as an upper (?) portion of the global Densospo- rltes devonicus - Grandispora naumovii Assemblage Zone of Richardson & McGregor (1986).
Geminospora extensa (EX) Zone(PI. 7-9)
Age : Givetian
This zone has been traced over the entire territory of Eastern Europe (Tchibrikova & Naumova, 1974; Kedo & Obu- khovskaya, 1981; Tchibrikova, 1982; Arkhangelskaya, 1985). It conforms to the Starooskol Superhorizon in the Central regions, the Polotsk Horizon in Belarus and their analogues elsewhere in the Russian Platform. The Starooskol Superhorizon equates with the Zone in the Unified Stratigraphic Scale.
The zonal assemblage is characterized by the appearance of the genus Geminospora, and the dominant species include G. extensa, G. tuberculata, G. decora and G. vul- gata. Geminospora micromanifesta, G. rugosa and G. notata gradually become more numerous further up the zone. The index species Geminospora extensa is practically limited to this zone.
Conodonts of the Polygnathus varcus Zone (Aristov & Ovnatanova, 1985) and the Brachiopod Stringocephalus bur- tini have been found in this Zone in the Central regions.
The Zone is divided into three subzones.
Cymbosporites magnificus - Hymenozonotriietes tichonovit- schi (MT) Subzone (PI. 7)
This subzone corresponds to the Vorobiev Horizon which occurs in the Central and eastern regions of the Russian Platform and their analogues in other regions. Only the upper portion of the subzone is present over large territories (Ukraine, Belarus).
The subzonal miospore assemblage is characterized by the appearance of the index species. It should be mentioned that Hymenozonotriietes tichonovitschi has never been encountered above the subzone upper boundary. Species transitional from the Eifelian deposits are frequent e.g. Cir- ratriradites monogrammos, Rhabdosporites langii, Calypto- sporites velatus, as well as spores of the genera Camarozonotriletes, Diatomozonotriletes and Acanthotri- letes. Geminospora meonacantha, G. compta var. expleti- vus and Archaeozonotriletes gravis are also typical of the subzone.
Vallatisporites celeber - Cristatisporites (?) violabilis (CV) Subzone (PI. 8)
This subzone conforms to the Ardatov Horizon in the Central and eastern regions of the Russian Platform, the Stolin Beds in Belarus and their analogues in other regions.
It is characterized by the maximum development of the index species and constant occurrence of Chelinospora concinna, Lophozonotriletes scurrus, L. scurrus var. jugo- maschevensis and Lanatisporites bislimbatus.
Cristatisporites triangulatus - Corystisporites serratus (TS) Subzone (PI. 9)
This subzone basically corresponds to the Mullin Horizon in the Central and eastern regions of the Russian Platform, to the Morotch Beds in Belarus and their analogues occurring elsewhere.
It is characterized by the appearance of Cristatisporites triangulatus and a maximum development of Corystisporites serratus. Species such as Geminospora tuberculata, G. decora, G. vulgata, Lanatisporites bislimbatus, Membrabacu- lisporis comans, Cingulatisporites cassiformis and others typical of the Grandispora extensa Zone become extinct within this subzone. Species transitional to the overlying deposits e.g. Geminospora micromanifesta, G. notata and Perotrilites spinosus are widespread
The two lower MT and CV Subzones can be palynologi- cally correlated with the Geminospora lemurata - Cymbosporites magnificus Assemblage Zone and the TS Subzone with the lower part of the Contagisporites optivus - Cristatisporites triangulatus Assemblage Zone of Richardson & McGregor (1986)
Contagisporites optivus - Spelaeotriletes krestovnikovii (OK) Zone (PI. 10-11)
Age : Early Frasnian.
This zone has been ascertained by a group of workers (Palynological meeting, 1984). It conforms to the Pashiya, Timan and Sargaevo Horizons in the Unified Stratigraphic Scale.
The zonal assemblage is characterized by abundant specimens of Geminospora micromanifesta, G. rugosa and G. notata, the stable presence of the first index species Contagisporites optivus and the appearance of Ancyrospora incisa. The zone is also characterized by the absence of the miospores typical of the underlying Grandispora extensa Zone.
This zone is divided into two subzones.
Ancyrospora incisa - Geminospora micromanifesta (IM) Subzone (PI. 10)
This subzone corresponds to the Yastrebov and lower larger portion of the Tscigrov Horizons, both occurring in the Central regions of the Russian Platform (Raskatova, 1969; Raskatova, 1990), the Pashiya and lower portion of the Kynov Horizons in the eastern regions (Tchibrikova, 1962; Tchibrikova & Naumova, 1974; Raskatova, 1990) and the lower portion of the Lansk Horizon in Belarus (Kedo & Obukhovskaya, 1981). The Pashiya Horizon is confined to this subzone in the Unified Stratigraphic Scale.
The miospore assemblage is characterized by the appearance of Ancyrospora incisa and abundance of Geminospora micromanifesta. A typical feature is the dominance of miospores belonging to the genus Geminospora. Cymbosporites magnificus, Perotrilites spinosus and, in the majority of the regions, Cristatisporites triangulatus become

86 V.l. AVKHIMOVITCH, E.V. TCHIBRIKOVA, T.G. OBUKHOVSKAYA, A.M. NAZARENKO, V.T, UMNOVA,L.G. RASKATOVA, V.N, MANTSUROVA, S. LOBOZIAK AND M. STREEL
BCREDP 17 (1993)
extinct in this subzone, while higher in the subzone Spe- laeotriletes krestovnikovii, Geminospora semilucensa and Acanthotriletes eximius increase in number. The first appearance of occasional Acanthotriletes bucerus and Archaeo- perisaccus verrucosus is recorded in the Timan-Pechora Province.
Acanthotriletes bucerus - Archaeozonotriletes variabilis insignis (Bl) Subzone (PI. 11)
This subzone conforms to the Timan and Sargaevo Horizons in the Timan-Pechora Province (Medianik, 1981; Raskatova, 1990), the upper portion of the Kynov Horizon and the Sargaevo Horizon in the Volga-Ural Province (Tchi- brikova & Naumova, 1974; Arkhangelskaya & Ovnatanova,1986), in the Volga region near Volgograd (Nazarenko, 1983) and also in the upper portion of the Lansk Horizon and the Sargaevo Horizon in the Pripyat Depression (Obukhovskaya, 1986).
This subzonal assemblage is characterized by the abundance of Archaeozonotriletes variabilis, the appearance ofA. variabilis var. insignis, the presence of Acanthotriletes bucerus, A. dentatus, A. eximius, Kedoesporis livnensis and the appearance of Spelaeotriletes bellus. Archaeoperisac- cus verrucosus, A. timanicus and Cristatisporites triangula- tus are numerous in the lower portion of this subzone in the Timan-Pechora Province.
The upper portion of the subzone, composed mainly of carbonaceous sediments, is characterized by a poor mio- spore composition. Apart from the subzonal species and abundance of the genus Geminospora, the following species have been found to prevail : Converrucosisporites curvatus, Retusotriletes communis, Acanthotriletes uncatus, Kedoesporis angulosus and Lophozonotriletes concessus.
The Ancyrodella binodosa Conodonts Zone has been identified in the lower portion of the subzone in the Volga- Ural Province while in the upper part, Conodonts of the Ancyrodella rotundiloba Zone (Arkhangelskaya & Ovnatanova, 1986) occur.
Both subzones can be palynologically correlated with the upper portion of the Contagisporites optivus - Cristatisporites triangulatus Assemblage Zone of Richardson & McGregor (1986).
Geminospora semilucensa - Perotrilites donensis (SD) Zone (PI. 12)
Age : Early Frasnian
This zone is widespread in Eastern Europe and corresponds to a lower portion of the Semilouky Horizon in the Central regions, Belarus, Ukraine, Volga Region near Volgograd, the lowermost Domanikov Horizon in the Timan-Pechora Province and the eastern regions of the Russian Platform. The zone was established by a group of workers (Palynological meeting, 1984). The studies have been carried out by Raskatova (1969), Nazarenko (1983), Medianik (1981), Obukhovskaya (1986), Arkhangelskaya in Arkhangelskaya & Ovnatanova, 1986). At present, the zone is known more precisely on a basis of zonal assemblage occurrence.
The miospore assemblage is characterized by dominating species of the genus Geminospora, among which G. semilucensa and G. aurita are invariably present. Crista
tisporites trivialis, Ancyrospora laciniosa, Hymenozonotri- letes argutus, Archaeozonotriletes variabilis, A. timanicus are also typical. The second zonal species Perotrilites donensis is not found everywhere, but in some sections it is abundant, as is Camarozonotriietes obtusus. The mio- spores with coarse tubercular ornamentation of the exine such as Lophozonotriletes tylophorus and Verrucosisporites grumosus have been observed to appear in the zone.
In the eastern sections of the Timan-Pechora Province, Conodonts of the middle-upper Polygnathus asymmetricus Zone have been discovered (Arkhangelskaya & Ovnatanova, 1986; Ovnatanova & Kuzmin, 1991) in this SD Zone.
Archaeoperisaccus ovalis - Verrucosisporites grumosus (OG) Zone (PI. 13-15)
Age : Middle Frasnian
This zone was identified by a group of workers (Palynological meeting, 1984). In the present study the composition of the zone has been determined more accurately. The upper portions of the Semilouky Horizon, the Rechitsa and Voronezh Horizons conform to this Zone in the Unified Stratigraphic Scale.
The features of the OG zonal miospore assemblage include the appearance and acme of bilateral spores of the genus Archaeoperisaccus which possess fine ornamented or shagreen surface of the exine, numerous miospores with filmy outer coatings and forms with coarse tubercular ornamentation together with representatives of the genus Geminospora.
The Zone is divided into three subzones.
Spelaeotriletes bellus (SB) Subzone (PI. 13)
This subzone has been reliably identified in the Central regions of the Russian Platform and in the Timan-Pechora Province where it incorporates the upper portion of the Semilouky (Domanikov) Horizon (Raskatova, 1969; Medianik, 1981).
The zonal miospore assemblage is characterized by the co-occurrence of Archaeoperisaccus species (A. ovalis, A. menneri, A. concinnus and A. mirandus) with representatives of the krestovnikovii morphon (Spelaeotriletes krestovnikovii, S. bellus, S. domanicus and S. instabilis). The latter species practically do not occur above the upper boundary of the zone. Cristatisporites deiiquescens, C. trivialis, Verruciretusispora semilucensa, V. pallida, Lophozonotriletes privus are constantly found in miospore associations of the subzone.
in the Timan-Pechora Province, where the subzone section is the most complete, Cyrtospora (?) expleta, Cymbo- sporites vetlasjanicus and Bascaudaspora dobridia have been discovered in its upper part.
In this province, the subzone is associated with Conodonts of the upper Polygnathus asymmetricus and the An- cyrognathus triangularis Zones (Ovnatanova & Kuzmin, 1991).
Cymbosporites vetlasjanicus (CVe) Subzone (PI. 14)
This subzone is widespread in Eastern Europe. It conforms to the Petin Horizon and lower portion of the Voronezh Horizon in the Central regions and Volga region near Volgograd, the Rechitsa Horizon and lower portion of

BCREDP 17 (1993) MIDDLE AND UPPER DEVONIAN MIOSPORE ZONATION - EASTERN EUROPE 87
the Voronezh Horizon in Belarus, the Vetlasjan Horizon and lower portion of the Siratchoi Horizon in the Timan-Pechora Province and to the Mendym Horizon in the eastern regions of the Russian Platform (Raskatova et al., 1976; Medianik, 1981; Obukhovskaya, 1986; Arkhangelskaya & Ovnatanova, 1986).
The subzonal assemblage is featured by abundant mio- spores of the genera Archaeoperisaccus and Geminospora, all species of which were inherited from older strata. The index species Cymbosporites vetlasjanicus is abundant in the sections of the Timan-Pechora and Volga-Ural Provinces. Bascaudaspora dobridia is also present there. A higher content of miospores with coarse tubercular ornamentation is observed such as Lophozonotriletes tylophorus, L. privus, L. torosus and Verrucosisporites grumosus. The first appearance of occasional Membrabaculisporis radiatus, Diducites radiatus, Auroraspora speciosa is also observed. Convolu- tispora crassitunicata is confined to the lower portion of the section and specimens of Grandispora famenensls var. gracilis are found in its upper portion.
In the Timan-Pechora and Volga-Ural Provinces, the subzone is associated with Conodonts of the lower Palmatolepis gigas Zone (Arkhangelskaya & Ovnatanova, 1986; Kuzmin & Ovnatanova 1989; Obukhovskaya & Kuzmin, in press).
Membrabaculisporis radiatus (MR) Subzone (PI. 15)
This subzone is widespread in Eastern Europe. The sub- zonal assemblage characterizes a large portion of the Voronezh Horizon in the Central regions of Russia and in Belarus and Volga region near Volgograd, the Siratchoi Horizon in the Timan-Pechora Province and the Orlov Formation in the western slope of the Ural (Tchibrikova, 1972; Raskatova, 1975; Medianik, 1981; Obukhovskaya, 1986).
The following features are typical of the subzone : constant presence of the index species Membrabacuiispo- rites radiatus, Geminospora aurita, Diducites radiatus and appearance of Diducites mucronatus, Bulbosisporites bul- bosus, Kedoesporis rugilobus and K. imperfectus. Higher in the subzone representatives of the genus Archaeoperisaccus become less numerous in the assemblages.
In the Timan-Pechora Province there are Conodonts of the Palmatolepis gigas Zone (Kuzmin & Ovnatanova, 1989; Obukhovskaya & Kuzmin, in press) associated with the subzone.
The miospore assemblages of the A. ovalis - V. grumosus Zone can be correlated with the Archaeoperisaccus ovalis - Verrucosisporites bulliferus Assemblage Zone of Richardson & McGregor (1986).
Cristatisporites deliquescens - Verrucosisporites evlanensis (DE) Zone (PI. 16-17)
Age : Late Frasnian
It was first identified by a group of authors as the H. speciosus - H. radiatus and H. imperfectus - H. subsutus Subzones (Palynological meeting, 1984). The zone conforms to the Evlanov and Liven Horizons in Eastern Europe.
The zonal assemblage is characterized by the dominant development of Cristatisporites deliquescens, Auroraspora speciosa, Diducites radiatus, Membrabaculisporis radiatus, Spelaeotriletes hopericus and the appearance of Verrucosi
sporites evlanensis. A typical feature of the zone is the presence of species of the genera Geminospora and Kedoesporis.
Over a large part of the territory the zone is divided into two subzones.
Auroraspora speciosa (AS) Subzone (PI. 16)
This subzone corresponds to the Evlanov Horizon in the Central regions of the Russian Platform, Belarus, Volga region near Volgograd and to the lower and middle portions of the Uhta Formation in the Timan-Pechora Province. The persistent presence of Auroraspora speciosa, the large number of miospores belonging to the genera Stenozonotriletes and Verrucosisporites and the appearance and widespread occurrence of Cymbosporites acanthaceus, Chelinospora polymorpha are regarded as characteristic features of the subzonal miospore assemblage (Raskatova, 1974; Medianik, 1981; Obukhovskaya & Nekriata, 1983). The miospores of the genus Archaeoperisaccus are not numerous and are even absent in some sections.
Conodonts of the Palmatolepis gigas Zone have been found in the AS Subzone of the Timan-Pechora Province (Obukhovskaya & Kuzmin, in press). The Palmatolepis gigas Zone has also been identified in the stratotypical sections of the Evlanov Horizon in the Russian Platform (Aristov, 1988).
Grandispora subsuta (GS) Subzone (PI. 17)
This subzone conforms to the Liven Horizon. It has been reliably established in the Central regions of the Russian Platform, in the Pripyat and Dnieper-Donetsk Depressions and in the Volga region near Volgograd.
It is characterized by the appearance of the index species Grandispora subsuta, Cymbosporites eximius, C. boa- feticus, Spelaeotriletes microgranosus and the permanent presence of Chelinospora polymorpha var. lepidus. The majority of the typical species of the Frasnian Stage cease to exist here. The GS Subzone spore assemblage is poorly present in the Timan-Pechora Province.
Conodonts of the uppermost Palmatolepis gigas Zone have been found in the deposits characterized by this poor miospore assemblage (Obukhovskaya & Kuzmin, in press).
Corbulispora vimineus - Geminospora vasjamica (VV) Zone (PI. 18)
Age : Early Famennian
This zonal miospore assemblage has been identified in the tectonically most disturbed regions of the Russian Platform and in the western slope of the Ural (Nekriata, 1979; Medianik, 1981; Kononenko, 1984; Tchibrikova & Nazarenko, 1984; Mantsurova, 1987). At present, the composition and age of the zone are known more precisely. This zone corresponds to the Linev and Umetov Measures in the Volga region near Volgograd, the Domanovitchy Horizon and Kuz- mitchev Beds in the Pripyat Depression, the Pakul and lowermost Leskov deposits in the Dnieper-Donetsk Depression, the Sub-Zadon Horizon in the Timan-Pechora Province and the Vazyam Measures in the western slope of the Ural (Nazarenko et al., in press). In the Central Devonian Field this part of the section is absent.

88 V.l. AVKHIMOVITCH, E.V. TCHIBRIKOVA, T.G. OBUKHOVSKAYA, A.M. NAZARENKO, V.T. UMNOVA,L.G, RASKATOVA, V.N. MANTSUROVA, S. LOBOZIAK AND M. STREEL
BCREDP 17 (1993)
The deposits corresponding to the C. vimineus - G. vas- jamica (VV) Zone have not been established in the Unified Stratigraphic Scale as an independent stratigraphic unit. However, by the palynological data they may be regarded as a horizon having a rather widespread occurrence.
The zonal miospore assemblage is distinguished by the following features : appearance of the first index species Corbulispora vimineus, constant presence of Geminospora vasjamica, G. notata var. microspinosus, Lophozonotriletes furssenkoi, Lophotriietes multiformis, Converrucosisporites curvatus, Pustulatisporites pullus and absence of species typical of older deposits. In the Pripyat and Dnieper-Donetsk Depressions and in the Ural a higher content of the mio- spores with coarse tubercular ornamentation of the exine has been observed, while in the Timan-Pechora Province, Cristatisporites imperpetuus, and in the Volga region near Volgograd, Cymbosporites boafeticus are common with the latter species appearing in the underlying deposits where it played a subordinate role. Pustulatisporites famenensis and occasional Cyrtospora cristifer appear in the upper part of the zone.
Conodonts of the Paimatoiepis triangularis Zone have been discovered in the VV Zone in the Timan-Pechora Province (Obukhovskaya & Kuzmin, in press).
Cyrtospora cristifer - Diaphanospora zadonica (CZ) Zone (PI. 19-20)
Age : Early Famennian
This zone has been established by the same group of authors who determined the Trachytriletes famenensis - Hy- menozonotriletes zadonicus Subzone of the Archaeotriletes honestus - Hymenozonotriietes rugosus Zone (Palynological meeting, 1984). The CZ Zone conforms to the Zadon Horizon and has been traced all over Eastern Europe (Naumova, 1953; Raskatova, 1973; Nazarenko, 1978; Nekriata, 1979; Kononenko, 1984).
The zonal miospore assemblage is characterized by the constant presence of the first index species Cyrtospora cristifer, the appearance of the second one Diaphanospora zadonica and the extensive occurrence of Diaphanospora rugosa, D. macrovarius, Auroraspora varia, A. limpida, Pustulatisporites famenensis and Converrucosisporites curvatus, together with representatives of the genera Stenozonotriletes, Retusotriletes and Hystricosporites.
The changes in miospore composition make it possible to identify two subzones which have been studied in detail in the Pripyat (Nekriata, 1979) and Dnieper-Donetsk Depressions (Kononenko, 1984).
Geminospora notata var. microspinosus (GM) Subzone (PI. 19)
This subzone has been established in the lower portion of the section (Nekriata, 1979; Avkhimovitch et al., 1988). It is characterized by the prevailing development of Geminospora notata, the presence of sparse specimens of Corbulispora vimineus, Converrucosisporites curvatus var. médius, Lophozonotriletes furssenkoi inherited from more ancient sediments.
In many regions of Eastern Europe Brachiopods of the Cyrtospirifer asiaticus Zone have been discovered in the GM
Subzone (Liashenko, 1959) while in the Central Devonian Field (Aristov, 1988) and Pripyat Depression (Golubtsov et al., 1978), Conodonts of the Paimatoiepis triangularis and Paimatoiepis crepida Zones occur.
Convolutispora zadonica (Za) Subzone (PI. 20)
This subzone has been established in the upper part of the section (Nekriata, 1979; Kononenko, 1984). It is characterized by the appearance of the index species Convolutispora zadonica, the higher content of the genera Stenozonotriletes and Retusotriletes species and the reduction in numbers of Geminospora vasjamica and G. notata var. microspinosus. Diducites radiatus, D. vishenensis are constantly present. The first appearance of occasional Knoxisporites dedaleus and Lagenoisporites immensus has also been observed.
Conodonts of the Paimatoiepis crepida Zone have been determined in the Za Subzone in the Pripyat Depression (Golubtsov et al., 1978).
Lagenoisporites immensus (Im) Zone(PI. 21)
Age : Early Famennian
This subzone is equivalent to that established by a group of authors (Palynological meeting, 1984) as the upper - Archaeozonotriletes voigogradicus - Hymenozonotriietes immensus Subzone of the Archaeotriletes honestus - Hymenozonotriietes rugosus Zone. It conforms to the Eletsk Horizon predominantly over the entire territory of Eastern Europe (Naumova, 1953; Raskatova, 1973; Nazarenko, 1978; Nekriata, 1979; Kononenko, 1984).
The zonal miospore assemblage is characterized by the regular occurrence of the index species Lagenoisporites immensus and a number of other typical species, Knoxisporites dedaleus and Ancyrospora orlovica as well as by the appearance of Lophozonotriletes lebedianensis, Diducites commutatus, D. compactus and Spelaeotriletes papu- losus. The last species considerably prevails in the Timan-Pechora Province. Miospores with a simple structure such as Auroraspora luteola, A. pallida and others are rather abundant in the assemblage. Cornispora monocornata appears in the upper half of the zone. The transitional species Diaphanospora rugosa, Auroraspora varia and small numbers of Bulbosisporites voigogradicus as well as various species of Stenozonotriletes are also present.
In many regions of Eastern Europe this Im Zone contains Brachiopods of the Cyrtospirifer brodi - Ptychomaletoechia brodica Zone (Liashenko, 1959), while in the Central Devonian Field (Aristov, 1988) and Pripyat Depression (Krutchek, 1974) Conodonts of the Paimatoiepis rhomboidea Zone have been found.
Cornispora varicornata (CVa) Zone (PI. 22-24)
Age : Middle Famennian
This zone was originally established in Eastern Europe by Tchibrikova & Naumova (1974). Since then it has been divided into three subzones by the present authors (Avkhimovitch,

BCREDP 17 (1993) MIDDLE AND UPPER DEVONIAN MIOSPORE ZONATION - EASTERN EUROPE 89
1975; Palynological meeting, 1984; Kononenko, 1984). In the majority of the regions the Petrikov, Lebediansk and Optukhov Horizons and their analogues are related to this zone.
Grandispora famenensis minutus (GF) Subzone (PI. 22)
This subzone has been identified in the Pripyat Depression (Avkhimovitch, 1975, 1986). It also occurs in the Dnie- per-Donetsk Depression (Kononenko, 1983) and Timan-Pechora Province (Narian-Mar borehole). The middle Famennian Petrikov Horizon is related to the subzone. In the Unified Stratigraphic Scale the Petrikov Horizon is absent. It is possible that in the Central Devonian Field it corresponds to the upper member of limestones assigned to the Eletsk Horizon but not containing fossils of the Eletsk age. In other regions this part of the section has specific paleontological features and therefore should be identified as a separate stratigraphic unit which is confirmed by the palynological data.
In the GF Subzone Cornispora varicornata begins to develop and there are also various representatives of the genus Grandispora (G. famenensis var. minutus, G. verru- cata, G. aspersus and others). Species of Diducites (D. compactus, D. commutatus, D. poljessicus, D. mucronatus) considerably increase in number. Cristatisporites lupinovit- chi, Spelaeotriletes papulosus and various small size mio- spores such as Auroraspora macra, A. luteola are also rather numerous. Lophozonotriletes lebedianensis shows a maximum of development in this subzonal assemblage.
Conodonts of the upper part of the Palmatolepis rhom- boidea Zone have been found in the typical GF Subzone in the Pripyat Depression (Golubtsov et ai., 1978) whereas in the Timan-Pechora Province, Conodonts of the Palmatolepis marginifera Zone (Durkina et al., 1980) have been recorded. This GF Subzone correlates with Fa2a deposits of the Franco-Belgian Ardenne Massif characterized by the gracilis - hirtus (GH) miospores Zone which also coincides with the Palmatolepis rhomboidea Zone (Bouckaert et al., 1968).
Cornispora bicornata (CB) Subzone (PI. 23)
It has been established in the Volga region near Volgograd by Nazarenko (1975). It is also found in the Central regions and in the Central Devonian Field (Umnova, 1971; Raskatova, 1973), the Pripyat Depression (Avkhimovitch, 1974), the Dnieper-Donetsk Depression (Kononenko, 1983) and the Timan-Pechora Province (Sennova, 1972). Generally, over the entire territory of Eastern Europe the subzone corresponds to the middle Famennian Lebediansk Horizon, the lower part of the Ust-Pechora Horizon in the Timan-Pechora Province and the Maksakov Formation in the northwest of the Dnieper-Donetsk Depression.
Miospores of the zonal species Cornispora varicornata reach their maximum development in this subzone. However, this species occurs unevenly across the region. For instance, it is abundant in the east, especially in the Timan- Pechora Province and Volga region near Volgograd. However, in the west (Pripyat and Dnieper-Donetsk Depressions) it rarely reaches its maximum development. Lophozonotriletes lebedianensis and Knoxisporites dedaleus still occur though in lesser numbers. Cristatisporites lupinovitchi, Spelaeotriletes papulosus and various species of the genus Diducites increase in number. Specimens of the genus Lophozonotriletes and Stenozonotriletes are also numerous.
In the majority of the regions the subzone contains the Brachiopods Cyrtospirifer iebedianicus.
Cristatisporites lupinovitchi (CL) Subzone (PI. 24)
This subzone has been identified in the Pripyat Depression (Avkhimovitch, 1975). It also occurs in the Dnieper- Donetsk Depression (Kononenko, 1983), the Central regions (Raskatova, 1973) and the Timan-Pechora Province (Durkina & Avkhimovitch, in press). The subzone corresponds to the Optukhov Horizon in the Central regions of the Russian Platform, to the Oresa Horizon in the Pripyat Depression, to the middle portion of the Ust-Pechora Horizon in the Timan- Pechora Province and to the Adamov Formation in the northwest of the Dnieper-Donetsk Depression. The middle Famennian Optukhov Horizon corresponds to the subzone in the Unified Stratigraphic Scale.
The zonal species Cristatisporites lupinovitchi is abundant and terminates its development within the subzone. Cornispora varicornata is considerably reduced in number and Grandispora famenensis appears. Ancyrospora orlovica and Bulbosisporites voigogradicus cease to develop, as do the majority of the genus Hystricosporites species. Discern- isporites golubinicus is more widespread and species of the genus Diducites are still abundant, especially in the western regions.
Based on the first appearance of Grandispora famenensis in both regions, CB and CL Subzones can be conditionally correlated with the uppermost Fa2a and the Fa2b intervals characterized by the gracilis - minutus (GM) miospores Zone [renamed gracilis - famenensis (GF) Oppel Zone in Streel et al., 1987] of the Franco-Belgian Ardenne Massif (Bouckaert et al., 1968; Avkhimovitch, 1986).
Diducites versabilis - Grandispora famenensis (VF) Zone (PI. 25-26)
Age : Upper Famennian
This zone has been established first as D. versabilis Zone in the Pripyat Depression (Kedo & Avkhimovitch, 1981). It occurs all over Eastern Europe. The upper Famennian Plavsk Horizon in the Central regions (Umnova, 1971), the Streshin Horizon in the Pripyat Depression (Avkhimovitch & Demidenko, 1985), the upper half of the Zimovsk Horizon and the lower half of the Sennov Horizon in the Volga region near Volgograd (Nazarenko, 1978) are all related to this zone. The upper Famennian Plavsk Horizon conforms to the zone in the Unified Stratigraphic Scale. The base of the VF Zone in Eastern Europe is regarded as an important boundary where the spores that terminate the late stage of Devonian flora development appear.
The zone is divided into two subzones. In general it is comparable to the Fa2c interval defined by the versabilis - cornuta (VCo) Oppel Zone of the Franco-Belgian Ardenne Massif (Streel, 1986).
Discernisporites golubinicus (DG) Subzone (PI. 25)
This zone was first established in the Volga region near Volgograd as the G. famenensis Zone within the upper part of the Zimovsk Horizon (Nazarenko, 1975). It also occurs in the Pripyat Depression in the lower part of the Streshin Horizon (Avkhimovitch, 1978) and in the Timan-Pechora Province from the upper part of the Ust-Pechora Horizon (Durkina & Avkhimovitch, in press).

90 V.l. AVKHIMOVITCH, E.V. TCHIBRIKOVA, T.G. OBUKHOVSKAYA, A.M. NAZARENKO, V.T. UMNOVA,L.G. RASKATOVA, V.N, MANTSUROVA, S. LOBOZIAK AND M, STREEL
BCREDP 17 (1993)
Typically Late Devonian miospores Diducites versabilis and Retispora lepidophyta var. macroreticulata appear in the subzone. Grandispora famenensis is most abundant at this level and reaches its maximum development. Grandispora distinctus appears and Discernisporites golubinicus is numerous. Also, various species of Diducites (D. poljessi- cus, D. commutatus) occur in the subzone as well as Lo- phozonotriletes magnus and Converrucosisporites curvatus.
Foraminifera of the Quasiendothyra communis Zone have been found in the DG Subzone in the Timan-Pechora Province (Durkina & Avkhimovitch, in press).
Speiaeotriietes papulosus (SP) Subzone (PI. 26)
This subzone has been identified in the Volga Region near Volgograd (Nazarenko, 1975). It also occurs in the Pri- pyat Depression (Avkhimovitch & Demidenko, 1985; Avkhimo- vitch, 1986), in the Central regions (Umnova, 1971; Raskatova,1973), in the Central Devonian Field (Avkhimovitch, 1978) and in the Timan-Pechora Province (Durkina & Avkhimovitch, 1986).
This subzone is referable to the lower part of the Sennov Florizon in the Volga region near Volgograd, the upper part of the Streshin Florizon in the Pripyat Depression, the Kudejar Beds of the Plavsk Florizon in the Central regions and the lowermost Zelenets Florizon in the Timan-Pechora Province.
The index species of the Zone Diducites versabilis is still abundant and the subzonal index species Speiaeotriietes papulosus terminates its development in this subzone. Grandispora facilis, G. lupata and Auroraspora evanida, forms typical of the Late Devonian deposits, appear in the subzone as do Convolutispora usitata and Dictyotriletes grandiformis. Lophozonotriletes proscurrus is also a characteristic element. Among other miospores, Grandispora distinctus, G. famenensis and Discernisporites golubinicus are typical of the subzone. Miospores of the genus Diducites are less numerous than in the lower subzone.
In the Timan-Pechora Province Conodonts of the Polygnathus stryriacus Zone have been determined in this subzone (Durkina et al., 1980).
2 — BIOSTRATIGRAPHICAL RELATIONS BETWEEN THE EAST EUROPEAN PLATFORM AND
THE ARDENNE-RHINE REGIONS
An attempt is made (Fig. 4) to correlate, using miospores, the new zonation of the East European Platform with the zonation built in the Ardenne-Rhine regions by Streel et al. (1987). This last zonation having been correlated by Streel & Loboziak (in press) with the standard Conodont zonation, relatively reliable datation can be proposed.
A main result is to show the well diversified zones and subzones described on the East European Platform during the interval covering the Late Frasnian and Early Famennian times, compared to the poor definition of the contemporaneous zones (mainly IV and V tentatives zones) described so far in Western Europe.
3 — LIST OF TAXA CITED IN TEXT AND PLATE EXPLANATIONS
Abbreviations used :Arkh. = Arkhangelskaya Avkh. = Avkhimovitch
Nekr. = Nekriata Obukh. = ObukhovskayaPaschk. = Paschkevitch Rask. = Raskatova
Tchib. = Tchibrikova
Acanthotriietes bucerus Tchib. PI. 11 Acanthotriletes eximius Naumova PI. 11 Acanthotriietes perpusillus Naumova PI. 6 Acanthotriletes uncatus Naumova Acanthotriietes variaculeatus Kedo PI. 6
Acinosporites acanthomammillatus Richardson
Ancyrospora fidus (Naumova) Obukh. PI. 9, 12Ancyrospora incisa (Naumova) M. Rask. & Obukh. PI. 10Ancyrospora laciniosa (Naumova) Mantsurova PI. 12Ancyrospora melvillensis Owens PI. 11Ancyrospora microincisa (Kedo) Obukh. PI. 5Ancyrospora orlovica (Nazarenko & Nekr.) Avkh. & Nekr. PI. 21, 24Ancyrospora voronensis (Arkh.) Arkh. PI. 15
Aneurospora greggsii (McGregor) Streel PI. 10 Aneurospora heterodonta (Naumova) Streel PI. 9
Apiculatisporites dentatus (Naumova) Obukh. PI. 11
Apiculiretusispora absurda (Tchib.) Arkh. PI. 1 Apiculiretusispora aculeolata (Tchib.) Arkh. PI. 1 Apiculiretusispora divulgata Tchib. var. plicata Tchib. PI. 1 Apiculiretusispora gibberosa (Kedo) Arkh. PI. 5 Apiculiretusispora microacuieata (Tchib.) Tchib.Apiculiretusispora steriibaschevensis (Tchib.) Arkh. PI. 2 Apiculiretusispora verrucosa (Kedo) Arkh. PI. 3
Archaeoperisaccus concinnus Naumova PI. 13-15 Archaeoperisaccus echinatus Rask. PI. 14, 15 Archaeoperisaccus menneri Naumova PI. 13, 14 Archaeoperisaccus mirandus Naumova PI. 14 Archaeoperisaccus mirus Naumova PI. 14, 15 Archaeoperisaccus ovalis Naumova PI. 13 Archaeoperisaccus verrucosus Paschk. PI. 11
Archaeozonotriletes densus (McGregor) Arkh. PI. 11 Archaeozonotriletes gravis Arkh.Archaeozonotriletes ignoratus (Naumova) Tchib. PI. 1, 2 Archaeozonotriletes latemarginatus (Kedo) Obukh. PI. 10 Archaeozonotriletes ocularis Rask. PI. 8Archaeozonotriletes polymorphus Naumova var. takatinicus Tchib. PI. 2Archaeozonotriletes timanicus Naumova PI. 8, 11, 12 Archaeozonotriletes variabilis Naumova PI. 12 Archaeozonotriletes variabilis Naumova var. insignis Sennova PI. 11
Auroraspora evanida (Kedo) Avkh.Auroraspora limpida (Naumova) Avkh. PI.19 Auroraspora luteola (Naumova) Avkh.Auroraspora macra Sullivan PI. 22 Auroraspora pallida (Naumova) Avkh.Auroraspora speciosa (Naumova) Obukh. PI. 16, 17 Auroraspora speciosa (Naumova) Obukh. var. ornatus Nazarenko
PI. 14Auroraspora varia (Naumova) Ahmed PI. 21, 26
Azonomonoletes ellipsoïdes Kedo PI. 6

Early
DEVO
NIA
N
Mid
dle DEV
ON
IAN
La
te DEV
ON
IAN
Ed>3
CONODONTS ____Klapper & Ziegler 1979 Weddige 1984 Ziegler & Sandberg 1990
Old zonation Standard zonation
M LL expansa m
U EM styriacus
L EU LM velifer
L U++)marginifera i_
EU ! b J LL E
L(++)L
M ML EU LM P. triangularis. triangularis ML EU <+) linguiformis
U gigas LL EAg. triangularis jamieac
LTill III I I 1 I III ! I 1 1u EM punctata
asymmetricus transitons
ft- LL<+> E
disparalis+ ) upper- or lowermost
L = Lowerhermanni cristatus
Lvarcus M
Eensensis bipennatus
ensensis obliquimarginatuskockelianus
partitus
patulus
Oppel and Interval Zones
after Streel et al. 1987
(++) latest
L = Late(•) phase Zone
versabilis - cornuta Var.
VCo Fie.
gracilis - famenensis Mic.
OF Fam.
gracilis - hirtus
OH
••V" M
E
"IV" <*>
D
C
B
A
bulliferus - media
BM
bulliferus - jekhovskyi
BJ
triangulatus - concinna
TCo
triangulatus - ancyreaTA
acanthomammillatus - devonicusLem.
ADRef.
Mac.
apiculatus - proteus Vel.
AP Pro.
Cor.
?
? -i.
MIOSPORES
Assemblage-Acme Zones and Subzor.es
( This paper)
D. versabilis - G. famenensis S. papulosus SP
VF D. golibinicus DO
C. varicornata
CVa
C. lupinovitchi CL
C. bicornata CB
G. famenensis minutus OF
L. immensus Im
C. cris lifer - D. zadonica C. zadonica Za
CZ G. notata microspinosus OM
C. vimineus - G. vasjamica VV
C. deliquescens - V. evlanensis G. subsuta G S
DEA speciosa AS
A. ovalis - V. grumosus
oo
Af. radiatus MR
C. vetlasjanicus CVe
S. bellus SB
G. semilucensa - P. dunensis SD
C. optivus - S. krestovnikovii A. bucerus - A. variabilis insignis BIOK
A. incisa - G. micromanifesta IM
C. triangulatus - C. serralus TS
EXV. celeber - C. violabilis CV
C. magnificus - H. tichonovitschi MT
R. langii RL
P. tortus G. naumovii GN
PTE. biformis Bi
D. inassueta DI
R. clandestinus G vanjaschkinensis - A. subreticularis VS
RCA. divulgata plicata DP
m Conodonts
Figure 4
Middle and Late Devonian biostratigraphical (Conodonts and miospores) relations between the Eastmodified after Streel & Loboziak, in press
European Platform and the Ardenne-Rhine regions,
BCR
EDP 17 (1993)
MID
DLE AN
D UPPER D
EVON
IAN MIO
SPOR
E ZON
ATION - EASTER
N EUR
OPE

92 V.l. AVKHIMOVITCH, E.V. TCHIBRIKOVA, T.G. OBUKHOVSKAYA, A.M. NAZARENKO, V.T. UMNOVA,L.G. RASKATOVA, V.N. MANTSUROVA, S. LOBOZIAK AND M. STREEL
BCREDP 17 (1993)
Azonomonoletes microtuberculatus Tchib. PI. 1, 3 Azonomonoletes subreticularis Tchib. PI. 1 Azonomonoletes tuberculatus Tchib. PI. 3
Bascaudaspora dobridia Arkh. PI. 14 Bulbosisporites bulbosus (Obukh.) Obukh. PI. 15 Bulbosisporites volgogradicus (Nazarenko & Tchib.) Obukh. PI. 21, 22
Calyptosporites proteus (Naumova) Allen PI. 5 Calyptosporites tener (Tchib.) Obukh. var. concinnus Tchib. PI. 2 Calyptosporites velatus (Eisenack) Richardson PI. 4
Camarozonotriletes minutus (Naumova) Tchib. PI. 6 Camarozonotriletes obtusus Naumova PI. 12
Chelinospora concinna Allen PI. 8, 11 Chelinospora lepidus (Obukh.) Obukh. PI. 17 Chelinospora polymorpha (Naumova) Obukh.Chelinospora polymorpha (Naumova) Obukh. var. lepidus Obukh.
Cingulatisporites cassiformis (Rask.) Arkh.
Cirratriradites monogrammos (Arkh.) Arkh. PI. 6, 7 Cirratriradites punctomonogrammos (Arkh.) Arkh.
Contagisporites optivus (Tchib.) Owens PI. 10
Converrucosisporites curvatus (Naumova) Turnau PI. 11, 18-21 Converrucosisporites curvatus (Naumova) Turnau var. médius Kedo PI. 18, 19
Convolutispora cancellothyris (Waltz) Avkh. & Nekr. PI. 21, 23Convolutispora crassitunicata (Obukh.) Obukh. PI. 14Convolutispora subtil is Owens PI. 14Convolutispora tegula Allen
Convolutispora usitata Playford PI. 26Convolutispora zadonica (Nekr.) Obukh. & Nekr. PI. 20
Corbulispora semireticulata (Tchib.) Tchib. PI. 18 Corbulispora vimineus (Nekr.) Obukh. & Nekr. PI. 18, 19
Cornispora bicornata Nazarenko PI. 22-24 Cornispora monocornata Nazarenko PI. 22-24 Cornispora tricornata Nazarenko PI. 23 Cornispora varicornata Staplin & Jansonius
Corystisporites serratus (Kedo) Mc Gregor & Camfield PI. 9 Corystisporites spinutissimus (Kedo) Obukh. PI. 9
Cristatisporites deliquescens (Naumova) Arkh. PI. 16, 17 Cristatisporites imperpetuus (Sennova) Obukh. PI. 18 Cristatisporites lupinovitchi (Avkh.) Avkh. PI. 22-24 Cristatisporites triangulatus (Allen) McGregor & Camfield PI. 9, 10 Cristatisporites trivialis (Naumova) Obukh. PI.12, 14 Cristatisporites ( ?) violabilis (Tchib.) M. Rask. PI. 8 Cristatisporites (?) violabilis (Tchib.) M. Rask. var. major Tchib. PI. 8
Cyclogranisporites plicatus Allen PI. 1
Cymbosporites acanthaceus (Kedo) Obukh. PI. 16 Cymbosporites boafeticus (Tchib.) Obukh. PI. 17-19 Cymbosporites eximius (Obukh.) Obukh. PI. 17 Cymbosporites magnificus (McGregor) McGregor & Camfield PI. 7, 9Cymbosporites vettasjanicus Medianik & Obukh. PI. 14
Cyrtospora cristifer (Luber) Van Der Zwan PI. 19-21, 26 Cyrtospora expteta Arkh. PI. 14
Densosporites devonicus Richardson Densosporites sorokinii Obukh. PI. 11
Diaphanospora impolita (Tchib.) Arkh. PI. 2 Diaphanospora inassueta (Tchib.) Arkh. PI. 2 Diaphanospora macrovarius (Nazarenko) Nekr. & Avkh. PI. 19, 20 Diaphanospora rugosa (Naumova) Byvscheva PI. 16, 23 Diaphanospora zadonica (Naumova) Avkh. PI. 20
Diatomozonotriletes devonicus Naumova var. azonatus Tchib. PI. 6
Dibolisporites antiquus (Kedo) Arkh. PI. 4 Dibolisporites apsogus (Tchib.) Tchib. PI. 3 Dibolisporites capiteliatus (Tchib.) Arkh. PI. 1, 3 Dibolisporites radiatus Tiwari & Schaarschmidt PI. 2 Dibolisporites triangulatus Tiwari & Schaarschmidt PI. 2
Dictyotriletes famenensis Naumova PI. 19 Dictyotriletes grandiformis Kedo
Diducites commutatus (Naumova) Avkh. PI. 21, 25 Diducites compactus (Nekr.) Nekr. PI. 21-23 Diducites mucronatus (Kedo) Van Veen PI. 17, 22 Diducites poljessicus (Kedo) Van Veen PI. 23-25 Diducites radiatus (Kedo) Obukh. PI. 15, 16, 20 Diducites versabiiis (Kedo) Van Veen PI. 25, 26 Diducites vishenensis Obukh. & Avkh. PI. 20
Discernisporites golubinicus (Nazarenko) Avkh. PI. 25, 26
Elenisporis biformis (Arkh.) Arkh. PI. 4
Emphanisporites annulatus McGregor PI. 1 Emphanisporites rotatus McGregor PI. 1
Endoculeospora setacea (Kedo) Avkh. & Higgs PI. 26 Endosporites delectabilis (Nazarenko) Mantsurova PI. 26
Geminospora aurita Arkh. PI. 12, 13Geminospora compta (Naumova) Arkh. var. expletivus Tchib. PI. 7 Geminospora decora (Naumova) Arkh. PI. 8, 9 Geminospora egregius (Naumova) Tchib. PI. 7 Geminospora extensa (Naumova) Gao PI. 7-9 Geminospora meonacantha (Naumova) Tchib. PI. 7 Geminospora micromanifesta (Naumova) Arkh. PI. 8-10 Geminospora micromanifesta (Naumova) Arkh. var. limbatus Tchib. PI. 10Geminospora micromanifesta (Naumova) Arkh. var. minor Naumova PI. 7Geminospora notata (Naumova) Obukh. PI. 9-11, 14 Geminospora notata (Naumova) Obukh. var. microspinosus Tchib. PI. 18-20Geminospora plicata Owens PI. 10 Geminospora rugosa (Naumova) Obukh. PI. 9, 12, 14, 15 Geminospora semilucensa (Naumova) Obukh. & M. Rask. PI. 12, 13Geminospora tuberculata (Kedo) Allen PI. 7-9 Geminospora vasjamica (Tchib.) Obukh. & Nekr. PI. 18, 19 Geminospora vulgata (Naumova) Arkh. PI. 8, 9
Gneudnaspora divellomedium (Tchib.) Balme PI. 2
Grandispora aspersus (Avkh.) Avkh. PI. 22Grandispora distinctus (Naumova) Avkh. PI. 26Grandispora douglastownense McGregor PI. 3Grandispora echinata Hacquebard
Grandispora endemica (Tchib.) Tchib. PI. 2Grandispora endemica (Tchib.) Tchib. var. vanjaschkinensis Tchib.PI. 1Grandispora facilis (Kedo) Avkh. PI. 26 Grandispora famenensis (Naumova) Streel PI. 24-26 Grandispora famenensis (Naumova) Streel var. gracilis Kedo PI. 14 Grandispora famenensis (Naumova) Streel var. minutus Nekr. PI. 22, 23, 25Grandispora gracilis (Kedo) Streel PI. 25

BCREDP 17 (1993) MIDDLE AND UPPER DEVONIAN MIOSPORE ZONATION - EASTERN EUROPE 93
Grandispora inculta Allen PI. 8Grandispora longa (Arkh.) Tchib. var. antiquus Tchib. PI. 1 Grandispora ludza (Kedo) Obukh.Grandispora lupata Turnau PI. 26 Grandispora naumovii {Kedo) McGregor PI. 5 Grandispora parviconica (Kedo) Obukh.Grandispora prodigialis (Kedo) Avkh. PI. 24 Grandispora subsuta (Nazarenko) Obukh. PI. 17 Grandispora verrucata (Avkh.) Avkh.
Hymenospora intertextus (Nekr. & Sergeeva) Avkh. & Loboziak PI. 24
Hymenozonotriletes argutus Naumova PI. 13 Hymenozonotriletes ? inaequalis Philimonova et al. PI. 13 Hymenozonotriletes tichonovitschi Rask. PI. 7
Hystricosporites hamulus (Naumova) Nekr. PI. 20 Hystricosporites mitratus Allen PI. 3 Hystricosporites pleiomorphus (Kedo) Obukh. PI. 19 Hystricosporites setigerus (Kedo) Obukh. PI. 5
Kedoesporis angulosus (Naumova) Obukh. PI. 20 Kedoesporis evlanensis (Naumova) Obukh. PI.15-17 Kedoesporis imperfectus (Naumova) Obukh. PI. 15, 16 Kedoesporis livnensis (Naumova) Obukh.Kedoesporis rugilobus (Naumova) Obukh. & Avkh. PI. 23
Knoxisporites dedaleus (Naumova) Moreau-Benoit PI. 21-23, 26
Kraeuselisporites acerosus (Arkh.) McGregor & Camfield PI. 4
Laevigatosporites ovalis Kosanke PI. 25
Lagenoisporites immensus (Nazarenko & Nekr.) Avkh. & Turnau PI. 21, 22
Lanatisporites bislimbatus (Tchib.) Arkh. PI. 7, 8 Lanatisporites hispidus Arkh. PI. 2
Leiotriletes pagius Allen PI. 1
Lophotriletes multiformis Tchib. PI. 18 Lophotriletes paucus Kedo PI. 6
Lophozonotriletes concessus Naumova Lophozonotriletes furssenkoi Nekr. PI. 18 Lophozonotriletes lebedianensis Naumova PI. 21-23 Lophozonotriletes magnus Kedo Lophozonotriletes privus Arkh.Lophozonotriletes proscurrus Kedo PI. 26 Lophozonotriletes scurrus Naumova
Lophozonotriletes scurrus Naumova var. jugomaschevensis Tchib. PI. 8Lophozonotriletes torosus Naumova PI. 14 Lophozonotriletes tylophorus Naumova PI. 15
Membrabaculisporis comans (Philimonova) Arkh. PI. 7 Membrabaculisporis radiatus (Naumova) Arkh. PI. 15, 16
Periplecotriletes tortus Egorova PI. 4, 5 Perotrilites bifurcatus Richardson Perotrilites donensis (Rask.) M. Rask. PI. 12 Perotriiites meonacanthus (Naumova) Arkh. PI. 6 Perotrilites spinosus (Naumova) Arkh. PI. 9
Punctatisporites famenensis (Naumova) Obukh. PI, 19 Punctatisporites tortuosus (Tchib.) Arkh. PI. 2
Pustuiatisporites famenensis (Naumova) Obukh. PI. 19 Pustuiatisporites pullus (Naumova) Obukh. PI. 18
Reticulatisporites perlotus (Naumova) Obukh. PI. 10 Reticulatisporites retiformis (Naumova) Obukh. PI. 10
Retispora archaeolepidophyta (Kedo) McGregor & Camfield PI. 6 Retispora lepidophyta (Kedo) Playford var. macroreticulata Kedo PI. 25Retusotriletes ambogiosus Tchib. PI. 1 Retusotriletes clandestinus Tchib. PI. 1 Retusotriletes communis Naumova PI. 19, 23.Retusotriletes communis Naumova var. modestus Tchib. PI. 3Retusotriletes concinnus Kedo PI. 6Rétusotriletes insperatus Tchib. PI. 1Retusotriletes laevis Tchib. var. minor Rask. PI. 7Retusotriletes microaculeatus Tchib. PI. 1Retusotriletes naumovae Tchib. PI. 1Retusotriletes pychovi Naumova PI. 20Retusotriletes radiosus Rask. PI. 10Retusotriletes stylifer Tchib. PI. 1Retusotriletes tenerimedium Tchib.
Rhabdosporites facetus (Arkh.) Arkh. PI. 5 Rhabdosporites langii (Eisenack) Richardson PI. 6 Rhabdosporites mirus Arkh. PI. 3
Rugospora ? impolita (Naumova) Tchib. PI. 9
Samarisporites tozeri Owens PI. 6
Sinuosisporites sinuosus (Umnova) Arkh. PI. 4
Spelaeotriletes bellus (Naumova) Obukh. PI. 13 Spelaeotriletes domanicus (Naumova) Obukh. PI. 13 Spelaeotriletes hopericus (Nazarenko) Obukh. PI. 17 Spelaeotriletes instabilis (Rask.) Obukh. & M. Rask. PI. 13 Spelaeotriletes krestovnikovii (Naumova) Obukh. PI. 11-13 Spelaeotriletes microgranosus (Kedo) Obukh. PI. 17 Spelaeotriletes papulosus (Sennova) Avkh. PI. 21, 22, 24, 26
Stenozonotriletes conformis Naumova PI, 16, 20, 23 Stenozonotriletes definitus Naumova PI. 20 Stenozonotriletes extensus Naumova PI. 17 Stenozonotriletes formosus Naumova PI. 6 Stenozonotriletes laevigatus Naumova PI. 21 Stenozonotriletes supragrandis Kedo PI. 24
Vallatisporites celeber (Tchib.) Arkh. PI. 8
Verruciretusispora domanica (Naumova) Obukh. PI. 12 Verruciretusispora lucensa (Naumova) Obukh. PI. 13 Verruciretusispora pallida Owens PI. 13, 14 Verruciretusispora semilucensa (Naumova) Obukh. PI. 13
Verrucosisporites (?) concessus (Naumova) Obukh. PI. 11 Verrucosisporites evlanensis (Naumova) Obukh. PI. 16, 18 Verrucosisporites grumosus (Naumova) Obukh. PI. 15, 17
Zonomonoletes vulgaris Kedo PI. 24
Acknowledgements
The miospore zonation of the Devonian deposits occurring in Eastern Europe has been worked out using the data of numerous researchers. Among them special thanks are due to Drs. Raskatova, M.G. (Voronezh), Byvscheva, T.V. (Moscow), Nekriata, N.S. (Minsk), Kononenko, L.P. (Chernighov) and Verbova, N. I. (Uhta) for their material. The authors greatly acknowledge and appreciate the contribution by Naumova, S.N. and Kedo, G.I., regretfully no longer with us, who were the first to study and differentiate the Devonian miospores in Eastern Europe.
The authors are also grateful to Netter, R., URA 1365 du CNRS, Lille, Evrard, D. and Giraldo-Martin, F., Université de l’Etat, Liège, and Bühler, G., Elf Aquitaine, Pau, for their technical assistance.

94 V.l. AVKHIMOVITCH, E.V. TCHIBRIKOVA, T.G. OBUKHOVSKAYA, A.M. NAZARENKO, V.T. UMNOVA,L.G. RASKATOVA, V.N. MANTSUROVA, S. LOBOZIAK AND M. STREEL
BCREDP 17 (1993)
4 — REFERENCES
Araslanova, R.M, (1971). — New data on the correlation of the Middle Devonian horizons in the eastern and central regions of the Russian Platform. — Perm, VNIGNI, 117, 73-80 (in Russian).
Araslanova, R.M. (1976). — New palynological data on the stratigraphy of the Eifelian deposits in the western slope of the Middle Ural (Perm regions). Geology and petroleum potential of the Middle Volga and Kama regions. — Perm, VNIGNI, 161, 80-87 (in Russian).
Aristov, V.A. (1988). — Devonian Conodonts from the Central Devonian Field (Russian Platform). — Moscow, Nauka, 432, 120 pp. (in Russian).
Aristov, V.A. & Ovnatanova, N.S. (1985). — Conodonts from the Mosolov and Chernoyar deposits of the Russian Platform. — In : USSR Middle Devonian, its boundaries and stages. — Moscow, Nauka, 165-172 (in Russian).
Arkhangelskaya, A.D. (1972). — Palynological characteristics of the Middle Devonian lower horizons in the eastern part of the Russian Platform. — Moscow, VNIGNI, 83, 124-142 (in Russian).
Arkhangelskaya, A.D. (1980). — On establishing the Retuso- triletes clandestlnus Zone in the Devonian lower portion (south-eastern parts of Orenburg region). — Moscow, VNIGNI, 217, 47-52 (in Russian).
Arkhangelskaya, A.D. (1985). — Zonal spore assemblages and stratigraphy of the Lower and Middle Devonian in the Russian Plate.— In : Atlas of spore and pollen from the Phanerozoic petroleum formations in the Russian and Tura Plates. — Moscow, Nedra, 5-21 (in Russian).
Archangelskaya, A.D. & Ovnatanova, N.S. (1986). — Comparison of the zonal units by Conodonts and spores in the Frasnian deposits of the Volga-Ural Petroleum Province. — Izv. Akad. Nauk SSSR, ser. geol., 8, 61-67 (in Russian).
Avkhimovitch, V.l. (1974). — Palynological characteristics of the Upper Famennian saliferous formation in the Pripyat Depression. — In : Paleozoic spores of Belorussia. — Minsk, BelNIGRI, 95-107 (in Russian).
Avkhimovitch, V.l. (1975). — Famennian spore assemblages in the salt-bearing and suprasalt measures of the Pripyat Depression and their stratigraphic significance. — Doct. thesis synopsis, Vilnius State University, 30 pp. (in Russian).
Avkhimovitch, V.l. (1978). — On the correlation of the Upper Famennian deposits in the Pripyat Depression and Central Devonian Field. — In : Present-day problems of geology in the BSSR. — Minsk, BelNIGRI, 65-71 (in Russian).
Avkhimovitch, V.l. (1986). — Zonal differentiation and correlation of the Devonian/Carboniferous boundary deposits in Belorussia with the standard sections in the Franco- Belgian Basin by the spores. — In : Paleontology and its role in the study of geological structure of Belorussia. — Minsk, Nauka i Technika, 145-165 (in Russian).
Avkhimovitch, V.l. & Demidenko, E.K. (1985). — Biostratigraphy of the Devonian/Carboniferous boundary deposits in Belorussia (Pripyat Depression). — Magadan, SVK Nil Far-east Scientific Centre AN SSSR, 54 pp. (in Russian).
Avkhimovitch, V.I., Nekriata, N.S. & Obukhovskaya, T.G. (1988).- Devonian palynostratigraphy of the Pripyat Depres
sion, Belorussia. In : Devonian of the World. — Proc. Second Intern. Symp. Devonian System, Calgary, Canada, 3, 559-567.
Batanova, G.P., Shevtchenko, V.I., Netchaeva, M.A., & Nazarenko, A.M. (1968). — The Eifelian deposits of the Volgograd region. — Dokl. Akad. Nauk SSSR, 181, 6, 1452-1454 (in Russian).
Bouckaert, J., Streel, M. & Thorez, J. (1968). — Schéma biostratigraphique et coupes de référence du Famennien Belge. — Ann. Soc. géol. Belg., 91, 3, 317-336.
Durkina, A.V. & Avkhimovitch, V.l. (1988). — Reference sections of the Devonian/Carboniferous boundary deposits in the Timan-Pechora Province. — In : Devonian/Carboniferous boundary in the USSR. Minsk, Nauka i Technika, 87-101 (in Russian).
Durkina, A.V. & Avkhimovitch, V.l. (in press). — Devonian/Carboniferous boundary deposits in the reference section of the northern Timan-Pechora Province. — Izv. Akad. Nauk SSSR (in Russian).
Durkina, A.V., Kushnareva, T.l. & Khalymbadja, V.G. (1980). — Zonal differentiation of the Upper Devonian/Carboniferous boundary strata in the Pechora Syncline. — Soviet Geology, 8, 56-68 (in Russian).
Golubtsov, V.K., Avkhimovitch, V.I., Akimets, V.S., Belousova, G.A., Burlak, A.F., Demidemko, E.K., Kedo, G.I., Krutchek, S.A., Linnik, L.F., Mityanina, I.V., Moiseyeva, T.I., Nekriata,N.S., Pifkun, E.V. & Pushkin, V.l. (1974). —Stratigraphical and Paleontological studies in Belorussia. — Minsk, Nauka i Technica, 248 pp. (in Russian).
Kamaletdinov, M.A. & Kamaletdinov, P.A. (1960). — New data on Devonian in the basin of river Ik in the Southern Ural. — Dokl. Akad. Nauk SSSR, 130, 1, 143-145 (in Russian).
Kedo, G.l. & Avkhimovitch, V.l. (1981). —Zonal differentiation of the Upper Famennian deposits in the Pripyat Depression by palynological data. — In : New data on the stratigraphy of Belorussia. — Minsk, BelNIGRI, 83-85 (in Russian).
Kedo, G.l. & Obukhovskaya, T.G. (1981). — Middle Devonian of the Baltic region and north-eastern Belorussia. — In : Devonian and Carboniferous of the Baltic region. — Riga, Zinatne, 419-436 (in Russian).
Khalymbadja, V.G., Tchernijsheva, N.G. & Baryshev, V.N. (1985). — Middle Devonian biostratigraphy of the western slope of the Ural according to Conodonts. — In : Middle Devonian of the USSR, its boundaries and stage subdivision. — Moscow, Nauka, 69-74 (in Russian).
Klapper, G. & Ziegler, W. (1979). — Devonian Conodont Biostratigraphy. — In : House, M.R., Scrutton, C.T. & Bassett, M.G. (eds.) : The Devonian System. — Special Papers in Palaeontology, London, 23, 199-224.
Kononenko, L.P (1983). — Palynozones of the Devonian intersalt measures in the north-western part of the Dnie- per-Donetsk Depression. — In : Geology and geochemistry of energy resources. — Kiev, 60, 77-82 (in Russian).
Kononenko, L.P. (1984). — On the palynozones in the Famennian intersalt deposits in the north-west of the Dnieper-Donetsk Depression. — In : Paleontology and stratigraphy of the Ukrainian Phanerozoic. — Kiev, Navu- kova Dumka, 29-33 (in Russian).
Krutchek, S.A. (1974). — On the Middle Devonian conodonts in Belorussia. — In: Problems of regional geology in Belorussia. — Minsk, BelNIGRI, 118-126 (in Russian).
Kuzmin, A.V. & Ovnatanova, N.S. (1989). — Upper Frasnian shallow-marine Conodonts in the southern Timan. — In : Paleontological method in the practical stratigraphy. — Moscow, IGIRGI, 15-22 (in Russian).
Liashenko, A.I. (1959). — Brachiopod atlas and stratigraphy of the Devonian deposits in the Central regions of the Russian Platform. — Moscow, Gostoptehizdat, 451 pp. (in Russian).
Mantsurova, V.N. (1987). — Palynological characteristics of the Liven and Umet Beds in the Volga basin near Volgograd. — In : Petrol, geol. zoning and methods of petrol, prosp. in the Caspian region. — Volgograd, VNIPIneft, 95-101 (in Russian).
Medianik, S.l. (1981). — Palynological characteristics of the Frasnian deposits in the Timan-Pechora Province. — Doct. thesis synopsis, Moscow, 26 pp. (in Russian).
Naumova, S.N. (1953). — Spore and pollen assemblages in Upper Devonian of the Russian Platform and their stratigraphic significance. — Moscow, IGN, ser. geol., 60, 143, 200 pp. (in Russian).

BCREDP 17 (1993) MIDDLE AND UPPER DEVONIAN MIOSPORE ZONATION - EASTERN EUROPE 95
Nazarenko, A.M. (1975). — Famennian spore Assemblages in the Volga region near Volgograd and their stratigraphic importance. — Volgograd, 139 pp. (in Russian).
Nazarenko, A.M. (1983). — Palynological characteristics of the Sargaevo and Middle Frasnian deposits in the Volga region. — In : Stratigraphy and correlation of the deposits by palynological methods. — Sverdlovsk, 43-45 (in Russian).
Nazarenko, A.M., Tchibrikova, E.V., Avkhimovitch, V.I., Nekriata,N.S., Obukhovskaya, T.G., Kononenko, L.P. & Mantsurova, V.N. (in press). — Palynological substrantiation of the Frasnian/Famennian boundary in the East-European Platform. — In : Paleontological method in geology. — Moscow, IGIRGI (in Russian).
Nekriata, N.S. (1979). — Zonal spore assemblages in the Pripyat Depression intersalt deposits. — Dokl. Akad. Nauk. BSSR, 23, 6, 547-549 (in Russian).
Obukhovskaya, N.S. (1986). — Amount and boundaries of the Frasnian deposits in the Pripyat Depression by palynological data. — In ; Paleontology and its role in the study of geological structure of Belorussia. — Minsk, Nauka i Technika, 134-144 (in Russian).
Obukhovskaya, T.G. & Kuzmin, A.V. (in press). — Spores and Conodonts from the Upper Frasnian/Lower Famennian boundary deposits in the Uhta-Tebu area. — In : Paleontological method in geology. — Moscow, Trans, (in Russian).
Obukhovskaya, T.G. & Nekriata, N.S. (1983). — Palynological characteristics of the Frasnian/Famennian boundary deposits in the Pripyat Depression. — In : Questions of regional geological structure of the BSSR. — Minsk, Bel- NIGRI, 108-122 (in Russian).
Ovnatanova, N.S. & Kuzmin, A.V. (1991). — Conodonts from the type sections of the Domanik Formation in the Southern Timan. — Izv. Akad. Nauk SSSR, 3, 37-50 (in Russian).
Palynological Meeting (1984). — Decision devoted to the zonal differentiation and correlation of the Devonian sections in the Russian Platform. — Uhta, 18 pp. (in Russian).
Potonie, R. & Kremp, G. (1954). — Die Gattungen der palâozoischen Sporae dispersae und ihre Stratigraphie. — Geol. Jb., 69, 111-194.
Raskatova, L.G. (1969). — Spore and pollen assemblages of Middle and Upper Devonian in the south-east of the 'Central Devonian Field. — Voronezh, Voronezh State University, 166 pp. (in Russian).
Raskatova, L.G. (1973). — Palynological characteristics of the Famennian deposits in the Central regions of the Russian Platform. — Voronezh, Voronezh State University, 172 pp. (in Russian).
Raskatova, L.G. (1974). — Detailed stratigraphic differentiation of Devonian in the central Devonian Field by palynological data. — In : Proterophytic and paleophytic palynology. — Moscow, Nauka, 67-71 (in Russian).
Raskatova, L.G. (1975). — Palynological characteristics of the Voronezh deposits in the Central regions of the Russian Platform. — In : Some questions of the sedimentary cover stratigraphy in the Voronezh Anteclise. — Voronezh, Voronezh State University, 19-24 (in Russian).
Raskatova, L.G., Kononenko, L.P. & Smirnova, G.F. (1975). — Palynological characteristics of the Petin deposits in the Central regions of the Russian and Dnieper-Donetsk Depression. — In: Lithology and stratigraphy of the sedimentary cover in the Voronezh Anteclise. — Voronezh, Voronezh State University, 81-85 (in Russian).
Raskatova, M.G. (1990). — Palynoassemblages of the Give- tian/Frasnian boundary deposits in the Central Devonian
Field and Timan. — Doct. thesis synopsis, Moscow, 19 pp. (in Russian).
Richardson, J.B. & McGregor, D.C. (1986). — Silurian and Devonian spore zones of the Old Red Sandstone Continent and adjacent regions. — Bull. geol. Surv. Canada, 364, 81 pp.
Rzhonsnitskaya, M.A. & Kulikova, V.F. (1991). — Devonian of the Russian Platform. — In : Stratigraphy and paleontology of Devonian Carboniferous and Permian of the Russian Platform. — Leningrad, VSEGEI, 11-21 (in Russian).
Sennova, VF, (1972). — Upper Devonian spore and pollen assemblages in the Timan-Pechora Province. — In : Geology and petroleum potential in the north-east of the European USSR. — Syktyvkar, 2, 99-108 (in Russian).
Streel, M. (1986). — Miospore contribution to the Upper Famennian-Strunian event stratigraphy. — Ann. Soc. géol. Belg., 109, 75-92.
Streel, M., Higgs, K., Loboziak, S., Riegel, W. & Steemans, P. (1987). — Spore stratigraphy and correlation with faunas and floras in the type marine Devonian of the Ardenne- Rhenish region. — Rev. Palaeobot. Palynol., 50, 211-229.
Streel, M. & Loboziak, S. (in press). — Middle to Upper Devonian miospores. — Palynology and Stratigraphy. AASP Silver Jubilee Project.
Tchibrikova, E.V. (1962). — Spores in the Devonian clastic sections of western Bashkiria and western slope of the Southern Ural. — In : Brachiopods, Ostracodes and spores of Middle and Upper Devonian in Bashkiria. — Moscow, Nauka, 351-467 (in Russian).
Tchibrikova, E.V. (1972). — Plant microfossils in the Southern Ural and adjacent areas. — Moscow, Nauka, 220 pp. (in Russian).
Tchibrikova, E.V. (1977). — Stratigraphy of the Devonian and more ancient Paleozoic deposits in the Southern Ural and adjacent areas. — Moscow, Nauka, 191 pp. (in Russian).
Tchibrikova, E.V. (1982). — Lower/Middle Devonian boundary in the Barrandian sections by plant spores. — In : Biostratigraphy of the Lower/Middle Devonian boundary deposits. — Moscow, Nauka, 159-165 (in Russian).
Tchibrikova, E.V. & Naumova, S.N. (1974). — Devonian spore and pollen zonal assemblages in the European USSR and their analogues abroad. — In : Proterophytic and paleophytic palynology. — Moscow, Nauka, 39-46 (in Russian).
Tchibrikova, E.V. & Nazarenko, A.M. (1974). — New stratigraphic units of Upper Devonian in the south-east of the Russian Platform and Ural and their palynological characteristics. — In : Proterophytic and paleophytic palynology. — Moscow, Nauka, 78-81 (in Russian).
Umnova, V.T. (1971). — On the Devonian/Carboniferous boundary in the Central regions of the Russian Platform by palynological data. — Izv. Akad. Nauk. SSSR, 4, 109- 122 (in Russian).
Umnova, V.T. (1987). — The importance of phyto- and lithos- tratigraphic analysis for the stratification of the Middle Devonian lower horizons. — In : Enhancing geological survey projects in the Central regions of the East-European Platform. — Moscow, 33-40 (in Russian).
Vaitekunene, G.K. (1983). — On the Devonian spore assemblages of the Kiarnav Formation in the southern Baltic Region. — In : Palynology in geological studies of the Baltic region and sea. — Riga, Zinatne, 27-31 (in Russian).
Weddige, K. (1984). — Zur Stratigraphie und Palâogeogra- phie des Devons und Karbons von NE-lran. — Senck. lethaea, 65, 179-223.
Ziegler, W. & Sandberg, C.A. (1990). — The Late Devonian Standard Conodont Zonation. — Cour. Forsch.- Inst. Sen- ckenberg, 121, 1-115.

96 V.l. AVKHIMOVITCH, E.V. TCHIBRIKOVA, T.G. OBUKHOVSKAYA, A.M. NAZARENKO, V.T. UMNOVA,L.G. RASKATOVA, V.N. MANTSUROVA, S. LOBOZIAK AND M. STREEL
BCREDP 17 (1993)
PLATE 1Illustrated specimens magnifications x 500 for all the plates
Retusotriletes ctandestinus (RC) Zone
Fig. 1. —Retusotriletes ctandestinus Tchib.W. slope Southern Ural, Rauzjak, 8, 43,7-45, 2 m
2. — Apiculiretusispora divulgata Tchib. var. plicata Tchib.W. slope Southern Ural, Rauzjak, 8, 38,2-40,6 m
3. — Retusotriletes stylifer Tchib.W. Bashkir, Uruzbaevskaja, 59, 1427,5-1430,2 m
4. — Cyciogranisporites plicatus AllenW. Bashkir, Uruzbaevskaja, 59, 1435-1440 m
5. — Retusotriletes naumovae Tchib.W. slope Southern Ural, Rauzjak, 8, 33,5-34,4 m
6. — Apiculiretusispora absurda (Tchib.) Arkh.W. Bashkir, Khlebodarovskaja, 7, 2448-2450 m
7. — Apiculiretusispora aculeolata (Tchib.) Arkh.W. slope Southern Ural, Rauzjak, 8, 38,4-40,6 m
8. — Retusotriletes microaculeatus Tchib.W. slope Southern Ural, Rauzjak, 8, 33,4-34,4 m
9. — Dibolisporites capitellatus (Tchib.) Arkh.W. slope Southern Ural, Inzer river, Gabdukovo village
10. — Archaeozonotriietes Ignoratus (Naumova) Tchib.W. slope Southern Ural, Inzer river, Gabdukovo village
11. — Emphanisporites annulatus McGregorBelarus, Braslavskaja, 14, 225-229 m
12. — Retusotriletes ambagiosus Tchib.W. slope Southern Ural, Inzer river, Gabdukovo village
13. — Grandispora endemica (Tchib.) Tchib. var. vanjaschkinensis Tchib.W. slope Southern Ural, Inzer river, Gabdukovo village
14. — Grandispora longa (Arkh.) Tchib. var. antiquus Tchib.Belarus, Braslavskaja, 14, 225-229 m
15. — Azonomonoletes microtuberculatus Tchib.W. slope Southern Ural, Inzer river, Gabdukovo village
16. — Azonomonoletes subreticularis Tchib.W. slope Southern Ural, Inzer river, Gabdukovo village
17. — Retusotriletes insperatus Tchib.
W. slope Southern Ural, Inzer river, Gabdukovo village18. — Leiotriletes pagius Allen
Belarus, Braslavskaja, 6, 327-331 m19. — Emphanisporites rotatus McGregor
Belarus, Braslavskaja, 14, 225-229 m

BCREDP 17 (1993) V.l. AVKHIMOVITCH, E.V. TCHIBRIKOVA, T.G. OBUKHOVSKAYA, A.M. NAZARENKO, V.T. UMNOVA,L.G. RASKATOVA, V.N. MANTSUROVA, S. LOBOZIAK AND M. STREEL.
- MIDDLE AND UPPER DEVONIAN MIOSPORE ZONATION - EASTERN EUROPE : Plate 1
97

98 V.l. AVKHIMOVITCH, E.V. TCHIBRIKOVA, T.G. OBUKHOVSKAYA, A.M. NAZARENKO, V.T. UMNOVA,L.G. RASKATOVA, V.N. MANTSUROVA, S. LOBOZIAK AND M. STREEL
BCREDP 17 (1993)
PLATE 2Diaphanospora inassueta (DI) Zone
Fig. 1. —Diaphanospora inassueta (Tchib.) Arkh.W. Bashkir, Konstantinovskaja, 6, 1754-1760 m
2. — Diaphanospora impolita (Tchib.) Arkh.W. slope Southern Ural, Inzer river, Gabdukovo village
3. — Gneudnaspora divellomedium (Tchib.) BalmeBelarus, Tscherikovskaja, 1, 418-423 m
4. — Grandispora endemica (Tchib.) Tchib.W. slope Southern Ural, Inzer river, Gabdukovo village
5. — Punctatisporites tortuosus (Tchib.) Arkh.W. Bashkir, Konstantinovskaja, 6, 1754-1760 m
6. — Dibolisporites radiatus Tiwari & SchaarschmidtBelarus, Berdyzh, 1, 431-436 m
7. — Apicuiiretusispora sterlibaschevensis (Tchib.) Arkh.W. Bashkir, Sterlibashevskaja, 19, 2017-2028 m
8. — Dibolisporites triangulatus Tiwari & SchaarschmidtBelarus, Berdyzh, 1, 431-436 m
9. — Archaeozonotritetes ignoratus (Naumova) Tchib.W. Bashkir, Ishtuganovskaja, 2, 1028,7-1029,9 m
10. — Archaeozonotritetes poiymorphus Naumova var. takatinicus Tchib.W. Bashkir, Sumlinskaja, 17, 2092,7-2098,5 m
11. — Lanatisporites hispidus Arkh.Belarus, Tscherikovskaja, 1, 418-423 m
12. — Calyptosporites tener (Tchib.) Obukh. var. concinnus Tchib.Belarus, Braslavskaja, 6, 297-307 m

* «
BCREDP 17 (1993) 99V.l. AVKHIMOVITCH, E.V. TCHIBRIKOVA, T.G. OBUKHOVSKAYA, A.M. NAZARENKO, V.T. UMNOVA,L.G. RASKATOVA, V.N. MANTSUROVA, S. LOBOZIAK AND M. STREEL.
- MIDDLE AND UPPER DEVONIAN MIOSPORE ZONATION - EASTERN EUROPE : Plate 2

100 V.l. AVKHIMOVITCH, E.V. TCHIBRIKOVA, T.G. OBUKHOVSKAYA, A.M. NAZARENKO, V.T. UMNOVA,L.G. RASKATOVA, V.N. MANTSUROVA, S. LOBOZIAK AND M. STREEL
BCREDP 17 (1993)
PLATE \J
Diaphanospora inassueta (DI) Zone
Fig. 1. —Dibolisporites capitellatus (Tchib.) Arkh.Volga Basin near Volgograd, Tersinskaja,80, 2603-2611 m
2. — Dibolisporites apsogus (Tchib.) Tchib.W. Bashkir, Leninskaja, 2, 1987-1990 m
3. — Rhabdosporites mirus Arkh.Belarus, Tscherikovskaja, 1, 418-423 m
4. — Hystricosporites mitratus AllenLatvia, Talsy, 55, 588 m
5. — Azonomonoietes microtubercuiatus Tchib.W. Bashkir, Elatminskaja, 2, 2406-2413 m
6. — Azonomonoietes tuberculatus Tchib.W. Bashkir, Elatminskaja, 2, 2406-2413 m
7. — Grandispora dougiastownense McGregorBelarus, Tscherikovskaja, 1, 418-423 m
8. — Retusotriietes communis Naumova var. modestus Tchib.Volga Basin near Volgograd, Tersinskaja, 80, 2603-2611 m
9. — Apiculiretusispora verrucosa (Kedo) Arkh.Belarus, Berdyzh, 1, 431-436 m

BCREDP 17 (1993) V.l. AVKHIMOVITCH, E.V. TCHIBRIKOVA, T.G. OBUKHOVSKAYA, A.M. NAZARENKO, V.T. UMNOVA,L.G. RASKATOVA, V.N. MANTSUROVA, S, LOBOZIAK AND M. STREEL.
- MIDDLE AND UPPER DEVONIAN MIOSPORE ZONATION - EASTERN EUROPE : Plate 3
101

102 V.l. AVKHIMOVITCH, E.V. TCHIBRIKOVA, T.G. OBUKHOVSKAYA, A.M. NAZARENKO, V.T. UMNOVA,L.G. RASKATOVA, V.N. MANTSUROVA, S. LOBOZIAK AND M, STREEL
BCREDP 17 (1993)
PLATE 4Periplecotriletes tortus (PT) Zone
E. biformis (Bi) Subzone
Fig. 1. —Periplecotriletes tortus EgorovaW. Bashkir, Ermekeevo, 11, 1976-1982 m
2. — Dibolisporites antiquus (Kedo) Arkh.Central Regions, Brjanskaja, 6000, 510 m
3, 4. — Eienisporis biformis (Arkh.) Arkh.3. Volga Basin near Volgograd, Khoperskaja, 974, 759,7-764,4 m4. Belarus, Tscherikovskaja, 1, 386,8-392,2 m
5. — Calyptosporites velatus (Eisenack) Richardson
Central Regions, Brjanskaja, 6000, 510 m6. — Sinuosisporites sinuosus (Umnova) Arkh.
Volga Basin near Volgograd, Khoperskaja, 974, 759,7-764,4 m.7. — Kraeuselisporites acerosus (Arkh.) McGregor & Camfield
W. Bashkir, Ermekeevo, 11, 1976-1982 m

BCREDP 17 (1993) V.l. AVKHIMOVITCH, E.V. TCHIBRIKOVA, T.G. OBUKHOVSKAYA, A.M. NAZARENKO, V.T, UMNOVA,L.G. RASKATOVA, V.N. MANTSUROVA, S. LOBOZIAK AND M. STREEL,
- MIDDLE AND UPPER DEVONIAN MIOSPORE ZONATION - EASTERN EUROPE : Plate 4
103

104 V.l. AVKHIMOVITCH, E.V. TCHIBRIKOVA, T.G. OBUKHOVSKAYA, A.M. NAZARENKO, V.T. UMNOVA,L.G. RASKATOVA, V.N. MANTSUROVA, S. LOBOZIAK AND M. STREEL
BCREDP 17 (1993)
PLATE 5Periplecotriletes tortus (PT) Zone
G. naumovii (GN) Subzone
Fig. 1. — Periplecotriletes tortus Egorova Belarus, Berdyzh, 1, 354-359 m
2. — Grandispora naumovii (Kedo) McGregorBelarus, Chotimskaja, 1, 470-472 m
3. — Hystricosporites setigerus (Kedo) Obukh.Belarus, Chotimskaja, 1, 438-440 m
4. — Ancyrospora microincisa (Kedo) Obukh.Belarus, BH PNPZ, 215-230 m
5. — Apiculiretusispora gibberosa (Kedo) Arkh.Volga Basin near Volgograd, Choperskaja, 974, 759,7-764,4 m
6. — Rhabdosporites facetus (Arkh.) Arkh.Belarus, Berdyzh, 1, 354-359 m
7. — Calyptosporites proteus (Naumova) Allen
Belarus, Gavriltchitskaja, 45, 385 m

BCREDP 17 (1993) V.l. AVKHIMOVITCH, E.V. TCHIBRIKOVA, T.G. OBUKHOVSKAYA, A.M. NAZARENKO, V.T. UMNOVA,L.G. RASKATOVA, V.N. MANTSUROVA, S. LOBOZIAK AND M. STREEL,
- MIDDLE AND UPPER DEVONIAN MIOSPORE ZONATION - EASTERN EUROPE : Plate 5
105

106 V.l. AVKHIMOVITCH, E.V. TCHIBRIKOVA, T.G. OBUKHOVSKAYA, A.M. NAZARENKO, V.T. UMNOVA,L.G. RASKATOVA, V.N. MANTSUROVA, S. LOBOZIAK AND M, STREEL
BCREDP 17 (1993)
Rhabdosporites langii (RL) Zone
Fig. 1. —Rhabdosporites langii (Eisenack) Richardson
Central Devonian Field, L. Mamon, 596, 114,1 m2. — Retispora archaeolepidophyta (Kedo) McGregor & Camfield
Belarus, Chotimskaja, 1, 414 m3. — Cirratriradites monogrammos (Arkh.) Arkh.
Central Regions, Vjasma, 1, 734,9 m4. — Perotrilites meonacanthus (Naumova) Arkh.
Belarus, Gavriltchitskaja, 45, 361-365 m5. — Lophotriletes paucus Kedo
Belarus, Gavriltchitskaja, 45, 361-365 m6. — Camarozonotriletes minutus (Naumova) Tchib.
Belarus, Gavriltchitskaja, 45, 361-365 m7. — Acanthotriletes variaculeatus Kedo
Belarus, BH PNPZ, 190-194 m8. — Diatomozonotriletes devonicus Naumova var. azonatus Tchib.
W. Bashkir, Ermekeevskaja, 12, 2278-2281 m9. — Azonomonoletes ellipsoïdes Kedo
Central Regions, Adamovskaja, 1, 445 m10. — Acanthotriletes perpusillus Naumova
W. Bashkir, BH Sulli, 7, 1926-1931 m11. — Samarisporites tozeri Owens
Belarus, Gavriltchitskaja, 45, 361-365 m12. — Retusotriletes concinnus Kedo
Central Devonian Field, L. Mamon, 596, 114,1 m13. — Stenozonotriletes formosus Naumova
Belarus, Gavriltchitskaja, 45, 295-351 m

BCREDP 17 (1993) V.l. AVKHIMOVITCH, E.V. TCHIBRIKOVA, T.G. OBUKHOVSKAYA, A.M. NAZARENKO, V.T. UMNOVA,L.G, RASKATOVA, V.N. MANTSUROVA, S. LOBOZIAK AND M. STREEL.
- MIDDLE AND UPPER DEVONIAN MIOSPORE ZONATION - EASTERN EUROPE : Plate 6
107

108 V.l. AVKHIMOVITCH, E.V. TCHIBRIKOVA, T.G. OBUKHOVSKAYA, A.M. NAZARENKO, V.T. UMNOVA,L.G. RASKATOVA, V.N. MANTSUROVA, S. LOBOZIAK AND M. STREEL
BCREDP 17 (1993)
PLATE /
Geminospora extensa (EX) ZoneC. magnificus - H. tichonovitchi (MT) Subzone
Fig. 1. — Geminospora extensa (Naumova) GaoCentral Devonian Field, BH 8214, 139 m
2. — Cymbosporites magnificus (McGregor) McGregor & CamfieldW. Bashkir, Asnaevskaja, 1, 2208-2212 m
3. — Geminospora tuberculata (Kedo) AllenCentral Devovian Field, BH 8214, 139 m
4. — Geminospora micromanifesta (Naumova) Arkh. var, minor Naumova
Central Devonian Field, BH 8214, 139 m5. — Retusotritetes laevis Tchib. var. minor Rask.
Central Devonian Field, BH 8204, 252 m6. — Membrabaculisporis comans (Philimonova) Arkh.
W. Bashkir, Shaviady, 28, 1855,2-1857,3 m7. — Cirratriradites monogrammos (Arkh.) Arkh.
Central Regions, Vjasma, 1, 674 m8. — Geminospora compta (Naumova) Arkh. var. expletivus Tchib.
W. Bashkir, Kirgis-Mnjaki, 1, 2275-2281 m9. — Geminospora meonacantha (Naumova) Tchib.
Central Regions, Vjasma, 1, 675 m10. — Lanatisporites bislimbatus (Tchib.) Arkh.
Central Regions, Vjasma, 1, 675 m11. — Hymenozonotriletes tichonovitschi Rask.
W. Bashkir, Znamenskaja, 120, 2075-2081 m12. — Geminospora egregius (Naumova) Tchib.
W. Bashkir, Asnaevskaja, 1, 2212-2215 m

BCREDP 17 (1993) V.l. AVKHIMOVITCH, E.V. TCHIBRIKOVA, T.G. OBUKHOVSKAYA, A.M. NAZARENKO, V.T. UMNOVA,L.G. RASKATOVA, V.N. MANTSUROVA, S. LOBOZIAK AND M. STREEL.
- MIDDLE AND UPPER DEVONIAN MIOSPORE ZONATION - EASTERN EUROPE : Plate 7
109

110 V.l. AVKHIMOVITCH, E.V. TCHIBRIKOVA, T.G. OBUKHOVSKAYA, A.M. NAZARENKO, V.T. UMNOVA, BCREDP 1L.G. RASKATOVA, V.N. MANTSUROVA, S. LOBOZIAK AND M. STREEL
PLATE Ij
Geminospora extensa (EX) ZoneV. celeber - C.(?) violabilis (CV) Subzone
Fig. 1. — Vallatisporites celeber (Tchib.) Arkh.W. Bashkir, Is - Basa, 22, 1829-1835 m
2. — Cristatisporites (?) violabilis (Tchib.) M. Rask. var. major Tchib.W. Bashkir, Dubrovka, 1, 1760-1766 m
3. — Cristatisporites (?) violabilis (Tchib.) M. Rask.W. Bashkir, Bokaly, 4, 1651-1657 m
4. — Geminospora extensa (Naumova) Gao
W. Bashkir, Arlanskaja, 3, 1925,7-1932,8 m5. — Geminospora tuberculata (Kedo) Allen
Central Regions, Vjasma, 1, 654 m6. — Chelinospora concinna Allen
Belarus, Pripyat Depression, BH 3259, 123-127 m7. — Lanatisporites bislimbatus (Tchib.) Arkh.
Belarus, BH PNPZ, 106-112 m8. — Grandispora inculta Allen
Central Regions, Vjasma, 646 m9. — Archaeozonotriletes ocularis Rask.
Central Devonian Field, BH 8204, 210 m10. — Archaeozonotriletes timanicus Naumova
Central Devonian Field, Pavlosk quarry11. — Geminospora decora (Naumova) Arkh.
Belarus, Pripyat Depression, BH 3259, 123-127 m12. — Geminospora vulgata (Naumova) Arkh.
Belarus, Pripyat Depression, BH 3259, 123-127 m13. — Geminospora micromanifesta (Naumova) Arkh.
Central Regions, Vjasma, 674 m14. — Lophozonotriletes scurrus Naumova var. jugomaschevensis Tchib.
W. Bashkir, Leninskaja, 8, 1841,4-1845,4 m
7 (1993)

111BCREDP 17 (1993) V.l. AVKHIMOVITCH, E.V. TCHIBRIKOVA, T.G. OBUKHOVSKAYA, A.M. NAZARENKO, V.T. UMNOVA,L.G. RASKATOVA, V.N. MANTSUROVA, S. LOBOZIAK AND M. STREEL,
- MIDDLE AND UPPER DEVONIAN MIOSPORE ZONATION - EASTERN EUROPE : Plate 8

112 V.l. AVKHIMOVITCH, E.V. TCHIBRIKOVA, T.G. OBUKHOVSKAYA, A.M. NAZARENKO, V.T. UMNOVA, BCREDP 1L.G. RASKATOVA, V.N. MANTSUROVA, S. LOBOZIAK AND M, STREEL
PLATE
Geminospora extensa (EX) ZoneC. triangulatus - C. serratus (TS) Subzone
Fig. 1-2. —Cristatisporites triangulatus (Allen) McGregor & Camfield
1. Central Devonian Field, BH 8151, 113 m2. Belarus, Mstislavskaja, 1, 263-265 m
3. — Corystisporites serratus (Kedo) McGregor & CamfieldBelarus, BH PNPZ, 106 m
4. — Geminospora extensa (Naumova) GaoW. Bashkir, Alkinskaja, 4, 2247-2249 m
5. — Cymbosporites magnificus (McGregor) McGregor & CamfieldW. Bashkir, Ik-Basa, 22, 1807-1808 m
6. —Corystisporites spinutissimus (Kedo) Obukh.Central Regions, Vjasma, 646 m
7. —Perotrilites spinosus (Naumova) Arkh.W. Bashkir, Igrovka, 20, 2049,8-2050,6 m
8. — Geminospora micromanifesta (Naumova) Arkh.Central Devonian Field, BH, 88 m
9. —Aneurospora heterodonta (Naumova) StreelW. Bashkir, Ik - Basa, 22, 1803-1807 m
10. —Geminospora vuigata (Naumova) Arkh.W. Bashkir, Ik - Basa, 22, 1803-1807 m
11. —Geminospora rugosa (Naumova) Obukh.Central Devonian Field, BH 6774, 150 m
12. —Geminospora tuberculata (Kedo) AllenBelarus, BH PNPZ, 106 m
13. —Rugospora ? impolita (Naumova) Tchib.W. Bashkir, Dubrovka, 1, 1721,9-1728,8 m
14. —Geminospora decora (Naumova) Arkh.Central Regions, Vjasma, 646 m
15. —Geminospora notata (Naumova) Obukh.Central Regions, Vjasma, 646 m
16. —Ancyrospora fidus (Naumova) Obukh.W. Bashkir, Tumenjak-Charan, 1500, 1752 m
7 (1993)

BCREDP 17 (1993) V.l. AVKHIMOVITCH, E.V. TCHIBRIKOVA, T.G. OBUKHOVSKAYA, A.M. NAZARENKO, V.T. UMNOVA,L.G, RASKATOVA, V.N. MANTSUROVA, S. LOBOZIAK AND M. STREEL.
- MIDDLE AND UPPER DEVONIAN MIOSPORE ZONATION - EASTERN EUROPE : Plate 9
113

114 V.l. AVKHIMOVITCH, E.V. TCHIBRIKOVA, T.G. OBUKHOVSKAYA, A.M. NAZARENKO, V.T. UMNOVA,L.G. RASKATOVA, V.N, MANTSUROVA, S. LOBOZIAK AND M. STREEL
BCREDP 17 (1993)
Fig. 1.
2.
3.
4, 5.
6.
7.
8.
9.
10.
11.
12.
13.
Contagisporites optivus - Spelaeotriletes krestovnikovii (OK) ZoneA. incisa - G. micromanifesta (IM) Subzone
— Ancyrospora incisa (Naumova) M. Rask. & Obukh.Belarus, Pripyat Depression, BH 3260, 67 m
— Geminospora micromanifesta (Naumova) Arkh.Central Devonian Field, BH 8151, 62 m
— Aneurospora greggsii (McGregor) Streel Central Devonian Field, BH 8151, 64 m
— Cristatisporites triangulatus (Allen) McGregor & Camfield
4. Central Regions, Vjasma, 602,5 m5. Pripyat Depression, BH 3259, 123 m
— Reticulatisporites retiformis (Naumova) Obukh.Belarus, Mstislavskaja, 1, 225-230 m
— Geminospora micromanifesta (Naumova) Arkh. var. limbatus Tchib.Belarus, Pripyat Depression, BH 3259, 123 m
— Geminospora plicata Owens Belarus, Mstislavskaja, 1, 225-230 m
— Reticulatisporites perlotus (Naumova) Obukh.W. Bashkir, Tchekmagushskaj, 67, 1922-1925 m
— Geminospora notata (Naumova) Obukh.Belarus, Mstislavskaja, 1, 225-230 m
— Contagisporites optivus (Tchib.) Owens Central Devonian Field, Pavlovsk quarry
— Retusotriletes radiosus Rask.Belarus, Pripyat Depression, BH 3285, 71 m
— Archaeozonotriletes latemarginatus (Kedo) Obukh.Central Regions, Vjasma, 557 m

BCREDP 17 (1993) V.l. AVKHIMOVITCH, E.V. TCHIBRIKOVA, T.G. OBUKHOVSKAYA, A.M. NAZARENKO, V.T. UMNOVA,L.G. RASKATOVA, V.N. MANTSUROVA, S. LOBOZIAK AND M. STREEL.
- MIDDLE AND UPPER DEVONIAN MIOSPORE ZONATION - EASTERN EUROPE : Plate 10
115
■ji

116 VJ. AVKHIMOVITCH, E.V. TCHIBRIKOVA, T.G. OBUKHOVSKAYA, A.M. NAZARENKO, V.T. UMNOVA,L.G. RASKATOVA, V.N. MANTSUROVA, S. LOBOZIAK AND M. STREEL
BCREDP 17 (1993)
Contagisporites optivus - Spetaeotritetes krestovnikovii (OK) ZoneA. bucerus - A. variabilis insignis (Bl) Subzone
Fig. 1. —Spelaeotriletes krestovnikovii (Naumova) Obukh.Central Devonian Field, BFH 8151, 44 m
2, 3. — Archaeozonotriletes variabilis Naumova var. insignis Sennova2. Belarus, Mstislavskaja, 1, 146,5-148,5 m3. Central Devonian Field, BH 8151, 44 m
4. — Acanthotriletes eximius NaumovaCentral Devonian Field, BH 8231, 161,2 m
5. — Acanthotriletes bucerus Tchib.W. Bashkir, Bogorodskaja, 2, 2081-2084 m
6. — Archaeozonotriletes densus (McGregor) Arkh.Belarus, Pripyat Depression, N. Bobrovitschska, 1, 3729 m
7. — Chelinospora concinna AllenW. Bashkir, Right Bank Belaja river
8, 9. — Converrucosisporites curvatus (Naumova) Turnau8. Central Devonian Field, BH 8207, 157 m9. Belarus, Pripyat Depression, Turovskaja, 121, 266 m
10. — Archaeozonotriletes timanicus NaumovaCentral Devonian Field, BH 8207, 157 m
11. — Geminospora notata (Naumova) Obukh.Belarus, Mstislavskaja, 1, 146,5-148,5 m
12. — Verrucosisporites (?) concessus (Naumova) Obukh.Belarus, Mstislavskaja, 1, 146,5-148,5 m
13. — Archaeoperisaccus verrucosus Paschk.Central Devonian Field, BH 8225, 178,5 m
14. — Apiculatisporites dentatus (Naumova) Obukh.Belarus, Mstislavskaja, 1, 158-164 m
15. — Ancyrospora melvillensis OwensTiman-Pechora Province, Pyzhama river, outcrop 45/09, layer 27
16. — Densosporites sorokinii Obukh.Timan-Pechora Province, Pyzhama river, outcrop 45/09, layer 27

BCREDP 17 (1993) V.l. AVKHIMOVITCH, E.V. TCHIBRIKOVA, T.G. OBUKHOVSKAYA, A.M. NAZARENKO, VT. UMNOVA,L.G. RASKATOVA, V.N. MANTSUROVA, S. LOBOZIAK AND M. STREEL.
- MIDDLE AND UPPER DEVONIAN MIOSPORE ZONATION - EASTERN EUROPE: Plate 11
117

118 V.l. AVKHIMOVITCH, E.V. TCHIBRIKOVA, T.G. OBUKHOVSKAYA, A.M. NAZARENKO, V.T. UMNOVA,L.G. RASKATOVA, V.N. MANTSUROVA, S. LOBOZIAK AND M. STREEL
BCREDP 17 (1993)
Geminospora semilucensa - Perotrilites donensis (SD) Zone
Fig, 1. —Geminospora semilucensa (Naumova) Obukh. & M. Rask.Central Devonian Field, Kosii ovrag, outcrop, layer 1
2. — Perotrilites donensis (Rask.) M. Rask.Central Devonian Field, Kosii ovrag, outcrop, layer 5
3. — Geminospora au ri ta Arkh.Central Devonian Field, Kosii ovrag, outcrop, layer 5
4. — Archaeozonotriletes timanicus NaumovaVolga Basin near Volgograd, Choperskaja, 966, 835-841 m
5. — Geminospora rugosa (Naumova) Obukh.Belarus, Chotimskaja, 1, 140-145 m
6. — Verruciretusispora domanica (Naumova) Obukh.Timan-Pechora Province, Domanik river outcrop
7. — Cristatisporites trivialis (Naumova) Obukh.Volga Basin near Volgograd, Bolshovskaja, 5008, 1435-1439 m
8. — Camarozonotriletes obtusus NaumovaCentral Devonian Field, Kosii ovrag, outcrop, layer 1
9. — Ancyrospora laciniosa (Naumova) MantsurovaVolga Basin near Volgograd, Tersinskaja, 161, 1396-1400 m
10. — Ancyrospora fidus (Naumova) Obukh.Volga Basin near Volgograd, Orlovskaja, 23, 1440-1442 m
11. — Archaeozonotriletes variabilis NaumovaVolga Basin near Volgograd, Choperskaja, 966, 827-829 m
12. — Spelaeotriletes krestovnikovii (Naumova) Obukh.Central Devonian Field, Rudkino outcrop, layer 1

BCREDP 17 (1993) V.l. AVKHIMOVITCH, E.V. TCHIBRIKOVA, T.G. OBUKHOVSKAYA, A.M. NAZARENKO, V.T. UMNOVA,L.G. RASKATOVA, V.N. MANTSUROVA, S. LOBOZIAK AND M. STREEL.
- MIDDLE AND UPPER DEVONIAN MIOSPORE ZONATION - EASTERN EUROPE : Plate 12
119

120 V.l. AVKHIMOVITCH, E.V. TCHIBRIKOVA, T.G. OBUKHOVSKAYA, A.M. NAZARENKO, V.T. UMNOVA,L.G. RASKATOVA, V.N. MANTSUROVA, S. LOBOZIAK AND M. STREEL
BCREDP 17 (1993)
PLATE
Archaeoperisaccus ovatis - Verrucosisporites grumosus (OG) ZoneS. bellus (SB) Subzone
Fig. 1. —Archaeoperisaccus ovalis NaumovaCentral Devonian Field, Kosii ovrag, outcrop, layer 9
2. — Archaeoperisaccus concinnus NaumovaCentral Devonian Field, Kosii ovrag, outcrop, layer 9
3. — Spelaeotriletes bellus (Naumova) Obukh.Timan-Pechora Province, outcrop Tschut river 45/90
4. — Geminospora aurita Arkh.Timan-Pechora Province, outcrop Tschut river 45/90
5. — Archaeoperisaccus menneri NaumovaTiman-Pechora Province, Pizhma river, outcrop 45/17
6. — Spelaeotriletes krestovnikovii (Naumova) Obukh.Timan-Pechora Province, Pizhma river, outcrop 45/17
7. — Spelaeotriletes instabilis (Rask.) Obukh. & M, Rask.Timan-Pechora Province, Pizhma river, outcrop 45/17
8. — Hymenozonothletes argutus NaumovaTiman-Pechora Province, Pizhma river, outcrop 45/17
9. — Geminospora semilucensa (Naumova) Obukh, & M. Rask.Central Devonian Field, Kosii ovrag, outcrop layer 9
10. — Verruciretusispora pallida OwensTiman-Pechora Province, Pizhma river, outcrop 45/17
11. — Verruciretusispora lucensa (Naumova) Obukh.Central Devonian Field, Kosii ovrag, outcrop layer 9
12. — Spelaeotriletes domanicus (Naumova) Obukh.Timan-Pechora Province, outcrop Tschut river, 45/90
13. — Hymenozonotriletes ? inaequalis Philimonova & coil.Volga Basin near Volgograd, Choperskaja, 966, 835-841 m

BCREDP 17 (1993) V.l. AVKHIMOVITCH, E.V. TCHIBRIKOVA, T.G. OBUKHOVSKAYA, A.M. NAZARENKO, V.T. UMNOVA,L.G. RASKATOVA, V.N. MANTSUROVA, S, LOBOZIAK AND M. STREEL
- MIDDLE AND UPPER DEVONIAN MIOSPORE ZONATION - EASTERN EUROPE : Plate 13
121

122 V.l. AVKHIMOVITCH, E.V. TCHIBRIKOVA, T.G. OBUKHOVSKAYA, A.M. NAZARENKO, V.T. UMNOVA, BCREDP 1L.G, RASKATOVA, V.N. MANTSUROVA, S. LOBOZIAK AND M. STREEL
Fig. 1.
2.
3.
4.
5.
6, 9.
7.
8.
10.
11.
12.
13, 15.
14.
16.
17.
18.
19.
PLATE
Archaeoperisaccus ovalis - Verrucosisporites grumosus (OG) ZoneM. radiatus (MR) Subzone
— Archaeoperisaccus concinnus Naumova Central Devonian Field, Petino outcrop
— Archaeoperisaccus mirus Naumova Timan-Pechora Province, Uchta river outcrop
— Archaeoperisaccus menneri Naumova
Belarus, Pripyat Depression, Elskaja, 22, 3530 m— Archaeoperisaccus mirandus Naumova
Timan-Pechora Province, Uchta river outcrop— Archaeoperisaccus echinatus Rask.
Central Devonian Field, Petino outcrop— Cymbosporites vetlasjanicus Medianik & Obukh.
6. Timan-Pechora Province, Uchta river outcrop9. W. Bashkir, Salmyschskaja, 619, 3219-3223 m
— Cristatisporites trivialis (Naumova) Obukh.Belarus, Pripyat Depression, Vyschemirovskaja, 3, 3122-3126 m
— Bascaudaspora dobridia Arkh.Timan-Pechora Province, Uchta river outcrop
— Geminospora rugosa (Naumova) Obukh.Central Devonian Field, Petino outcrop
— Cyrtospora expleta Arkh.Timan-Pechora Province, Uchta river outcrop
— Grandispora famenensis (Naumova) Streel var. gracilis Kedo Belarus, Pripyat Depression, Elskaja, 22, 3515-3530 m
— Convolutispora crassitunicata (Obukh.) Obukh.13. Central Devonian Field, Petino outcrop15. Belarus, Pripyat Depression, Vyschemirovskaja, 3, 3122-3126 m
— Geminospora notata (Naumova) Obukh.Central Devonian Field, Semiluki outcrop
— Verruciretusispora pallida Owens Timan-Pechora Province, Uchta river outcrop
— Lophozonotriletes torosus Naumova Central Devonian Field, Petino outcrop
— Convolutispora subtilis OwensBelarus, Pripyat Depression, Elskaja, 22, 3532 m
— Auroraspora speciosa (Naumova) Obukh. var. ornatus Nazarenko Dnieper-Donetsk Depression, Sorokoschichi Repki, 654, 1542-1545 m
7 (1993)

BCREDP 17 (1993) V.l. AVKHIMOVITCH, E.V. TCHIBRIKOVA, T.G. OBUKHOVSKAYA, A.M. NAZARENKO, V.T. UMNOVA, 123L.G. RASKATOVA, V.N. MANTSUROVA, S. LOBOZIAK AND M. STREEL.
- MIDDLE AND UPPER DEVONIAN MIOSPORE ZONATION - EASTERN EUROPE : Plate 14

124 V.l. AVKHIMOVITCH, E.V. TCHIBRIKOVA, T.G. OBUKHOVSKAYA, A.M. NAZARENKO, V.T. UMNOVA,L.G, RASKATOVA, V.N. MANTSUROVA, S. LOBOZIAK AND M. STREEL
BCREDP 17 (1993)
Archaeoperisaccus ovalis - Verrucosisporites grumosus (OG) ZoneM. radiatus (MR) Subzone
Fig. 1. —Membrabaculisporis radiatus (Naumova) Arkh,Timan-Pechora Province, Izhma river outcrop, Verchovskaja village
2. — Diducites radiatus (Kedo) Obukh.Belarus, Pripyat Depression, Strelitchevskaja, 4, 1642 m
3. — Archaeoperisaccus echinatus Rask.Timan-Pechora Province, Belhopskaja, 15, 203-207 m
4, 7. — Kedoesporis imperfectus (Naumova) Obukh.Belarus, Pripyat Depression, Mstislavskaja, 1, 76-78 m
5. — Archaeoperisaccus mirus NaumovaTiman-Pechora Province, Izhma river outcrop, Verchovskaja village
6, 8. — Archaeoperisaccus concinnus Naumova6. Pripyat Depression, Strelitchevskaja, 4, 1642 m 8. Timan-Pechora Province, Izhma river outcrop, Verchovskaja village
9. — Kedoesporis evianensis (Naumova) Obukh.Belarus, Pripyat Depression, Strelitchevskaja, 4, 1642 m
10. — Lophozonotriletes tylophorus NaumovaBelarus, Pripyat Depression, Elskaja, 22, 3505 m
11. — Verrucosisporites grumosus (Naumova) Obukh.Timan-Pechora Province, Izhma river outcrop, Verchovskaja village
12. — Bulbosisporites bulbosus (Obukh.) Obukh.Belarus, Pripyat Depression, W. Bobrovitchi, 1, 3657 m
13. — Geminospora rugosa (Naumova) Obukh.Belarus, Pripyat Depression, Elskaja, 22, 3515 m
14. — Ancyrospora voronensis (Arkh.) Arkh.Timan-Pechora Province, Vezhavosh river outcrop

BCREDP 17 (1993) V.l. AVKHIMOVITCH, E.V. TCHIBRIKOVA, T.G. OBUKHOVSKAYA, A.M. NAZARENKO, V.T. UMNOVA,L.G. RASKATOVA, V.N. MANTSUROVA, S. LOBOZIAK AND M. STREEL.
- MIDDLE AND UPPER DEVONIAN MIOSPORE ZONATION - EASTERN EUROPE : Plate 15
125

126 V.l. AVKHIMOVITCH, E.V. TCHIBRIKOVA, T.G. OBUKHOVSKAYA, A.M. NAZARENKO, V.T. UMNOVA, BCREDP 1L.G. RASKATOVA, V.N. MANTSUROVA, S, LOBOZIAK AND M, STREEL
Cristatisporites deliquescens - Verrucosisporites evlanensis (DE) ZoneA. speciosa (AS) Subzone
Fig. 1. — Verrucosisporites evlanensis (Naumova) Obukh.Central Devonian Field, Kon-Kolodez village outcrop
2, 5. — Cristatisporites deliquescens (Naumova) Arkh.2. Central Devonian Field, Zadonsk town outcrop5. Volga Basin near Volgograd, Choperskaja, 948, 849,9-851,9m
3, 4. — Cymbosporites acanthaceus (Kedo) Obukh.3. Belarus, Pripyat Depression, Grebenevskaja, 1, 4774,2-4779,3 m4. Timan-Pechora Province, Belhopskaja, 4, 117-124 m
6. — Stenozonotriletes conformis NaumovaBelarus, Pripyat Depression, Grebenevskaja, 1, 4889,1-4897,4 m
7. — Membrabaculisporis radiatus (Naumova) Arkh.Volga Basin near Volgograd, Choperskaja, 948, 849,9-851,9 m
8. — Verruciretusispora sp. ABelarus, Pripyat Depression, Radomlja, 16, 1967-1702 m
9. — Kedoesporis evlanensis (Naumova) Obukh.Central Devonian Field, Kon-Kolodez village outcrop
10. — Diaphanospora rugosa (Naumova) ByvschevaBelarus, Pripyat Depression, Radomlja, 16, 1697-1702 m
11. — Kedoesporis imperfectus (Naumova) Obukh.Belarus, Pripyat Depression, Grebenevskaja, 1, 4889,1-4897,4 m
12. — Auroraspora speciosa (Naumova) Obukh.Timan-Pechora Province, Belhopskaja, 4, 117-124 m
13. — Diducites radiatus (Kedo) Obukh.Belarus, Pripyat Depression, Turovskaja, 121, 266 m
7 (1993)

BCREDP 17 (1993) V.l. AVKHIMOVITCH, E.V. TCHIBRIKOVA, T.G. OBUKHOVSKAYA, A.M. NAZARENKO, V.T, UMNOVA,L.G. RASKATOVA, V.N. MANTSUROVA, S, LOBOZIAK AND M. STREEL.
- MIDDLE AND UPPER DEVONIAN MIOSPORE ZONATION - EASTERN EUROPE : Plate 16
127

128 V.l. AVKHIMOVITCH, E.V. TCHIBRIKOVA, T.G. OBUKHOVSKAYA, A.M. NAZARENKO, V.T. UMNOVA,L.G. RASKATOVA, V.N. MANTSUROVA, S. LOBOZIAK AND M. STREEL
BCREDP 17 (1993)
Fig.
PLATE
Cristatisporites deliquescens - Verrucosisporites evlanensis (DE) ZoneG. subsuta (GS) Subzone
I, 2. —Grandispora subsuta (Nazarenko) Obukh.1. Volga Basin near Volgograd, Mirnaja, 1, 3880-3887 m2. Belarus, Pripyat Depression, Petrikovskaja, 469, 962-968 m
3. — Spelaeotriletes hopericus (Nazarenko) Obukh.Volga Basin near Volgograd, Choperskaja, 945, 580-584 m
4. — Verrucosisporites grumosus (Naumova) Obukh.Timan-Pechora Province, Belhopskaja, 4, 64-70 m
5. — Cheünospora lepidus (Obukh.) Obukh,Belarus, Pripyat Depression, Kasimirovskaja, 1, 2622, 8-2654, m
6. — Diducites mucronatus (Kedo) Van VeenBelarus, Pripyat Depression, Lelchitskaja, 1, 1810 m
7. — Kedoesporis evlanensis (Naumova) Obukh.Central Devonian Field, Kon-Kolodez village outcrop
8. — Cymbosporites eximius (Obukh.) Obukh.Belarus, Pripyat Depression, Lelchitskaja, 1, 1810 m
9. — Spelaeotriletes microgranosus (Kedo) Obukh.Belarus, Pripyat Depression, Kasimirovskaja, 1, 2662,8-2645 m
10. — Stenozonotriletes extensus NaumovaCentral Devonian Field, Kon-Kolodez village outcrop
II. — Auroraspora speciosa (Naumova) Obukh.Timan-Pechora Province, Belhopskaja, 4, 67-70 m
12. — Cymbosporites boafeticus (Tchib.) Obukh.Latvija, Dobele, 18, 122 m
13. — Cristatisporites deliquescens (Naumova) Arkh.Belarus, Pripyat Depression, W. Kamenskaja, 1, 3335 m

BCREDP 17 (1993) VI. AVKHIMOVITCH, E.V. TCHIBRIKOVA, T.G. OBUKHOVSKAYA. A.M. NAZARENKO, V.T. UMNOVA, 129L.G. RASKATOVA, V.N. MANTSUROVA, S. LOBOZIAK AND M. STREEL.
- MIDDLE AND UPPER DEVONIAN MIOSPORE ZONATION - EASTERN EUROPE: Plate 17

130 V.l. AVKHIMOVITCH, E.V. TCHIBRIKOVA, T.G. OBUKHOVSKAYA, A.M. NAZARENKO, V.T, UMNOVA,L.G. RASKATOVA, V.N. MANTSUROVA, S. LOBOZIAK AND M. STREEL
BCREDP 17 (1993)
Fig. 1-3.
4, 5.
6.
7.
8.
9, 10.
11.
12.
13.
14.
15.
16, 17.
PLATE
Corbulispora vimineus - Geminospora vasjamica (VV) Zone
— Corbulispora vimineus (Nekr.) Obukh. & Nekr.1. Pripyat Depression, Vyshemirovskaja, 11, 2065-2075 m2. Volga Basin near Volgograd, Romanovskaja, 23, 3480-3487 m3. Timan-Pechora Province, Belgopskaja, 4, 33-36 m
— Geminospora vasjamica (Tchib.) Obukh. & Nekr.4. Timan-Pechora Province, BH VIS, 909, 1689-1694 m5. W. slope Southern Ural, Vasjamskaja, 8, 122-123 m
— Corbulispora semireticulata (Tchib.) Tchib.W. slope Southern Ural, Kuruil river, Pokrovskoye village
— Lophozonotriletes furssenkoi Nekr.Pripyat Depression, Petrikov, 469, 929-935 m
— Lophotriletes multiformis Tchib.W. Bashkir, Alkinskaja, 2, 2192-2196 m
— Geminospora notata (Naumova) Obukh. var. microspinosus Tchib.9. Volga Basin near Volgograd, Krasnojarskaja, 44, 2304-2308 m10. Timan-Pechora Province, Belgopskaja, 4, 33-36 m
— Converrucosisporites curvatus (Naumova) Turnau var. médius Kedo Volga Basin near Volgograd, Osinovskaja, 2, 2648-2653 m
— Converrucosisporites curvatus (Naumova) Turnau Timan-Pechora Province, Tebukskaja, 881, 1645-1651 m
— Cymbosporites boafeticus (Tchib.) Obukh.Volga Basin near Volgograd, Korobkovskaja, 69, 2633-2638 m
— Pustulatisporites pullus (Naumova) Obukh.Volga Basin near Volgograd, Osinovskaja, 2, 2648-2653 m
— Verrucosisporites evlanensis (Naumova) Obukh.Pripyat Depression, W. Bobrovitchi, 4, 2621-2634 m
— Cristatisporites imperpetuus (Sennova) Obukh.16. Timan-Pechora Province, Volsko-Vymskaja, Uhta river, 750/217. Izhma river, near Sosnogorsk, 50/30

BCREDP 17 (1993) V.l. AVKHIMOVITCH, E.V. TCHIBRIKOVA, T.G. OBUKHOVSKAYA, A.M. NAZARENKO, V.T. UMNOVA,L.G. RASKATOVA, V.N. MANTSUROVA, S. LOBOZIAK AND M. STREEL.
- MIDDLE AND UPPER DEVONIAN MIOSPORE ZONATION - EASTERN EUROPE : Plate 18
131

132 V.l. AVKHIMOVITCH, E.V. TCHIBRIKOVA, T.G. OBUKHOVSKAYA, A.M. NAZARENKO, V.T, UMNOVA,L.G. RASKATOVA, V.N, MANTSUROVA, S. LOBOZIAK AND M. STREEL
BCREDP 17 (1993)
Fig. 1,2.
3, 4.
5.
6, 7.
8.
9.
10.
11.
12.
13.
14.
15.
16.
17.
PLATE
Cyrtospora cristifer - Diaphanospora zadonica (CZ) ZoneG. notata microspinosus (GM) Subzone
—Cyrtospora cristifer (Luber) Van Der Zwan1. Pripyat Depression, W. Bobrovitchi, 4, 2604-2610 m2. Volga Basin near Volgograd, Kotovskaya, 19
— Geminospora notata (Naumova) Obukh. var. microspinosus Tchib. Pripyat Depression, W. Sophievskaja, 1, 2512 m
— Geminospora vasjamica (Tchib.) Obukh. & Nekr.Pripyat Depression, W. Bobrovitchi, 4, 2545-2580 m
— Converrucosisporites curvatus (Naumova) TurnauVolga Basin near Volgograd, Kotovskaja, 19, 2582-2588 m
— Converrucosisporites curvatus (Naumova) Turnau var. médius Kedo Pripyat Depression, W. Bobrovitchi, 4, 2577 m
— Pustulatisporites famenensis (Naumova) Obukh.Pripyat Depression, W. Bobrovitchi, 4, 2545-2580 m
— Diaphanospora macrovarius (Nazarenko) Nekr. & Avkh.Volga Basin near Volgograd, Kotovskaja, 19, 2582-2588 m
— Auroraspora limpida (Naumova) Avkh.Pripyat Depression, Chobno, 1, 2873 m
— Cymbosporites boafeticus (Tchib.) Obukh.Volga Basin near Volgograd, Kotovskaja, 19, 2582-2588 m
— Dictyotriletes famenensis NaumovaPripyat Depression, W. Sophievskaja, 1, 2512 m
— Retusotriletes communis Naumova Pripyat Depression, Chobno, 1, 2866 m
— Punctatisporites famenensis (Naumova) Obukh.Timan-Pechora Province, Belgopskaja, 4, 26-27 m
— Corbulispora vimineus (Nekr.) Obukh. & Nekr.Pripyat Depression, W. Bobrovitchi, 4, 2547-2550 m
— Hystricosporites pleiomorphus (Kedo) Obukh.Pripyat Depression, Chobno, 1, 2888 m

BCREDP 17 (1993) V.l. AVKHIMOVITCH, E.V. TCHIBRIKOVA, T.G. OBUKHOVSKAYA, A.M. NAZARENKO, V.T. UMNOVA,L.G. RASKATOVA, V.N. MANTSUROVA, S. LOBOZIAK AND M. STREEL.
- MIDDLE AND UPPER DEVONIAN MIOSPORE ZONATION - EASTERN EUROPE : Plate 19
133

134 V.l. AVKHIMOVITCH, E.V. TCHIBRIKOVA, T.G. OBUKHOVSKAYA, A.M. NAZARENKO, V.T. UMNOVA,L.G. RASKATOVA, V.N. MANTSUROVA, S, LOBOZIAK AND M, STREEL
BCREDP 17 (1993)
Fig. 1.
2.
3.
4.
5.
6.
7.
8.
9.
10.
11.
12.
13.
PLATE
Cyrtospora cristifer - Diaphanospora zadonica (CZ) ZoneC. zadonica (Za) Subzone
— Cyrtospora cristifer (Luber) Van Der ZwanPripyat Depression, W. Bobrovitchi, 4, 2604-2610 m
— Convolutispora zadonica (Nekr.) Obukh. & Nekr.Pripyat Depression, Malodushinskaja, 1, 1450-1456 m
— Diaphanospora zadonica (Naumova) Avkh.Volga Basin near Volgograd, Jarskaja, 1, 2470-2476 m
— Geminospora notata (Naumova) Obukh. var. microspinosus Tchib. Pripyat Depression, W. Bobrovitchi, 4, 2545-2580 m
— Kedoesporis angulosus (Naumova) Obukh.Central Devonian Field, Dobrynka, 690
— Converrucosisporites curvatus (Naumova) Turnau Central Devonian Field, Dobrynka, 690
— Retusotriletes pychovi NaumovaVolga Basin near Volgograd, Jarskaja, 1, 2470-2476 m
— Diaphanospora macrovarius (Nazarenko) Nekr.Pripyat Depression, Turov, 120, 345 m
— Diducites radiatus (Kedo) Obukh.Pripyat Depression, Petrikov, 5, 1401-1418 m
— Diducites vishenensis Obukh. & Avkh.Pripyat Depression, Velikopolskaja, 1
— Stenozonotriletes definitus NaumovaVolga Basin near Volgograd, Jarskaja, 1, 2470-2476 m
— Stenozonotriletes conformis Naumova Pripyat Depression, Turov, 120, 345 m
— Hystricosporites hamulus (Naumova) Nekr.Pripyat Depression, Chobno, 1, 2784 m

BCREDP 17 (1993) V.l. AVKHIMOVITCH, E.V. TCHIBRIKOVA, T.G. OBUKHOVSKAYA, A.M. NAZARENKO, V.T. UMNOVA, 135L.G. RASKATOVA, V.N, MANTSUROVA, S. LOBOZIAK AND M, STREEL.
- MIDDLE AND UPPER DEVONIAN MIOSPORE ZONATION - EASTERN EUROPE : Plate 20

136 V.l. AVKHIMOVITCH, E.V. TCHIBRIKOVA, T.G. OBUKHOVSKAYA, A.M. NAZARENKO, V.T. UMNOVA,L.G. RASKATOVA, V.N. MANTSUROVA, S. LOBOZIAK AND M. STREEL
BCREDP 17 (1993)
PLATE
Lagenoisporites immensus (Im) Zone
Fig. 1. —Lagenoisporites immensus (Nazarenko & Nekr.) Avkh, & Turnau Pripyat Depression, Chobno, 1, 2793 m
2. — Lophozonotriletes lebedianensis NaumovaPripyat Depression, Chobno, 1, 2728 m
3. — Diducites commutatus (Naumova) Avkh.Pripyat Depression, Chobno, 1, 2716 m
4. — Spelaeotriletes papulosus (Sennova) Avkh.Volga Basin near Volgograd, Orlovskaja, 22, 1216-1222 m
5. — Convolutispora cancellothyris (Waltz) Avkh. & Nekr.Pripyat Depression, Chobno, 1, 2740 m
6. — Stenozonotriletes laevigatus NaumovaVolga Basin near Volgograd, Orlovskaja, 22, 1216-1222 m
7. — Converrucosisporites curvatus (Naumova) TurnauPripyat Depression, Turov, 121, 2178 m
8. — Diducites compactus (Nekr.) Nekr.Pripyat Depression, Turov, 121, 127,5 m
9. — Auroraspora varia (Naumova) AhmedPripyat Depression, Turov, 121, 168,2 m
10. — Knoxisporites dedaleus (Naumova) Moreau-BenoitPripyat Depression, Chobno, 1, 2709 m
11. — Ancyrospora oriovica (Nazarenko & Nekr.) Avkh. & Nekr.Pripyat Depression, Shestovitchy, 18, 362 m
12. — Cyrtospora cristifer (Luber) Van Der ZwanPripyat Depression, Shestovitchy, 18, 362 m
13. — Bulbosisporites volgogradicus (Nazarenko & Tchib.) Obukh.Pripyat Depression, Turov, 121, 333 m

BCREDP 17 (1993) V.l. AVKHIMOVITCH, E.V. TCHIBRIKOVA, T.G. OBUKHOVSKAYA, A.M. NAZARENKO, V.T. UMNOVA,L.G. RASKATOVA, V.N. MANTSUROVA, S. LOBOZIAK AND M. STREEL,
- MIDDLE AND UPPER DEVONIAN MIOSPORE ZONATION - EASTERN EUROPE : Plate 21
137

138 V.l. AVKHIMOVITCH, E.V. TCHIBRIKOVA, T.G. OBUKHOVSKAYA, A.M. NAZARENKO, V.T. UMNOVA,L.G. RASKATOVA, V.N. MANTSUROVA, S. LOBOZIAK AND M, STREEL
BCREDP 17 (1993)
PLATE
Cornispora varicornata (CVa) ZoneG. famenensis minutus (GF) Subzone
Fig. 1. —Cornispora monocornata NazarenkoVolga Basin near Volgograd, Grishin, 1, 1196-1220 m
2. — Cornispora bicornata NazarenkoPripyat Depression, Shestovitchy, 18, 362 m
3, 4. — Grandispora famenensis (Naumova) Streel var. minutus Nekr.3 Pripyat Depression, Shestovitchy, 18, 362 m4 Pripyat Depression, Turov, 121, 110,3 m
5. — Cristatisporites lupinovitchi (Avkh.) Avkh.Pripyat Depression, Turov, 121, 110,3 m
6. — Grandispora aspersus (Avkh.) Avkh.Pripyat Depression, Petricov, 269, 771-773 m
7, 8. — Spelaeotriletes papulosus (Sennova) Avkh.Timan-Pechora Province, Veiikovisochnaja, 55, 1201 m
9. — Lophozonotriletes lebedianensis Naumova
Pripyat Depression, Chobno, 1, 2709-2711 m10. — Diducites compactus (Nekr.) Nekr.
Pripyat Depression, Turov, 115, 105 m11. — Diducites mucronatus (Kedo) Van Veen
Pripyat Depression, Turov, 121, 110,3 m12. — Lagenoisporites immensus (Nazarenko & Nekr.) Avkh. & Turnau
Pripyat Depression, Strelitchev, 1, 940-944 m13. — Knoxisporites dedaieus (Naumova) Moreau-Benoit
Pripyat Depression, Zhitkovitchy, 2, 390 m14. — Auroraspora macra Sullivan
Pripyat Depression, Shestovitchy, 18, 355-362 m15. — Bulbosisporites volgogradicus (Nazarenko & Tchib.) Obukh.
Pripyat Depression, Tulgovitchy, 2, 1175-1180 m

BCREDP 17 (1993) V.l. AVKHIMOVITCH, E.V. TCHIBRIKOVA, T.G. OBUKHOVSKAYA, A.M. NAZARENKO, V.T. UMNOVA, 139L.G. RASKATOVA, V.N. MANTSUROVA, S. LOBOZIAK AND M. STREEL.
- MIDDLE AND UPPER DEVONIAN MIOSPORE ZONATION - EASTERN EUROPE : Plate 22

140 V.l. AVKHIMOVITCH, E.V. TCHIBRIKOVA, T.G. OBUKHOVSKAYA, A.M. NAZARENKO, V.T. UMNOVA,L.G. RASKATOVA, V.N, MANTSUROVA, S. LOBOZIAK AND M. STREEL
BCREDP 17 (1993)
PLATE
Cornispora varicornata (CVa) ZoneC. bicornata (CB) Subzone
Fig. 1. —Cornispora monocornata NazarenkoPripyat Depression, Shestovitchy, 4, 2461,35-2467,45 m
2. — Cornispora bicornata NazarenkoVolga Basin near Volgograd, Grishkin-Sviridov, 1, 1196-1203 m
3, 4. — Cornispora tricornata NazarenkoVolga Basin near Volgograd, Grishkin-Sviridov, 1, 1196-1203 m
5. — Grandispora famenensis (Naumova) Streel var. minutus Nekr.Pripyat Depression, Starobin, 239, 537-540 m
6. — Lophozonotriletes lebedianensis NaumovaPripyat Depression, Strelitchev, 1, 940-944 m
7. — Cristatisporites lupinovitchi (Avkh.) Avkh.Pripyat Depression, Turov, 121, 60,2 m
8. — Diducites compactus (Nekr.) Nekr.Pripyat Depression, Turov, 121, 60,2 m
9. — Diducites poljessicus (Kedo) Van VeenPripyat Depression, Turov, 115, 105 m
10. — Knoxisporites dedaleus (Naumova) Moreau-BenoitPripyat Depression, Zhitkovitchy, 2, 390 m
11. — Retusotriletes communis NaumovaPripyat Depression, Chobno, 1, 2771-2775 m
12. — Diaphanospora rugosa (Naumova) ByvschevaPripyat Depression, Turov, 121, 60,2 m
13. — Convolutispora cancellothyris (Waltz) Avkh. & Nekr.Pripyat Depression, Turov, 121, 127,5 m
14. — Kedoesporis rugilobus (Naumova) Obukh. & Avkh.Pripyat Depression, Turov, 120, 345 m
15. — Stenozonotriletes conformis NaumovaPripyat Depression, Sharpilovskaja, 1, 920 m

BCREDP 17 (1993) V.l. AVKHIMOVITCH, E.V. TCHIBRIKOVA, T.G. OBUKHOVSKAYA, A.M. NAZARENKO, V.T. UMNOVA, 141L.G. RASKATOVA, V.N, MANTSUROVA, S. LOBOZIAK AND M. STREEL,
- MIDDLE AND UPPER DEVONIAN MIOSPORE ZONATION - EASTERN EUROPE : Plate 23

142 V.l. AVKHIMOVITCH, E.V. TCHIBRIKOVA, T.G. OBUKHOVSKAYA, A.M. NAZARENKO, V.T. UMNOVA, BCREDP 1L.G. RASKATOVA, V.N, MANTSUROVA, S. LOBOZIAK AND M. STREEL
Fig. 1,2. —
3. —
4. —
5. —
6. —
7. —
8. —
9. —
10. —
11. —
12. —
13. —
Cornispora varicornata (CVa) ZoneC. lupinovitchi (CL) Subzone
Cristatisporites lupinovitchi (Avkh.) Avkh.
Pripyat Depression, Turov, 121, 60,2 mSpelaeotriletes papulosus (Sennova) Avkh.
Timan-Pechora Province, Veiikovisochnaja, 55, 1201 mDiducites poijessicus (Kedo) Van Veen
Pripyat Depression, Turov, 115, 267 mHymenospora intertextus (Nekr. & Sergeeva) Avkh. & Loboziak
Pripyat Depression, Vyshemir, 1, 2204 mGrandispora famenensis (Naumova) Streel
Pripyat Depression, Turov, 115, 267 m Grandispora prodigialis (Kedo) Avkh.
Pripyat Depression, Starobin, 239, 771-773 m Cornispora monocornata Nazarenko
Pripyat Depression, Sharpiloskaja, 1, 1113 mCornispora bicornata Nazarenko
Pripyat Depression, Turov, 121, 60,2 mZonomonoletes vulgaris Kedo
Pripyat Depression, Turov, 121, 74,5 mAncyrospora oriovica (Nazarenko & Nekr.) Avkh. & Nekr.
Pripyat Depression, Tulgovitchy, 2, 1175,8-1180,2 mStenozonotriletes supragrandis Kedo
Pripyat Depression, Sharpilovskaja, 1, 847 mHystricosporites sp.Pripyat Depression, Petricov, 269, 637-641 m
7 (1993)

BCREDP 17 (1993) V.l. AVKHIMOVITCH, E.V. TCHIBRIKOVA, T.G, OBUKHOVSKAYA, A.M. NAZARENKO, V.T. UMNOVA, 143L G. RASKATOVA, V.N. MANTSUROVA, S, LOBOZIAK AND M. STREEL.
- MIDDLE AND UPPER DEVONIAN MIOSPORE ZONATION - EASTERN EUROPE : Plate 24

144 V.l. AVKHIMOVITCH, E.V. TCHIBRIKOVA, T.G. OBUKHOVSKAYA, A.M. NAZARENKO, V.T. UMNOVA,L.G. RASKATOVA, V.N. MANTSUROVA, S. LOBOZIAK AND M. STREEL
BCREDP 17 (1993)
PLATE
Diducites versabilis - Grandispora famenensis (VF) ZoneD. golubinicus (DG) Subzone
Fig. 1. —Diducites versabilis (Kedo) Van VeenPripyat Depression, Turov, 123, 230 m
2, 3. — Grandispora famenensis (Naumova) Streel2. Pripyat Depression, Turov, 115, 267 m3. Volga Basin near Volgograd, Orlinovskaja, 3, 1072-1079 m
4-6. — Discernisporites golubinicus (Nazarenko) Avkh.4. Volga Basin near Volgograd, Orlinovskaja, 3, 1072-1079 m5. Pripyat Depression, Starobin, 239, 367 m6. Pripyat Depression, Petricov, 269, 637 m
7. — Grandispora famenensis (Naumova) Streel var. minutus Nekr.Pripyat Depression, Petricov, 269, 666 m
8. — Grandispora gracilis (Kedo) StreelPripyat Depression, Petricov, 269, 637 m
9. — Diducites poljessicus (Kedo) Van VeenPripyat Depression, Turov, 115, 105 m
10. — Retispora lepidophyta (Kedo) Playford var. macroreticulata KedoPripyat Depression, Zhitkovitchy, 02, 110,7 m
11. — Diducites commutatus (Naumova) Avkh.Pripyat Depression, Turov, 115, 289 m
12. — Laevigatosporites ovalis KosankePripyat Depression, Turov, 115, 289 m

BCREDP 17 (1993) V.l. AVKHIMOVITCH, E.V. TCHIBRIKOVA, T,G. OBUKHOVSKAYA, A.M. NAZARENKO, V.T. UMNOVA,L.G. RASKATOVA, V.N. MANTSUROVA, S. LOBOZIAK AND M. STREEL
- MIDDLE AND UPPER DEVONIAN MIOSPORE ZONATION - EASTERN EUROPE : Plate 25
145

146 V.l. AVKHIMOVITCH, E.V. TCHIBRIKOVA, T.G. OBUKHOVSKAYA, A.M. NAZARENKO, V.T, UMNOVA,L.G. RASKATOVA, V.N. MANTSUROVA, S. LOBOZIAK AND M. STREEL
BCREDP 17 (1993)
PLATE
Diducites versabilis - Grandispora famenensis (VF) ZoneS. papulosus (SP) Subzone
Fig. 1. — Diducites versabilis (Kedo) Van VeenPripyat Depression, Kn. Bor, 76, 238,9-243,8 m
2. — Spelaeotriletes papulosus (Sennova) Avkh.Timan-Pechora Province, Velikovisochnaja, 55, 1201 m
3. — Grandispora distinctus (Naumova) Avkh.Pripyat Depression, Starobin, 239, 239 m
4. — Endoculeospora setacea (Kedo) Avkh. & Higgs
Pripyat Depression, Turov, 123, 177 m5. — Knoxisporites dedaleus (Naumova) Moreau-Benoit
Pripyat Depression, Lelchitsy, 345, 608 m6. — Grandispora facilis (Kedo)
Pripyat Depression, Starobin, 239, 290 m7. — Grandispora lupata Turnau
Pripyat Depression, Svetiogorsk, 625, 659 m8. — Discernisporites golubinicus (Nazarenko) Avkh.
Pripyat Depression, Starobin, 269, 764 m9. — Auroraspora varia (Naumova) Ahmed
Pripyat Depression, Sharpilovskaja, 1, 963 m10. — Convolutispora usitata Playford
Pripyat Depression, Turov, 123, 175,8 m11. — Grandispora famenensis (Naumova) Streel
Pripyat Depression, Petricov, 269, 637-641 m12. — Endosporites delectabilis (Nazarenko) Mantsurova
Volga Basin near Volgograd, Zimovsk, 15, 1443-1450 m13. — Cyrtospora cristifer (Luber) Van Der Zwan
Pripyat Depression, Turov, 123, 170 m14. — Lophozonotriletes proscurrus Kedo
Pripyat Depression, Starobin, 756, 270 m

/Sdv
BCREDP 17 (1993) V.l. AVKHIMOVITCH, E.V. TCHIBRIKOVA, T.G. OBUKHOVSKAYA, A.M. NAZARENKO, V.T. UMNOVA,L.G. RASKATOVA, V.N, MANTSUROVA, S. LOBOZIAK AND M. STREEL,
- MIDDLE AND UPPER DEVONIAN MIOSPORE ZONATION - EASTERN EUROPE : Plate 26
147
'V ''S
w- • - ■ ■ ■ . . - ’■ V-*J

INTERPRÉTATION SÉQUENTIELLE PLURIDISCIPLINAIRE DU TITHONIQUE SUPÉRIEUR ET DU BERRIASIEN DU SUD-EST DE LA FRANCE
A MULTIDISCIPLINARY SEQUENCE-STRATIGRAPHIC INTERPRETATION OF THE UPPER TITHONIAN AND BERR!ASIAN IN SOUTH-EAST FRANCE
Jean-François RAYNAUD
Les stratotypes et hypostratotypes du sud-est de la France attirent depuis longtemps les géologues pétroliers, et en particulier les biostratigraphes. Ils trouvent, dans le Crétacé inférieur de la Fosse Vocontienne en particulier, une des rares coupes types situées en domaine bassin, remarquable par sa richesse en macro et microfossiles, sa continuité et sa facilité d’accès.
Elf Aquitaine, dont les palynologues ont, dès 1976, échantillonné et analysé l’intervalle Berriasien- Barrémien, et qui mène un vaste programme de recherche sur la stratigraphie séquentielle, se trouvait à la meilleure place pour soutenir le projet multidisciplinaire de R. Jan du Chêne, à but à la fois synthétique et pédagogique.
Cette approche, unique à notre connaissance, démontre la part de chaque discipline dans la démarche de l’interprétation séquentielle. La mise en valeur des spécialistes explique l’esprit de coopération enthousiaste entre universitaires et pétroliers, dont les travaux sont menés avec intérêt et bienveillance par nos collègues de la Réserve Géologique de Haute-Provence.
The stratotypes and hypostratotypes in South-East France have been attracting petroleum geologists, especially biostratigraphers, for a long time. One of the few reference sections located in a basinal setting is to be found in the Lower Cretaceous of the Vocontian Trough. This section is noted for its richness in macro and microfossils, its continuity and the fact that it is easily accessible.
Elf Aquitaine, whose palynologists have been sampling and analyzing the Berriasian-Barremian interval since 1976 as well as carrying out an extensive study on the sequence stratigraphy, found itself in the best position to support R. Jan du Chêne's multidisciplinary project, the aim of which is both synthetic and educational.
This approach, which is only known to us, shows the part played by each discipline in the process of sequence-stratigraphic interpretation. The development of the special methods explains the enthusiastic cooperative spirit between academics and geologists, whose work was kindly led with interest by our colleagues from the Geological Reserve of Haute-Provence.
Jean-François Raynaud, Elf Aquitaine Production, Département Géologie Sédimentaire, CSTJF, F-64018 Pau cédex. - March 12, 1993.

SEQUENCE-STRATIGRAPHIC INTERPRETATION OF UPPER TITHONIAN- BERRIASIAN REFERENCE SECTIONS IN SOUTH-EAST FRANCE :A MULTIDISCIPLINARY APPROACH
INTERPRÉTATION SÉQUENTIELLE DE COUPES DE RÉFÉRENCE DU TITHONIQUE SUPÉRIEUR ET DU BÉRRIASIEN DU SUD-EST DE LA FRANCE : APPROCHE MULTIDISCIPLINAIRE
Roger JAN DU CHÊNE, Robert BUSNARDO, Jean CHAROLLAIS, Bernard CLAVEL, Jean-François DECONINCK, Laurent EMMANUEL, Silvia GARDIN, Georges GORIN, Hélène MANIVIT, Eric MONTEIL, Jean-François RAYNAUD, Maurice RENARD,Daniel STEFFEN, Norbert STEINHAUSER, André STRASSER, Christian STROHMENGER and Peter Robin VAIL
JAN DU CHÊNE, R., BUSNARDO, R., CHAROLLAIS, J., CLAVEL, B,, DECONINCK, J.-R, EMMANUEL, L, GARDIN, S., GORIN, G., MANIVIT, H., MONTEIL, E„ RAYNAUD, J,-F., RENARD, M., STEFFEN, D., STEINHAUSER, N., STRASSER, A., STROHMENGER, C. & VAIL, P.R. (1993). - Sequence-stratigraphic interpretation of Upper Tithonian-Berriasian reference sections in South-East France : a multidisciplinary approach [Interpretation séquentielle de coupes de référence du Tithonique supérieur et du Berriasien du sud-est de la France : approche multidisciplinaire]. - Bull. Centres Rech. Expior.-Prod. Elf Aquitaine, 17, 1, 151-181, 4 fig., 6 pi.; Boussens, June 24, 1993. - ISSN : 0396-2687. CODEN : BCREDP.Des observations de terrains (géométrie des bancs, succession et alternances
des couches marneuses et carbonatées) et l’analyse des faciès ont permis le découpage par la stratigraphie séquentielle de trois coupes de référence de l'intervalle Tithonique supérieur - Berriasien du domaine vocontien (SE France) : Broyon, Berrias (stratotype) et Angles. Une succession de dix séquences de dépôts de troisième ordre (sensu Vail) a été définie : trois dans le Tithonique supérieur (Ti 4 à Ti 6) et sept dans le Berriasien (Be 1 à Be 7).
Les séquences du Tithonique supérieur et de la base du Berriasien consistent principalement en un empilement de dépôts gravitaires de bas niveau marin et de prismes de bordure de plate-forme. Les séquences berriasiennes montrent des successions plus complètes avec prismes de bas niveau, transgressif et de haut niveau.
Ces séquences sont étalonnées précisément par la biostratigraphie, notamment par les échelles de Calpionelles et d’Ammonites. A Berrias, elles sont également intégrées aux données de la magnétostratigraphie.
Un échantillonnage cohérent a ensuite été effectué par des spécialistes d’autres disciplines (géochimie, minéralogie des argiles, palynofaciès) et par des bio-strati- graphes (palynologie, nannofossiles calcaire) avec deux objectifs :
— tester les possibilités et les limites de chacune de ces disciplines en interprétation séquentielle en intégrant leurs résultats à une interprétation séquentielle pré-établie. Pour chaque discipline certaines tendances générales propres à chaque système de dépôt (dépôt gravitaire, prisme de bas niveau, intervalle transgressif, prisme de haut niveau) ont été observées;
— améliorer le cadre biostratigraphique publié actuellement dans la littérature par l’apport des Dinoflagellés et du nannoplancton calcaire.
0396-2687/93/0017-0151 $ 6.20 © 1993 elf aquitaine production, F-31360 Boussens

152 R. JAN DU CHÊNE, R. BUSNARDO, J. CHAROLLAIS, B. CLAVEL, J,-F. DECONINCK, L EMMANUEL, BCREDP (17) 1993S. GARDIN, G. GORIN, H. MANIVIT, E. MONTEIL, J.-F. RAYNAUD, M. RENARD, D. STEFFEN, N, STEINHAUSER,
A. STRASSER, C. STROHMENGER AND P.R. VAIL
Ces résultats sont discutés en détail dans chacun des articles de spécialités publiés dans ce volume (Strohmenger & Strasser, Deconinck, Emmanuel & Renard, Steffen & Gorin, Monteil, Gardin & Manivit). Certaines divergences peuvent apparaître entre ’interprétation séquentielle pré-établie et les modèles proposés par certaines spécialités (géochimie et Dinoflagellés), principalement dans le Berriasien supérieur (Emmanuel & Renard, Monteil). De nouvelles propositions de subdivisions séquentielles et de corrélations sont émises par ces auteurs. Elles doivent encore être vérifiées par d'autres analyses dans les affleurements étudiés et dans d'autres coupes ou forages.
Une synthèse des principaux résultats est présentée dans ce travail; elle est co-signée par tous les membres du groupe de travail.Roger Jan du Chêne, Geological Consultant, 3 square du Pomérol, Domaine de
Beausoleil, F-33170 Gradignan; Robert Busnardo, Bernard Clavel, Département des Sciences de la Terre, Université Claude Bernard, 15-43 Boulevard du 11 Novembre 1918, F-69621 Villeurbanne; Jean Charollais, Georges Gorin, Eric Monteil, Daniel Steffen, Norbert Steinhauser, Département de Géologie et Paléontologie, 13, rue des Maraîchers, CH-1211 Genève; Jean-François Deconinck, Laboratoire de Dynamique sédimentaire et structurale, U.R.A. 719 CNRS, Université de Lille, Sciences de la Terre, F-59655 Villeneuve d’Ascq CEDEX; Laurent Emmanuel, Hélène Manivit (deceased, November 1991), Maurice Renard, U.R.A. 1315 et Laboratoire de Géologie des Bassins Sédimentaires, 4, place Jussieu, F-75252 Paris CEDEX05; Silvia Gardin, Bureau de Recherches Géologiques et Minières, Service géologique national, BP 6009, F-45060 Orléans; Jean-François Raynaud, elf aquitaine production, Département Géologie Sédimentaire, CSTJF, F-64018 Pau CEDEX; André Strasser, Institut de Géologie, Pérolles, CH-1700 Fribourg (Suisse); in the early stage of the project Département de Géologie et Paléontologie, 13, rue des Maraîchers, CH-1211 Genève; Christian Strohmenger, BEB Erdgas und Erdoel GmbH, Riethorst 12, D-3000 Hannover 51 (Germany); in the early stage of the project Département de Géologie et Paléontologie, 13, rue des Maraîchers, CH-1211 Genève; Peter Vail, Rice University, Department of Geology and Geophysics, PO. Box 1892, Houston, TX 77251 (USA). - February 18, 1993.
Mots-clefs : Coupe type, Tithonique, Berriasien, Eustatisme (Stratigraphie séquentielle), Alpes de Haute-Provence (Angles), Ardèche (Berrias, Broyon), Fosse Vocontienne.
ABSTRACT
Field observations (stacking pattern of carbonate and marlstone beds) and facies analysis allow the sequence-stratigraphic interpretation of three Upper Tithonian-Berriasian reference sections of the Vocontlan Trough (SE France) : Broyon, Berrias (stratotype) and Angles. A succession of ten third-order depositional sequences (sensu Vail) is defined : three in the Upper Tithonian (Ti 4 to Ti 6) and seven in the Berriasian (Be 1 to Be 7).
The Upper Tithonian and basal Berriasian sequences consist mainly of stacked lowstand systems tracts which are essentially composed of slope fans and of prograding wedges. Berriasian sequences show more complete successions including Lowstand, Transgressive and Highstand systems tracts.
These third-order sequences are precisely calibrated by biostratigraphy, principally by the Calpionellid and Ammonite reference scales. At Berrias, they are also integrated into the paleomagnetic data.
Samples have been selected by specialists in diverse disciplines such as geochemistry, clay mineralogy, palynofacies, and by bios- tratigraphers (palynology and calcareous nannoplankton) with two main objectives :
— to test the abilities and limitations of each of these specialities in sequence-stratigraphic interpretation by integrating their results into the pre-established sequence-stratigraphic framework. For each discipline, trends characterizing each of the systems tracts (mass-flow, lowstand wedge, transgressive, highstand) are observed and discussed;
— to improve the biostratigraphic resolution of the interval by adding Dinoflagellate and calcareous nannofossil zonations.
These results are discussed in each of the specialist papers published in this volume (Strohmenger & Strasser, Deconinck, Emmanuel & Renard, Steffen & Gorin, Monteil, Gardin & Manivit). Some differences appear between the pre-established sequence-stratigraphic interpretation and the models proposed by some specialities
(geochemistry and Dinoflagellates), essentially in the Upper Berriasian (Emmanuel & Renard, Monteil). New correlations and subdivisions are proposed by these authors. They still have to be checked by additional analysis in the outcrops studied and in other field or subsurface sections.
A synthesis of the most important results is submitted in this paper; it is co-signed by all the working group members.
Key words : Type sections, Tithonian, Berriasian, Eustasy (Sequence stratigraphy), Alpes de Haute-Provence (Angles), Ardèche (Berrias, Broyon), Vocontian Trough.
PRELIMINARY REMARK
This paper is a synthesis of the abundant data prepared by a research group, the “Vocontian Trough Early Cretaceous working group”, composed mostly of scientists from French (Lille, Paris, Lyon) and Swiss (Geneva, Fribourg) Universities, coordinated by R. Jan du Chêne and J.-F. Raynaud. The scientists were largely supported by fundings from Elf Aquitaine Production (Pau, France), Swiss National Science Foundation (Projects 21-28988.90, 20- 28468.90, 20-23422.92, 20-33422.92, 20-5646.88, 20-30276.90), BEB Erdgas und Erdôl GmbH (Hannover, Germany), Bureau de Recherches Géologiques et Minières (Orléans, France), CNRS (through U.R.A. 1315 and 719) and UPMC Paris.
The sequence-stratigraphic school and excursion run for this research group in the Department of Geology of the University of Geneva (June 1991) by P.R. Vail (Rice University, Houston), was sponsored by Elf Aquitaine Production.

BCREDP 17 (1993) UPPER TITHONIAN-BERRIASIAN SEQUENCE - STRATIGRAPHIC MULTIDISCIPLINARY INTERPRETATION 153
CONTENTS
INTRODUCTION.......................................................................... 1531. - THE GEOLOGICAL CONTEXT.......................................... 154
1.1. The Vocontlan trough................................................. 1541.2. The Upper Tithonian-Berriasian interval................. 154
1.2.1. The Broyon Quarry......................................... 1551.2.2. The Berriasian stratotype.............................. 1551.2.3. The Angles reference section...................... 155
2. - SEQUENCE-STRATIGRAPHIC INTERPRETATION........... 1572.1. Introduction.................................................................. 1572.2. Biostratigraphic calibration and description of the
depositional sequences............................................ 1572.2.1. Depositional sequence Ti 4.......................... 1572.2.2. Depositional sequence Ti 5.......................... 1572.2.3. Depositional sequence Ti 6.......................... 1572.2.4. Depositional sequence Be 1........................ 1632.2.5. Depositional sequence Be 2........................ 1632.2.6. Depositional sequence Be 3........................ 1642.2.7. Depositional sequence Be 4........................ 1642.2.8. Depositional sequence Be 5........................ 1652.2.9. Depositional sequence Be 6........................ 1662.2.10. Depositional sequence Be 7...................... 166
2.3. Discussion................................................................... 1672.3.1. Magnetostratigraphy....................................... 1672.3.2. Facies............................................................... 1672.3.3. Geochemistry.................................................. 1672.3.4. Clay mineralogy.............................................. 1672.3.5. Palynofacies.................................................... 1682.3.6. Palynology : Dinoflagellate biostratigraphy.... 1682.3.7. Calcareous nannoplankton............................ 168
3. - GENERAL CONCLUSIONS................................................ 1694. - REFERENCES...................................................................... 169
INTRODUCTION
Sequence-stratigraphic interpretation is essentially based on physical-geology observations. Third-order sequences are divided into systems tracts, these being the expression of relative sea-level fluctuations. These variations depend principally on the combination of the effects of eustasy, sediment supply, tectonic subsidence and climate (Vail et al., 1991).
In recent years, sequence-stratigraphic interpretations were proposed which were based on different geological specialities (micropaleontology, palynology, geochemistry, etc.) and speculative parameters related to systems tracts. Most of these parameters were used without being controlled by a pre-established sequence-stratigraphic interpretation. In some cases, the basic concepts of sequence stratigraphy were not even correctly understood and interpreted. One of the most common misunderstandings of the concept, was the supposed continuous increase of marine influence from the sequence boundary to the maximum flooding surface, without any consideration for the progradatio-
nal pattern of the lowstand wedge. The definition of a systems tract based on a single punctual observation was also a common misinterpretation. No attempts were made to define whether the results of the analyses were directly related to relative sea-level changes, or if they were predominantly influenced by only one of the parameters (sediment supply, tectonic subsidence, etc.).
The objective of a series of papers published in this volume (Deconinck, Clay mineralogy; Emmanuel & Renard,
Geochemistry; Steffen & Gorin, Palynofacies; Monteil, Dino- flagellates; Gardin & Manivit, Calcareous nannofossils) is to test the possibilities and limitations of each of these specialities in sequence-stratigraphic interpretation and to define if general trends are observed throughout the different systems tracts of a succession of relatively deep water, third-order depositional sequences (maximum or minimum abundance peaks, increasing or decreasing curve patterns, microfaunal and microfloral associations, etc.).
These analyses also attempt to define whether a curve pattern is directly connected to relative sea-level rise or fall, or if it may be predominantly or solely related to another parameter, such as variations in sedimentation rate, variations in the rate of tectonic subsidence, variations in rock carbonate content, in energy level, etc. These variations may be recorded in any of the systems tracts or even at parasequential level, and therefore, would only be indirectly, or not at all related to eustatic cycles.
Another objective of the group was to calibrate additional micropaleontological zonations with the reference Calpionel- lid and Ammonite zonations, and with the sequence-stratigraphic interpretation. A Dinoflagellate zonation already published independently by Monteil (1992), is slightly modified and integrated into the proposed framework (Mon
teil, 1993). It demonstrates that even in carbonate-dominated sections, and with an adapted processing method, Dinoflagellates remain an excellent biostratigraphic tool. Nannofossil qualitative and quantitative studies (Gardin &
Manivit, 1993) are also integrated into our synthetic tables. The nannofossil specific distribution is compared with the standard biostratigraphic scale of Bralower et al. (1989).
The relationship between each speciality and relative sea-level changes, is investigated using a sequence-stratigraphic framework pre-established in the field by the members of the “Vocontian Trough Early Cretaceous working group”. The sequence-stratigraphic interpretation is largely based on bed stacking patterns and identification of key surfaces, and is supported by sedimentological and facies analysis by Strohmenger & Strasser (1993).
A series of preliminary considerations were discussed and adopted by the members of the group.
Systems tracts are defined as the superposition of a series of parasequences defining a sedimentological trend in a vertical geological section. From the base to the top of a theoretical third-order sequence, we recognize :
• a lowstand systems tract composed of :— lowstand mass flow deposits (slope fans, basin floor
fans),— a lowstand prograding wedge or shelf margin wedge,
defined as a series of parasequences producing a prograding and then aggrading sedimentological trend;

154 R. JAN DU CHÊNE, R. BUSNARDO, J. CHAROLLAIS, B, CLAVEL, J.-F. DECONINCK, L. EMMANUEL,S. GARDIN, G. GORIN, H. MANIVIT, E. MONTEIL, J.-F. RAYNAUD, M. RENARD, D. STEFFEN, N. STEINHAUSER,
A. STRASSER, C. STROHMENGER AND P.R. VAIL
BCREDP (17) 1993
• a transgressive systems tract, defined as a series of parasequences producing an aggrading and then retrograding sedimentological trend;
• a highstand systems tract, defined as a series of parasequences resulting in an aggrading and then prograding sedimentological trend.
The boundary between two systems tracts is based mainly on a trend inversion and does not necessarily correspond to an abrupt sedimentological change.
If directly related to relative sea-level changes, the observations made in each speciality should reflect these different sedimentological trends. However, the trend pattern may vary considerably with the position (proximal or distal to the offlap break) of the vertical geological section studied.
It is evident that, at all times, proximal (delta plain, lagoon, etc.) to distal (open marine) environments exist. A single environment (and its micropaleontological, geochemical, etc. components) is not, therefore, characteristic of a systems tract. However, the vertical superposition of these environments will define trends which will characterize the progradational, aggradational or retrogradational patterns of the systems tracts.
An “intelligent” sampling is essential to correctly define a trend in a geological succession. Important variations in the distribution of faunal, geochemical, etc. components (diversity and abundance), may exist between the base and the top of a single coarsening-up parasequence, even in open-marine conditions (Darmedru et at., 1982; etc.). Variations may be even more important in shallow-water neritic environments, where energy level, granulometry of the sediments, etc. could vary more drastically (Rioult et at., 1991; fig. 16: silty quartz content curve). Samples should, therefore, be selected at the same reference level(s) (base, top, etc.) in each of the parasequences.
Sample spacing is also an important factor. Regularly spaced sampling throughout a whole section has to be avoided (see above). However, for financial, processing and analytical time consuming reasons, the regular sampling of each of the parasequences is impossible (principally when a single bedset is considered as the basic unit, i. e. the Vocontian Early Cretaceous). As third-order sequences and, consequently, systems tracts, show considerable differences in thickness in a single vertical section (i.e. between thick lowstand wedges and thin condensed transgressive systems tracts in deep water settings), a preliminary sequence- stratigraphic interpretation is highly recommended on well log (subsurface) or outcrop (field observations) to define a sampling adapted for each of the systems tracts. Therefore, sample spacing in the different systems tracts may vary considerably throughout a single depositional sequence.
Analyses based on “intelligent” sampling will most probably reflect the correct trend of a speciality throughout a systems tract. However, the most abrupt changes in the trend may not necessarily indicate the boundary between systems tracts. They may just correspond to some of the limits of the application related to a change in the parase- quential succession (i. e. an abrupt coarsening up in a vertical section). These limits cannot generally be correlated as they may vary in time with the relative location (proximal to distal) of the different vertical geological sections studied.
1 — THE GEOLOGICAL CONTEXT
1.1. THE VOCONTIAN TROUGH
In the Southern Subalpine Ranges (S-E France), the Mesozoic of the Digne and Castellane areas is essentially characterized by deep water pelagic sediments. This domain is bounded in the south by the Provence platform, and by hemipelagic zones in the north (Vercors) and in the west (Ardèche and Massif Central). The pelagic zone open to the Alpine Tethys Sea in the east is called the “Domaine Vocontien" (Baudrimont & Dubois, 1977; Curnelle & Dubois, 1986).
In the whole area, the Mesozoic series is characterized by an alternation of marl-dominated intervals (Oxfordian, Valanginian, Aptian, Albian) and limestone-dominated episodes (Bajocian, Tithonian, Barremian, Bedoulian, Turonian and Senonian).
In the Southern Subalpine Ranges, the end of the Latest Jurassic sequence is characterized by the development of massive carbonates. The limy Kimmeridgian and Tithonian sediments are capped by brackish or freshwater Purbeckian facies, or truncated by an extended and diachronous discontinuity surface. At the western border of the Vocontian Trough, the limy Berriasian stratotype section is still characterized by hemipelagic facies with interbedded synsedimen- tary breccias. In Angles, the Berriasian consists of massive limestone beds at the base of the section, grading into limestone / marl alternations towards the top.
In the Valanginian and Lower Hauterivian, an important difference in thickness is recorded between the relatively condensed basin series of the Vocontian Trough and the thick and rapidly prograding western margin series.
12. THE UPPER TITHONIAN-BERRIASIAN INTERVAL
The sequence-stratigraphic interpretation of three Upper Tithonian-Berriasian reference sections (Broyon Quarry, Berriasian stratotype and Angles reference sections; Fig. 1) is based essentially on field lithostratigraphic observations and facies analysis (Strohmenger & Strasser, 1993). Long-distance sequential correlations are supported by an excellent biostratigraphic framework, mostly based on Calpionellids and, in some cases, Ammonites (Le Hégarat, 1973, 1980; Le Hégarat & Remane, 1968; Le Hégarat & Ferry, 1990), and more recently by Dinoflagellates (Monteil, 1992, 1993) and nannofossils (Gardin & Manivit, 1993).
Additional sequence-stratigraphic data were provided by observations made in other field sections (Jacquin, pers. comm.).
A summary of the sequence-stratigraphic terminology and conventions is given by Vail et al. (1991), an outcrop sequence-stratiqraphic procedure can be found in Rioult et al. (1991).

BCREDP 17 (1993) UPPER TITHONIAN-BERRIASIAN SEQUENCE - STRATIGRAPHIC MULTIDISCIPLINARY INTERPRETATION 155
Figure 1
Location map of the three sections studied.
1.2.1. The Broyon Quarry
The Broyon Quarry is located about 2km south of Le Pou- zin, on the right hand side of the Rhône river, along the road D22 (see Cecca et al., 1989, fig. 9; see also map Institut Géographique National (IGN) CREST, XXX-37, 5-6,1 :25 000; X : 789.5; Y : 272.0).
The Broyon section ranges from Early Tithonian to Early Berriasian and is dated by Calpionellids and Ammonites (Le Hégarat, 1973; Cecca et al., 1989). The Tithonian interval is represented by a cliff of massive fine-grained limestones with local intercalations of breccias : the “Calcaires blancs” Fm. of Cecca et al. (1989). The Berriasian part of the section (Jacobi-Grandis zone) displays limestone-marl alternations, where marls are clearly dominant and extremely favourable for microfossil preservation. Marl dominated basal Berriasian is only known in the Broyon Quarry and in a few other outcrops in the same area.
The section is capped by a single breccia bed, which corresponds to the base of Calpionellid zone C and Ammonite Privasensls subzone.
The Broyon section is interpreted as hemipelagic slope deposits (Dromart et al., 1992; Strohmenger & Strasser, 1993). A general description of the lithostratigraphy and biostratigraphy of the quarry has recently been published by Cecca et al. (1989). However, the bed numbers used in this work do not correspond to those defined by Cecca et al. (1989), who subdivided the outcrop into three major
units : The “Brèche de base”, the “Calcaires blancs” and the “Marno-calcaires”.
Most of the beds seem relatively well dated (Calpionellids and Ammonites), except for the “Brèche de base” which is situated between Early Tithonian (Richteri subzone, Fallauxi zone) and Upper Tithonian (Microcanthum zone).
The lithological log of the Broyon Quarry has been established by R. Busnardo, R. Jan du Chêne, E. Monteil and D. Steffen (Fig. 2).
1.2.2. The Berriasian stratotype
The Berriasian stratotype is located to the north of the village of Berrias, in an ephemeral river, the Graveyron or Graveyrou, running NW to SE (Busnardo et al., 1965; fig. 3; see also map IGN BESSEGES, XXVIII-39, 1 :25 000, 3-4, base section X : 748.6; Y : 233.2; top section X :749.1; Y : 232.3).
It is dated by Calpionellids and, in some intervals, by Ammonites (Busnardo et al., 1965; Le Hégarat & Remane, 1968; Le Hégarat, 1973, 1980; latest update by Busnardo & Clavel, pers. comm.) and is related to magnetostratigraphy by Galbrun et al. (1986). The section consists of finegrained limestones with rare, thin marly intercalations and a massive breccia bed at the base of Calpionellid zone C, which correlates with the topmost bed observed at Broyon.
The Berrias section is interpreted as hemipelagic outer platform deposits (Gorin & Steffen, 1991; Strohmenger & Strasser, 1993).
In the Berriasian stratotype section, the bed numbers (138-193) correspond approximately to those defined by Le Hégarat & Remane (1968) and Le Hégarat (1980). They are also equivalent to those of Gorin & Steffen (1991). However, another numbering (1 to 65) is observed along the section. It corresponds to the magnetostratigraphic sampling of Galbrun et al. (1986).
The lithological log of the Berriasian stratotype has been established by R. Busnardo, R. Jan du Chêne, E. Monteil and D. Steffen (Fig. 3).
1.2.3. The Angles reference section
The Upper Tithonian and Berriasian section of Angles is located at the intersection of road N207 (Saint-André-des- Alpes-Nice) and road D33 to Angles (Le Hégarat & Ferry, 1990; fig. 1). The Tithonian-Berriasian section is directly overlain by the Valanginian hypostratotype.
The section is dated by Calpionellids (Le Hégarat & Ferry, 1990). It consists of massive limestone beds at the base, grading into limestone-marl alternations towards the top. At two different levels, slumped and channelized beds coincide with important biostratigraphic gaps.
The limestone-marl alternations in the Angles section are considered as lower slope to basin deposits (Strohmenger & Strasser, 1993).
The lithological log of the Angles section has been made by D. Steffen and R. Busnardo (Fig. 4). There is no equivalence between the bed numbers used in this paper and the bed reference numbers used by Le Hégarat & Ferry (1990).

SEQUENCESTRATIGRAPHY
BEDNO.
LITHOLOGY and FACIES
FACIES TYPEPALYNOFACIES DINOFLAGELLATE NANNOFOSSILS BED
NO.
BASIN FLOOR FANSb'(Be"4)----
131.5
(, SB (Be 3) 133 ,
Position of the SB (Be 3) implied by
regional biostratigraphic
correlations.
LOWSTANDPROGRADING
WEDGE
\
Position of the SB (Ti 6) implied
by regional biostratigraphic
correlations.
*PRIVASENSIS
Fluxoturbidite:Grain-flow
deposit
Alternation of fossil
wackestone and thick marlstone
beds.Basal sequence
boundary does not exhibit any
erosive feature
- Thinning upward tendency (l 8B-C) Abt. radiolarians, calpionellids and minor limestone
__ clasts
Slightly erosive surface
Monomictic mud-flow
breccias with grain-flow
intercalation (base of 12)
Massive breccia: channelled debris
___flowsErosive surface
Mud-dominatedinterval:
Mud flows with dark intraclasts
and three thin-bedded debris flows
(IB, 7 and 8 base)
Prominent hardground
on the top of a heavily
bioturbated and ferriferous bed; abt. ammonites
(180
PM4 dominant
with 15-30% PM 1
Rare sporomorphs PM 1/2-B strongly
dominant
PM 1/2 - B increasingly
dominant from the base
to the top
PM4 decreasingly abundant from the base to the top
Saccocoma (pelagic crinoid)
(top 1-2) Shallow-water fossils
mixed with deep-water fossils
Abt shells and ammonites at the
top of D Abt. deep-water
fossils (C)
PM4dominant
with 20-40%© PMl +iAH
CL
PM 1/2 - B
■ P. basifurcatum
***D. bensonii T. dodekovae S. ramosus group C. elegantulum M. tabulata
JD. hollisteri
M. longicoma C. pygmaea m
P. mixtispinosum***W. californica
18A: Rare dinocvsts
BARREN
9: L. bulgarica P. anasillum L. mirabile
P. lunareB. ramosa
D. scabratum
• B. johnewingii
* R. angustiforata N. kamptneri kamptneri
*N. steinmannii steinmannii, N. steinmannii minor M. chiastiusU. granulosa C. cuvillieri etc.
N. infans 4 C. deflandrei H. noelae
C. mexicana mexicana C. mexicana minorC. margerelliD. lehmanni D. rotatorius P. beckmanni W. bamesae W. manivitae Z, embergerii
25
2423222119
C18 Ü
10
“8
Z5I
3
2
Figure 2
The Broyon Quarry Biostratigraphy, sequence stratigraphy and lithostratigraphy. Integration of the main results from the palynofacies analysis, and of the biostratigraphy of the Dinoflagellates and calcareous nannoplankton.
156 R
. JAN DU C
HÊN
E, R
. BUSN
ARD
O, J. C
HAR
OLLAIS,
B. CLAVEL, J.-F. D
ECO
NIN
CK,
L. EMM
ANU
EL, BC
RED
P (17) 1993S. G
ARD
IN, G
. GO
RIN
, H
. MAN
IVIT, E, M
ON
TEIL, J.-F. RAYN
AUD
, M
. REN
ARD
, D. STEFFEN
, N
. STEINH
AUSER
,A. STR
ASSER, C
. STRO
HM
ENG
ER AND P.R
. VAIL

BCREDP 17 (1993) UPPER TITHONIAN-BERRIASIAN SEQUENCE - STRATIGRAPHIC MULTIDISCIPLINARY INTERPRETATION 157
2. — SEQUENCE-STRATIGRAPHIC INTERPRETATION
2.1. INTRODUCTION
The three outcrops studied are interpreted as hemipela- gic to pelagic outer platform to basinal deposits. These vertical sections remain in a distal position relative to the offlap break. This location may slightly smoothen the trends of the analyses, as they are not affected by sharp sedimentological breaks or discontinuities which commonly occur in shallow- water environments. In this deep water setting, important discontinuities are characterized by episodic mass-flow deposits.
From the base of the Broyon Quarry to the top of the Angles section, a series of ten third order sequences has been identified : three in the Upper Tithonian (Ti 4 to Ti 6) and seven in the Berriasian (Be 1 to Be 7). In this report, each third order sequence is named after its basal sequence boundary (i.e. the depositional sequence Ti 4 is supported by sequence boundary Ti 4). Absolute age datings were tentatively provided by Jacquin & Vail (oral comm.).
Tithonian depositional sequences are mostly represented by stacked lowstand systems tracts, essentially composed of slope fans and prograding wedges. A single bed in both the Angles section (68) and the Broyon section (30) has been tentatively interpreted as basin floor fan equivalents.
Berriasian sequences, principally those of the Upper Berriasian, show a more complete succession including low- stand, transgressive and highstand systems tracts in both the Berriasian stratotype and the Angles sections.
2.2. BIOSTRATIGRAPHIC CALIBRATION AND DESCRIPTION OF THE DEPOSITIONAL SEQUENCES.
2.2.1. Depositional sequence Ti 4
This sequence has been observed in the Broyon Quarry only (Fig. 2). Its basal sequence boundary (SB Ti 4) is located at the base of an erosive and massive breccia, interpreted as a channelized debris flow equivalent to a slope fan (bed 10). This sequence boundary is imprecisely calibrated by biostratigraphy, as older than Microcanthum and younger than (or in uppermost part of) Richteri Ammonite zones. It is directly overlying a mud-dominated interval representing a lowstand prograding wedge. A stratigraphic hiatus including the time equivalent of at least a transgressive systems tract (or condensed section) and a highstand is, therefore, expected at the level of the sequence boundary Ti 4. It may explain the absence of the Admirandum/Biruncinatum and Ponti zones.
In the Broyon Quarry, the depositional sequence Ti 4 is restricted to a thin slope fan complex (bed 10) and a series of thin-bedded limestones which may either be interpreted as a lowstand prograding wedge or a highstand systems tract.
The sequences Ti 4, Ti 5 and Ti 6 are characterized by a progressive increase of the allochthonous PM 1/2-B organic fragments and large equidimensional PM4 debris. This suggests strong continental influence in a stacked lowstand slope fan succession (for organic matter classification, see Steffen & Gorin, 1993).
The presence of the diagnostic Dinoflagellate Biorbifera johnewingii below SB Ti 4 indicates that the base of the corresponding zone is Lower Tithonian; it is calibrated as \nUa-Richteri Ammonite subzone (Cecca et al., 1989). The relatively frequent Dinoflagellates observed in the marly facies below SB Ti 4, contrast with the intervals barren of Dinoflagellates, recorded in the massive limestone of sequence Ti 4 to Ti 6. The absence of favourable marly facies and the predominance of mud-flow, debris flows and massive lowstand wedges in sequences Ti 4 to Be 2 is liable to the non-recognition of the B. johnewingii zone in both the Berrias and Angles sections.
The marly interval in the lowermost part of the Broyon Quarry and the depositional sequence Ti 4 (in part) (beds 1-11 ?) are attributed to the Middle Tithonian nanno-subzone NJ-20B, due to the abundance of Polycostela beckmanni, Conusphaera mexicana mexicana and Faviconus muitico- lumnatus, and to the absence of the marker of the NJK zone Microstaurus chiastius. These results differ slightly from those of Bralower et at. (1989), who considered this interval (beds 1-19) as Upper Tithonian - Early Berriasian (NJK).
2.2.2. Depositional sequence Ti 5
The base of this sequence has been observed in the Broyon Quarry only. The sequence boundary Ti 5 is located at the base of massive monomictic mud-flow breccias (bed 12), interpreted as stacked slope fans. It is biostratigraphi- cally located in the basal part of the Microcanthum Ammonite zone and at the boundary between the Chitinoidella and Crassicollaria A biozones.
In the Angles section, a strong maximum of illite is recorded in the Ti 5 depositional sequence (Fig. 4). It suggests an intense continental influence as this mineral is derived from the erosion of the crystalline basement of continental landmasses. Such a maximum of illite may therefore be related to an important relative lowstand of sea- level, maybe in the most regressive interval of a second order cycle.
In both Berrias and Angles, the manganese values remain consistently low in the stacked lowstand deposits of the Ti 5 to Be 1 sequences.
The massive mud-flow deposits of this sequence are essentially barren of Dinoflagellates. Because of the unfavourable lithology, nannofossils are also relatively rare in this interval. The NJK nannozone (Upper Tithonian - Early Berriasian) is not recognized.
2.2.3. Depositional sequence Ti 6
The base of this sequence cannot be precisely defined in the Broyon Quarry. Through regional biostratigraphic correlations, it should occur in the succession of massive monomictic mud-flow breccias (beds 12 to 17), most probably at the base of, or in bed 15. In the Angles section, sequence boundary Ti 6 is tentatively placed at the base of a debris-

en03
LITHOLOGY and FACIES
FACIES TYPE
i i i i'
Upper part of the stratotype section
dominated by marl stone
intercalations
Sequential subdivisions based solely
on field observations
Thick limestone bed
Uniform bed thicknesses.
HST identified only by its spacial
position
- Thin beds with abt. pyrite
Relatively thick limestone beds, superimposed by a marl stone of uncertain
thickness
Five parasequences which
are tentatively related to Milankovitch)
cycles.
Uniform, thin-bedded
carbonate beds reflecting increasing
accomodation space
Four parasequences (Milankovitch
cycles ?) showing
thining-upward tendency
(beds /24 to /34)
CLAYMINERALOGY
__4
KAOLINITE/ ILLITE
ratio
Subtle
variations
in the
relative
proportions
of illite
and
kaolinite
seem to
correspond
to sea-level
fluctuations
GEOCHEMISTRY DINOFLAGELLATES
,P. pelliferum ■*-* K. fasciatum
M. maewhaei F. A
A. metaelliptica [-►
wSystematophora sp. A
T. apatela
AcmeM. longicomis
P. chailengerensis
■<-*F. modesta
C. dissimilis
NANNOFOSSILS BEDNO.
2MT
/62191/61
P. fenestrata
R. angustiforata
173/45
/44
MAGNET.
M14
M15n
M15
M16n
M16
M17n
R. JAN D
U CH
ÊNE,
R. BU
SNAR
DO
, J. CH
ARO
LLAIS, B. C
LAVEL, J.-F. DEC
ON
INC
K, L. EMM
ANU
EL, BC
RED
P (17) 1993G
ARD
IN, G
. GO
RIN
, H
. MAN
IVIT, E. M
ON
TEIL, J.-F. RAYN
AUD
, M
. REN
ARD
, D. STEFFEN
, N
. STEINH
AUSER
,A. STR
ASSER, C
. STRO
HM
ENG
ER AND
P.R. VAIL

BEDNO. MAGNET.
M17n/25
ha
123
ISO
I'll
M17148/16
147/IS
/14 Ml 8n147/12
/II/V M18
CLAYMINERALOGY
Heterogeneousclay
assemblages composed of
illite, kaolinite
andillite/smectitemixed-layers
KAOLINITE/ILLITERATIO
GEOCHEMISTRY DINOFLAGELLATE
C. pygmaea
P. mixtispinosumm
•**W. cylindricum B. johnewingii
C. pygmaea
C. elegantulum M. tabulata M. Iongicornis
S. ramosus group
■J P. basifurcatum W. califomica A. metaelliptica etc.
100 200
NANNOFOSSILS
N. steinmanni - minor
N. steinmanni
143/4143/3'
143/2
140
139/3139/2
139/1
Figure 3
The Berriasian stratotype : Biostratigraphy, sequence stratigraphy, lithostratigraphy and magnetostratigraphy. Integration of the main results from the geochemical, clay mineralogy and palynofacies analyses, and of the Dinoflagellates and calcareous nannoplankton biostratigraphy.
A : top section; B : base section.
BCR
EDP 17 (1993)
UPPER TITH
ON
IAN-BER
RIASIAN SEQ
UEN
CE - STR
ATIGR
APHIC M
ULTID
ISCIPLIN
ARY IN
TERPR
ETATION
159

Œ>O
R. JAN D
U CH
ÊNE,
R. BU
SNAR
DO
, J. CH
ARO
LLAIS, B. CLAVEL, J.-F. D
ECO
NIN
CK, L. EM
MAN
UEL,
BCR
EDP (17) 1993
GAR
DIN
, G
. GO
RIN
, H
, MAN
IVIT, E, M
ON
TEIL, J.-F. RAYN
AUD
, M
. REN
ARD
, D. STEFFEN
, N
. STEINH
AUSER
,A. STR
ASSER, C
. STRO
HM
ENG
ER AND P.R
. VAIL

BER
RIA
SIA
NSEQUENCE
STRATIGRAPHYBEDNO. LITHOLOGY and FACIES CLAY
MINERALOGY GEOCHEMISTRY PALYNOFACIES DINOFLAGELLATE NANNOFOSSILSIBED
NO.SB (Be 6) 129 132
D2
HIGH STAND SYSTEMS TRACT
_MFS_
TRANSGRESSIVE
- D
I FACIES TYPE Thicklimestone bed
Thin-bedded limestones,
rich in calpionellids I and ammonites
LOWSTANDPROGRADING
WEDGE
LOWSTAND SLOPE FAN
SB (Be 5) 129.7 I i2n~l I
5m II
D1
HIGHSTAND
SYSTEMSTRACT
MFS
TRANSGRESSIVE - SYSTEMS
TRACT
XZT
"LOWSTANDPROGRADING
WEDGELOWSTAND SLOPE FANSB (Be J + 4)
133+131.5
LOWSTANDPROGRADING
WEDGE
SB (Be 2) 133.5
:t>
lid
Thick limestone beds
Channelized but not slumped
interval
Five small-scale cycles
(parasequences) Each inferred Milankovitch
cycle is characterized
by 3-4 limestone beds separated
from the superimposed cycle by more
marlyintercalations (top of cycles)
Condensed section:bituminous limest.
Fossil wackestones,very bituminous in beds 99-105
Thinning-upward tendency, increase in marlstone thickness.
Thick limestone ______ beds
Slumpeddebris-flow breccia I
Thick limestone beds
SubmarineI channel cut ?
> ILLITE
?“ 2Ô0 300
PM 4
&
PM 1
dominant
, Di nocyst short abundance peak
PM 4
&
PM 1
dominant
Dinocystmaximumabundance
Foram. linings
PM 4
&
PM 1
dominantDi nocystincreasingabundance
PM 4
PM 1
&
PM 1/2-B
dominant
ÜZ
ca £ w z XoXL
Presence 'Top occurrence ► Base occurrence
T. apatela
Acme M. longicornis
Acme M. longicornis
F. modesta* "C. dissimilis
A. metaelliptica ^ D. bensonii *
D. hollisteri W. cylindricum *
P. challengerensis C. dissimilis *
B. johnewingii A. ? neptuni
M. longicornis 'P. basifurcatum C. pygmaea
M. tabulataS. ramosus group
T. dodekovaeC. elegantulum .
C. pygmaea h»
J P. fenestrata
|R. angustiforata
IN. steinmanni J steinmanni N. steinm. minor
1 M. chiastius
130
127
124
120
118
114
112111
108
105
102
98
96
W
908988
86
84
80
78
BCR
EDP 17 (1993)
UPPER TITH
ON
IAN-BER
RIASIAN SEQ
UEN
CE - STR
ATIGR
APHIC M
ULTID
ISCIPLIN
ARY IN
TERPR
ETATION

LATE
TIT
HO
NIA
N B
ERR
1ASI
AN
LITHOLOGY and FACIES CLAYMINERALOGY
GEOCHEMISTRY PALYNOFACIES DINOFLAGELLATE NANNOFOSSILS BEDNO.
FACIES TYPE
Fossil Clay mineralwackestones rich assemblagesin globochaetids composed of chlorite
illite
Beds are very irregular in
andmixed layers.
Developmentthickness and of chlorite
partly in the limestonediscontinuous beds of the
Submarinemarl-limestone
ÆÊÊ alternations.channels (?)
Hi Occurrence
Grain-flow breccia| (fluxoturbidite) Erosive surface
Mud flows and/or
debris flows rich in allochtonous
fossils of shallow water origin pelecypods,
gastropods and echinoderms
fragments displaying syntaxial
overgrowths (facies type II
dominant). Chert nodules are common.
Intercalations of fluxoturbidites
(on top of 64B): facies type III
Bed 66B is slumped
Fcorrensite (regular chlorite / smectite mixed layer).
% ILLITE30 50
These clay mineral assemblages have mainly a diagenetic significance
(burial diagenesis).The absence of kaolinite (an important difference
with the Berriasian stratotype) is probably due to the greater distance from
detrital sources.
PM 4
PM 1
&
PM 1/2-B
dominant
Rare di nocysts:Cleistosphaerid. sp. Systematophora sp.
BARREN
S. scoriacea “(rare dinocysts)-
BARREN
L. mirabile (rare)
Presence of A. metaelliptica W. californica P. basifurcatum T. evittii
BARREN
Manganese
200 300
** L. bulgarica P. anasillum (top occurrences)
Presence i Top occurrence • Base occurrence
Figure 4
The Angles section. Biostratigraphy, sequence stratigraphy and lithostratigraphy. Integration of the main results from the geochemical, clay mineralogy and palynofacies analyses, and of the Dinoflagellates and calcareous nannoplankton biostratigraphy.
A : top section; B : middle section; C : base section.
162 R
. JAN DU C
HÊN
E, R
, BUSN
ARD
O, J. C
HAR
OLLAIS,
B. CLAVEL, J.-F. D
ECO
NIN
CK,
L. EMM
ANU
EL, BC
RED
P (17) 1993S. G
ARD
IN, G
. GO
RIN
, H. M
ANIVIT,
E, MO
NTEIL, J.-F. R
AYNAU
D, M
, R
ENAR
D, D
. STEFFEN, N
. STEINH
AUSER
,A. STR
ASSER, C
. STRO
HM
ENG
ER AND
P.R. VAIL

BCREDP 17 (1993) UPPER TITHONIAN-BERRIASIAN SEQUENCE - STRATIGRAPHIC MULTIDISCIPLINARY INTERPRETATION 163
flow breccia (bed 64B), interpreted as a slope fan. In both sections, the sequence boundary is intra-Crassicollaria A biozone. It seems to occur in the Durangites Ammonite zone in Broyon.
In the Angles section, strong variations in the illite ratio are observed. Continental influences are also suggested by the presence of abundant PM1/2-B fragments and continental microflora throughout the sequences Ti 5 to base Be 2 in Broyon, Angles and Berrias. Dinoflagellates are rare in Ti 6. Observed in mass-flow deposits, they may be slightly reworked.
In Angles and Broyon, nannofossils are still rare and badly preserved in this interval which should correspond to nannozone NJK.
2.2.4. Depositional sequence Be 1
The base of this sequence (SB Be 1) is recognized in the Broyon Quarry (base of bed 18A), in the Berriasian stratotype (tentatively located at the base of bed 139; Fig. 3) and in the Angles section (base of bed 68). In the Broyon Quarry and in the Angles section, the sequence boundary Be 1 corresponds to the base of Calpionellid zone B (Cal- pionella B). In the Berriasian stratotype, it seems to occur in the lowermost part of B.
In Broyon, mud-flow deposits (bed 18A) are interpreted as a thin lowstand prograding wedge. The thin transgressive beds 18B and C, characterized by a fossiliferous breccia regionally known as “Florizon de La Boissière” or “Brèche de Chomerac” (Le FIégarat & Remane, 1968; Cecca et al., 1989), are capped by a prominent hard ground indicating a maximum flooding surface. This surface coincides with an abrupt change in depositional systems, from massive limestone-dominated stacked lowstand deposits to marls- tone-dominated thin transgressive and highstand deposits (bed 19). This abrupt change is thought to be related to a variation in the rate of the regional tectonic subsidence (Strohmenger & Strasser, 1993; Dromart et al., 1992).
At Berrias, the sequence boundary Be 1 is tentatively proposed at the base of mud-flow breccias (bed 139/1-2), interpreted as lowstand slope fans. It may correspond to the Tithonian-Berriasian boundary. However, biostratigra- phers believe that this boundary is slightly deeper and not observed in the section because the base of Calpionellid zone B and its contact with zone A is not recognized in the stratotype. The overlying partly discontinuous and/or slumped beds (139/3-142) may correspond to a lowstand prograding wedge.
In the Angles section, the base of the Berriasian is characterized by a breccia (bed 68), which represents a massive fluxoturbidite, interpreted as a basin floor fan with a basal erosive surface. The overlying beds (69 to 75) correspond to channelized slope fan deposits (Strohmenger &
Strasser, 1993).
In both Berrias and Angles, both the manganese and 9180 values remain consistently low in the lowstand deposits of the Be 1 sequence. Dinoflagellate cysts are rare and the palynofacies are dominated by PM4 and PM 1/2-B organic matter types which still suggest some continental influences. No PM4-T fragments are recorded.
In Berrias and Angles, the abundance of Illite and the strong variations of the kaolinite/illite ratio also suggest
intense erosion of varying continental sources in the Upper Tithonian and Lowermost Berriasian (Jacobi-Grandis zone). In most sediments, illite is derived from the erosion of the crystalline basement of continental landmasses (related to relative lowstand of sea-level), while kaolinite is reworked from soil developed in weathering profiles.
No samples have been studied for nannofossils in this sequence at Berrias. In Angles, nannofossils are rare and poorly preserved and the assemblages recorded do not allow any zonal attribution.
2.2.5. Depositional sequence Be 2
This sequence is recognized in the three sections analyzed. Its basal sequence boundary (Be 2) is located in Calpionellid zone B (lease ?).
In the Broyon Quarry, discontinuous outcrop conditions in the alternating marls and marly limestone do not allow a precise location of the sequence boundary Be 2. It is tentatively placed at the top of bed 19, the overlying alternations displaying a thickening-upward tendency of the marlstones, interpreted as a prograding lowstand wedge.
In the Berriasian stratotype, the depositional sequence Be 2 is characterized by its basal erosive surface, overlain by a massive mud-flow and debris-flow breccia (bed 143/2- 4) which is interpreted as a lowstand slope fan. A lowstand prograding wedge is proposed between beds 144 and 146/7, whilst a thinning-upward tendency characterizing a transgressive systems tract is recorded between 146/8 and 146/10. The maximum flooding surface corresponds approximately to the Jacobi-Grandis/Subalpina Ammonite zone boundary in both the Broyon quarry and the Berriasian stratotype. In Berrias, it is located within magnetozone M18 whilst the overlying SB (Be 3) approximately corresponds to the M18n/M17 magnetozone boundary.
At Angles, the precise location of the sequence boundary Be 2 is difficult to evaluate. It may be placed at the important lithofacies change observed between the southern part (south of the bridge) and northern part of the section (north of the bridge). Irregularly thick and partly discontinuous beds (69-75), related to channelized slope fan deposits are observed in the southern section, and thickly-bedded limestones interpreted as a lowstand prograding wedge (beds 78 to 87) in the northern one. Even if the sequence-stratigraphic concept would admit such a superposition in a single third-order sequence, regional and long-distance sequential correlations strongly support the presence of a sequence boundary at this level (Jacquin, pers. comm.).
In both Berrias and Angles, the manganese values remain low in the lowstand deposits of the Be 2 sequence. A small increase is recorded in the TST and HST of Berrias, but it seems more related to a long term trend with an important maximum in the MFS of the overlying sequence Be 3. 5180 variation seems more closely related to systems tracts. Values show a progressive increase in the upper part of the LST, a maximum in the TST and a rapid decrease in the HST. These relationships clearly occur again in each of the Berrias sequences, with sharp maxima at each of the TST or MFS.
The absence of kaolinite during most of the depositional sequence Be 2, seems to be a correctable event, at least from SE France to the Purbeckian facies of the Jura Mountains. It probably corresponds to an arid period.

164 R. JAN DU CHÊNE, R, BUSNARDO, J. CHAROLLAIS, B. CLAVEL, J,-F, DECONINCK, L. EMMANUEL,S. GARDIN, G, GORIN, H, MANIVIT, E, MONTEIL, J.-F. RAYNAUD, M, RENARD, D. STEFFEN, N. STEINHAUSER,
A. STRASSER, C. STROHMENGER AND P.R. VAIL
BCREDP (17) 1993
Dinoflagellate base occurrences are frequent in Broyon, Angles and Berrias. The base of the Dichadogonyaulax ben- sonii zone is recorded both in Berrias and Broyon in the LST of the sequence Be 2. In Angles, this zone boundary is located in the base of Be 4 only, but an important stratigraphic hiatus including part of Be 2 and the whole of Be 3 is recorded in this last section. The position of the MFS is emphasized in Berrias by an abundance peak of Dinofla- gellates. The base occurrences of Tehamadinium dodeko- vae and Muderongia tabulata are also recorded in this sequence.
The relative abundance of PM4-T fragments seems to correlate with the increasing manganese values in a long term trend which includes both sequences Be 2 and Be 3.
Sequence boundary Be 2 may be correlatable with the base of the nannozone NK-1 (Lower to Middle Berriasian) and the base occurrence of its index species Nannoconus steinmanni steinmanni, both in Broyon and Berrias. However, in Berrias the base of the nannozone corresponds to the lowermost studied sample. In Broyon, it corresponds to the first studied sample in favourable lithofacies above the mostly barren massive limestone. Therefore, the base of zone NK-1 is not definitely calibrated as it could already occur in sequence Be 1. In Angles, the index species Nannoconus steinmanni steinmanni is not observed below bed 88. The samples analyzed in sequence Be 2 are attributed to nannozone NJK.
2.2.6. Depositional sequence Be 3
If the presence of this depositional sequence is inferred from regional correlations in the Broyon Quarry, its definition is relatively precise in the Berriasian stratotype. Its lower sequence boundary (Be 3) is still located in Calpionellid zone B, in the basal part of the Subalpina Ammonite subzone. The whole sequence is relatively thin (about 3 m).
The sequence boundary Be 3 is underlined by an erosive surface overlain by a mud-flow breccia, interpreted as channelized lowstand slope fan ( 146/14b and 146/15) and capped by a thin lowstand prograding wedge (147-148/16). The sb corresponds approximately to the M18n/M17 magnetozone boundary.
A thin transgressive systems tract (bed 148/18) or condensed interval is separated from the overlying high- stand by an inferred, but very important, maximum flooding surface (intra M17 magnetozone). Long distance palaeoma- gnetic correlations strongly suggest that this maximum flooding surface may be correlated with the Cinder Beds of the Dorset Purbeckian succession (Ogg et ai., 1991, in press, fig. 2 and 3). Ogg et al. (in press) point out that “ Hoede- maeker (1987) tentatively correlated the Cinder Bed transgression with the top of the Tethyan B. jacobi Ammonite zone, but Allen & Wimbledon (1991) correlate it with the lower T. occitanica zone” (= Subalpina). The position of the Be 3 maximum flooding surface in the topmost part of Calpionellid zone B and in the upper part of the Subalpina Ammonite subzone, strongly supports this tentative correlation. The oyster-rich Cinder Beds of the Middle Purbeck have been proposed as the base of the Cretaceous in the non-marine Purbeck-Wealden boreal succession (Casey, 1963, 1964; Rawson et ai, 1978, p.7-8). Therefore, the nonmarine boreal Jurassic-Cretaceous boundary should be correlated with the base of the TST, or even with the maximum
flooding surface of the Be 3 sequence, in the Subalpina Ammonite subzone.
These long distance correlations are also supported by changes in clay mineralogy, with the re-appearance of kao- linite from bed 148/16 in Berrias. The re-appearance of kao- linite is synchronous in the Jura Mountains and in the Berrias stratotype. In Dorset, kaolinite re-appears three meters above the Cinder Beds, slightly higher than in Berrias but still in the same sequence. The re-appearance of kaolinite may reflect the re-establishment of a more humid climate during a relatively important transgressive phase. However, kaolinite remains absent in the whole Angles section, most probably due to the greater distance from detrital sources than Berrias.
In Berrias, the TST is characterized by a rapid increase in manganese up to a very important maximum of 350 ppm, and by a sudden maximum of J180, both at the MFS, where dinocyst diversity and abundance peaks are also recorded. Manganese and 3180 values decrease rapidly in the HST.
At Angles, this part of the section is strongly disturbed by massive slumps (bed 88-89). The upper part of Calpionellid zone B, as well as zone C and lower part of D1 (Grandis to Paramimounum Ammonite zones equivalent) are thought to be missing (Le Hégarat & Ferry, 1990; slump S1 : p. 372). The top of sequence Be 2 and the whole of Be 3 are therefore absent (eroded or not deposited). This stratigraphic hiatus is also expressed by the Dinoflagellate distribution. In both Berrias and Broyon, the base of the Dichadogonyaulax bensonii zone is recorded as intra Be 2. In Angles, this boundary is located in the base of Be 4 only.
In Berrias, the palynofacies show an important increase of the marine fraction in the upper part of the sequence, with dinocyst abundance and diversity peaks and frequent foraminiferal linings.
The base of nannozone NK-2 (and nanno-subzone NK2- A) seems to be recorded as intra sequence Be 2 in the Broyon Quarry, based on the base occurrence of R. angus- tiforata. However, this zone boundary is not synchronous in the three sections studied. In Angles, it is placed at the base of the lowstand wedge of the sequence Be 4, but the section is strongly disturbed by slope fans and stratigraphic hiatuses in this interval. In Berrias, the base occurrence of R. angustiforata is recorded much too high in the HST of sequence Be 4.
2.2.7. Depositional sequence Be 4
The base of the depositional sequence Be 4 corresponds to the base of Calpionellid zone C and Ammonite subzone Privasensis. It is recognized in the Broyon Quarry by the occurrence of a relatively thin fluxoturbidite (grain-flow deposit) interpreted as a basin floor fan (bed 30; equivalent to bed 34 in Le Hégarat & Remane, 1968).
Through biostratigraphic evidence, Le Hégarat & Remane (1968) already correlated the Broyon topmost breccia with bed 150 of the Berriasian stratotype. Sequence-stratigraphic interpretation comes to the same conclusion, with the erosive and channelized breccia bed 150 interpreted as a slope fan. SB (Be 4) is located in a low magnetization interval between M17 and M17n. However, the base of the lowstand prograding wedge immediately overlying the breccia bed 150 is definitely in M17n.

BCREDP 17 (1993) UPPER TITHONIAN-BERRIASIAN SEQUENCE - STRATIGRAPHIC MULTIDISCIPLINARY INTERPRETATION 165
At Angles, the base of depositional sequence Be 4 is also characterized by a debris-flow breccia (Le Hégarat &
Ferry, 1990; slump S1 : p. 372) interpreted as an erosive lowstand slope fan. It overlies an important stratigraphic gap (top of sequence Be 2 and the whole of Be 3 missing). Thin lowstand prograding wedges are recognized at Berrias (beds 152/24 to 164/34; four inferred Milankovitch cycles) and Angles (beds 90-91). Above them, relatively thick transgressive and highstand systems tracts are recorded for the first time in the studied interval. In Berrias, a series of uniform, thin carbonate beds indicates increasing accomodation space and less favourable conditions for carbonate production in a deep-marine environment and at relatively high sea-level. The maximum flooding surface is placed at the top of the thinnest limestone bed (within 166). It corresponds to the boundary between the magnetozone M16 and M16n, the overlying sequence boundary SB (Be 5) being intra M16n.
At Angles, the lowest limestone-marl alternations appear at this level (at the top of five stacked lowstand systems tracts), indicating an overall deepening of the marine conditions. The series shows an obvious thinning upward tendency of the limestone beds and increasing thickness of the marlstone intercalations. A maximum flooding surface can be located in bed 102, bituminous marlstones being recorded from beds 99 to 105. In both sections, this maximum flooding surface occurs in the lower part of Calpionellid zone D1.
Five parasequences tentatively related to the 100,000 year Milankovitch cycles, are recognized both in the Berrias (top bed 166 to base 180/51) and Angles (beds 103 to 119) highstand systems tracts.
Manganese and 31sO curves show a completely different aspect in Berrias and Angles. No major variations in Mn content are recorded in Berrias. The values are evenly restricted between 130 and 160 ppm throughout the three systems tracts of the sequence. In Angles, the lowstand values (260-270 ppm) are slightly lower than the TST ones (near 300 ppm) with a maximum of 320 ppm at the MFS. In the FIST, the values progressively decrease towards the overlying SB (Be 5).
In Berrias, the 3180 values slightly decrease in the LSW, increase abruptly in the TST, to progressively decrease again in the HST. No major variations are recorded in Angles; the values show a slight and progressive increase from the base to the top of the sequence.
Clay mineralogy tends to support the sequence-stratigraphic interpretation. Minima in illite are recorded in the TST in Angles, whilst the kaolinite/illite ratio slowly increases in the LST and TST in the Berrias section. An important maximum peak of the kaolinite/illite ratio is recorded in the lower part of the FIST (bed 42).
In Angles, the continental microflora progressively disappears in the base of the sequence, whilst the relative abundance of Dinoflagellate cysts increases. This increase may be directly related to an overall deepening. It may also be related to more favourable conditions of deposition and preservation due to the marly facies. A dinocyst maximum abundance peak is observed in the marly beds of the FIST parasequences.
Important palynological events are observed. The base occurrence of Foucheria modesta (and of the equivalent dinozone; Monteil, 1993) is recorded in both the Angles and
Berrias sections at the MFS of the sequence. An acme of Muderongia longicornis is also recognized in the FIST of both sections.
2.2.8. Depositional sequence Be 5
In both the Berrias and Angles sections, the basal sequence boundary Be 5 is placed at or near the boundary of Calpionellid zones D and C. In Berrias, the sequence boundary is located in the middle part of the magnetozone M16n, and the whole sequence corresponds to the upper part of M16n. The base of the sequence is characterized by thick limestone beds (180/51 to 183), interpreted as a lowstand prograding wedge. This interval is overlain by a marlstone and thin limestone bed (188), rich in pyrite, which may correspond to the transgressive systems tract. Based on stratonomic features, the maximum flooding surface is tentatively placed at the base of bed 190, a thin highstand systems tract being defined up to the next thicker limestone bed (191 top), which is considered as the base of the over- lying sequence.
At Angles, the base of depositional sequence Be 5 is characterized by a channelized interval (Le FIégarat & Ferry,
1990, slump S2 : p. 372). The successive overlying systems tracts are tentatively defined by the overall bedding features. Their definition seems confirmed by the results obtained from other disciplines (geochemistry, clay mineralogy, etc.). The lowstand prograding wedge is characterized by relatively thick limestone beds (125-130); a condensed transgressive systems tract is recognized in a thin limestone bed rich in Ammonites and Calpionellids ( 131 A). The highstand systems tract consists of a succession of relatively thick limestone beds of uniform thickness. In both sections, the maximum flooding surface is placed in the middle part of Calpionellid zone D2 (mid-Picteti Ammonite subzone).
The major discrepancies between the geochemical (mainly Mn) model and the pre-established sequence-stratigraphic framework occur in Be 5, Be 6 and Be 7.
In Be 5, manganese curves show completely different aspects in Berrias and Angles. No major variations are recorded in Angles, the values being evenly restricted between 250 and 270 ppm. In Berrias, the lowstand values (120- 140 ppm) remain low, a progressive increase being observed in the TST and HST with a maximum of 180 ppm in the upper part of the HST (as previously defined by field observations). Geochemists propose new sequence-stratigraphic subdivisions and correlations which are fully developed in their paper (Emmanuel & Renard, 1993). However, if the systems tracts of this sequence are poorly defined by the Mn content, the MFS and underlying TST of Berrias are clearly correlatable with a sharp increase in 3180. Moreover, the proposed correlations are not fully coherent with the basic biostratigraphic framework given by the Calpionellids.
Clay mineralogy supports the sequence-stratigraphic interpretation. In Angles, maxima in illite are recorded around both SB Be 5 and Be 6, whilst a minimum is observed at the MFS.
In the Berrias section, an important maximum peak of the kaolinite/illite ratio is recorded at the MFS and in the lower part of the HST, whilst minimal values are observed around both SB Be 5 and Be 6.

166 R. JAN DU CHÊNE, R, BUSNARDO, J. CHAROLLAIS, B, CLAVEL, J,-F. DECONINCK, L. EMMANUEL,S. GARDIN, G. GORIN, H. MANIVIT, E, MONTEIL, J,-F, RAYNAUD, M. RENARD, D. STEFFEN, N. STEINHAUSER,
A. STRASSER, C. STROHMENGER AND P.R. VAIL
BCREDP (17) 1993
No major variations in palynofacies occur throughout the whole sequence in Angles. A very weak increase in abundance of dinocysts is observed in the TST whilst low percentages of PM1/2-B fragments are observed only in the lowermost lowstand slope fan. The whole interval is dominated by PM4, PM1 and PM4-T organic debris in constant proportions. In Berrias, the overall picture of the palynofacies is different. PM1, PM1/2-B and PM4 fragments are alternatively abundant in the lowstand deposits. The TST (one sample; bed 188) shows a strong abundance peak of large scale PM1/2-B debris, and some peloidal particles. PM4-T fragments are recorded in the HST only, together with rare spores absent lower down in the section. The whole sequence belongs to the Foucheria modesta dinozone.
The boundary between the subzone NK-2A and NK-2B occurs at the transgressive surface of the sequence Be 5 in the Angles section, and at the MFS of the sequence Be 5 in the Berriasian stratotype (base P. fenestrata). This boundary is calibrated as intra D2 (Calpionellid) and intra M16n (paleomagnetism) in agreement with Bralower et al. (1989).
2.2.9. Depositional sequence Be 6
At both Berrias and Angles, the basal sequence boundary Be 6 Is recognized at or near the Calpionellid subzone D2-D3 boundary, in the upper half of the Picteti Ammonite subzone. However, the overlying sections are not entirely observable and some of the systems tracts and surfaces are tentatively defined through stratonomic features and long-distance sequence-stratigraphic correlations calibrated by biostratigraphy. Additional correlation tools are provided by other disciplines (geochemistry, clay mineralogy, palynofacies).
At Berrias, the sequence boundary Be 6 is only defined by the presence of a thick limestone bed (base of 191/61), and is supported by regional stratigraphic correlations. However, the magnetic calibration of the sequence Be 6 seems relatively precise as SB (Be 6) is correlated with the M16n/M15 magnetozone boundary and SB (Be 7) is correlated with the M15n/M14 magnetozone boundary.
At Angles, sedimentological observation and stratonomy suggest the following subdivisions :
— a lowstand prograding wedge characterized by relatively thickly-bedded limestone and marlstone alternations (beds 132-141). This interval is also characterized by relatively low values of manganese (near 270-280 ppm) and Dinoflagellates (< 10 %);
— strong bioturbation at the base of bed 151 may indicate a maximum flooding surface (reduced sedimentation rate). This surface is recorded in Calpionellid subzone D3 and in the upper part of the Picteti Ammonite subzone. The approximate location of this surface in the Berrias stratotype is possible only through biostratigraphic correlations.
In Angles, the manganese ratio would show a slow increase in the TST to reach maximal values (around 320 ppm) between beds 150 and 154 (topmost TST and basal HST). This ratio decreases again in the highest part of the HST (at and below 300 ppm). The 018O curve shows a similar pattern, with a sharp break at the LST / TST boundary and a more progressive decrease in the HST.
The Dinoflagellate ratio also increases slightly in this interval, reaching peaks above 20 %. However, the organic content is essentially characterized by PM4, PM1 and PM4-T fragments. Frequent foraminiferal linings are present at the
base of the TST. In both Angles and Berrias, the base of the Muderongia macwhaei Forma A Dinoflagellate subzone is located in the uppermost part of Be 6. In both sections, the presence of sporomorphs indicates that continental influences are again present, even in the deepest part of the basin.
In Angles, the sequence Be 6 is precisely calibrated between two illite peaks indicating continental erosion at SB Be 6 and SB Be 7. However, apart from the peaks recorded at most of the sequence boundaries, illite percentages slowly increase from beds 96-97 to the top of the section, probably reflecting a second-order regressive trend. The decreasing kaolinite / illite ratios recorded in the Berrias section most probably also reflect this second-order general trend related to the Middle Kimmeridgian to Uppermost Berriasian - Lower Valanginian regressive phase.
In Berrias and Angles sections, both sequences Be 6 and Be 7 belong to nannozone NK-2B.
2.2.10. Depositional sequence Be 7
At Angles, indications for a sequence boundary at the top of bed 160 are given by stratonomic and facies analysis. The occurrence of limy bulges, interpreted as current ripples indicating submarine muddy contour currents (Strohmenger & Strasser, 1993), suggests a lowstand of sea-level. At Angles, the sequence boundary is located in the middle of Calpionellid subzone D3. The equivalent interval at Berrias is poorly exposed. In this section, sequence boundary Be 7 is tentatively placed at the base of bed 193/65, in the Cal- listo Ammonite subzone and in the middle of Calpionellid subzone D3. It corresponds to the M15n/M14 magnetozone boundary. The maximum flooding surface of sequence Be 7 is already Valanginian in age, being located in the basal part of Otopeta.
In Angles, the presence of current ripples and the slight increase in Dinoflagellate abundance observed in the upper part of the marly bed 160 (SB Be 7), may correspond to a thin condensed interval related to the progradational time to this distal location of the lowstand wedge. This discontinuity may correspond to the northwestern European Late Kimmerian unconformity.
The presence of continental microflora in both Berrias and Angles also indicates that continental influences are continuously present, even in the deepest part of the basin. However, in both Angles and Berrias, important dinocyst diversity and abundance peaks are recorded in the TST and at the MFS, in the Lowermost Valanginian. The base occurrence of Kleithriasphaeridium fasciatum is consistently observed at this level, at the Berriasian-Valanginian boundary, the whole sequence being attributed to the Muderongia macwhaei Forma A Dinoflagellate subzone.
The manganese ratios also show important maximum peaks in both the Berrias and Angles sections. In Berrias the TST and MFS are characterized by values varying between 230 and 300 ppm, whilst the LST values are below 150 ppm. In Angles, the variations are not as pronounced. LST values are included between 250 and 300, and TST and MFS values are generally over 300 ppm. They decrease again to below 300 ppm in the HST.
In Angles the sequence boundary Be 7 is precisely calibrated by an illite peak indicating continental erosion. Above SB Be 7, illite percentages slowly increase to the top of the studied section.

BCREDP 17 (1993) UPPER TITHONIAN-BERRIASIAN SEQUENCE - STRATIGRAPHIC MULTIDISCIPLINARY INTERPRETATION 167
2.3. DISCUSSION
2.3.1. Magnetostratigraphy
The integration of the magnetostratigraphic results of the Berriasian stratotype (Galbrun et al., 1986) is important for the calibration of the sequence-stratigraphic framework and to correlate the Boreal and Tethyan realms at the Jurassic- Cretaceous boundary. The following correlations are proposed :• SB (Be 3) is related to the thin magnetozone M18n
The important MFS of the sequence Be 3 is intra M17. The TST or MFS of the same sequence is therefore tentatively correlated with the Cinder Beds of Dorset, which is often considered as the base of the Cretaceous in the Boreal realm. A slight discrepancy occurs in the correlation of the magnetostratigraphic calibration of the Cinder Beds of Dorset (intra M17n; Ogg et al., in press), and the MFS of the sequence Be 3 (intra M17, but at the base of an interval with poor resolution)
• SB (Be 4) is near the M17/M17n boundaryThe MFS of the sequence Be 4 is at the M16/M16n boundary
• SB (Be 5) and MFS (Be 5) are intra M16n• SB (Be 6) corresponds to the M16n/M15 boundary, MFS
(Be 6) being intra M15• SB (Be 7) may correspond to the boundary M15n/M14.
2.3.2. Facies (Strohmenger & Strasser, 1993)
The basic sequence-stratigraphic interpretation of the Broyon, Berrias and Angles sections was established essentially on field lithostratigraphic observations (bed geometry, stacking pattern of carbonate and marlstone beds) and facies analysis.
Three important facies types are defined in the sections studied :
— fossil wackestones (periplatform ooze) which represent predominantly autochthonous deep-marine deposits (facies type I);
— intraclast-fossil wackestones/floatstones (facies type llm : mud flows and facies type lid : debris flows);
— intraclast-fossil grainstone/rudstones (facies type III : grain flows) which both record the collapse of the carbonate slope during relative sea-level lowstands.
Fligher-order sequences inferred to be in the Milankovitch frequency band could be identified within lowstand and highstand systems tracts at Angles and Berrias. They may help to correlate sections between different areas.
2.3.3. Geochemistry (Emmanuel & Renard, 1993)
The integration of the geochemical results (Mn, Sr, Fe, 913C and 9180) of the Berrias and Angles sections into the sequence-stratigraphic framework shows interesting and important relationships both at the second and third-order levels. However, the understanding of the second-order curves is possible only when considering a longer time interval (Upper Tithonian - Barremian; Emmanuel, 1993).
At the third-order level, interesting relationships exist between manganese contents and sea-level changes, with relatively lower Mn values recorded in LST and in the upper part of the HST and increasing values in the TST. A maximum is often recorded at the MFS or in the lower part of the HST. However, these relationships are not consistently developed. They are clearly expressed in some sequences such as Be 3 and Be 7 in Berrias, or Be 4 in Angles, but the values may also remain extremely even throughout the different systems tracts of the same sequence, as in Be 4 in Berrias or Be 5 in Angles. In these sequences, the relationships between manganese and systems tracts are better expressed in Mn-Fe diagrams (Emmanuel, 1993).
In both Berrias and Angles, the manganese values remain consistently low in the lowstand deposits of the Ti 6 and Be 1 sequence. These values show a general increasing trend from sequence Be 1 to Be 3 (in Berrias) or Be 4 (in Angles), before decreasing again to the Uppermost Berriasian Be 7 sequence boundary. These tendencies may reflect a minor second-order transgressive-regressive phase from the Upper Tithonian to the Uppermost Berriasian with a maximum transgressive trend in sequences Be 3 or Be 4.
Manganese values remain consistently higher in the deeper water facies of Angles than in the relatively shallower facies of Berrias.
The 918 O values of the Berrias and Angles section display similar features both in their long term and third-order trends. 918 O curves are precisely correlatable between both sections. However, some events (MFS) are more sharply defined in Berrias than in Angles.
As for other elements (Sr, Mg), 313C variations are better understood when considering a longer time interval (Upper Tithonian - Barremian; Emmanuel, 1993).
Based on major diachronisms of the Upper Berriasian Mn curves between Berrias and Angles, Emmanuel & Renard
(1993) propose new sequential subdivisions and correlations for the Angles and Berrias sections. Dinoflagellate biostra- tigraphic events could support this interpretation. However, it shows contradictions with the Calpionellid reference scale and, in some cases, does not suit the bed stacking pattern (particularly the proposed SB Be 5 in Berrias). There is definitely a need for additional observations in the outcrops studied and in other field and subsurface sections.
2.3.4. Clay mineralogy (Deconinck, 1993)
Although the assemblages are different in the Berrias and Angles sections (not studied in Broyon), clay mineralogy displays common features in relation with sequence stratigraphy which can be used together with classical sedimentological criteria to identify systems tracts.
Sequence boundaries and lowstands as well as the upper part of prograding highstands, are characterized by relatively high illite content or heterogeneous clay assemblages indicating strong erosion of diversified continental sources.
The clay fraction of transgressive systems tracts is depleted in illite, minima coinciding with maximum flooding surfaces. In some cases, transgressive systems tracts are enriched in kaolinite reworked from the internal platform or stemming from the erosion of pedogenic blankets. The maximum of kaolinite percentages seems to indicate maximum flooding surfaces.

168 R. JAN DU CHÊNE, R, BUSNARDO, J. CHAROLLAIS, B. CLAVEL, J.-F, DECONINCK, L, EMMANUEL,S. GARDIN, G. GORIN, H. MANIVIT, E, MONTEIL, J.-F. RAYNAUD, M. RENARD, D. STEFFEN, N. STEINHAUSER,
A, STRASSER, C. STROHMENGER AND P.R, VAIL
BCREDP (17) 1993
The change in clay mineralogy occurring from the base of sequence Be 3 is a correlatable event also observed in the Jura Mountains within the Subalpina subzone. The same event, related to an important climatic change, is also recorded in Dorset a few meters above the Cinder Beds. It supports the sequence-stratigraphic correlations between the transgressive event of sequence Be 3 or its maximum flooding surface and the Cinder Beds.
Apart from the peaks recorded at most of the third-order sequence boundaries, the slow but continuous illite percentage variations may reflect a second-order trend, even in deep water facies. These variations are correlatable with the manganese “second-order” variations described above.
2.3.5. Palynofacies (Steffen & Gorin, 1993).
Palynofacies analyses strongly support the definition of a second-order transgressive-regressive phase from the Upper Tithonian to the Uppermost Berriasian with a maximum transgressive in the sequence Be 3 in Berrias or Be 4 in Angles. In Berrias, the general trend of the different terrestrial fractions, the complete absence of PM1/2-B fragments in the upper part of Be 2 and in Be 3, the consistent occurrence of PM4-T from the topmost Be 2 to the MFS of Be 4, the important maximum in marine organisms at the Be 3 maximum flooding surface, as well as the presence of continental microflora in the uppermost part of the section (top Be 5 and Be 6-Be 7) would strongly support this interpretation.
The same general pattern in palynofacies distribution is recorded in the Angles section with the dominance of PM1/2-B and the presence of continental microflora in the lower part of the section (Ti 5 to Be 2), the presence of PM4-T and dinocysts from the base of Be 2, and the re-occurrence of continental microflora from the HST of Be 6 to the upper part of the studied interval. However, its more basinal location considerably smooths the continental influences in the upper part of the Angles section compared with the same interval in Berrias.
Increasing trends in Dinoflagellate abundance and diversity are often related to TST, with maxima generally at or in the vicinity of the MFS. However, punctual Dinoflagellate abundance and diversity peaks may also be recorded in lowstand and highstand condensed sections. Foraminiferal linings are not characteristic of a systems tract. They have been found to be abundant in lowstand, transgressive, and highstand systems tracts.
2.3.6. Palynology : Dinoflagellate biostratigraphy (Monteil,
1993).
The biostratigraphic definition of the carbonate-dominated Upper Tithonian-Berriasian interval is greatly improved by the Dinoflagellate zonation defined by Monteil (1992 and 1993). However, the quantitative distribution and the preservation of the dinocysts are strongly affected by the type of depositional system. Stacked slope fans in lowstand systems tracts are particularly unfavourable.
Four zones are defined in the studied interval :- Biorbifera johnewingii zone : its base is not precisely
defined but the index species is recorded in the Richteri Ammonite subzone in the Broyon Quarry;
— Dichadogonyaulax bensonii zone : its base is calibrated in sequence Be 2, in the Jacobi-Grandis Ammonite zone, in the Calpionellid zone B and in magnetozone M18. However, it may be slightly older as the Upper Tithonian and the base of the Berriasian of the three sections studied are characterized by stacked lowstands and unfavourable lithofacies;
— Foucheria modesta zone : its base is calibrated at the MFS of the sequence Be 4 in both the Angles and Berrias sections, in the Paramimounum Ammonite subzone, in the Calpionellid zone D1 and in the lowermost part of magnetozone M16n;
— Muderongia macwhaei Forma A subzone : its base is calibrated in the HST of Be 6 (Berrias) or at the basal SB of Be 7 (Angles), in the Callisto Ammonite subzone, in the Calpionellid zone D3, and in the thin magnetozone M15 (Berrias).
2.3.7. Calcareous nannoplankton (Gardin & Manivit, 1993).
The distribution of the calcareous nannoplankton seems strongly affected by the unfavourable lithological successions of the three sections studied. These preliminary results have to be improved by analyzing a larger number of samples.
Nannofossils seem to be sensitive to facies. In these carbonate-dominated sections, base and top occurrences of the index species rarely occur in stratigraphic positions comparable to the ones defined in the standard zonation of Bralower et al. (1989).
They are rarely correlatable between the three sections. However, the species characterizing the Upper Tithonian - Berriasian are present, and the analysis of additional samples will most probably calibrate more precisely the zones NJK, NK-1, NK-2A and NK-2B.
The following correlations between the nannofossil zonation and sequence-stratigraphic subdivisions are proposed :
— NJ-20B : not correlatable but observed in Broyon below SB Ti 4,
— base NJK : difficult to define because of unfavourable lithology both in Broyon and Angles,
— base NK-1 : certainly older than SB Be 2 (Broyon),— base NK-2A : most probably in the base of Be 2, in
the Jacobi-Grandis Ammonite zone. However, Bralower et al. (1989) defines the base of the NK-2A zone at the base of the Dalmasi Ammonite subzone and in the Calpionellid zone C,
- base NK-2B : is related to the transgressive systems tract or maximum flooding surface of the sequence Be 5, both in Berrias and Angles.
The sample distribution does not allow an accurate quantitative interpretation of the calcareous nannofossils in the Berrias section. Trends are observable in the upper part of the Angles section, in sequence Be 4 and above. In the marly facies, the quantitative curves (total abundance in calcareous nannoplankton, abundance in nannoconids, in pla- coliths, specific diversity) mostly show a similar evolution, but the sharpest contrasts are given by the nannoconid total abundance. Transgressive systems tracts and maximum flooding surfaces generally coincide with increasing and maximum abundance of Nannoconids whilst the HST show obvious decreasing trends. This curve pattern is not related to differences in lithology as samples have been regularly selected in the marly intervals of the marl-limestone alternations.

BCREDP 17 (1993) UPPER TITHONIAN-BERRIASIAN SEQUENCE - STRATIGRAPHIC MULTIDISCIPLINARY INTERPRETATION 169
3 GENERAL CONCLUSIONS 4. REFERENCES
Abundant observations converge to the definition of a minor second-order transgressive - regressive phase from the Upper Tithonian to the base of the Valanginian, with its maximum transgressive interval in sequence Be 3 in Berrias and Be 4 in Angles. The transgressive trend is defined by :
— a general increase of the manganese values,— the decrease of the palynofacies terrestrial compo-
nants, principally the disappearance of the continental microflora and PM1/2-B fragments, and the increase of the marine organic microfossils and PM4-T fragments,
— low illite content and a re-appearance of kaolinite observed throughout Western Europe.
These events seem clearly related to the MFS 131 my of the sequence LZB-1.5 as defined in the original cycle chart (version 3.1). The important regressive trend recorded from the Middle Kimmeridgian to the Early Valanginian clearly shows a short transgressive event in the Middle Berriasian. It is also correlatable with “a short-lived transgression during which water spilled southward into the non-marine Wessex basin to deposit the quasi-marine Cinder Bed and correlative Whitchurch Sands” (Rawson & Riley, 1982), a transgression which can be traced over much of Europe (Casey, 1963, 1973) and even in Greenland (Surlyk, 1973). This event is dated as intra-Koch/ Ammonite zone (Boreal zonation) by Rawson & Riley and as intra-Subalpina in the Tethysian Realm. This minor second-order cycle is superposed to the major regressive trend known from the Middle Kimmeridgian to the Early Valanginian.
A very good stratigraphic calibration of the third-order sequences is defined by magnetostratigraphy, Calpionellid, Ammonite, and Dinoflagellate zonations. It appears that even in carbonate-dominated sections, and with an adapted processing method, Dinoflagellates remain an excellent biostratigraphic tool, except in massive lowstand when they are composed essentially of mass flow deposits.
The precision of the information given by the different analytical specialities depends essentially on an adapted (''intelligent”) sampling. In most cases, the sample spacing can be defined after a preliminary sequence-stratigraphic interpretation of the section studied.
If the characterization of the third-order sequences, systems tracts and bounding surfaces is not systematic by any of the specialities, tentative models can be proposed for each of the disciplines; they appear clearly in a majority of the sequences, but there are some exceptions which remain as yet unexplained (assuming that the sequence-stratigraphic framework was established correctly). However, for financial, processing and analytical time-consuming reasons, disciplines such as clay mineralogy and geochemistry show more detailed information (due to the larger number of samples possibly processed and analyzed) than palynofacies, microfauna and microflora quantitative or biostratigraphic studies.
It is evident that general trends are observable. They may be particularly well expressed in these deep water carbonate facies and will be checked in the future in the overlying Valanginian to Barremian deep water reference sections of the same area. They also have to be checked in other types of environments, principally in shallow-water sections where basic parameters may vary rapidly, not only in a vertical section, but also laterally.
Allen, P. & Wimbledon, W.A. (1991). — Correlation of NW European Purbeck-Wealden (nonmarine Lower Cretaceous) as seen from the English type-areas. — Cretaceous Research, 12, 511-526.
Baudrimont, A.F. & Dubois, P. (1977). — Un bassin mésogéen du domaine péri-alpin : le sud-est de la France. — Bull. Centres Rech. Explor.-Prod. Elf Aquitaine, 1, 1, 261-308.
Bralower, T.J., Monechi, S. & Thierstein, H.R. (1989). — Calcareous nannofossil zonation of the Jurassic — Cretaceous boundary interval and correlation with the geomagnetic polarity timescale. — Marine Micropal., 14, 153-235.
Busnardo, R., Le Hégarat, G. & Magne, J. (1965). — Le stratotype du Berriasien. — Bur. Rech. géol. min., Mém. 34, 5-33.
Busnardo, R., Thieulloy, J.-P. & Moullade, M. (1979). — Hypostratotype mésogéen de l’étage Valanginien (sud- est de la France). — Ed. CNRS, Les stratotypes français, 6, 1-143.
Casey, R. (1963). — The down of the Cretaceous period in Britain. — Bull. S-E Union Scient., Sos, 117, 1-15.
Casey, R. (1973). — The ammonite succession in the Jurassic-Cretaceous boundary in Eastern England. — In : The Boreal Lower Cretaceous. — Geol. J. spec, issue, 5, 193-266.
Cecca, F, Enay, R. & Le Hégarat, G. (1989). — L'Ardescien (Tithonique supérieur) de la région stratotypique : séries de référence et faunes (ammonites, calpionelles) de la bordure ardéchoise. — Doc. Lab. Géol. Fac. Sci. Lyon, 107, 1-115.
Curnelle, R. & Dubois, P. (1986). — Evolution mésozoïque des grands bassins sédimentaires français ; bassin de Paris, d’Aquitaine et du Sud-Est. — Soc. géol. France, (8), 2, 4, 529-546.
Darmedru, C., Cotillon, P. & Rio, M. (1982). — Rythmes climatiques et biologiques en milieu marin pélagique. Leurs relations dans les dépôts crétacés alternants du bassin vocontien (Sud-Est de la France). — Bull. Soc. géol. France, (7), 24, 3, 627-640.
Deconinck, J.-F. (1993). — Clay mineralogy of the Late Tithonian-Berriasian deep-sea carbonates of the Vocontian Trough (SE France) : relationships with sequence stratigraphy. — Bull. Centres Rech. Explor.- Prod. Elf Aquitaine, 17, 1, 223-234.
Dromart, G., Ferry, S. & Atrops, F (in press). — Removal of deep-water carbonates and relative sea-level changes : the Upper Jurassic-Lowermost Cretaceous of South-East France. — IAS Special publication.,
Emmanuel, L. (1993). — Apport de la géochimie des carbonates à la stratigraphie séquentielle. Application au Crétacé inférieur du domaine Vocontien. — Mém. Sc. Terre, Univ. P. & M. Curie, Paris, 95, 5, 191 pp.
Emmanuel, L. & Renard, M. (1993) — Carbonate geochemistry (Mn, 913C, d180) of the Late Tithonian-Berriasian pelagic limestones of the Vocontian Trough (SE France). — Bull. Centres Rech. Explor.-Prod. Elf Aquitaine, 17, 1, 205-221.
Galbrun, B., Rasplus, L. & Le Hégarat, G. (1986). — Données nouvelles sur le stratotype du Berriasien : corrélations entre magnétostratigraphie et biostratigraphie. — Bull. Soc. géol. France, (8), 2, 4, 575-584.
Gardin, S. & Manivit, H. (1993). — Upper Tithonian and Berriasian calcareous nannofossils from the Vocontian Trough (SE France) : biostratigraphy and sequence stratigraphy. — Bull. Centres Rech. Explor.-Prod. Elf Aquitaine, 17, 1, 277-289.

170 R. JAN DU CHÊNE, R, BUSNARDO, J. CHAROLLAIS, B, CLAVEL, J.-F. DECONINCK, L. EMMANUEL,S. GARDIN, G. GORIN, H. MANIVIT, E. MONTEIL, J.-F. RAYNAUD, M. RENARD, D. STEFFEN, N. STEINHAUSER,
A. STRASSER, C, STROHMENGER AND P.R. VAIL
BCREDP (17) 1993
Gorin, G. & Steffen, D. (1991). — Organic faciès as a tool for recording eustatic variations in marine fine-grained carbonates — example of the Berriasian stratotype at Berrias (Ardèche, France).— Paleogeogr., Palaeoclima- tol., Palaeoecol., 85, 303-320.
Hoedemaeker, P. (1987). — Correlation possibilities around the Jurassic-Cretaceous boundary. — Scripta geologica, 84, 1-55.
Le Hégarat, G. (1973). — Le Berriasien du Sud-Est de la France. — Doc. Lab. Géot. Fac. Sci. Lyon, 43, 575 pp.
Le FIégarat, G. (1980). — Le Berriasien. — In : Cavelier, C. & Roger, J. (Coord.); Les étages français et leur stratotype. — Bur. Rech. géol. min., Mém. 109, 65-105.
Le Hégarat, G. & Remane, J. (1968). — Tithonique supérieur et Berriasien de l’Ardèche et de l’Hérault. Corrélation des ammonites et des calpionelles. — Geobios, 1, 7-70.
Le Hégarat, G. & Ferry, S. (1990). — Le Berriasian d’Angles. — Geobios, 23, 3, 369-373.
Monteil, E. (1992a). — Quelques nouvelles especes-index de kystes de dinoflagellés (Tithonique-Valanginien) du sud-est de la France et de l’ouest de la Suisse.— Rev. PaiéobioL, 11, (Genève), 273-297.
Monteil, E. (1992b). — Kystes de dinoflagellés index (Tithonique-Valanginien) du sud-est de la France. Proposition d’une nouvelle zonation palynologique.— Rev. PaiéobioL, 11, 1 (Genève), 299-306.
Monteil, E. (1993). — Dinoflagellate cyst biozonation of the Tithonian and Berriasian of South-East France. Correlation with the sequence stratigraphy. — Bull. Centres Rech. Explor.-Prod. Elf Aquitaine, 17, 1, 249-273.
Ogg, J.G., Hasenyager II, R.W., Wimbledon, W.A., Channel, J.T. & Bralower, T.J. (1991). — Magnetostratigraphy of the Jurassic-Cretaceous boundary interval — Tethyan and English faunal realms. — Cretaceous Research, 12, 455- 482.
Ogg, J.G., Hasenyager II, R.W. & Wimbledon, W.A. (in press). — Jurassic-Cretaceous boundary : Portland - Purbeck magnetostratigraphy and possible correlation to the Tethyan faunal realm. — Intern. Symp. Jurassic stratigraphy, Poitiers, Sept. 91.
Rawson, P.F., Curry, D., Dilley, F, Hancock, J., Kennedy, W.,
Neale, J., Wood, C. & Worssam, B. (1978). — A correlation of Cretaceous rocks in the British Isles. — Geol. Soc. London, Special rep. 9, 70 pp.
Rawson, P.F. & Riley, L.A. (1982). — Latest Jurassic-Early Cretaceous events and the “Late Cimmerian unconformity” in North Sea area. — Bull. amer. Assoc. Petroleum Geol., 66, 12, 2628-2648.
Rioult, M., Dugue, O., Jan Du Chêne, R., Ponsot, C., Fily,
G., Moron, J.M. & Vail, P. (1991). — Outcrop sequence stratigraphy of the Anglo-Paris Basin, Middle to Upper Jurassic (Normandy, Maine, Dorset). — Bull. Centres Rech. Explor.-Prod. Elf Aquitaine, 15, 1, 101-194.
Steffen, D. & Gorin, G. (1993). — Palynofacies of the Upper Tithonian-Berriasian deep-sea carbonates in the Vocontian Trough (SE France). — Bull. Centres Rech. Explor.-Prod. Elf Aquitaine, 17, 1, 235-247.
Strohmenger, C. & Strasser, A. (1993). — Eustatic controls on the depositional evolution of Upper Tithonian and Berriasian deep-water carbonates (Vocontian Trough, SE France). — Bull. Centres Rech. Explor.-Prod. Elf Aquitaine, 17, 1, 183-203.
Surlyk, F. (1973). — The Jurassic-Cretaceous boundary in Jameson Land, East Greenland. — In : The Boreal Lower Cretaceous. — Geol. J. spec, issue, 5, 81-100.
Vail, P.R., Audemard, F, Bowman, S.C., Eisner, P.N., Perez-
Cruz, G. (1991) — The stratigraphic signatures of Tectonics, Eustacy and Sedimentation. — In: Einsele, G., Ricken, W. & Seilacher, A. (eds ); Cycles and events in stratigraphy. — Springer-Verlag, 617-659.
PLATE
The Broyon Quarry.
Pig _The Broyon Quarry : general view. The Upper Tithonian interval consists of a cliff of massive fine-grained limestones(12-15) with local intercalations of breccias. The Berriasian part of the section displays limestone-marl alternations (19-30).
2. — Berriasian of the Broyon Quarry. Bed 18 (black) is interpreted as the LSW of the sequence Be 1. The bed 18(white) corresponds to the thin transgressive beds 18B and C characterized by a fossiliferous breccia regionally known as “Horizon de La Boissière" or “Brèche de Chomerac”. Above (beds 19-26), the Jacobi-Grandis zone consists of marls and marly limestone.
3. — Berriasian of the Broyon Quarry. Detail of the Jacobis-Grandis and Subalpina (base) interval.

BCREDP 17 (1993) R. JAN DU CHÊNE, R. BUSNARDO, J. CHAROLLAIS, B. CLAVEL, J,-F. DECONINCK, L EMMANUEL, 171S. GARDIN, G. GORIN, H. MANIVIT, E. MONTEIL, J,-F, RAYNAUD, M. RENARD, D. STEFFEN, N. STEINHAUSER,
A. STRASSER, C. STROHMENGER AND P.R. VAIL. - UPPER TITHONIAN-BERRIASIAN SEQUENCE - STRATIGRAPHIC MULTIDISCIPLINARY INTERPRETATION :Plate 1

172 R. JAN DU CHÊNE, R, BUSNARDO, J. CHAROLLAIS, B. CLAVEL, J.-F, DECONINCK, L. EMMANUEL,S. GAROIN, G. GORIN, H. MANIVIT, E, MONTEIL, J.-F, RAYNAUD, M. RENARD, D. STEFFEN, N. STEINHAUSER,
A. STRASSER, C. STROHMENGER AND P,R, VAIL
BCREDP (17) 1993
PLATE L-
The Berriasian stratotype.
Fig. 1. —Base of the section with SB (Be 1) in between beds 138-139.2. — Detail of bed 143 (slope fan) with SB (Be 2) at its base.3. — Detail of bed 150 (erosive and channelized breccia representing multiple debris flows) with SB (Be 4) at its base.
4. — Detail of beds 29 to 35 with the top lowstand surface of Be 4 in between 34 and 35.5. — Detail of beds 39 to 43 (FIST of sequence Be 4).

BCREDP 17 (1993) R. JAN DU CHÊNE, R. BUSNARDO, J. CHAROLLAIS, B. CLAVEL, J.-F, DECONINCK, L. EMMANUEL, 173S, GARDIN, G. GORIN, H. MANIVIT, E, MONTEIL, J.-F. RAYNAUD, M. RENARD, D. STEFFEN, N. STEINHAUSER,
A. STRASSER, C. STROHMENGER AND P.R. VAIL. - UPPER TITHONIAN-BERRIASIAN SEQUENCE - STRATIGRAPHIC MULTIDISCIPLINARY INTERPRETATION :Plate 2

174 R. JAN DU CHÊNE, R. BUSNARDO, J. CHAROLLAIS, B. CLAVEL, J.-F, DECONINCK, L. EMMANUEL,S. GARDIN, G. GORIN, H. MANIVIT, E. MONTEIL, J.-F. RAYNAUD, M. RENARD, D. STEFFEN, N. STEINHAUSER,
A, STRASSER, C. STROHMENGER AND P.R. VAIL
BCREDP (17) 1993
PLATE vJ
The Berriasian stratotype.
Fig, 1. —Condensed transgressive interval and highstand systems tract of sequence Be 2, with the MFS at the top of bed 146/11.
2. —Sequence boundary Be 5 at the base of bed 180.3. — General view of the lowstand prograding wedge and of the transgressive interval of sequence Be 4.

BCREDP 17 (1993) R. JAN DU CHÊNE, R. BUSNARDO, J. CHAROLLAIS, B. CLAVEL, J.-F. DECONINCK, L. EMMANUEL, 175S. GARDIN, G. GORIN, H. MANIVIT, E. MONTEIL, J.-F. RAYNAUD, M. RENARD, D. STEFFEN, N. STEINHAUSER,
A. STRASSER, C. STROHMENGER AND P.R. VAIL. - UPPER TITHONIAN-BERRIASIAN SEQUENCE - STRATIGRAPHIC MULTIDISCIPLINARY INTERPRETATION :Plate 3

176 R. JAN DU CHÊNE, R. BUSNARDO, J. CHAROLLAIS, B, CLAVEL, J.-F. DECONINCK, L. EMMANUEL, BCREDP (17) 1993S. GARDIN, G. GORIN, H. MANIVIT, E, MONTEIL, J.-F. RAYNAUD, M. RENARD, D. STEFFEN, N. STEINHAUSER,
A. STRASSER, C. STROHMENGER AND P.R. VAIL
PLATE 4The Angles reference section.
Fig. 1. —General view of the Late Jurassic-Earliest Cretaceous transition in the Angles area.2. —The Jurassic-Cretaceous boundary in the Angles reference section (between 67 and 68). It corresponds to SB
(Be 1) and is precisely correctable with the Broyon Quarry.3. —The intersection of road N207 (Saint-André-des-Alpes, Nice) and road D33 to Angles with beds 78 to 86.4. — Beds 85-95 : This part of the section is strongly disturbed by massive slumps (bed 88-89). The upper part of
Calpionellid zone B, as well as zone C and lower part of D1 are missing. The top of sequence Be 2 and the whole Be 3 are therefore absent (eroded or not deposited).

BCREDP 17 (1993) R. JAN DU CHÊNE, R. BUSNARDO, J. CHAROLLAIS, B. CLAVEL, J.-F. DECONINCK, L. EMMANUEL, 177S. GARDIN, G. GORIN, H. MANIVIT, E. MONTEIL, J.-F. RAYNAUD, M. RENARD, D. STEFFEN, N. STEINHAUSER,
A. STRASSER, C. STROHMENGER AND P.R. VAIL. - UPPER TITHONIAN-BERRIASIAN SEQUENCE - STRATIGRAPHIC MULTIDISCIPLINARY INTERPRETATION :Plate 4

178 R. JAN DU CHÊNE, R. BUSNARDO, J. CHAROLLAIS, B. CLAVEL, J.-F. DECONINCK, L. EMMANUEL, BCREDP (17) 1993S, GARDIN, G. GORIN, H, MANIVIT, E. MONTEIL, J.-F RAYNAUD, M. RENARD, D. STEFFEN, N. STEINHAUSER,
A. STRASSER, C. STROHMENGER AND P.R. VAIL
PLATE 5The Angles reference section.
Fig. 1-3. — Lithological succession through the sequence Be 4. Correlation with sequence-stratigraphic interpretation (see also Plate 6 for comparison with lithological log).A maximum flooding surface is recognized in bed 102, bituminous marlstones being recorded from beds 99 to 105. Five parasequences tentatively related to the 100,000 year Milankovitch cycles, are observed (beds 103 to 119) in the highstand systems tract.

BCREDP 17 (1993) R. JAN DU CHÊNE, R. BUSNARDO, J, CHAROLLAIS, B. CLAVEL, J.-F. DECONINCK, L EMMANUEL, 179S. GARDIN, G, GORIN, H, MANIVIT, E. MONTEIL, J.-F. RAYNAUD, M. RENARD, D, STEFFEN, N, STEINHAUSER,
A. STRASSER, C. STROHMENGER AND P,R. VAIL. - UPPER TITHONIAN-BERRIASIAN SEQUENCE - STRATIGRAPHIC MULTIDISCIPLINARY INTERPRETATION :Plate 5
SEQUENCESTRATIGRAPHY
HIGH STAND SYSTEMS
TRACTMFS
TRANSGRESSIVE
LOWSTANDPROCRADING
WEDGE
LOWSTAND SLOPE FAN
SB (Bt 5) 129.7
HIGHSTAND
SYSTEMSTRACT
_ .MFS— _
SYSTEMSTRACT
TUWgraNP~PROGRADING ___WEDGE___
US
114
112111
les
iss
102
90K
«1?
LOWSTAND SLOPE FANSB (Be 3 + 4)
133+131.5
LOWSTANDPROGRADING
WEDGE
SB (Be 2) 133.5

180 R. JAN DU CHÊNE, R. BUSNARDO, J. CHAROLLAIS, B, CLAVEL, J.-F. DECONINCK, L. EMMANUEL,S. GARDIN, G. GORIN, H, MANIVIT, E. MONTEIL J,-F. RAYNAUD, M. RENARD, D. STEFFEN, N. STEINHAUSER,
A, STRASSER, C. STROHMENGER AND P.R. VAIL
BCREDP (17) 1993
PLATE 6The Angles reference section.
Fig. 1-3. —Lithological succession through the upper part of sequence Be 4 and through the whole sequence Be 5. Comparison with the lithological log (see also Plate 5 for correlation with the sequence-stratigraphic interpretation). The base of depositional sequence Be 5 (SB Be 5 is between beds 119 and 120) is characterized by a channelized interval (slump S2 of Le Hégarat & Ferry, 1990; beds 120-124). The successive overlying systems tracts are tentatively defined by the overall bedding features : the lowstand prograding wedge is characterized by relatively thick limestone beds (125-130); a condensed transgressive systems tract is recognized in a thin limestone bed rich in Ammonites and Calpionellids (131A); the highstand systems tract consists of a succession of relatively thick limestone beds of uniform thickness.

BCREDP 17 (1993) R. JAN DU CHÊNE, R. BUSNARDO, J. CHAROLLAIS, B. CLAVEL, J.-F. DECONINCK, L EMMANUEL, 181S. GARDIN, G. GORIN, H. MANIVIT, E. MONTEIL, J.-F. RAYNAUD, M. RENARD, D. STEFFEN, N. STEINHAUSER,
A. STRASSER, C. STROHMENGER AND P.R. VAIL. - UPPER TITHONIAN-BERRIASIAN SEQUENCE - STRATIGRAPHIC MULTIDISCIPLINARY INTERPRETATION :Plate 6

EUSTATIC CONTROLS ON THE DEPOSITIONAL EVOLUTION OF UPPER TITHONIAN AND BERRIASIAN DEEP-WATER CARBONATES (VOCONTIAN TROUGH, SE FRANCE)
CONTRÔLE EUSTATIQUE DES DÉPÔTS CARBONATÉS PROFONDSD’ÂGE TITHONIQUE SUPÉRIEUR À BERRIASIENDE LA FOSSE VOCONTIENNE (SUD-EST DE LA FRANCE)
Christian STROHMENGER and André STRASSER
STROHMENGER, C. & STRASSER, A. (1993). - Eustatic controls on the depositional evolution of Upper Tithonian and Berriasian deep-water carbonates (Vocontian Trough, SE France). [Contrôle eustatique des dépôts carbonates profonds d'âge tithonique supérieur à berriasien de la Fosse Vocontienne (sud-est de la France)].— Bull. Centres Rech. Explor.-Prod. Elf Aquitaine, 17, 1, 183-203, 4 fig., 4 pl.; Boussens, June 24, 1993. - ISSN : 0396-2687. CODEN : BCREDP,L’évolution sédimentologique et séquentielle des couches carbonatées et des
alternances marno-calcaires du Tithonique supérieur et du Berriasien a été étudiée dans trois localités (Broyon, Angles et Berrias) du domaine de la Fosse Vocontienne (sud-est France).
Les roches carbonatées fournissent un assemblage de fossiles typiques pour les milieux hémipélagiques à pélagiques (Radiolaires, Calpionelles, calcisphères, Globochètes, spicules d'éponge, filaments, Aptychi, Saccocoma, nannoplancton). Trois types de faciès ont été définis :
— faciès I : wackestones fossilifères (boue de périplate-forme);— faciès 11 m/l Id : wackestones/floatstones à intraclastes et
fossiles (coulées de boue et/ou de débris);— faciès III : grainstones/rudstones à intraclastes et fossiles (coulées de grains). Le type de faciès I représente des dépôts marins profonds autochtones. Les
coulées gravitaires monomictiques (types de faciès II et III) se forment probablement lors de l’effondrement du talus carbonaté à bas niveau marin relatif (cortèges de bas niveau).
L’analyse de faciès et les observations de terrain (géométrie des bancs, empilement des couches marneuses et carbonatées), ainsi que les résultats obtenus par les autres disciplines présentées dans ce volume, démontrent que l’évolution sédimentologique et séquentielle des formations étudiées est contrôlée surtout par des fluctuations du niveau marin de troisième ordre (coupes de Broyon, Angles et Berrias), mais localement aussi par la tectonique synsédimentaire (Broyon).
Des séquences d’ordres supérieurs dans la bande de fréquence de Milankovitch ont été identifiées dans les cortèges de bas niveau (prismes progradants) et de haut niveau à Angles et à Berrias.Christian Strohmenger, BEB Erdgas und Erdôl GmbH, Riethorst 12, D-3000 Hannover
51; André Strasser, Institut de Géologie, Pérolles, CH-1700 Fribourg. - October 21, 1992.
Mots-clefs : Roche carbonatée, Tithonique, Berriasien, Microfaciès, Eustatisme (Stratigraphie séquentielle), Sédimentation pélagique, Tectonique synsédimentaire, Coupe type, Ecoulement gravitaire, Bassin Vocontien, Ardèche (Berrias, Broyon), Alpes de Flaute-Provence (Angles).
0396-2687/93/0017-0183 $ 4.20 © 1993 elf aquitaine production, F-31360 Boussens

184 C. STROHMENGER AND A. STRASSER BCREDP 17 (1993)
ABSTRACT
Sedimentology and sequence stratigraphy of Upper Tithonian and Berriasian carbonate beds and carbonate-marlstone alternations have been studied at three different localities (Broyon, Angles and Berrias), in the realm of the Vocontian Trough (SE France).
The carbonate rocks yield an unequivocal hemlpelagic to pelagic fossil assemblage (Radiolarians, Calpionellids, calcisphaerulids, Globochaetids, sponge spicules, filaments, Aptychi, Saccocoma and nannoplankton). They can be subdivided into three facies types :
— facies type I : fossil wackestones (periplatform ooze);— facies type llm/lld : intraclast-fossil wackestones/floatstones
(mud and/or debris flows);— facies type III : intraclast-fossil grainstones/rudstones (grain
flows).Facies type I represents autochthonous deep-marine deposits,
whereas the monomictic mass-flow breccias (facies types II and III) record the collapse of the carbonate slope during relative sea- level lowstands (lowstand systems tracts).
Facies analysis and field observations (bed geometries, stacking pattern of carbonate and marlstone beds), together with the results of the other studies presented in this volume, show that the sedi- mentological and sequential development of the studied formations is mainly controlled by third-order sea-level variations (Broyon, Angles and Berrias sections) and, in some cases, also by synse- dimentary tectonics (Broyon section).
Fligher-order sequences inferred to be in the Milankovitch frequency band could be identified within lowstand (prograding wedges) and highstand systems tracts at Angles and Berrias.
Key words : Carbonate rocks, Tithonian, Berriasian, Microfacies,Eustasy (Sequence stratigraphy), Pelagic sedimentation, Synse-dimentary tectonics, Type sections, Gravity sliding, Vocontian Basin, Ardèche (Berrias, Broyon), Alpes de Plaute-Provence (Angles).
CONTENTS
INTRODUCTION.......................................................................... 1841. - FACIES ANALYSIS............................................................ 185
1.1. Facies type I............................................................... 1851.2. Facies type II (llm/lld)............................................... 1861.3. Facies type III............................................................. 186
2. - SEDIMENTOLOGICAL CONCEPTS FOR THE SEQUENCE-STRATIGRAPHIC INTERPRETATION................ 1862.1. Lowstand systems tracts........................................... 186
2.1.1. Lowstand basin floor fans............................. 1872.1.2. Lowstand slope fans...................................... 1872.1.3. Lowstand prograding wedges...................... 187
2.2. Transgressive surfaces.............................................. 1872.3. Transgressive systems tracts.................................... 1872.4. Maximum flooding surfaces...................................... 1872.5. Highstand systems tracts.......................................... 1872.6. Sequence boundaries................................................ 187
3. - TITHONIAN/BERRIASIAN STRATA FROM BROYON........ 1883.1. Sequential development............................................ 188
3.1.1. Tithonian strata................................................ 1883.1.2. Berriasian strata.............................................. 1883.1.3. Tectonic control of Tithonian/Berriasian strata. 189
4. - TITHONIAN/BERRIASIAN STRATA FROM ANGLES.......... 1894.1. Sequential development............................................. 189
4.1.1. Tithonian strata................................................ 1894.1.2. Berriasian strata.............................................. 189
5. - BERRIASIAN STRATA FROM BERRIAS (BERRIASIANSTRATOTYPE)....................................................................... 1915.1. Sequential development............................................. 191
6. - CONCLUSIONS................................................................... 193
7. - REFERENCES................................................................. 194
INTRODUCTION
Upper Jurassic and Lower Cretaceous bedded carbonate rocks and carbonate-marl alternations are well exposed in the realm of the Vocontian Trough (southern Subalpine chains) in southeast France. The sedimentology and sequence stratigraphy of Upper Tithonian and Berriasian strata has been studied at three classic localities (Fig. 1) :
— at the Berriasian stratotype section of Berrias (western border of the Vocontian Trough : hemipelagic outer platform deposits);
Figure 1
Location map of the three studied sections.

BCREDP 17 (1993) VOCONTIAN TROUGH : EUSTATIC CONTROLS ON DEPOSITION OF DEEP-WATER CARBONATES 185
— at Angles (eastern Vocontian Trough : pelagic basin deposits);
— at Broyon (northwestern edge of the Vocontian Trough : hemipelagic slope deposits).
Detailed descriptions of localities and lithologies have been published by Le Hégarat (1965) and Médioni et al. (1984). The biostratigraphy Is well established by Ammonites and Calpionellids (busnardo et al., 1965; Le Hégarat & Remane, 1968; Le Hégarat, 1973, 1980; Galbrun et al., 1986; Cecca et al., 1989; Le Hégarat & Ferry, 1990).
The fossil content of the carbonates (planktonic organisms such as Radiolarians, Calpionellids, Globochaetids, calcispheres and nannoplankton) clearly identifies them as deep-marine, hemipelagic to pelagic deposits (Jenkyns, 1978; Scholle et al., 1983; McIlreath & James, 1984).
Predominantly fine-grained, monotonous limestone beds (fossil wackestones) with marlstone interbeds may locally grade upwards into coarse-grained, massive carbonate beds (intraclast-fossil wackestones/floatstones and intraclast-fossil grainstones/rudstones) that record resedimentation (mud flows, debris flows and grain flows). The common occurrence of channelized intervals further suggests episodic gravity-induced disturbance of sedimentation.
This study shows how sedimentary textures (e.g. wackestones vs floatstones/rudstones), structures (e.g. hard- grounds, bioturbation) and stratonomy (e.g. varying bed and interbed thicknesses, bed continuity) of deep-water carbonate deposits reflect eustatic sea-level variations, as well as synsedimentary regional tectonics. In many cases, the sedimentological analysis alone is not sufficient to clearly identify depositional sequences and systems tracts. Information from the other studies presented in this volume has been integrated in order to obtain a better idea of the evolution of the sedimentary system.
The sequence stratigraphy of the Upper Tithonian and the Berriasian was mainly established during a field trip in June 1991 by P.R. Vail and the Working Group for the Lower Cretaceous of the Vocontian Trough (Members in alphabetical order : R. Busnardo, J. Charollais, B. Clavel, J.-F. De- coninck, L. Emmanuel, S. Gardin, G. Gorin, R. Jan Du Chêne, H. Manivit, E. Monteil, J.-F. Raynaud, M. Renard, D. Steffen, N. Steinhauser, A. Strasser & C. Strohmenger).
The version presented here (Broyon, Angles and Berrias sections) was finalized in Paris in December 1991 by J.-F. Deconinck, G. Gorin, R. Jan Du Chêne, T. Jacquin, M. Renard, D. Steffen, C. Strohmenger & P.R. Vail (alphabetical order).
1 — FACIES ANALYSIS
Periplatform, hemipelagic to pelagic carbonates are ubiquitous deposits occurring around shallow-water carbonate platforms (Mullins, 1986). They are produced by open- ocean planktonic organisms as well as by platform-derived carbonate sediment (Wilson, 1975; Flügel 1982).
The preservation potential of periplatform ooze (Schlager & James, 1978) is controlled by bottom currents (winnowing
of fine-grained sediment), sediment gravity flows (erosion and/or dilution of fine-grained sediment), and the carbonate compensation depth (CCD, dissolution of carbonate material). In oxygenated environments, these carbonates are often intensely bioturbated.
Deep-marine conditions are influenced by sea-level variations (e.g. polytaxic vs oligotaxic times), climate changes and plate tectonics (Fischer & Arthur, 1977; Davies & Wors-
ley, 1981; Beard et ai, 1982; Mullins, 1983; Wilkinson et ai, 1985; Bottjer et ai, 1986). For recent reviews of pelagic carbonate sediments see Scholle et al. (1983), Mullins
(1986) and Tucker & Wright (1990).
Platform slopes represent the transition between platform margin and basin. Slopes range from very gentle (about0.5°) to extremely steep or near-vertical. Characteristic sediments comprise fine-grained pelagic oozes (slowly deposited pelagic carbonate “rain”) as well as slope- and/or platform-derived, resedimented material (rapidly deposited mass flows).
Modern analogs show that carbonate platforms, in contrast to their siliciclastic counterparts, act as line sources of sediment which is transported by gravity flows towards the deeper-water environment (Schlager & Chermak, 1979). For references on modern and ancient carbonate shelf-slope breaks as well as on slope deposits (slumps, mass-flow breccias, turbidites) see Mullins & Neumann (1979), Nardin
et ai (1979), Kelts & Arthur (1981), Hine & Mullins (1983), James & Mountjoy (1983), Cook & Mullins (1983), Read
(1985) and Einsele (1991).
Facies analysis based on petrography of samples of carbonates from the three studied sections (130 thin sections) allows the recognition of three facies types :
— type I : fossil wackestones, representing predominantly autochthonous deposits (periplatform ooze);
— type II : intraclast-fossil wackestones/floatstones, representing mud-flow (facies type llm) and debris-flow (facies type lid) deposits;
— type III : intraclast-fossil grainstones/rudstones, representing grain-flow deposits (fluxoturbidites).
The description of the facies types is based on the classification proposed by Dunham (1962), with supplements by Embry & Klovan (1972).
The small number of different facies is typical of the deep-water environment. Field observations are critical in interpreting the sedimentological record of varying deep- marine conditions. This is why stratal geometries have also been integrated in the facies analysis.
The studied sections show undisturbed limestone and marlstone alternations, massive limestone beds, slumped limestone beds, as well as discontinuous limestone beds interpreted as channelized intervals. Vertical changes in facies and stacking patterns of the different bed types reflect changes in relative sea level.
1.1. FACIES TYPE IFossil wackestones
The wide variety of pelagic fossils such as Radiolarians (PI. 1, fig. 1), Calpionellids, calcisphaerulids, sponge spicules, Aptychi, planktonic Crinoids (Saccocoma, PI. 1, fig. 2) and Globochaetids (Globochaete alpina) characte-

186 C. STROHMENGER AND A. STRASSER BCREDP 17 (1993)
rizes this facies. Scanning electron microscopy shows abundant nannoplankton (Nannoconus), which supports the deep-water origin of this facies (PI. 1, fig. 3-6).
Bioturbation as well as burrows (Zoophycos, Planolites, Chondrites) are common features within the described limestones and suggest a well oxygenated bottom environment.
The fossil wackestones are interpreted as forming by the more or less continuous “rain” of sediment provided by planktonic organisms, with only minor platform-derived carbonate mud.
These wackestones may be deposited during relative sea-level highstands (thin limestone beds), when the flooding of continental shelves tends to trap the bulk of carbonate sediment near shore, causing decreased deep-sea accumulation rates (Scholle et al., 1983). They may also represent relative sea-level lowstands (thick limestone beds, channelized sections), when carbonate production is shifted basinward and a lowered CCD permits high carbonate accumulation rates in the deep-marine environment (Milliman,1974).
1.2. FACIES TYPE II (llm/lld)Intraclast-fossil wackestones/floatstones
This facies is characterized by subangular to subrounded limestone clasts with dominant mud-supported, and locally grain-supported textures (PI. 2, fig. 1-3). The clasts as well as the background sediment contain a typical hemipelagic to pelagic fossil assemblage, comparable to that of facies type I : Radiolarians, Foraminifera, Calpionellids, calcisphae- rulids, sponge spicules, Aptychi, planktonic Crinoids (Sac- cocoma) and Globochaetids (Globochaete alpina).
Facies type II is interpreted as mass-flow breccias (Schla- ger & Schlager, 1973). Monomictic clasts of different sizes were derived from older sediments within the basin (intraclasts; PI. 3, fig. 1-2). The occurrence of Pelecypod tests (Pycnodontids) and Gastropods of shallow-water origin supports this interpretation (PI. 3, fig. 3).
Mud-flow dominated deposits (facies type llm) locally grade into debris-flow dominated deposits (facies type lid). There is no sharp boundary between the two end members (for discussion see Einsele, 1991).
These submarine mass-flow breccias are interpreted to represent relative lowstands of sea-level (lowstand slope fans and/or lowstand prograding wedges), but may also form during tectonic activity (Füchtbauer & Richter, 1983; Eberli, 1991).
1.3. FACIES TYPE III Intraclast-fossil grainstones/rudstones
This facies consists of subangular to rounded limestone clasts and fossils (PI. 2, fig. 4). The grain-supported texture indicates high water energy and winnowing of lime mud during deposition.
The biota is dominated by Echinoderm plates and Pelecypod tests (Pycnodontids; PI. 3, fig. 4-6). Echinoderms are indicative of an open-platform, stenohaline environment, and their presence in a deeper-marine environment indicates their allochthonous character. The intraclasts contain a typical deep-marine, pelagic fossil assemblage, proving that
they derived from within the periplatform environment and not from the adjacent platform.
The intraclast-fossil grainstones and rudstones are interpreted as channelized grain-flow deposits by passing a steep slope (Einsele, 1991) during relative sea-level low- stands. They may correspond to the fluxoturbidites described by Schlager & Schlager (1973).
In carbonate-dominated environments, mass flows are most likely to occur at the beginning of a fall in relative sea-level (Sarg, 1988; Haq, 1991; Vail et al., 1991). We therefore interpret the massive fluxoturbidites as channelized lowstand deposits, that possibly correspond to basin floor fans.
Thin-bedded grain flows may, however, occur throughout the lowstand systems tracts (lowstand slope fans and low- stand prograding wedges).
2 — SEDIMENTOLOGICAL CONCEPTS FOR THE SEQUENCE-STRATIGRAPHIC INTERPRETATION
Sedimentological interpretations and the proposed sequential subdivision of the studied sections are not only based on facies analysis, but also on the geometric relationships of the strata and their stacking patterns (Vail et al., 1977, 1987; Haq, et al., 1987, 1988; Van Wagoner et al.. 1987, 1988, 1990).
2 1 LOWSTAND SYSTEMS TRACTS
Studies of modern periplatform environments such as the Bahamas show that off-bank transport of both coarse- and fine-grained sediment tends to occur during relative highstands of sea-level (“highstand shedding”), when carbonate platforms are flooded (Boardman & Neumann, 1984; Droxler & Schlager, 1985; Boardman et ai, 1986; Wilber et at, 1990; Grammer & Ginsburg, 1992).
Intercalations of platform-derived material (such as bioclasts and ooids) within deep-marine sediments may represent prograding late highstand deposits (Eberli & Ginsburg, 1989; Everts, 1991), when the platform is still flooded but relative sea-level is falling. However, they may equally correspond to early lowstand deposits (Haq, 1991), when carbonate sediments are still uncemented and excavated from the exposed platform (“lowstand flushing”, Vail pers. com., 1991).
Jacquin et al. (1991) concluded that the carbonate platform In the southern Vercors (France) supplied clastic material to the basin during periods of relative sea-level falls and lowstands.
Schlager (1991) showed that non-skeletal grains (e.g. peloids and ooids) are abundant mainly in turbidites of interglacial times when sea-level was high, whereas skeletal grains occur predominantly during glacial times.

BCREDP 17 (1993) VOCONTIAN TROUGH : EUSTATIC CONTROLS ON DEPOSITION OF DEEP-WATER CARBONATES 187
Major sea-level falls enhance the erosion potential in the deep-marine environment, due to steepened gradients, increased sediment load and increased frequency of mass flows as well as turbidity and contour currents (Van Wagoner
et ai, 1988, 1990; Sarg, 1988; Haq, 1991).
The observed mass-flow breccias (facies types llm/lld and III) are built up by clasts clearly derived from the deep slope environment. Only some fossils (e.g. Echinoderm fragments) indicate platform-derived material. This seems to indicate a situation where the platform is exposed and hemipelagic to pelagic material is redeposited (Reijmer &
Everaas, 1991; Reijmer et at., 1991),
2.1.1. Lowstand basin floor fans
Basin floor fans are interpreted as resulting from the collapse of the platform margin during sea-level lowstand (Vail
et at., 1991). In the studied area, massive intercalations of facies type III (intraclast-fossil grainstones/rudstones, fluxo- turbidites) may correspond to lowstand basin floor fans.
2.1.2. Lowstand slope fans
Predominantly channelized intervals (channelized mud turbidites and/or distal mud flows) displaying facies type I (fossil wackestones) as well as mud flows (facies type llm), debris flows (facies type lid), thin-bedded grain flows (facies type III) and slumped sections are interpreted as slope fan deposits.
2.1.3. Lowstand prograding wedges
In deep-marine environments, carbonate sedimentation rates increase during times of low relative sea-level due to massive blooms of planktonic organisms and lowered CCD (Milliman, 1974; Davies & Worsley, 1981; Scholle et at., 1983; Haq, 1991). An increased terrigenous input of clay is indicated by thick marlstone beds (Haq, 1991; Vail et al., 1991). Rapid progradation can lead to oversteepening and thus to gravity-displaced carbonates.
Thick-bedded limestone and thick marlstone intervals, channelized mud-flow, debris-flow and thin-bedded grain- flow deposits, as well as slumps may therefore correspond to lowstand prograding wedges (facies types I, llm/lld, III).
Wavy limestone beds interpreted as muddy contourites (Angles section, see below) may also be indicative of a low- stand prograding wedge.
Small sequences which may reflect Milankovitch cyclicity are thought to be characteristic of lowstand prograding wedge deposits (Angles and Berrias sections, see below).
2.2. TRANSGRESSIVE SURFACES
In the studied sections, transgressive surfaces could only be inferred from their spatial position between lowstand deposits (below) and transgressive deposits (above). No diagnostic sedimentological features could be observed.
2.3. TRANGRESSIVE SYSTEMS TRACTS
The increased carbonate production on platforms during transgressive and early highstand times causes carbonate depletion in the deep-marine environment (Berger & Winterer, 1974; Haq, 1991).
The increase of the water column therefore leads to a thinning-upward trend of hemipelagic and pelagic limestone beds (facies type I : fossil wackestones). Gravity-displaced material is relatively rare during sea-level rise. The occurrence of facies type llm (intraclast-fossil wackestones/floats- tones interpreted as mud-flow deposits) within the transgressive systems tract at Broyon (PI. 2, fig. 2) is thought to be controlled predominantly by tectonism.
Transgressive deposits are mainly inferred from their thinning-upward tendency due to the decrease in carbonate productivity.
2.4. MAXIMUM FLOODING SURFACES
The tops of thin limestone and/or marlstone beds that terminate intervals which show an obvious thinning-upward trend (transgressive systems tract) are interpreted as maximum flooding surfaces. In some cases (e.g. Broyon section), these surfaces are underlain by hardgrounds, concentrations of pyrite, and intense bioturbation.
2.5. HIGHSTAND SYSTEMS TRACTS
Early highstand deposits are starved in the deep basin, and typically do not form massive beds; instead, they are thin and fossil-rich (Vail et ai, 1991). Relative sea-level fall during late highstand results in a thickening-upward tendency of the limestone beds (facies type I).
Throughout the studied sections, highstand systems tracts are inferred from their spatial position between maximum flooding surface at the bottom (thin limestone beds) and sequence boundary (erosive surface) at the top.
Small-scale sequences suggesting a Milankovitch cyclicity occur within the highstand systems tracts at the Angles and Berrias sections (see below).
2.6. SEQUENCE BOUNDARIES
Erosive surfaces at the base of mass-flow breccias are interpreted as sequence boundaries. Indications of contour currents (muddy contourites) may also point to an underlying sequence boundary (Angles section).
In the following descriptions of the studied sections, sequence boundaries are labeled according to Jan Du Chêne
et at. (this volume).

188 C. STROHMENGER AND A. STRASSER BCREDP 17 (1993)
3 TITHONIAN/BERRIASIAN STRATA FROM BROYON
In the Broyon quarry (Ardèche area), a series of bedded limestones with minor marl intercalations at the base and marl-dominated deposits towards the top of the succession are well exposed (thickness: about 40m, lithological logs after Busnardo, Jan Du Chêne, Monteil & Steffen) (Fig. 2).
Based on Ammonites and Calpionellids (Cecca et at., 1989) the rock suite can be subdivided into Tithonian (base : bed dominated, about 20 m thick) and Berriasian (top : interbed dominated, about 20 m thick).
The limestones are mainly composed of facies type llm/lld (intraclast-fossil wackestones/floatstones; PI. 2, fig. 1-3) and facies type III (intraclast-fossil grainstones/rudstones; PI. 2, fig. 4). Facies type I (fossil wackestones) is relatively rare within the studied section. The fossil assemblage is typical of a deep-marine environment (Radiolarians, Calpionellids, Foraminifera, spicules, Saccocoma, calcisphaeru- lids, filaments, Aptychi and Globochaetids), but also shows
Broyon
• present «rare «frequent •abundant a present (not quantified)
Figure 2
Schematic geological column, petrographic characteristics and sequence-stratigraphic subdivision of the Broyon section.
displaced, shallow marine organisms such as Pelecypod tests (Pycnodontids), Echinoderm fragments and Gastropods (abundant within facies types II and III). Saccocoma occurs quite frequently within Tithonian deposits (PI. 1, fig. 2), whereas Calpionellids are concentrated in carbonate rocks of Berriasian age.
3.1. SEQUENTIAL DEVELOPMENT
3.1.1. Tithonian strata
The Tithonian is dominated by limestones representing gravity-displaced sediments, transported as mud flows (facies type llm) and/or debris flows (facies type lid) and, less commonly, by grain flows (facies type III).
The mud-dominated interval of beds 1A to 8 (mainly mud flows with dark intraclasts) including three thin-bedded debris flows (beds 1B, 7 and 8) and one thin-bedded grain flow (bed 1D) is thought to represent a lowstand prograding wedge. Only the sample on top of bed 1B displays a clearly pelagic sediment (facies type I) which might correspond to a short pelagic phase, intercalated in lowstand deposits.
A sequence boundary (Ti4), identified by an erosive surface (base of bed 10), separates these lowstand deposits from a superimposed massive breccia (bed 10 : channelized debris flows), interpreted as a slope fan (PI. 2, fig. 3). The overlying thin-bedded limestones (bed 11) may correspond either to a lowstand prograding wedge or to a highstand systems tract.
The interval between beds 12 and 17 is dominated by monomictic mud-flow deposits (facies type llm) with minor grain-flow intercalations (base of bed 12, above the inferred sequence boundary Ti5) and is interpreted as lowstand slope fan deposits. Sequence boundary Ti6 could not be identified. Most of the Tithonian strata is interpreted as stacked lowstand systems tracts.
3.1.2. Berriasian strata
Mud-flow deposits (bed 18A), interpreted as a lowstand prograding wedge, overlie a slightly erosive sequence boundary (Be1 : top of bed 17, limit between Tithonian and Berriasian).
A prominent hardground indicates a maximum flooding surface on top of the heavily bioturbated and ferriferous bed 18C (rich in pyrite rhombs; PI. 2, fig. 2) and separates inferred transgressive deposits (beds 18B and 18C : thinning-upward tendency) from overlying highstand deposits (bed 19).
The superimposed marlstone-limestone alternations (beds 20 to 28), displaying a thickening-upward tendency of marlstones, are interpreted as an interbed-dominated low- stand prograding wedge (Vail et al., 1991) The corresponding sequence boundary (Be2 : base of marlstone bed 20) does not exhibit any erosive features.
The overlying interval (bed 29) is not well exposed and could not be interpreted sedimentologically.
A sequence boundary (Be4 : base of bed 30) is implied by an overlying grain-flow deposit interpreted as fluxoturbi- dite (facies type III; PI. 2, fig. 4), which may represent a basin floor fan.

BCREDP 17 (1993) VOCONTIAN TROUGH : EUSTATIC CONTROLS ON DEPOSITION OF DEEP-WATER CARBONATES 189
3.1.3. Tectonic control of Tithonian/Berriasian strata
The rapid change from limestone-dominated stacked lowstand deposits (base of the section, Tithonian) to thin transgressive and highstand deposits and then to marlstone- dominated lowstand deposits (top of the section, Berriasian) is thought to be related not only to eustatic sea-level changes but also to tectonism. Regional, tectonically induced rapid subsidence of the sea floor (Dromart et al., 1993) may have created additional accommodation space in the Earliest Berriasian, and thus precluded enhanced carbonate production on the lowstand wedges.
Tectonic control of the carbonate succession of Broyon is also indicated by the predominance of mass-flow breccias throughout the Tithonian (FCichtbauer & Richter, 1983; Eberli, 1991).
4 — TITHONIAN/BERRIASIAN STRATA FROM ANGLES
An almost undisturbed pelagic Upper Tithonian to Bar- remian interval of bedded limestones and interbedded marlstones is well exposed near Angles. The alternations in strata correspond to cyclic changes of the marine environment forced by orbital parameters, as demonstrated (predominantly for Valanginian strata) by Cotillon et al. (1980), Cotillon & Rio (1984), Rio et al. (1989) and Cotillon (1989, 1991).
The present study considers the sedimentological and sequential development of Upper Tithonian (about 15m) and Berriasian (about 60m) strata (lithological logs after Steffen & Busnardo) (Fig. 3). Their biostratigraphy has recently been established through Calpionellids by Le Hégarat & Ferry (1990).
Facies analysis was carried out on limestone samples. The fossil assemblage is dominated by Calpionellids and Radiolarians. Spicules, Saccocoma, Foraminifera, calcis- phaerulids, Globochaetids (Globochaete alpina), filaments, Aptychi and Echinoderm fragments are also present.
Scanning electron microscopy shows that the bulk of the fine-grained matrix of the limestone beds (PI. 1, fig. 3-4), as well as of the marlstones (PI. 1, fig. 5-6), is composed of nannofossils (Nannoconus).
The occurrence of dolomite (corroded dolomite rhombo- hedra; PI. 1, fig. 4) may indicate early, deep-marine dolo- mitization of the calcareous ooze (Kelts & McKenzie, 1980; Garrison, 1981). Cold, calcite-undersaturated, but dolomite- supersaturated ocean water is thought to be responsible for the formation of authigenic dolomite in periplatform sediments (Saller, 1984; Saller et al., 1989; Mullins et al., 1985). The corrosion of the individual dolomite rhombs may be due to either near-surface or surface dedolomitization (exposure of the carbonate rocks), as described by De G root (1967).
4.1. SEQUENTIAL DEVELOPMENT
4.1.1. Tithonian strata
The Tithonian strata (base of the studied section, beds 60 to 67) is dominated by facies type llm/lld (mud flows
and/or debris flows) rich in allochthonous fossils of shallow-water origin (Pelecypod tests, Gastropods and Echinoderm fragments displaying syntaxial overgrowths). Chert nodules (rich in dolomite rhombs) are quite common (PI. 1, fig. 1).
Intercalations of fluxoturbidites (facies III : intraclast-fossil grainstones/rudstones) are found on top of bed 64B. Sedimentological characteristics (field observations and facies analysis) allow subdivision of this interval into :
— lowstand prograding wedge (beds 60 to 64A : mudflow dominated),
— sequence boundary Ti6, at the base of debris-flow deposit (bed 64B),
— lowstand slope fan (beds 64B and 65 : massive debris-flow and thin-bedded grain-flow deposits),
— lowstand prograding wedge (beds 66A to 67B : interval of thick-bedded to slightly irregular-bedded limestone beds with mud-flow deposit on top). Bed 66B is slumped.
4.1.2. Berriasian strata
The base of the Berriasian (bed 68) is characterized by a breccia which represents a massive fluxoturbidite deposit (facies type III : intraclast-fossil grainstones rudstones). Bed 68 is therefore thought to correspond to a basin floor fan, overlying an erosive, submarine surface interpreted as a sequence boundary (Be1 : top of bed 67, limit between Tithonian and Berriasian).
Limestone beds 69 to 75 are irregular in thickness and partly discontinuous. The interval may therefore represent submarine channel fills. Even if the facies analysis gives no indications of relative sea-level position (facies type I : fossil wackestones rich in Globochaetids), the configuration of the limestone beds justifies the interpretation as channelized slope fan deposits.
The interval between beds 78 to 87 (relatively thick-bedded limestone beds, probably displaying a submarine channel cut within bed 78) is again interpreted as a lowstand prograding wedge.
Sequence boundary Be2 is not exposed (Jan Du Chêne et al., Steffen & Gorin, this volume).
A renewed fall of sea-level is implied by the occurrence of a debris-flow deposit, also showing slump features (beds 88/89, facies type lid : intraclast-fossil wackestones/floats- tones), overlying inferred sequence boundaries Be3 and Be4 which are amalgamated (top of bed 87). The mass-flow breccia is interpreted as a lowstand slope fan (beds 88/89), overlain by a lowstand prograding wedge (relatively thick limestone beds 90 to 91).
It is only above these five stacked lowstand systems tracts that the limestones are commonly separated by marls- tone/claystone intercalations, indicating deeper marine conditions (transgression and relative highstand of sea- level).
Field observations make it possible to distinguish transgressive and highstand deposits between beds 92A and 119.

190 C. STROHMENGER AND A. STRASSER BCREDP 17 (1993)
The limestone beds show an obvious thinning-upward tendency as well as an increase in marlstone thickness up to the top of bed 102 (thick marl intercalation). Thin sections display facies type I (fossil wackestones) which is extremely bituminous in beds 99 to 105.
Beds 92A to 102 can therefore be interpreted as transgressive deposits. A maximum flooding surface (under- and overlain by bituminous limestones) is placed in marlstone bed 102. The overlaying highstand deposits (beds 103 to 119) comprise thickening-upward limestone beds.
The highstand deposits are further subdivided into five small-scale sequences which may reflect Milankovitch cyclicity (Milankovitch, 1941; Hays et ai, 1976; Imbrie & Imbrie, 1979; Berger, 1980; Berger et al., 1984; Algéo & Wilkinson, 1988). Each sequence is characterized by three to five limestone beds. Successive sequences are separated by more marly intercalations. The marly intercalations may be small- scale flooding events, whereas the limestone beds at the base of the cycles could correspond to relative falls of sea- level. Climatically controlled productivity cycles certainly played an important part in the formation of the limestone- marlstone alternations (Cotillon et ai, 1980; Cotillon, 1991).
A sequence boundary (Be5) on top of these highstand deposits (top of bed 119) is indicated by an overlying channelized (not slumped, cf. Le Hégarat & Ferry, 1990) interval (beds 120 to 124), interpreted as a lowstand slope fan (compare with beds 69 to 75).
The interval between beds 125 and 160 does not show unequivocal sedimentological indicators which allow a sequential subdivision. The interpretation is therefore based on results obtained from other disciplines (Jan Du Chêne et al., this volume), especially clay analysis (Deconinck, this volume).
Sedimentological criteria, however, support the proposed subdivision :
— lowstand prograding wedge (beds 125 to 130) characterized by relatively thick limestone beds (favored by low sea-level);
— relatively thin transgressive deposits (bed 131A : thin- bedded limestones rich in Calpionellids and Ammonites);
— maximum flooding surface at top of marlstone bed 131A (Deconinck, this volume);
— highstand deposits (beds 131B to 131F) displaying thick- and evenly-bedded limestones, separated by marl- and claystones (probably due to Milankovitch cyclicity);
— sequence boundary Be6 at the base of thick limestone bed 132 (Deconinck, this volume);
— lowstand prograding wedge (beds 132 to 141), characterized by relatively thick-bedded limestone-marlstone alternations (probably due to Milankovitch cyclicity);
— intense bioturbation (burrows) at the base of bed 151 indicates a maximum flooding surface (reduced sedimentation rate) which separates transgressive (beds 142 to 150) and highstand deposits (beds 151 to 160).
Sedimentological evidence for a sequence boundary at the top of bed 160 is given by field observations as well as facies analysis. The superjacent thin bed (about 10 cm thick) has a flat, sharp base and a wavy top (PI. 4, fig. 1). Marly sediment is concentrated in the troughs and thins upward towards the crests of the ripples. The wavy limestones
Angles I
• present «rare «frequent • abundant a present (not quantified)
Figure 3
Schematic geological column, petrographic characteristics and sequence-stratigraphic subdivision of the Angles section,
a : Angles I; b : Angles II; c ; Angles III.
are thoroughly bioturbated by unidirectional, inclined burrows of Zoophycos, ? Planolites and Chondrites. The Inclination of the different burrows may be primary or current induced, but is not the result of compaction.
It is possible that the wavy bedforms represent current ripples and indicate submarine muddy contour currents (Pickering et ai, 1986, 1989). The occurrence of such muddy contourites in deep-marine environments is thought to be favored by relative sea-level lowstand (“erosive cycle” after Haq, 1991). The described feature may therefore be indicative of an underlying sequence boundary.
The wavy limestone bed (uppermost part of bed 160) as well as the overlying interval (beds 161 to 167D) are interpreted as lowstand deposits (lowstand prograding wedge). The corresponding sequence boundary Be7 is placed near the top of bed 160 (PI. 4, fig. 1).
The following interval cannot be differentiated by sedimentological criteria. The subdivision is based on the results obtained by other studies (Emmanuel & Renard, Jan Du Chêne et ai, this volume) : transgressive systems tract (beds 168A to 171) and maximum flooding surface (top of bed 171).

191
Angles IIIs si LITHOLOGY
BCREDP 17 (1993) VOCONTIAN TROUGH : EUSTATIC CONTROLS ON DEPOSITION OF DEEP-WATER CARBONATES
b)
<2 j§ c 2 mmc'c-£o'D8c-§Q-ro —g-cSiaSgô l'ë -g B .E § § £ ë n -g gc ai -E » S u “ >.-üCü .C TO CL m TO i—t TO f r> O . ir — TO '— Q- mV) O "O -Q -O CL (/> ™ O — UÜ Q>«)^= CL O)-O TOÜ
— SB - Be 6
— SB - Be 2• present «rare «frequent • abundant a present (not quantified)A.inferred Milankovitch cycles
Angles III8 LITHOLOGY
»■£ _ ; ro — j n nE a ® g 1
SS®»E|
"B .E2§S‘= ■2 R-c
^ .e ^ Jc.5a2oRc'02-o'f °f“Scü®°2°iû-iü-gi y i ss °] u ° u5 gros !
K
• present «rare «frequent
à present (not quantified)
5 — BERRIASIAN STRATA FROM BERRIAS (BERRIASIAN STRATOTYPE)
The stratigraphie subdivision of the Berriasian stratotype section is based on the results of Galbrun et al. (1986) who used magnetostratigraphic and biostratigraphic correlations.
Effects of eustatic variations, supported by palynofacies, have recently been shown by Gorin & Steffen (1991).
The studied section north of Berrias (Ardèche region) is dominated by carbonate beds displaying varying thicknesses. Relatively thick marl intercalations only occur in the uppermost part of the Berriasian strata. The total thickness of the studied section is about 35m (lithological logs after Busnardo, Jan Du Chêne, Monteil & Steffen) (Fig. 4).
The carbonates are dominated by fossil wackestones (facies type I) rich in Calpionellids, spicules and Foramini- fera. Radiolarians, Echinoderm plates, filaments and calci- spheres are common. Globochaetids (Globochaete alpina) are found predominantly in the lower part of the section (beds 138 to 149). Aptychi and Pelecypod tests (Pycnodon- tids) occur sporadically in the investigated samples.
5.1. SEQUENTIAL DEVELOPMENT
The base of the section (Uppermost Tithonian ?) is dominated by discontinuous-bedded (channelized ?) fossil wackestones rich in Radiolarians, Calpionellids and Globochaetids (facies type I) which are interpreted as lowstand deposits (bed 138 : lowstand prograding wedge).
A sequence boundary (Be1) on top of bed 138 (possibly the limit between Tithonian and Berriasian) occurs below a channelized interval interpreted as a lowstand slope fan (beds 139/1 to 139/2 : mud-flow deposits; PI. 4, fig. 4).
The overlying, mostly relatively thick-bedded and partly discontinuous (channelized ?) limestones between beds 139/3 and 142 reflect conditions favorable for carbonate production during a relative lowstand of sea-level and may correspond to a lowstand prograding wedge.
An erosive surface at the top of bed 142 again indicates a sequence boundary (Be2), overlain by a massive mud-flow and/or debris-flow deposit (beds 143/2 to 143/4, facies type 11 m/I Id : intraclast-fossil wackestones/floatstones; PI. 4, fig. 5) interpreted as a lowstand slope fan. The overlying

192 C. STROHMENGER AND A. STRASSER BCREDP 17 (1993)
limestones (beds 144/145: laterally discontinuous debris- flow deposits; bed 146/7 : thick limestone bed) are interpreted as a lowstand prograding wedge.
The thinning-upward nature of the interval between beds 146/8 and 146/10 indicates a transgressive systems tract with a maximum flooding surface on top of bed 146/10. This surface, further accentuated by strong bioturbation within bed 146/11, separates the thin transgressive systems tract from an equally thin highstand systems tract (beds 146/11 to 146/14A).
An erosive surface on top of bed 146/14A indicates sequence boundary Be3. The mud-flow deposit of beds 146/14B and 146/15 (facies type llm : intraclast-fossil wackestones/floatstones) is interpreted as a channelized lowstand slope fan.
The interval between beds 147 and 148/19 is interpreted as a lowstand deposit (lowstand prograding wedge), displaying three small-scale sequences (Milankovitch cycles ?). A thin transgressive systems tract (marlstone bed 148/20) is separated by an inferred maximum flooding surface (top of marlstone bed 148/20) from the overlying evenly-bedded limestones, assigned to thin highstand deposits (bed 149/21). The latter are terminated by an erosive surface, interpreted as sequence boundary Be4 (base of bed 150;
PI. 4, fig. 3). This sequence boundary is followed by a channelized breccia, representing multiple debris flows (facies type lid) during lowstand of sea-level (lowstand slope fan : bed 150; PI. 4, fig. 2). The geometry of the debris-flow deposit as well as the main channel levee is well exposed.
The superjacent interval (beds /24 to /34) is characterized by thick limestone beds which are interpreted as being deposited during low relative sea-level. This lowstand prograding wedge (possibly a slope fan at the base) consists of four small sequences (Milankovitch cycles), thinning-upward towards the top of bed /34.
Transgressive deposits on top of this lowstand systems tract are identified by a series of uniform, thin-bedded carbonates (beds /35 to /38, base of thicker limestone bed), reflecting increased accommodation space during high relative sea-level and conditions less favorable for carbonate production in the deep-marine environment. A maximum flooding surface is placed on top of the thinnest limestone bed (168).
The superimposed highstand deposits (beds 169 to base 180/51) show highly variable bank thicknesses which are thought to correspond to Milankovitch cyclicity. Five small- scale sequences are distinguished.

BCREDP 17 (1993) VOCONTIAN TROUGH : EUSTATIC CONTROLS ON DEPOSITION OF DEEP-WATER CARBONATES 193
This interval belongs to the Paramimounum zone (D1/D1D2). It is correlated with the interval of the studied section at Angles. There, in the same stratigraphic position (Paramimounum zone, D1), five small-scale sequences are also recognized (see above).
A sequence boundary (Be5) is placed on top of the fifth small sequence, at the base of a thick limestone bed (180/51). It is overlain by thick limestone beds and a gap which probably corresponds to a marlstone (beds 180/51 to base 188). This interval is interpreted as a lowstand deposit (lowstand prograding wedge).
Thin transgressive deposits (bed 188) are characterized by a thinning-upward trend of pyrite-rich limestone beds towards a maximum flooding surface (base of bed 190). Superjacent highstand deposits (beds 190 to 191/61, base) have uniform bed thicknesses and cannot be identified by sedimentological observations. A sequence boundary (Be6) is placed at the base of the thick limestone bed 191/61.
The top of the Berriasian stratotype section (about 5m) is dominated by thick marlstone intercalations where thicknesses can only be estimated. This interval cannot be differentiated by sedimentological criteria (Emmanuel & Re
nard, Jan Du Chêne et al., this volume).
The trend towards more marl-dominated deposits towards the Valanginian (also observable at Angles) may be explained by a second-order, tectono-eustatically controlled sea-level rise (Vail et al., 1991).
6 — CONCLUSIONS
The facies analysis carried out in Upper Tithonian to Berriasian carbonate rocks from Broyon, Angles and Berrias yields a clearly hemipelagic to pelagic fossil assemblage : Radiolarians, Calpionellids, sponge spicules, Calcispheres, planktonic Crinoids (Saccocoma), filaments, Aptychi, Glo- bochaetids (Globochaete alpina) and nannoplankton (Nan- noconus).
Platform-derived material (Echinoderm plates displaying syntaxial cements, Gastropods and Pelecypod tests) is predominantly present within intercalated mass-flow breccias.
The studied limestone beds can be subdivided into three different facies types :
— facies type I : fossil wackestones,— facies type llm/lld : intraclast-fossil wackestones/ float-
stones,— facies type III : intraclast-fossil grainstones/rudstones.Facies type I represents deep-marine, predominantly
autochthonous deposits. According to variations in bed thicknesses and stacking patterns, it can be assigned to low- stand, transgressive, and highstand systems tracts.
Facies type II is interpreted as mud-flow (facies type llm) and/or debris-flow (facies type lid) deposits corresponding to relative lowstands of sea-level (lowstand slope fans, low- stand prograding wedges).
Facies type III is thought to represent grain-flow deposits (fluxoturbidites) which may be indicative of lowstand basin
floor fans. Thin-bedded grain flows may, however, occur throughout the lowstand systems tract.
Besides facies types, it is to a large part the geometry of the carbonate and marlstone beds as well as vertical changes in their relative thicknesses that allow the proposed sequential subdivision of the studied sections.
The predominance of mass-flow breccias at Broyon has probably been favored by synsedimentary tectonics.
The following sedimentological criteria are thought to be indicative of different systems tracts and their related bounding surfaces in the deep-marine (hemipelagic to pelagic) carbonate environment :
Lowstand basin floor fans :
— massive grain-flow deposits (fluxoturbidites).
Lowstand slope fans :
— massive mud-flow deposits,— massive debris-flow deposits,— thin-bedded grain-flow deposits,— channelized and/or slumped mass-flow deposits,— channelized sections.
Lowstand prograding wedges :
— mud-flow deposits,— debris-flow deposits,— thin-bedded grain-flow deposits,— muddy contourites,— slumped sections,— thick carbonate and marlstone beds,— occurrence of small-scale sequences related to Mi-
lankovitch cyclicity,— thinning-upward tendency of small-scale sequences.
Transgressive surfaces :
— no sedimentological criteria observed in the studied sections.
Transgressive systems tracts :
— thinning-upward tendency of limestone and marlstone beds towards the overlying maximum flooding surface.
Maximum flooding surfaces :
— increased bioturbation,— enrichment in pyrite,— hardgrounds.
Highstand systems tracts :
— thickening-upward tendency of limestone beds,— occurrence of small-scale sequences related to Mi-
lankovitch cyclicity.
Sequence boundaries :
— erosive surfaces at the base of mass-flow breccias,— non-erosive surfaces below muddy contourites.
Higher-order inferred Milankovitch cycles, identified within lowstand prograding wedge and highstand deposits at Angles and Berrias, may help to correlate sections between different areas.

194 C. STROHMENGER AND A. STRASSER BCREDP 17 (1993)
Acknowledgements
We thank P.R. Vail and T. Jacquin, as well as the members of the “Vocontian Trough Early Cretaceous Working Group” for valuable discussions.
D. Cao was responsible for the SEM photographs. W. Liedmann took the CL photograph.
We thank J.C. Mitchell for reviewing the manuscript and suggesting improvements.
C.S. gratefully acknowledges BEB Erdgas und Erdôl GmbH for support and granting permission for his participation in the study. Field expenses of A.S. have been covered by project No. 21-28988.90 of the Swiss National Science Foundation.
7 REFERENCES
Algeo, T.J. & Wilkinson, B.H. (1988). — Periodicity of mesoscale Phanerozoic sedimentary cycles and the role of Milankovitch orbital modulation. — J. Geol., 96, 313- 322.
Beard, J.H., Sangree, J.B. & Smith, L.A. (1982). — Quaternary chronology, paleoclimate, depositional sequences, and eustatic cycles. — Bull. amer. Assoc. Petroleum Geol., 66, 2, 158-169.
Berger, A. (1980). — The Milankovitch astronomical theory of paleoclimates : a modern review. — Vistas Astron., 24, 103-122.
Berger, A., Imbrie, J., Hays, J., Kukla, G. & Saltzman, B. (eds.) (1984). — Milankovitch and Climate. — NATO ASI Series, (C), 126, 895 pp.
Berger, W.H. & Winterer, E.L. (1974). — Plate stratigraphy and the fluctuating carbonate line. — In : Hsü, K.J. & Jenkyns, H.C. (eds.) : Pelagic sediments : on land and under the sea. — Inter. Assoc. Sediment., spec. Pub!.,I, 11-48.
Boardman, M.R. & Neumann, A.C. (1984). — Sources of periplatform carbonates : Northwest Providence Channel, Bahamas. — J. Sediment. Petrol., 54, 4, 1110-1123.
Boardman, M.R., Neumann, A.C., Baker, P.A., Dulin, L.A., «.enter, R.J., Hunter, G.E. & Kiefer, K.B. (1986). — Banktop response to Quaternary fluctuations in sea-level recorded in periplatform sediments. — Geology, 14, 28-31.
Bottjer, D.J., Arthur, M.A., Dean, W.E., Hattin, D.E. & Savrda, C.E. (1986). — Rhythmic bedding produced in Cretaceous pelagic carbonate environments : sensitive recorders of climatic cycles. — In : Arthur, M.A. & Garrison, R.E. (eds.) : Milankovitch cycles through geologic time. — Paleoceanography, 1, 4, 467-481.
Busnardo, R., Le Hégarat, G. & Magné, J. (1965). — Le stratotype du Berriasien. — Bur. Rech. géol. min., Mém. 34, 5-33.
Cecca, F., Enay, R. & Le Hégarat, G. (1989). — L’Ardescien (Tithonique supérieur) de la région stratotypique : séries de référence et faunes (ammonites, calpionelles) de la bordure ardéchoise. — Doc. Lab. géol. Lyon, 107, 115 pp.
Cook, H.E. & Mullins, H.T. (1983). — Basin margin environment. — In : Scholle, P.A., Bebout, D.G. & Moore, C.H. (eds.) : Carbonate depositional environments. — Amer. Assoc. Petroleum Geol., Mem. 33, 539-617.
Cotillon, P. (1989). — La sédimentation pélagique dans le bassin vocontien au Crétacé. — In : Ferry, S. & Rubino,J. -L. (eds.) : Mesozoic eustacy record on western Te- thyan margins. — Guide-book, Assoc. Sédiment, fr., 12, 46-52.
Cotillon, P. (1991). — Varves, beds, and bundles in pelagic sequences and their correlation (Mesozoic of SE France and Atlantic). — In : Einsele, G., Ricken, W. & Seilacher, A. (eds.) : Cycles and events in stratigraphy. — Springer-Verlag, Berlin, 820-839.
Cotillon, P. & Rio, M. (1984). — Cyclic Sedimentation in the Cretaceous of Deep Sea Drilling Project Sites 535 and 540 (Gulf of Mexico), 534 (Central Atlantic), and the Vocontian Basin (France). — In : Buffler, R.T., Schlager, W., et al. (eds.) : Init. Repts DSDP, IT, 339-376.
Cotillon, P, Ferry, S., Gaillard, C., Jautée, E., Latreille, G. & Rio, M. (1980). — Fluctuation des paramètres du milieu marin dans le domaine vocontien (France Sud-Est) au Crétacé inférieur : mise en évidence par l’étude des formations marno-calcaires alternantes. — Bull. Soc. géol. France, (7), 22, 5, 735-744.
Davies, T.A. & Worsley, T.R. (1981). — Paleoenvironmental implications of oceanic carbonate sedimentation rates. — In : Warme, J.E., Douglas, R.G. & Winterer, E.L. (eds.) : The Deep Sea Drilling Project : A decade of progress. — Soc. econ. Paleont. Mineral., spec. Pub!., 32, 169-179.
Deconinck, J.-F. (1993). — Clay mineralogy of the Late Tithonian-Berriasian deep-sea carbonates of the Vocontian Trough (SE France) : relationships with sequence stratigraphy. — Bull. Centres Rech. Explor.- Prod. Elf Aquitaine, 17, 1, 223-234.
De Groot, K. (1967). — Experimental dedolomitization. - J. Sediment. Petrol. 37, 4, 1216-1220.
Dromart, G., Ferry, S. & Atrops, F. (1993). — Removal of deep-water carbonates and relative sea-level changes : the Upper Jurassic — lowermost Cretaceous of South- East France (in press).
Droxler, A.W. & Schlager, W. (1985). — Glacial versus interglacial sedimentation rates and turbidite frequency in the Bahamas. — Geology, 13, 799-802.
Dunham, R.J. (1962). — Classification of carbonate rocks according to depositional texture. — In : Ham, W.E. (ed.) : Classification of carbonate rocks. — Amer. Assoc. Petroleum Geol., Mem. 1, 108-121.
Eberli, G.P (1991). — Calcareous turbidites and their relationship to sea-level fluctuations and tectonism. — In : Einsele, G., Ricken, W. & Seilacher, A. (eds.) : Cycles and events in stratigraphy. — Springer-Verlag, Berlin, 340- 359.
Eberli, G.P. & Ginsburg, R.N. (1989). — Cenozoic progradation of northwestern Great Bahama Bank, a record of lateral platform growth and sea-level fluctuations. — In : Crevello, P.D., Wilson, J.L., Sarg, J.F. & Read, J.F. (eds.) : Controls on carbonate platforms and basin development. — Soc. econ. Paleont. Mineral., spec. Publ., 44, 339-351.
Einsele, G. (1991). — Submarine mass flow deposits and turbidites. — In : Einsele, G., Ricken, W. & Seilacher, A. (eds.) : Cycles and events in stratigraphy. — Springer- Verlag, Berlin, 313-339.
Emmanuel, L. & Renard, M. (1993). — Carbonate geochemistry (Mn, 313C, 3180) of the Late Tithonian - Berriasian pelagic limestones of the Vocontian Trough (SE France). — Bull. Centres Rech. Expior.-Prod. Elf Aquitaine, 17, 1, 205-221.
Embry, A.F. & Klovan, E.J. (1972). — Absolute water depth limits of Late Devonian paleoecological zones. — Geol. Rdsch., 61, 2, 672-686.
Everts, A.J.W. (1991). — Interpreting compositional variations of calciturbidites in relation to platform-stratigraphy : an example from the Paleogene of SE Spain. — Sediment. Geol., 71, 231-242.

BCREDP 17 (1993) VOCONTIAN TROUGH : EUSTATIC CONTROLS ON DEPOSITION OF DEEP-WATER CARBONATES 195
Fischer, A.G. & Arthur, M.A. (1977), — Secular variations in the pelagic realm. — In : Cook, H.E. & Enos, P. (eds.) : Deep-water carbonate environments. — Soc. econ. Paleont. Mineral., spec. Pub!., 25, 19-50.
Flügel, E. (1982). — Microfacies analysis of limestones. — Springer-Verlag, Berlin, 633 pp.
Fuchtbauer, H. & Richter, D.K. (1983). — Carbonate internal breccias : a source of mass flows at early géosynclinal platform margins in Greece. — In : Stanley, D.J. & Moore, G.T. (eds.) : The shelfbreak : critical interface on continental margins. — Soc. econ. Paleont. Mineral., spec. Publ., 33, 207-215.
Galbrun, B., Rasplus, L. & Le Hégarat, G. (1986). — Données nouvelles sur le stratotype du Berriasien : corrélations entre magnétostratigraphie et biostratigraphie. — Bull. Soc. géol. France, (8), 2, 4, 575-584.
Garrison, R.E. (1981). — Diagenesis of oceanic carbonate sediments : a review of the DSDP perspective. — In : Warme, J.E., Douglas, R.G. & Winterer, E.L. (eds.) : The Deep Sea Drilling Project : a decade of progress. — Soc. econ. Paleont. Mineral., spec. Publ., 32, 181-207.
Gorin, G.E. & Steffen, D. (1991). — Organic facies as a tool for recording eustatic variations in marine fine-grained carbonates — example of the Berriasian stratotype at Berrias (Ardèche, SE France). — Palaeogeogr., Pa- laeoclimatol., Palaeoecol., 85, 303-319.
Grammer, G.M. & Ginsburg, R.N. (1992). — Highstand versus lowstand deposition on carbonate platform margins : insight from Quaternary foreslopes in the Bahamas. — Marine Geol., 103, 125-136.
Haq, B.U. (1991). — Sequence stratigraphy, sea-level change, and significance for the deep sea. — In : MacDonald, D.I.M. (ed.) : Sedimentation, tectonics and eus- tasy. Sea-level changes at active margins. — Inter. Assoc. Sediment., spec. Publ., 12, 3-39.
FIaq, B.U., FIardenbol, J. & Vail, PR. (1987). — Chronology of fluctuating sea levels since the Triassic. — Science, 235, 1156-1167.
Haq, B.U., Hardenbol, J. & Vail, PR. (1988). — Mesozoic and Cenozoic chronostratigraphy and cycles of sea-level change. — In : Wilgus, C.K., Hastings, B.S., Kendall, C.G.St.C., Posamentier, H.W., Ross, C.A. & Van Wagoner, J.C. (eds.) : Sea-level changes : an integrated approach. — Soc. econ. Paleont. Mineral., spec. Publ., 42, 71-108.
Hays, J.D., Imbrie, J. & Shackleton, N.J. (1976). — Variations in the earth’s orbit : pacemaker of the ice ages. — Science, 194, 1121-1131.
Hine, A.C. & Mullins, H.T. (1983). — Modern carbonate shelf-slope breaks. — In : Stanley, D.J. & Moore, G.T. (eds.) : The shelfbreak : critical interface on continental margins. — Soc. econ. Paleont. Mineral., spec. Publ., 33, 169-188.
Imbrie, J. & Imbrie, K.P. (1979). — Ice ages : solving the mystery. — The Macmillan Press Ltd., London, 224 pp.
Jacquin, T, Arnaud-Vanneau, A., Arnaud, H., Ravenne, C. & Vail, PR. (1991). — Systems tracts and depositional sequences in a carbonate setting : a study of continuous outcrops from platform to basin at the scale of seismic lines. — Marine Petroleum Geol., 8, 122-139.
James, N.P. & Mountjoy, E.W. (1983). — Shelf-slope break in fossil carbonate platforms : an overview. — In : Stanley,S.J. & Moore, G.T. (eds.) : The shelfbreak : critical interface on continental margins. — Soc. econ. Paleont. Mineral., spec. Publ., 33, 189-206.
Jan Du Chêne, R., Busnardo, R., Charollais, J., Clavel, B., Deconinck, J.-F, Emmanuel, L., Gardin, S., Gorin, G., Manivit, H., Monteil, E., Raynaud, J.-E, Renard, M., Steffen, D., Steinhauser, N., Strasser, A., Strohmenger, C. & Vail, P. (1993). — Sequence-stratigraphy interpretation of Upper Tithonian-Berriasian reference sections in South-
East France : a multidisciplinary approach. — Bull. Centres Rech. Explor.-Prod. Elf Aquitaine, 17, 1, 151-181.
Jenkyns, H.C. (1978). — Pelagic environments. — In: Rea
ding, H.G. (ed.) : Sedimentary environments and facies. — Blackwell Scientific Publications, Oxford, 314-317.
Kelts, K. & McKenzie, J.A. (1980). — Diagenetic dolomite formation in Quaternary anoxic diatomaceous muds of Deep Sea Drilling Project Leg 64, Gulf of California. — In : Curray, J.R., Moore, D.G., et al. (eds.) : Init. Repts DSDP, 64, 533-569.
Kelts, K. & Arthur, M.A. (1981). — Turbidites after ten years of Deep-Sea Drilling — wringing out the mop ?. — In : Warme, J.E., Douglas, R.G. & Winterer, E.L. (eds.) : The Deep Sea Drilling Project : a decade of progress. — Soc. econ. Paleont. Mineral., spec. Publ., 32, 91-127.
Le Hégarat, G. (1965). — Stratigraphie et macrofaune. — In : Busnardo, R., le Hégarat, G. & Magné, J. (eds.) : Le stratotype du Berriasien. — Bur. Rech. géol. min., Mém. 34, 9-16.
Le Hégarat, G. (1973). — Le Berriasien du Sud-Est de la France. — Doc. Lab. géol. Lyon, 43, 575 pp.
Le Hégarat, G. (1980). — Berriasien. — In: Cavelier, C. & Roger, J. (coord.) : Les étages français et leur stratotypes. — Bur. Rech. géol. min., Mém. 109, 96-105.
Le Hégarat, G. & Ferry, S. (1990). — Le Berriasien d’Angles (Alpes-de-Haute-Provence, France). — Geobios, 23, 3, 369-373.
Le Hégarat, G. & Remane, J. (1968). — Tithonique supérieur et Berriasien de la bordure cévenole. Corrélation des ammonites et des calpionelles. — Geobios, 1,1, 7-70.
McIlreath, I.A. & James, N.P. (1984). — Carbonate slopes.— In : Walker, R.G (ed.) : Faciès models, 2nd edition.— Reprint Series, Geoscience Canada, 1, 245-257.
Médioni, R. (coord.), et at. (1984). — Berriasien — Valangi-nien. — In : Debrand-Passard, S. et al. (ed.) : Synthèse géologique du Sud-Est de la France. — Bur. Rech. géol. min., Mém. 126, Ci 2.
Milankovitch, M. (1941). — Kanon der Erdbestrahlung und seine Anwendung auf das Eiszeitenproblem. — Royal Serb. Acad., spec. Publ., 133, 633 pp.
Milliman, J.D. (1974). — Marine carbonates. Part 1. —Springer-Verlag, Berlin, 375 pp.
Mullins, H.T. (1983). — Modem carbonate slopes and basins of the Bahamas. — In: Cook, H.E., Hine, A.C. & Mullins, H.T. (eds.) : Platform margins and deep water carbonates. — Short Course, Soc. econ. Paleont. Mineral., 12, 4-1-4-138.
Mullins, H.T. (1986). — Carbonate depositional environments. Modern and ancient. Part 4 : Periplatform carbonates. — Quart. Colorado School of Mines, 81, 2, 63 pp.
Mullins, H.T. & Neumann, A.C. (1979). — Deep carbonate bank margin structure and sedimentation in the northern Bahamas. — In : Doyle, L.J. & Pilkey, O.H. (eds.) : Geology of continental slopes. — Soc. econ. Paleont. Mineral., spec. Publ., 27, 165-192.
Mullins, H.T., Wise, S.W.Jr., Land, L.S., Siegel, D.I., Masters,
P.M., Hinchey, E.J. & Price, K.R. (1985). — Authigenic dolomite in Bahamian peri-platform slope sediment. — Geology, 13, 292-295.
Nardin, T.R., Hein, F.J., Gorsline, D.S. & Edwards, B.D. (1979). — A review of mass movement processes, sediment and acoustic characteristics, and contrasts in slope and base-of-slope systems versus canyon-fan-basin floor systems. — In : Doyle, L.J, & Pilkey, O.H. (eds.) : Geology of continental slopes. — Soc. econ. Paleont. Mineral., spec. Publ., 27, 61-73.
Pickering, K.T., Hiscott, R.N. & Hein, F.J. (1989). — Deep marine environments. — Unwin Hyman, London, 416 pp.

196 C. STROHMENGER AND A. STRASSER BCREDP 17 (1993)
Pickering, K.T., Stow, D.A.V., Watson, M.P. & Hiscott, R.N. (1986). — Deep-water faciès, processes and models; a review and classification scheme for modem and ancient sediments. — Earth Sci. Rev., 23, 75-174.
Read, J.F. (1985). — Carbonate platform facies models. — Bull. amer. Assoc. Petroleum Geoi, 69, 1, 1-21.
Reijmer, J.J.G. & Everaars, J.S.L. (1991). — Carbonate platform facies reflected in carbonate basin facies (Triassic, Northern Calcareous Alps, Austria). — Facies, 25, 253- 278.
Reijmer, J.J.G., Ten Kate, W.G.H.Z., Sprenger, A. & Schla-
ger, W. (1991). — Calciturbidite composition related to exposure and flooding of a carbonate platform (Triassic, Eastern Alps). — Sedimentology, 38, 1059-1074.
Rio, M., Cotillon, P. & Ferry, S. (1989). — Rhythmic pelagic successions and terrestrial orbital variations. The example of the Lower Cretaceous from Angles (SE France). — Terra Nova, 1, 5, 449-450.
Saller, A.H. (1984). — Petrologic and geochemical constraints on the origin of subsurface dolomite, Enewe- tak Atoll : An example of dolomitization by normal sea water. — Geology, 12, 217-220.
Saller, A.H., Barton, J.W. & Barton, R.E. (1989). — Slope sedimentation associated with a vertically building shelf, Bone Spring Formation, Mescalero Escape Field, southwestern New Mexico. — In : Crevello, P.D., Wilson, J.L., Sarg, J.F. & Read, J.F. (eds.) : Controls on carbonate platform and basin development. — Soc. econ. Paleont. Mineral., spec. Pub!., 44, 275-288.
Sarg, J.F. (1988). — Carbonate sequence stratigraphy. - In : Wilgus, C.K., Hastings, B.S., Kendall, C.G.St.C., Posamentier, H.W., Ross, C.A. & Van Wagoner, J.C. (eds.) :
Sea-level changes : an integrated approach. — Soc. econ. Paleont. Mineral., spec. Pubi, 42, 155-181.
Schlager, W. (1991). — Depositional bias and environmental change — important factors in sequence stratigraphy. — Sediment. Geoi, 70, 109-130.
Schlager, W. & Schlager, M. (1973). — Clastic sediments associated with radiolarites (Tauglboden-Schichten, Upper Jurassic, Eastern Alps). — Sedimentology, 20, 65-89.
Schlager, W. & James, N.P. (1978). — Low-magnesian calcite limestones forming at the deep-sea floor, Tongue of the Ocean, Bahamas. — Sedimentology, 25, 675-702.
Schlager, W. & Chermak, A. (1979). — Sediment facies of platform-basin transition, Tongue of the Ocean, Bahamas. — In : Doyle, L.J. & Pilkey, O.H. (eds.) : Geology of continental slopes. — Soc. econ. Paleont. Mineral., spec. Pubi, 27, 193-208.
Scholle, P.A., Arthur, M.A. & Ekdale, A.A. (1983). — Pelagic environment. — In : Scholle, P.A., Bedout, D.G. & Moore,
C.H. (eds.) : Carbonate depositional environments. — Amer. Assoc. Petroleum Geoi, Mem. 33, 619-691.
Steffen, D. & Gorin, G. (1993). — Palynofacies of the Upper Tithonian-Berriasian deep-sea carbonates in the Vocontian Trough (SE France). — Bull. Centres Rech. Explor.-Prod. Elf Aquitaine, 17, 1, 235-247.
Tucker, M.E. & Wright, V.P (1990). — Carbonate sedimentology. — Blackwell Scient. Pubi., Oxford, 482 pp.
Vail, PR., Mitchum, R.M.Jr., Todd, R.G., Widmier, J.M., Thomp
son, S. Ill, Sangree, J.B., Bubb, J.N. & Hatlelid, W.G. (1977). — Seismic stratigraphy and global changes of sea level. — In : Payton, C.E. (ed.) : Seismic stratigraphy — applications to hydrocarbon exploration. — Amer. Assoc. Petroleum Geoi, Mem. 26, 49-212.
PLATE I
Typical fossils found in carbonate and marlstone beds
Fig. 1. — Well preserved Radiolarians occurring in chert nodule together with dolomite rhombs (Angles section, bed 61 base).Scale bar : 200 pm, // niçois.
2. —Abundant fragments of planktonic Crinoids (Saccocoma; Broyon section bed 7).Scale bar : 200 pm, // niçois.
3. —Nannoconus within carbonate bed from Angles section (bed 149).SEM : 12 KV, slightly etched in 10 % HCI, scale bar : 1 pm.
4. —Abundant Nannoconus as well as corroded dolomite rhombohedra within carbonate bed from Angles section (bed149).SEM : 20 KV, slightly etched in 10 % HCI, scale bar : 10 pm.
5. —Nannoconus within marlstone bed from Angles section (bed 168). Note abundance of clay minerals which haveresisted etching with acid.SEM : 10 KV, slightly etched in 10 % HCI, scale bar : 10 pm.
6. —Well preserved Nannoconus in marlstone bed from Angles section (bed 168) favors the interpretation that thechange from limestone to marlstone deposition is controlled by increased input of clay and not by pressure solution. SEM : 20 KV, slightly etched in 10 % HCI, scale bar : 1 pm.

BCREDP 17 (1993) C. STROHMENGER AND A. STRASSER :VOCONTIAN TROUGH : EUSTATIC CONTROLS ON DEPOSITION OF DEEP-WATER CARBONATES : Plate 1
197

198 C. STROHMENGER AND A. STRASSER BCREDP 17 (1993)
Vail, P.R., Colin, J.-P., Jan Du Chêne, R., Kuchly, J., Media-
villa, F. & Trifilieff, V, (1987). — La stratigraphie séquentielle et son application aux corrélations chronostratigraphiques dans le Jurassique du bassin de Paris. — Bull. Soc. géol. France, (8), 3, 7, 1301-1321.
Vail, P.R., Audemard, F., Bowman, S.A., Eisner, PN. & Perez-
Cruz, C. (1991). — The stratigraphie signatures of tectonics, eustasy and sedimentology — an overview. — In : Einsele, G., Ricken, W. & Seilacher, A. (eds.) : Cycles and events in stratigraphy. — Springer-Verlag, Berlin, 617- 659.
Van Wagoner, J.C., Mitchum, R.M.Jr., Posamentier, H.W. & Vail, PR. (1987). — Seismic stratigraphy interpretation using sequence stratigraphy. Part II : Key definitions of sequence stratigraphy. — In : Bally, A.W. (ed.) : Atlas of seismic stratigraphy 1. — Studies in Geology. — Amer. Assoc. Petroleum Geol., 27, 11-14.
Van Wagoner, J.C., Posamentier, H.W., Mitchum, R.M., Vail,
P.R., Sarg, J.F., Loutit, T.S. & Hardenbol, J. (1988). — An overview of the fundamentals of sequence stratigraphy and key definitions. — In: Wilgus, C.K., FIastings,
B.S., Kendall, C.G.St.C., Posamentier, H.W., Ross, C.A. & Van Wagoner, J.C. (eds.) : Sea-level changes : an integrated approach. — Soc. econ. Paleont. Mineral., spec. Pub!., 42, 39-45.
Van Wagoner, J.C., Mitchum, R.M., Campion, K.M. & Rahma-
nian, V.D. (1990). — Siliciclastic sequence stratigraphy in well logs, cores and outcrops : concepts for high- resolution correlation of time and facies. — Methods in Exploration. — Amer. Assoc. Petroleum Geol., 7, 55 pp.
Wilber, R.J., Milliman, J.D. & Halley, R.B. (1990). — Accumulation of bank-top sediment on the western slope of Great Bahama Bank : Rapid progradation of a carbonate megabank. — Geology, 18, 970-974.
Wilkinson, B.H., Owen, R.M. & Carrol, A.R. (1985). — Submarine hydrothermal weathering, global eustasy, and carbonate polymorphism in Phanerozoic marine oolites. — J. Sediment. Petrol., 55, 2, 171-183.
Wilson, J.L. (1975). — Carbonate facies in geologic history. — Springer-Verlag, Berlin, 471 pp.
PLATE 2Polished slabs of main facies types from Broyon section
Fig. 1. —Facies type llm : mud-flow deposit (bed 15).Scale bar : 1 cm.
2. —Facies type llm: mud-flow deposit, rich in pyrite (top of bed 18C : transgressive systems tract, directly belowmaximum flooding surface).Scale bar : 1 cm.
3. —Facies type lid : debris-flow deposit showing Aptychus fragment (bed 10).Scale bar : 1 cm.
4 —Facies type III : grain-flow deposit (fluxoturbidite) displaying subrounded to rounded limestone clasts (bed 30). Scale bar : 1 cm.

BCREDP 17 (1993) C. STROHMENGER AND A. STRASSER :VOCONTIAN TROUGH : EUSTATIC CONTROLS ON DEPOSITION OF DEEP-WATER CARBONATES : Plate 2
199

200 C. STROHMENGER AND A. STRASSER BCREDP 17 (1993)
PLATE 3Thin section photographs of different facies types
Fig. 1. —Faciès type llm : intraclast-fossil wackestone/floatstone (mud-flow deposit) displaying dark limestone clast (at left) floating in fine-grained matrix rich in Calpionellids (Angles section, bed 67B).Scale bar : 200 pm, // niçois.
2. — Facies type lid : intraclast-fossil packstone/floatstone (debris-flow deposit) rich in dark limestone clasts of varyingsizes, Calpionellids, filaments and fine-grained Echinoderm fragments (Berrias stratotype section, bed 144/5). Scale bar : 200 pm, // niçois.
3. — Facies type lid : intraclast-fossil packstone/floatstone (debris-flow deposit) with Pelecypod test replaced by quartz(Broyon section, bed 1B base).Scale bar : 200 pm, # niçois.
4. — Facies type III : intraclast-fossil grainstone/rudstone (grain-flow deposit), with fairly large Pelecypod fragment (Pyc-nodontid; Angles section, bed 64B top).Scale bar : 200 pm, // niçois.
5. — Facies type III : intraclast-fossil grainstone (grain-flow deposit) rich in Echinoderm fragments with syntaxial overgrowths. Dark areas consist of Fe-rich dedolomite (Broyon section, bed 30).Scale bar : 100 pm, # niçois.
6. — CL analysis (compare with Fig. 5) shows two phases of syntaxial overgrowth cementation (first dull- and secondbright-luminescent phase). Dedolomitization (non-luminescent rhombohedra, partly displaying bright-luminescent outer fringes) is interpreted to be concurrent with syntaxial rim cementation (Broyon section, bed 30).CL : 20 kV / 500 mA, scale bar : 100 pm.

BCREDP 17 (1993) C. STROHMENGER AND A. STRASSER :VOCONTIAN TROUGH : EUSTATIC CONTROLS ON DEPOSITION OF DEEP-WATER CARBONATES : Plate 3
201

202 C. STROHMENGER AND A. STRASSER BCREDP 17 (1993)
PLATE 4Outcrop photographs of sedimentary structures
(Angles section : fig. 1; Berriasian stratotype section : fig. 2-5)
Fig. 1. _Wavy limestone bed (flat, sharp base and wavy top), possibly indicative of deep-marine bottom currents formedduring relative sea-level lowstand. The inferred muddy contourite (uppermost part of bed 160 : lowstand prograding wedge) overlies sequence boundary Be7 (base of hammer) on top of highstand systems tract (bed 160).
2. — Detail of channelized debris-flow deposit (bed 150 : lowstand slope fan).
3. — Sequence boundary (Be4), identified by an erosive surface below a mass-flow breccia (bed 150 : lowstand slopefan), on top of highstand systems tract (bed 149/21).
4 _ Channelized slope fan (beds 139/1-2 : facies type llm, mud-flow deposits), separated from underlying lowstand prograding wedge (bed 138) by sequence boundary Be1 (base of hammer).
5. — Sequence boundary (Be2), identified by an erosive contact between bed 142 (lowstand prograding wedge) and beds 143/2-4 (facies type llm/lld : channelized mud- and debris-flow deposits interpreted as lowstand slope fan).

BCREDP 17 (1993) C. STROHMENGER AND A. STRASSER :VOCONTIAN TROUGH : EUSTATIC CONTROLS ON DEPOSITION OF DEEP-WATER CARBONATES : Plate 4
203

CARBONATE GEOCHEMISTRY (Mn, a^c, Ô^O)OF THE LATE TITHONIAN - BERRIASIAN PELAGIC LIMESTONES OF THE VOCONTIAN TROUGH (SE FRANCE)
Laurent EMMANUEL and Maurice RENARD
EMMANUEL, L. & RENARD, M. (1993)' - Carbonate geochemistry (Mn, 313C, 9180) of the Late Tithonian - Berriasian pelagic limestones of the Vocontian Trough (SE France). - Bull. Centres Rech. Exptor.-Prod. Elf Aquitaine, 17, 1, 205-221, 8 fig., 2 tab.; Boussens, June 24, 1993. - ISSN : 0396-2687. CODEN : BCREDP. La comparaison des données géochimiques du Berriasien des coupes de Berrias
et d’Angles avec le découpage séquentiel pré-établi montre que les fluctuations des teneurs en manganèse sont en bon accord avec les changements relatifs de troisième ordre du niveau marin. Ceci peut aider à caractériser les différents cortèges sédimentaires :•
— les basses teneurs en Mn sont enregistrées dans les cortèges de bas niveau marin,
— une augmentation des valeurs apparaît dans l’intervalle transgressif avec un maximum de manganèse correspondant à la surface d’inondation maximale. Cette surface est aussi soulignée par un accident positif sur la courbe de variations du rapport isotopique de l'oxygène,
— une diminution des valeurs correspond au cortège de haut niveau marin, Néanmoins, si nous essayons d’effectuer des corrélations pour chaque séquence
entre les coupes d’Angles et de Berrias, nous observons quelques diachronismes entre les courbes géochimiques, particulièrement dans le Berriasien supérieur. Sur la base des résultats géochimiques des modifications du découpage séquentiel préétabli sont proposées.
La géochimie des carbonates pélagiques et particulièrement les teneurs en Mn semblent donc être des outils performants pour les études de stratigraphie séquentielle.Laurent Emmanuel, Maurice Renard, Laboratoire de Géologie des Bassins Sédimen
taires, Université P. et M. Curie et URA-CNRS 1315, 4, place Jussieu, F-75252 Paris cedex 05. - February 01, 1993.
Mots-clefs: Manganèse, Isotope stable, C13-C12, Ois-O-m, Calcaire, Sédimentation pélagique, Tithonique, Berriasien, Eustatisme (Stratigraphie séquentielle), Alpes de Haute-Provence (Angles), Ardèche (Berrias), Fosse Vocontienne.
ABSTRACT
The comparison of Berriasian geochemical data from Berrias and Angles sections with the pre-established sequence-stratigraphic framework shows that manganese content fluctuations concord well with third order relative sea-level changes. This can help to characterise the various systems tracts :
— low values of manganese contents are recorded in the low- stand systems tract,
— increasing values occur in the transgressive systems tract with the maxima content corresponding to the maximum flooding surface,
— decreasing values in the highstand systems tract.So pelagic carbonate Mn contents seem to be powerful tools
for sequence-stratigraphic interpretation. Nevertheless, if we try to correlate each sequence between Berrias and Angles sections, we can observe some diachronisms between the geochemical curves, particularly in the Upper Berriasian. Some modifications of the pre- established sequence-stratigraphic framework are proposed on the base of geochemical data.
Key words: Manganese, Stable isotopes, C13-C12, O18-O16, Limestone, Pelagic sedimentation, Tithonian, Berriasian, Eustasy (Sequence stratigraphy), Alpes de Haute-Provence (Angles), Ardèche (Berrias), Vocontian Trough.
0396-2687/93/0017-0205 $ 3.40 © 1993 elf aquitaine production, F-31360 Boussens

206 L. EMMANUEL AND M. RENARD BCREDP 17 (1993)
CONTENTS
INTRODUCTION..................................................................... 2061. - GEOLOGICAL SETTING............................................... 206
1.1. Be" as section........................................................ 2061.2. Angles section........................................................ 207
2. - GEOCHEMISTRY : TRACE ELEMENTS AND STABLEISOTOPES...................................................................... 2072.1. Methods................................................................... 2072.2. Manganese............................................................. 2082.3. Carbon and oxygen isotopes................................. 210
2.3.1. Evolution of carbon isotopic composition inthe pelagic carbonates.............................. 210
2.3.2. Evolution of oxygen isotopic composition inthe pelagic carbonates.............................. 210
3. - RESULTS AND SEQUENCE DEVELOPMENTS............ 2123.1. Berriasian stratotypic section................................ 212
3.1.1. Manganese content evolution..................... 2133.1.2. Evolution of the carbon isotopic composition 2133.1.3. Evolution of the oxygen isotopic composition 213
3.2. Angles section............ :.......................................... 2133.2.1. Manganese content evolution..................... 2133.2.2. Evolution of the carbon isotopic composition 2143.2.3. Evolution of the oxygen isotopic composition 214
3.3. Sequence stratigraphy - Geochemistry relationships....................................................................... 2143.3.1. Berrias section............................................ 2143.3.2. Angles section ...:......................................... 2153.3.3. Comparison of sequential and geochemical
correlations between Berrias and Angles sections........................................................ 215
4. - CONCLUSION............................................................... 2205. - REFERENCES................................................................ 220
INTRODUCTION
An attempt at sequence-stratigraphic interpretation of the Late Tithonian / Berriasian of the Vocontian Trough has been made through a multidisciplinary approach including clay mineralogy (Deconinck, this volume), palynofacies (Steffen
& Gorin, this volume) and biostratigraphy (e.g. microfaunal and microfloral associations; Monteil, this volume).
The pre-established sequence-stratigraphic framework used in this study can be found in Jan Du Chêne et al. (this volume). It is essentially based on field lithostratigraphic observations and facies analyses (Strohmenger & Strasser,
this volume).The purpose of the present paper is to test whether geo
chemistry of pelagic carbonates records eustatic variations, and could be a useful tool for sequence stratigraphy.
1 — GEOLOGICAL SETTING
The studied sections (Fig. 1) are located in the Vocontian Trough in the south-eastern French Alps (Angles section) and in the Ardèche area (Berriasian stratotypic section). Precise locations and detailed descriptions of the lithology of
Figure 1
Location maps of Berrias and Angles sections.
these reference sections are given by Le FIégarat (1973) and Médioni et al. (1984). The biostratigraphic framework (Cal- pionellids and Ammonites) is well established both in the Berrias (Busnardo et al., 1965; Le Hégarat & Remane, 1968; Le FIégarat, 1973, 1980) and in the Angles section (Le FIé
garat & Ferry, 1990). Magnetostratigraphic data is available on the Berrias section (Galbrun 1984; Galbrun et ai, 1986). A sedimentological study of these sections can be found in Strohmenger & Strasser (this volume).
1.1. BERRIAS SECTION
The hemipelagic outer platform deposits of the Berriasian stratotypic section consists of 35 meters of fine-grained limestones with rare marly horizons at the top of the section. The stratigraphic subdivision (Fig. 2) is based on the magnetostratigraphic and biostratigraphic data gathered from various studies by Galbrun (1984) and Galbrun et at, (1986). In spite of the presence of a slump in the upper part of the Occitanica zone, the section seems to be complete.
The samples used for chemical analysis come from two sampling sets. The first one, by Steffen, Gorin & Strohmenger, corresponds to the samples of the base and the top of the section (numbers 138 to 200); the second one, using a different numbering (numbers 5 to 65), to a magnetostratigraphic sampling made by Galbrun.

BCREDP 17 (1993) VOCONTIAN TROUGH : CARBONATE GEOCHEMISTRY OF THE TITHONIAN - BERRIASIAN 207
1.2. ANGLES SECTION
This well known outcrop, located near Angles (Alpes-de- Haute-Provence), ranges from the Late Tithonian to the Bar- remian / Aptian boundary. The studied interval is restricted to the Late Tithonian - Berriasian (Fig. 3). The sedimentation consists of massive bedded limestones at the base, grading progressively to an alternation with interbedded marlstones towards the top. These cyclic changes in the sedimentation have been related to variations in marine environment forced by orbital parameters (Cotillon et al., 1980; Strohmenger &
Strasser, this volume). The regular bedding is disturbed by two important slumps (beds 88/89 and beds 120 to 124, (Le Hégarat & Ferry, 1990) which correspond to two bios- tratigraphical gaps of :
— a part of B and the whole of C Calpionellid zones for the first one,
— the top of D1 and the base of D2 for the second.
These hiatuses induce disturbances in the chemical record, and lead to some difficulties in recognizing and correlating the different sequences between the platform and the basin series.
2 GEOCHEMISTRY : TRACE ELEMENTS AND STABLE ISOTOPES
Sea-level changes may lead to variations in the chemical composition of sea water by modifications in the chemical element input/output. In the pelagic realm, carbonate sediments record these variations, and many authors (Renard,
1985; Accarie et ai, 1989; Pratt et al., 1991; Cromblad &
Malmgren, 1981; Renard & Letolle, 1983; Pomerol, 1984; Re
nard, 1986) have shown that some trace element contents (e.g. strontium or manganese) could be related to eustatic fluctuations from the Early Jurassic to the Present.
The evolution of stable isotope ratios of carbon and oxygen in pelagic carbonates are generally used as indicators of carbon cycling, salinity and temperature. They can provide useful records of paleo-oceanographic and paleocli- matic changes at different time-scales.
2.1. METHODS
Manganese concentrations were measured, by atomic absorption spectrophotometry, in the carbonate fraction (acetic acid soluble fraction) of structureless pelagic limestone samples (Tab. I and II). The carbon and oxygen isotopic composition of the bulk carbonates were measured on the same samples. The values are recorded per mil relative to the PDB standard. The precision of the measurements, as standard deviation of the mean calculated for replicate analysis, is ± 0.05 %».
TABLE I
Geochemical results of Berrias section.
BERRIAS SECTION
Samples Pos. %CaC03 Mn (ppm) ai3c (%c) 3180 (%<,)
Be 138b 0,35 97,19 41 1,41 -2,33Be 138s 1,50 97,37 58 1,38 -2,71Be 139/3 2,40 97,15 48 1,42 -1,99Be 140 3,00 97,31 55 1,36 -2,87Be 142s 4,50 97,69 49 1,26 -2,82Be 143/2 4,90 97,37 54 1,33 -2,51Be 144b 5,80 97,25 62 1,18 -2,49
Be 6 6,30 97,91 66 1,17 -2,02Be 144s 6,65 96,65 63 1,19 -1,73
Be 7 7,90 98,72 64 1,15 -1,68Be 8 8,15 96,21 85 1,11 -1,98Be 9 830 95,05 98 1,15 -2,32Be 10 8,45 94,82 85 1,08 -2,32Be 11 8,60 96,82 107 1,01 -2,71Be 12 8,90 95,03 103 1,03 -2,31Be 13 9,10 96,03 93 1,05 -2,05Be 14 9,50 96,38 109 1,08 -2,33Be 15 9,75 96,23 128 1,10 -2,14Be 16 10,50 95,03 133 0,91 -2,36Be 17 10,65 94,59 153 1,00 -2,19Be 18 10,80 93,77 190 1,03 -1,86Be 19 11,00 95,06 355 1,04 -1,02Be 20 11,20 91,42 199 1,14 -1,76Be 21 11,60 93,80 154 1,18 -1,87Be 149 11,80 92,66 167 1,26 -1,93Be 22 12,40 97,82 89 1,37 -1,38Be 23 13,20 96,69 97 1,23 -1,81Be 24 14,10 94,39 148 1,12 -2,08Be 25 14,30 91,17 110 1,13 -2,10Be 26 14,60 93,92 108 1,13 -2,09Be 27 15,10 94,33 163 1,18 -2,48Be 28 15,30 93,87 156 1,26 -1,96Be 29 15,50 94,45 149 1,18 -2,47Be 30 15,80 96,22 161 1,18 -2,58Be 31 16,10 96,45 140 1,17 -2,30Be 32 16,35 94,43 141 1,27 -2,49Be 33 16,75 95,22 133 1,24 -2,20Be 34 17,00 95,52 140 1,23 -2,32Be 35 17,20 94,54 157 1,20 -2,41Be 36 17,40 94,08 137 1,30 -2,06Be 37 17,55 94,30 159 1,46 -1,22Be 38 17,75 90,34 143 1,25 -2,10Be 39 18,50 93,31 153 1,26 -2,23Be 40 18,80 92,40 143 1,31 -1,85Be 41 19,15 92,67 151 1,24 -1,92Be 42 19,50 94,19 155 1,17 -2,13Be 43 19,65 94,95 154 1,22 -2,06Be 44 19,90 93,41 131 1,18 -2,06Be 45 20,25 93,55 128 1,20 -2,07Be 46 20,60 94,58 155 1,10 -2,36Be 47 20,80 92,44 145 1,10 -2,30Be 48 20,90 95,76 153 1,09 -1,94Be 49 21,05 95,22 115 1,01 -2,13Be 50 21,20 94,35 129 0,88 -2,32Be 51 21,65 95,97 123 0,79 -2,47Be 52 21,85 96,76 115 0,94 -2,31Be 53 22,20 96,68 128 0,94 -2,21Be 54 22,45 92,91 118 1,00 -1,87Be 55 22,60 95,16 126 0,98 -2,09Be 56 22,80 95,58 130 1,02 -2,15Be 57 23,20 96,12 114 1,16 -0,97Be 58 23,30 92,40 139 1,03 -1,62Be 59 23,90 93,02 151 0,93 -1,70Be 60 24,80 93,00 178 0,96 -1,93Be 61 25,20 94,25 127 0,81 -1,83Be 62 25,50 94,45 145 0,87 -2,21Be 63 26,00 91,69 141 0,97 -1,70Be 64 26,50 91,60 147 0,94 -2,08Be 193 27,00 89,14 126 1,05 -1,97Be 65 27,35 88,35 137 0,99 -2,07
Be 197 28,40 84,60 241 0,99 -2,00Be 199 29,40 79,07 258 1,26 -1,69Be 200b 29,75 72,57 297 1,14 -1,61Be 200s 30,00 79,04 248 1,07 -1,65

208 L. EMMANUEL AND M. RENARD BCREDP 17 (1993)
BERRIAS SECTION (top) GEOCHEMISTRY
LITHOLOGY MICROFACIES MANGANESE (ppm)
; 0.75
l 1.00
Upper part of the stratotype section
dominated by marlstone
intercalations with only estimated
thicknesses
Sequential subdivision based solely
on field observations
Uniform bed thicknesses.
HST identified only by its spacial
position
— ¥h in-beds with----— — abt. pyrite — -
Relatively thick limestone beds, superimposed
by a marlstone of uncertain thickness
-SF-MFS?
- MFS ?
LST
Highly variable bank thicknesses
which are tentatively related
to Milankovitch cycle?. (six parasequences)
Uniform,thin-bedded carbonate bed
reflecting increasing
accomodation space
Thick limestone beds which are thought to correspond to
relative low sea-level
Thinning-upwardtendency
— SB-
HST
ai3C (%c) also (%c)
2.2. MANGANESE
The incorporation of manganese in carbonate sediments is controlled by 2 main processes :
1. coprecipitation with calcite (Bodine et ai, 1965). This method leads to a crystal formula :
[Ca(1.x), Mnx] C03 with x much lower than 1,
Due to the value of the Mn incorporation coefficient (Mi- chard, 1969) and the low concentration in sea water (2 ppb part per billion), these carbonates are impoverished in Mn (between 5 and 50 ppm);
2. precipitation of Mn02 when redox conditions of the environment are favorable.
As Mn02 is soluble acetic acid, this method leads to "high manganese calcites”, but the main part of Mn is not in the lattice of the crystal.
On the one hand, the previous studies generally agree that manganese variations in fine grained marine sediments commonly record the variations of the oxygenation state of sea water and/or interstitial water. The solubility of manganese in reduced water is higher than in oxygenated sea water and its behaviour in stratified water masses reflects this property. If manganese-poor biogenic calcites fall on the sea floor and stay long enough in the oxidizing layer of sediments, the precipitation of oxides (catalysed by carbonates) leads to an increase in the Mn content of the sediments.
On the other hand, it is now well established that the input of manganese in the ocean is mainly controlled by

BCREDP 17 (1993) VOCONTIAN TROUGH : CARBONATE GEOCHEMISTRY OF THE TITHONIAN - BERRIASIAN 209
berrias section (base) GEOCHEMISTRY
SEQUENCESTRATIGRAPHY
BEDN°. LITHOLOGY MICROFACIES MANGANESE (ppm) Ô13C (%c) 0I8O(%c)
SLOPEFAN
SB (Be 4) ----170
HIGHSTAND « - _MFS_ — TRANSGRESSIVE SYSTEMS TRACT
LOWSTAND PROGRADING _ \VED£E_ _SLOPE FAN SB (Be 3) 133
Thinning-upwardtendency
Erosive and channelized breccia, representing multiple
debris flows
_LZ_148116
1514
Condensed section . .
"Tfiihrimg-upwartT _ tendency
"Erosive mud-TTow _ _ hte<sja_ _
HIGHSTAND _ _ MFS _ __ TRANSGRESSIVE : SYSTEMS TRACT -
7712,
146/7Thinning-upward
tendency
LOWSTANDPROGRADING
WEDGE
SLOPE FAN
SB (Be 2)
LOWSTANDPROGRADING
WEDGE
SLOPE FAN
SB (Bel) 134
143.2142s
Massive mud-flow, debris flow breccia
(facies type II) and discontinuous
debris^flow _ ErosTve surface
Thick bedded limestones
reflecting conditions favourable for
carbonate productions in
lowstand sea level
Channeled interval
138s
138b
Fossil wackestones rich in globochaetids
(facies type I)
Figure 2
Sequence stratigraphy, lithology and geochemistry (Mn, 313C and 3180) of Berrias reference section.LPW : lowstand prograding wedge,TST : transgressive systems tract,HST : highstand systems tract,MFS : maximum flooding surface.
volcano-hydrothermal ridge activity. The amount of manganese in pelagic surface layer sediments is related to the distance of the ridge axis in the Atlantic as well as in the Pacific Ocean (Turekian & Imbrie, 1966). Bender et al. (1970) have measured Mn accumulation rates at the crest of the East Pacific Rise, 25 times higher than the average for the world wide ocean. Lyle (1976) shows that the Mn excess in the surface sediments could be detected as far as 2 000 km from the ridge. A compilation (Accarie & Renard,
unpublished data) of oceanic sediments’ Mn contents (from
Bostrom & Peterson, 1969) and of spreading rates shows a very good relationship between the Mn contents of sediments and the spreading rates of a ridge. Thus, we can postulate that there is a strong parallelism between the history of sea-floor spreading and the evolution of manganese contents in pelagic sediments (Fig. 4). Thus, Andrianiazy &
Renard (1984) have shown that for different periods, Mn contents of carbonate pelagic sediments are related both to the distance of the ridge and to the amount of CaC03 (dilution processes). So, due to this sensibility of Mn

210 L. EMMANUEL AND M. RENARD BCREDP 17 (1993)
Figure 3
Sequence stratigraphy, lithology and geochemistry (Mn, 913C and 9180) of Angles section.
contents to the dilution processes, the amount of Mn in pelagic carbonates could potentially be a good marker of the sedimentary condensations which can occur during a rapid sea-level rise.
In conclusion, Mn distribution in carbonate pelagic sediments appears to be controlled by 4 factors :
— the distance from the ridge,— the ridge activity rate,— the depth, which controls the Mn dilution by the car
bonates and the sea-floor oxygenation,— the carbonate production rate.
2.3. CARBON AND OXYGEN ISOTOPES
2.3.1. Evolution of carbon isotopic composition in the pelagic carbonates
The 313C isotopic signal is one of the most powerful pa- leo-oceanographic and stratigraphic tools in sedimentary geology (Letolle & Renard, 1980; Renard, 1984; Weissert,
1989; Shackleton & Hall, 1984; Hadji, 1991; Corfield et al., 1991). Moreover, pelagic carbonates 313C seem to be, more
or less directly, a paleodepth indicator (Renard & Letolle,
1983). So changes in carbon isotopic composition by the mean of the primary production variations are related to the transgressive/regressive cycles. For example, previous studies indicate that the long-term 313C evolution curve during the Cenozoic (Cavelier et al., 1981) presents several coinciding points with the sea-level variations curve (Vail et al., 1977). Therefore, we propose to test this correlation for the Cretaceous.
2.3.2. Evolution of oxygen isotopic composition in the pelagic carbonates
The use of oxygen isotopic composition in carbonates as a paleothermometer and as a stratigraphical tool is now classic in sedimentary geology. However, due to the effects of burial diagenesis, measurements on bulk carbonates may not be reliable. Nevertheless, the long-term evolution of the bulk carbonate oxygen isotopic ratio cannot be exclusively explained by the diagenesis, and various authors (Renard,
1986; Killingley, 1983; Brand & Veizer, 1981) have shown that diagenesis does not totally remove the original environmental signal. So, oxygen isotopic ratio recorded by bulk carbonates can be used to determine climatic and/or pa-

BCREDP 17 (1993) VOCONTIAN TROUGH : CARBONATE GEOCHEMISTRY OF THE TITHONIAN - BERRIASIAN 211

212 L. EMMANUEL AND M. RENARD BCREDP 17 (1993)
TABLE IIGeochemical results of Angles section
ANGLES SECTION
Samples Pos. %CaC03 Mn (ppm) 313C (fc) 3180 (%o) Samples Pos. O o w Mn (ppm) 313C (%o) Q_> o 2
ANG 61s 2,20 86,04 186 1,23 -3,66 ANG 153ca b 59,50 85,27 324 1,21 -2,64ANG 62s 3,30 79,32 198 1,21 -3,91 ANG 154ca 59,95 86,04 324 1,20 -3,05ANG 64Am 5,30 84,51 179 1,31 -3,45 ANG 155 60,40 86,13 297 1,12 -2,88ANG 64Bs 7,20 85,69 136 1,32 -3,98 ANG 157ca 61,30 88,31 295 1,14 -3,69ANG 66Bb 9,60 87,65 156 1,31 -3,86 ANG 159ca 62,30 89,73 303 1,31 -3,42ANG 66B-60 10,00 88,05 151 1,23 -4,31 ANG 160.2 63,00 90,62 279 1,08 -3,50ANG 67b 10,70 88,70 155 1,26 -3,81 ANG 162s 63,70 88,98 268 1,00 -3,51ANG 67s 12,70 83,97 157 0,64 -4,63 ANG 164ca 64,80 86,22 293 1,23 -2,76ANG 68b 13,10 84,17 148 0,56 -4,51 ANG 165.3 65,40 87,05 280 1,11 -3,01ANG 69b 14,10 85,89 157 1,05 -3,96 ANG 167A 66,50 85,59 280 1,11 -2,98ANG 70b 15,40 87,91 161 1,32 -3,86 ANG 167D 67,75 89,47 261 1,32 -3,02ANG 71m 16,90 87,28 169 1,20 -3,87 ANG 168A 68,60 85,19 284 1,25 -2,75ANG 71-Sllex 17,20 83,08 160 1,18 -4,03 ANG 168C 69,60 84,36 331 1,33 -2,24ANG 72s 18,90 85,21 180 U9 -3,72 ANG 169A.1 70,35 86,35 274 1,26 -2,89ANG 73 19,30 83,47 174 1,18 -4,05 ANG 169C 71,30 88,31 315 1,30 -2,96ANG 74 19,90 84,22 158 1,18 -4,10 ANG 169D.2 71,80 81,83 300 1,28 -2,65ANG 75b 20,50 74,72 163 1,26 -4,05 ANG 170b 72,10 86,90 307 1,25 -2,79ANG 75m 21,30 80,33 159 1,15 -3,52 ANG 171.2 72,70 84,06 333 1,29 -2,53ANG 78m 23,60 69,29 177 1,31 -2,97 ANG 173 73,80 86,71 300 1,33 -2,86ANG 79.1 24,50 67,64 193 1,21 -3,12 ANG 174 74,20 87,33 315 1,27 -2,93ANG 83 26,20 67,23 190 1,17 -3,06 ANG 175.2 74,70 86,16 281 1,32 -2,74ANG 86 27,40 78,53 200 1,25 -3,36 ANG 177 75,30 87,39 287 1,32 -2,77ANG 87.1 28,40 74,91 242 1,54 -2,79 ANG 180.1 76,20 88,44 263 1,36 -2,93ANG 88/89 SL 29,00 76,04 261 1,67 -2,82 ANG 182 77,20 87,36 300 1,27 -3,00ANG 90m 29,70 75,26 269 1,63 -3,00 ANG 185 78,45 84,04 272 1,13 -2,98ANG 91s 30,50 77,16 265 1,50 -3,05 ANG 188 79,90 84,85 291 1,13 -3,09ANG 92A 30,70 80,33 289 1,66 -2,89 ANG 189s 80,95 86,53 289 1,12 -2,99ANG 92B 31,10 86,02 306 1,50 -2,97 ANG 190 81,30 87,24 290 1,15 -3,32ANG 96 32,20 85,07 297 1,80 -3,19 ANG 191m 81,50 87,68 283 1,10 -3,48ANG 99 33,25 91,25 300 1,87 -3,20 ANG 192 82,00 90,76 275 1,13 -3,30ANG lOlca 33,70 88,06 323 1,66 -3,20 ANG 194 82,80 90,29 278 1,08 -2,94ANG 102ca 34,10 88,83 317 1,44 -2,84 ANG 196 83,80 81,46 362 1,07 -3,05ANG 104 34,90 91,23 276 1,52 -3,20 ANG 198 84,80 88,07 322 1,04 -3,36ANG 105.2 35,70 87,44 289 1,40 -2,75 ANG 198/2 85,00 90,76 319 1,08 -2,84ANG 107 36,40 88,64 278 1,46 -3,08 ANG 199.1 86,10 86,33 417 1,15 -3,20ANG 108.2 37,20 83,25 302 1,45 -2,54 ANG 200 87,00 88,21 366 1,15 -3,04ANG 111 38,30 89,48 301 1,72 -2,79 ANG 202.2 87,80 89,75 388 1,20 -2,79ANG 112 38,70 86,00 299 1,73 -2,52 ANG 207 89,45 87,71 312 1,13 -3,45ANG 114b 39,50 90,21 275 1,71 -2,37 ANG 210 90,35 84,82 275 1,09 -3,09ANG 116b 40,50 93,15 250 1,70 -2,70 ANG 211 91,55 88,55 279 1,10 -3,35ANG 117.3 41,40 88,74 248 1,71 -2,38 ANG 214.1 92,65 84,37 326 1,12 -3,06ANG 118m 41,65 91,30 265 1,64 -3,10 ANG 216 93,65 89,26 319 1,13 -3,59ANG 119.2 42,30 90,15 268 1,52 -3,16 ANG 219 95,30 87,51 338 1,05 -3,51ANG 122 SL 43,20 91,68 256 1,73 -2,51 ANG 222 97,00 85,47 318 1,08 -3,43ANG 125 44,30 90,93 268 1,28 -3,42 ANG 225 98,40 83,03 322 1,05 -3,20ANG 127.1 45,20 91,01 263 1,34 -3,08 ANG 228 99,90 81,48 329 1,06 -3,28ANG 128s 46,10 89,43 265 1,21 -3,06ANG 130s 47,00 90,11 244 1,38 -3,00ANG 131A 47,40 93,12 261 1,34 -3,00ANG 131C 48,40 91,51 265 1,18 -3,28ANG 131E 49,60 90,31 274 1,08 -3,06ANG 132 50,60 90,10 263 1,30 -3,06ANG 134.2 51,50 88,71 286 1,25 -2,86ANG 136s 52,40 87,05 265 1,26 -2,76ANG 138.2 53,20 87,12 268 1,29 -2,86ANG 140 54,00 90,04 270 1,28 -2,99ANG 142 54,70 84,97 295 1,23 -2,34ANG 144 55,50 85,55 272 1,25 -2,69ANG 146 56,40 85,44 305 1,16 -2,55ANG 148.1 57,40 85,02 310 1,12 -2,24ANG 149.2 57,85 93,42 322 1,10 -2,67ANG 151.1 58,75 82,11 329 1,08 -2,60
leo-oceanographic fluctuations. For example, Clauser (1988) has proposed a latitudinal thermal gradient for Western Europe deduced from bulk isotopic records of Late Cretaceous samples. Furthermore, this marker could be a good way to distinguish glacio-eustatism from tectono-eustatism (Kauffman et al., 1991).
3 — RESULTS AND SEQUENTIAL DEVELOPMENTS
3.1. BERRIASIAN STRATOTYPIC SECTION
All the results can be found in Tab. I; analyses from beds 22 and 23 must not be taken into account due to

BCREDP 17 (1993) VOCONTIAN TROUGH : CARBONATE GEOCHEMISTRY OF THE TITHONIAN - BERRIASIAN 213
(A1/(A1+F e+ Mn))x 100
80
70
60
50
40
30
20
1 0
00 50 100 150 200
Sea floor spreading rate (mm/y)
Figure 4
Relationship between geochemistry of oceanic sediments and sea floor spreading rates.
the allochthonous components of these samples which were picked up in a slump.
3.1.1. Manganese content evolution (Fig. 2)
Manganese contents of Berrias carbonates are lower than 70 ppm during the Late Tithonian and the major part of the Early Berriasian (Jacobi-Grandis zone). In the upper part of the B Calpionellid zone, we can observe :
— a) from bed 146/7 to bed 11, a slight rise to 107 ppm followed by a slight decrease in bed 13 (93 ppm);
— b) "a manganese peak”, in bed 19, corresponding to the highest Mn content (around 350 ppm) recorded all along the section.
In the lower part of the C Calpionellid zone, above this remarkable Mn event, carbonates corresponding to the breccia deposits of beds 22-23 and beds 23 to 28, are low in manganese. Then, between beds 28 and 48 (upper part of the C and D1 Calpionellid zones), Mn contents remain medium and stable (around 150 ppm). A slight decrease appears just below the D1/D2 boundary (sample 49). The whole D2 zone is characterized by a low Mn content up to bed 188/57, followed by an increase to the top of bed 190. The end of the section (D2 zone) provides a similar trend which begins with relative low contents between beds 191 and 193, followed by an increase up to the double bed 200 with a peak of manganese located in the marly intercalation.
3.1.2. Evolution of the carbon isotopic composition (Fig. 2)
The 13C/12C variability is lower than observed in manganese contents. The long-term evolution of the carbon isotopic ratio shows 3 major geochemical trends :
a) from the bottom of the section to bed 148/16, we observe a slight and constant decrease of the 313C (about0.5 %<,);
b) a progressive increase of 0.5 %<> occurs during the upper part of the B Calpionellid zone and the values remain
more or less constant during the whole C Calpionellid zone. The end of this second trend is underlined by a positive shift in bed 37;
c) the final part (D1 to D3 zones) of the 313C curve shows a progressive decrease of the values (beds 38 to 200). This third trend is broken by :
— two negative shifts in bed 180/51 (D1/D2 transition zone) and in bed 191/61 (D2/D3 boundary);
— two positive shifts in bed 188/57 (intra D2 Calpionellid zone) and in bed 200B.
3.1.3. Evolution of the oxygen isotopic composition (Fig. 4)
The global trend corresponds to an increase of 3180 values which range between -3 and -1 %° and reflect alternating long periods with negative values, and brief periods with less negative values. In detail, the positive shifts are precisely located in bed 146/7 (-1.68 %<>), bed 19 (-1.02 %»), bed 37 (-1.22 %»), bed 188/57 (-0.97 %«), and bed 200B (-1.61 %»),
3.2. ANGLES SECTION (Fig. 3)
3.2.1. Manganese content evolution
The global evolution of the manganese content curve is disturbed by the presence of two major slumped zones. Therefore, the Upper Tithonian and the Lowest Berriasian strata (beds 60 to 75/78, A3 and B Calpionellid subzones) are low in manganese (lower than 200 ppm) without significant geochemical breaks. In the upper part of the B zone, the Mn content begins to increase just before the occurrence of the first slump (beds 88-89) which screens the whole C Calpionellid zone. This increase goes on above the slump and reaches a maximum (320 ppm) in bituminous limestone beds (bed 102). This Mn content increase is also related to a thinning-upward trend (Strohmenger & Strasser, this volume).

214 L. EMMANUEL AND M. RENARD BCREDP 17 (1993)
The next interval (beds 102 to 119) is characterized by a thickening-upward trend in sedimentological features and the manganese curve shows a progressive decrease of about 50 ppm. From bed 120 (second slump) to bed 140, Mn contents remain low and constant (around 250 ppm) without any significant geochemical discontinuities.
The upper part of the section shows more variability in manganese amounts which allows the definition of two geochemical cycles with similar trends :
— the first one begins with an increase in manganese content from bed 140 to bed 151 followed by a slight decrease up to bed 160,
— the second one begins with a zone with constant values (around 250 ppm) between beds 160 to 167D. Then, Mn content increases in an alternate marl-limestone succession with characteristic variations (beds 168 and 169) of parasequences, and reaches a maximum in bed 171. The first Valanginian strata (beds 171 to 180) show a progressive decrease in Mn contents.
3.2.2. Evolution of the carbon isotopic composition
It is possible to distinguish three major trends in the curve of carbon isotope distribution :
a) the base of the section (between beds 61 and 87) shows constant values (ranging between +1.15 and +1.30 %») with a negative shift located at the Tithonian/Ber- riasian boundary (beds 67s and 68b);
b) between the two slumps (beds 88/89 to bed 124), 313C ratio are higher. In detail, there is an increase from bed 90 to 99 (bed 99 : 1.87%o, maximum value recorded in the Berriasian). Afterwards, a rapid decrease appears in beds 101 and 102 and is followed by a zone (beds 104 to 108.2) with a carbon isotopic ratio lower than 1,5%o. The isotopic ratio increases (by about 0.3 %») between beds 108 and 111, and remains more or less constant up to the second slump;
c) above this slump, the 913C decreases, at first rapidly (beds 119 to 125) then slowly, to reach a minimum (+ 1.00 %o at bed 162). The 313C increases progressively towards the top of the section but does not exceed + 1.5
3.2.3. Evolution of the oxygen isotopic composition
In the base of the section (up to bed 75), oxygen isotopic ratios range between -4.30 %0 and -3.50 %» with a negative excursion in beds 67s (-4.63%») and 68b (-4.51%°). A sharp increase (more than 1.00 %o) between bed 75 and bed 78 is followed by a progressive positive evolution from beds 80 to 118. A sudden negative break appears just below the second slump (beds 120/124) and the values remain low up to bed 132 where a positive trend occurs with a maximum located in bed 148 (-2.24 %°). A negative excursion leads to an isotopic ratio lower than -3.40%» between beds 157 and 162. Afterwards, values rise again over -3.00%» with a positive shift in bed 168.
3.3 SEQUENCE STRATIGRAPHY-GEOCHEMISTRY RELATIONSHIPS
In the sequence-stratigraphic framework (Jan Du Chêne
et al., this volume), the name of each sequence corresponds to the one of its basal boundary.
According to the behaviour of the manganese during the oceanic sedimentation (see above), we can postulate that the lowstand deposits (LST) could have low manganese contents. Transgressive systems tracts (TST) could be characterized by an increase or contents and highstand systems tracts (HST) by a decrease of contents. The maximum flooding surface (MFS) could be located at the maximum of manganese contents.
3.3.1. Berrias section (Fig. 2)
Depositional sequences TI6 and Be1These two sequences are characterized by low manga
nese contents which are compatible with the presence of lowstand systems tracts.
Depositional sequence Be2
In this sequence, a slight progressive increase of the Mn content begins which reaches a maximum in the next sequence. In spite of this positive long-term trend, the Be2 sequence is relatively well documented by geochemistry, with low Mn values in the LST (beds 142 to 144), increasing values in the small TST from bed 7 to bed 11 (MFS) and decreasing values in the HST. The sequence-stratigraphic framework points out the Be3 sequence boundary at the top of bed 13, whereas the best candidate for geochemistry seems to be the middle of level 12.
Depositional sequence Be3This is, with regards to the geochemistry, the most
obvious sequence of the Berriasian stratotypic section. Related to its low manganese contents, the interval between 146/14 and 148/16 corresponds to lowstand deposits. A sharp increase (more than 200 ppm) provides evidence for the transgressive systems tract with a good accuracy in the location of the maximum flooding surface in bed 148/19. This remarkable event is also confirmed by a positive shift in the 3180 curve, and by a Dynocyst increase both in quantity and in diversity (Steffen & Gorin, this volume). It may be related to the Cinder Bed of the Dorset Purbeckian series as suggested by paleomagnetic correlations (Jan Du Chêne
et al., this volume). The end of the sequence Be3 shows a rapid manganese decrease, but the values remain relatively higher than in the previous lowstand. This corresponds to a highstand systems tract truncated by the overlying debris flow (beds 22-23/150). Thus, the manganese curve agrees with field arguments to locate the Be4 sequence boundary at the base of bed 150.
Depositional sequence Be4The base of this sequence (beds 22/150 to 27), is cha
racterised by low Mn contents which are related to lowstand deposits. This part is overlain by a zone of relative high values which remain consistently flat. The Mn curve does not give enough evidence to precisely locate the MFS, and this zone could be interpreted, in a first approach, as undistinguished transgressive and highstand systems tracts (beds 27 to 49). Nevertheless, the MFS could be located in bed 37 by a 3180 positive shift (- 1.22 %°); this proposition is close to the previous framework (MFS in the top of bed 38).
Depositional sequence Be5The Be5 sequence boundary is well documented by a
Mn negative shift located in bed 49, whereas field observations put it at the base of bed 180/51. This geochemical

BCREDP 17 (1993) VOCONTIAN TROUGH : CARBONATE GEOCHEMISTRY OF THE TITHONIAN - BERRIASIAN 215
break is more or less synchronous with the D1/D2 Calpio- nellid boundary. Between beds 180 and 188, the low trace element values could be interpreted as the lowstand system tract. Afterwards, the increasing trend in Mn amounts indicates a TST. Nevertheless, because of the poor quality of the outcrop, which does not provide enough samples, there is a slight disagreement between the stratonomy and 9180 propositions (bed 58) and the Mn proposition (bed 60) to precisely locate the MFS.
Depositional sequence Be6
The sequence boundary Be6 is clearly expressed by a negative break at the base of bed 191/61. Above this boundary, numerous outcrop hiatuses do not provide a sampling sufficient for a detailed interpretation of the Be6 sequence. Geochemistry does not provide support for the approximate location of the different systems tracts as it does with bios- tratigraphic correlations (Jan Du Chêne et al., this volume).
Depositional sequence Be7
The latest sequence of the Berrias section is better documented than the Be6 sequence. The Mn curve shows evidence of a lowstand systems tract between beds 193/65 and 197, but due to hiatuses in the outcrop, it is impossible to precisely define the top lowstand surface. The upper part of the section (beds 199 and 200) corresponds to a TST capped by a MFS in bed 200B (marly limestones with a high manganese content and 9180 increase).
3.3.2. Angles section (Fig. 3)
Depositional sequences Ti5 and Ti6
The Tithonian depositional sequences, only analysed in the Angles section, show low Mn contents which only suggest evidence of lowstand deposits, without the possibility of precisely defining the different systems tracts. However, the base of the section is marked by a sharp decrease in Mn contents between beds 64A and 64B, which allows us to locate the sequence boundary Ti6 near the base of bed 64B.
Depositional sequence Be1
As for the Tithonian sequences, Mn contents are low (low- stand deposits). The Be1 sequence boundary (between beds 67 and 68) is overlain by a slight decrease in Mn contents, and especially by an important negative shift in 9180 and 913C curves related to the hardground of the top of bed 67.
Depositional sequence Be2
The Mn values remain low and still suggest lowstand deposits. Geochemistry does not provide evidence for the exact location of the sequence boundary. By field observations, we have interpreted the bed setting of this sequence as only a LST, but the Mn increase suggests that the end of this sequence (beds 86 and 87) belongs to the beginning of the TST just before the slump 1. This proposition is also in concordance with the palynofacies interpretation (Steffen
& Gorin, this volume).
Depositional sequence Be3
Due to the massive slump (beds 88-89) which strongly disturbs this part of the section (lack of C Calpionellid zone), the top of sequence Be2 and the whole of Be3 are missing.
Depositional sequence Be4On lithological arguments, the Be4 sequence boundary
is placed at the base of the slumped beds 88/89, which are interpreted as an erosive lowstand slope fan. The depositional sequence Be4 also appears as the most developed sequence in the Berriasian strata. The evolution of the manganese curve confirms the presence of a thin LST (beds 90-91) with low contents. The transgressive systems tract (between beds 92 and 102) is recognised by an increase, and the maximum flooding surface (320 ppm in Mn content) can therefore be placed near bed 102. Then, decreasing values, up to bed 118, can be interpreted as a developed HST.
The basal sequence boundary Be5 is also well documented by a negative manganese excursion and must be located at the top of bed 117.
Depositional sequence Be5
Geochemistry (no significant geochemical variations between beds 120 to 132) does not provide evidence to support the field sequence interpretation. There are also no significant variations in the abundance of Dinocysts (Steffen
& Gorin, this volume) in this interval, but other specialities (clay mineralogy and nannofossils) confirm the previous sequence-stratigraphic interpretation. This ambiguity is not well understood but we can suggest either an extreme condensed TST (recorded in only one layer) or the lack of a part of the sequence (TST and the basal part of the HST) due to slump 2 disturbance.
Depositional sequence Be6
The sequence boundary Be6 is not clearly expressed in the geochemical curves, but according to lithological and biostratigraphical arguments, it can be placed at the base of bed 132. Therefore, the interval between beds 132 to 142 is interpreted as a lowstand systems tract with relative low Mn contents. The following interval (beds 142 and 151), characterized by an increase in Mn contents and 9180 increase, corresponds to a transgressive systems tract. Above, decreasing Mn values between beds 151 to 160 characterise the overlying HST. This feature means that we can locate the maximum flooding surface of sequence Be6 near bed 151.
Depositional sequence Be7
The sequence boundary Be7 is marked by a minor break in the Mn curve near bed 162.
The lowstand systems tract (between beds 162 and 167D) is emphasized by low Mn values. Then, increasing manganese contents up to bed 170 characterize the transgressive systems tracts. Moreover, the small Mn content variations between beds 167 and 170 bring evidence for parasequences recorded during the transgressive systems tract. Due to its Mn content, bed 171 seems to be a good candidate for the maximum flooding surface also well documented by organic facies studies. For more details see Steffen & Gorin (this volume). The top of the section corresponds to a highstand systems tract with decreasing manganese contents.
3.3.3. Comparison of sequence and geochemical correlations between Berrias and Angles sections
Geochemical correlations within the pre-established sequence- stratigraphic framework
Globally, there is a good agreement between the sequence-stratigraphic framework and the Mn content evo-

216 L. EMMANUEL AND M. RENARD BCREDP 17 (1993)
(angles) ( BERRIAS) m
Figure 5
Relationship between manganese curves in Berrias and Angles sections deduced from sequence stratigraphy based on field observations.
lution curve. Nevertheless, if we try to correlate each sequence boundary and each maximum flooding surface between the Berrias and Angles sections (Fig. 5), we can observe some discrepancies between the two geochemical curves, particularly in the Upper Berriasian.
In both sections, for the Upper Tithonian and Lowest Berriasian sequences (Ti6 to Be2), sequential correlations match geochemical correlations. The comparison of the two Mn curves gives evidence of the presence of a part of the Be2 sequence TST just below the slump 1 in Angles (samples 86-87). This slump screens the upper part of Be2 and the whole Be3 sequence in Angles. The Be4 MFS is located in sample Angles 101 (well obvious in Mn curve) and Berrias 37 (not obvious in Mn curve but clear in oxygen curve).
The Be5 sequence boundary location leads us to correlate the low Mn contents of Angles 117 with those of Berrias 49, although a correlation Angles 117-Berrias 44 would be better. The Be5 MFS is located in Angles 131C (without geochemical evidence) and between Berrias 58-59 (high Mn contents). Sequence boundary Be6 location correlates Angles 132 (no geochemical evidence for a sequence boundary) with Berrias 61 (geochemically obvious sequence
boundary). Be6 MFS correlates Angles 151 (high Mn content) with Berrias 63 (low Mn Contents). Manganese-low samples Angles 160 and Berrias 193 correspond to the Be7 sequence boundary, while manganese-high samples Angles 171 and Berrias 200b represent the MFS of this last sequence.
The main discrepancy concerns Be5, Be6 and the base of Be7 sequences. So, the pre-established sequence-stratigraphic framework leads us to correlate a zone with low Mn contents in Angles (samples 116 to 132) with a high Mn zone in Berrias (samples 58 to 60) and an Angles high Mn content zone (samples 146 to 159) with a low Mn zone in the Berrias section (samples 61-65).
A new sequence-stratigraphic framework proposition based on geochemical data (Fig. 6)
By examining biostratigraphic and sedimentological data, we can try to propose a new sequential framework compatible with geochemical correlations between the Angles and Berrias sections. To make the understanding of this new scheme easier, we shall describe the succession of the various sequences In an antistratigraphic order.

BCREDP 17 (1993) VOCONTIAN TROUGH : CARBONATE GEOCHEMISTRY OF THE TITHONIAN - BERRIASIAN 217
(angles) ( BERRIAS)
Figure 6
Sequence stratigraphy correlation of Berrias and Angles sections based on geochemical results (manganese).
Sequence Be7The MFS of this sequence should not be put in bed 171
in Angles, as thought in the pre-established framework, because this leads to the addition of an extra sequence in the Valanginian (Emmanuel, 1993). So, we propose to locate it in sample 199. In this way Angles 199 can be correlated with Berrias 200b in concordance with Mn curves.
Sequence boundary Be7 does not change in Angles (level 160) but we relocate it in Berrias, to bed 191/61 (Be6 location in the previous framework). This remains compatible with Calpionellid zonation (D3) and Dinoflagellate zonation (FAD of K. fasciatum, Angles 172 -Berrias 197, and of M. macwhaei forma A, Angles 160 -Berrias 192) (Monteil,
this volume).Sequence Be6The MFS does not change in Angles (151) but must be
located in Berrias between the bottom and the top of level 190 (previous MFS of Be5). This sets a biostratigraphic problem, as this MFS is within the D3 Calpionellid zone in the Angles section and within the D2 zone in Berrias. Yet, we must notice that the lower boundary of the D3 zone does
not seem to be well established in Berrias (various locations between 1984 and 1986). This new proposition is supported by the FAD of Systematophora sp A (Angles 190 - Berrias 190).
In the Angles section, sequence boundary Be6 (D2 zone) seems to be located lower (130) than in the previous scheme (132). In Berrias, Be6 corresponds to bed 178/49 (D1/D2 transition zone). This correlation is supported by the occurrence of T. apatela (Monteil, this volume).
Sequence Be5In the Berrias section, this sequence is very condensed.
Its basal boundary can be located in bed 172/44 (D1 zone) and its MFS between levels 174-176/46-48 (D1/D2 zone).
In the Angles section, the sequence boundary could be placed at the top of bed 117 (D1 zone), and it seems that sedimentary disturbance, linked with the slump 2, screens the MFS of this sequence.
Sequence Be4The MFS of this sequence could be located in Angles
101 and Berrias 167-168 (37-38), which is compatible with biostratigraphic data (D1 zone). The basal boundary

218 L EMMANUEL AND M. RENARD BCREDP 17 (1993)
remains located just below the breccia in Berrias (sample 149/21, near the B/C zone boundary), Be4 boundary is eroded by the slump 1 in the Angles section.
Sequence Be3Related to the previous framework, this sequence (zone
C) is not modified in the Berrias section (Sb (Be3) = level 148/13 and MFS = bed 19). In the Angles section, the whole sequence disappears in the slump 1.
Sequence Be2For this sequence (zone B), geochemical data also agree
with the pre-established framework (MFS = bed 12 and Sb (Be2) betwen level 142/143). In Angles, the Be2 sequence boundary could be lower (bed 72) than thought (bed 78), and there is geochemical evidence for the pre
Figure 7Berrias section - Pre-established sequence-stratigraphic framework without geochemical data (left side) and proposition of a new sequential framework with integration of geochemical results
(right side).
sence of the lower of the TST of this sequence just below slump 1 (beds 86, 87).
Sequence Be1, Ti6 and Ti5
Geochemical data does not bring new information about these sequences.
For both sections, Figures 7 and 8 summarize the correlation between the pre-established sequence-stratigraphic framework built without geochemical data, and the new proposition which integrates these data. These propositions should be checked by additional analysis in the outcrops studied and other Vocontian sections.

BCREDP 17 (1993) VOCONTIAN TROUGH : CARBONATE GEOCHEMISTRY OF THE TITHONIAN - BERRIASIAN 219
Figure 8
Angles section - Pre-established sequence-stratigraphic framework without geochemical data (left side) and proposition of a
new sequential framework with integration of geochemical results (right side).

220 L. EMMANUEL AND M. RENARD BCREDP 17 (1993)
4 CONCLUSIONS
The integration of the geochemical results (Mn, 913C and ô180) from Berrias and Angles sections into the Berriasian sequence-stratigraphic framework of these sections shows a good relationship both with the second and third order sea-levei variations. However, the understanding of the second order curves relationship is only possible by considering a longer time interval (Late Tithonian - Barremian for example; Emmanuel, 1993) than the one taken into account in this paper.
At the level of third oder variations, manganese contents fluctuations correlate well with relative sea-level changes and help to characterise the various systems tracts :
— low values of manganese contents are recorded in the lowstand systems tract,
— increasing values occur in the transgressive systems tract with the maxima content corresponding to the maximum flooding surface,
— decreasing values in the highstand systems tract.Preliminary data on other various sections in age and
environment (Emmanuel et al., 1993) seem to show that this geochemical behaviour could be global in time and space. So, carbonate geochemistry certainly represents a powerful tool for sequence-stratigraphic interpretation.
Acknowledgements
We are very grateful to P. Vail, T. Jacquin, R. Jan Du Chêne
and ail the “Vocontian team” for their friendly help. Many thanks are also due to J. Riveline, J.F. Deconinck, S. Hadji
and J.C. Corbin for sampling assistance. Funds for this research were provided by Université Pierre-et-Marie Curie, Paris, CNRS (through URA 1315) and Bureau de Recherches géologiques et minières.
5 — REFERENCES
Accarie, H., Renard, M., Deconinck, J.F, Beaudoin, B. & Fleu
ry, J.J. (1989). — Géochimie des carbonates (Mn, Sr) et minéralogie des argiles de calcaires pélagiques sénoniens. Relation avec l’eustatisme (Massif de la Mai- ella, Abruzzes, Italie). — C.R. Acad. Sci. (Paris), (2), 309, 1679-1685.
Andrianiazy, A. & Renard, M. (1984). — Trace element contents of carbonates from holes 549 and 550B (Leg 80) : comparison with some tethyan and atlantic sites. — In : Graciansky, PC. de, Poag, C.W. et al. (eds.); Init. Rep. Deep Sea Drill. Proj., U.S. Govt. Printing Off., Washington, vol. LXXX, 1055-1072.
Bender, M.L., Teh-Lung, Ku & Broecker, W.S. (1970). — Accumulation rates of manganese in pelagic sediments and nodules. — Earth and planet. Sci. Lett., 8, 143-148.
Bodine, M.W. Jr., Holland, H.D. & Borcsik, M. (1965). — Coprecipitations of manganese and strontium with calcite. Symposium-Problems of postmagmatic ore deposition with special reference to the geochemistry of ore veins. — Geol. Surv. Czechoslovakia, Prague, 2, 401-406.
Bostrom, K. & Peterson, M.N.A. (1969). — Precipitates from hydrothermal exhalations on the East Pacific Rise. — Econ. Geol., 61, 1258-1265.
Brand, U. & Veizer, J. (1981). — Chemical diagenesis of a multicomponent carbonate system — 2. Stable isotopes. — J. sediment. Petrol., 51, 987-997.
Busnardo, R., Le Hégarat, G. & Magne, J. (1965). — Le stratotype du Berriasien. — Bur. Rech. géol. min., Mém. 34, 5-33.
Cavelier, C., Chateauneuf, J.J., Pomerol, C., Rabussier, D., Renard, M. & Vergnaud-Grazzini, C. (1981). — Geologic events at the Eocene-Oligocene boundary. — Paleo- geogr., Palaeoclimatol., Palaeoecol., 36, 223-248.
Clauser, S. (1988). — Etudes stratigraphiques du Cam- panien et du Maastrichtien de l’Europe occidentale. Biochronologie, magnétostratigraphie, stratigraphie isotopique, radiochronologie comparée du domaine océanique et des régions stratotypiques. Contribution à la paléoclimatologie du Crétacé supérieur. — Thèse 3e cycle, Univ. P.-et-M. Curie Paris, Mem. Sci., Terre, 88-19, 245 pp.
Corfield, R.M., Cartlidge, J.E., Premoli Silva, I. & Housley,
R.A. (1991). — Oxygen and carbon isotope stratigraphy of the Paleogene and Cretaceous limestones in the Bot- tacione Gorge and the Contessa Highway sections, Umbria, Italy. — Terra Nova, 4, 4, 414-422.
Cotillon, R, Ferry, S., Gaillard, C., Jautee, E., Latreille, G. & Rio, M. (1980). — Fluctuations des paramètres du milieu marin dans le domaine vocontien (France Sud-Est) au Crétacé inférieur : mise en évidence par l’étude des formations marno-calcaires alternantes. — Bull. Soc. géol. France, (7), 22, 5. 735-744.
Cromblade, H.G. & Malmgren, B.A. (1981). — Climatically controlled variation of Sr and Mg in Quaternary planktonic foraminifera. — Nature, 291, 61-64.
Deconinck, J.-F. (1993). — Clay mineralogy of the Late Tithonian-Berriasian deep-sea carbonates of the Vocontian Trough (SE France) : relationships with sequence stratigraphy. — Bull. Centres Rech. Explor.- Prod. elf Aquitaine, 17, 1, 223-234.
Emmanuel, L. (1993). — Apport de ia géochimie à la stratigraphie séquentielle. Application au Crétacé inférieur vocontien. — Thèse 3e cycle, Univ. P.-et-M. Curie Paris, Mém. Sci. Terre, 93-5, 191 pp.
Emmanuel, L., Corbin, J.C., Jan Du Chêne, R., Riveline, J.,
Renard, M. & Vail, P.R. (1993). — La géochimie des carbonates : un outil de la stratigraphie séquentielle. Séance spécialisée : «Signaux physico-chimiques de la stratigraphie» S.G.F. (Paris, 14 décembre 1992), Abstract, 2 pp.
Galbrun, B. (1984). — Magnétostratigraphie de la limite Jurassique-Crétacé. Proposition d’une échelle de polarité à partir du stratotype du Berriasien (Berrias, Ardèche, France) et de la Sierra de Lugar (Province de Murcie, Espagne). — Thèse 3e cycle, Univ. P.-et-M. Curie Paris., 153 pp.
Galbrun, B., Rasplus, L. & Le Hégarat, G. (1986). — Données nouvelles sur le stratotype du Berriasien : corrélations entre magnétostratigraphie et biostratigraphie. — Bull. Soc. géol. France, (8), 2, 4, 575-584.
Hadji, S. (1991). — Stratigraphie isotopique des carbonates pélagiques (Jurassique supérieur-Crétacé inférieur) du bassin d’Ombrie-Marches (Italie). — Thèse 3e cycle, Univ.P.-et-M. Curie Paris, Mem. Sci. Terre, 91-23, 160 pp.
Jan Du Chêne, R., Busnardo, R., Charollais, J., Clavel, B.,
Deconinck, J.-F., Emmanuel, L., Gardin, S., Gorin, G., Ma-
nivit, H., Monteil, E., Raynaud, J.-F., Renard, M., Steffen,
D., Steinhauser, N., Strasser, A., Strohmenger, C. & Vail,
P.R. (1993). — Sequence-stratigraphic interpretation of Upper Tithonian-Berriasian reference sections in South- East France : a multidisciplinary approach. — Bull. Centres Rech. Explor.-Prod. Elf Aquitaine, 17, 1, 151-181.

BCREDP 17 (1993) VOCONTIAN TROUGH : CARBONATE GEOCHEMISTRY OF THE TITHONIAN - BERRIASIAN 221
Kauffman, E.G., Elder, W.P. & Sageman, B.B. (1991). — High- resolution correlation : a new tool in chronostratigraphy.— In : Einsele, G., Ricken, W. & Seilacher, A. (eds.): Cycles and Events in Stratigraphy, 795-819. — Springer- Verlag, Berlin.
Killingley, J.S. (1983). — Effect of diagenetic recristallization on 180/160 values of deep-sea sediments. — Nature, 301, 594-597.
Le Hégarat, G. (1973). — Le Berriasien du S.E. de la France.— Doc. Lab. Géol. Fac. Sci. Lyon, 43, 575 pp.
Le Hégarat, G. (1980). — Berriasien. In : Cavelier C. & Roger J. (coord.), Les étages français et leurs stratotypes. — Bur. Rech. géol. min., Mém. 109, 96-105.
Le Hégarat, G. & Remane, J. (1968). — Tithonique supérieur et Bérriasien de la bordure cévenole. Corrélation des ammonites et des calpionelles. — Geobios, 1,1, 7-70.
Le Hégarat, G. & Ferry, S. (1990). — Le Berriasien d’Angles (Alpes-de-Haute-Provence, France). — Geobios, 23, 3, 369-373.
Letolle, R. & Renard, M. (1980). — Evolution des teneurs en 13C des carbonates pélagiques aux limites Crétacé/Tertiaire et Paléocène/Eocène. — C.R. Acad. Sel. (Paris), 290, 827-830.
Lyle, M. (1976). — Estimation of hydrothermal manganese input to the oceans. — Geology, 4, 12, 733-736.
Médioni, R. coord, et al. (1984). — Berriasien - Valanginien.— In : Debrand-Passard, S. et al. (eds.) : Synthèse géologique du Sud-Est de la France. — Bur. Rech. géol. min., Mém. 126, Ci2.
Michard, G. (1969). — Contribution à l’étude du comportement du manganèse dans la sédimentation chimique. Thèse d’Etat, Univ. Paris, 195 pp.
Monteil, E. (1993). — Dinoflagellate cyst biozonation of the Tithonian and Berriasian of South-East France. Correlation with the sequence stratigraphy. — Bull. Centres Rech. Explor.-Prod. Elf Aquitaine, 17, 1, 249-273.
Pomerol, B. (1984). — Géochimie des craies du bassin de Paris. — Thèse Doct. Etat, Univ. P.-et-M. Curie, Mem. Sci. Terre, 84-21, 540 pp.
Pratt, L.M., Force, E.R. & Pomerol, B. (1991). — Coupled manganese and carbon-isotopic events in marine carbo
nates at the Cenomanian-Turonian boundary. — J. sediment. Petrol., 61, 3, 370-383.
Renard, M. (1985). — Géochimie des carbonates pélagiques : mises en évidence des fluctuations de la composition des eaux océaniques depuis 140 ma. Essai de chimiostratigraphie. — Doc. Bur. Rech. géol. min., 85. 650 pp.
Renard, M. (1986). — Pelagic carbonate chemiostratigraphy (Sr, Mg, 1sO, 13C). — Mar. Micropaléontology, 10, 1-3, 117-164.
Renard, M, & Letolle, R. (1983). — Essai d’interprétation du rôle de la profondeur de dépôt dans la répartition des teneurs en manganèse et dans l’évolution du rapport isotopique du carbone des carbonates pélatiques : influence de l’oxygénation du milieu. — C.R. Acad. Sci. (Paris), 296, 1739-1740.
Schackleton, N.J. & Hall, M.A. (1984). — Carbon isotope data from leg 74 sediments. — In : Moore, Jr. T.C., Rabi- nowitz, P.D. et al.; Init. Rep. Deep Sea Drill. Proj., U.S. Govt. Printing Off., Washington, 613-620.
Steffen, D. & Gorin, G. (1993). — Palynofacies of the Upper Tithonian-Berriasian deep-sea carbonates in the Vocontian Trough (SE France). — Bull. Centres Rech. Ex- plor.-Prod. Elf Aquitaine, 17, 1, 235-247.
Strohmenger, C. & Strasser, A. (1993). — Eustatic controls on the depositional evolution of Upper Tithonian and Ber- riasian deep-water carbonates (Vocontian Trough, SE France). — Bull. Centres Rech. Explor.-Prod. Elf Aquitaine, 17, 1, 183-203.
Turekian, K.K. & Imbrie, J. (1966). —The distribution of trace elements in deep-sea sediments of the Atlantic ocean.— Earth and planet. Sci. Lett., 1, 4, 161-168.
Vail, P.R., Mitchum, R.M. Jr., Todd, R.G., Widmier, J.M., Thompson, S.lll, Sangree, J.B., Bubb, J.N. & Hatlelid, W.G. (1977). — Seismic stratigraphy and global changes of sea level. — In: Payton, C.E. (ed.) : Seismic stratigraphy- applications to hydrocarbon exploration. — Amer. Assoc. Petroleum Geo!., Mem. 26, 49-212.
Weissert, H. (1989). — C-lsotopes stratigraphy, a monitor of palaeoenvironmental change : a case study from the early Cretaceous. — Surveys in Geophysics, 10, 1-61.

CLAY MINERALOGY OF THE LATE TITHONIAN-BERRIASIAN DEEP-SEA CARBONATES OF THE VOCONTIAN TROUGH (SE FRANCE) : RELATIONSHIPS WITH SEQUENCE STRATIGRAPHY
MINÉRALOGIE DES ARGILES DES SÉDIMENTS CARBONATÉS PROFONDS D’ÂGE TITHONIQUE-BERRIASIEN DU BASSIN VOCONTIEN (SE DE LA FRANCE) : RELATIONS AVEC LA STRATIGRAPHIE SÉQUENTIELLE
Jean-François DECONINCK
DECONINCK, J.-F. (1993). - Clay mineralogy of the Late Tithonian-Berriasian deep- sea carbonates of the Vocontian Trough (SE France) : relationships with sequence stratigraphy [Minéralogie des argiles des sédiments carbonatés profonds, d’âge tithonique - berriasien du bassin vocontien (SE de la France) : relations avec la stratigraphie séquentielle]. - Bull. Centres Rech. Explor.-Prod. Elf Aquitaine, 17, 1, 223-234, 6 fig.; Boussens, June 24, 1993. - ISSN : 0396 - 2687. CODEN : BCREDP.La minéralogie de la fraction argileuse des carbonates hémipélagiques à péla
giques du Tithonique supérieur/Berriasien du bassin vocontien est étudiée par diffraction des rayons X. Nous considérons ici la coupe du stratotype de Berrias et la coupe d’Angles (Tithonique supérieur/Berriasien).
A Berrias les assemblages argileux, constitués essentiellement de proportions variables d’illite, d’interstratifiés et de kaolinite semblent résulter essentiellement d'apports détritiques. L’absence de kaolinite au passage Jacobi/Subalpina constitue le fait majeur observé dans la succession minéralogique argileuse du stratotype du Berriasien. L’absence de kaolinite à cette période paraît principalement déterminée par des conditions climatiques arides à mettre en relation avec un bas niveau marin. Le facteur climatique oblitère l'influence des fluctuations eustatiques de troisième ordre sur la composition des cortèges minéralogiques. La kaolinite apparaît de nouveau dans la sous-zone à Subalpina. Les apports de kaolinite seraient liés à la fois au développement d’un climat plus humide et au caractère transgressif des dépôts. Dans la partie supérieure du Berriasien (zones C à D2 des Calpionelles), les fluctuations relativement faibles des assemblages argileux paraissent principalement associées aux variations eustatiques de 3e ordre. Les cortèges de bas niveau se caractérisent par l’abondance de l'illite par rapport à la kaolinite. La proportion de kaolinite augmente dans les dépôts transgressifs, atteint son maximum au voisinage des surfaces d’inondation maximale puis décroît par rapport à l'illite dans le cortège de haut niveau.
Dans le Berriasien d’Angles, les assemblages argileux ont subi des transformations diagénétiques liées à l’enfouissement. Celles ci s’expriment en particulier par les fortes proportions de chlorite rencontrées dans les bancs calcaires, par rapport aux horizons plus argileux enrichis en illite. Malgré l’influence diagénétique nette, les fluctuations des proportions d’illite peuvent être rattachées aux variations eustatiques de 3e ordre. Les pourcentages d’illite sont maximum aux limites de séquences, élevés dans les cortèges de bas niveaux, décroissants dans les intervalles transgressifs et comme à Berrias minimum au voisinage des surfaces d’inondation maximale.Jean-François Deconinck, Laboratoire de Dynamique sédimentaire et structurale,
URA 719 CNRS, Université de Lille, Sciences de la Terre, F-59655 Villeneuve d'Ascq cedex - October 21, 1992.
Mots clefs : Minéraux argileux, Roche carbonatée, Tithonique, Coupe-type, Berriasien, Eustatisme (Stratigraphie séquentielle), Diagenèse, Paléoclimat, Sédimentation pélagique, Ardèche (Berrias), Alpes de Haute-Provence (Bassin Vocontien).
0396-2687/93/0017-0223 $ 2.40 © 1993 elf aquitaine production, F-31360 Boussens

224 J.-F. DECONINCK BCREDP 17 (1993)
ABSTRACT
The clay fractions of Late Tithonian/Berriasian hemipelagic to pelagic carbonates of the Vocontian Trough are studied using X-ray diffraction. Two sections are investigated, in Berrias (Berriasian stratotype) and Angles.
In Berrias, the clay mineral assemblages are dominated by illite, mixed layers and kaolinite in various proportions. Most clay minerals seem to have a detrital origin. Kaolinite inputs are due to both the development of a more humid climate and transgressive conditions. In the upper part of the section (Calpionellid zones C to D2), relatively few variations of clay assemblages result from third-order eu- static fluctuations. Lowstand systems tracts are characterized by the abundance of illite relative to kaolinite. The proportions of the latter mineral increase in transgressive systems tracts, reach a maximum close to maximum flooding surfaces and decrease in high- stand systems tracts.
The most striking feature occurring in the Berrias section is the fact that kaolinite disappears in the grandis and at the base of the subalpina Ammonite subzones. This reflects arid climatic conditions probably related to a second-order lowstand of sea-level. The control of third-order eustatic fluctuations on the clay mineral sedimentation is overprinted by this climatic factor.
In the Berriasian of Angles, the influence of burial diagenesis on clay assemblages is expressed by the replacement of smectite by chlorite in limestone beds. Despite this diagenetic influence, the variations of the illite percentages can be attributed to third-order eustatic fluctuations. Maximum percentages of illite are recorded near the sequence boundaries. These percentages are higher in lowstand systems tracts than in transgressive systems tracts, and the minimum abundance of illite coincides with maximum flooding surfaces.
Key words : Clay minerals, Carbonate rocks, Tithonian, Type section, Berriasian, Eustasy (Sequential stratigraphy), Diagenesis, Paleoclimate, Pelagic sedimentation, Ardèche (Berrias), Alpes de Haute-Provence (Vocontian Basin).
CONTENTS
INTRODUCTION - GEOLOGICAL SETTING............................ 2241. - METHODS............................................................... 2242. - CLAY MINERALOGY OF THE BERRIASIAN STRATO
TYPE SECTION....................................................... 2252.1. RESULTS.......................................................... 2252.2. DISCUSSION................................................... 225
2.2.1. Influence of diagenesis with depth of burial 2252.2.2. Relationships between clay mineralogy and
sequence stratigraphy...................... 2253. - CLAY MINERALOGY OF THE BERRIASIAN OF ANGLES 229
3.1. RESULTS.......................................................... 2293.2. DISCUSSION................................................... 232
3.2.1. Influence of diagenesis..................... 2323.2.2. Relationships between clay mineralogy and
sequence stratigraphy....................... 2324. - CONCLUSION........................................................ 2325. - REFERENCES......................................................... 233
INTRODUCTION — GEOLOGICAL SETTING
The clay mineral assemblages are studied in two classical sections cropping out in the realm of the Vocontian Trough near Berrias (Berriasian stratotype) and Angles (Fig. 1).
Figure 1Location map of the studied sections
The sediments of the Berriasian stratotype are dominantly composed of periplatform carbonates deposited on the western border of the Vocontian Trough (Strohmenger &
Strasser, this volume). Accurate biostratigraphic data (Ammonites, Calpionellids) are available (Busnardo et ai, 1965; Le Hégarat & Remane, 1968; Le FIégarat, 1973, 1980), together with magnetostratigraphic data (Galbrun et al., 1986).
In Angles, the Tithonian is mainly composed of carbonate mud flows, debris flows and fluxoturbidites containing fossils of shallow-water origin (Strohmenger & Strasser, this volume). The base of the Berriasian consists of massive limestones with redeposition facies (Strohmenger & Strasser,
this volume), giving way upwards to pelagic marl-limestone alternations corresponding to fluctuations of the marine environment forced by orbital parameters in the Milankovitch frequency band (Cotillon et ai, 1980; Rio et ai, 1989). Two slumpings are responsible for biostratigraphical gaps revealed by the absence of Calpionellid zones (Le FIégarat
& Ferry, 1990).The main purpose of this study is to investigate how var
iations in the clay mineralogy of deep-sea carbonates may reflect eustatic fluctuations as well as diagenesis, paleoclimate or structural instability.
1 METHODS
Each sample is decarbonated using 0.2 N hydrochloric acid. The excess acid is removed by successive washing with deionized water. The clay fraction is separated by

BCREDP 17 (1993) VOCONTIAN TROUGH : CLAY MINERALOGY OF LATE TITHONIAN-BERRIASIAN CARBONATES 225
sedimentation and centrifugation, and oriented pastes are made on glass slides. Three X-ray diagrams are made using a Philips diffractometer (PW 1730) with CuKa radiations, after air-drying (untreated sample), saturation with ethyleneglycol, and heating at 490°C over two hours. Semi-quantitative evaluations are based on the peak heights and areas summed to 100%, the relative error being 5% (Holtzapffel, 1985). In addition, the relative abundance of two clay species is estimated using the ratio between the intensity of the basal reflexion of each mineral. The samples studied often concern the same beds as those used for chemical and palynofacies analyses (Emmanuel & Renard; Steffen & Gorin, this volume).
All the studied samples are limestones. Even in intervals composed of marl-limestone alternations from the Angles section, the clay mineralogy of the limestones is studied, mainly because in the Vocontian Trough the origin of clay minerals (detrital or diagenetic) is better defined in carbonate beds (Deconinck, 1987a).
In this paper, the legend of clay minerals (Fig. 2) is the same for all figures; the name of each sequence corresponds to the name attributed to the lower sequence boundary.
2 CLAY MINERALOGY OF THE BERRIASIAN STRATOTYPE SECTION
2.1. RESULTS
The clay-mineral assemblages are mainly composed of illite, kaolinite and various mixed layers. Trace amounts of chlorite also occur in most samples (Fig. 2). These results are in agreement with those presented by Geyer (1991).
The stratigraphic distribution of the clay assemblages allows the distinction of three mineralogical zones (Fig. 2).
In zone I (Fig. 2a), the clay assemblages are variable and composed of abundant illite (35 - 70%), kaolinite (traces to 25%) and random illite-smectite mixed layers (Fig. 3). They characterize lowstand prograding-wedge and slope-fan deposits. The top of this mineralogical zone is not well defined because of gaps in the sampling.
Mineralogical zone II comprises illite, vermiculite and mixed layers. The absence of kaolinite is characteristic (Fig. 2b). The mixed layers include random illite-smectite and chlorite-smectite probably associated with chlorite-ver- miculite. A mineralogical change occurs between samples 146/7 and 146/8. The clay fraction of samples 146/6 and 146/7 (subzone lia) is composed of a mixture of illite, chlorite-smectite and vermiculite-smectite mixed layers occurring together with vermiculite (Fig. 3). Subzone lib is characterized by illite, illite-smectite and chlorite-smectite mixed layers (Fig. 3).
In mineralogical zone III, from bed 148/16 upwards, kaolinite increases (Fig. 2b). This zone is characterized by clay assemblages composed of various proportions of illite (10 to 35%), kaolinite (5 to 30%), mixed layers and chlorite (traces). The mixed layers comprise random illite-smectite and sub-regular chlorite-smectite types (Fig. 3). Mineralogical zone III can be subdivided into subzones Ilia and 111 b, the limit between the two corresponding to decreasing proportions of chlorite-smectite mixed layers (Fig. 2b).
2.2. DISCUSSION
2.2.1. Influence of diagenesis with depth of burial
In the Berriasian stratotype section, there is no clear evidence of diagenesis due to burial, but in this region few clay mineral data from over- and underlying formations are available. Sedimentary smectite may have been replaced by random or sub-regular chlorite-smectite and illite-smectite mixed layers, but such an assessment is not very reliable in the absence of regional studies of clay mineralogy.
To examine relationships between sequence stratigraphy and clay sedimentology, we mainly use the relative abundance of illite and kaolinite, which probably have a detrital origin.
2.2.2. Relationships between clay mineralogy and sequence stratigraphy
• Mineralogical zone I
The abundance of illite and the strong fluctuations of the kaolinite/illite ratio suggest intense erosion of varying continental sources. In most sediments, illite derived from the erosion of crystalline basement of continental landmasses, while kaolinite is reworked from soils developed in weathering profiles. According to field and microfacies observations, this mineralogical zone is composed of stacked lowstand prograding-wedge and slope-fan deposits. Strong erosion is probably related to lowstand of sea-level. Clay mineralogy does not allow us to distinguish the lowstand prograding-wedge from the slope-fan nor to define the sequence boundaries.
• Mineralogical zone II
The most striking features occurring in the Berrias section are the absence of kaolinite at the transition between Jacobi- Gran dis and Occitanica Ammonite zones (mineralogical zone II, Fig. 2b), and the increasing proportions of kaolinite from bed 148/16 upwards.
The absence of kaolinite during the period corresponding to the mineralogical zone II is well documented in the South- East of France. In the Swiss and French Jura Mountains, the Purbeckian facies deposited during this period (Clavel et al., 1986) are also characterized by the absence of kaolinite. Furthermore, the occurrence of illitic minerals resulting from the replacement of smectite suggests wetting and drying cycles in supratidal environments (Deconinck & Stras- ser, 1987; Deconinck et al., 1988). In the Vocontian Trough, the Jurassic/Cretaceous boundary is depleted in kaolinite (Deconinck, 1984; Deconinck et at., 1985). According to clay minerals and other climatic indicators, Hallam et al., (1991) have suggested that a period of aridity may be responsible for such a depletion in kaolinite. In the Purbeck beds of the Jura Mountains, aridity is expressed by the abundance of illitic minerals formed at surface temperature in alternating wet and dry environments. These illitic minerals are also well-known in green marls occurring in the carbonate platform surrounding the Vocontian Trough (e.g. Calcaires Blancs of Provence, Babinot et al., 1971).

226 J .-F. DECONINCK BCREDP 17 (1993)
• Transition between mineralogical zones II and III.
Increasing proportions of kaolinite occur from bed 148/16 upwards within the subalpina subzone. In the Jura Mountains, a similar change in clay mineralogy is recorded between the Purbeckian facies (Goldberg Formation) and the transgressive Pierre-Châtel Formation (Persoz & Remane,
1976; Deconinck & Strasser, 1987) which is also situated in the subalpina subzone (Clavel et al., 1986). Consequently, at Berrias and in the Jura Mountains, the appearance of kaolinite occurs synchronously. In the Jura Mountains, the mineralogical change correlates with the transgressive surface situated between the Purbeckian facies and the Pierre- Châtel Formation. This suggests that the transgressive surface of sequence Be3 at Berrias is situated below bed 148/16 coinciding with the appearance of kaolinite (Fig. 2b). At the Jurassic/Cretaceous boundary, a similar trend in clay- mineral suites is also observed in the Purbeck beds exposed along the Dorset Coast (southern England). Kaolinite, absent in the Luiworth beds, appears three meters above the Cinder bed in the Intermarine beds and then increases (Deconinck, 1987b). The Cinder bed corresponds to a maximum flooding surface which occurs, according to mag- netostratigraphic data, at the beginning of chron M17n around the boundary between subalpina and privasensis subzones (Ogg et at., 1991). This suggests a correlation between the oyster-rich Cinder bed and the Be3 maximum flooding surface at Berrias (Jan du Chêne et al., this volume), indicating inputs of kaolinite earlier in the South-East of France than in England (Fig. 4).
Except for this mineralogical change recorded at the top of mineralogical zone II, there are no obvious relationships between sequence stratigraphy and clay mineralogy in this part of the section comprising part of depositional
sequences Be2 and Be3. The relationships between clay sedimentology and sequence stratigraphy are probably obliterated by the climatic influence (aridity) related to a second-order lowstand (see above).
• Mineralogical zone III
This part of the section displays relatively small variations of clay minerals which are composed of illite, mixed layers and kaolinite. This reflects the stability of source areas and stable climatic conditions, which a priori favor the recognition of eustatic fluctuations and relationships between clay mineralogy and sequence stratigraphy. In particular we have studied the relative abundance of illite and kaolinite expressed by the kaolinite/illite ratio.
In the depositional sequences Be4 and Be5, the distribution of clay assemblages is similar. Lowstand systems tracts (slope-fan or lowstand prograding-wedge) are characterized by relatively low values of the kaolinite/illite ratio. The ratio increases in the transgressive systems tract and reaches a maximum in bed 42 of depositional sequence Be4 and at the top of bed 188 (base of 190), corresponding to the maximum flooding surface of depositional sequence Be5 (Fig. 2a). In the depositional sequence Be4, the maximum flooding surface is located in bed 161/38 according to field and microfacies observations (Strohmenger & Strasser, this volume) and to palynofacies (Steffen & Gorin, this volume). Clay mineral data however, suggest that the maximum flooding surface coincides with beds 41/42 which also contain frequent bioturbations (Strohmenger & Strasser, this volume).
In highstand systems tracts, the kaolinite/illite ratio decreases again, and sequence boundaries in the Berrias section are characterized by low values of the kaolinite/illite ratio.

BCREDP 17 (1993) VOCONTIAN TROUGH : CLAY MINERALOGY OF LATE TITHONIAN-BERRIASIAN CARBONATES 227
Figure 2Clay mineralogy of the Berriasian stratotype section
a : lower part. SB, Sequence Boundary; LPW, Lowstand Prograding-Wedge; SF, Slope Fan; b : upper part. SB, Sequence Boundary; TS, Transgressive Surface; MFS, Maximum Flooding Surface; LPW, Lowstand Prograding-Wedge; SF, Slope Fan; TST, Transgressive Systems Tract; HST, Highstand Systems Tract.

228 J.-F. DECONINCK BCREDP 17 (1993)
Figure 3Main X-ray diffraction patterns corresponding to each mineralogical zone identified in the Berriasian stratotype (C, Chlorite.
I, lllite. K, Kaolinite. V, Vermiculite. I-S, lilite-smectite mixed layers. C-S, Chlorite-smectite mixed layers.C-V, Chlorite-vermiculite mixed layers. Q, Quartz).

BCREDP 17 (1993) VOCONTIAN TROUGH : CLAY MINERALOGY OF LATE TITHONIAN-BERRIASIAN CARBONATES 229
Figure 4Comparative clay mineralogical trend across the Jurassic-Cretaceous boundary in South-East France and Dorset (England).
Only the upper part of the Jacobi-Grandis Ammonite zone is plotted. CB, Cinder Bed; TS, Transgressive Surface;MFS, Maximum Flooding Surface.
The similar variations of the kaolinite/iliite ratio recorded in depositional sequences Be4 and Be5 can be explained by variations in the intensity of erosion associated with sea- level fluctuations. Illite and kaolinite have two distinct origins. Illite probably derives from crystalline rocks, whereas kaolinite comes from soils developed on continental areas (e.g. Central Massif). The relative abundance of these two clay species is therefore indicative of the intensity of erosion. Increasing proportions of illite suggest intensification of erosion, while relative abundance of kaolinite indicates surficial soil erosion. Consequently, lowstand systems tracts are enriched in illite and relatively depleted in kaolinite, as is the case in mineralogical zone I composed of stacked slope-fan and lowstand prograding-wedge deposits. The increasing proportions of kaolinite in transgressive systems tracts are due to more surficial erosion of kaolinite-rich pedogenic blankets during sea-level rise.
During the Lower Cretaceous, clay sedimentation on carbonate platforms surrounding the Vocontian Trough was dominated by differential settling processes. A mineralogical distribution depending on hydrodynamic factors can be observed (Darsac, 1983; Adatte & Rumley, 1984; Chamley,1989). Kaolinite is especially abundant on the internal platform, acting as a trap for this mineral. The crude correspondence observed between the maximum of kaolinite and the maximum flooding surfaces suggests that kaolinite may have been partly reworked from the internal platform. Moreover,
differential settling processes diminished during the drowning of the platform allowing the sedimentation of kaolinite in more distal sedimentary areas.
In highstand system tracts, the kaolinite/iliite ratio decreases again, but this is due to a decrease of kaolinite rather than to an increase of illite. The decrease of kaolinite is balanced by increasing proportions of smectitic mixed layers indicating more gentle erosion. A similar increase of smectitic minerals during highstand of the sea-level is recorded in Jurassic and Cretaceous series from the Paris Basin and the Tethyan realm (Accarie et at., 1989; Chamley
et at., 1990).
3 CLAY MINERALOGY OF THE BERRIASIAN OF ANGLES
3.1. RESULTS
The clay assemblages are quite different from those identified in the Berrias section. They are dominantly composed of chlorite, illite and mixed layers, whereas kaolinite is absent, thus indicating a more distal pelagic sedimentation than in Berrias (Fig. 5). Among the mixed layers, it is possible to distinguish random illite-smectite and chlorite-smectite types and a regular chlorite-smectite type close to corrensite (Fig. 6). Strong variations are observed from one
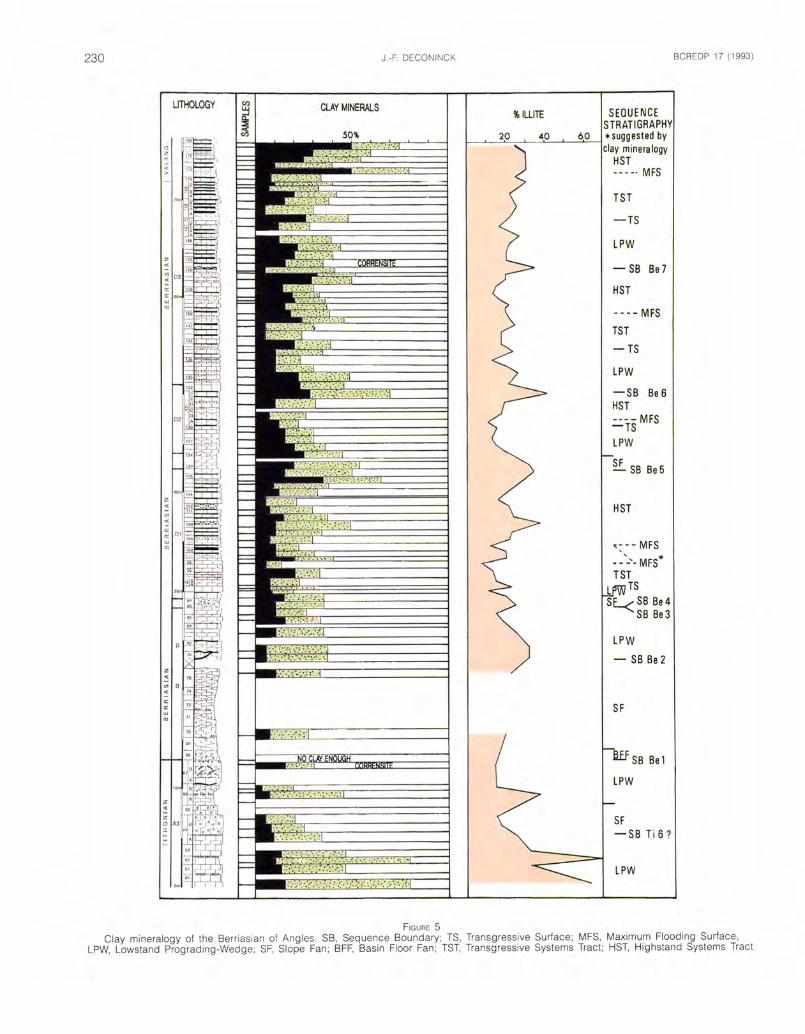
230 J.-F. DECONINCK BCREDP 17 (1993)
Clay mineralogy of the Berriasian of Angles. SB, Sequence Boundary; TS, Transgressive Surface; MFS, Maximum Flooding Surface, LPW, Lowstand Prograding-Wedge; SF, Slope Fan; BFF, Basin Floor Fan; TST, Transgressive Systems Tract; FIST, Plighstand Systems Tract.

BCREDP 17 (1993) VOCONTIAN TROUGH : CLAY MINERALOGY OF LATE TITHONIAN-BERRIASIAN CARBONATES 231
Figure 6Typical X-ray diffraction patterns in the Berriasian of Angles (C, Chlorite. I, lllite. I-S, lllite-smectite mixed layers.
C-S, Chlorite-smectite mixed layers. Q, Quartz).

232 J.-F. DECONINCK BCREDP 17 (1993)
sample to another, and it is difficult in this section to separate distinct clay mineral zones. Notice the presence of increasing proportions of chlorite from the base to the top of the section. Chlorite is especially abundant in the limestone beds of marl-limestone alternations.
3.2. DISCUSSION
3.2.1. Influence of diagenesis
In the Vocontian Trough, numerous studies published on clay mineral distribution in the Mesozoic series document the increasing influence of diagenesis to the East in relation with Alpine orogeny (Deconinck & Chamley, 1983; Ferry et at., 1983; Deconinck & Debrabant, 1985; Levert & Ferry, 1987, 1988; Levert, 1989 a and b). Similar conclusions arise from increasing maturity of organic matter (reflectance and Tmax, Bréhéret, 1985; Crumière et al., 1988).
In the subalpine basin, the role of diagenesis on clay assemblages is particularly well expressed by the replacement of smectitic minerals by chlorite and illite (Deconinck,
1987a; Levert, 1989a and b; Geyer, 1989, 1991). In the Ver- gons section of the Angles region, the evolution of clay mineral assemblages from the Turonian down to Oxfordian shows the progressive illitization and chloritization of smectite (Deconinck, 1987a). Diagenesis is particularly obvious in marl-limestone alternations, where smectites are replaced mainly by illite in marly horizons and by chlorite in limestone beds. The illite-smectite, chlorite-smectite mixed layers and corrensite represent intermediate steps of the transformation. In the Berriasian of Angles, clay mineral assemblages mainly have a diagenetic origin expressed by the high proportions of chlorite in the marl-limestone alternations of the upper part of the section, and by the occurrence of corren- site-like minerals.
3.2.2. Relationships between clay mineralogy and sequence stratigraphy
• Depositional sequences Ti6 and Be1
Strong variations in the composition of the clay fraction (as in Berrias) together with the abundance of various mixed layers characterize this part of the section composed of stacked slope-fan and lowstand prograding-wedge deposits. The clay fraction often contains a magnesium-rich regular chlorite-smectite mixed layer (corrensite) associated with dolomite rhombs. Corrensite probably replaced detrital smectitic minerals and constitutes a transitional phase of the transformation from smectite to chlorite during burial diagenesis.
• Depositional sequences Be2 to Be7
As chlorite and mixed layers mainly have a diagenetic significance, we have particularly studied the evolution of the proportions of illite in the clay fraction of limestone beds. This mineral can be considered as mainly detrital in limestone beds and therefore reflects variations in the intensity of erosion. Increasing proportions of illite would suggest strong erosion associated with lowstand systems tracts and sequence boundaries, whereas the lowest amounts of illite would indicate maximum flooding surfaces.
Sequence boundary Be2 is not exposed, but in the over- lying lowstand prograding wedge, illite is abundant at the
base and then decreases regularly towards the top. Sequence boundaries Be3 and Be4 are amalgamated. The overlying lowstand slope-fan shows increasing proportions of illite. In the transgressive systems tract, the percentages of illite decrease and reach a minimum in bed 99. The maximum flooding surface is situated at the top of bed 102 according to the occurrence of bituminous marlstone (Strohmenger & Strasser, this volume) and higher manganese concentrations (up to 300 p.p.m., Emmanuel & Renard, this volume). Clay mineralogy suggests that the maximum flooding surface is situated a few decimeters below, in bed 99.
The sequence boundary Be5 indicated by overlying channeled deposits (Strohmenger & Strasser, this volume) is also marked by a maximum of illite abundance. In slope- fan deposits, illite is still abundant, decreases in the transgressive systems tract and reaches a minimum at the top of bed 131 A, which may correspond to the maximum flooding surface. In the overlying highstand systems tract, illite increases again with a maximum in bed 132, which is proposed as sequence boundary Be6.
In depositional sequences Be6 and Be7, fluctuations in clay mineralogy are of smaller intensity. Considering the proportions of illite, there is no clear relationship between sequence stratigraphy and clay mineralogy, except in bed 160 where a maximum of illite corresponds to sequence boundary Be7 (Jan du Chêne et al., this volume).
4 CONCLUSION
The clay mineralogy of Late Tithonian/Berriasian deep- sea carbonates studied in two classical sections of South- East France (Berrias and Angles) expresses various aspects of paleoenvironments as well as of burial diagenesis.
1) The composition of clay assemblages is very different in Berrias and Angles. Two major differences are observed :
— in Angles, the abundance of chlorite replacing smectite reflects the influence of burial diagenesis, whereas in Berrias there is no obvious indication of burial diagenesis;
- in Berrias, the occurrence of kaolinite indicates more proximal sedimentary conditions than in Angles, where this mineral is absent in limestones. At the Jurassic/Cretaceous boundary, the depletion of kaolinite associated with a second-order lowstand of the sea-level reflects the onset of an arid phase.
2) Despite these differences, the clay mineralogy of both sections displays some common features in relation with sequence stratigraphy, which can be used together with classical sedimentological criteria to identify systems tracts.
Sequence boundaries and lowstand systems tracts are characterized by relatively high contents of illite or heterogeneous clay assemblages, indicating strong erosion of diversified continental sources.
The clay fraction of transgressive systems tracts is depleted in illite. The minimum amounts of illite coincide with maximum flooding surfaces. In Berrias, transgressive systems tracts are enriched in kaolinite reworked from the internal carbonate platform or coming from the erosion of pedogenic blankets. The maximum of kaolinite percentages seems to indicate maximum flooding surfaces.

BCREDP 17 (1993) VOCONTIAN TROUGH : CLAY MINERALOGY OF LATE TITHONIAN-BERRIASIAN CARBONATES 233
The influence of eustatic fluctuations is often overprinted by other factors such as climatic changes or burial diagenesis. The best expressions of eustatic fluctuations are observed in the upper part of the Berriasian stratotype section, which was deposited during stable climatic and tectonic conditions.
Acknowledgements
I thank H. Chamley, T. Jacquin and P. Vail as well as the members of the Lower Cretaceous Working group for helpful discussion and improvement of the manuscript.
5. — REFERENCES
Accarie, H., Renard, M., Deconinck, J.F., Beaudoin, B. & Fleu
ry, J.J. (1989). — Géochimie des carbonates (Mn, Sr) et minéralogie des argiles de calcaires pélagiques sé- noniens. Relation avec l’eustatisme (Massif de la Maiella, Abruzzes, Italie).— C.R. Acad. Sci. (Paris), 309, 2, 1679- 1685.
Adatte, T. & Rumley, G. (1984). — Microfaciès, minéralogie, stratigraphie et évolution des milieux de dépôts de la plate-forme berriaso-valanginienne des régions de Sainte-Croix (VD) Cressier et du Landeron.— Bull. Soc. neuchât. Sci. nat., 107, 221-239.
Babinot, J.F., Gervais, J., Masse, J.P. & Tronchetti, G. (1971). — Contribution à l’étude micropaléontologique et sédi- mentologique de la formation des « Marnes vertes infra- crétacées» de la Basse-Provence occidentale (Sud-Est de la France). — Ann. Univ. Provence Sci. 46, 189-208.
Breheret, J.G. (1985). — Sédimentologie et diagenèse de la matière organique contenue dans le niveau Paquier, couche repère de l’Albien inférieur vocontien.— C. R. Acad. Sci., (Paris), 301, 2, 15, 1151-1156.
Busnardo, R., Le FIegarat, G. & Magne, J. (1965). — Le stratotype du Berriasien. — Bur. Rech. géol. min., Mém. 34, 5-33.
Chamley, H. (1989). — Clay sedimentology.— Springer Ver- lag. Berlin, 623 pp.
Chamley, H., Deconinck, J.F. & Millot, G. (1990). — Sur l’abondance des minéraux smectitiques dans les sédiments marins communs déposés lors des périodes de haut niveau marin du Jurassique supérieur au Paléogène. — C.R. Acad. Sci. (Paris), 311, 2, 1529-1536.
Clavel, B., Charollais, J., Busnardo, R. & Le Hegarat, G.
(1986). — Précisions stratigraphiques sur le Crétacé inférieur basal du Jura méridional.— Eclogae. geol. Helv., 79, 2, 319-341.
Cotillon, R, Ferry, S., Gaillard, C., Jautee, E., Latreille, G.
& Rio, M. (1980). — Fluctuation des paramètres du milieu marin dans le domaine vocontien (France Sud-Est) au Crétacé inférieur : mise en évidence par l’étude des formations marno-calcaires alternantes.— Bull. Soc. géol. France, (7), 22, 5, 735-744.
Crumiere, J.P., Pascal, F. & Espitalie, J. (1988). — Evolutions diagénétiques comparées de la matière organique et des argiles. Influence de l’enfouissement normal et d’une anomalie thermique par surcharge des nappes alpines (Crétacé subalpin de Haute-Provence, France). — C. R. Acad. Sci., (Paris), 306, 2, 493-498.
Darsac, C. (1983). — La plate-forme berriaso-valanginienne du Jura méridional aux massifs subalpins (Ain, Savoie).
Sédimentologie, minéralogie, stratigraphie, paléogéographie, micropaléontologie. — Thèse 3e cycle, Univ. Grenoble, 319 pp.
Deconinck, J. F. (1984). — Sédimentation et diagenèse des minéraux argileux du Jurassique supérieur-Crétacé dans le Jura méridional et le domaine subalpin (France - Sud- Est). Comparaison avec le domaine atlantique Nord. — Thèse 3e cycle, Univ. Lille, n° 1216, 150 pp.
Deconinck, J.F. (1987a). — Identification de l’origine détritique ou diagénétique des assemblages argileux : le cas des alternances marne-calcaires du Crétacé inférieur subalpin. — Bull. Soc. géol. France., (8), 3, 139-145.
Deconinck, J. F. (1987b). — Minéraux argileux des faciès purbeckiens : (Jura suisse et français, Dorset, (Angleterre) et Boulonnais (France). — Ann. Soc. géol. Nord, 106, 285-297.
Deconinck, J.F., Beaudoin, B., Chamley, H., Joseph, P. & Raoult, J.F. (1985). — Contrôles tectonique, eustatique et climatique de la sédimentation argileuse mésozoïque du domaine subalpin. — Rev. Géol. dyn. Géogr. phys. 26, 5, 311-320.
Deconinck, J.F. & Chamley, H. (1983). — Héritage et diagenèse des minéraux argileux dans les alternances marno-calcaires du Crétacé inférieur du domaine subalpin. — C.R. Acad. Sci., (Paris), 297, 2, 589-594.
Deconinck, J.-F. & Debrabant, P. (1985). — Diagenèse des argiles dans le domaine subalpin : rôles respectifs de la lithologie, de l’enfouissement et de la surcharge tectonique. — Rev. Géol. Dyn. Géogr. Phys., 26, 5, 321-330.
Deconinck, J. F. & Strasser, A. (1987). — Sedimentology, clay mineralogy and depositional environment of Pur- beckian green marls (Swiss and French Jura). — Eclogae. geol. Helv. 80, 3, 753-772.
Deconinck, J. F, Strasser, A. & Debrabant, P. (1988). — Formation of illitic minerals at surface temperatures in Pur- beckian sediments (Lower Berriasian, Swiss and French Jura). — Clay minerals, 23, 91-103.
Emmanuel, L. & Renard, M. (1993). — Carbonate geochemistry (Mn, 313C, 9180) of the Late Tithonian-Berriasian pelagic limestones of the Vocontian Trough (SE France). — Bull. Cent. Rech. Explor.-Prod. Elf Aquitaine, 17, 1, 205-221.
Ferry, S., Cotillon, P. & Rio, M. (1983). — Diagenèse croissante des argiles dans les niveaux isochrones de l’alternance calcaire-marne valanginienne du bassin vocontien. Zonation géographique.— C.R. Acad. Sci., (Paris), 297, 2, 51-56.
Galbrun, B., Rasplus, L. & Le Hegarat, G. (1986). — Données nouvelles sur le stratotype du Berriasien : corrélations entre magnétostratigraphie et biostratigraphie. — Bull. Soc. géol. France., (8), 2, 4, 575-584.
Gardin, S. & Manivit, H. (1993). — Late Tithonian and Berriasian calcareous Nannofossils from the Vocontian Trough (SE France) : biostratigraphy and sequence stratigraphy. — Bull. Centres Rech. Explor.-Prod. Elf Aquitaine, 17, 1, 277-289.
Geyer, M. (1989). — Preliminary results of investigations on clay minerals in the Vocontian basin and its surroundings (SE France) at the Jurassic-Cretaceous Boundary. — Géol. alp. (Grenoble), 65, 45-64.
Geyer, M. (1991). — Répartition régionale et stratigraphique des minéraux argileux dans les calcaires tithoniques et berriasiens du domaine vocontien (SE France). — Thèse, Univ. Neuchâtel, 192 pp.
Hallam, A., Grose, J.A. & Ruffell, A.H. (1991). — Palaeo- climatic significance of changes in clay mineralogy ac- cross the Jurassic-Cretaceous boundary in England and France. — Palaeogeogr., Palaeoclimatol., Palaeoecol., 81, 173-187.

234 J.-R DECONINCK BCREDP 17 (1993)
Holtzapffel, T. (1985). — Les minéraux argileux: Préparation, analyse diffractométrique et détermination. — Soc. géol. Nord Publ., Lille, 12, 136 pp.
Jan du Chene, R., Busnardo, R., Charollais, J., Clavel, B., Deconinck, J.F., Emmanuel, L., Gardin, S., Gorin, G., Ma- nivit, H., Monteil, E., Raynaud, J.F., Renard, M., Steffen, D., Steinhauser, N., Strasser, A., Strohmenger, C. & Vail, PR. (1993). — Sequence stratigraphie interpretation of Upper Tithonian-Berriasian reference sections in South- East France : a multidisciplinary approach. — Bull. Centres Rech. Explor.-Prod. Elf Aquitaine, 17, 1, 151-181.
Le FIegarat, G. (1973). — Le Berriasien du Sud-Est de la France.— Doc. Lab. Géol. Fac. Sci. Lyon, 43, 575 pp.
Le FIegarat, G. (1980). — Berriasien. — In : Cavelier, C. & Roger, J. (coord.) : Les étages français et leur stratotypes. — Bur. Rech. géol. min., Mém. 109, 96-105.
Le FIegarat, G: & Ferry, S. (1990). — Le Berriasien d’Angles (Alpes de Flaute-Provence, France). — Geobios, 23, 3, 369-373.
Le Hegarat, G. & Remane, J. (1968). — Tithonique supérieur et Berriasien de la bordure cévenole. Corrélation des ammonites et des calpionelles. — Geobios, 1,1, 7-70.
Levert, J. (1989a). — Répartition géographique des minéraux argileux dans les sédiments mésozoïques du bassin subalpin : Mise en évidence d’une diagenèse complexe. — Doc. Lab. Géol. Fac. Sci. Lyon, 114, 1991, 175 pp.
Levert, J. (1989b). — Origine diagénétique complexe des minéraux argileux dans le Mésozoïque subalpin. — Geobios, Mém. sp. 11, 239-251.
Levert, J. & Ferry, S. (1987). — Les apports argileux dans le bassin mésozoïque subalpin. Quantification et problème d’altération diagénétique de l’héritage. — Géol. alp. (Grenoble), Mém. h.s. 13, 209-213.
Levert, J. & Ferry, S. (1988). — Diagenèse argileuse complexe dans le Mésozoïque subalpin révélée par cartographie des proportions relatives d’argiles selon des niveaux isochrones. — Bull. Soc. géol. France., (8), 4, 1029-1038.
Ogg, J.G., Hasenyager, R.W. & Wimbledon, W.A. (1991). — Jurassic-Cretaceous Boundary : Portland-Purbeck ma- gnetostratigraphy and possible correlation to the Tethyan faunal Realm. — 3rd Inter. Symp. on Jurassic Stratigraphy, Poitiers, 89.
Persoz, E, (1982). — Inventaire minéralogique, diagenèse des argiles et minéralostratigraphie des séries jurassiques et crétacées inférieures du Plateau suisse et de la bordure sud-est du Jura entre les lacs d’Annecy et de Constance.— Matér. Carte géol. Suisse (n.s.), 155, 52 pp.
Persoz, F. & Remane, J. (1976). — Minéralogie et géochimie des formations à la limite Jurassique-Crétacé dans le Jura et le bassin vocontien. — Eclogae. geol. Flelv., 69, 1, 1-38.
Rio, M., Cotillon, P. & Ferry, S. (1989). — Rhythmic pelagic successions and terrestrial orbital variations. The example of the Lower Cretaceous from Angles (SE France). — Terra Nova, 1, 5, 449-450.
Steffen, D. & Gorin, G. (1993). — Palynofacies of the Upper Tithonian-Berriasian Deep-Sea carbonates in the Vo- contian trough (South-East France). — Bull. Cent. Rech. Explor.-Prod. Elf Aquitaine, 17, 1, 235-247.
Strohmenger, C. & Strasser, A. (1993). — Eustatic controls on the depositional evolution of Upper Tithonian and Ber- riasian deep-water carbonates (Vocontian Trough, SE France). — Bull. Centres Rech. Explor.-Prod. Elf Aquitaine, 17, 1, 183-203.

PALYNOFACIES OF THE UPPER TITHONIAN - BERRIASIAN DEEP-SEA CARBONATES IN THE VOCONTIAN TROUGH (SE FRANCE)
Daniel STEFFEN and Georges GORIN
STEFFEN, D. & GORIN, G. (1993). - Palynofacies of the Upper Tithonian - Berriasian deep-sea carbonates in the Vocontian Trough (SE France). - Bull. Centres Rech. Explor.-Prod. Elf Aquitaine, 17, 1, 235-247, 8 fig., 1 pi.; Boussens, June 24, 1993. - ISSN : 0396-2687. CODEN : BCREDP.Palynofacies analyses were carried out on some 150 samples from three Upper
Tithonian-Berriasian field sections consisting of slope to basin fine-grained carbonates and dated by Calpionellids and Ammonites. By using mainly the autochthonous vs. allochthonous nature and the degree of degradation of organic matter, as well as the hydrodynamical laws governing the deposition of allochthonous fragments, palynofacies variations in time are interpreted in terms of palaeoenvironmental changes associated with sea-level variations. The comparison of this interpretation with a sequence stratigraphic framework established in the field allows the definition of characteristic palynofacies distributions for each systems tract.
Lowstand systems tracts display a low amount and diversity of Dinocysts and an abundant, often degraded allochthonous fraction, which includes large, angular, equidimensional, black, oxidized, humic fragments. Transgressive systems tracts show an increasing amount of Dinocysts and blade-shaped, black, oxidized, humic fragments and an increasing diversity of Dinocysts, whereas equidimensional, black, humic fragments become smaller and more rounded. Highstand systems tracts are characterized by a decrease in abundance and diversity of Dinocysts, an increase of the allochthonous fraction and of the size of equidimensional, black, humic fragments.
These observations can be correlated across the three studied sections and illustrate the value of palynofacies as a complementary tool to other standard methods in establishing a sequence-stratigraphic framework.Daniel Steffen, Georges Gorin, Department of Geology and Paleontology, 13, rue
des Maraîchers, C-H 1211, Geneva 4. - October 29, 1992.
Key words: Organic materials, Palynomorphs, Tithonian, Berriasian, Pelagic sedimentation, Eustasy (Sequence stratigraphy), Carbonate rocks, Ardèche (Broyon, Berrias), Alpes de Haute-Provence (Angles), Vocontian Trough.
CONTENTS
INTRODUCTION........................................................................... 2351. - GEOLOGICAL SETTING.................................................... 236
1.1. Berrias section............................................................ 2361.2. Broyon section............................................................ 2361.3. Angles section............................................................ 237
2. - ORGANIC MATTER CLASSIFICATION.............................. 2373. - PALYNOFACIES RESULTS................................................. 238
3.1. Berrias section............................................................ 2383.2. Broyon section............................................................ 2383.3. Angles section............................................................ 238
4. - DISCUSSION...................................................................... 2414.1. Palynofacies criteria used for palaeoenvironmental
interpretation............................................................... 2414.2. Sequence stratigraphy............................................... 241
4.3. Systems tracts and associated palynofacies.......... 244
5. - CONCLUSIONS.................................................................. 2456. - REFERENCES..................................................................... 245
INTRODUCTION
Sequence stratigraphy has been largely developed these last fifteen years (mainly since Vail et al., 1977), and global eustatic variations have been identified all over the world. These major sea-level fluctuations have a direct influence on palaeoceanography and palaeoecology by changing water circulation, drowning or emerging shelves, modifying terrigenous input in the sea, etc. (Vail et al., 1991).
0396-2687/93/0017-0235 $ 2.60 © 1993 elf aquitaine production, F-31360 Boussens

236 D. STEFFEN AND G. GORIN BCREDP 17 (1993)
The aim of this paper is to address the following problem : how does palynofacies (Combaz, 1964) record these eustatic changes in the investigated sections ? The same approach is proposed using clay mineralogy (Deconinck,
1993, this volume) and geochemistry (Emmanuel & Renard,
1993, this volume).A first attempt at investigating a possible relationship
between palynofacies and eustasy has already been made by Gorin & Steffen (1991) on the Berrias section. This original study is extended here to include two other field sections, thereby allowing for lateral comparisons of organic content. Apart from the Berrias section, two other Upper Tithonian - Berriasian field sections have been investigated at Broyon and Angles (Fig. 1, location). Some 150 samples have been studied (Fig. 2, methodology). The relationship between palynofacies and eustasy was subsequently investigated using a sequence-stratigraphic framework established in the field by the members of the “Vocontian Trough Early Cretaceous working group” (coordinated by R. Jan Du
Chêne and J.-F. Raynaud).
1 — GEOLOGICAL SETTING
The three studied sections are located in the Vocontian Trough (Médioni et al., 1984) in the southeastern French Alps (Fig. 1). They consist mainly of slope and basin deep-sea carbonates. Strohmenger & Strasser, 1993 (this volume) give a more detailed lithological description of the sections.
PREPARATION
OBSERVATION
Figure 2
Procedure used for the preparation and observation of palynofacies samples.
1.1. BERRIAS SECTION
The Berrias section is the Berriasian stage stratotype. It is properly dated by Ammonites and Calpionellids (Busnardo
et al., 1965; Le FIégarat & Remane, 1968; Le FIégarat, 1973, 1980) and is correlated with magnetostratigraphy (Galbrun
et al., 1986). It consists of fine-grained limestones with rare, thin, marly intercalations (beds 161/38 and 161/40). The Berrias sediments represent hemipelagic outer platform deposits (Gorin & Steffen, 1991; Strohmenger & Strasser, 1993, this volume).
1.2. BROYON SECTION
The Broyon section ranges from the Early Tithonian to the Early Berriasian and is dated by Calpionellids and Ammonites (Le FIégarat, 1973; Cecca et al., 1989). The Tithonian interval is represented by a cliff of massive finegrained limestones with local intercalations of breccias. The

BCREDP 17 (1993) VOCONTIAN TROUGH : PALYNOFACIES OF UPPER TITHONIAN - BERRIASIAN CARBONATES 237
Berriasian part of the section displays limestone/marl alternations, where marls are clearly dominant. The Broyon section is interpreted as hemipelagic slope deposits (Dromart et al., 1993; Strohmenger & Strasser, 1993, this volume).
1.3. ANGLES SECTION
The studied interval in the Angles section ranges from the Late Tithonian to the Berriasian/Valanginian boundary and is dated by Calpionellids (Le Hégarat & Ferry, 1990). It consists of massive limestones at the base grading to limestone/marl alternations towards the top. At two different levels, slumped beds coincide with important biostratigra- phical gaps : in beds 88 to 89, the top of B and C Calpio- nellid zones are missing and in beds 120 to 124 the top of D1 and base of D2 are missing. Such hiatuses have already been observed in the Vocontian Trough around the Jurassic - Cretaceous boundary and have been attributed to slope instabilities (Beaudoin, 1980).
The limestone/marl alternations in the Angles section are considered as pelagic basin deposits (Strohmenger & Strasser, 1993, this volume).
2 ORGANIC MATTER CLASSIFICATION
The organic constituents observed in the studied samples have been grouped according to the classification proposed by Whitaker (1984). A summary of this classification is proposed in Figure 3 (modified from Steffen & Gorin, 1993), where the approximate correspondance with coal macérais is also highlighted. The following groups are distinguished :
Palynomaceral group (PM)
It comprises all fragments derived from higher plant debris and is subdivided according to their degree of oxidation :
PM1 - orange to dark brown, translucent, partially oxidized;PM2 - orange to dark brown fragments exhibiting cell-
structures, moderately oxidized. When degraded, PM1 and 2 are distinguished by the suffix B (PM1/2-B);
PM3 - yellow to orange fragments exhibiting cell-structures;
PM4 - black opaque fragments, highly oxidized. It is considered as the most stable palynomaceral and can be transported far out to sea before being degraded (Davies et al., 1991; Gorin & Steffen, 1991). PM4 is subdivided into two fractions : equidimensional PM4 and blade-shaped or tabular PM4 (PM4-T).
Sporomorphs
This term includes pollen and spores. Because of their scarcity in the studied samples they are grouped together in this paper.
Dinoflagellates cysts (= Dinocysts)
Dinocysts are the main representatives of the organic microplankton. All species encountered here are strictly marine (E. Monteil, 1993, this volume).
Foraminifera linings
They are organic linings (tectin) of some Foraminifera, and considered as a marine indicator (Stancliffe, 1989).
The palynomaceral group and sporomorphs constitute the allochthonous fraction (land-derived), whereas Dinocysts and Foraminifera linings represent the (relatively) autochthonous fraction (marine) of the organic residue (Whitaker, 1984; Van Der Zwan, 1990; Gorin & Steffen, 1991).
Figure 3
Origin and classification of particulate organic matter as used in this study (modified from Steffen & Gorin, 1993). Approximate coal macérai equivalents are indicated on the right hand side.(1) Because of the scarcity in sporomorphs, no distinction was made in this study between bisaccates and non-saccates.(2) No fluorescent amorphous organic matter is present in the Berriasian carbonates.(3) Although a few lacustrine species of Dinocysts and Acritarchs are known, all species encountered in this study are marine (E. Monteil, this volume).
ORIGIN GROUP CONSTITUENT APPROX. COAL MACERAL EQUIV.
PM1vitrinitehigher plant
debris(macrophytes
tissues)
palynomacerals(PM)
PM2-1< cn PM3 cutinite
z 2 PM4equidimensional
inertiniteLU O Z É blade-shaped (T)H 8 pollen & spores sporomorphs (1)
bisaccatessporiniteo~i non-saccates
o highly degraded macrophytes
tissues amorphous organic matter
(AOM) (2)
non-fluorescent AOM vitrinite
COZD
io
m |5 8
mainly degraded phytoplankton fluorescent AOM
dinoflagellatecysts
(dinocysts)proximate exinite
(or liptinite)K 5< i marine phytoplankton (3) chorale= s> acritarchs
jg tasmanitidscc^ foraminifera foraminifera test linings

238 D. STEFFEN AND G. GORIN BCREDP 17 (1993)
3 — PALYNOFACIES RESULTS
Before detailing the palynofacies results of the three analyzed sections, it is worth pointing out that the following organic parameters indicate that relatively oxidizing conditions prevailed in the Vocontian Trough during the Late Tithonian and Berriasian :
— the total organic content is always low in the sediments, which can be qualified as organic-lean carbonates (Total Organic Carbon values derived from Rock-Eval pyrolysis never reach 0.2 % wt);
— no fluorescent amorphous organic matter (hydrogen- rich AOM) has been found throughout the three studied sections;
— allochthonous fragments often display a bleached appearance and are frequently pitted;
— even the Dinocysts (richer in hydrogen than palyno- macerals, Whitaker, 1984) are poorly fluorescent when observed under UV-fluorescent light.
3.1. BERRIAS SECTION (Fig. 4)
beds 138 - 146/7 (PI. 1, fig. 1)The base of the Berrias section is dominated by an
assemblage of completely (bio?-) degraded PM1 to PM2 (PM1/2-B) and of some fungal filaments. The rounded shape of some PM1/2-B may suggest that some of this residue consists of fecal pellets (Honjo & Roman, 1978; Turner &
Ferrante, 1979; Porter & Robbins, 1981; Habib, 1983). Equi- dimensional PM4 is large and displays highly corroded edges. Few Dinocysts are present (base of bed 138 and bed 143) and their specific diversity is very low (approx. 2 to 8 species).
beds 147/11 - 149 (PI. 1, fig. 2)
Palynofacies changes drastically in bed 147/11 : PM1/2-B disappears and is replaced by large amounts of PM4-T and Dinocysts. Fragments of PM1 and PM4 are well preserved. In bed 149, Dinocysts represent over 50 % of the total organic residue.
beds 151 - 179 (PI. 1, fig. 3)Similarly to the basal part of the section, this interval is
locally rich in PM1/2-B and fungal filaments. PM4-T and Dinocysts show globally the same trends in their relative proportion, which culminates in samples where PM1/2-B is absent (bed 159/29 and bed 161/38). The upper part of this interval displays a continuously low amount of Dinocysts and an increasing proportion of PM1/2-B.
beds 180 - 188This interval consists essentially of non-fluorescent,
highly degraded allochthonous fragments. Bed 188 contains nearly only large scale PM1/2-B fragments and some peloi- dal particles with a probable fecal origin, but no Dinocysts.
beds 189 - 200 (PI. 1, fig. 4)
Although this interval is poorly outcropping, some samples could be collected. Dinocysts are present at the base,
they disappear in the middle part and reappear abundantly in the Valanginian part of the section, accompanied by Foraminifera linings (bed 197; Otopeta Ammonite zone). Rare sporomorphs are present.
3.2. BROYON SECTION (Fig. 5)
beds 1A - 9
This interval shows no general trends in the distribution of organic particles. However, the allochthonous fraction is clearly dominant throughout. PM1/2-B is always present in variable proportions. Some sporomorphs have been observed. Dinocysts are absent to rare, with a small peak in abundance and diversity in bed 9.
beds 10 - 18C (PI. 1, fig. 5)
This interval corresponds to the massive cliff-forming limestones in the Broyon quarry. The palynofacies consists only of highly degraded allochthonous particles. The proportion of PM1/2-B increases towards the top, where these fragments reach large sizes (up to 600 ^rm). PM4-T is absent and no Dinocysts have been found.
beds 19-30 (PI. 1, fig. 6)
Although the autochthonous part is never abundant (from 0 to 5 % Dinocysts), the organic content in the uppermost part of the Broyon section changes drastically. PM1/2-B, which is dominant in the underlying interval, completely disappears. Non-corroded equidimensional fragments of PM4 are smaller. PM4-T, absent in the beds below, is present in large proportions. Organic matter distribution in this interval is rather monotonous and does not show any abrupt variations.
3.3. ANGLES SECTION (Fig. 6)
beds 60 - 75 (PI. 1, fig. 7)
High amounts of PM1/2-B and filaments of probable fungal origin are present. A low quantity of sporomorphs has been observed throughout the interval. Dinocysts are virtually absent : few specimens have been encountered and their relative proportion never reaches 2 %, so that they are not shown in Figure 6.
beds 78 - 87
These beds display intermediate characteristics between those of the underlying and overlying intervals. PM1/2-B and sporomorphs are still present at the base but disappear in the upper part. They are accompanied by a low proportion of Dinocysts and PM4-T.
beds 88-160
PM1/2-B is episodically reoccurring. Dinocysts are present throughout in variable proportions. Peaks in their distribution correspond to maxima of PM4-T and of small, rounded, well sorted, equidimensional PM4 fragments (e. g. beds 130 and 142). Rare Foraminifera linings have been encountered, their presence often being associated with high amounts of Dinocysts (e. g. beds 105 and 142).

BCREDP 17 (1993) VOCONTIAN TROUGH : PALYNOFACIES OF UPPER TITHONIAN - BERRIASIAN CARBONATES 239
BERRIASex
13U
Palynofacies% marine fraction % terrestrial fraction
Seq.PM4 grainsize ^
(|im)0 20 40 60 80 0 20 40 60 80 100 0 60 120
Berrias section : biostratigraphy (Busnardo et at., 1965; Le Hégarat & Remane, 1968; Le Hégarat, 1973), lithology, palynofacies and sequence stratigraphy. The sequence-stratigraphic interpretation was established in the field by the “Vocontian Trough Early Cretaceous
working group" coordinated by R. Jan Du Chêne and J.-F. Raynaud.
The following abbreviations are used :Biostratigraphy - Am. = Ammonites, Ca, = Calpionellids.Palynofacies - F.L. = Foraminifera linings, H.D.D. = high Dinocyst diversity, PM1 = palynomaceral 1, PM 1/2-B = palynomacerals 1 and 2 degraded, PM4 = equidimensional palynomaceral 4, PM4-T = blade-shaped palynomaceral 4.Sequence stratigraphy - sb = sequence boundary labelled Be1, Be2, etc. and highlighted by an orange line, tls = top lowstand surfacehighlighted in red, mfs = maximum flooding surface highlighted in green. Intervals highlighted in red correspond to lowstand systems tracts(LST), those in green to transgressive systems tracts (TST) and those in orange to highstand systems tracts (HST),

240 D. STEFFEN AND G. GORIN BCREDP 17 (1993)
BROYON Palynofacies% marine fraction
0 20 40 60
% terrestrial fraction 20 40 60 80
PM4 grainsize (Hm)
100 0 60 120
Seq.str.
Figure 5
Broyon section : biostratigraphy (Le Hégarat, 1973; Cecca et al., 1989), lithology, palynofacies and sequence stratigraphy. The sequence- stratigraphic interpretation was established in the field by the “Vocontian Trough Early Cretaceous working group”
coordinated by R. Jan Du Chêne and J.-F. Raynaud. See Figure 4 for explanation of abbreviations.

BCREDP 17 (1993) VOCONTIAN TROUGH : PALYNOFACIES OF UPPER TITHONIAN - BERRIASIAN CARBONATES 241
beds 161 - 180 (PI. 1, fig. 8)
This interval is characterized by the absence of PM1/2-B and the remarkably high content in autochthonous particles (mainly Dinocysts and also Foraminifera linings). Some spo- romorphs have been locally observed. Dinocysts represent up to 30 % of the total organic residue in the Valanginian part (beds 172 and 178).
4 — DISCUSSION
4.1. PALYNOFACIES CRITERIA USED FOR PALAEOENVIRON- MENTAL INTERPRETATION
Based on literature, Gorin & Steffen (1991) proposed some criteria to convert palynofacies observations into a palaeoenvironmental interpretation valid for open marine carbonates. These criteria are summarized in Figure 7 and can be better understood when integrated in the depositio- nal model illustrated in Figure 8. The following additional comments are needed (Gorin & Steffen, 1991) :
— the use of these criteria does not give any absolute indication, it may just indicate whether the depositional environment evolves towards “more proximal” or “more distal" conditions;
— the distribution of allochthonous fragments is mainly controlled by hydrodynamical processes (Fig. 7 and 8; see also Fisher, 1980; Tyson, 1987). These fragments are sorted according to their buoyancy (increasing buoyancy scale proposed by Whitaker, 1984, Van Der Zwan, 1990: PM4, PM1, PM2, PM3 and sporomorphs, Steffen & Gorin, 1992). Within a category, particle sorting is essentially determined by size and shape (criteria 4 and 5 in Fig. 7; Parry et al., 1981; Davies et al., 1991));
— the nature of the autochthonous fraction is directly related to ecological conditions (Davies et al., 1991). The number of Dinocysts species increases towards more open marine conditions (criterion 2 in Fig. 7; Fig. 8; see also Denison & Fowler, 1980; Lister & Batten, 1988; Van Pelt & Habib, 1988; Habib & Miller, 1989; Van Der Zwan, 1990);
— the degree of biodegradation depends largely on the oxygen content at the site of deposition and globally decreases towards more open marine conditions (Van Der Zwan, 1990).
The application of these criteria to the Upper Tithonian - Berriasian carbonates of the Vocontian Trough helps in recognizing regressive and transgressive episodes. This is a fundamental step in a sequence-stratigraphic analytical procedure.
4.2. SEQUENCE STRATIGRAPHY
Palynofacies results can be subsequently interpreted in terms of palaeoenvironment within the sequence-stratigraphic framework established in the field by the “Early Cretaceous Vocontian Trough working group”. This framework is shown on the right hand side of Figures 4, 5 and 6. Hereafter, each sequence will be referred to using the name attributed to its lower sequence boundary (e. g. sequence BeX begins with sequence boundary sb-BeX).
— Sequences Ti4, Ti5 and Ti6 (Fig. 5 and 6)Tithonian sequences in Broyon and Angles show an
organic fraction clearly dominated by allochthonous fragments, with exceptionally high amounts of PM1/2-B and large equidimensional PM4 grains. This indicates a dominant continental influence with no signs of transgression, and corresponds in the sequence-stratigraphic framework to a succession of stacked lowstand systems tracts. However, it is not possible to locate sequence boundaries on the basis of palynofacies investigations alone.
— Sequence Be1 (Fig. 4, 5 and 6)This sequence is poorly outcropping in Broyon. In Berrias
and in Angles, autochthonous organic constituents are absent and PM1/2-B increases towards the top, indicating a regressive trend. As in the Tithonian interval, organic content does not indicate any evidence of a transgression and fits with lowstand systems tract deposits.
— Sequence Be2 (Fig. 4, 5 and 6)This sequence is characterized by a decrease (or an
absence in Broyon) of PM1/2-B and by the appearance of few Dinocysts. The top of sequence Be2 does not outcrop in Broyon and is missing in Angles (hiatus). It has only been observed in Berrias : a sharp increase in Dinocysts (beds 146/8 to 146/11), indicating a rapid shift towards more distal conditions, marks the transgressive systems tract. The high- stand systems tract deposits (beds 146/12 to 146/14A) contain a high proportion of Dinocysts (more than 20 %). A decrease in their specific diversity indicates a regressive trend.
— Sequence Be3 (Fig. 4, 5 and 6)Sequence Be3 has not been observed in Broyon and in
Angles for the same reasons as for the top of sequence Be2. In Berrias, lowstand systems tract deposits contain a continuously low percentage of Dinocysts. At the top of the sequence, a sharp increase in Dinocysts may suggest the transgressive systems tract, or already the highstand systems tract. However, poor outcrop quality does not allow a precise location of the systems tract boundaries.
— Sequence Be4 (Fig. 4, 5 and 6)The base of sequence Be4 is missing in Angles (absence
of C Calpionellid zone). But the thin deposits (beds 89 to 91) just above the slumps, which contain low percentages of Dinocysts, some sporomorphs and PM1/2-B, suggest relatively proximal conditions fitting with a lowstand systems tract. In Berrias, this lowstand systems tract is well developed, but its organic content displays erratic and sharp variations, which may indicate condensed horizons at the parasequence scale.
The transgressive systems tract in Berrias is marked by a shift to a relatively more distal organic content : disappearance of PM1/2-B, presence of Foraminifera linings and enrichment in Dinocysts and PM4-T, the latter culminating at the maximum flooding surface (bed 161/38). Similar features are observed in Angles around bed 112, but based on lithology and bed-stacking patterns the maximum flooding surface has been placed at bed 102 (Strohmenger &
Strasser, 1993, this volume), where no significant change in the organic content is observed.
— Sequence Be5 (Fig. 4 and 6)Both in Berrias and in Angles, the lowstand systems tract
is characterized by a low content in Dinocysts and the presence of PM1/2-B. In Berrias, palynofacies investigations do

TITH
ON
IAN
B
ERR
IASI
AN
242 D. STEFFEN AND G. GORIN BCREDP 17 (1993)

BCREDP 17 (1993) VOCONTIAN TROUGH : PALYNOFACIES OF UPPER TITHONIAN - BERRIASIAN CARBONATES 243
ANGLES (top) Palynofacies% marine fraction
O
2
<tt><CLCLLUCO
20 40 60 80___ I
l’KDD.
-dinocysts
-dinocysts
H.D.D.
Figure 6
Angles section : biostratigraphy (Le Hégarat & Ferry, 1990), lithology, palynofacies and sequence stratigraphy. The sequence-stratigraphic interpretation was established in the field by the “Vocontian Trough Early Cretaceous working group” coordinated by R. Jan Du Chêne and
J.-F. Raynaud. See Figure 4 for explanation of abbreviations.

244 D. STEFFEN AND G. GORIN BCREDP 17 (1993)
Energy : Higher Lowerm—open marine carbonates
ratio marine/terrestrial components
number of dinoflagellate cyst species
degree of PM1 - PM4 biodegradation
proportion of PM4 - T
size, sorting and rounding of equldimensional PM4 fragments
Figure 7
Palynofacies criteria used for palaeoenvironmental interpretation (modified from Gorin & Steffen, 1991).
not allow the identification of the transgressive systems tract, whereas the highstand systems tract shows regressive features (decrease in Dinocysts and in PM4-T).
— Sequence Be6 (Fig. 4 and 6)
The top of sequence Be6 does not outcrop in Berrias. In the basal part, the absence of Dinocysts and the presence of PM1/2-B suggest a lowstand systems tract. In
Angles, the top lowstand surface is clearly marked by an abrupt increase in Dinocysts which remain abundant in the highstand systems tract.
— Sequence Be7 (Fig. 4 and 6)
Similarly to the top of sequence Be6, the basal part of sequence Be7 could not be tested at Berrias because of poor outcrop quality. At Angles, a regressive trend in the lowstand systems tract is suggested by a progressive decrease in Dinocysts. Both in Berrias and in Angles, the transgressive systems tract is characterized by a significant increase in Dinocysts and the presence of Foraminifera linings. This increase is stabilized at the maximum flooding surface (around bed 200 in Berrias and bed 171 in Angles). In both sections, the maximum flooding surface is marked by a maximum in Dinocysts diversity.
4.3. SYSTEMS TRACTS AND ASSOCIATED PALYNOFACIES
Each type of systems tract displays a characteristic palynofacies distribution, which can be summarized as follows from the base to the top of each systems tract :
Lowstand systems tract (LST) - the Dinocysts abundance and diversity are low, the allochthonous fraction is generally dominant (mainly PM1/2-B) and equidimensional PM4 grains are large and angular.
Transgressive systems tract (TST) - the proportion of PM4-T and the abundance and diversity of Dinocysts are continuously increasing, PM1/2-B disappears and equidimensional PM4 grains become smaller and more rounded.
Flighstand systems tract (FIST) - the proportion of Dinocysts and PM4-T decreases, the allochthonous fraction becomes more important and the size of equidimensional PM4 increases.
Figure 8
Depositional pathways of particulate organic matter (POM). Allochthonous organic matter comprises higher plant debris (palynomacerals) and sporomorphs. Relatively autochthonous organic matter comprises fluorescent amorphous organic matter, marine phytoplankton and
Foraminifera linings.1 - Transport from emerged land by air and flotation (bisaccates)2 - Transport from emerged land by rivers and marine currents3 - Reworking of shallower sediments4 - Resuspension or reworking by burrowers.

BCREDP 17 (1993) VOCONTIAN TROUGH : PALYNOFACIES OF UPPER TITHONIAN - BERRIASIAN CARBONATES 245
5 — CONCLUSIONS
In the Upper Tithonian - Berriasian deep-sea carbonates of the Vocontian Trough, the organic content displays significant relative variations in time.
The use of paleoenvironmental criteria based on qualitative and quantitative palynofacies observations allows the identification of regressive and transgressive intervals. These intervals clearly fit with the systems tract interpretation established in the field. Consequently, paleoenvironmental results derived from palynofacies analysis can be interpreted in terms of sequence stratigraphy when combined with classical field observations (lithology, sedimento- logical features, bed-stacking patterns, etc.).
Although the three studied sections are several tens of kilometres from each other (Fig. 1), chronostratigraphically equivalent intervals display unequivocal similarities in their organic distribution.
This study illustrates that palynofacies may be a useful complementary tool to standard sedimentology. It may bring a valuable contribution in establishing a sequence-stratigraphic framework, especially in monotonous sediments where classical field observations are limited.
Acknowledgements
This research was supported by the Swiss National Science Foundation (grant no. 20-30276.90). We are indebted to the members of the “Vocontian Trough Early Cretaceous working group” coordinated by R. Jan Du Chêne and J.-F. Raynaud, for stimulating discussions and exchange of data both in the field and in the lab. Our thanks also go to M. Floquet (Univ. of Geneva) for processing the palynofacies samples and to J. Metzger (Univ. of Geneva) for draughting part of the figures.
6 REFERENCES
Beaudoin, B. (1980). — Le Bassin subalpin. — In : Autran,
A. & Dercourt, J. (coord.) : Colloque C7, Géologie de la France. — Bur. Rech. géol. min., Mém. 107, 284-291.
Busnardo, R., Le Hégarat, G. & Magne, J. (1965). — Le stratotype du Berriasien. — Bur. Rech. géol. min., Mém. 34, 5-33.
Cecca, F, Enay, R. & Le FIégarat, G. (1989). — L'Ardescien (Tithonique supérieur) de la région stratotypique : séries de références et faunes (ammonites, calpionelles) de la bordure ardéchoise. — Doc. labo, géol., Lyon, 107, 115 pp.
Combaz, A. (1964). — Les palynofaciès. — Rev. Micropal. 7, 3, 205-218.
Davies, J.R., Mc Nestry, A. & Waters, R.A. (1991). —
Palaeoenvironments and palynofacies of a pulsed transgression : the late Devonian and early Dinantian (Lower Carboniferous) rocks of southeast Wales. — Geol. Magazine, 28, 4, 355-380.
Deconinck, J.-F. (1993). — Clay mineralogy of the late Tlthonian-Berriasian deep-sea carbonates of the Vocontian Trough (SE France) : relationships with sequence stratigraphy. — Bull. Centres Rech. Explor.- Prod. Elf Aquitaine, 17, 1, 223-234.
Denison, C.N. & Fowler, R.m. (1980). — Palynological identification of facies in a deltaic environment. — In : The sedimentation of the North Sea reservoir rocks. — Norwegian Petrol. Soc., 12, 1-22.
Dromart, G., Ferry, S. & Atrops, F. (1993) — Removal of deep-water carbonates and relative sea-level changes : the Upper Jurassic — Lowermost Cretaceous of South- East France. — In : Posamentier, H.W., Summerhayes, C.P., Haq, B.U. & Allen, G.P. (eds.) : Sequence Stratigraphy and Facies Associations. — IAS, Special Publication, 18 (in press).
Emmanuel, L. & Renard, M. (1993). — Carbonate geochemistry (Mn, 913C, 5180) of the Late Tithonian — Berriasian pelagic limestones of the Vocontian Trough (SE France) — Bull. Centres Rech. Explor.-Prod. Elf Aquitaine, 17, 1, 205-221.
Fisher, M.J. (1980). — Kerogen distribution and depositional environments in the Middle Jurassic of Yorkshire, UK. — Proc. 4th International Palynological Conf., Lucknow, 1976-1977, 2, 574-580.
Galbrun, B., Rasplus, L. & Le FIégarat, G. (1986). — Données nouvelles sur le stratotype du Berriasien : corrélations entre magnétostratigraphie et biostratigraphie. — Bull. Soc. géol. France, 8, 2, 4, 575-584.
Gorin, G.E. & Steffen, D. (1991). — Organic facies as a tool for recording eustatic variations in marine fine-grained carbonates — example of the Berriasian stratotype at Berrias (Ardèche, SE France). — Palaeogeogr., Palaeo- climat., Palaeoecol., 85, 303-320.
Habib, D. (1983). — Sedimentation-rate dependant distribution of organic matter in the North Atlantic Jurassic-Cretaceous. — Init. Rep. DSDP, 76, 781-794.
Habib, D. & Miller, J.A. (1989). — Dinoflagellate species and organic facies evidence of marine transgression and regression in the Atlantic Coastal Plain. — Palaeogeogr., Palaeoclimat., Palaeoecol., 74, 23-47.
Honjo, S. & Roman, M.R. (1978). — Marine copepod fecal pellets : production, sedimentation and preservation. — J. Marine Res., 36, 45-57.
Le Hégarat, G. (1973). — Le Berriasien du Sud-Est de la France. — Doc. Labo. Géol. Fac. Sci. Lyon, 43, 575 pp.
Le Hégarat, G. (1980) — Le Berriasien. — In C. Cavelier & Roger, J. (coord.) : Les étages français et leur stratotypes. — Bur. Rech. géol. min., Mém. 34, 9-16.
Le Hégarat, G. & Remane, J. (1968). — Tithonique supérieur et Berriasien de la bordure cévenole. Corrélation des Ammonites et des Calpionelles. — Géobios, 1, 7-70.
Le Hégarat, G. & Ferry, S. (1990). — Le Berriasien d’Angles (Alpes-de-Haute-Provence, France). — Géobios, 23, 3, 369-373.
Lister, J.K. & Batten, D.J. (1988). — Stratigraphie and pa- laeoenvironmental distribution of Early Cretaceous dinoflagellate cysts in the Hurlands Farm borehole, West Sussex, England. — Palaeontographica, Abt. B, 210 (1-3), 9-89.
Médioni, R. (coord.) et ai (1984). — Berriasien - Valanginien. — In : Debrand-Passard, S. et al. (eds.) : Synthèse géologique du Sud-Est de la France. — Bur. Rech. géol. min., Mém. 126, atlas.
Monteil, E. (1993). — Dinoflagellate cyst biozonation of the Tithonian and Berriasian of South-East France. Correlation with the sequence stratigraphy — Bull. Centres Rech. Explor.-Prod. Elf Aquitaine, 17, 1, 249-273.

246 D. STEFFEN AND G. GORIN BCREDP 17 (1993)
Parry, C.C., Whitley, P.J.K, & Simpson, R. D, H. (1981). — Integration of palynological and sedimentological methods in facies analysis of the Brent Formation. — In : Illing, L.V. & Hobson, G.B. (eds.) : Petroleum Geology of the Continental Shelf of North-West Europe. — Heyden, London, 205-215.
Porter, K.G. & Robbins, E. I. (1981). — Zooplankton fecal pellets link fossil fuel and phosphate deposits. — Science, 212, 931-933.
Stancliffe, R.P.W. (1989). — Microforaminiferal linings : their classification, biostratigraphy and palaeoecology, with special reference to specimens from British Oxfordian sediments. — Micropaleont., 35, 4, 337-352.
Steffen, D. & Gorin, G. (1993). — Sedimentology of organic matter In Upper Tithonian — Berriasian deep-sea carbonates of SE France : evidence of eustatic control. — In : Katz, B.J. & Pratt, L. (eds.) : Source rocks in a sequence stratigraphic framework. — Amer. Assoc. Petroleum. Geol. — Studies in Geology (in press).
Strohmenger, C. & Strasser, A., (1993). — Eustatic controls on the depositional evolution of Upper Tithonian and Berriasian deep-water carbonates (Vocontian Trough, SE France). — Bull. Centres Rech. Explor.-Prod. Elf Aquitaine, 17, 1, 183-203.
Turner, J.T. & Ferrante, J.G. (1979). — Zooplankton fecal pellets in aquatic ecosystems. — Bioscience, 29, 670- 676.
Tyson, R.V., (1987). — The genesis and palynofacies characteristics of marine petroleum source rocks. — In : Brooks, J. & Fleet, A.J. (eds.) : Marine Petroleum Source Rocks. — Geol. Soc., Spec. Pub!., 26, 47-67.
Vail, P.R., Mitchum Jr., R.M., Todd, R.G., Widmier, J.M., Thomp
son III, S., Sangree, J.B., Bubb, J.N. & Hatllelid, W.G. (1977). — Seismic stratigraphy and global changes of sea-level. —Amer. Assoc. Petroleum Geol., Mem. 26, 49- 212.
Vail, P.R., Audemard, E, Bowman, S.A., Eisner, P.N. & Perez-
Cruz, C. (1991). — The stratigraphic signatures of tectonics, eustasy and sedimentology — an overview. — In : Einsele, G., Ricken, W. & Seilacher, A. (eds.) : Cycles and events in stratigraphy. — Springer-Verlag, Berlin, 615- 659.
Van Der Zwan, C.J. (1990). — Palynostratigraphy and palynofacies reconstruction of the Upper Jurassic to lowermost Cretaceous of the Draugen Field, offshore Mid Norway. — Rev. Palaeobot. Palynol., 62, 157-186.
Van Pelt, R.S. & Habib, D. (1988). — Dinoflagellate species abundance and organic facies in Jurassic Twin Creek Limestone signal episodes of transgression and regression. — Abstracts, 7th Int. Palynol. Congr., Brisbane, 168.
Whitaker, M.F. (1984). — The usage of palynostratigraphy and palynofacies in definition of Troll Field geology, in Offshore Northern Seas — reduction of uncertainities by innovative reservoir geomodelling. — Norskpetr. foren., art. G6.
PLATE I
Significant palynofacies from Berrias, Broyon and Angles sections. All figures at same scale (bar is 50 |im long).
Fig. 1. —PM1/2-B dominant and filaments of probable fungal origin (Berrias, bed 141 : LST sequence Be1).
2. —PM4-T dominant (Berrias, bed 146/12 : mfs sequence Be2).3. —Large-size allochthonous woody fragments dominant, PM1/2-B and PM2 (Berrias, bed 154 : LST sequence Be4).
4. —Diversified Dinocyst population (Berrias, bed 200 : mfs sequence Be7).5. —PM1/2-B dominant (Broyon, bed 12: LST sequence Ti5).6. —PM4 dominant (Broyon, bed 23 : LST sequence Be2). Note the sharp contrast with the beds below
(see fig. 5, this Plate).7. —Highly degraded humic fragments PM1/2-B (Angles, 67B : LST sequence Ti6).8. —PM4, PM4-T and Dinocyst (Angles, 170 : TST sequence Be7). The absence of PM1/2-B illustrates the drastic
palynofacies change between the base (see fig. 7, this Plate) and the top of the section (this fig.).

BCREDP 17 (1993) 247D. STEFFEN AND G. GORINVOCONTIAN TROUGH : PALYNOFACIES OF UPPER TITHONIAN - BERRIASIAN CARBONATES : Plate 1

DINOFLAGELLATE CYST BIOZONATION OF THE TITHONIAN AND BERRIASIAN OF SOUTH-EAST FRANCE.CORRELATION WITH THE SEQUENCE STRATIGRAPHY
Eric MONTEIL
MONTEIL, E. (1993). - Dinoflagellate cyst biozonation of the Tithonian and Berriasian of South-East France. Correlation with the sequence stratigraphy. - Bull. Centres Rech. Explor.-Prod. Elf Aquitaine, 17, 1, 249-273, 6 fig., 3 tab., 5 pi.; Boussens, June 24, 1993. - ISSN : 0396-2687. CODEN : BCREDP.The Dinoflagellate cyst biozonation, correlated to Ammonite and/or Calpionellid
zonal schemes, recently proposed for the Tithonian-Valanginian interval of South-East France (Monteil, 1992b) Is modified here. A new zone, the Foucheria modesta zone, is created for the Late Berriasian. The zonal and subzonal definitions are refined for the Tithonian-Berriasian interval. The 33 index species selected for this interval are illustrated. The limits of 4 zones and 2 subzones, as well as the first and last appearance data of index species are precisely located, at bed level, in the three studied sections of Berrias, Broyon and Angles (South-East France). Correlations between Dinoflagellate cysts and sequence stratigraphy demonstrate that it is possible to characterise most sequence boundaries (sb) and maximum flooding surfaces (mfs), using the earliest and latest occurrences of some selected Dinoflagellate cysts. These taxa are thought to be good "sequential biomarkers" in the Vocontian basin, some of them possibly having the potential for long-distance correlations. It is interesting to note that the comparison between Dinoflagellate cysts and manganese abundance (Emmanuel & Renard, this volume) shows a close relationship.Eric Monteil, University of Geneva, Department of Geology and Palaeontology, 13 bis,
rue des Maraîchers, CH-1211 Geneva 4, Switzerland. - January 30, 1993.
Key words : Dinoflagellates, Biostratigraphy, Tithonian, Berriasian, Valanginian, Eus- tasy (Sequence stratigraphy), Ardèche (Berrias, Broyon), Alpes de Haute-Provence (Angles), Vocontian Trough.
CONTENTS INTRODUCTION
INTRODUCTION.......................................................................... 249
1. - GEOLOGICAL AND BIOSTRATI GRAPHICAL SETTINGS 250
1.1. The Berrias section.................................................... 2501.2. The Broyon section.................................................... 2501.3. The Angles section.................................................... 250
2. - DINOFLAGELLATE CYST ZONATION............................ 250
3. - RELATION BETWEEN SEQUENCE STRATIGRAPHY ANDDINOFLAGELLATE CYST DISTRIBUTION 255
3.1. Results.......................................................................... 2573.2. Palynological comments and proposals................. 2603.3. Geochemical and palynological correlations......... 260
4. - CONCLUSION................................................................... 260
5. - REFERENCES.................................................................... 262
6. - APPENDIX.......................................................................... 263
Monteil (1992a and b) presented a high resolution Dinoflagellate cyst zonation, based on 47 index species, including five new taxa, which were accurately correlated to Ammonite and/or Calpionellid biozonations, for the Tithonian-Valanginian interval of South-East France. From the palynological analyses of the Berriasian stratotype (Ardèche, Berriasian to Early Valanginian), the Valanginian hy- postratotype, (Alpes-de-Haute-Provence, Late Tithonian to Valanginian) and the Broyon quarry section, (Ardèche, Tithonian to Early Berriasian) a new palynological biozonation for the tethyan realm was proposed. The purpose of this paper is to illustrate these index species, to discuss their impact on the biozonation of Tithonian-Berriasian interval and, finally, to compare their distribution with the sequence-stratigraphic framework established during a field trip in June 1991 by P. Vail and the members of the “Vocontian Trough Early Cretaceous working group” (R. Busnardo, J. Charollais, B. Clavel, J.F. Deconinck, L. Emmanuel, S. Gardin, G. Gorin, R. Jan du Chêne, Fl. ManivitT, E. Monteil, J.F. Raynaud, M. Renard, D. Steffen, N. Stein- hauser, A. Strasser & C. Strohmenger).
0396-2687/93/0017-0249 $ 5.00 © 1993 elf aquitaine production, F-31360 Boussens

250 E. MONTEIL BCREDP 17 (1993)
1 — GEOLOGICAL AND BIOSTRATIGRAPHICAL SETTINGS
The three studied sections are located in the Vocontian Trough (Médioni et al., 1984) in the south-eastern French Alps (Fig. 1). They mainly consist of slope and basin deep- sea carbonates. Strohmenger & Strasser (this volume) recognised only three facies types, which is characteristic for a relatively monotonous deep-water environment. The fossil content of the carbonates (Radiolarians, Calpionellids, Globochaetids, calcispheres and nannoplankton), as well as the marls (Nannoconus), clearly identifies them as deep- marine, hemipelagic to pelagic sediments. A more detailed lithological and sedimentological description of the sections is given by Strohmenger & Strasser (this volume).
1.1. THE BERRIAS SECTION (Fig. 1 and 2)
The Berrias section is the Berriasian stage stratotype. It consists of fine-grained limestones with rare, thin, marly intercalations and a massive breccia bed at the base of the Calpionellid zone C. It is precisely dated by Ammonites and Calpionellids (Busnardo et al., 1965; Le FIegarat & Remane, 1968; Le FIegarat 1973, 1980), as well as by magnetostrati- graphical correlations (Galbrun et al., 1986). The adopted biostratigraphical framework was constructed using the
recent work by R. Busnardo, B. Clavel and G. le Hégarat. In microfacies, the typical deep-marine fossil assemblage contains sporadic pelecypod tests and aptychi. The Berrias sediments are interpreted as hemipelagic outer platform deposits (Gorin & Steffen, 1991; Strohmenger & Strasser, this volume).
1.2. THE BROYON SECTION (Fig. 1 and 3)
The Broyon section ranges from the Early Tithonian to the Early Berriasian, and is dated by Calpionellids and Ammonites (Le FIégarat, 1973; Cecca et al., 1989). The Tithonian interval is represented by a cliff of massive fine-grained limestones with local intercalations of breccias. The Berriasian part of the section displays limestone/marl alternations, where marls are clearly dominant. The section is capped by a single breccia bed, which corresponds to the base of the Calpionellid zone C, correlateable to one observed at Berrias. In microfacies, the fossil assemblage, characteristic for a deep-marine environment, also shows evidence of displaced shallow marine organisms (Pelecypod tests, Echinoderm fragments and Gastropods). The Broyon section is interpreted as hemipelagic slope deposits (Dro- mart et al., 1992; Strohmenger & Strasser, this volume).
1.3. THE ANGLES SECTION (Fig, 1, 4 and 5)
Location map. Stars indicate the three studied sections Berrias, Broyon and Angles.
The studied interval in the Angles section ranges from the Late Tithonian to the Berriasian/Valanginian boundary, and is dated by Calpionellids (Le Hégarat & Ferry, 1990). It consists of massive limestones at the base grading to limestone/marl alternations towards the top. At two different levels, slumped beds coincide with important biostratigraphical gaps : in beds 88 to 89, the top of the Calpionellid zone B and the whole Calpionellid zone C are missing, and in beds 120 to 124 the top of the Calpionellid zone D1 and the base of the Calpionellid zone D2 are missing. Such hiatus have already been observed in the Vocontian Trough around the Jurassic-Cretaceous boundary and have been attributed to slope instabilities (Beaudoin, 1980). The microfossil type assemblage is characteristic of a deep-water environment. The limestone/marl alternations in the Angles section are considered as pelagic basin deposits (Strohmenger & Strasser, this volume).
2 — DINOFLAGELLATE CYST ZONATION
Following the works of Habib & Drugg (1983) and Jardiné et al., (1984), Monteil (1992b) proposed a new palynoplanc- tological zonation for the Tithonian-Valanginian of South-East France (Tab. I). In this paper, the Tithonian-Valanginian interval was subdivided into 7 zones : Biorbifera johnewlngil zone, Dichadogonyaulax bensonii zone, Muderongia mac- whaei zone, Muderongia australis zone, Cassiculosphaeridia

BCREDP 17 (1993) SOUTH-EAST FRANCE: DINOFLAGELLATE CYST BIOZONATION OF THE TITHONIAN AND BERRIASIAN 251
Figure 2
Bernas section : biostratigraphy (Busnardo et al., 1965; Le Hégarat & Remane, 1968; Le Hégarat, 1973, 1980), lithology, sequence stratigraphy and palynology. The sequence stratigraphy interpretation was established by the “Vocontian Trough
Early Cretaceous working group” coordinated by R. Jan du Chêne and J.-F. Raynaud.
• List of samples (indicated by arrows) from base to top : 138 b, 138 mi, 138 t, 139/1, 139/2, 139/3, 140, 141, 142 s 143/2 143/3 144 b144 mi, 144/5, 145 b, 145 s, 146/7, 146/8, 146/11, 147/12, 147/13, 147/14, 147/15, 147 t, 148 b, 148 t, 149, 150, 151, 152,’ 154,
156, 159, 160, 161, 162, 163, 165, 166, 169, 172, 175, 178, 180, 182, 184, 188, 189, 190, 191, 192, 193, 197, 199’, 200 b, 200 s.• Sequence stratigraphy key : orange line = sb (sequence boundary, labelled Be1, Be2 etc.); rose line = tls (top lowstand surface)-
green line = mfs (maximum flooding surface); orange interval = FIST (Highstand Systems Tract); rose interval = LST (LowstandSystems Tract); green interval = TST (Transgressive Systems Tract).
• Palynology : indications of the approximate number of species per sample, the limits of the Dinoflagellate cyst zones and subzonesdefined in this paper, as well as the FAD (First Appearance Datum) and the LAD (Last Appearance Datum) of index species.

252 E. MONTEIL BCREDP 17 (1993)
Figure 3
Broyon section : biostratigraphy (Le Hégarat, 1973; Cecca et al., 1989), lithology, sequence stratigraphy and palynology.The sequence stratigraphy interpretation was established by the “Vocontian Trough Early Cretaceous working group
coordinated by R. Jan du Chêne and J.-F. Raynaud.
List of samples (indicated by arrows) from base to top.: 1A b, 1A t, 1B b, 1B t, 1D b, 1D t, 1E, 2 b, 2 t, 3 b, 3 L 4 6, 7, 8 b, 8 t, 9, 10 t, 12 b, 15 b, 15 t, 16 b, 16 t, 17, 18A, 18B, 18C, 19, 20, 21, 22, 23, 24 b, 24 t, 25, 26, 27, 28, 29.
Sequence stratigraphy key and palynology : see Figure 2.

BCREDP 17 (1993) SOUTH-EAST FRANCE: DINOFLAGELLATE CYST BIOZONATION OF THE TITHONIAN AND BERRIASIAN 253
magna zone, Kleithriasphaeridium corrugatum zone and Mu- derongia staurota zone, and two subzones, Muderongia macwhaei forma A and Muderongia macwhaei forma B. A new zone, Foucheria modesta zone is herein created for the Late Berriasian. Table I depicts this slightly modified biozonation which is discussed below for the Tithonian-Berria- sian interval. The limits of the three zones and one subzone subdividing this interval are defined, bed by bed, for each of the studied sections : Berrias (Fig. 2), Broyon (Fig. 3) and Angles (Fig. 4 and 5). The First Appearance Datum (FAD) and the Last Appearance Datum (LAD) of index species, as well as the approximate number of species present in each of the analysed samples are indicated on these figures. The samples are identified with the name of the section (Bro, Ber or Ang), the bed number (e.g. Ang 105), the Ammonite or equivalent (eq.) Ammonite zone, and/or the Calpionellid zone, placed between brackets. The 33 index species selected for this interval are illustrated in five plates (PI. 1-5).
Remark : A comparison with palynological assemblages occuring in the inner platform (Steinhauser et al., 1993) has shown that Biorbifera johnewingii is a species abundant in the pelagic domain, rare in the hemipelagic domain (outer platform and slope deposits) and absent in the proximal domain. The genus Druggidium is also typical of the same environment. Consequently, the Neocomian stratotype zonation established by FIabib & Drugg (1983) appears more adapted to a pelagic deep-water environment. Apart from the Biorbifera johnewingii zone, the new proposed zonal scheme can be successfully applied to either the distal or the proximal domains. This can be further correlated to the
western North Atlantic zonation (Habib, 1972; 1976; 1977; 1978).
Biorbifera johnewingii Zone
Definition : interval from the first appearance of Biorbifera johnewingii to the first appearance of Dichadogonyaulax bensonii.
Age : Early Tithonian (Fallauxi zone, Richteri subzone) to Early Berriasian (Jacobi-Grandis zone pars).
Significant events : Warrenia californica and Amphorula metaelliptica appear and Lanterna bulgarica disappears in the uppermost part of this zone (Calpionellid zone A3). The disappearances of Prolixosphaeridium anasillum and of the genus Lanterna is thought to indicate the end of the Titho- nian (Thusu et al., 1988, Monteil, 1992b).
Distribution : In the Broyon quarry, B. johnewingii is present from the base of the section which corresponds to the Early Tithonian (bed Bro 1Ab). At Berrias and Angles, the series begins in the Early Berriasian and the Latest Titho- nian, respectively. The Tithonian/Berriasian boundary occurs within massive limestones which are palynologically barren.B. johnewingii is not found in these sediments and appears later in the Early Berriasian (Jacobi-Grandis zone). This is probably not the true base but its reappearance (Ber 146/8 and Ang 84). For this reason, the part of the section situated below the appearance of Dichadogonyaulax bensonii in Berrias and Angles is hesitantly attributed to the ? Biorbifera johnewingii zone. However, in the Angles section, this spe-
TABLE IComparison between palynoplanctological zonations proposed for South-East France. In Habib & Drugg (1983), I : the zone limits have been placed using ages given in the zonal definitions. The observed hiatus between the Biorbifera johnewingii zone and the Druggidium apicopaucicum zone is highlighted using the Ammonite zonation of Thieuloy (1973); II : they are placed using the first appearance of the nominative species. (*) In the Vergons section, Muderongia staurota appears in the
upper part of the Radiatus Ammonite zone (Londeix, 1990).
BIOZONATIONS
SOUTHEAST FRANCE
HABIB & DRUGG (1983)
(I)
HABIB & DRUGG (1983)
(II)
JARDINE, RAYNAUD &
DE RENEVILLE (1984)
MONTEIL(1992)
modifiedRadiatus
CallidiscusTrinodosumVerrucosum
CampylotoxumPertransiens
Otopeta
Boissieri
Occitanica
Callisto
Picteti
ParamimounumDalmasi
PrivasensisSubalpina
Jacobi GrandisMicrocanthum Durangites
Ponti
FallauxiAdmirandurn
Richteri
Druggidiumdeflandrei
Druggidiumapicopaucicum
Biorbiferajohnewigii
"Phoberocysta neocomica"
Druggidiumdeflandrei
D. apicopaucicum
Biorbiferajohnewingii
Heslertonia heslertonensis
C. magna
M. staurota *
Diacanthumhollisteri
Biorbiferajohnewingii
Kleithriaspha eridium corrugatum
C. magna
M. australis
M.macwhaei
forma B
forma A
Foucheriamodesta
Dichadogonya ulax bensonii
Biorbiferajohnewingii

254 E. MONTEIL BCREDP 17 (1993)
Figure 4
Angles section (base) : biostratigraphy (Le Hégarat & Ferry, 1990), lithology, sequence stratigraphy and palynology.The sequence stratigraphy interpretation was established by the “Vocontian Trough Early Cretaceous working group”
coordinated by R. Jan du Chêne and J.-F. Raynaud. •
• List of samples (indicated by arrows) from base to top : 59 t, 61 t, 62, 63 b, 64A t, 64B b, 64B t, 65 b, 66A mi, 66B t, 66B m, 67A, 67B t, 68 b, 69 b, 70 t, 73 b, 75 b, 75 t, 78, 78 m, 79 t, 80 m, 82, 84, 86 t, 88 b, 90 b, 90 m, 92A t, 93 m, 96 b, 102 c, 102 m, 105 t, 111.• Sequence stratigraphy key and palynology : see Figure 2.

BCREDP 17 (1993) SOUTH-EAST FRANCE : DINOFLAGELLATE CYST BIOZONATION OF THE TITHONIAN AND BERRIASIAN 255
cies starts at bed 84 and the Biorbifera johnewingii zone is depicted without any question mark. This species, rare in the Berriasian of the Speeton Clay, is widespread in offshore south-eastern Canada and in the North Atlantic (Habib &
Drugg, 1983). It is also reported from the Neocomian of the Sacramento Valley sequence of California (Habib & Warren,
1973).
Dichadogonyaulax bensonii Zone
Definition : interval from the first appearance of Dichadogonyaulax bensonii to the first appearance of Fou- cheria modesta.
Age : Early Berriasian (Jacobi-Grandis zone pars) to Late Berriasian (Boissieri zone, Paramimounum subzone pars).
Significant event : the base of this zone is marked by the simultaneous appearances (probably more environmental than stratigraphic) of Cassiculosphaeridia pygmaea, Te- hamadinium dodekovae, Spiniferites ramosus group, Ctenidodinium elegantulum, Achomosphaera ? neptuni, Muderongia tabulata, M. longicornis, and slightly above, the first occurrence of Diacanthum hollisteri and Wallodinium cylindricum. Cirrusphaera dissimilis stratigraphically follows Cassiculosphaeridia pygmaea. Prolixosphaeridium mixtispi- nosum and Prolixosphaeridium basifurcatum show their last occurrences in the lower part of this zone.
Distribution : Dichadogonyaulax bensonii is present in the Broyon, Berrias and Angles sections. This species appears in the Jacobi-Grandis zone at Broyon (Bro 21) and Berrias (Ber 146/7). At Angles, D. bensonii occurred later (Ang 92At) in D1 Calpionellid zone, i.e. in the Paramimounum zone. This shift is conceivably explained by the important biostratigraphical gap corresponding to the top of the Calpionellid zone B and the whole of the Calpionellid zone C, as already observed by Le Hégarat & Ferry (1990). D. bensonii is a very common species, which has been observed in all of the studied sections in the Swiss Jura (Stein-
hauser et al., 1993). This species is also known from Late Jurassic offshore sediments along the American Atlantic coast (Benson, 1985).
Foucheria modesta Zone
Definition : interval from the first appearance of Foucheria modesta to the first appearance of Muderongia macwhaei.
Age : Late Berriasian (Boissieri zone, Paramimounum subzone pars to Callisto subzone pars).
Significant events : the upper part of this zone is marked by the last occurrence of Amphorula metaelliptica and the first appearance of Pseudoceratium pelliferum.
Distribution : Foucheria modesta is a very common species, present in South-East France and in central and southern Jura. F. modesta zone starts in the D1 Calpionellid zone,i.e. in Paramimounum subzone, at Angles, (Ang 102m) and Berrias (Ber 166). The nominative species also occurs in the Late Ryazanian-Early Valanginian interval of the Speeton Clay, England (pers. obs.).
Muderongia macwhaei Zone
Definition : interval from the first appearance of Muderongia macwhaei to the first appearance of Muderongia australis.
Age : Late Berriasian (Callisto subzone pars) to Early Valanginian (Petransiens zone).
Distribution : In South-East France and West Switzerland, Muderongia macwhaei is present throughout the studied sections. In Berrias (Ber 192) and Angles (160c), M. macwhaei appears in the D3 Calpionellid zone, i.e. in Callisto zone. The distribution of this species is worldwide.
Remark : The stratigraphic succession of the three formae A, B, C of Muderongia macwhaei (Monteil, 1991; 1992b), Muderongia australis and Muderongia staurota, allows a very detailed subdivision of the Late Berriasian- Valanginian interval. This zone is subdivided into 2 subzones on the basis of the morphographic succession of the formae A and B. The succession of these three formae has only been observed in South-East France and West Switzerland.
Muderongia macwhaei forma A Subzone
Definition : interval from the first appearance of Muderongia macwhaei forma A to the first appearance of Muderongia macwhaei forma B.
Age : Late Berriasian (Callisto subzone pars) to Early Valanginian (Otopeta zone).
Significant events : Systematophora areolata and Muderongia longicornis disappear and Kleithriasphaeridium fasci- atum appears in the middle part of this zone. The first occurrence of K. fasciatum coincides with the base of the Valanginian in the two sections of Angles (Ang 169Dt) and Berrias (Ber 197).
Muderongia macwhaei forma B Subzone
Definition : interval from the first appearance of Muderongia macwhaei forma B to the first appearance of Muderongia australis.
Age : Early Valanginian (Pertransiens zone).
3 — RELATION BETWEEN SEQUENCE STRATIGRAPHY AND DINOFLAGELLATE CYST DISTRIBUTION
Based on changes in species diversity and abundance of Dinoflagellate cysts, the different systems tracts can be recognised quantitatively : lowstand systems tracts (LST) regularly show a low species diversity; transgressive systems tracts (TST) show an increase in species diversity and abundance, with a maximum at the maximum flooding surface; highstand systems tracts (HST) start with a high species diversity and abundance, followed by a clear decrease up to the sequence boundary. This system tracts characterisation based on Dinoflagellate cysts has already been qualitatively observed by Steffen & Gorin (1993).
This paper attempts to isolate some Dinoflagellate cysts that can qualitatively characterise (or calibrate) the different surfaces recognised in this project : sequence boundaries (Sb), top lowstand surfaces (tls) and maximum flooding surfaces (mfs). In other words, to attribute to certain taxa a value of “sequential biomarkers”.
Firstly, 47 taxa considered as index species for the Tithonian-Valanginian interval (Monteil, 1992b), were selected as potential “sequential biomarkers”. Then, these taxa

256 E. MONTEIL BCREDP 17 (1993)
Figure 5
Angles section (top) : biostratigraphy (Le Hégarat & Ferry, 1990), lithology, sequence stratigraphy and palynology.The sequence stratigraphy interpretation was established by the “Vocontian Trough Early Cretaceous working group”
coordinated by R. Jan du Chêne and J.-F. Raynaud. •
• List of samples (indicated by arrows) from base to top.: 112 mi, 116 c, 117 t, 119 t, 122, 125, 130 c, 130 m, 132 mi, 134 t, 138 c, 141 t,142, 145, 147, 150, 153, 154, 157, 160 c, 160 m, 162 m, 166 b, 168A c, 169D t, 171, 172 c, 172 m, 178 m.
• Sequence stratigraphy key and palynology : see Figure 2.

BCREDP 17 (1993) SOUTH-EAST FRANCE: DINOFLAGELLATE CYST BIOZONATION OF THE Tl THON IAN AND BERRIASIAN 257
were placed within the sequential framework established by the working group. The correlations between the Dinoflagel- late cysts and the sequence stratigraphy (Fig. 6) are presented and discussed below, from base to top, cycle per cycle. The samples are identified with the name of the section (Bro, Ber or Ang), the bed number (e.g. Ang 105), the Ammonite or equivalent (eq.) Ammonite zone, and/or the Calpionellid zone, placed between brackets.
3.1. RESULTS
Preliminary remark : it has not been possible to characterise the tls palynologically and only the Sb and mfs are considered in this discussion.
Depositional sequences Ti4, Ti5, Ti6 and Be1
Palynological results of these four eustatic cycles are sparse and incomplete. This is in part due to an important stratigraphic hiatus (absence of the Ammonite zones Ad- mirandum/Biruncinatum and Pont!) at the Sb Ti4 level, and also as a result of the predominance of massive limestones in the depositional sequences Ti4 to Be1. Plowever, it does seem possible to make some relevant observations.
— Warrenia catifornica, Tehamadinium evittii and Am- phorula metaelliptica are present below the Sb Ti6. The genus Lanterna and Prolixosphaeridium anasillum show their last occurrence just below the Sb Ti6 (Ang 64 At : A3/eq. top Microcanthum-Durangites);
— Biorbifera johnewingii is present below the Sb Ti4 (Bro 1A, 2, 9 : Fallauxi, Richteri):
— Spiniferites ramosus group appears in the depositional sequence Be1 (Ber 141 : Jacobi-Grandis/B).
A. metaelliptica and the Lanterna genus are known from the Tithonian. It is not yet possible to define when the species Biorbifera johnewingii*, Warrenia californica* and the Spiniferites ramosus group* really appear for the first time.
From the Broyon section, Leptodinium mirabile may be restricted to the Early Tithonian. In Angles, the presence of L. mirabile in the breccia (Ang 64B) would indicate reworked material from the Early Tithonian.
Depositional sequence Be2
In the three sections of Broyon, Berrias and Angles, the sequence Be2 is marked, below the mfs, by the sudden appearance of numerous Dinoflagellate cysts : Di- chadogonyaulax bensonii, Ctenidodinium eiegantuium, Tehamadinium dodekovae, Amphoruta ? neptuni, Cas- siculosphaeridia pygmaea, Muderongia tabulata and Muder- ongia longicornis. (Jacobi-Grandis/B). Prolixosphaeridium mixtispinosum disappears in the upper part of this sequence just above the mfs.
In Berrias, the mfs (Ber 146/11 : top Jacobi-Grandis/B) is marked by a high peak in the diversity of Dinoflagellate cysts (about 30 species).
In Berrias, the presence of Leptodinium mirabile in beds 144-145 seems to indicate reworked material, possibly from Early Tithonian.
Depositional sequence Be3
The sequence boundary Be3 has only been recognized in the Berrias section. In the Broyon section, its position has been tentatively extrapolated between beds 28 and 29 (Subalpina/B) through regional biostratigraphic correlations. In Angles, an important stratigaphic hiatus has been highlighted through the study of Calpionellids (Le Hégarat &
Ferry, 1990). It corresponds to the top of the B zone, C zone and the base of the D1 zone (equivalent Ammonite zones : Grandis to Paramimounum). This explains why the top of Be2 and the whole of Be3 were not observed in this section.
The Dinoflagellate cysts also indicated the existence of this significant hiatus :
— In Berrias and Broyon, the base of the Dichadogony- aulax bensonii zone is identified as intra Be2 (Ber 146/7 and Bro 21 : Jacobi-Grandis/B). In Angles, this nominative species appears in the lower part of Be4 (Ang 92A : D1/eq. Paramimounum)-,
— In Broyon, Diacanthum hollisteri clearly appears above the explosion of species observed at the base of Be2 and relatively close to the extrapolated Be3 position,i.e. in the upper part of Be2 (Bro 25 : Jacobi-Grandis/B). In Angles, the appearance of D. hollisteri is not observed in sequence Be2, but in Be4 (Ang 90m : D1/eq. Paramimounum). This fact confirms that the top of Be2 and the whole of Be3 are missing;
— In Berrias, Cirrusphaera dissimilis appears in the mfs of Be3 (Ber 149 : top Subalpina/B). In Angles, this species appears in the breccia (88-89) overlying the Sb Be4, and persists until bed Ang 102 (D1/eq. Paramimounum).
In Berrias, the mfs of Be3 (Ber 149 : top Subalpina/B) is marked by a high peak in the diversity of Dinoflagellate cysts (about 35 species), the first occurrence of Cirrusphaera dissimilis and the disappearance of Cassiculosphaeridia pygmaea. Prolixosphaeridium basifurcatum disappears in the lower part of the depositional sequence Be3 (Ang 84 : B).
Depositional sequence Be4
In Berrias, the mfs of Be4 (Ber 166 : Paramimounum/D1) is marked by a high peak in the diversity of Dinoflagellate cysts (about 50 species). In Angles, this mfs is also marked by the base of the Foucheria modesta zone and the last occurrence of Cirrusphaera dissimilis (Ang 102m : D1/eq. Paramimounum). Berrias is similar, however C. dissimilis appears just below the mfs (Ber 165 : Paramimounum/D1).
In Berrias, the presence of Prolixosphaeridium basifurcatum in the breccia (Ber 150) may indicate reworking of the underlying strata (Early Berriasian or Tithonian).
The upper part of this sequence is marked by several peaks, corresponding to the acme of Muderongia longicornis during the Paraminounum zone in South-East France and West Switzerland. One in Berrias (Ber 172: Paramimou- numlD1) and two in Angles (Ang 112 and 117 : D1/eq. Paramimounum-, the latter being more emphasized). In Berrias, Tubotuberella apatela is only present in the bed Ber 178 (Paramimounum/DI-D2), situated just below the Sb Be5 (intra Be4).

258 E. MONTEIL BCREDP 17 (1993)
SEQUENCE STRATIGRAPHY :MuilliliMiplinary approach"
SEQUENCE STRATIGRAPHYMull {disciplinary approach
DINOFLAGELLATE CYST CHRONOSTRATIGRAPHY RELATED TO SEQUENCE STRATIGRAPHY
Eric MONTEILUniversity ol Geneva
Dpmt of Geology & Paleontology 13. rue dos Maraîchers 1211 GENF.VT 4 Swteertand
DINOFLAGELLATE CYSTS! ANGLESIn a first stage, the palynological study of the three Berriasian field sections at
Figure 6
Correlations between the Dinoflagellate cyst distribution and the sequence stratigraphy interpretation for the three sections of Berrias, Broyon and Angles. This figure represents a poster displayed at the 8th International Palynological Conference
(Aix-en-Provence, September 1992). The reproduction was made with the help of Elf Aquitaine. Since the creation of this poster, a new zone (Foucheria modesta Zone) has been defined and some taxa have been added. These new features have been integrated
in Figures 2-5.

BCREDP 17 (1993) SOUTH-EAST FRANCE: DINOFLAGELLATE CYST BIOZONATION OF THE TITHONIAN AND BERRIASIAN 259
Depositional sequence Be5
As mentioned above, in Berrias, Tubotuberella apatela appears intra Be4. In Angles, this species appears intra Be5, just below the mfs (Ang 130/D2).
In Berrias, the mfs of Be5 (Ber 190 : PictetilD2) is marked by a high peak in the diversity of Dinoflagellate cysts (about 20 species) and the massive and sudden appearance of Systematophora sp. A (= Systematophora sp. aff. S. fasciculigera sensu Habib 1972). Amphorula metaelliptica clearly disappears at this level. In Angles, no sample has been analysed from bed Ang 131A-F (D2) and currently there is no palynological argument to confirm the existence of a mfs.
Depositional sequence Be6
In Angles and Berrias, there are no palynological arguments to date the Sb Be6.
The mfs of Be6 (Ang 150 : D3) is marked in Angles by a high peak in the diversity of Dinoflagellate cysts (about 40 species) and, as already mentioned for Berrias (mfs of Be5), by the massive and sudden appearance of Systematophora sp. A.
In Angles, Tubotuberella apatela disappears intra Be6 below the mfs (Ang 145, D3).
Depositional sequence Be7
In Angles (Ang 160m : D3) and Berrias (Ber 192 : Cal- llstolD3) Muderongia macwhaei forma A appears just below Sb Be7.
In both sections, the mfs of Be7 (Ang 172 and Ber 200 : Otopeta/D3) is clearly marked by a very important peak in the diversity of Dinoflagellate cyst species (> to 50 species).
TABLE IISequential interpretation proposed by the team, calibrated to Dinoflagellate cysts.

260 E. MONTEIL BCREDP 17 (1993)
3.2. PALYNOLOGICAL COMMENTS AND PROPOSALS
In the course of the study, it has been possible to paly- nologically date (FAD and LAD) most of the Sb and mfs, but not the tls. From a palynological point of view, the mfs are clearly marked by a peak in the diversity of Dinoflagel- late cyst species in the hemipelagic domain (Berrias), but poorly identifiable in the pelagic environment (Angles). In order to make these mfs identifiable, we have attempted to associate them with a Dinoflagellate cyst appearing in the mfs from the hemipelagic environment. Most of the mfs have been palynologically recognised in this manner in the Angles section (e.g. Cirrusphaera dissimilis for mfs Be3 and F. modesta for mfs Be4).
The Dinoflagellate cyst correlations mostly support the sequential framework established by the team for the three sections of Berrias, Broyon and Angles (Fig. 6 and Tab. II). However, in the Be4-Be6 interval, the dinocyst distribution displays a shift of one depositional sequence between the sections of Angles and Berrias. This shift is highlighted by two different species in two successive depositional sequences. Tubotuberella apatela appears in Berrias intra Be4 and in Angles intra Be5. Systematophora sp. A occurs intra Be5 in Berrias and intra Be6 in Angles. Therefore; it seems that this observation cannot be attributed to an environmental cause. Palynological data seems to infer that there should be a sequence boundary post-Be4 and pre- Be5 in the Berrias section.
Two events, the appearance of Tubotuberella apatela, and the passage from Amphorula metaelliptica to Systematophora sp. A, may be of great interest in palaeoecology and palaeogeography and long-distance correlations, respectively.
Habib & Drugg (1983) published an article entitled “Dinoflagellate age of Middle Jurassic-Early Cretaceous in the Blake-Bahama basin". In their paper, they presented a stratigraphic range chart showing Dinoflagellates zones and ages from Deep Sea Drilling Project Hole 534A (Fig. 2). In their Figure 2, the range of the species Systematophora fasclculigera appears to be discontinuous : Late Oxfordian to Tithonian and Late Berriasian to Early Valanginian. According to my observations, the Early Cretaceous specimens are considered to represent the species I named Systematophora sp. A in this paper. If this is correct, we observe that the passage Amphorula metaelliptica to Systematophora sp. A. occurs at the top of the Berriasian, as in the South-East of France. This event, correlated here with the upper part of Be6, would constitute a very good reference point for long-distance correlations with the North Atlantic domain.
Monteil (1992b) suggested that the presence of Tubotuberella apatela could constitute a key event and be used as an indicator of boreal connections in the south-east basin, as a result of a sill. In the boreal domain, this species ranges from the Bathonian to the Early Valanginian (Costa
& Davey, 1992; Riding & Thomas, 1992). In the North Atlantic ocean, the Dinoflagellate cyst disappears in Late Tithonian (Habib & Drugg, 1983). In South-East France, this species is only known in the Cretaceous from the upper part of the Boissieri zone (Pourtoy, 1989; Monteil, 1992a and b). The Tubotuberella apatela episode is significantly shorter in Berrias (a single bed, Ber 178 : D1/D2) than in Angles (Ang
130-145 : D2-D3). In this latter section, it displaces the appearance of Systematophora sp. A from the Calpionellid zone D1/D2 to D3. There is a lag between the appearance and disappearance of these two taxa that may be caused by the return of Atlantic conditions; once the water masses have warmed up sufficiently, the environment becomes more favourable to the development of the cyst-forming Dinoflagellate Systematophora sp. A. This hypothesis seems to be supported by geochemical data. According to Emmanuel & Renard (pers. com.), if the variation curves of 5 180 are interpreted in terms of palaeotemperature, a contemporaneous cooling of sea water containing Tubotuberella apatela and warming-up of sea water containing Systematophora sp. A would be apparent in both sections. Due probably to the time span, this phenomenon is clearer in Angles than in Berrias. In Angles, Tubotuberella apatela appears in Ang 130. A brief cooling period is observed in Ang 131C. This cooling continues up to Ang 147/148, where the tendency becomes reversed. The temperature gradually increases up to Ang 150, where Systematophora sp. A appears, then increases markedly up to Ang 156. In Berrias, this period corresponds to a global warming phase. However, slight cooling is recorded from Ber 174 to 178 where Tubotuberella apatela appears, followed by an increase in temperature from 178 to 180. The temperature then decreases sharply from Ber 180 to 188, increasing again starting from Ber 190, where Systematophora sp. A appears.
3.3. GEOCHEMICAL AND PALYNOLOGICAL CORRELATIONS
An alternative sequential interpretation (Emmanuel & Re
nard, this volume), based entirely on geochemical data (variations in manganese content), has been proposed for the Late Berriasian and compared with Dinoflagellate cyst distribution (Tab. III). It presents a good concordance with the sequential framework suggested by the team, except for the Late Berriasian in the depositional sequences where the palynological data was not in agreement with the sequential correlations. Furthermore, it solves the palynologists quest for the missing sequence boundary. In Berrias, these observations lead to a new sequence boundary placed post- Be4 and pre-Be5. The former Be5 becomes Be6, and the Be6 becomes the Be7. The positions of Be6 and Be7 are slightly modified. For the time being, this study does not wish or intend to judge the validity of this alternative method; it restricts itself to note that the proposals of the geochemists is in accordance with the data derived from the Dinoflagellate cysts.
4 CONCLUSION
In the Vocontian Trough, correlations between Dinoflagellate cysts and sequence stratigraphy confirmed that it is possible to label most of the sequence boundaries (Sb) and maximum flooding surfaces (mfs), using the earliest and latest occurences of several selected Dinoflagellate cysts.

BCREDP 17 (1993) SOUTH-EAST FRANCE: DINOFLAGELLATE CYST BIOZONATION OF THE TITHONIAN AND BERRIASIAN 261
TABLE IIIAlternative sequential interpretation proposed by geochemists (Emmanuel & Renard, this volume),
calibrated to Dinoflagellate cysts.
SURFACES DINOFLAGELLATE CYSTSSb and mfs FAD LAD
mfs 7«__ I K. FASCIATUM
Be7 128.5 Mat—I M. MACWHAEI forma A
(__ I SYSTEMATOPHORA sp. A(Angles)
<__ I P. PELLIFERUMBe6 129 Ma
mfs 6
* 1T. APATELA (Angles)
mfs 5 <__ I SYSTEMATOPHORA sp. A«__ I T. APATELA (Angles) (Berrias) * | A METAELLIPTICA
Be5 129.7 Mac__ 1 T. APATELA (Benias)
M. LONGICORNIS Acmemfs 4
( | C. DISSIMIUS
Be4 131.5 Ma
mfs 3
Be3 133 Ma
* | C. PYGMAEA( | P BASIFURCATUM
Be2 133.5 Ma
mfs 2 D. BENSONIIC. ELEGANTULUM
__ | T. DODEKOVAEA. ? NEPTUNI, C. PYGMAEAM. TABULATE M. LONGICORNIS
* 1 p. MIXTISPINOSUM
SPINIFERTTES __ 1 RAMOS US group.*
Be1 134 Ma
T16 W. CALIFORNICA *
__ Ia metaelufticaI P ANASILLUM LANTERNA spp.
Ti5 134.5 Ma
T14 136 Ma
—1 B. JOHN EWING II-
These taxa are believed to be good “sequential biomarkers” which could be used for long-distance correlations. From a palynological point of view, in hemipelagic domain (Berrias), the mfs are clearly marked by great peaks of species diversity. The association between peak and earliest occurrence of certain taxa, e.g. F. modesta with mfs 4 and Systematophora sp. A with mfs 6, allows mfs identification in pelagic environments where these peaks are markedly reduced and sometimes unobservable. The relationship between the Dinoflagellate cyst distribution and the manganese abundance (Emmanuel & Renard, this volume) shows great potential for further studies.
Until now, the biozonations placed next to the chart of eustatic sea-level changes was built empirically from preexisting data. In this study, we aimed to follow the reverse procedure. Firstly, we created a Dinoflagellate cyst biozonation, accurately correlated to the Ammonite and Calpio- nellid zones, then we established the sequential framework through a multidisciplinary study. Finally, we calibrated the sequential framework with the Dinoflagellate cysts, identi
fying some of them as “sequential biomarkers”. This study thus opens the way to concerted multidisciplinary research in sequence stratigraphy.
Acknowledgements
We are indebted to the members of the “Vocontian Trough Early Cretaceous working group” co-ordinated by R. Jan du Chêne (Consultant, Gradignan) and J.F. Raynaud
(Elf Aquitaine, Pau) for stimulating discussions and exchange of data. The English was significantly enhanced through the helpful feedback from E. Fookes and B. Ujetz
(University of Geneva). My thanks also go to M. Floquet
(University of Geneva) for processing the palynological samples and J. Metzger (University of Geneva) for draughting the figures. I am grateful to M. Gaillard (Shell-UK Expro, London) for critically reviewing this manuscript and to R. Curnelle (Elf Aquitaine, Boussens) for his support in publishing this paper. The Swiss National Science Foundation (grant n° 20-28468.90 and 20-33422.92) financially supported this research.

262 E. MONTEIL BCREDP 17 (1993)
5. — REFERENCES
Beaudoin, B. (1980).—Le bassin subalpin. — In : Autran, A.& Dercourt, J. (coord.) : Colloque C7, Géologie de la France. — Bur. Rech. géol. min., Mém. 107, 284-291.
Benson, D.G. (1985). — Observations and recommendations on the fossil dinocyst genera Ctenidodinium, Dichadogo- nyaulax, and Korystocysta. — Tulane Stud. Geol. Pa- leont., 18, 3-4, 145-155.
Busnardo, R., Le Hégarat, G. & Magne, J. (1965). — Le stratotype du Berriasien. — In: Colloque sur le Crétacé inférieur (Lyon, 1963). — Bur. Rech. géol. min., Mém. 34, 5-33.
Cecca, F., Enay, R. & Le Hégarat, G. (1989). — L’Ardescien (Tithonique supérieur) de la région stratotypique : série de référence et faunes (Ammonites, Calpionelles) de la bordure ardéchoise. — Doc. Lab. Géol. Fac. Sci. Lyon, 107, 115 p.
Costa, L.I., & Davey, R.J. (1992). — Dinoflagellate cysts of the Cretaceous System. — In : Powell, A.J. (ed.) : A Stratigraphic index of dinoflagellate cysts, 99-153.
Dromart, G., Ferry, S. & Atrops, F. (1992). — Removal of deep-water carbonates and relative sea-level changes : the Upper Jurassic-Lowermost Cretaceous of South-East France. — In : Posamentier, H.W., Summerhayes, C.P, Haq,B.U. & Allen, G.P. (eds.) : Sequence stratigraphy and Facies Associations — IAS Spec. Publ. 18 (in press).
Emmanuel, L. & Renard, M. (1993). — Carbonate geochemistry (Mn, 813C, 5180) of the Late Tithonian-Berriasian pelagic limestones of the Vocontian Trough (SE France). — Bull. Centres, Rech. Explor.-Prod. Elf Aquitaine, 17, 1, 205-221.
Galbrun, B„ Rasplus, L. & Le Hégarat, G. (1986). — Données nouvelles sur le stratotype du Berriasien : corrélations, entre magnétostratigraphie et biostratigraphie. — Bull. Soc. géol. France, 8, 2, 4, 575-584.
Gorin, G.E. & Steffen, D. (1991)' — Organic facies as a tool for recording eustatic variations in marine fine-grai- ned carbonates — example of the Berriasian stratotype at Berrias (Ardèche, SE France). — Palaeogeogr. Palaeo- climatol. Palaeoecol., 85, 303-320.
Habib, D. (1972). — Dinoflagellate stratigraphy Leg 11, Deep Sea Drilling Project. — Init. Repts. DSDP, 11, 367-425.
Habib, D. (1976). — Neocomian dinoflagellate zonation in the western North Atlantic. — Micropaléontology, 21, 4, 373-392.
Habib, D. (1977). — Comparison of Lower and Middle Cretaceous palynostratigraphic zonations in the western North Atlantic. — In : Swain, F.M., (ed.) : Stratigraphic Micropaleontology of Atlantic Basin and Borderlands, 341-367.
Habib, D. (1978). — Palynostratigraphy of the Lower Cretaceous sections at Deep Sea Drilling Project Site 391, Blake-Bahama Basin, and its correlation in the North Atlantic. — Init. Repts. DSDP, 44, 887-897.
Habib, D. & Drugg, W.S. (1983). — Dinoflagellate age of Middle Jurassic-Early Cretaceous sediments in the Blake-Bahama Basin. — Init. Repts. DSDP, 76, 623-638.
Habib, D., & Warren, J.S. (1973). — Dinoflagellates near the Cretaceous-Jurassic boundary. — Nature, 241, 217-218.
Jardine, S., Raynaud, J.-F. & Reneville, J. de (1984). — Di- noflagellés, spores et pollens. — In : Debrand-Passard, S., Courbaleix, S. & Lienhardt, M.-J. : «Synthèse Géologique
du Sud-Est de la France ». — Bur. Rech. géol. min., Mém. 125, 300-303.
Le Hégarat, G. (1973). — Le Berriasien du Sud-Est de la France. — Doc. Lab. Géol. Fac. Sci. Lyon, 43, 1-575.
Le Hégarat, G. (1980). — Le Berriasien. In: Cavelier, C. & Roger, J. (Coord.) : Les étages français et leur stratotypes. — Bur. Rech. géol. min., Mém. 109, 96-105.
Le Hégarat, G. & Ferry, S. (1990). — Le Berriasien d'Angles (Alpes de Haute-Provence, France). — Géobios, 23, 3, 369-373.
Le Hégarat, G. & Remane, J. (1968). — Tithonique supérieur et Berriasien de la bordure cévenole. Corrélation des Ammonites et des Calpionelles. — Géobios, 1, 7-70.
Londeix, L. (1990). — La distribution des kystes de Dinofla- gellés dans les sédiments hémipélagiques (Ardèche) et pélagiques (Arc de Castellane, S.E. de la France) en domaine vocontien du Valanginien au Barrémien inférieur. Biostratigraphie et relations avec la stratigraphie séquentielle. — Thèse Univ. Bordeaux (I), 598 pp.
Médioni, R. (coord.) et al. (1984). — Berriasien-Valanginien. — In : Debrand-Passard, S. et al. (eds.) : Synthèse géologique du Sud-Est de la France. — Bur. Rech. géol. min., Mém. 126.
Monteil, E. (1991). — Morphology and systematics of the Ceratioid group : a new morphographic approach. Revision and emendation of the genus Muderongia Cookson
& Eisenack, 1958. — Bull. Centres Rech. Explo.-Prod. Elf Aquitaine, 15, 2, 461-505.
Monteil, E. (1992a). — Quelques nouvelles espèces-index de kystes de dinoflagellés (Tithonique-Valanginien) du Sud-Est de la France et de l’Ouest de la Suisse. — Rev. Paléobiol., 11, 1, 273-297.
Monteil, E. (1992b). — Kystes de dinoflagellés index (Tithonique-Valanginien) du Sud-est de la France. Proposition d’une nouvelle zonation palynologique. — Rev. Paléobiol., 11, 1, 299-306.
Pourtoy, D. (1989). — Les kystes de dinoflagellés du Crétacé inférieur de la Veveyse de Châtel-Saint-Denis (Suisse) : Biostratigraphie et stratigraphie séquentielle. — Thèse 3e cycle, Univ. Bordeaux (I), 382 pp.
Riding, J.B. & Thomas, J.E. (1992). — Dinoflagellate cysts of the Jurassic System. — In : Powell, A.J. (ed.) : A Stratigraphic index of dinoflagellate cysts, 7-98.
Steffen, D. & Gorin G. (1993). — Sedimentology of organic matter in Upper Tithonian-Berriasian deep-sea carbonates of SE France : evidence of eustatic control. — In : Katz, B.J. & Pratt, L. (eds.) : Source rocks in a sequence stratigraphic framework. — Amer. Assoc. Petroleum Geol., Studies in Geology, (in press).
Steinhauser, N., Charollais, J., Clavel, B., Monteil, E. & Weid-
mann, M. (1993). — Le Berriaso-Valanginien du Jura Central et Méridional. — Eclogae. geol. Helv. (in press).
Strohmenger, Ch. & Strasser, A. (1993). — Eustatic controls on the depositional history of Upper Tithonian and Berriasian deep-water carbonate-marl deposits (Vocontian Trough, SE France). — Bull. Centres Rech. Explor.-Prod Elf Aquitaine, 17, 1, 183-203.
Thusu, B., Van der Eem, J.G.L.A., El-Mehdawi, A. & Bu-Ar-
goub, F. (1988). — Jurassic-Early Cretaceous palynostratigraphy in northeast Libya. — In : El-Arnauti, A. et al., Subsurface Palynostratigraphy of Northeast Libya, Benghazi, 1-276.

BCREDP 17 (1993) SOUTH-EAST FRANCE: DINOFLAGELLATE CYST BIOZONATION OF THE TITHONIAN AND BERRIASIAN 263
6. — APPENDIX
Alphabetical list of species
Achomosphaera? neptuni (eisenack, 1958) davey & Williams, 1966
Amphorula metaelliptica Dodekova, 1969, emend. Monteil, 1990
Biorbifera johnewingii Habib, 1972, emend. Below, 1987
Broomea ramosa Cookson & Eisenack, 1958
Cassiculosphaeridia pygmaea Stevens, 1987
Cirrusphaera dissimilis Monteil, 1992
Ctenidodinium elegantulum Millioud, 1969, emend. Below, 1981
Diacanthum hollisteri Habib, 1972, emend. Habib & Drugg, 1987
Dichadogonyaulax bensonii Monteil, 1992
Dingodinium scabratum (Kumar, 1986) Lentin & Williams, 1989
Foucheria modesta Monteil, 1992
Kleithriasphaeridium fasciatum (Davey & Williams, 1966) Davey, 1974
Lanterna bulgarica Dodekova, 1969
Leptodinium mirabiie Klement, 1960, emend. Sarjeant, 1984
Muderongia iongicornis Monteil 1991
Muderongia macwhaei forma A Monteil, 1991
Muderongia tabulata (Raynaud, 1978) Monteil, 1991Prolixosphaeridium anasillum Erkmen & Sarjeant, 1980
Prolixosphaeridium basifurcatum Dodekova, 1969
Prolixosphaeridium mixtispinosum (Klement, 1960) Davey et al., 1969
Prolixosphaeridium sp. AProtobatioladinium lunare Monteil, 1992
Pseudoceratium pelliferum Gocht, 1957 emend. Dôrhôfer & Davies, 1980
Pyxidinopsis chatiengerensis Habib, 1976
Spiniferites ramosus (Ehrenberg, 1838) Loeblich & Loeblich, 1966 group
Systematophora areolata Klement, 1960
Systematophora scoriacea (Raynaud, 1978) Monteil, 1992
Systematophora sp. ATehamadinium dodekovae Jan du Chêne et al., 1986
Tehamadinium evittii (Dodekova, 1969) Jan du Chêne et al. in Jan du Chêne et al., 1986
Tubotuberella apateia (Cookson & Eisenack, 1960) Ioannides et ai, 1977
Wallodinium cylindricum (Habib, 1970) Duxbury, 1983
Warrenia californica Monteil, 1992

264 E. MONTEIL BCREDP 17 (1993)
PLATE I
All photographs (x 800), in Nomarski interference contrast
Fig. 1. — Dingodinium scabratum (Kumar, 1986) Lentin & Williams, 1989. Slide Bro 1A t-1, England Finder reference D35/2. Early Tithonian (Fallauxi, Richteri). Broyon section, Ardèche, south-east France. Median optical view.
2. —Leptodinium mirabile Klement, 1960, emend. Sarjeant, 1984. Slide Bro 4-1, England Finder reference E20/2. EarlyTithonian (Fallauxi, Richteri). Broyon section, Ardèche, south-east France. Ventral face in low focus.
3. —Protobatioladinium lunare Monteil, 1992. Slide Bro 9-1, England Finder reference W36/1. Early Tithonian (Fallauxi,Richteri). Broyon section, Ardèche, south-east France. Ventral face in high focus. Partial paratabulation of ventral margin of the archeopyle.
4. —Prolixosphaeridium anasillum Erkmen & Sarjeant, 1980. Slide Bro 4-1, England Finder reference 026/3. Early Tithonian (Fallauxi, Richteri). Broyon section, Ardèche, south-east France. Median optical view.
5. —Prolixosphaeridium mixtispinosum (Klement, 1960) Davey et al., 1969. Slide Bro 1D t-1, England Finder referenceL23. Early Tithonian (Fallauxi, Richteri). Broyon section, Ardèche, south-east France. Median optical view.
6. — Prolixosphaeridium sp. A. Slide Ang 122-1, England Finder reference J41/2. Late Berriasian (eq. Boissieri, D1/D2).Angles section, Alpes-de-Flaute-Provence, south-east France. Median optical view.
7. —Prolixosphaeridium basifurcatum dodekova, 1969. Slide Bro 3 b-1, England Finder reference X17/2. Early Tithonian(Fallauxi, Richteri). Broyon section, Ardèche, south-east France. Median optical view.
8-9. —Lanterna bulgarica Dodekova, 1969. Slide Bro 1A b-1, England Finder reference G32. Early Tithonian (Fallauxi, Richteri). Broyon section, Ardèche, south-east France. Operculum in interior view.

BCREDP 17 (1993) E. MONTEIL:SOUTH-EAST FRANCE: DINOFLAGELLATE CYST BIOZONATION OF THE TITHONIAN AND BERRIASIAN : Plate 1
265

266 E. MONTEIL BCREDP 17 (1993)
PLATE C-
All photographs (x 800), in Nomarski interference contrast
Fig. 1-3. —Warrenia californica Monteil, 1992.1 : Slide Bro 21-1, England Finder reference Q15/2. Early Berriasian (Jacobi-GrandislB). Broyon section, Ardèche, south-east France. Right lateral face in high focus. Specimen showing a roughly verrucate ornamentation, with anastomosed elements.2: Slide Bro 27-1, England Finder reference E23. Early Berriasian (Jacobi-GrandislB). Broyon section, Ardèche, south-east France. Left lateral face in high focus. Specimen showing a spinous ornamentation.3 : Slide Bro 29-1, England Finder reference N38/2. Middle Berriasian (Occitanica, Subalpina/B). Broyon section, Ardèche, south-east France. Dorsal face in low focus. Archeopyle type 2P(3”+4").
4 — Cassiculosphaeridia pygmaea Stevens, 1987. Slide Bro 25-1, England Finder reference D14/4. Early Berriasian (Jacobi-GrandislB). Broyon section, Ardèche, south-east France. Dorsal face in high focus. Note the small attached operculum.
5-8. — Biorbifera johnewingii Habib, 1972, emend. Below, 1987.5 : Slide Bro 2 b-1, England Finder reference H37/2. Early Tithonian (Fallauxi, Richteri). Broyon section, Ardèche, south-east France. Dorsal face in low focus.6: Slide Bro 9-1, England Finder reference N20. Early Tithonian (Fallauxi, Richteri). Broyon section, Ardèche, south-east France.Dorsal face in low focus.7 : Slide Bro 2 b-1, England Finder reference C28. Early Tithonian (Fallauxi, Richteri). Broyon section, Ardèche, south-east France. Dorsal face in low focus.8 : Slide Ang 157-2, England Finder reference E31. Late Berriasian (eq. late BoissierilD3). Angles section, Alpes- de-Haute-Provence, south-east France. Ventral face in high focus. Tithonian specimens seem to differ from Berriasian specimens in having a subcircular shape rather than an elongate ellipsoidal shape.
9-10. — Cirrusphaera dissimilis Monteil, 1992.9: Slide Ber 160-1, England Finder reference H21. Middle Berriasian (Occitanica/Dalmasi/C). Berrias section, Ardèche, south-east France. High focus view.10 : Slide Ang 102m-1, England Finder reference D35/3. Late Berriasian (eq. Paramimounum, D1). Angles section, Alpes-de-Haute-Provence, south-east France.Median optical view. Note the small attached operculum.
11. — Dichadogonyaulax bensonii Monteil, 1992. Slide Ang 160m-1, England Finder reference M30/1. Late Berriasian (eq. late Boissieri, D3). Angles section, Alpes-de-Haute-Provence, south-east France. Polar view in median focus.
12-14. — Spiniferites ramosus (Ehrenberg, 1838) Loeblich & Loeblich, 1966 group. 12-13 : Slide Ang 90 b-1, England Finder reference C27/3. Late Berriasian (eq. Boissieri, Paramimounum/ D1). Angles section, Alpes-de-Haute-Provence, south-east France.12 : Right lateral view in high focus.13 : Median optical view.14: Slide Ber 141-1, England Finder reference W32/1. Early Berriasian (Jacobi-Grandisl B). Berrias section, Ardèche, south-east France. Median optical view.
15. — Wallodinium cylindricum (Habib, 1970) Duxbury, 1983. Slide Ang 111-1, England Finder reference C23. Late Berriasian (eq. Boissieri, Paramimounum/ D1). Angles section, Alpes-de-Haute-Provence, south-east France. High focus view. Note the angular archeopyle margin.

BCREDP 17 (1993) E. MONTEIL :SOUTH-EAST FRANCE: DINOFLAGELLATE CYST BIOZONATION OF THE TITHONIAN AND BERRIASIAN : Plate 2
267
tiré-
.

268 E. MONTEIL BCREDP 17 (1993)
PLATE \J
All photographs (x 800), in Nomarski interference contrast
Fig, 1. — Ctenidodinium elegantulum Millioud, 1969, emend. Below, 1981. Slide Ber 200 t-6, England Finder reference Q31. Early Valanginian (Otopeta/D3). Berrias section, Ardèche, south-east France. Median optical view.
2. — Tubotuberella apatela (Cookson & Eisenack, 1960) Ioannides et al., 1977. Slide Ang 130c-1, England Finder referenceG28. Late Berriasian (eq. late Boissierl/D2). Angles section, Alpes-de-Flaute-Provence, south-east France. Ventral face in high focus.
3. —Pseudoceratium pelliferum Gocht, 1957, emend. Dorhofer & Davies, 1980. Slide Ang 162m-1, England Finder reference X26. Late Berriasian (eq. late Boissierl/D3). Angles section, Alpes-de-Flaute-Provence, south-east France. Dorsal face in high focus.
4-5. — Tehamadinium evittii (Dodekova, 1969) Jan du Chêne et al. in Jan du Chêne et al., 1986. Slide Bro 9-1, England Finder reference W27/4. Early Tithonian (Fallauxi, Richteri). Broyon section, Ardèche, south-east France. Archeopyle type 2P(3"+4").4 : Ventral face in low focus.5 : Dorsal face in high focus.
6. — Diacanthum hollisteri Habib, 1972, emend. Habib & Drugg, 1987. Slide Ang 169, England Finder reference J42/4.Late Berriasian (eq. late Boissieri/D3). Angles section, Alpes-de-Haute-Provence, south-east France. Ventral face in high focus.
7. _ Tehamadinium dodekovae Jan du Chêne et ai., 1986. Slide Ang 160m-1, England Finder reference K20. Late Berriasian (eq. late Boissieri, D3). Angles section, Alpes-de-Haute-Provence, south-east France. Dorsal face in high focus. Archeopyle type 2P(3"+4").
8. —Amphoruia metaelliptica Dodekova, 1969, emend. Monteil, 1990. Slide Ber 150-2,England Finder reference H23.Middle Berriasian (Occitanica, Privasensis/C). Berrias section, Ardèche, south-east France. Ventral face in high focus. Note the clearly expressed paratabulation of the parasulcal area : as, ras, rs, Is and ps.

BCREDP 17 (1993) E. MONTEIL :SOUTH-EAST FRANCE: DINOFLAGELLATE CYST BIOZONATION OF THE TITHONIAN AND BERRIASIAN : Plate 3
269

270 E. MONTEIL BCREDP 17 (1993)
PLATE 4All photographs (x 800), in Nomarski interference contrast
Fig. 1. — Systematophora areolata Klement, 1960. Slide Ang 166 b-1, England Finder reference Q16/4. Late Berriasian (eq. late BoissierilD3). Angles section, Alpes-de-Flaute-Provence, south-east France. Dorsal face in high focus.
2. _ Systematophora sp. A. (= Systematophora sp. aff. S. fasciculigera sensu Habib, 1972). Slide Ang 162m-1, England Finder reference M20/4. Late Berriasian (eq. late BoissierilD3). Angles section, Alpes-de-Haute-Provence, south-east France. Dorsal face in high focus.
3-4. — Systematophora scoriacea (Raynaud, 1978) Monteil, 1992. Slide Ang 172m-1, England Finder reference J43/3. Early Valanginian (Otopeta/D3). Angles section, Alpes-de-Haute-Provence, south-east France.3 : High focus view.4 : Median optical view.
5. — Foucheria modesta Monteil, 1992. Slide Ang 162m-1, England Finder reference H30/3. Late Berriasian (eq. lateBoissierilD3). Angles section, Alpes-de-Haute-Provence, south-east France. Median optical view.
6. —Pyxidinopsis challengerensis Habib, 1976. Slide Ang 153-1, England Finder reference U41/3. Late Berriasian (eq.late BoissierilD3). Angles section, Alpes-de-Haute-Provence, south-east France. Right lateral face in high focus.
7. —Kleithriasphaeridium fasciatum (Davey & Williams, 1966) Davey, 1974. Slide Ang 172c-2, England Finder referenceR27/2. Early Valanginian (Otopeta/D3). Angles section, Alpes-de-Haute-Provence, south-east France. Median optical view.
8. —Achomosphaera ? neptuni (Eisenack, 1958) Davey & Williams, 1966. Slide Ber 146/11-8, England Finder referenceX42/2. Early Berriasian (Jacobi-GrandislB). Berrias section, Ardèche, south-east France. Dorsal face in high focus.

BCREDP 17 (1993) E. MONTEIL :SOUTH-EAST FRANCE: OINOFLAGELLATE CYST BIOZONATION OF THE TITHONIAN AND BERRIASIAN : Plate 4
271

272 E. MONTEIL BCREDP 17 (1993)
PLATE
All photographs (x 800), in Nomarski interference contrast
Fig. 1. _ Muderongia longicornis (0) Monteil, 1991. Slide Ang 111-1, England Finder reference S30. Late Berriasian (eq.Boissieri, Paramimounum/D1). Angles section, Alpes-de-Haute-Provence, south-east France. Ventral face in high focus. Note the long left antapical horn and the well-developed right antapical horn (arrow).
2. —Muderongia tabulata (0) (Raynaud, 1978) Monteil, 1991. Slide Bro 27-1, England Finder reference Q21/4. Early Berriasian {Jacobi-GrandislB). Broyon section, Ardèche, south-east France. Ventral face in high focus. Note the relatively short left antapical horn and the right antapical horn only expressed by a rounded bulge (arrow).
3 —Muderongia macwhaei (0) forma A Monteil, 1991. Slide Ber 199-1, England Finder reference G25/4. Early Valan- ginian (Otopeta/D3). Berrias section, Ardèche, south-east France. Ventral face in high focus. Note the short pos- tcingular extensions (arrows)
4. — Broomea ramosa Cookson & Eisenack, 1958. Slide Bro 6-1, England Finder reference T36/1. Early Tithonian (Fallauxi, Richteri). Broyon section, Ardèche, south-east France. Dorsal face in high focus.

BCREDP 17 (1993) E. MONTEIL :SOUTH-EAST FRANCE: DINOFLAGELLATE CYST BIOZONATION OF THE TITHONIAN AND BERRIASIAN : Plate 5
273
3*~~ÆÊÊÊÊKÊÊÊË

ERRATA
Editor's note : the author apologizes for several, specific errors which remain uncorrected in the preceding article because the script was hastily checked.
Monteil, E. (1991). - Morphology and systematics of the Ceratioid group : a new morphographic approach. Revision and emendation of the genus Muderongia Cookson & Eisenack 1958. - Bull. Centres Rech. Explor.-Prod. Elf Aquitaine, 15, 2, 461-505.
- Preliminary remark: The synonym list given on page 477 for the species named “M. tomaszowensis Alberti 1961 emend.” includesthe holotype of the species neocomica Gocht 1957. Consequently, the correct epithet for this species is : “Muderongia neocomica Gocht1957 comb. nov. & emend”.
- p. 462, second column, line 36, read “some of the Odontochitina species”.- p. 464, first column, line 6, read “(Fig. 1e)” and not “(Fig. 1d)”.- p. 464, first column, line 7, read “(Fig. 1d„ e)" and not “(Fig. 1e)”.- p. 464, second column, line 24, read “the periphragm is loose...”, and not “floppy”.- p. 466, caption Figure 2, read : “Examples in the species M. tabulata (0) comb. nov. & emend.” and not “in the species M. simplex (0)”.- p. 467, first column, line 1, read “W. ? neocomica".
- p. 467, table III, in species grouped under axial type (L I), read : M. sp. B sensu Raynaud 1978” and not “M. sp. A sensu Raynaud 1978”. Read “M. neocomica" and not “M. tomaszowensis”. Add M. longicornis.
- p. 467, table IV, in species grouped under joined type (ATP II), read : M. sp. B sensu Raynaud 1978” and not “M. sp. A sensu Raynaud 1978” and add M. longicornis. In species grouped under axial type (ATP I), read : "M. neocomica" and not “M. tomaszowensis".
- p. 468, first column, last line, read "bifid”.- p. 469, first column, line 20, read : “This general framework is applicable to almost all species belonging to the Muderongia/“Pho-
berocysta" complex”.- p. 470, first column, line 2, read “P. edgelli" : fig. 12D-F, fig. 13A-C in FIelby, 1987".- p. 470, second column, line 4, read "M. neocomica" and not "M. tomaszowensis".
- p. 470, second column, line 29, read “?pr, 4’, 0a, 6”, 6c ...”.- p. 471, first column, line 28, read M. longicornis" and not “M. Iongicoma”.
- p. 471, second column, lines 25-27, instead of “M. tomaszowensis..." read : “M. neocomica Gocht, 1957 comb. nov. & emend., p. 172; pi. 19, fig. 1; text-fig. 17. Plolotype (pi. 19, fig. 1) is from the Flauterivian of Germany.
- p. 471, second column, line 29, read “Muderongia ? lata".
- p. 471, second column, line 41, read "Phoberocysta ? dubia".
- p. 472, table VII, under species heading : read “M. tabulata comb. nov. & emend.”, “M. longicornis", and “M. neocomica comb. nov. & emend.” instead of "M. tomaszowensis”. Under synonyms heading : read “M. cf. macwhaei sensu Alberti 1961".
- p. 473, first column, line 36, read “M. longicornis" and not “M. Iongicoma".
- p. 473, second column, line 17, read “Late Berriasian” and not Early Berriasian”.- p. 473, second column, line 26, read “M. longicornis" and not “M. Iongicoma".
- p. 474, first column, line 23, read “Callisto Zone" and not “Upper Otopeta Zone”.- p. 474, Figure 4, read "Callisto Zone" and not “Upper Otopeta Zone".- p. 475, first column, line 17, read “M. neocomica" and not “M. tomaszowensis".
- p. 475, second column, line 23, read “M. longicornis" and not "M. Iongicoma".
- p. 475, second column, line 34, read “M. longicornis" and not "M. Iongicoma".
- p. 476, first column, delete lines 20-21.- p. 476, second column, line 1, read “M. longicornis" and not "M. Iongicoma".
- p. 477, first column, lines 13, instead of “M. tomaszowensis..." read “M. neocomica Gocht, 1957 comb. nov. & emend."- p. 479, table IX, read “Muderongia species determination key, table B”. Instead of “M. tomaszowensis emend.” read “M. neocomica
comb. nov. & emend.”- p. 480, table X, read “Muderongia species determination key, table A”. Read “M. tabulata comb. nov. & emend." and “M. longicornis".
- p. 481, second column, line 57, read : Harding, I.C. (1986). - An Early Cretaceous dinocyst assemblage from the Wealden of Southern England. Special Papers in Palaeontology, 35 : 95-109.
- Plate 2: line 1, read “M. longicornis".
lines 2 and 17, read “Late Berriasian” and not “Early”.- Plate 3: line 1, instead “M. tomaszowensis..." read “M. neocomica (0) Gocht, 1957 comb. nov. & emend.- Plate 9: line 1, instead "M. tomaszowensis..." read “M. neocomica (0-IV) Gocht, 1957 comb. nov. & emend.

UPPER TITHONIAN AND BERRIASIAN CALCAREOUS NANNOFOSSILS FROM THE VOCONTIAN TROUGH (SE FRANCE) :BIOSTRATIGRAPHY AND SEQUENCE STRATIGRAPHY
NANNOFOSSILES CALCAIRES DU TIT HO NIQUE SUPÉRIEUR ET DU BERRIASIEN DE LA FOSSE VOCONTIENNE (SUD-EST DE LA FRANCE) : BIOSTRATIGRAPHIE ET STRATIGRAPHIE SÉQUENTIELLE
Silvia GARDIN and Hélène MANIVIT
GARDIN, S. & MANIVIT, H. (1993). - Upper Tithonian and Berriasian calcareous nannofossils from the Vocontian Trough (SE France) : biostratigraphy and sequence stratigraphy. [Nannofossiles calcaires du Tithonique supérieur et du Berriasien de la Fosse Vocontienne (sud-est de la France): biostratigraphie et stratigraphie séquentielle]. - Bull. Centres Ftech. Explor.-Prod. Elf Aquitaine, 17, 1, 277-289, 11 fig.; Boussens, June 24, 1993. - ISSN: 0396-2687. CODEN • BCREDP.Les nannofossiles calcaires de trois coupes de référence de la Fosse Vocontienne
(SE France) d’âge tithonique supérieur à berriasien sont étudiés par des méthodes qualitatives et quantitatives. Les résultats sont intégrés à un cadre pré-défini de stratigraphie séquentielle afin :
— d'améliorer la calibration biostratigraphique des événements séquentiels par les nannofossiles calcaires;
— de tester les possibilités et les limites de l’utilisation de la nannoflore en interprétation séquentielle en définissant certaines tendances générales propres à chaque système de dépôt (gravitaire, prismes de bas niveau, transgressif, de haut niveau).
Ces résultats sont intégrés dans une interprétation séquentielle globale (Jan Du Chêne et al., 1993) fondée sur d’autres articles de spécialités publiés dans ce volume (Strohmenger & Strasser, Deconinck, Emmanuel & Renard, Steffen & Gorin, Monteil).
Silvia Gardin, Bureau de Recherches Géologiques et Minières, Service géologique national, BP 6009, F-45060 Orléans; Hélène Manivit, Laboratoire de Géologie des Bassins Sédimentaires, 4, place Jussieu, F-75252 Paris cedex 05, deceased, November 1991. - February 12, 1993.
Mots-clefs : Flore coccolithe, Tithonique, Berriasien, Biostratigraphie, Eustatisme (Stratigraphie séquentielle), Ardèche (Berrias, Broyon), Alpes de Flaute-Provence (Angles), Fosse Vocontienne.
ABSTRACT
Three Upper Tithonian - Berriasian reference sections of the Vocontian Trough (SE France) were investigated with calcareous nannofossll quantitative biostratigraphy. The results are compared with a pre-established sequence-stratigraphic framework, in order :
— to obtain a better calibration of the sequence-stratigraphic events with the calcareous nannofossils;
— to test the possibilities and limitations of calcareous nannofossils in sequence-stratigraphic interpretation and to define if general trends (in total abundance, specific diversity, total abundance of groups such as nannoconids or placoliths, etc.) are
observed throughout the different systems tracts of a succession of relatively deep-water third-order depositional sequences (maximum or minimum abundance peaks, increasing or decreasing curve patterns, etc.).
These results are included in a series of papers published in this volume (Strohmenger & Strasser, Deconinck, Emmanuel & Renard, Steffen & Gorin, Monteil), and integrated into a synthetic sequence- stratigraphic interpretation (Jan Du Chêne et al., 1993).
Key words Coccoliths, Tithonian, Berriasian, Biostratigraphy, Eus- tasy (Sequence stratigraphy), Ardèche (Berrias, Broyon), Alpes de Flaute-Provence (Angles), Vocontian Trough.
0396-2687/93/0017-0277 $ 2.60 © 1993 elf aquitaine production, F-31360 Boussens

278 S. GARDIN AND H. MANIVIT BCREDP (17) 1993
CONTENTS
INTRODUCTION.......................................................................... 2781. - THE GEOLOGICAL CONTEXT.......................................... 2782. - MATERIALS AND METHODS............................................ 2793. - CALCAREOUS NANNOFOSSIL BIOSTRATIGRAPHY..... 279
3.1. Introduction.................................................................. 2793.2. Results.......................................................................... 279
3.2.1. The Broyon Quarry......................................... 2793.2.2. The Berriasian stratotype.............................. 2803.2.3. The Angles reference section...................... 280
4. - CALCAREOUS NANNOFOSSILS AND SEQUENCESTRATIGRAPHY........................................ 2844.1. Introduction.................................................................. 2844.2. The Broyon Quarry..................................................... 2844.3. The Berriasian stratotype.......................................... 2844.4. The Angles reference section.................................. 284
5. - CONCLUSIONS.................................................................. 2886. - REFERENCES...................................................................... 289
INTRODUCTION
The objective of this paper is to test the possibilities and limitations of calcareous nannofossils in sequence-stratigraphic interpretation and to define if general trends (in total abundance, specific diversity, total abundance of groups such as nannoconids or placoliths, etc.) are observed throughout the different systems tracts of a succession of relatively deep-water, third-order depositional sequences (maximum or minimum abundance peaks, increasing or decreasing curve patterns, etc.).
Another objective of the work is to calibrate the calcareous nannofossil zonation with the reference Calpionellid and Ammonite zonations, and with the sequence-stratigraphic interpretation. The nannofossil specific distribution is compared with the standard biostratigraphic scale of Bra- lower et al. (1989) in the three reference sections selected : the Broyon Quarry, the Berrias Stratotype, the Angles reference section.
Results exposed in this paper have to be considered as preliminary. Additional samples need to be studied to improve the biostratigraphic resolution and to check the trends observed which are supposed to be related with relative sea-level changes.
A sequence-stratigraphic framework, essentially based on field observations, was first established during a field excursion in June 1991 (Jan Du Chêne et al., 1993). This sequence-stratigraphic interpretation is largely based on bed stacking patterns and identification of key surfaces, and is supported by sedimentological and facies analysis by Strohmenger & Strasser (1993).
The calcareous nannofossil results are compared to those of various other specialities published in this volume (Deco-
ninck, Clay mineralogy; Emmanuel & Renard, Geochemistry; Steffen & Gorin, Palynofacies; Monteil, Dinoflagellates) and integrated into a synthetic sequence-stratigraphic interpretation (Jan du Chêne et al., 1993).
1 — THE GEOLOGICAL CONTEXT
The Vocontian Trough belongs to the Southern Subalpine Ranges (SE France), and is essentially characterized by deep-water pelagic sediments (Fig. 1). Detailed studies on the Upper Tithonian and Berriasian interval on both geology and lithology are those of Médioni et al., (1984), etc., and the reference biostratigraphic framework is based on Cal- pionellids and Ammonites (Busnardo eta!., 1965; Le Hégarat, 1973, 1980; Le FIégarat & Remane, 1968; Le Hégarat & Ferry, 1990, etc). Calcareous nannofossils (Bralower et al. (1989) and Dinoflagellate (Monteil, 1992, 1993) zonations have been recently established.
The precise locations of the sections are given by Cecca et al., (1989; fig. 9, p. 36) for the Broyon Quarry, Busnardo et al., (1965; fig. 3, p. 10) for the Berriasian stratotype and Le Hégarat & Ferry, (1990; fig. 1, p. 370) for the Angles reference section.

BCREDP (17) 1993 VOCONTIAN TROUGH : UPPER TITHONIAN AND BERRIASIAN CALCAREOUS NANNOFOSSILS 279
2 MATERIALS AND METHODS
A first set of samples was collected before the establishment of the sequence-stratigraphic framework. Therefore, third order sequences and their subdivisions (systems tracts and major surfaces) were not entirely covered. Additional samples were subsequently selected around crucial levels such as sequence boundaries and maximum flooding surfaces. Investigations on some of these samples are still in progress.
The marly and clayey intervals were collected as much as possible in order to obtain better preserved calcareous nannofossil assemblages. However, an important part of the sections is represented by massive limestones, varying from mass-flow deposits (slope fans, breccia beds, etc.) to finegrained, hard limestone beds, strongly affecting the preservation and distribution of the calcareous nannofossils.
Slide preparation required much attention : the same amount of material (1gr) was selected from each row sample and ground in nine grammes of distilled water. Five drops of this solution were dispersed on a cover glass and subsequently heated in order to obtain an homogeneous distribution.
Slides were first observed from a qualitative point of view, listing all genera and species present in each of the samples (biostratigraphic qualitative distribution and specific diversity diagrams).
A quantitative analysis was then performed counting all the calcareous nannofossils recognized in a selected area of 300 views (total abundance, placolith and nannoconid abundance diagrams).
CALCAREOUS NANNOFOSSIL ZONATION (Bralower et al., 1989)
ZONE SUBZONE
C oblongata (NK-3) (NK-3A)
P. fenestrata (NK-2B)
ralus
(NK-2) A. infracreta cea
(NK-2A)
N. steinmann steinmanni
(NK-1)
M. chiastius (NJK)
N. steinmann
(NJK-D)
R. laffittei (NJK-C)
U. granulos« granulosa
H. noelae (NJK-A)
C. mexicana (NJ-20)
P. beckmann (NJ-20B)
H. cuvillieri (NJ-20A)
V. stradneri (NJ-19)
P. embergeri (NJ-19B)
MAIN EVENTS
CALPIO-NELLIDZONATION
TETHYANAMMONITEZONATION
C. angustiforatus —* R, nebulosus
J N. steinmanni steinmanni
l N. steinmanni minor
_j R. laffittei
J U. granulosa granulosa
M. chiastius H. noelae
—I P. beckmannii
1 C. mexicana minor
J P. embergeri
Calpionellites(E)
ROUBADIANAL. hungarica
(D3)
Cs. oblonga (D2)
Cs. simplex (D1)
C. elliptica (C)
C. alpina(B)
DURANQITES
Crassicollaria(A)
TRANSITORIUS
SIMPUSPHINCTEi
3 < o
Figure 2
Reference calcareous nannofossil zonation for the Tithonian- Lower Valanginian (Bralower et at., 1989).
3 — CALCAREOUS NANNOFOSSIL BIOSTRATIGRAPHY 3.2. RESULTS
3.1. INTRODUCTION
Tithonian-Early Cretaceous calcareous nannofossil blos- tratigraphy has recently been studied in detail both inland and in DSDP Sites (Thierstein, 1971, 1973, 1976; Perch-Niel- sen, 1979, 1985; Roth, 1978, 1983; Cooper, 1984; Bralower, 1986; Bralower et at., 1989). The synthetic zonation proposed by Bralower et al. (1989) turned out to be the best for this time interval and provides a high resolution biostratigraphy; moreover, the calcareous nannofossil bloevents are correlated with magnetostratigraphy (Ogg, 1983; Ogg et al., 1984), Calpionellid and Ammonite zonations (Fig. 2). However Ogg et al. (in press) observed that “the multiplicity of Tethyan-Atlantic magnetostratigraphic sections has enabled quantification of the diachroneity and other variations in the first/last appearance datum levels of various microfossils”, including calcareous nannofossils. These diachroneities are observed in the sections studied where they are certainly amplified by unfavourable lithologies.
3.2.1. The Broyon Quarry
A detailed lithological log is given in Jan Du Chêne et al. (1993). The Broyon Quarry consists mostly of a series of bedded limestones with minor marl intercalations at the base (6-7 m), overlain by a massive limestone succession interpreted as gravity displaced sediments (about 18 m) and marl dominated deposits towards the top (17 m). According to Dromart et al. (1992) and Strohmenger & Strasser (1993), the Broyon section is interpreted as hemipelagic slope deposits.
Our biostratigraphic results are coherent with those already published by Thierstein (1973) and Bralower et al. (1989) in the Broyon Quarry. The calcareous nannofossil preservation and distribution are moderate in the basal marly levels, very poor in the massive limestone succession, and fairly good in the marl dominated deposits at the top of the Quarry (Fig. 3, 4 and 5).
In Bralower et al. (1989), the lower part of the section, up to the top of the massive limestone, is attributed to the zone NJK. The presence of abundant Polycostella beck-

280 S. GARDIN AND H. MANIVIT BCREDP (17) 1993
CO
ABUNDANCE PRESERVATION Biscutum sp.Conusphaera mexicana mexicana Conusphaera mexicana minor Cyclagelosphaera margerelii Diazomatholithus lehmannii Discorhabdus rotatorius Nannoconus sp.Parhabdolithus cf. swinnertonii Polycostella beckmannii Watznaueria barnesae Watznaueria manivitae Zeughrabdothus embergerii Biscutum ellipticum Nannoconus compressus Small Rhagodiscus sp.Faviconus multicolumnatus Zeughrabdothus erectus Nannoconus infans Cyclagelosphaera deflandrei Hexalithus noelae Micrantholithus hoschultzi Nannoconus broennimanni Nannoconus kamptneri minor Cretarhabdus surirellus Cruciellipsis cuvillieri Diadorhombus rectus Manivitella pemmatoidea Microstaurus chiastius Nannoconus steinmanni minor Nannoconus steinmanni steinmanni Polycostella senaria Rhagodiscus asper Rotelapillus laffittei Umbria granulosa granulosa Staurolithites sp.Cretarhabdus octofenestratus Litraphidites carniolensis Nannoconus globulus minor Rhagodiscus nebulosus Rhagodiscus splendens Speetonia colligata Umbria granulosa minor Vekshinella sp.Assipetra infracretacea Markalius circumradiatus Nannoconus kamptneri kamptneri Tegumentum stradneri Bukrylithus ambiguus Nannoconus globulus globulus Markalius ellipticum Retacapsa angustiforata
Figure 3
Calcareous nannofossil distribution and zonation in the Broyon Quarry section.
mannii, Conusphaera mexicana mexicana, Faviconus multicolumnatus and the absence of Microstaurus chiastius and Hexalithus noelae rather indicate subzone NJ-20B (Middle Tithonian) for the lowermost interval, at least up to bed 9.
M. chiastius first occurs in bed 19 together with Nannoconus steinmanni steinmanni, a marker of the zone NK-1 (Lower - Middle Berriasian). The non-definition of zone NJK is probably due to unfavourable lithology in the massive limestone succession of the Middle - Upper Tithonian.
The base occurrence of Retacapsa angustiforata and Rhagodiscus nebulosus in bed 24 defines the base of zone NK-2, subzone NK-2A. These results are coherent with those of Bralower et al. (1989) for this quarry, even if these authors define the base of the NK-2A zone as at the base of the Dalmasi Ammonite subzone and in the Calpionellid zone C in their reference zonation. In addition, they observed that
some nannofossil ranges overlap in Broyon and do not in DSDP Site 534A, suggesting low sedimentation rate and condensation at Broyon. They finally concluded that reworking may have caused mixed nannofloral assemblages or that the Calpionellid and Ammonite stratigraphies need to be reinvestigated in this section. The biostratigraphic (at the base of Privasensis and Calpionellid zone C), geological and sequence-stratigraphic correlations (SB Be 4) of the uppermost breccia bed of the Broyon Quarry (bed 30) with the Berriasian stratotype bed 150, would rather support the diachroneity observed in the nannofossils.
3.2.2. The Berriasian stratotype
A detailed lithological log is given in Jan Du Chêne et al. (1993). The Berriasian stratotype consists mostly of a series of bedded limestones with a massive breccia-bed in its middle part (bed 150), and increasing marl alternations towards the top. According to Gorin & Steffen (1991) and Strohmen- ger & Strasser (1993), the Berriasian section is interpreted as hemipelagic outer platform deposits.
Our preliminary biostratigraphic results (Fig. 6, 7 and 8) are coherent with those already published by Thierstein (1973), Manivit in Galbrun et al. (1986) and Bralower et al. (1989). Investigations on some additional samples are still in progress in order to improve the correlations between nannofossil distribution and sequence-stratigraphic interpretation.
The lowermost part of the section (bed 138 to 142) has not been studied. The zonal species of zone NK-1, N. steinmanni steinmanni, is present from the lowermost sample in bed 143/2. Flowever, the zone boundary may be slightly lower in the non-studied interval.
In this section, the zone NK-1 extends far above the boundary proposed by Bralower et al. (1989; base Dalmasi), up to the middle of the Paramimounum Ammonite subzone and middle Calpionellid zone D1. This diachroneity may be due to the small number and poverty of the samples studied in the Dalmasi-Paramimounum interval.
The base occurrence of Retacapsa angustiforata is recorded in bed 170 (base subzone NK-2A).
The calibration of the base of subzone NK-2B (Upper Berriasian-Lowermost Valanginian; Fig. 7) is coherent with the proposals of Bralower et al. (1989). The base occurrence of Percivalia fenestrata is recorded at the base of bed 190, in the Picteti Ammonite subzone and in the Calpionellid zone D2. It corresponds to the maximum flooding surface of Be 5 as defined in the sequence-stratigraphic framework.
3.2.3. The Angles reference section
The section is dated by Calpionellids only (Le Hégarat & Ferry, 1990). It consists of massive limestone beds at the base, grading into limestone-marl alternations towards the top. At two different levels, slumped and channelized beds coincide with important biostratigraphic gaps. The limestone-marl alternations in the Angles section are considered as pelagic basin deposits (Strohmenger & Strasser, 1993).
The lower part of the section (beds 60 to 75) shows barren samples or reveals very poor assemblages of calcareous nannofossils (Fig. 9, 10 and 11) such as: Conu-

BCREDP (17) 1993 VOCONTIAN TROUGH : UPPER TITHONIAN AND BERRIASIAN CALCAREOUS NANNOFOSSILS 281
BROYON
30 72^7
29
15
_L12
10
5m
_0m
CALCAREOUS NANNOFOSSILS
FAD(main events)
C. ANGUSTIFORATUS R. NEBULOSUS N. KAMPTNERI KAMPTNERI N. GLOBULUS M. CIRCUMRADIATUS
N. STEINMANNII STEINMANNII
LAD(main events)
§ i;N s."3
NK2A
N. STEINMANNII MINORM. CHIASTIUS
~PrOENAfWr~ ----- -1ANULQ
N. COMPRESSUS
P. BECKMANNH
Be4
Be3?
NK1
NJK
NJ20B
Be2
Bel
Ti6?
m.
Ti4
Figure 4
Calcareous nannofossil biostratigraphy and integrated sequence stratigraphy in the Broyon Quarry.

282 S. GARDIN AND H. MANIVIT BCREDP (17) 1993
Figure 5Quantitative distribution of calcareous nannofossils and integrated sequence stratigraphy in the Broyon section (see chapter 2)
a : Calcareous nannofossil total abundance; b : Calcareous nannofossil specific diversity; c : Placolith abundance; d ; Nannocomd abundance.
(T) O 10 3 (0 0> 3 XT
Abundance ;+PRESERVATIONCyclageloBphaera margerelii Cyclagelosphaera deflandrei Watznaueria barneaae Conusphaera tnexicana mexicana Microstaurus chiastius Nannoconus broennimanni Nannoconus kamptneri minor Nannoconus sp.Nannoconus steinmanni steinmanni RhagodiscuB splendens Umbria granulosa granulosa Watznaueria manivitae Zeughrabdothus embergerii Conusphaera maxicana minor Litraphidites carniolensis Micrantholitus hoschultzi Nannoconus infans Nannoconus steinmanni minor Nannoconus globulus globulus Rhagodiscus asper Cretarhabdus octofenestratus Cruciellipsis cuvillieri Faviconus multicolumnatus Nannoconus compressus Vekshinella sp.Bukrylithus ambiguus Diazomatholithus lehmanni Markalius circumradiatus Small Rhagosdicus sp. Zeughrabdothus erectus Cretarhabdus conicus Micrantholithus obtusus Nannoconus kamptneri kamptneri Aotelapillus laffittei Manivitella pemmatoidea Micrantholithus sp.Umbria granulosa minor Biscutum sp.Retacapsa angustiforata Rhagodiscus nebulosus Discorhabdus rotatorius Assipetra infracretacea Percivalia fenestrata Nannoconus globulus minor Speetonia colligata
> o » <CO®#® c 3 Ï m n3 3 n> *<a o0 3 3 H3 n> a
Figure 6
Calcareous nannofossil distribution and zonation in the Berrias stratotype.
sphaera mexicana mexicana, Conusphaera mexicana minor, Zeughrabdothus embergeri, Cyclagelosphaera margerelii, Watznaueria barnesae. This interval remains unzoned.
The lowermost diagnostic assemblage is found in bed 80 m, with Cruciellipsis cuvillieri and Microstaurus chiastius. It characterizes zone NJK (Upper Tithonian-Lower Berria- sian). These base occurrences are observed later (intra Be 2) in Angles than in the Berrias stratotype, where the base of the zone NK-1 is recorded at the SB Be 2 or below. Abundant base occurrences are recorded between beds 80 and 86, most probably because of an important change in the depositional systems, from essentially stacked slope fan deposits (beds 60 to 75) to lowstand prograding wedges with thin marly intercalations ; Nannoconus globulus minor,N. wintereri, N. kamptneri kampneri, N. kamptneri minor, Po- lycostella senaria, Manivitella pemmatoidea and Umbria granulosa granulosa.
Because of the important stratigraphic gap observed in the slumped interval (beds 88-89), the base of zone NK-1 is recorded only in sequence Be 4 with the base occurrence of Nannoconus steinmanni steinmanni. This zone is extremely reduced and corresponds to the lowstand of Be 4.
The base of subzone NK-2A is recorded as intra Be 4 both in Berrias and Angles, with the base occurrence of Retacapsa angustiforata in Calpionellid zone D1 (in Calpio- nellid zone C in Bralower et al., 1989). However, in Berrias this base occurrence is observed in the HST, whilst in Angles, it occurs in the lowstand prograding wedge.
Other important events recorded in NK-2A are the base occurrence of Rucinolithus wisei in bed 102 and the topmost occurrence of Umbria granulosa granulosa in bed 117.
The calibration of the base of subzone NK-2B (Upper Berriasian-Lowermost Valanginian; Fig. 10) is coherent with the proposals of Bralower et al. (1989). The base occurrence of Percivalia fenestrata is recorded in bed 130, in the Calpionellid zone D2. It corresponds to the top lowstand surface of Be 5 as defined in the sequence-stratigraphic framework. This boundary is precisely calibrated in both Berrias and Angles.
The base occurrence of Tubodiscus jurapelagicus is observed in bed 153, in the Calpionellid zone D3. For Bra
lower et al. (1989), this species is known from the base of D3.

Jaco
bi
Gra
ndis
Subalpins Priv
asen
sis D
alm
asi Param
imou
num
Pi
ctet
i Icallistolotope
ta
BCREDP (17) 1993 VOCONTIAN TROUGH : UPPER TITHONIAN AND BERRIASIAN CALCAREOUS NANNOFOSSILS 283
Figure 7
Calcareous nannofossil biostratigraphy and integrated sequence stratigraphy in the Berrias stratotype.

284 S. GARDIN AND H. MANIVIT BCREDP (17) 1993
BEDNr.
S) TOTAL ABUNDANCE b) SPECIFIC DIVERSITY C) PLACOLITHS (j) NANNOCONIDS BEDNr.
SEQUENCE STRAT.FRAMEWORK
197 197 SB (Be 7)
192/64 WÊÊÊ 192/64 HSTSB (Be 6)
190b
184
190b HSTTop lowstand surface
■Hi 184LST
SB (Be 5)
182
180
■■■ ■ 182
■ 180
170/42 ■■■■ ■■■ 170/42 HSTTod lowstand surface
159 ■hm WM 159
LST
SB (Be 4)
154/26 WÊÊÊÊÊÊÊM
■ ■ 154/26,
150/2* ^■1 150/24
149 wmm■
149 Top lowstand surface
147/15 147/15 SB (Be 3)
147/1'
146/8
143/2
1 147/14
146/8
HSTMFSTST
Top lowstand surface
■ ■■ ■ 143/2 SB (Be 2)
10 20 100 200 3Ô0 0 20 40 60 80
Figure 8
Quantitative distribution of calcareous nannofossils and integrated sequence stratigraphy in the Berrias stratotype section (see chapter 2). a : Calcareous nannofossil total abundance; b ; Calcareous nannofossil specific diversity; c : Placolith abundance; d : Nannocomd abundance.
4 — CALCAREOUS NANNOFOSSILS AND SEQUENCE STRATIGRAPHY
4 1. INTRODUCTION
Slides were first observed from a qualitative point of view (Fig. 5b, 8b and 11b; specific diversity diagrams). A quantitative analysis was then performed, counting all the calcareous nannofossils recognized in a selected area of 300 views (Fig. 5a, 8a and 11a), and the abundance in placoliths (Fig. 5c, 8c and 11c) and nannoconids (Fig. 5d, 8d and 11 d).
The sample distribution does not allow an accurate quantitative interpretation of the calcareous nannofossils in the Berrias section. Trends are observable in the upper part of the Angles section, in sequence Be 4 and above. In the marly facies, the quantitative curves mostly show a similar evolution, but the sharpest contrasts are given by the nan- noconid total abundance.
The distribution of the calcareous nannoplancton, seems strongly affected by the unfavourable lithological successions of the three sections studied. These preliminary results have to be improved by analysing a larger number of samples.
4.2. THE BROYON QUARRY
The distribution of the calcareous nannofossils is strongly influenced by the lithology in the Broyon Quarry. Total abundance and specific diversity are maximum in the lowermost and, principally, in the uppermost marly dominated intervals. These values are minimum in the massive limestone (Fig. 5).
The section being essentially composed of stacked low- stands, variations between systems tracts are impossible to define in this outcrop. However, the abundance absolute values recorded in sequence Be 2 to Be 4 (beds 19-27), are almost identical to those observed in the same interval of the Angles section (beds 80-86).
4.3. THE BERRIASIAN STRATOTYPE
The number of samples analysed in the Berrias stratotype is inadequate to draw trends through the different systems tracts. Observations are punctual except for the sequences Be 4 and Be 5 (Fig. 8).
In Be 4, three samples are analysed in the base of the lowstand prograding wedge and one in the middle of the highstand. The curve pattern does not show any sensible variations both in diversity and abundance, but the transgressive systems tract and its bounding surfaces have not yet been analysed (Fig. 6, 7, and 8). In addition, the absolute values recorded in the Be 4 lowstand of Berrias (beds 150/24-159) are much lower than those observed in the same lowstand of the Angles section (beds 88-90). These differences may be due to a more important marl ratio in the limestone succession of Angles.
In sequence Be 5, three samples are analysed in the lowstand prograding wedge and one in the base of the highstand. The lowstand succession shows continuous increase, both in diversity and abundance, from the base to the top and does not reflect the prograding and shallowing-up pattern of the lowstand (maybe because of the important water depth or condensation in the distal part of the lowstand). Differences are also observed between the absolute values of the sequence Be 5 of Berrias, and those recorded in the same sequence of the Angles section.
4.4. THE ANGLES REFERENCE SECTION
A sharp contrast in total abundance and specific diversity is observed between the basal channelized slope fans massive limestone of the Upper Tithonian - Lowermost Berria- sian, and the thin marly intercalations of the Be 2 and Be 4 lowstand prograding wedge. This important increase may be due in part to the abrupt change in lithology, reworkings (in bed 88b) and condensation (in bed 90t). This could be confirmed by the multiple base occurrences recorded in these levels (Fig. 11).

BCREDP (17) 1993 VOCONTIAN TROUGH : UPPER TITHONIAN AND BERRIASIAN CALCAREOUS NANNOFOSSILS 285
BERRIASIAN
-------- • rrj'L.i i i nmiiiiiiiii i i î i i i T-umin i i i i i i n rnm -ri i
□n • Œ) •
STAGE
NANNOFOSSIL ZONES (Bralower et alii, 1989)
ABUNDANCEPRESERVATIONConusphaera mexicana mexicana Cyclagelosphaera margerelii Diazomatholithus lehmanni Litraphidites carniolensia Watznaueria barnesae Watznaueria britannica Watznaueria manivitae Assipetra infracretacea Rhagodiscus asper Biscutum ap.Cretarhabdua conicus Cruciellipaia cuvillieri Cyclagelosphaera deflandrei Discorhabdus rotatorius Manivitella pemmatoidea Microatauru8 chiastius Nannoconue globulus minor Nannoconus minutua Nannoconus ap.Nannoconus winteren
| Polycoatella aenaria Rhagodiscus splendens Zeughrabdothus embergeri Cretarhabdua cf. octofenestratua Markaliua circumradiatus Nannoconus kamptneri kamptneri Nannoconus kamptneri minor Umbria granulosa granulosa Zeughrabdothus erectus
! Zeughrabdothus fissus | Nannoconus bermudezi
n> o cn 3 (D 0)3 tr
> n ̂ » <& o a> & ac 3 € ^ n3 3 '•«. id <a o *»*w 3 s M 3 (D TJ 0>ft a o t^ CJ 0 ID
0 C 1 -N. <03 »a <
i t mmn I I I I mini i i r-nninninr i
amii—cm I I l IJ • ...................in----------co • —co • —-----
m i I I I TTT'I
CO-------CO
• • CO--- • •
Nannoconus steinmanni minor Nannoconus steinmanni steinmanni Cretarhabdus striatus Cretarhabdua surirellus Eprolithus ? sp.Nannoconus compressus Retacapsa angustiforata Rhagodiscus nebulosus Rotelapillus laffittei Sollasites sp.Speetonia colligata Staurolithites sp.Nannoconus broennimanni Rucinolithus sp.Zeughrabdotus sp.Braarudosphaera sp.Eiffellithus cf. primus Ethmorhabdus cf. gallicus Microstaurus quadratus Nannoconus infans Rucinolithus wisei Nannoconus globulus globulus Podorhabdaceae sp.Markalius ellipticus Percivalia fenestrata Vagalapilla cf. angusta Vagalapilla compacta Micrantholitus hoschultzi Micrantholitus sp.Micrantholitus obtusus Tubodiscus jurapelagicus Diadorhombus rectus
Figure 9
Calcareous nannofossil distribution and zonation in the Angles reference section.
An adequate number of samples has been analysed in the transgressive (3 samples) and high stand (5 samples) systems tracts of the sequence Be 4. The total abundance in calcareous nannoplancton, placoliths and nannoconids and the specific diversity show slightly higher values in the transgressive sytems tracts than in the high stand. The sharpest contrast between the total abundance curves appears between the condensed transgressive (bed 130top) and top high stand (bed 131F) values of the sequence Be 5. Additional samples are currently being studied in the lower part of the HST (bed 131 A-E). From bed 130t upward, the nannoconids become a major component of the calcareous nannofossil assemblages.
Four samples were analysed in sequence Be 6. Similar curve patterns are developed with relatively lower values in the lowstand (bed 139t) and high stand (bed 153), and maximum values in the transgressive systems tract (beds 142 and 147t). The strongest differences are observed in the abundance diagrams (Fig. 11a, 11c and 11 d) and not in the specific diversity curve (Fig. 11b).
The same curve pattern is recorded in the sequence Be 7 with low values in the lowstand and maximum values in the transgressive and basal high stand. The strongest differences are again observed in the abundance diagrams (Fig. 11a, 11c and 11 d) and not in the specific diversity curve (Fig. 11b).

T I T
H O
N I A
N
286 S. GARDIN AND H. MANIVIT BCREDP (17) 1993
| ANGLES o (base)
CALCAREOUS NANNOFOSSILS
FAD(main events)
LAD(main events)
Z<CO<octrLUm
ib:
A3A M Al< |A<TvA 7 < A
RUCINOUTHUS sp.
.fcL
R. NEBULOSUS R. ANGUSTIFORATA R. LAFFITTEI
N. STEINMANNII STEINMANNII•irmSTemmmrmiorrmU. GRANULOSA GRANULOSA N. KAMPTNERI KAMPTNERI N. KAMPTNERI MINOR N. BERMUDEZI
M. CHIASTIUS C. CUVILLIERIN. GLOBULUS MINOR N. WINTERERIC. CONICUS M. PEMMATOIDEA
P. EMBERGERII C. MEXICANA MEXICANA P. BECKMANNII
Figure 10
Calcareous nannofossil biostratigraphy and integrated sequence stratigraphy in the Angles reference section, a : base; b : top.
Seq.
strat
i.

Cal
pion
.
BCREDP (17) 1993 VOCONTIAN TROUGH : UPPER TITHONIAN AND BERRIASIAN CALCAREOUS NANNOFOSSILS 287

288 S. GARDIN AND H. MANIVIT BCREDP (17) 1993
BED Cl) TOTAL ABUNDANCE b) SPECIFIC DIVERSITY C) PLACOLITH ABUNDANCE (j) NANNOCONID ABUNDANCE BEDNr.
SEQUENCE STRAT. FRAMEWORK
172 ■HHHH 172 MFS (Be 7)
170m ■̂ 170rr TST
16&A1 16SAI
162mTop lowstand surface
LST162m
160 iiinMHas* 160 SB (Be 7)
153 153 MFS (Be 6)
147t ■HHHI 147t TST
147 142 Top lowstand surface
■H 139t LST-------^r5----------1391
131Ft 131Pi HSTMFS (Be 51
Top lowstand surface1301 1301
120 ■Hi 120SB (Bt 5)
117 ■■■ 117
115 ■■■■■■ 115
113t ■■ 113t HST
108t ■■■m 108t
105t ■■■ ■ 105t MFS (Be 4)
102m ■■■■■■ 102mTST
98t ■1 98t
93m 93m
90m
Top lowstand surface
LST90m
88b ■HHHHHHi 88b SB (Be 3) + (Be 4)
86t TllilWM— mmm ■ 86t
80m ■ 80m SB (Be 2)
75
73
75
73LST
§B(Bf DtSBtTlfl
63t 63t
61t mm
59t ■■ ,,,,,,,, , 59t
' 400 800 ' 1200 ’ 1600 10 ' 20 ' 30 40 400 ' 800 1200 ' 1600 100 200 300 400 500 600
Figure 11
Quantitative distribution of calcareous nannofossils and integrated sequence stratigraphy in the Angles reference section (see chapter 2). a : Calcareous nannofossil total abundance; b : Calcareous nannofossil specific diversity; c ; Placolith abundance; d : Nannoconid abundance.
5 CONCLUSIONS
The distribution of the calcareous nannoplancton seems strongly affected by the unfavourable lithological successions of the three sections studied. These preliminary results have to be improved by analysing a larger number of samples, principally in selected intervals of the Berrias and Angles sections.
Nannofossils are sensitive to facies. In these carbonate- dominated sections, base and top occurrences of the index species rarely occur in stratigraphic positions comparable to the ones defined in the standard zonation of Bralower et al. (1989). They are rarely precisely correlatable between the three sections, except the base of the subzone NK-2B which is related to the transgressive systems tract or maximum flooding surface of the sequence Be 5, both in Berrias and Angles. However the species characterizing the Upper Tithonian - Berriasian are present and the analysis of additional samples will most probably calibrate more precisely the zones NJK, NK-1, NK-2A.
The following correlations between the nannofossil zonation and sequence-stratigraphic subdivisions are proposed ;
• NJ-20B : not correlatable but observed in Broyon below SB Ti 4.
• Base NJK : difficult to define because of unfavourable lithology both in Broyon and Angles.
• Base NK-1 : certainly older than SB Be 2 (Broyon).• Base NK-2A : most probably in the base of Be 2, in
the Jacobi-Grandis Ammonite zone. However, Bralower et al. (1989) defines the base of the NK-2A zone at the base of the Dalmasi Ammonite subzone and in the Calpionellid zone C.
• Base NK-2B : is related to the transgressive systems tract or maximum flooding surface of the sequence Be 5, both in Berrias and Angles.
The sample distribution does not allow an accurate quantitative interpretation of the calcareous nannofossils in the Berrias section. Trends are observable in the upper part of the Angles section, in sequence Be 4 and above. In the marly facies, the quantitative curves (total abundance in calcareous nannoplancton, abundance in nannoconids, In pla- coliths, specific diversity) mostly show a similar evolution, but the sharpest contrasts are given by the nannoconid total abundance. Transgressive systems tracts and maximum flooding surfaces generally coincide with increasing and maximum abundance of nannoconids, whilst the high stand shows obvious decreasing trends even in these deep-water settings. This curve pattern is not related to differences in lithology as samples have been selected regularly in the marly interval of the marl-limestone alternations.
Acknowledgments
We greatly thank all the members of the “Vocontian Trough working group”, particularly Roger Jan Du Chêne for greatly improving the quality of the manuscript with helpful criticisms.
This work was dramatically marked by the sudden death of Hélène Manivit, in November 1991, which left an empty space in our group. We will always keep a good memory of Hélène and her love for scientific research.

BCREDP (17) 1993 VOCONTIAN TROUGH : UPPER TITHONIAN AND BERRIASIAN CALCAREOUS NANNOFOSSILS 289
6 REFERENCES
Bralower, T.J. (1986). — Valanginian to Aptian calcareous nannofossil stratigraphy and correlation with the M-se- quence magnetic anomalies. — Marine Micropal., 11, 293-310.
Bralower, T.J., Monechi, S. & Thierstein, H.R. (1989). — Calcareous nannofossil zonation of the Jurassic — Cretaceous boundary interval and correlation with the geomagnetic polarity timescale. — Marine Micropal., 14, 153-235.
Busnardo, R., Le Hégarat, G. & Magne, J. (1965). — Le stratotype du Berriasien. — Bur. Rech. géol. min., Mém. 34, 5-33.
Cecca, F., Enay, R. & Le Hégarat, G. (1989). — L’Ardescien (Tithonique supérieur) de la région stratotypique : séries de référence et faunes (ammonites, calpionelles) de la bordure ardéchoise. — Doc. Lab. Géol. Lyon, 107, 1-115.
Cooper, M.K.E. (1984). — Nannofossils accross the Jurassic/Cretaceous boundary in the Tethyan realm. — Bull, geol. Soc. Denmark, 33, 430-443.
Deconinck, J.-F. (1993). — Clay mineralogy of the Upper Tithonian-Berriasian deep-sea carbonates of the Vocontian Trough (SE France) : Relationships with sequence stratigraphy. — Bull. Centres Rech. Explor.- Prod. Elf Aquitaine, 17, 1, 223-234.
Dromart, G., Ferry, S. & Atrops, F. (in press). — Removal of deep-water carbonates and relative sea-level changes : the Upper Jurassic-Lowermost Cretaceous of South-East France. — IAS Special publication.
Emmanuel, L. & Renard, M. (1993) — Carbonate geochemistry of the Upper Tithonian-Berriasian pelagic limestones of the Vocontian Trough (SE France). — Bull. Centres Rech. Expior.-Prod. Elf Aquitaine, 17, 1, 205-221.
Galbrun, B., Rasplus, L. & Le Hégarat, G. (1986). — Données nouvelles sur le stratotype du Berriasien : corrélations entre magnétostratigraphie et biostratigraphie. — Bull. Soc. géol. France, (8), 2, 575-584.
Gorin, G. & Steffen, D. (1991). — Organic facies as a tool for recording eustatic variations in marine fine-grained carbonates — example of the Berriasian stratotype at Berrias (Ardèche, France).— Paleogeogr., Palaeoclima- tol., Palaeoecol., 85, 303-320.
Jan Du Chêne, R., Busnardo, R., Charollais, J., Clavel, B.,
Deconinck, J.F., Emmanuel, L., Gardin, S., Gorin, G., Ma-
nivit, H., Monteil, E., Raynaud, J.F., Renard, M., Steffen,
D., Strasser, A., Strohmenger, C. & Vail, RR. (1993). — Sequence stratigraphy interpretation of upper Tithonian- Berriasian reference sections in South-East France : a multidisciplinary approach. — Bull. Centres Rech. Explor.-Prod. Elf Aquitaine, 17, 1, 151-181.
Le Hégarat, G. (1973). — Le Berriasien du Sud-Est de la France. — Doc. Lab. Géol. Fac. Sci. Lyon, 43, 575 p.
Le Hégarat, G. (1980). — Le Berriasien. — In : Cavelier, C. & Roger, J. (Coord.), Les étages français et leur stratotype. — Bur. Rech. géol. min., Mém. 109, 65-105.
Le Hégarat, G. & Remane, J. (1968). — Tithonique supérieur et Berriasien de l’Ardèche et de l'Hérault. Corrélation des ammonites et des calpionelles. — Geobios, 1, 7-70.
Le Hégarat, G. & Ferry, S. (1990). — Le Berriasian d’Angles.— Geobios, 23/3, 369-373.
Médioni, R., (coord.) et al., (1984) — Berriasien - Valangi- nien. — In : Debrand Passard, S. et al. (eds.) : Synthèse géologique du Sud-Est de la France. — Bur. Rech. géol. min., Mém. 126, Ci 2.
Monteil, E. (1992). — Kystes de dinoflagellés index (Titho- nique-Valanginien) du sud-est de la France. Proposition d’une nouvelle zonation palynologique — Rev. Paléobiologie, (Genève), 11, 1 299-306.
Monteil, E. (1993). — Some important Upper Tithonian and Berriasian dinoflagellate cysts of SE France : Integrated biostratigraphy and sequence stratigraphy. — Bull. Centres Rech. Explor.-Prod. Elf Aquitaine, 17, 1, 249-273.
Ogg, J.G. (1983). — Magnetostratigraphy of Upper Jurassic and lowest Cretaceous sediments, Deep Sea Drilling Project, Site 534, Western North Atlantic. — In : R. E. She
ridan, F.M. Gradstein et al. : Initial Reports of the DSDP, 76, U.S. Government Printing Office, Washington, D. C., 685-696.
Ogg, J.G., Steiner, M.B., Oloriz, F. & Tavera, J.M. (1984). — Jurassic magnetostratigraphy I. Kimmeridgian-Titho- nian of Sierra Gorda and Carcabuey, Southern Spain. — Earth Planet. Sci. Lett., 71, 147-162.
Ogg, J.G., Hasenyager II, R.W. & Wimbledon, W.A. (in press). — Jurassic-Cretaceous boundary : Portland — Purbeck magnetostratigraphy and possible correlation to the Tethyan faunal realm. — Intern. Sympos. Jurassic stratigraphy, Poitiers, Sept. 91.
Perch-Nielsen, K. (1979). — Calcareous nannofossils from the Cretaceous between the North Sea and the Mediterranean. — Aspekte der Kreide Europas, IUGS, A, 223- 272.
Perch-Nielsen, K. (1985). — Mesozoic calcareous nannofossils. — In : Bolli, H.M. Saunders, I. & Perch-Nielsen, K. (eds.) : Plankton Stratigraphy, Cambridge University Press, Cambridge, 55-572.
Roth, P.H. (1978). — Cretaceous nannoplankton biostratigraphy and oceanography of the Northwestern Atlantic Ocean. — In : Benson, W.E., Sheridan R.E. et al. : Initial Reports of DSDP, 44, U. S. Government Printing Office, Washington D. C., 731-759.
Roth, P.H. (1983). — Jurassic and Lower Cretaceous calcareous nannofossils in the Western North Atlantic (Site 534) : biostratigraphy, preservation and some observation on biogeography and paleoceanography.-. In : Initial Reports of DSDP, 76, U. S. Government Printing Office, Washington D. C., 587-621.
Steffen, D. & Gorin, G. (1993). — Palynofacies of the Upper Tithonian-Berriasian deep-sea carbonates in the Vocontian Trough (SE France). — Bull. Centres Rech. Explor.-Prod. Elf Aquitaine, 17, 1, 235-247.
Strohmenger, C. & Strasser, A. (1993). — Eustatic controls on the depositional evolution of Upper Tithonian and Berriasian deep-water carbonates (Vocontian Trough, SE France). — Bull. Centres Rech. Explor.-Prod. Elf Aquitaine, 17, 1, 183-203.
Thierstein, H.R. (1971). — Tentative lower Cretaceous calcareous nannoplankton zonation. — Eel. Geol. Helv., 64, 459-488.
Thierstein, H.R. (1973). — Lower Cretaceous calcareous nannoplankton biostratigraphy. — Abh. Geol. Bunde- sanst., 29, 1-52.
Thierstein, H.R. (1976). — Mesozoic calcareous nannoplankton biostratigraphy of Marine sediments. — Marine Micro- pal., 1, 325-362.

OMNIPRÉSENCE DE COCCOLITHES DANS DES CALCAIRES LAGUNAIRES DU JURASSIQUE MOYEN ET SUPÉRIEUR DE FRANCE
OMNIPRESENCE OF COCCOLITHS IN MIDDLE-UPPER JURASSIC LAGOON AL LIMESTONES IN FRANCE
Georges BUSSON, Denise NOËL, Daniel CONTINI, Anne-Marie MANGIN Annie CORNÉE et Pierre HANTZPERGUE
BUSSON, G., NOËL, D„ CONTINI, D., MANGIN, A.-M., CORNÉE, A. & HANTZPERGUE, P. (1993), - Omniprésence de coccolithes dans des calcaires lagunaires du Jurassique moyen et supérieur de France. [Omnipresence of coccoiiths in Middle-Upper Jurassic lagoonal limestones in France]. - Bull. Centres Ftech. Explor.-Prod. Elf Aquitaine. 17, 1, 291-301, 3 fig., 1 pl., 1 tab.; Boussens, June 24, 1993. - ISSN : 0396-2687. CODEN : BCREDP.We emphasized in a former paper the genetic importance of coccoiiths in litho
graphie limestones s.s. sampled in Bavaria (Solnhofen area), the French Jura (Cerin) and South-East of France (Canjuers). Here we have studied numerous sublithographic, pure limestones from different, Middle and Upper Jurassic lagoons : 1) Batho- nian lagoon with the Comblanchian Formation sampled in the French Jura near Besançon (Calcaire de la Citadelle) and in Burgundy at Plombières-les-Dijon, Chaumont, and Buisson and Ladoix quarries, both near Ladoix-Serrigny; 2) Middle Oxfordian lagoon with the so-called Calcaire de Clerval sampled at Avrigney and Sainte Ylie near Dole; 3) Kimmeridgian (Upper part of Pterocerian) lagoonal deposit sampled at Audincourt (Jura); 4) Tithonian sublithographic limestone collected in Mas de Pégourdy quarry (Dordogne).
Besides the geological grounds, the lagoonal nature of these calcareous deposits is proved by on the one hand, a scanty marine fauna without normal and diversified assemblages, next to no benthic fauna and on the other hand, no lacustrine biota. Furthermore these deposits were generated in very shallow waters and drying phases can even be observed in the sequences.
In all the studied samples, the SEM examination shows that the only constitutive elements which can be identified are minute-sized, oligospecific and cuff-link shaped coccoiiths. Other fauna and flora are very scarce. Major diagenetic alteration occurs : the only remains of coccoiiths are the holes related to the central wall which links the distal and the proximal shields of the coccoiiths and the peculiar structure of the area surrounding the holes. The strong diagenesis effects explain both the hardness and the compactness of sublithographic and lithographic limestones.
Our interpretation of these deposits is not very different from the one we formerly proposed for lithographic limestones s.s. In lagoons where the supply of continent- derived organic debris was low and the waters less saline than normal marine waters, Coccolithophorids bloomed to such an extent that their coccoiiths could fill up the space resulting from subsidence. Abnormal salinities may have inhibited the other groups of the biota. Furthermore the coccolithic blooms may have played an antibiotic role as do the red tides in present-day marine environments or eutrophication in lacustrine environments. In Jurassic sediments where Coccolithophorids show anomalie features such as low diversity, minute-size, etc., they can no longer be considered as representative of the only true marine environment as it is unanimously admitted.Georges Busson, Denise Noël, Annie Cornée, Laboratoire de Géologie du Muséum,
43, rue Button, F-75005 Paris et U.R.A. 12 (CNRS) pour D. Noël; Daniel Contini, Laboratoire de Géologie Historique, Université de Besançon, Place Leclerc, F-25000 Besançon; Anne-Marie Mangin, Laboratoire de Stratigraphie, Université P et M. Curie, 4, Place Jussieu, F-75005 Paris; Pierre Hantzpergue, Laboratoire de Géologie Stratigraphique et Structurale, Université de Poitiers, 40, avenue du Recteur Pineau, F-86022 cedex. - September 8, 1992.
Key words: Limestone, Lagoonal sedimentation, Bathonian (Comblanchian), Oxfordian, Kimmeridgian, Tithonian, Coccoiiths, Diagenesis, Doubs, Jura, Côte-d’Or, Haute-Saône, Aquitaine basin.
0396-2687/93/0017-0291 $ 2.20 © 1993 elf aquitaine production, F-31360 Boussens

292 G. BUSSON, D. NOËL, D. CONTINI, A.-M. MANGIN, A, CORNÉE ET P. HANTZPERGUE BCREDP 17 (1993)
RÉSUMÉ
A la suite de la découverte de l’importance des coccolithes dans des calcaires lithographiques sensu stricto (Bavière, Cerin, Can- juers), nous avons examiné de nombreux calcaires fins sublithographiques, très purs, en provenance de lagons du Jurassique moyen et supérieur : 1) le lagon bathonien avec le Comblanchien échantillonné dans le Jura près de Besançon (Calcaire de la Citadelle) et en Bourgogne à Plombières-les-Dijon, Chaumont, dans les carrières de Buisson et Ladoix, près de Ladoix-Serrigny; 2) le lagon de l'Oxfordien moyen avec les Calcaires de Clerval échantillonnés à Avrigney et Sainte Ylie près de Dole; 3) les dépôts lagunaires du Kimméridgien (partie supérieure du Ptérocérien) prélevés à Audincourt (Jura); 4) le calcaire sublithographique tithonien de la carrière du Mas de Pégourdy (Dordogne).
En plus des arguments géologiques, le caractère lagunaire de ces dépôts calcaires est attesté par la grande pauvreté de la faune marine qui ne présente jamais d'associations normales et diversifiées, la quasi-absence de la faune benthique et d’un autre côté l’absence d'associations lacustres. En outre, ces dépôts se sont faits sous très faible tranche d’eau et des assèchements peuvent même être repérés dans la succession.
Au MEB, dans tous les cas examinés, la fraction identifiable est faite de coccolithes peu diversifiés, à morphologie en « boutons de manchette » et de petite taille. La faune et la flore associées sont très rares. Les altérations diagénétiques sont très poussées : les coccolithes ne sont en général plus identifiables que par les trous correspondant au canal axial et par la morphologie de l’aire périphérique à ce trou. Cette diagenèse poussée rend compte de la dureté et de la compacité de ces calcaires lithographiques et sublithographiques.
L'interprétation que nous donnons à ces dépôts ne diffère pas fondamentalement de celle que nous avons proposée pour les calcaires lithographiques s.s. : dans des lagunes très protégées des apports détritiques et vraisemblablement dans des eaux plus ou moins dessalées, des floraisons de Coccolithophoridées ont proliféré au point de remplir l'espace offert par la subsidence, jusqu’à la cote 0. Les salinités anormales devaient inhiber les autres formes de vie. En outre ces floraisons ont pu jouer un rôle antibiotique, comme le font les eaux rouges en milieu marin ou des phénomènes d'eutrophisation en milieu lacustre. Au Jurassique, lorsque les populations de Coccolithophoridées présentent les anomalies évoquées ci-dessus (faible diversification, nanisme, etc.) elles ne sont plus caractéristiques du seul environnement marin franc comme cela est pourtant encore généralement admis.Mots-clefs ; Calcaire, Sédimentation lagunaire, Bathonien (Com
blanchien), Oxfordien, Kimméridgien, Tithonique, Flore coccolithes, Diagenèse, Doubs, Jura département, Côte-d’Or, Haute-Saône, Bassin aquitain.
TABLE DES MATIÈRES — CONTENTS
INTRODUCTION.......................................................................... 2921. - FORMATIONS EXAMINÉES - THE OBSERVED FORMA
TIONS.................................................................................... 2921.1. La formation du Comblanchien (Bathonien) -
Comblanchian (Bathonian) formation...................... 2921.2. L'Oxfordien moyen - Middle Oxfordian.................. 2951.3. Le Kimméridgien - Kimmeridgian............................ 2971.4. Le Tithonien de la vallée du Lot - Tithonian of the
Lot Valley.................................................................... 2972. - INTERPRÉTATION ET DISCUSSION - INTERPRETATION
AND DISCUSSION.............................................................. 2972.1. Le contexte lagunaire - The lagoonal setting....... 2972.2. Les observations microscopiques - Sem obser
vations.......................................................................... 2982.3. Interprétation - Interpretation................................... 298
3. - CONCLUSION.................................................................... 2984. - RÉFÉRENCES..................................................................... 299
INTRODUCTION
Dans une précédente note (Noël et al., 1991), nous avons déjà étudié l’ultrastructure de très nombreux calcaires marins du Jurassique moyen-supérieur. Les calcaires << propres » - c’est-à-dire à faible ou très faible teneur en argile- du Dogger et du Malm, de dépôts franchement pélagiques, s’avèrent constitués primordialement de coccolithes. Ces derniers sont caractérisés par des populations de très petite taille (3 à 5 p.m), très peu diversifiées et correspondant à des formes en « boutons de manchette ». En outre, dans ces calcaires, ces coccolithes sont souvent affectés d’altérations diagénétiques très poussées. Cette circonstance s’ajoutant à la très petite taille de ces nannolithes explique que l’on ait mis si longtemps à élucider la constitution intime de ces calcaires et à prendre conscience de l’importance de ces organismes.
Dans une autre étude (Busson et al., 1992) nous avons abordé l’étude des calcaires lithographiques sensu stricto- c’est-à-dire qui sont aptes à une utilisation dans la technique lithographique en imprimerie. Avant nos études, ces calcaires ont pu être interprétés comme le résultat d’une calcitisation due à des Cyanophycées (Keupp, 1977, pour les dépôts de Solnhofen) ou comme un dépôt de carbonates détritiques fins (Bernier, 1984 et Barale et al., 1985, pour les Calcaires de Cerin). Nous avons pu montrer que le même type de coccolithes (nains, peu diversifiés, en « boutons de manchette») a contribué très largement à la constitution de ces « pierres lithographiques ». On sait que ces calcaires (Bavière, Cerin, Canjuers) représentent le remplissage de lagunes, situées sur des plates-formes carbonatées, parfois à proximité de terres émergées, qui ont fourni la faune et la flore terrestres souvent abondantes dans ces dépôts.
Il était donc important d’examiner d’autres dépôts de calcaires jurassiques, couvrant une période plus étendue - du Dogger au Tithonique - mais ayant tous pour caractéristique de s’être déposés dans des lagons ou dans des conditions « intertidales supérieures à supratidales » pour connaître leur ultrastructure. En fait, il s'agissait de savoir, sur des cas beaucoup plus nombreux que les seuls calcaires lithographiques sensu stricto, si les coccolithes pouvaient être le contributeur principal de ces dépôts de lagunes alors que ce groupe d’Algues calcaires est classiquement considéré comme d’écologie marine.
1 FORMATIONS EXAMINÉES
1.1. LA FORMATION DU COMBLANCHIEN (BATHONIEN)
Le Bathonien du sud-est du Bassin de Paris (Fig. 1 et Tabl. I), et particulièrement la formation du Comblanchien (Fig. 2), ont fait l’objet de travaux importants parmi lesquels on peut citer : Purser, 1975; Contini, 1979; Girardin, 1982; Rat, 1991. Cette formation fait suite aux dépôts oolithiques, de vaste extension, de la partie supérieure du Bajocien et la partie inférieure du Bathonien. Elle s’est développée sur tout le Jura bisontin, la Haute-Saône, la Haute-Marne et la

BCREDP 17 (1993) COCCOLITHES DES CALCAIRES LAGUNAIRES DU JURASSIQUE (FRANCE) 293
Figure 1
Localisation géographique des échantillons étudiés. Location ot the areas studied.
Bourgogne. Purser (1975) évoque ce lagon comblanchien qui s’est « développé d’abord dans le Jura (Calcaire de la Citadelle) et probablement dans les Vosges (Calcaire compact de Neufchâteau), près de l’axe de la ride-mère, puis s’est ultérieurement étendu vers l'ouest suivant la progression de la barrière protectrice de sable oolithique, à travers la Bourgogne et la partie centrale du Bassin de Paris». Rat (1991), synthétisant des travaux antérieurs, interprète ce faciès comme un « dépôt de mer très peu pro
fonde ayant évolué dans la zone de balancement des marées (zone intertidale), étant parfois même resté exposé au-dessus du niveau des hautes mers (zone supratidale). Ce contexte géologique indique une mer chaude, favorable à la vie des organismes benthiques et à la précipitation physico-chimique ou biochimique du carbonate de calcium ».
L’ensemble des auteurs a insisté sur la quasi-absence d’éléments terrigènes et la très grande rareté des fossiles ou débris bioclastiques. Il en résulte, d’après Feuillée & Rat (1973), un calcaire d’une grande pureté, avec une lithifica- tion uniforme, « d’aspect extérieur homogène, lisse (« sublithographique ») ». Rat (1991) en décrit les caractéristiques pétrophysiques : calcaires compacts, denses (2,66), à porosité faible (0,2 à 0,9 %), très durs.
Rat (1991) précise que pour les géologues, le Comblanchien représente l’ensemble compris entre « l’Oolithe Blanche» (cf. Purser, 1975, p. 109) dessous et le Calcaire de Corton au-dessus, d’une grande variabilité de faciès. Au contraire, pour les carriers, le Comblanchien désigne un banc précis d’environ 6 m d'épaisseur de calcaire très fin, localisé à la partie inférieure de la formation. Il est évident que les échantillons que nous avons étudiés proviennent plutôt de bancs de calcaires très fins - rappelant le Comblanchien des carriers - que des faciès plus hétérogènes (oolithiques, graveleux, bioclastiques, etc.).
Les échantillons étudiés proviennent de 5 sites.Dans le Jura, un échantillon (776, PI. 1, fig. 1) a été
prélevé au sommet des Calcaires de la Citadelle (Besançon). Ces couches du Bathonien supérieur consistent en calcaire compact, massif, le plus souvent sublithographique, où les fossiles sont peu diversifiés : quelques Foraminifères dont Meyendorffina bathonica et une Rhynchonelle Rh. de- corata (Dreyfuss & Kuntz, 1967). En lame mince, la texture est hétérogène : les deux tiers de la surface sont un mudstone, l’autre tiers a une texture grainstone composée de nombreux Foraminifères (Trocholines, Miliolidés en particulier) et de fausses oolithes au sens de Lucas (1942, p. 228). Il faut noter que ces fausses oolithes se trouvent également dans la partie mudstone.
TABLEAU ILocalisation géologique et stratigraphique des échantillons et données sur leur contexte géologique. Geological and stratigraphical location of the studied samples and data on their geological context.
LIEUFEUILLE MILIEU D’APRES REFERENCES50 000° FORMATION AGE FLORE ET FAUNE COMPAGNES LES AUTEURS SUR CONTEXTE
GEOLOGIQUE
BESANÇON BESANÇON Sommet des calcaires Bathonien sup. Forams benthiques . 7 sp. Rhynchonelle \ Dreytus et Kuntz, 1967
CARRIÈRE des PORRETS BEAUNE Comblanchien Bathonien 10% éléments figurés: Globochaete, MiliolesGirardin, 1982Feuillée et Rat, 1973
débris d'échinod et lamellibranches MilieuPLOMBIÈRES LES DIJON GEVREY- Base Comblanchien Bathonien 3% éléments fig.. Globochaete, forams, intertidal Floquet et al., 1991
CHAMBERTIN Ostracodes; débris d'échinod et lamellibranches aN19-CHAUM0NT CHAUMONT Base Comblanchien Bathonien 2-3% éléments fig.: Globochaete. Algues Forams Ostracodes; débris d'échinod, lamellibranches
supratidalFloquef et al, 1991
CARRIERE DU BUISSON(LADOIX SERRIGNY)
BEAUNE Comblanchien Bathonien Forams agglutinés; débris d'échinodermes Feuillée et Rat, 1973
LADOIX BEAUNE Sommet Comblanchien Bathonien Forams benthiques Floquet et al., 1991
AVRIGNEY (près Dole) BESANÇON Calcaires deClerval Oxfordien Pas d'éléments figurés Lagunaire, peu profond Enoy et al., 1988moyen avec tendance confinement
ST-YLIE (près Dole) DOLE Calcaires de Clerval Oxfordienmoyen
Pas d'éléments figurés Emersion périodique Enay et al., 1988
AUDINCOURT (Jura)
MAS de PEGOURDY(PRES CRESSAC)
MONTBELLIARD Calcaires à Corbis Kimméridgien Pas d'éléments figurés Peu profond Chevalier 1989Contini et Hantzpergue, 1973
CAHORS Formation Casa! Tithonien Pas d'éléments figurés Milieu intertidal inf. à sup.
Hantzperque etLafaurie, 1991

ETAG
E
294 G. BUSSON, D. NOËL, D. CONTINI, A.-M. MANGIN, A. CORNÉE ET P. HANTZPERGUE BCREDP 17 (1993)
3 61 ^2

BCREDP 17 (1993) COCCOLITHES DES CALCAIRES LAGUNAIRES DU JURASSIQUE (FRANCE) 295
Les Calcaires de la Citadelle débutent souvent par un petit banc marneux à gyrogonites de Characées et sont formés par une succession de séquences de « tidal-flats » ou de plages (Girardin,1982).
Les quatre autres échantillons proviennent de Bourgogne. Un échantillon (703, PI. 1, fig. 9 in Noël et al, 1991) a été récolté dans la carrière des Porrets, près de Nuits- Saint-Georges (Côte-d’Or) : calcaire compact, en bancs de 20 cm d’épaisseur, de couleur claire, pratiquement dépourvu d’éléments bioclastiques et d’âge Bathonien inférieur. En lame mince, c’est un calcaire grumeleux ou wackstone (micrite 4 à 10 pm), avec 10 % d’éléments figurés : des Glo- bochaete assez abondants, des Milioles et débris d’Echi- nodermes, de Lamellibranches, et des fantômes d’oolithes.
L’échantillon 718 (PI. 1, fig 2) provient de la base du Comblanchien, à Plombières-les-Dijon. Il a été prélevé dans le premier banc (3 m d’épaisseur) de calcaire comblanchien surmontant «l’Oolithe Blanche». En lame mince, c’est une micrite (mudstone) avec 3 % d’éléments figurés représentés par des Globochaete, des Foraminifères, Ostracodes, Echi- nodermes, Lamellibranches.
L’échantillon 720 (PI. 1, fig 3) a été pris à Chaumont sur la nationale 19, au sud de Chamarandes, dans un banc calcaire (1 m) situé à la base du Comblanchien, quelques dizaines de centimètres au-dessus du contact avec «l’Oolithe Blanche». C’est un calcaire à patine blanchâtre, à cassure gris-beige. En lame mince, c’est un mudstone (3-4 pm) avec seulement 2 à 3 % d'éléments figurés parmi lesquels des Globochaete, Algues, Foraminifères, Ostracodes, débris d’Echinodermes et de Lamellibranches.
L'échantillon 701 a été prélevé dans la carrière du Buisson (Ladoix-Serrigny, Côte-d’Or). Ces calcaires rosés à crème en gros bancs massifs, très purs (moins de 1 % de résidu insoluble, cf. Feuillée & Rat, 1973), sont datés du Bathonien supérieur. L’échantillon est un packstone avec nombreux Foraminifères agglutinés, débris d’Echinodermes et fausses oolithes.
L’échantillon 719 (PI. 1, fig 4) se localise au sommet du Comblanchien dans la carrière de Ladoix sur la commune de Ladoix-Serrigny (Floquet et al., 1991, page 31). Dans cette carrière, où l’abondance des « beachrocks » témoigne de conditions de sédimentation très peu profondes, le banc calcaire échantillonné est à cassure très blanche, à pâte fine et pratiquement sans éléments figurés. En lame mince, c’est un packstone à Foraminifères très abondants et fausses oolithes (cf. ci-dessus).
L’observation au MEB de cassures fraîches de ces calcaires a montré qu’ils renfermaient tous des coccolithes. Ces derniers, comme ceux trouvés dans de nombreux calcaires du Jurassique moyen-supérieur (Noël et al., 1991), sont de petite taille (3-5 (im) et correspondent au type morphologique en «boutons de manchette». Leur état de conservation est médiocre, se situant le plus souvent entre les types 2 et 3 de notre échelle d’altération diagénétlque (Noël et al., 1991, Busson et al., 1992). Lorsque les nanno- lithes ont un contour arrondi, nous les avons rapprochés des Discorhabdus ou des Cyclagelosphaera; lorsqu’ils sont elliptiques, ils rappellent des Ellipsagelosphaera. Dans les champs observés, les coccolithes sont dispersés et irrégulièrement répartis. Dans l’ensemble, le nannofaciès de ces échantillons est nettement plus hétérogène que celui des calcaires lithographiques sensu stricto (Busson et al., 1992), plus hétérogène aussi que ceux de la plupart des calcaires oxfordiens-kimméridgiens pélagiques que nous avons étudiés et dont quelques-uns ont été illustrés (Noël et al., 1991). Evaluée au MEB, la porosité s’avère un peu plus élevée dans les deux échantillons prélevés à la base du Comblanchien que dans les deux en provenance du sommet.
1.2. L’OXFORDIEN MOYEN
Nous avons étudié deux échantillons provenant du sommet de la zone à Transversarium, l’un prélevé à Avrigney (777, PI. 1, fig. 5) (Haute-Saône - Feuille de Besançon -) et l’autre à Sainte-Ylie près de Dole (778, PI. 1, fig. 6) (Jura - Feuille de Dole -) : ils appartiennent à la formation des « Calcaires de Clerval » (Fig. 3) (Contini, 1989).
Enay et al. (1988) exposent que « au sommet de la zone à Transversarium, lorsque la « plate-forme rauracienne » atteint son développement maximal, apparaissent, dans sa partie interne, des faciès de milieux peu profonds et protégés, à débris et oncolites (...) et, vers la fin de l’Oxfordien moyen, s’installe un véritable lagon protégé, avec tendance au confinement ». Les deux échantillons sus-cités sont représentatifs d’un tel lagon. Les mêmes auteurs précisent que « les deux membres de la formation de Clerval renfermant de nombreux indices d’émersion (...) sont les témoins de la formation d’un lagon protégé à la fin de la première séquence oxfordienne, lagon très peu profond où s’accumulait une boue carbonatée fine qui arrivait à fleur d’eau et même affleurait par endroits pour former de petits îlots
Figure 2
Position stratigraphique des lagons du Jurassique moyen du Jura.A - Lagon du Bajocien moyen : localisé géographiquement dans le nord de la Franche-Comté dans le faisceau bisontin et dans les collines préjurassiennes. (N’a pas été étudié dans le présent travail); B - Lagon du Bathonien inférieur (Calcaires de Mailley) : il est limité au SE par le faisceau salinois, à l’ouest par une ligne reliant Dôle à Champlitte; au NE il disparaît vers Héricourt (N’a pas été étudié
dans le présent travail); C - Lagon du Bathonien moyen et supérieur (Calcaires de la Citadelle) : de superficie beaucoup plus vaste, il s’étend vers l’ouest et le nord-ouest en Bourgogne et dans la partie sud-est du Bassin de Paris.
Légende - 1 : Discontinuité; 2 : Lacune; 3 : Faciès de bassins (marnes, alternance calcaire-marne); 4 : Biohermes à Spongiaires; 5 ;Plate-forme carbonatée peu profonde; 6 : Lagon.
Stratigraphie position of Middle Jurassic lagoons in the French Jura.A - Middle Bajocian lagoon located in the North of Franche-Comté in the « faisceau bisontin » and in pre-Jurassian hills. (Not studied in
the present paper); B - Lower Bathonian lagoon (Calcaires de Mailley) : it is bounded in the South-East by the ■< faiseau salinois », in the West by a line connecting Dôle to Champlitte, and in the North-East it disappears towards Hericourt. (Not studied in the present paper); C - Middle and Upper Bathonian lagoon (Calcaires de la Citadelle) : larger than the previous ones it extends westwards and north
westwards in Burgundy and in the South-East part of the Paris Basin.Legend : 1 ; Discontinuity, 2 : Hiatus, 3 : Basinal facies (marls, alternation limestone/marl), 4 ; Sponge bioherms, 5 : Shallow carbonate
platform, 6 : Lagoon.

296 G. BUSSON, D. NOËL, D. CONTINI, A.-M. MANGIN, A. CORNÉE ET P. HANTZPERGUE BCREDP 17 (1993)
3 6
Figure 3
Position stratigraphique des lagons du Jurassique supérieur du Jura :A - Lagon de l’Oxfordien moyen : Calcaires de Clerval; B - Lagon de l'Oxfordien supérieur : Calcaires de Besançon; C - Lagon du Ptéro-
cérien : Tidalites d’Arc-sous-Cicon; D - Lagon du Kimméridgien supérieur : Calcaires en plaquettes, qui correspondent aux couches de Cerin, Orbagnoux, étudiées par ailleurs (Busson et al., 1992); E - Lagon du Portiandien (Non étudié ici).
Légende : identique à celle de la Figure 2.Stratigraphie position of Upper Jurassic lagoons in the French Jura.
A - Middle Oxfordian lagoon : Calcaires de Clerval; B - Upper Oxfordian lagoon : Calcaires de Besançon; C - Pterocerian lagoon : Tidalites of Arc-sous-Cicon; D - Upper Kimmeridgian lagoon : plate limestones which are coeval with Cerin and Orbagnoux deposits which
have already been studied (Busson et al., 1992); E - Portlandian lagoon (not studied here).Legend : as Figure 2.

BCREDP 17 (1993) COCCOLITHES DES CALCAIRES LAGUNAIRES DU JURASSIQUE (FRANCE) 297
sur lesquels se développaient des plantes et des animaux terrestres ». On déduira de ces deux citations que ces calcaires oxfordiens, d'aspect parfois qualifié de sublithographique (Dreyfuss & Kuntz, 1967), correspondent à des conditions de dépôts proches de celles qui ont été décrites pour des gisements tels que celui de Cerin (Barale et al., 1985; Busson et al., 1992) : un lagon très peu profond soumis à des émersions périodiques, avec des arrivées d’animaux et de végétaux terrestres.
En lame mince, l’échantillon d’Avrigney (777) se présente comme un mudstone (cristaux de la micrite 4 à 6 ^m), remarquablement dépourvu de bioclastes et n’offrant que quelques micro-quartz détritiques (30 |im). Au microscope électronique à balayage, les échantillons montrent tous deux des coccolithes de type diagénétique 2 et 3 dont la taille est de 5 à 7 jim de diamètre. On peut identifier des Ellip- sagelosphaera et, de façon plus dubitative, des Discorhab- dus. Dans les deux cas, le nannofaciès est homogène et la porosité relativement élevée. Quantifier sur des images au MEB cette porosité nécessiterait des techniques particulières, telles que remplissage des pores par une résine, sous vide, puis dissolution du calcaire. Ces études sortent du cadre du présent article.
1.3 LE KIMMÉRIDGIEN
Un échantillon (780, PI 1, fig 7), récolté à Audincourt (Jura - Feuille de Montbéliard -), a été étudié. Il provient de la partie supérieure du « Ptérocérien », étage classique dans ces régions, (de l’équivalent des « Tidalites d’Arc- sous-Cicon » (Chevallier, 1989) situées à la base de la zone à Acanthicum). D’un point de vue environnemental, Contini & Hantzpergue (1973) évoquent « la mer des calcaires à Cor- bis (...) très peu profonde et les apports terrigènes pratiquement nuis ». Par ailleurs, la faible profondeur d’eau est invoquée pour expliquer la variabilité rapide des faciès.
En lame mince, le calcaire se présente encore comme un mudstone, remarquablement dépourvu d’éléments figurés. Les rares quartz détritiques ne mesurent que 15 à 20 |j.m. Au MEB, la structure s’avère très finement homogène avec une porosité encore élevée (voir ci-dessus). Les coccolithes sont encore abondants quoique plus difficiles à discerner, l’état d'altération diagénétique habituel étant le type 3.
1.4. LE TITHONIEN DE LA VALLÉE DU LOT
Au Dogger, à l’Oxfordien et au Kimméridgien inférieur, la plate-forme carbonatée néritique se développe de façon extensive sur un vaste domaine couvrant une grande partie de l’Aquitaine et même du Massif Central (BRGM et al., 1974; Curnelle & Dubois, 1986). Ensuite au Kimméridgien supérieur et au Tithonien, le comblement du bassin occidental permet une progression vers l’ouest de la plate-forme carbonatée jusqu’au méridien de Bordeaux. Dès lors, trois aires paléogéographiques se distinguent dans le « golfe Charentais ». L’aire occidentale est marine à passées argileuses. La zone centrale, plus ou moins méridienne, de Cognac à Angoulême, est caractérisée par les faciès de régression marine du Purbeckien : anhydrite, marnes à gypse; carbonates peu profonds, etc. La zone la plus interne, en amont même des évaporites, est faite de calcaires souvent laminés, localement lithographiques, s’étendant jusque dans le Quercy.
Hantzpergue & Lafaurie (1992) ont évoqué, dans cette « extrémité orientale du golfe Charentais... une sédimentation sublittorale marquée, dans la région de Cahors (Lot), par le dépôt rythmique de calcaires lithographiques...». Dans ce Tithonien quercynois (ibid), « la régression fini- Jurassique s’exprime par une suite de séquences d’accré- tion dont l’évolution virtuelle débute par des calcaires à Céphalopodes et s'achève par un faciès lithographique, de plus en plus laminé, avec de nombreuses figures sédimen- taires (rides, fentes de dessication, impacts de gouttes de pluie...) et des traces d’activité biologique (pistes de Reptiles) ».
Le banc étudié (Ech. 764; PI. 1, fig. 8) provient de la carrière du Mas de Pégourdy, près de Cressac en Dordogne (feuille 50 000 de Cahors); il se situe stratigraphiquement à la partie supérieure de la formation Casai (Hantzpergue &
Lafaurie, 1992). A ce niveau l’environnement de dépôt correspond à un milieu intertidal inférieur à supérieur. La formation dans laquelle l’échantillon a été prélevé consiste en calcaires fins, lithographiques, en bancs réguliers, avec intercalations lumachelliques de Corbules. Le banc lui- même correspond à une micrite sans fossile visible sur le terrain et pratiquement sans bioclastes en lame mince. Notre échantillon (764) est un mudstone (4 à 7 |im) totalement dépourvu d’éléments figurés à l’exception de quelques débris probables de Lamellibranches recristallisés. Au MEB, le calcaire présente un nannofaciès homogène, avec une porosité régulièrement répartie. Le calcaire renferme d’assez abondants nannolithes à contour elliptique, de 5 à 6 |im dans leur plus grande dimension. Nous les avons rapportés à des coccolithes (Ellipsagelosphaera et peut-être Biscutum) au stade diagénétique 2-3. On note aussi la présence de grains d’allure rhomboédrique, inférieurs à 1 (im.
2 — INTERPRÉTATION ET DISCUSSION
2.1 LE CONTEXTE LAGUNAIRE
Les calcaires que nous venons d’étudier ont en commun une texture très fine, compacte, dense. Ils sont très purs, dépourvus d’apports terrigènes, même argileux. Sur la foi d’études régionales - évoquées au fil de ce texte - ils ont été qualifiés de dépôts de lagons, de dépôts de milieu intertidal supérieur à supratidal; bref on a pu les qualifier globalement de lagunaires, malgré un certain discrédit qui s’attache à ce terme, jugé trop vague par les uns et employé indûment dans une acception trop étroite par les autres.
Ces dépôts, en effet, cantonnés à des plates-formes, ont souvent été enfermés dans des barrières oolithiques auxquelles ils passent latéralement; dans d’autres cas, ils se biseautent sur les bordures témoignant d’une sédimentation en cuvette quasiment fermée. Dans de nombreux cas, on a la preuve de dépôts opérés sous très faible tranche d’eau (exemple : traces de pas de Vertébrés) ou même d’assèchements qui parfois ponctuent la succession.
Les arguments paléobiologiques viennent à l’appui d’une telle interprétation « lagunaire ». Ces calcaires en effet ne présentent jamais de faune et de flore marines - en particulier benthiques -, riches et diversifiées. Dans ces lagons, les couches fossilifères sont rares et, dans un niveau donné, les populations sont pratiquement monospécifiques. Ainsi, au Bathonien, le niveau à Rh. decorata est riche en individus

298 G. BUSSON, D. NOËL, D. CONTINI, A.-M, MANGIN, A. CORNÉE ET P. HANTZPERGUE BCREDP 17 (1993)
et très étendu géographiquement; à l'Oxfordien moyen on y trouve une espèce de Térébratule à crochet allongé : Juralina bauhini; à l'Oxfordien supérieur, Zeilleria astartina.Il faut également signaler dans certains bancs la présence de nombreux terriers et pistes.
Les calcaires des aires franchement pélagiques (Chaînes Subalpines, Tunisie septentrionale, etc.) du Jurassique moyen-supérieur se présentent souvent comme des mudstones assez pauvres, mais certains bancs cependant contiennent des Ammonites et très souvent au moins un faible pourcentage volumétrique de Radiolaires, Protoglobigé- rines, et à certains niveaux des Saccocoma, etc. Ici au contraire, les restes marins se limitent à de rares Foramini- fères, Globochaete, débris d’Echinodermes, etc. Quelques indices de dessalure (Characées) existent également (Tintant & Feuillée, 1973). Ces calcaires ne présentent jamais non plus un bios lacustre typique. Dans quelques sites, existent des organismes franchement terrestres, vertébrés, végétaux qui ne font que témoigner de la proximité de terres émergées. Il s'agit donc bien de milieux intermédiaires auxquels convient l'appellation de lagunaires.
2.2. LES OBSERVATIONS MICROSCOPIQUES
Au MEB, la nanostructure de ces calcaires apparaît remarquablement homogène. Rappelons d’abord que les calcaires sélectionnés pour notre étude ne l’ont été que sur un critère : provenir de séries de lagon et se présenter comme des calcaires fins à l’examen visuel. Or, dans tous les cas, la fraction identifiable s’est révélée faite de cocco- lithes abondants. Aucun autre organisme ne nous est apparu; ce qui n’a rien d’étonnant, l’examen des lames minces attestant l’insignifiance volumétrique des autres débris qui « flottent » dans la matrice. Ici encore les populations de coccolithes s’avèrent de petite taille et de morphologie en «boutons de manchette». Les altérations diagénétiques sont très poussées, de type 3. Les coccolithes ne sont identifiables le plus souvent que par le trou correspondant au canal axial et la morphologie de son aire périphérique.
Une telle ultra-structure rend compte des caractères pétrographiques. L’homogénéité des populations de coccolithes, la quasi-absence de faune ou flore associées et de détritiques expliquent l’extrême finesse et l’extrême homogénéité du grain. L'importance des altérations diagénétiques rend compte quant à elle de la compacité et de la dureté de ces calcaires.
Par rapport aux calcaires pélagiques du même âge (Jurassique moyen-supérieur, cf. Noël et al., 1991), on note donc une nette amplification, une aggravation des caractères habituels : l’exclusion du bios marin est plus complète et si les populations de coccolithes apparaissent peu différentes, par contre l’altération diagénétique semble être allée plus loin dans ces milieux lagunaires.
2.3. INTERPRÉTATION
Les analogies de composition nannofloristique, d’exclusion biologique, de diagenèse sont évidentes avec les calcaires lithographiques sensu stricto. Il en est de même de la conservation des restes de Vertébrés parfois signalés dans ces formations de lagons. Les interprétations proposées ici ne sauraient donc différer profondément de celles avancées pour les calcaires lithographiques sensu stricto
(Busson et al., 1992). L’hypothèse maintes fois proposée d’une stratification des eaux dans ces milieux, qui aurait entraîné une anoxie de fond, ne nous paraît pas convenir. Les sédiments ne présentent pas la lamination plan parallèle très fine qui est la caractéristique des dépôts méromicti- ques. Le jeu d’une hypersalinité ne nous paraît pas non plus vraisemblable. Les floraisons de populations anomali- ques de coccolithes ayant construit ces calcaires se sont épanouies dans des eaux différant nettement de l’eau de mer normale; très vraisemblablement du fait d’une dessalure plus ou moins poussée. Elles se sont développées dans des eaux peu profondes mais surtout exceptionnellement calmes, l’agitation du milieu n’étant pas propice aux Coc- colithophoridées. Ces floraisons mériteraient d’être comparées aux phénomènes résultant d’eutrophisation en milieu lacustre ou aux phénomènes d’eaux rouges souvent observés en milieu marin. Au delà, il est difficile de savoir si l’exclusion de la plupart des autres formes de vie marines n’est imputable qu’à cette salinité anormale; ou - comme l’hypothèse nous en paraît plausible - si ces floraisons (ou leurs excrétions chimiques ou biochimiques) ont contribué à éliminer la quasi-totalité des autres formes de vie.
3 CONCLUSION
A plusieurs niveaux du Jurassique moyen-supérieur, nous avons examiné la sédimentation de lagon, faite de calcaires très purs, parfois déposés sous très faible tranche d’eau ou à la limite de l’émersion. Dans chacun des cas étudiés, nous avons constaté que des floraisons de coccolithes de petite taille, très peu diversifiés et à morphologie en « boutons de manchette» avaient réalisé l’essentiel de la construction calcitique. Ces floraisons, très oligospécifiques, très anomaliques s'expliqueraient par un milieu relativement dessalé. Les qualités de l’eau et peut-être les floraisons elles-mêmes se sont ajoutées pour éliminer la plupart des autres organismes pélagiques et la quasi-totalité des organismes benthiques. En outre, dans ces conditions de milieu, les altérations diagénétiques des nannolithes ont été particulièrement poussées à l’instar de ce qui a été observé dans les calcaires lithographiques sensu stricto (Busson et al., 1992).
Bref, les floraisons responsables de ces sédiments rappellent beaucoup celles observées dans les calcaires pélagiques francs de même âge (Noël et al., 1991) mais avec une exclusion plus complète des autres organismes et avec une diagenèse plus régulièrement forte.
L’aube du Jurassique moyen est marquée par une coïncidence remarquable. Dans l’évolution du groupe des Coc- colithophoridées, on note l’apparition et le début de l’épanouissement des placolithes (Ellipsagelosphaera, Cyclagelosphaera) approximativement au passage Aalé- nien-Bajocien. La même époque correspond à la grande transgression des plates-formes calcaires tant sur les aires antérieurement sédimentaires que sur les massifs auparavant émergés. Ces nouvelles formes de coccolithes ont formé pour la première fois dans l’histoire de la Terre les calcaires purs des aires les plus profondes (Noël & Busson, 1990; Noël et al., 1991). Mais ils ont aussi envahi une partie des plates-formes et nous démontrons enfin, ici, qu’ils sont omniprésents dans les lagons, qui ont soit couvert de vastes parties de ces plates-formes (Comblanchien) soit se sont simplement trouvés dispersés à leur surface. Cette contri

BCREDP 17 (1993) COCCOLITHES DES CALCAIRES LAGUNAIRES DU JURASSIQUE (FRANCE) 299
bution d’organismes pélagiques était inattendue dans ces milieux. Notons cependant qu’il s’agit toujours de floraisons de populations anomaliques. Les populations de taille et de diversification normales gardent bien entendu leur valeur de marqueur du milieu pélagique franc.
Remerciements
Les crédits qui ont permis cette étude provenaient du c.n.r.s. (u.r.a. 12 et s.d.i. 189), du Muséum National d'Histoire Naturelle (b.q.r. 91 n°7) et de Naturalia et Biologia.
Le MEB du Laboratoire de Géologie du Muséum a eu dans cette étude une importance déterminante. Les lames minces ont été éxécutées à l’Institut de Paléontologie du Muséum (u.r.a. 12, c.n.r.s). Certains échantillons ont été récoltés par l’un de nous (a.c.) lors de l’excursion de l’Association des Sédimentologistes Français sur les séries carbonatées du Bathonien à l’Oxfordien de Bourgogne (27- 29 juin 1991).
Au laboratoire, nous devons remercier tous ceux qui ont participé à notre travail. En premier lieu, A. Roure - vacataire - collaboratrice extrêmement active et dont l’aide a été précieuse dans les recherches documentaires, dans la préparation des échantillons et des banques de données, dans la mise au point du manuscrit, de la bibliographie, etc.. P. Clément et M. Tamby assurent la maintenance du microscope électronique. M. Lemoine a réalisé toutes les lames minces utilisées dans cette étude. A.-M. Brunet a réalisé des calcimétries. N. Day a participé aux recherches documentaires et à la mise au point de la bibliographie. M. Destarac a eu la charge de tous les travaux photographiques, tant à l’aval du MEB que pour l’illustration des publications et des exposés. E. Cambreleng nous a aidés dans la confection de la planche et des figures. S. Guillon et M. Pallas ont contribué à la dactylographie du manuscrit. J. Sorant et M.-C. Laurent ont assuré d’innombrables lectures pour aider l’un de nous, atteint de cécité.
Nous remercions R. Curnelle, rédacteur de la revue, pour le temps qu’il a consacré à notre travail.
4 RÉFÉRENCES
Barale, G., Bernier, R, Bourseau, J.P, Buffetaut, E., Gaillard,
C., Gall, J.C. & Wenz, S. (1985). — Cerin, une lagune tropicale au temps des dinosaures. — Publ. cnrs/Mu-
séum de Lyon, 136 pp.Bernier, P. (1984). — Les formations carbonatées du Kim-
méridgien et du Portlandien dans le Jura méridional. Stratigraphie, Micropaléontologie, Sédimentologie. — Doc. Lab. Géol. Fac. Sci. Lyon, 92, 2, 804 pp.
brgm, elf-re, esso-rep. & snpa (1974). — Géologie du bassin d’Aquitaine. — Ed. BRGM, Paris, 27 pl.
Busson, G., Noël, D. & Cornée A. (1992). — Les coccolithes en « boutons de manchette » et la genèse des calcaires lithographiques du Jurassique supérieur. — Rev. Paléo- biol., Genève, 11, 1, 255-271.
Chevallier, Th. (1989). — Les formations carbonatées de la séquence ptérocérienne dans le Jura français et les régions voisines. — Thèse Univ. Claude Bernard Lyon, Cah. Institut Catholique Lyon, sér. Sci., 2, 194 pp. .
Contini, D. (1979). — Relations entre les bassins sédimen- taires Souabo-Lorrain et Jurassico-Dauphinois au Dog
ger. Naissance, évolution et disparition d’une plate-forme carbonatée. — In : Symposium « Sédimentation, Jurassique W Européen ». — Assoc. Sédim. Fr., Spéc. Publ. 1, 125-134.
Contini, D. (1989). — L’Oxfordien du Jura septentrional. Définition des formations. Evolution paléogéographique. — Ann. Scient. Univ. Franche-Comté, Géol., 4, 9, 3-6.
Contini, D. & Hantzpergue, P. (1973). — Le Kimméridgien de la région de Montbéliard. — Ann. Scient. Univ. Besançon, Géol., 3, 18, 143-179.
Curnelle, R. & Dubois, P. (1986). — Evolution mésozoïque des grands bassins sédimentaires français (bassins de Paris, d’Aquitaine et du Sud-Est). — Bull. Soc. géol. France, 2, 4, 529-546.
Dreyfuss, M. & Kuntz, G. (1967). — Carte géologique de la France au 50000e, Feuille Besançon. — Ed. BRGM.
Enay, R., Contini, D. & Boullier, A. (1988). — Le Séquanien- type de Franche-Comté (Oxfordien supérieur) : datations et corrélations nouvelles, conséquences sur la paléogéographie et l’évolution du Jura et régions voisines. — Eclo- gae. Geol. Helv., 81, 2, 295-363.
Feuillée, P. & Rat, P. (1973). — Les carrières de Comblan- chien. — Livret-Guide Excursions, Groupe Fr. Jurassique,8 pp.
Floquet, M., Javaux, C., Menot, J.C. & Purser, B.Fl. (1991). — Sédimentation, Diagenèse et Séquences de dépôt dans les séries carbonatées de plate-forme d’âge Bathonien à Oxfordien en Bourgogne. — Assoc. Sédim. Fr., Livret-Guide Excursions, 3-174.
Girardin, M. (1982). — Etude du Bathonien de Haute- Saône : stratigraphie, sédimentologie, paléogéographie et synthèse géotechnique. — Thèse Doct. 3ème cycle, Univ. Dijon, 128 pp.
Hantzpergue, P. & Lafaurie, G. (1992). — Les calcaires lithographiques du Tithonien Quercynois : stratigraphie, paléogéographie et contexte biosédimentaire. — Géobios— supplt. n° 1, Mém. spéc. 16, résumés, 26.
Keupp, H. (1977). — Ultrafazies und Genese der Solnhofener Plattenkalke (Obérer Maim südliche Frankenalb). — Abh. Naturhist. Ges. Nürnberg., 17, 128 pp.
Lucas, G. (1942). — Description géologique et pétrographi- que des Monts de Ghar-Rouban et du Sidi-el-Abed (frontière algéro-marocaine). — Bull. Serv. Carte géol. Algérie, (2), 16, 1-539.
Noël, D. & Busson, G. (1990). — L’importance des Schizo- sphères, Stomiosphères, Conusphaera et Nannoconus dans la genèse des Calcaires fins pélagiques du Jurassique et du Crétacé inférieur. — Bull. Sci. géol. (Strasbourg), 43, 1, 63-93.
Noël, D., Busson, G. & Cornée, A. (1991). — Les calcaires fins pélagiques du Jurassique moyen-supérieur sont essentiellement construits d’une nannoflore calcaire oligospécifique (coccolithes en « boutons de manchette »). —C. R. Acad. Sci., (Paris), (2), 313, 1455-1462.
Noël, D., Busson, G., Cornée, A., Bodeur, Y. & Mangin, A.M. (sous presse). — Contribution fondamentale des Cocco- lithophoridées à la constitution des calcaires fins pélagiques du Jurassique moyen et supérieur. — 3e Symp. Internat. Stratigr. Jurassique, Poitiers, 1991.
Purser, B.H. (1975). —Sédimentation et diagenèse précoce des séries carbonatées du Jurassique moyen de Bourgogne. — Thèse Doct. ès Sci., Univ. Paris-Sud, (dépôt Soc. géol. France), 383 pp.
Rat, P. (1991). — La pierre marbrière de Comblanchien (Côte-d'Or - France). — 115e Congr. Nat. Soc. sav., Avignon, 1990, Carrières et Constructions, C.T.H.S., 133-146.
Tintant, H. & Feuillée, P. (1973). — Stratigraphie et sédimentologie du Jurassique en Côte-d’Or. — Livret-Guide Excursion, Groupe Fr. Jurassique, Inst. Sc. Terre, Univ. Dijon, 1re partie, 54 pp.

300 G. BUSSON, D. NOËL, D. CONTINI, A.-M. MANGIN, A. CORNÉE ET P, HANTZPERGUE BCREDP 17 (1993)
PLANCHEPLATE 1
Fig. 1. —Bathonien supérieur - Besançon (Ech. n° 776).Upper Bathonian - Besançon (Sample No. 776).
2 —Comblanchien - Plombières-les-Dijon (Ech. n° 718).Comblanchian - Plombières-les-Dijon (Sample No. 718).
3 —Comblanchien - N19 au sud de Chaumont (Ech. n° 720).Comblanchian - N19 South of Chaumont (Sample No. 720).
4 —Sommet du Comblanchien - Carrière Ladoix (Ech. n° 719).Top of Comblanchian - Ladoix quarry (Sample No. 719).Tous ces échantillons se caractérisent par un nannofaciès identique : nombreux nannolithes à contour arrondi, avec une perforation centrale que nous avons rapportés à des coccolithes au stade diagénétique 3.AU the samples are characterized by the same nannofacies : numerous round nannoliths that we consider as coccoliths in the diagenetic stage 3.
5 —Sommet Oxfordien moyen - Auvrigney (Ech. n° 777).Top of Middle Oxfordian - Auvrigney (Sample No. 777).
6 —Sommet Oxfordien moyen - St Ylie près Dole (Ech. n° 778).Top of Middle Oxfordian - St Ylie near Dole (Sample No. 778).Ces deux calcaires fins, de lagon, sont également formés de coccolithes au stade diagénétique 3. La porosité des échantillons est en grande partie assurée par les ouvertures centrales des coccolithes.These fine-grained, lagoonal limestones are both made of coccoliths in the diagenetic stage 3. The porosity of the limestone originates to a great extent from the axial holes of coccoliths.
7 — Kimméridgien - Audincourt (Ech. n° 780).Kimmeridgian - Audincourt (Sample No. 780).Restes de coccolithes (stade diagénétique 3) dont on distingue encore les éléments du disque distal, avec un bord externe acuminé, dû au nourrissage des éléments originels.Coccolith remains (diagenetic stage 3) where the elements of the distal shield show an acuminate outer edge resulting from overgrowth.
8 —Tithonien - Mas de Pegourdy (Ech. n° 764).Tithonian - Mas de Pegourdy (Sample No. 764).Sur la partie gauche du cliché, coccolithes à contour arrondi et ouverture centrale.In the left upper part, coccoliths with rounded outline and central hole.
L’ensemble des figures démontre la généralité du phénomène : ces calcaires fins, déposés dans des lagons, sont en grande partie constitués de coccolithes fortement diagénétisés.
The set of figures illustrates the fact that these fine-grained lagoonal, limestones are mainly made of stronglydiagenetized coccoliths.
Figures 1, 2, 3 et 8, la barre (scale) = 1 pm. Figures 4 à 7, la barre (scale) = 10 pm.

BCREDP 17 (1993) G. BUSSON, D. NOÉL, D. CONTINI, A.-M. MANGIN, A. CORNÉE ET P. HANTZPERGÜE : COCCOLITHES DES CALCAIRES LAGUNAIRES DU JURASSIQUE (FRANCE) : Planche 1
301

Publications elf aquitaineCATALOGUE DISPONIBLE: elf aquitaine édition
31360 Boussens, FranceTel. : - 33 - 61 97 86 24
LIST OF PUBLICATIONS Fax: - 33 - 61 97 80 49FREE ON REQUEST: Telex: 530 395 F
PALÉOÉCOLOGIE DES OSTRACODESProceedings of the Colloquium on the Paleoecology of Ostracodes
(Pau, 1970)Edited by H.J. OERTLI
Published as Vol. 5 suppl. of the Bull. Centre Rech. Pau-SNPA Pau, 1971 — 230 FF
53 papers — most of them in English — dealing essentially with paleoecological aspects of Ostracodes. 10contributions are devoted to general aspects and statistical methods, 15 papers concern Upper Tertiary to Recent deposits, 9 others Tertiary alone. There are 9 articles on Mesozoic and 10 on Paleozoic Ostracodes. Exhaustive index.Hardbound volume, 960 pages, including 209 fig., 53 tables and 48 plates. — ISBN 2-901026-01-X.
MICROFACIÈS DU JURASSIQUE D’AQUITAINE MICROFACIES OF THE JURASSIC OF AQUITAINE
byA.V. CAROZZI,
J. BOUROULLEC, R. DELOFFRE & J.-L. RUMEAU 300 p„ 200 pi. — Pau, 1972 — 180 FF
First bilingual French-English text describing and illustrating the stratigraphic and paleogeographic context of the complete microfacies sequence of a geological system.200 full-page plates 7x10” of photomicrographs with exhaustive descriptions. First presentation of environmental reconstructions integrating petrographic, diagenetic and geochemical parameters. Complete coverage of porosity and permeability data. — ISBN 2-901026-02-8.
ESSAI DE CARACTÉRISATION SÉDIMENTOLOGIQUE DES DÉPÔTS CARBONATÉS
AN ATTEMPT AT SEDIMENTOLOGICAL CHARACTERISATION OF CARBONATE ROCKS
byELF AQUITAINE
Centres de Recherches de Boussens et de Pau Part one: Analytic elements (1975). — ISBN 2-901026-04-4
Part two: Interpretative elements (1977). — ISBN 2-901026-05-2Format (21x29,7 cm). The two parts have 170 and 230 pages written in French, with an English translation of chapter summaries and of explanations of figures and plates.Price of part 1: 100 FF. Part 2: 140 FF. Complete volume: 210 FF.A book richly illustrated with plates and figures, of practical use for geologists of petroleum or mining companies as well as for teachers and students wishing to further their study of carbonate rocks. Part one presents the sedimentological characteristics in the analysis of carbonate deposits: constituent types, classification of these rocks, and their individual micro-and macroscopic aspects («structures»); this part is illustrated by 60 photographic plates. The second part deals with the criteria used in identifying the various environments of deposition and with the problems of reservoirs and source rocks in carbonate sequences (classification, interpretation, relationship with the environment). The book concludes with examples of application.
COEDITION Universidade Agostinho Neto/Elf Aquitaine Angola
CONCHAS E MOLUSCOS DE ANGOLA COQUILLAGES ET MOLLUSQUES D’ANGOLA
byS. GOFAS, J. PINTO AFONSO & M. BRANDAO
Portugais/français: 142 p., 52 fig. (21 in colour). 22 x 28 cm, hardbound. — Luanda 1984 — 140 FF Une sélection abondamment illustrée des plus beaux coquillages de cette côte mal connue, acompagnée de commentaires sur le mode de vie et la distribution des espèces.Pour regarder les plages de l'Ouest Africain avec des yeux de naturaliste.A selection of the most handsome shells from this little known area, plentifully illustrated, with data on the life history and distribution of the species. A naturalist's view on west African shores.

manuels techniques elf aquitaine
© Perrodon, A. — Profession: Géologue pétrolier. 1987.202 p., 3 tab!., 6 pi 17x21 cm broché. — Prix: 95 FF — ISSN 0298-7457. ISBN 2-901026-23-0Si la mission du géologue pétrolier est toujours de découvrir des gisements d’hydrocarbures, les moyens dont il dispose n’ont cessé de se développer et de se perfectionner.Quel est aujourd'hui l’éventail des techniques dont il dispose? Quelles sont les principales filières de préparation à cette profession? Autant de questions auxquelles ce premier volume de la nouvelle collection «Manuels Techniques» des publications Elf Aquitaine s’efforce d’apporter des réponses originales. Un ouvrage indispensable à ceux qui cherchent à s’informer sur une profession encore trop largement méconnue.
® Mouchet, J.-P. & Mitchell, A. — Abnormal pressures while drilling. 1989.255 p. Price : 160 FF (approx. 28 $). ISSN 0298-7457 ISBN 2-901026-28-1.This practical handbook brings together a wide range of bibliographic information on abnormal pressures and adds the practical experience of the authors and various experts within Elf Aquitaine.Primarily destined for day to day use by subsurface geologists and drilling engineers wherever they are confronted with the problems of overpressure, it describes the various origins of pressure anomalies, and details the methods available for their prediction, detection and evaluation. — It will also be useful to petroleum geologists, petroleum engineers and reservoir engineers as a reference manual.
© Mouchet, J.-P. & Mitchell, A. — Pressions anormales en cours de forage. 1987.264 p.. 143 fig., 17 x 21 cm broché — Prix: 160 FF — ISSN 0298-7457 ISBN 2-901026-29-x.Ce guide pratique comprend une importante somme de données bibliographiques sur les pressions anormales auxquelles s’ajoute l'expérience pratique des auteurs et de plusieurs experts d'Elf Aquitaine.Compagnon quotidien du géologue de chantier et de l’ingénieur de forage, confrontés aux problèmes de pressions anormales, ce manuel s’intéresse aux diverses causes de pressions anormales et passe en revue toutes les méthodes utiles à leur prédiction, leur détection et leur évaluation. Cet ouvrage sera aussi fort utile au géologue pétrolier, à l’ingénieur de production et de gisement, comme manuel de référence.
En russe 1991 r. Mouchet, J. P. & Mitchell, A.Myuie 2K.-II. h Mhtmcjiji A.Abnormal pressures while drillingAHOMajibHbie naacTOBbie jiaiiJicHHa b npouecce Crypeun
CARTES — MAPS
CARTE GÉOLOGIQUE DES PYRÉNÉES OCCIDENTALES GEOLOGICAL MAP OF THE WESTERN PYRENEES
(1972)
42-44°N. 2°W-2°E4 feuilles/4 sheets; 1 :250000 — 190 FF
CARTE GÉOLOGIQUE DE LA PÉNINSULE DE MUSANDAM GEOLOGICAL MAP OF MUSAMDAN PENINSULA
(1975)
25°35’-26°25’N; 56°00-56°30’E 1 feuille/1 sheet; 1 :100 000 — 250 FF
OLIVET, J.L., GOSLIN, J., BEUZART, P., UNTERNEHR, P, BONNIN, J. & CARRE, D. (1987)THE BREAKUP AND DISPERSION OF PANGEA
1 feuille/1 sheet; 75x 100 cm (coédition: ELF AQUITAINE - IFREMER)
(ÉPUISÉ — OUT OF PRINT)The large scale map of the Earth as well as the six explanatory figures (on the reverse side of the map) illustrate the relative
motions of all major plates resulting from the breakup and dispersion of Pangea since 180-170 Ma.

LES AMMONITES DU CRÉTACÉ SUPÉRIEUR D’ASHAKA - NIGERIA
parC. MEISTER
Bull. Centres Rech. Explor.-Prod. Elf Aquitaine, 13, suppl. 84 pp. ISSN: 0396-2687. ISBN: 2-901026-30-3. Français: 84 p. , 42 fig., 28 pi. — Boussens 1989. 100 FF.Les affleurements mis en valeur par l’exploitation de la cimenterie d'Ashaka (Nord-est du Nigéria) font partie de la Formation de Gongila (Cénoma- no-Turonien). Ce gisement est exceptionnel par la quantité et la qualité des fossiles qu’il recèle. Par leur richesse et leur diversité les faunes d’Ammonites, très bien conservées même dans la morphologie juvénile, se prêtent parfaitement à des études ontogénétiques et évolutives: distribution verticale de 28 taxons, séquences de variabilité des espèces, problème évolutif des espèces.The detailed study of the lithologic profile of Ashaka (north-east Nigeria) enabled us to establish the vertical distribution of 28 Cenomanian-Turonian Ammonites. In the taxonomic part, the ontogenetic analysis of this Upper Cretaceous Ammonites association treats the variability sequences of species (P. paganum (Reyment), P. tectiforme (Barber), V. costatum (Barber), T. gongitensis (Woods), « P. >• nigeriensis (Woods), « P. » (W.) walls! (Woods)) and allows to enter upon certain phylogenetic problems in species (VP » nigeriensis) or in genera (Pseudaspidoceras, Thomasites - «.Pseudotissotia.»).
DÉCOUVERTE GÉOLOGIQUE DES PYRÉNÉES OCCIDENTALESpar
R. MIROUSE
79 p., 89 fig. (pour la plupart en couleurs), nombreux dessins et schémas. — 21x21 cm, cartonné. 1988. — 95 FF Coédition Elf-Aquitaine/BRGM — ISBN: 2-7159-0418 BRGM. ISBN: 2-901026-27-3 SNEA(P).Diversité et contrastes confèrent aux Pyrénées occidentales l’essentiel de leur charme. L'auteur raconte, à partir de lieux connus et accessibles à tous, les événements géologiques qui ont façonné les paysages pyrénéens.
INTRODUÇAÔ A MICROPALEONTOLOGIAC. SEYVE
1990 — 232 p. — 21x29,7 — 110 fig., 47 est., 27 tab. ISSN: 0181-0901. ISBN: 2-901026-31-1. Preço: 120 FF.Este manual, publicado no quadro das acçoes de formaçâo desenvolvidas pela ELF AQUITAINE ANGOLA na Universidade A, NETO de Luanda, é destinado aos estudantes de Geologia e a todos os géologos que desejam enriquecer os seus conhecimentos micropaleontôlogicos.O livra esté organizado em quatro capitulos : as técnicas micropalentolôgicas, os principals grupos de microfôsseis, as suas aplicaçôes estratigrâficas, paleoecolôgicas, petrôgenéticas, e enflm a micropaleontologia angolana.Os microfôsseis sâo tratados de uma maneira simples e astraente. Os Foraminiferos, Ostracodes, Diatomâoeas e Radiolârios, Calcisferas, Nanofôsseis calcârios, Palinomorfos e Microalgas sâo ricamente ilustrados.A iconografia permite apreender facilmente a organizaçào estrutural, a morfologia e o interesse geolôgico dos microfôsseis.Os aspectos sistemâticos, volontariamente reduzidos, sâo tratados para localizar os microfôsseis no quadro gérai das classificaçoes naturais.Em cada capltulo uma bibliografia especializada permitirâ aos leitores pormenorizarem os seus conhecimentos, para além desta introduçéo.

MÉMOIRES, du« Bulletin des Centres de Recherches Exploration-Production Elf Aquitaine^
Mém. 1O. SERRA
DIAGRAPHIES DIFFÉRÉES.BASES DE L’INTERPRÉTATION
Tome 1.: Acquisition des données diagraphiques.
1979. 328 p., 360 fig., 35 tabl. — Format: 22x 30 cm. Relié. Prix: 220 FF — ISSN : 0181-0901. ISBN: 2-901026-06-0.Second tome: Interprétation des données diagraphiques (voir Mém. 7).Ouvrage d’un usage pratique pour les géologues, géophysiciens et ingénieurs de réservoir, aussi bien que pour les enseignants et étudiants désirant approfondir leur connaissance de ces techniques d’investigation du sous-sol.Il devrait faire découvrir, aux géologues non pétroliers, le vaste champ d'application des diagraphies différées, et les convaincre de leur importance dans l'étude des bassins sédimentaires comme source d’information non seulement pétrolière mais fondamentalement géologique.La seconde édition, revue, corrigée et augmentée en préparation à paraître en 1993.
Mém. 2A. PERRODON
GÉODYNAMIQUE PÉTROLIÈREGenèse et Répartition des Gisements d'Hydrocarbures
Deuxième édition, 1985. 386 p., 220 fig., 5 tabl., 4 pi. — Format: 22x 30 cm. Relié. Prix: 285 FF — ISSN: 0181-0901. ISBN: 2-901026-15-X. — Coédition Elf-Aquitaine/Masson.Rédigé par un ingénieur géologue responsable de l’exploration, puis des programmes de recherche, cet ouvrage présente l’avantage d’associer étroitement le résultat des dernières connaissances et le fruit d'une longue expérience. Aux pétroliers, en général, il apporte une vue d'ensemble de l'exploration des hydrocarbures, aux géologues non pétroliers, il présente un chapitre particulier, mais fondamental, des Sciences de la Terre.
En russe 1991 r.
Perrodon, A. üeppoflOH A.Géodynamique pétrolièreOopMHpoBaHHe h pa3MemeHne MecTopoîKneHHH Herjrrn h ra3a
Mém. 3 ITINÉRAIRES GÉOLOGIQUES (épuisé)Aquitaine - Languedoc - Pyrénées
1980. 442 p., nombreuses fig. — Prix: 135 FF— ISSN: 0181-0901. ISBN: 2-901026-08-7.Recueil regroupant 5 excursions géologiques et 3 excursions métallogéniques, ainsi qu’une introduction générale, préparées dans le cadre du 26 Congrès géologique international (Paris, juillet 1980) et concernant le Sud-Ouest et le Sud-Est de la France.
R. DELOFFRE et P. GÉNOTLES ALGUES DASYCLADALES DU CÉNOZOÏQUE
CENOZOIC DASYCLAD ALGAE
1982. 200 p., 11 fig., 1 tabl., 20 pi. Format: 21x29,7. — Prix: 200 FF — ISSN: 0181-0901. ISBN: 2-901026-11-7.Recueil offrant pour la première fois une vue synthétique des Dascycladales cénozoïques décrites à ce jour et intégrant les connaissances nouvelles sur ce groupe de Chlorophycéées.Cet ouvrage représente un outil indispensable aux géologues stratigraphiques et micropaléontologistes, et une synthèse que les spécialistes algologues consulteront avec profit.The biostratigraphical and palaeoecological use of Algae has already been determined. This volume offers for the first time a synthetic view of the current knowledge of Cenozoic Dasycladales, including the recent discoveries concerning this group of Chlorophyceae.It represents an indispensable tool for all stratigraphical geologists and micropalaeontologists, and may usefully be consulted by specialist algologists.

A. PERRODONDYNAMICS OF OIL AND GAS ACCUMULATIONS
1983. 368 p„ 220 fig., 5 tables, 4 plates. — Hardbound; 22x 30 cm. Price: 285 FF — ISSN: 0181-0901. ISBN: 2-901026-12-5. Entirely revised and updated text of the French edition (our Mém. 2).Gives an excellent introduction to subjects such as
— evolution of sedimentary basins,— hydrocarbon occurrences as linked to the geology and chemistry of source rocks, reservoir genesis, migration, traps,— petroleum provinces,— exploration philosophy.
A useful tool for petroleum geologists as well as for teachers and students.
Mém. 6 BENTHOS ’832nd International Symposium on Benthic Foraminifera
(Pau, April 11-15, 1983)Edited by H.J. OERTLI
Published in March 1984 by Elf-Aquitaine, Esso-REP and Total-CFP. Contains all 90 papers presented at the Pau meeting (25 as abstracts only). 650 p. with numerous figures, tables and plates. — Format: 22x 30 cm. Price: 320 FF — ISSN: 0181-0901. ISBN: 2-901026-14-1
O. SERRADIAGRAPHIES DIFFÉRÉES. BASES DE L’INTERPRÉTATION
Tome 2.: Interprétation des données diagraphiques.
Publié en septembre 1985. 632 p., 886 fig., 67 tabl. Relié. 22x 30 cm. — Prix: 540 FF — ISSN: 0181-0901. ISBN: 2-901026-06-8.Ce second tome traite en quinze chapitres de l’interprétation proprement dite des diagraphies différées : méthodes d'interprétation rapide sur le site d’un forage pétrolier, puis informations géologiques pouvant être tirées de l'analyse des diagraphies au centre de calcul : composition texture, structure sédimentaire, faciès et séquence, milieu de dépôt, diagenèse, compaction, réservoirs, etc.
Mém. 7
Mém. 8 P. ROBERTHISTOIRE GÉOTHERMIQUE ET DIAGENÈSE ORGANIQUE
Publié en mai 1985. 345 p., 199 fig., 9 tabl., 13 pi Format: 22x30 cm. — Prix: 370 FF — ISSN: 0181-0901. ISBN: 2-901026-17-6. English figure captions and chapter abstracts.Ouvrage accessible à tous sur l’analyse microscopique des matières organiques, leur évolution thermique et l'application de celle-ci à la connaissance de l'histoire géothermique des bassins sédimentaires; cette histoire géothermique contrôle la genèse, la migration des hydrocarbures, mais aussi, elle est devenue une clé de l'étude géodynamique, indispensable dans toutes les branches de la géologie appliquée.Book, accessible to all, on the microscopical analysis of organic matter, its thermal evolution and its application to the knowledge of the geothermal history of sedimentary basins. The geothermal history is responsible for hydrocarbon genesis and migration, but it has also become a key for geodynamic investigation, necessary in all branches of applied geology.The English translation has been published early in 1988 (co-edition Reidel/Elf Aquitaine). — Price: 370 FF (paperback).
H.J. OERTLI (éd.)ATLAS DES OSTRACODES DE FRANCE
Publié en mai 1985. 396 p., fig., tabl., 116 pl. Relié, 22x30 cm. — Prix: 420 FF — ISSN: 0181-0901. ISBN: 2-901026-18-4.Rédigé par le Groupe des Ostracodologistes de langue française, cet ouvrage est destiné à la fois au micropaléontologue professionnel et amateur. L'introduction donne un aperçu des principaux termes utilisés, des listes de publications facilitant l’entrée en matière ainsi que les lieux de dépôts des collections françaises. La partie principale apporte des figurations (116 planches) et diagnoses des principales espèces rencontrées depuis l'Ordovicien jusqu’à l'Actuel.This volume, to which almost all French-speaking ostracodologists have contribued, is a tool for the identification and practical use of Ostracodes, found in France mainly between the Ordovician and the Recent, of forms, whether characteristic of biostratigraphy or of the interpretation of the environment. The main part — descriptive and figurative — consists of 350 pages (with 116 large format plates): it is complete with an introduction, including, in particular, a glossary of specialized terms (and their equivalents in French and German), a list of deposit locations, in France, for collections of Ostracodes and a list of French theses concerning Ostracodes. A generic-specific index concludes the work.

Mém. 10 A. PERR0D0NHISTOIRE DES GRANDES DÉCOUVERTES PÉTROLIÈRES
Un certain art de l’exploration
Publié en septembre 1985. 224 p.. 97f ig., 5 pl. Format: 22x30 cm. — Prix: 175 FF — ISSN: 0181-0901. ISBN: 2-901026-19-2. — Coédition Ell-Aquitaine/Masson.L’histoire de l'exploration d’un certain nombre de provinces pétrolières, géantes ou plus mineures, offre une succession d’aventures et de rebondissements où les techniques et l’imagination des prospecteurs se partagent le premier rôle. Découvertes relativement faciles et rapides au XIX comme au e siècle, quel que soit le développement des techniques, à Bakou, à Bornéo, en Californie, mais aussi en Libye, en Sibérie Occidentale, en Arabie, en Australie. Démarche incertaine faite de maigres succès et d’échecs retentissants, avant de trouver la voie royale, au Venezuela, en Iran, en Alaska... Le récit de ces approches, souvent hésitantes, parfois décevantes, toujours exemplaires, constitue une mine d’enseignements et de réflexions, quel que soit le degré de performance des techniques ou la maturé des concepts géologiques.
VAN MORKHOVEN, F.P.C.M., BERGGREN, W.A. & EDWARDS, A.S.CENOZOIC COSMOPOLITAN DEEP-WATER BENTHIC FORAMINIFERA
Published in October 1986. 424 p., 8 fig.. 1 table, 164 plates. 22x30 cm, hardbound. — Price: 490 FF— ISSN: 0181-0901. ISBN: 2-901026-20-6.The book presents the results of a 5-year study of 126 predominantly calcareous, stratigraphically important taxa. Diagnostic features, suspected synonyms, observed occurrences, known stratigraphic and bathymetric ranges are enriched by information on type material, taxonomy, lineage and paleobiogeography. A large stratigraphic chart is included with each volume. This publication should prove invaluable for deep water petroleum exploration and research, whilst serving equally well as a basic reference for marine micropaleontology studies.
Groupe de travail «Dinoflagellés» de l’Association des Palynologues de Langue Française (APLF)
GUIDE PRATIQUE POUR LA DÉTERMINATION DE KYSTESDE DINOFLAGELLÉS FOSSILES: LE COMPLEXE GONYAULACYSTA
Publié en septembre 1986. 479 p., 84 tabl., 152 planches. 22x30 cm, relié. — Prix: 465 FF— ISSN: 0181-0901. ISBN: 2-901026-21-4.Description et illustration de 345 espèces et sous-espèces, le plus souvent avec l’holotype ou un paratype. Clefs de détermination; glossaire quadrilingue (anglais-français-allemand-italien) des termes morphologiques; Un index des espèces traitées termine l’ouvrage.Description and illustration of 345 species and subspecies, generally with holotype or paratype. Keys for easy classification; a glossary of morphological terms in four languages (English-French-German-ltalian). An index of the studied species concludes the work.
Mém. 12
Mém. 13R. CURNELLE (éd.)
GÉOLOGIE AFRICAINE Colloques de géologie de Libreville,
6-8 mai 1991: recueil des publicationsPublié en avril 1992, 414 p., 197 fig., 57 pl., 11 tabl., format 21x29,7 cm, broché — Prix: 250 FF— ISSN: 0181-0901. ISBN: 2-901026-34-6. Cet ouvrage comprend deux parties :
- Colloque de stratigraphie et de paléogéographie des bassins sédimentaires Ouest-Africains:13 articles et 19 résumés, en Français ou en Anglais.
- Colloque africain de micropaléontologie :11 articles et 22 résumés, en Français ou en Anglais.
This publication comprises two parts :- Symposium of the stratigraphy and paleogeography of the West African sedimentary basins :
13 papers (9 in English); 19 abstracts in French or in English.- African symposium of micropaleontology
11 papers (5 in English); 22 abstracts in French or in English.
Mém. 14Comité des Techniciens de la Chambre Syndicale de la Recherche
et de la Production du Pétrole et du Gaz NaturelMONOGRAPHIE DES PRINCIPAUX CHAMPS PÉTROLIERS DE FRANCE
Publié en 1992, 157 p., 145 fig., 2 tabl., format 21x29,7 cm, classeur — Prix: 300 FF — ISSN: 0181-0901. ISBN: 2-901026-35-4.Classeur contenant 28 monographies de champ et 4 monographies de bassin. Chaque monographie de champ est constituée d’une double fiche à laquelle s’ajoute une ou plusieurs fiches de planches.Ces fiches donnent les informations essentielles sur les champs. L’accent a été mis sur les données réservoirs, fluides et production ainsi que sur les données historiques ante et post découverte.Les «fiches bassins» sont composées d’un texte, d’une bibliographie et de quelques figures.Les planches sont pour l’essentiel la carte structurale, le log lithologique et une ou plusieurs coupes géologiques ou sismiques du champ.Des mises à jour successives sont prévues.Cet ouvrage inexistant à ce jour en France, devrait susciter l’intérêt de tous les géologues et devenir un ouvrage de référence sur les champs pétroliers français.A file containing 28 field and 4 basin monographs. Each field monograph comprises 2 sides and, in addition, one or more sides of plates.These sheets give the essential information on the fields. The emphasis has been placed on reservoir data, fluids and production as well as on the pre- and post-discovery historical data.The "basin sheets" comprise a text, a bibliography and figures. The plates are mainly of structural charts, the lithologic log and one or several geological or seismic field sections.This publication, the first of it's kind to appear in France, should be of interest to oil geologists and become a reference work on French oil fields.

BULLETIN DES CENTRES DE RECHERCHES EXPLORATION-PRODUCTION ELF-AQUITAINE
SOMMAIRE — CONTENTSVolume 17 — N°1 — 1993
REYNES, P., ROLET, J., RICHERT, J.-P., GRUNEISEN, P., PALENGAT. J.-M. & COQUELET, D.— Apports des techniques 3D de la télédétection dans la recherche des blocs basculés du fossé Nord Tanganyika, Rift est-africain, Zaïre.3D remote sensing techniques as an aid for the research of tilted blocks of the NorthTanganyika trough. East African Rift, Zaire............................................................................ 1
MIEGEBIELLE, V., HERVOUET, Y. & XAVIER, J.-P. — Analyse structurale de la partie méridionale du bassin de Soria (Espagne).Structural analysis of the southermost part of the Soria basin (Spain)........................ 19
LEFORT, J.-P. — Image globale de la croûte continentale française entre le Brabant et le Pays Basque.Global image of the French continental crust between Brabant and the Basque Country. 39
GOLUBEV, V.A., KLERKX, J. & KIPFER, R. — Heat flow, hydrothermal vents and staticstability of discharging thermal water in Lake Baikal (south-eastern Siberia)............. 53
KOLLA, V. — Lowstand deep-water siliciclastic depositional systems : characteristics andterminologies in sequence stratigraphy and sedimentology............................................. 67
AVKHIMOVITCH, V.I., TCHIBRIKOVA, E.V., OBUKHOVSKAYA, T.G., NAZARENKO, A.M., UM- NOVA, V.T., RASKATOVA, L.G., MANTSUROVA, V.N., LOBOZIAK, S. & STREEL, M. —Middle and Upper Devonian miospore zonation of Eastern Europe............................... 79
INTERPRÉTATION SÉQUENTIELLE PLURIDISCIPLINAIRE DU TITHONIQUE SUPÉRIEUR ET DU BERRIASIEN DU SUD-EST DE LA FRANCE.
A MULTIDISCIPLINARY SEQUENCE-STRATIGRAPHIC INTERPRETATION OF THE UPPER TITHONIAN AND BERRIASIAN IN SOUTH-EAST FRANCE
RAYNAUD, J.-F. — Introduction............................................................................................................. 149JAN DU CHÊNE, R., BUSNARDO, R., CHAROLLAIS, J., CLAVEL, B„ DECONINCK, J.-F., EM
MANUEL, L., GARDIN, S., GORIN, G., MANIVIT, H., MONTEIL, E., RAYNAUD, J.-F., RENARD, M., STEFFEN, D., STEINHAUSER, N., STRASSER, A., STROHMENGER, C. &VAIL, P.R. — Sequence-stratigraphic interpretation of Upper Tithonian-Berriasian reference sections in South-East France : a multidisciplinary approach.Interpretation séquentielle de coupes de référence du Tithonique supérieur et du Ber-riasien du sud-est de la France: approche multidisciplinaire.......................................... 151
STROHMENGER, C. & STRASSER, A. — Eustatic controls on the depositional evolution of Upper Tithonian and Berriasian deep-water carbonates (Vocontian Trough, SE France).Contrôle eustatique des dépôts carbonatés profonds d'âge tithonique supérieur àberriasien de la Fosse Vocontienne (sud-est de la France).............................................. 183
EMMANUEL, L. & RENARD, M. — Carbonate geochemistry (Mn, 913C, r)1sO) of the LateTithonian - Berriasian pelagic limestones of the Vocontian Trough (SE France)....... 205
DECONINCK, J.-F. — Clay mineralogy of the Late Tithonian-Berriasian deep-sea carbonates of the Vocontian Trough (SE France) : relationships with sequence stratigraphy.Minéralogie des argiles des sédiments carbonatés profonds, d'âge tithonique - berriasien du bassin vocontien (SE de la France) : relations avec la stratigraphieséquentielle...................................................................................................................................... 223
STEFFEN, D. & GORIN, G. — Palynofacies of the Upper Tithonian - Berriasian deep-seacarbonates in the Vocontian Trough (SE France)....... ......................................................... 235
MONTEIL, E. — Dinoflagellate cyst biozonation of the Tithonian and Berriasian of South-East France. Correlation with the sequence stratigraphy.................................................. 249
GARDIN, S. & MANIVIT, H. — Upper Tithonian and Berriasian calcareous nannofossils from the Vocontian Trough (SE France) : biostratigraphy and sequence stratigraphy.Nannofossiles calcaires du Tithonique supérieur et du Berriasien de la Fosse Vocontienne (sud-est de la France) : biostratigraphie et stratigraphie séquentielle....... 277
BUSSON, G., NOËL, D., CONTINI, D., MANGIN, A.-M., CORNÉE, A. & HANTZPERGUE, P. — Omniprésence de coccolithes dans des calcaires lagunaires du Jurassique moyen et supérieur de France.Omnipresence of coccoliths in Middle - Upper Jurassic lagoonal limestones in France 291
IMPRIMERIE LOUIS-JEAN, 05002 GAPTél. 92.53.17.00* - Dépôt légal n 459 - Juin 1993 Prix de ce fascicule : 200 F