REGISTRATION DOCUMENT - Groupe Société Générale
568
2018 REGISTRATION DOCUMENT ANNUAL FINANCIAL REPORT 2017
-
Upload
khangminh22 -
Category
Documents
-
view
1 -
download
0
Transcript of REGISTRATION DOCUMENT - Groupe Société Générale

20
18
20
17
2018 REGISTRAT ION DOCUMENT
A N N U A L F I N A N C I A L R E P O R T 2 0 1 7

WEBSITE: WWW.SOCIETEGENERALE.COM INVESTOR RELATIONS AND FINANCIAL INFORMATION
Tel: 33 (0) 1 42 14 47 72
PRESS RELATIONS Tel: 33 (0) 1 42 14 67 02
COMMUNICATION DEPARTMENT
Postal address:
Tours Société Générale
75886 – Paris Cedex 18
SOCIETE GENERALE
Head office: 29, Bd Haussmann – 75009 Paris
Tel: 33 (0) 1 42 14 20 00
A French limited company founded in 1864
Share capital: EUR 1,009,897,173.75
552 120 222 RCS Paris
This document is printed in France on paper sourced from certified sustainable forests
Creation and production Societe Generale
Labrador
Translation
This label recognises the mosttransparent Registration Documentsaccording to the criteria of the AnnualTransparency Ranking.
TABLE OF CONTENTS
1
EDITORIAL 4
1
KEY FIGURES AND PROFILE OF SOCIETE GENERALE 7
1. History 8
2. Profile of Societe Generale 9
3. A strategy of stronger, profitable and sustainable growth, based on a diversified and integrated banking model 10
4. The Group’s core businesses 16
2
GROUP MANAGEMENT REPORT 27
1. Societe Generale Group main activities 28
2. Group activity and results 30
3. Activity and results of the core businesses 32
4. Significant new products or services 50
5. Analysis of the consolidated balance sheet 59
6. Financial policy 62
7. Major investments and disposals 66
8. Pending acquisitions and major contracts 67
9. Property and equipment 67
10. Post-closing events 67
11. Information about geographic locations and activities as at 31st December 2017 68
3
CORPORATE GOVERNANCE 71
1. Board of Directors’ report on corporate governance 72
2. Statutory Auditors’ special report on related-party agreements and commitments 133
4
RISK FACTORS AND CAPITAL ADEQUACY 137
1. Risk factors 138
2. Risk management and internal control mechanism 148
3. Capital management and adequacy 166
4. Credit risks 178
5. Market risks 201
6. Operational risks 211
7. Structural interest rate and exchange rate risks 217
8. Liquidity risk 221
9. Compliance and reputational risk, litigation 228
10. Other risks 233
Abbreviations used: Millions of euros: EUR m Billions of euros: EUR bn FTE: Headcount in Full-Time Equivalents
55
CORPORATE SOCIAL RESPONSIBILITY 237
1. Societe Generale – CSR at a glance 238
2. Societe Generale is a responsible bank 239
3. Societe Generale is implementing its CSR ambition 262
4. Appendices 291
5. Cross-reference table 297
6
FINANCIAL INFORMATION 299
1. Consolidated financial statements 302
2. Notes to the consolidated financial statements 309
3. Statutory Auditors’ report on the consolidated financial
statements 448
4. Societe Generale management report 454
5. Financial statements 461 6. Notes to the parent company financial statements 464
7. Statutory auditors’ report on the financial statements 524
7
SHARE, SHARE CAPITAL AND LEGAL INFORMATION 531
1. The Societe Generale share 532 2. Information on share capital 535
3. Additional information 539
4. By-laws 541
5. Internal Rules of the Board of Directors 546
6 List of regulated information published in the last 12
months 553
8
PERSON RESPONSIBLE FOR THE REGISTRATION DOCUMENT 555
1. Person responsible for the Registration Document 556
2. Statement of the person responsible for the Registration
Document 556
3. Person responsible for the audit of the financial
statements 557
9
CROSS-REFERENCE TABLES 559
Registration Document cross-reference table 560
Annual financial report cross-reference table 562 Cross-reference table for the registry of the Court 562
GLOSSARY OF MAIN TECHNICAL TERMS 563
Rankings: the source for all references to rankings is given explicitly. Where it is not, rankings are based on internal sources.

RREG ISTRAT ION DOCUMENT
2018
ANNUAL FINANCIAL REPORT 2017
This Registration Document was filed with the Autorité des Marchés Financiers (AMF) on 8th March 2018, pursuant to Article 212-13 of the AMF General Regulation. It may be used to support a financial transaction if completed by a transaction note approved by the AMF. This document was prepared by the issuer and is the responsibility of its signatory.
This label recognises the most transparent Registration Documents according to the criteria of the Annual Transparency Ranking.
This Registration Document is available online on www.societegenerale.com

EDITORIAL
4 I 2018 REGISTRATION DOCUMENT I S O C I E T E G E N E R AL E G R O U P
MESSAGE FROM THE CHAIRMAN AND CHIEF EXECUTIVE OFFICER
LORENZO BINI SMAGHI CHAIRMAN OF SOCIETE GENERALE
Societe Generale is a solid group firmly focused on the future. 2017 was a year of transition with a strong commercial performance, growing underlying profitability and resilient results despite the impact of non-recurring items. Book net banking income stood at €23,954 million and book Group net income at €2,806 million, the Common Equity Tier 1 ratio was 11.4% at the year’s end, above regulatory requirements. Fulfilling our role of financing businesses and consumers, our teams proved their commitment to serving our clients.
The strength of our diversified and integrated banking model was illustrated, notably in France, by the transformation of our retail banking networks and the increasing role of digital services that are highly appreciated by our clients. Internationally, it is evident in the improvement of our activities in Russia and the dynamism of our business in Africa, where, for decades, we have been establishing a strong local presence and long-term growth. The development trajectory of Boursorama – France’s leading online bank – and ALD Automotive – whose stock market launch was a success – also confirms our capacity to deliver growth by giving entities that enhance our offering and drive the Group’s development the autonomy they need to succeed. Lastly, our activities serving corporations and investors continued to adapt by reinforcing our efficiency and our areas of expertise.
We also put in place a more agile organisational structure, favouring innovation and synergies between the businesses to better serve our customers. We opened a new strategic chapter in our development with the presentation in November of our plan Transform to Grow, projecting our Group in a world undergoing profound change with a long-term vision and a strategic and financial roadmap for the next three years.
Our sector is experiencing a real industrial revolution. The Banking Union and the new regulations in the prudential domains and data management will reshape the European banking sector. Under the influence of new technologies, the way our clients use our services is evolving radically, relationship models to production methods are all becoming digital. The expectations of civil society towards social and environmental issues are also constantly evolving.

EDITORIAL
S O C I E T E G E N E R AL E G R O U P I 2018 REGISTRATION DOCUMENT I 5
“WE SEEK TO SEIZE THE OPPORTUNITIES THAT ARE OPEN TO US AND MAKE A POSITIVE CONTRIBUTION TO THE CONSTRUCTION OF THE WORLD OF TOMORROW.”
FRÉDÉRIC OUDÉA CHIEF EXECUTIVE OFFICER OF SOCIETE GENERALE
We seek to seize the opportunities that are open to us and make a positive contribution to the construction of the world of tomorrow. We reaffirm our fundamental role as bankers, that of a trusted partner, committed to helping our clients with their plans and driving positive transformations in the economies and societies in which we play a key role in helping to build and secure the future. This vision inspired our roadmap to 2020, which aims to put us on a dynamic, profitable and sustainable growth path of over 3% per year over the 2016-2020 period.
We have clearly identified the route we must take. We need to: better leverage the growth potential of our businesses by taking key initiatives in each of them; accelerate our digital transformation and our innovation efforts in order to optimise our operational efficiency, enhance our clients’ experience and invent new services for them. Furthermore, we need to control our costs so we can invest more; complete our refocusing on those activities and regions that have the best potential for synergies and growth
over the long term; promote our culture of responsibility by reinforcing our governance and our control systems to ensure we set the best standards in the banking sector, and better integrate our corporate and social responsibility and environmental commitments in the growth targets of our businesses. Among the CSR priorities we defined with our stakeholders, two are particularly emblematic of the positive transformations that we will support: contributing to the fight against climate change – we already strengthened our commitments in 2017 with the ambition to raise €100 billion in financing for the energy transition between now and 2020 – and advancing sustainable growth in Africa.
Strengthened by its growth strategy and its distinctive business model, as well as by the exceptional commitment of its teams, Societe Generale begins this new strategic stage with confidence and the intention to fully play its part in the future construction of the European banking sector.

6 I 2018 REGISTRATION DOCUMENT I S O C I E T E G E N E R AL E G R O U P
EDITORIAL
KEY F IGURES AND PROF I LE OF SOC IETE GENERALE

S O C I E T E G E N E R A L E G R O U P I 2018 REGISTRATION DOCUMENT I 7
1 KEY F IGURES AND PROF I LE
OF SOC IETE GENERALE
1. History ...................................................................................................................... 8
2. Profile of Societe Generale ........................................................................................ 9
3. A strategy of stronger, profitable and sustainable growth, based on a diversified and integrated banking model .............................................. 10Recent developments and outlook............................................................................................................................................ 13
4. The Group’s core businesses ................................................................................. 16French Retail Banking ............................................................................................................................................................... 17
International Retail Banking and Financial Services.................................................................................................................... 22
Global Banking and Investor Solutions...................................................................................................................................... 26

1 I 1
HISTORY KKEY FIGURES AND PROFIILE OF SOCIETE GENERAALE
8 I 2018 REGISTRATION DOCUMENT I S O C I E T E G E N E R AL E G R O U P
1 . H I S T O R Y
On 4th May 1864, Napoleon III signed Societe Generale’s founding decree. Founded by a group of industrialists and financiers driven by the ideals of progress, the Bank’s mission has always been “fostering business and industrial growth”.
Since its beginnings, Societe Generale has worked to modernise the economy, following the model of a diversified bank at the cutting edge of financial innovation. Its branch network grew rapidly throughout the French territory, increasing from 46 to 1,500 branches between 1870 and 1940. During the interwar period, it became the leading French credit institution in terms of deposits.
At the same time, Societe Generale began to build its international reach by financing infrastructure essential to the economic development of a number of countries in Latin America, Europe and North Africa. This expansion was accompanied by the establishment of an international retail network. In 1871, the Bank opened its London branch. On the eve of World War I, Societe Generale had a presence in 14 countries, either directly or through one of its subsidiaries, in particular in Russia. This network was then expanded by opening branches in New York, Buenos Aires, Abidjan and Dakar, and by acquiring stakes in financial institutions in Central Europe.
Societe Generale was nationalised by the French law of 2nd December 1945 and played an active role in financing the reconstruction of the French territory. The Bank thrived during the prosperous post-war decades and contributed to the increased use of banking techniques by launching innovative products for businesses, including medium-term discountable credit and lease financing agreements, for which it held the position of market leader.
Societe Generale demonstrated its ability to adapt to a new environment by taking advantage of the banking reforms that followed the French Debré laws of 1966-1967. While continuing to support the businesses it partnered, the Group lost no time in focusing its business on individual clients. In this way, it supported the emergence of a consumer society by diversifying the credit and savings products it offered households.
In June 1987, Societe Generale was privatised with a successful stock market launch and shares offered to Group staff. The Group developed a universal banking strategy, in particular through its Corporate and Investment Banking, to support the worldwide development of its customers. In France, it expanded its networks by founding Fimatex in 1995, which later became Boursorama, now a leading online bank, and by acquiring Crédit du Nord in 1997. Internationally, it established itself in Central and Eastern Europe through Banka in the Czech Republic and BRD in Romania, and in Russia with Rosbank, while consolidating its growth in Africa in Morocco, Côte d’Ivoire and Cameroon, among others. The Group has more than 147,000 members of staff* active in 67 countries. It continues its process of transformation by adopting a sustainable growth strategy driven by its core values of team spirit, innovation, responsibility and commitment. Firmly focused on the future, Societe Generale has embraced with conviction the opportunities of the digital age to best anticipate the needs of its clients and members of staff, and embody the bank of the 21st century. Drawing on more than 150 years of expertise at the service of its clients and the development of the real economy, the Societe Generale Group aims to be a trusted partner, committed to the positive transformations of society and the economy.
* Headcount at end of period excluding temporary staff.

1
PROFILE OF SOCIETE GENERALE
2 I 1 KKEY FIGURES AND PROFIILE OF SOCIETE GENERAALE
S O C I E T E G E N E R AL E G R O U P I 2018 REGISTRATION DOCUMENT I 9
2 . P R O F I L E O F S O C I E T E G E N E R A L E
Societe Generale is one of the leading European financial services groups. Based on a diversified and integrated banking model, the Group combines financial strength and proven expertise in innovation with a strategy of sustainable growth, aiming to be the trusted partner for its clients, committed to the positive transformations of society and the economy.
Active in the real economy for over 150 years, with a solid position in Europe and connected to the rest of the world, Societe Generale has over 147,000 members of staff* in 67 countries and supports on a daily basis 31 million individual clients, businesses and institutional investors(1) around the world by offering a wide range of advisory services and tailored financial solutions. The Group is built on three complementary core businesses:
French Retail Banking, which encompasses the Societe Generale, Crédit du Nord and Boursorama brands. Each offers a full range of financial services with omnichannel products at the cutting edge of digital innovation;
International Retail Banking, Insurance and Financial Services to Corporates, with networks in Africa, Russia, Central and Eastern Europe and specialised businesses that are leaders in their markets;
Global Banking and Investor Solutions, which offers recognised expertise, key international locations and integrated solutions.
Societe Generale is included in the principal socially responsible investment indices: DJSI (World and Europe), FTSE4Good (Global and Europe), Euronext Vigeo (World, Europe and Eurozone), four of the STOXX ESG Leaders indices, and the MSCI Low Carbon Leaders Index.
In 2017, the Group put in place a more agile organisation based on 17 Business Units (business lines, regions) and 10 Service Units (support and control functions) to encourage innovation and synergies, and to better respond to the new requirements and behaviours of its clients. With the presentation of its strategic plan Transform to Grow in November, Societe Generale set itself five strategic and operational priorities for the next three years: grow; accelerate the transformation of its businesses, particularly in digital; maintain strict cost discipline; complete the refocusing of the Group; and foster a culture of responsibility at every level of the company. In a European banking sector undergoing radical industrial change, the Group is ready to enter a new phase of its development and transformation.
* Headcount at end of period excluding temporary staff. (1) Excluding insurance policyholders.
KEY FIGURES
2017 2016 2015 2014 2013
Result (in EUR m))
Net banking income 23,954 25,298 25,639 23,561 22,831
o.w. French Retail Banking 8,131 8,403 8,550 8,275 8,235
o.w. International Retail Banking and Financial Services 8,070 7,572 7,329 7,456 8,012
o.w. Global Banking and Investor Solutions 8,887 9,309 9,442 8,726 8,710
o.w. Corporate Centre (1,134) 14 318 (896) (2,126)
Gross operating income 6,116 8,481 8,746 7,545 6,432
Cost-to-income ratio (excluding the revaluation of own financial liabilities and DVA)
74.3% 65.6% 67.7% 67.7% 67.4%
Operating income 4,767 6,390 5,681 4,578 2,380
Group net income 2,806 3,874 4,001 2,692 2,175
Equity (in EUR bn)
Group shareholders’ equity 59.4 62.0 59.0 55.2 51.0
Total consolidated equity 64.0 66.0 62.7 58.8 54.1
ROE after tax 4.9% 7.3% 7.9% 5.3% 4.4%
Total Capitaal Ratio(1) 17.0% 17.9% 16.3% 14.3% 13.4%
Loans and deposits (in EUR bn)
Customer loans 374 373 358 330 314
Customer deposits 394 397 360 328 320
(1) 2014 to 2017: figures based on CRR/CRD4 rules; 2013: proforma figures under Basel 3. Note: Figures as published for the respective financial years. Definitions and potential adjustments presented in methodological notes on pages 44 to 49.

1 I 3 A STRATEGY OF STRONGER, PROFITABLE AND
SUSTA INABLE GROWTH, BASED ON A D IVERS IFIED AND INTEGRATED BANKING MODEL KKEY FIGURES AND PROFIILE OF SOCIETE GENERAALE
10 I 2018 REGISTRATION DOCUMENT I S O C I E T E G E N E R AL E G R O U P
3 . A S T R AT E G Y O F S T R O N G E R , P R O F I TA B L E A N D S U S TA I N A B L E G R O W T H , B A S E D O N A D I V E R S I F I E D A N D I N T E G R AT E D B A N K I N G M O D E L
The Societe Generale Group has built a solid diversified banking model suited to the needs of its 31 million corporate, institutional and individual customers and structured around three complementary pillars enabling the Group to diversify risk and benefit from strong market positions:
French Retail Banking;
International Retail Banking and Financial Services;
Global Banking and Investor Solutions.
At the end of 2017, the Group presented its 2020 strategic plan entitled Transform to Grow, which is based on a long-term vision: as a trusted partner of its customers, the Group is fully committed to positive societal and economic transformation. Against this background, its ambition is to generate stronger, profitable and sustainable growth. To this end, the Group is ready to enter a new stage in its development and transformation.
The Group aims to rely firstly on its ability to anticipate market trends and to innovate as a way of improving the customer experience and turning it into a competitive advantage. Its model, which focuses on Europe while being connected to the rest of the world (about 75% of income generated in mature markets and 25% in fast-growing emerging markets), is made up of activities with high added value serving a high-potential customer base, working in synergies and enjoying leadership positions. Furthermore, the Group’s model is strongly geared towards business-to-business activities, which represent two-thirds of its income, whereas business-to-consumer activities, which represent one-third of its income, are firmly focused on professional, high net worth and mass affluent customers.
In Retail Banking, the Group will be concentrating its development in Europe, Russia and Africa, where it enjoys a historic presence, extensive knowledge of the markets and prominent positions. In Global Banking and Investor Solutions, the Group’s development extends beyond the borders of the EMEA region (Europe, Middle East and Africa) and capitalises on its product expertise and international network in the United States and Asia. Lastly, in International Financial Services, Societe Generale can rely on franchises with worldwide leadership positions, in particular in Operational Vehicle Leasing and Fleet Management activities, together with Equipment Financing.
The Group’s top priority is to sustain its growth and commercial development through increased efforts in customer satisfaction, quality of service, added value and innovation. The Group is targeting EUR 3.6 billion in additional income by 2020 (compared with end-2016), by way of a series of ambitious initiatives throughout the company targeting all its high-potential customers.
Moreover, the Group is ramping up its digital transformation in order to improve the customer experience, operational efficiency and security. Accordingly, the Group has adopted a strategy focused on three areas: (i) stimulating innovation by encouraging experimentation and increased proximity between operational staff in the businesses or functions and the IT teams and by multiplying interaction and cooperation with start-ups; (ii) investing
in new operational models and new methods of IT development, relying on massive data processing, open innovation and more open and flexible infrastructures; and (iii) strengthening its leading expertise in terms of data management, artificial intelligence and cybersecurity. Furthermore, Societe Generale was awarded second prize in the eCAC40 2017 Trophies (compared with third prize in 2016), recognising the Group’s deep transformation and ranking Societe Generale first among the most digitalised French banks and financial institutions.
Organic growth will also be stimulated by the development of internal income synergies within and between each of the pillars (greater cooperation between Private Banking and the Retail Banking networks, cooperation along the entire Investor Services chain, cooperation between the Insurance business line and the French and International Retail Banking networks, cooperation between all of the Group’s pillars through Global Transaction Banking activities, etc.).
In an environment sure to remain challenging, but which should continue to show gradual improvement, the Group is committed to maintaining the strict, disciplined management of its costs (by continuing to make savings, launching a new programme that should generate EUR 1.1 billion in structural savings in 2020, closely supervising discretionary costs, increasing operating efficiency via the improvement of its information systems and the automation of its processes), of its risks (keeping up the quality of the loan book, continuing efforts on operational risk, compliance and risk culture, strengthening the balance sheet), and of its capital allocation. In this respect, the Group intends to complete its realignment via the disposal or closure of activities that do not have critical mass and/or do not generate synergies (the impact of this realignment is expected to concern the equivalent of 5% of the Group’s risk-weighted assets).
Lastly, the Group aims to continue to establish a culture of responsibility at all levels of its organisation, and will continue to strengthen its internal control system, in particular with respect to the Compliance function, to position itself in line with the highest industry standards. Furthermore, the Group will continue to implement its Culture and Conduct programme, with the aim of applying rules of conduct and a set of strong shared values throughout the entire company.
Within this framework, the Group implemented a new, more horizontal organisation in September 2017, with a stronger regional approach, relying on 17 Business Units (businesses or regions) and 10 Service Units (support or control functions), reporting directly to General Management and equipped with increased delegation levels. The aim of this new organisation is to be as close as possible to the needs of the Group’s customers, while also fostering more collegial collaboration methods in order to enhance synergies between the businesses.
French Retail Banking is one of the three pillars of the Group’s diversified banking strategy.
Operating commercially in 67 countries, International Retail Banking and Financial Services is the second pillar of the Group’s diversified banking strategy.

1
A STRATEGY OF STRONGER, PROFITABLE AND SUSTAINABLE GROWTH, BASED ON A DIVERSIFIED AND
INTEGRATED BANKING MODEL
3 I 1 KKEY FIGURES AND PROFIILE OF SOCIEETE GENERALE
S O C I E T E G E N E R AL E G R O U P I 2018 REGISTRATION DOCUMENT I 11
FFrench Retail Banking is oone of the three pillars of the Group’s ddiversified banking strategy.
The Group is the third largest retail bank in France.
This activity has undertaken major transformations in its model based on the rapid development of customer behaviour and expectations, which are increasingly focused on personal attention with greater expertise and customisation.
French Retail Banking continues to build on the complementary nature of its three brands:
the Societe Generale multi-channel relationship-banking network, which supports a diversified customer base of individuals, professionals, corporates, local authorities and non-profit associations;
the Crédit du Nord network, which develops an original local and digital banking model through its network of community-oriented regional banks;
Boursorama, the French leader in online banking, which boasts an innovative business model and attractive price positioning.
Through the French Retail Banking division, the Group’s ambition is to set the standard in terms of customer satisfaction. In so doing, the Group plans to increase customer loyalty, continue to win new individual and professional customers, and strengthen its positioning as a leading player among corporate, professional and high net worth customers.
Boursorama continued its very dynamic customer acquisition this year, reaching 1.3 million customers at the end of 2017.
The pillar aims to further accelerate the operational and relational transformation of its brands – Societe Generale (continued streamlining of the branch network, reduced number of back offices and specialisation of platforms, digitalisation of processes and customer experience) and Crédit du Nord –, and to place digital technology at the heart of its model. With more than 1 billion contacts in 2017 (+13% year-on-year), digital technology has become the Bank’s main point of entry for its customers.
The pillar also aims to build on and enhance its growth drivers:
taking advantage of Private Banking expertise to meet the expectations of high net worth customers in the French networks;
capturing the full potential of the integrated bank insurance model by anticipating changes in the life insurance market and taking advantage of the strong customer take-up potential regarding personal protection and non-life insurance;
developing our activities among corporate and professional customers by providing strategic advice and comprehensive solutions; in this respect, the division announced in December 2017 the planned acquisition of Cegelease, an expert in equipment leasing to healthcare professionals. The acquisition was finalised on 28th February 2018;
accelerating the growth of Boursorama, whose ambition is to exceed 2 million customers by 2020.
OOperating commercially in 67 countries, International Retail BBannking and Financial Services is the second pillar of the Group’s ddiversified banking strategy.
International Retail Banking and Financial Services is a profitable growth driver for the Group, thanks to its leading positions on high-potential markets, its initiatives for operational efficiency and digital transformation, and its strong synergies. This pillar has undergone a major transformation over the last few years, by refocusing its
portfolio, introducing a more optimised model and improving its risk profile.
International Retail Banking activities are mainly located in regions outside of the Eurozone, which benefit (compared with the Eurozone) from stronger growth potential and a much more favourable interest rate environment. The Group aims to continue to develop its international banking activities in Western Europe, Russia and Africa, all areas in which the Group has established positions as a leader with renowned expertise:
in Central and Eastern Europe, the Group’s strategy is to focus its presence in markets where it enjoys leading positions with critical mass. In particular, the Group aims to become the first omnichannel bank in the Czech Republic, while recording high profitability. In Romania, the Group intends to consolidate its Top 3 franchise and its return to sustainable profitability. The strategy in this region also involved a more streamlined system, with the divestment in May 2017 of the Croatian subsidiary Splitska Banka;
in Russia, with its three brands (Rosbank, DeltaCrédit Banque and Rusfinance Banque), the Group continued to implement the transformation plan for Rosbank’s retail banking activities and the development of corporate activities, together with a return to profitability in 2017. The Group’s target is to become the first foreign-capital bank in the country, with profitable growth geared towards customers and digital technology;
in Africa, the Group intends to take advantage of the continent’s strong potential for economic growth and bank account penetration by building on its position as one of the three international banks most present in Africa (leading bank in Côte d’Ivoire and Cameroon, leading privately-owned bank in Algeria, second-largest bank in Guinea and Senegal). In addition, it plans to accelerate its development by rolling out a wide range of digital initiatives and partnerships, in particular a pan-African mobile payment offer.
Financial Services to Corporates enjoys competitive positions with good profitability. ALD and Insurance also have dynamic growth potential. Moreover, all of these businesses have committed to proactive digital transformation and innovation programmes:
In Insurance, the Group will strive to accelerate (i) the roll-out of its bank insurance model across all retail banking markets and all segments (life insurance, personal protection and non-life insurance), and (ii) the implementation of its digital strategy, in particular to enhance the product range and customer experience, while diversifying its business models through a strategy of innovation and partnerships.
In Operational Vehicle Leasing and Fleet Management, the Group’s ambition is to enhance its leadership position (No. 1 in Europe and No. 3 in the world, excluding captive companies and financial leasing companies) by developing new activities and services in a rapidly changing mobility sector. In that respect, the Group floated ALD on the stock market (Euronext Paris) on 15th June 2017, selling 20.2% of the capital. The aim of this IPO was to enable ALD to increase its visibility and reputation in the mobility ecosystem, to access a new source of funding and to increase its ability to accelerate its development and to seize growth opportunities in business-to-business and business-to-consumer markets. The Group will remain the controlling shareholder of ALD and will continue to actively support its subsidiary’s growth strategy, regarding both the financing and development of commercial relations. During 2017, ALD finalised the acquisition of BBVA Autorenting, the seventh-largest Spanish company in operational vehicle leasing, with a fleet of 25,000 vehicles, and also strengthened its geographic coverage with the acquisition of the Irish company Merrion Fleet and the opening of a new subsidiary in Colombia.

1 I 3
A STRATEGY OF STRONGER, PROFITABLE AND SUSTAINABLE GROWTH, BASED ON A DIVERSIFIED AND INTEGRATED BANKING MODELKKEY FIGURES AND PROFIILE OF SOCIETE GENERAALE
12 I 2018 REGISTRATION DOCUMENT I S O C I E T E G E N E R AL E G R O U P
Lastly, in Vendor and Equipment Finance, the Group plans to build on its position as a leader in Europe and one of the first players worldwide in order to increase its revenues and improve profitability. The Group aims to become the global benchmark for vendors and customers by relying on an exemplary client-centric approach, innovation, product expertise and dedicated teams.
The Group will also continue to encourage synergies between the pillar’s businesses and with the rest of the Group: with Private Banking, with the regional Corporate and Investment Banking platforms, by developing its commercial banking services (trade finance, cash management, payment services and factoring).
GGlobal Banking and Investor Solutions is the third pillar of the GGroup’s diversified banking strategy.
Having developed its model and adapted to regulatory changes, Global Banking and Investor Solutions is well-positioned to strengthen its market share in its core franchises, despite a highly competitive environment.
The Group is a world leader in derivative products, with a leading position in derivatives and structured products, and solid positions in flow solutions.
In the Financing and Advisory businesses, Societe Generale has a solid customer base worldwide, along with in-depth expertise in structured financing and asset financing, and strong positions in investment banking and corporate finance in Europe. Lastly, in terms of Asset and Wealth Management, the Group will rely on an open architecture and build on Lyxor’s expertise and the development of passive management.
In 2018, the Group will continue to support and better serve its broad and diversified customer base (businesses, financial institutions, asset managers, public-sector entities, high net worth individuals) by offering high-added-value and tailored solutions at
the cutting edge of innovation and digitalisation. In particular, the Group plans to:
attract new customers in Europe, increase business with financial institutions and broaden its HNWI customer base in Europe;
invest in the financing of natural resources and structured financing, develop originate-to-distribute solutions, and support credit disintermediation in Europe by developing primary market activities;
consolidate its leading positions in Global Markets activities by developing its equity derivatives, structured product and bond distribution activities;
maintain its Global Transaction Banking leadership in France, and develop its presence, in Western Europe specifically;
be at the forefront of post-trade services by developing the custody and fund administration platform and Prime Services activities;
continue and strengthen the development of Private Banking and Lyxor in their core markets in Europe, and build on the open architecture culture.
At the same time, in line with its strategy of remaining closely focused on its customers’ requirements, while ensuring compliance with the new, more demanding regulatory environment, the Group will continue to prioritise the optimised consumption of scarce resources (capital and liquidity), together with cost control and strict risk management.
Drawing on the quality of its assets, its balanced, diversified and customer-oriented model, and the transformation efforts undertaken over the past several years, the Group is in a strong position to enter a new stage in its development and seize opportunities to generate stronger, profitable and sustainable growth.

1
Global Banking and Investor Solutions is the third pillar of the Group’s diversified banking strategy.
A STRATEGY OF STRONGER, PROFITABLE AND SUSTAINABLE GROWTH, BASED ON A DIVERSIFIED AND
INTEGRATED BANKING MODEL
3 I 1 KKEY FIGURES AND PROFIILE OF SOCIEETE GENERALE
S O C I E T E G E N E R AL E G R O U P I 2018 REGISTRATION DOCUMENT I 13
RECENT DEVELOPMENTS AND OUTLOOK The macroeconomic environment saw a gradual improvement in 2017. Activity recovered in the Eurozone, benefiting from less restrictive budgetary policies, consistently accommodative monetary conditions, and a moderate recovery in employment. In the United States, the economic boom that started more than eight years ago has continued, making it the third longest boom since 1945. Bolstered by the monetary policy, it is however characterised by weaker growth than in previous cycles, and by more restrained inflation. Lastly, emerging countries in 2017 confirmed the moderate recovery of their economies, with Chinese growth benefiting from budgetary support measures implemented during 2016, as well as consistently dynamic credit demand, whereas commodity-producing countries (Brazil, Russia, etc.) enjoyed stabilising exchange rates, a recovery in exports and a decline in inflation. This buoyant economic environment coincided with significant growth in stock market indices, whereas the political risk – which saw a sharp resurgence in 2016 – remained significant throughout the year.
This improvement is expected to continue in 2018, with accelerated growth in most major economic areas and more dynamic international trade flows. The markets should remain buoyant, although valuation levels raise the question of their long-term sustainability, and a certain volatility could resurface. Lastly, the central banks should continue the normalisation of their monetary policies, albeit more gradually.
In the Eurozone, growth should strengthen further in 2018, under the combined effect of the accommodative monetary and budgetary policies implemented, together with strong international demand. Moreover, the Eurozone still has untapped capacity. Underlying inflation should record only a modest recovery, leading the ECB to gradually withdraw its asset purchase and quantitative easing policy. Its key interest rates are not expected to increase before 2019. Although the environment should therefore remain buoyant, it will not however enable the significant resorption of public deficits. Furthermore, the euro level should be monitored so that it does not adversely affect the region’s export capacity. Growth in the United States should continue in 2018, supported by the tax reductions decided at the end of 2017, which should strengthen household consumption and corporate investments. Moreover, the Fed is expected to continue the very gradual normalisation of its monetary policy, and has announced three further increases in its key interest rate in 2018. In addition, the relative divergence in monetary policies between the Eurozone and the United States will be a source of potential risk.
In emerging countries, the recovery – moderate on the whole, but varying from region to region – is expected to continue in 2018. In China, the strategy for rebalancing growth and reducing financial risk (in particular that of debt) should resume with greater strength compared with 2017. However, the authorities will probably not renounce their target of doubling the GDP/inhabitant between 2010 and 2020. Commodity-producing countries could see a drop in commodity prices in 2018. Russian growth could be affected as a result, given the likely lack of support from the budgetary policy. In Brazil and India, growth in 2018 should be driven by the sharp rebounds in investment and consumption observed in 2017.
From a regulatory perspective, the past year was marked in particular by the important agreement of December 2017 within the Basel Committee, which finalises the cycle of Basel 3 reforms started after the financial crisis, regarding equity rules for banks, among other matters. The aim is to define and harmonise the risk-weighting rules with respect to the banks’ balance sheets. This agreement, the provisions of which will enter into effect gradually from 2022 to 2027 (they will also be transposed into European and domestic law), offers banks a stabilised regulatory framework that should improve confidence in the banking system.
For 2018, the regulatory agenda should focus on the European legislative process concerning the set of CRR2/CRD5 texts, as well as the finalisation and harmonisation of the various liability ratio requirements (MREL – Minimum Required Eligible Liabilities, and TLAC – Total Loss Absorbing Capacity).
The year 2018 will likely be marked by a highly uncertain geopolitical environment, following on from a certain number of events over the last two years. Important elections will be held in several European Union countries (in Italy, in particular), and the Brexit negotiations will continue. “Separatist” tensions (Catalonia) could further intensify. In addition, several areas of instability and tension could affect the global economy, whether in the Middle East or in Asia, with American policy currently being characterised by a certain unpredictability.
In Europe, provided that the political situation in Germany and in Italy becomes clearer, 2018 could signal a new impetus in European ambition.
Lastly, banks must continue to adapt to a certain number of fundamental shifts, especially the acceleration of technological changes, requiring them to radically transform their operational and relationship models.
Within this framework, and in order to generate stronger, profitable and sustainable growth, the Group’s priorities in 2018 will be to:
continue its growth by implementing a series of ambitious initiatives aimed at all its high-potential customers (corporates, professionals and high net worth customers, bank insurance, Boursorama, ALD, etc.), while developing segments and services tailored to their changing needs;
accelerate the digital transformation of all its businesses and functions, and in particular the digitalisation of its retail banking networks, both in France and abroad;
maintain strict control of its costs, risks and capital allocation;
continue its realignment via the disposal or closure of activities that do not have critical mass and/or do not generate synergies;
continue to implement its Culture and Conduct programme, which aims to develop the Societe Generale culture by placing values, leadership quality and behavioural integrity at the very heart of the Group’s transformation, thereby building confidence among all its stakeholders (and mainly its customers).

1 I 3
A STRATEGY OF STRONGER, PROFITABLE AND SUSTAINABLE GROWTH, BASED ON A DIVERSIFIED AND INTEGRATED BANKING MODELKKEY FIGURES AND PROFIILE OF SOCIETE GENERAALE
14 I 2018 REGISTRATION DOCUMENT I S O C I E T E G E N E R AL E G R O U P

1
A STRATEGY OF STRONGER, PROFITABLE AND SUSTAINABLE GROWTH, BASED ON A DIVERSIFIED AND
INTEGRATED BANKING MODEL
3 I 1KKEY FIGURES AND PROFIILE OF SOCIETE GENERAALE
S O C I E T E G E N E R AL E G R O U P I 2018 REGISTRATION DOCUMENT I 15
FRENCH RETAIL BANKING
38,000 employees
EUR 191 bn in outstanding loans
INTERNATIONAL RETAIL BANKING AND FINANCIAL SERVICES
73,000 employees
EUR 115 bn in outstanding loans
GLOBAL BANKING AND INVESTOR SOLUTIONS
21,000 employees
Assets under management (Lyxor and Private Banking): EUR 230 bn
Assets under custody: EEUR 3,904 bn
Outstanding loans: EEUR 135 bn

1 I 4 THE GROUP’S CORE BUSINESSES KKEY FIGURES AND PROFIILE OF SOCIETE GENERAALE
16 I 2018 REGISTRATION DOCUMENT I S O C I E T E G E N E R AL E G R O U P
4 . T H E G R O U P ’ S C O R E B U S I N E S S E S
KEY FIGURES FOR THE CORE BUSINESSES
French Retail Banking International Retail
Banking and Financial Services
Global Banking and Investor Solutions
2017 2016 2015 2017 2016 2015 2017 2016 2015
Number of employees (in thousands)(1)
38.3 38.8 39.3 72.6 72.6 73.3 20.8 20.5 21.7
Number of branches 2,869 2,990 3,085 3,377 3,583 3,735 n/s n/s n/s
Net banking income (in EUR M)
8,131 8,403 8,550 8,070 7,572 7,329 8,887 9,309 9,442
Group net income (in EUR M)
1,010 1,486 1,417 1,975 1,631 1,077 1,566 1,803 1,808
Gross book outstandings(2) (in EUR bn)
196.9 190.4 188.2 138.7 129.3 123.8 136.0 152.2 138.0
Net book outstandings(3) (in EUR bn)
191.4 184.8 182.6 115.1 107.8 104.5 134.6 149.3 134.9
Segment assets (in EUR bn)(4)
226.3 218.0 219.4 306.2 277.6 260.9 625.9 757.1 733.9
Average allocated capital (regulatory)(5) (in EUR M)
11,081 10,620 9,750 11,165 10,717 9,572 14,442 15,181 14,660
(1) Headcount at end of period excluding temporary staff.
(2) Customer loans, deposits and loans due from banks, lease financing and similar agreements and operating leases. Excluding repurchase agreements. Excluding entities that are reclassified under IFRS 5.
(3) Net book outstandings, excluding operating leases.
(4) Segment assets included in Note 8.1 of the Consolidated Financial Statements (segment reporting).
(5) 2017 and 2016: average allocated capital calculated on 11% of risk-weighted assets; 2015: data as published in the respective financial year (average allocated capital calculated on 10% of RWAs).
OPERATING INCOME FROM BUSINESSES (IN EUR BN)
11.522.211.9
33.211.811.7
22.2
22.122.4
66.96.16.0
220172201622014
Global Banking andInvestor Solutions
International RetailBanking andFinancial Services
French RetailBanking
Total CoreBusinesses

1
THE GROUP’S CORE BUSINESSES
4 I 1KKEY FIGURES AND PROFIILE OF SOCIETE GGENERALE
S O C I E T E G E N E R AL E G R O U P I 2018 REGISTRATION DOCUMENT I 17
FRENCH RETAIL BANKING French Retail Banking offers a wide range of products and services suited to the needs of a diversified base of individual and professional customers, businesses, non-profit associations and local authorities.
Drawing on the expertise of a team of nearly 33,200 professionals(1), an efficient multi-channel distribution system, including nearly 2,900 branches, the pooling of best practices, and the optimisation and simplification of processes, French Retail Banking combines the strengths of three complementary brands: Societe Generale, the renowned national bank; Crédit du Nord, a group of regional banks; and Boursorama Banque, a major online bank. These networks are backed by Global Transaction and Payment Services (GTPS) for the management of flows and domestic and international payments.
At the end of October 2017, through its three brands, the Societe Generale Group had built up solid positions in the French individual customer deposit and loan market (with market share of more than 7.4% and 7.6% respectively(2)), and in non-financial business customer deposits (with market share of about 12.3% and 7.1% respectively).
The Retail Banking networks are innovating to build the relationship-focused banking group of tomorrow. French Retail Banking excels in its:
recognised customer service;
leading position in online and mobile banking in France;
sales momentum;
continual adaptation to its customers’ needs and expectations.
French Retail Banking not only strives to improve customer satisfaction across all segments, but also to further develop value-added services and support businesses with their expansion in France and worldwide. It capitalises on synergies with the specialised business lines, particularly with Insurance, Private Banking and Corporate and Investment Banking. For example, French Retail Banking distributes insurance products from Sogecap and Sogessur, subsidiaries operating within the International Retail Banking and Financial Services division.
Life insurance outstandings amounted to EUR 92.0 billion at the end of 2017, compared with EUR 90.2 billion at the end of 2016.
LOANS AND DEPOSITS (IN EUR BN)*
* Average quarterly outstandings.
The networks continue to support the economy and help their customers finance their projects, with growth in average outstanding loans from EUR 183 billion in 2016 to EUR 186 billion in 2017. At the same time, and amid rife competition for savings inflows, dynamic deposit inflows led to a loan-to-deposit ratio of 95% in 2017, versus 100% one year earlier.
Societe Generale Network
The Societe Generale Network offers solutions tailored to the needs of its individual customers and nearly 450,000 professional customers, non-profit associations and business customers trusting it with their business, drawing on three major strengths:
nearly 22,700 employees(3) and 2,018 branches located mainly in urban areas where a large portion of national wealth is concentrated;
a full and diversified range of products and services, from savings vehicles to asset management solutions, including corporate finance and payment instruments;
a comprehensive and innovative omnichannel system: Internet, mobile, telephone and service platforms.
(1) Headcount in full-time equivalents. (2) At end-October 2017, sources: Societe Generale calculations, Banque de France. (3) Including IT and network central offices.
“2018 Customer Service award in the Banks category” granted by Viseo Customer Insight, October 2017
2015 2016 2017Loans Deposits Loan/deposit ratio
104%100% 95%
178
170
183 183 186
195
1 I 4
THE GROUP’S CORE BUSINESSES KKEY FIGURES AND PROFIILE OF SOCIETE GENERAALE
18 I 2018 REGISTRATION DOCUMENT I S O C I E T E G E N E R AL E G R O U P
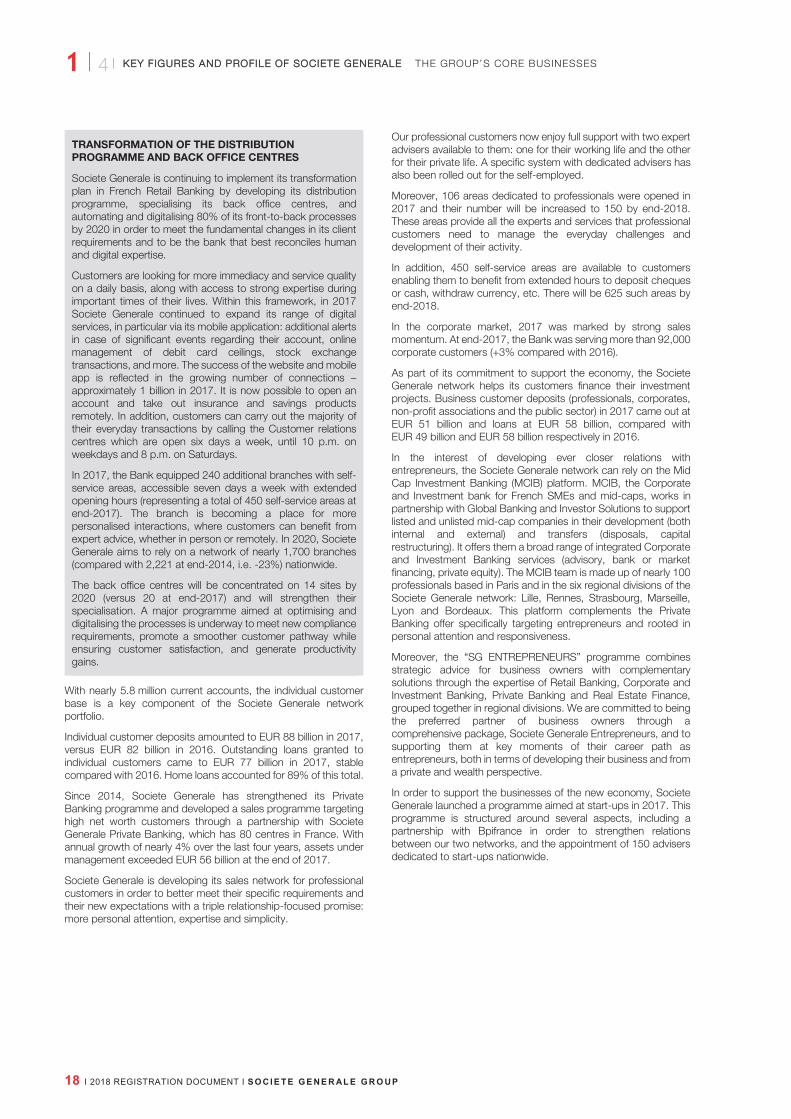
TRANSFORMATION OF THE DISTRIBUTION PROGRAMME AND BACK OFFICE CENTRES
Societe Generale is continuing to implement its transformation plan in French Retail Banking by developing its distribution programme, specialising its back office centres, and automating and digitalising 80% of its front-to-back processes by 2020 in order to meet the fundamental changes in its client requirements and to be the bank that best reconciles human and digital expertise.
Customers are looking for more immediacy and service quality on a daily basis, along with access to strong expertise during important times of their lives. Within this framework, in 2017 Societe Generale continued to expand its range of digital services, in particular via its mobile application: additional alerts in case of significant events regarding their account, online management of debit card ceilings, stock exchange transactions, and more. The success of the website and mobile app is reflected in the growing number of connections – approximately 1 billion in 2017. It is now possible to open an account and take out insurance and savings products remotely. In addition, customers can carry out the majority of their everyday transactions by calling the Customer relations centres which are open six days a week, until 10 p.m. on weekdays and 8 p.m. on Saturdays.
In 2017, the Bank equipped 240 additional branches with self-service areas, accessible seven days a week with extended opening hours (representing a total of 450 self-service areas at end-2017). The branch is becoming a place for more personalised interactions, where customers can benefit from expert advice, whether in person or remotely. In 2020, Societe Generale aims to rely on a network of nearly 1,700 branches (compared with 2,221 at end-2014, i.e. -23%) nationwide.
The back office centres will be concentrated on 14 sites by 2020 (versus 20 at end-2017) and will strengthen their specialisation. A major programme aimed at optimising and digitalising the processes is underway to meet new compliance requirements, promote a smoother customer pathway while ensuring customer satisfaction, and generate productivity gains.
With nearly 5.8 million current accounts, the individual customer base is a key component of the Societe Generale network portfolio.
Individual customer deposits amounted to EUR 88 billion in 2017, versus EUR 82 billion in 2016. Outstanding loans granted to individual customers came to EUR 77 billion in 2017, stable compared with 2016. Home loans accounted for 89% of this total.
Since 2014, Societe Generale has strengthened its Private Banking programme and developed a sales programme targeting high net worth customers through a partnership with Societe Generale Private Banking, which has 80 centres in France. With annual growth of nearly 4% over the last four years, assets under management exceeded EUR 56 billion at the end of 2017.
Societe Generale is developing its sales network for professional customers in order to better meet their specific requirements and their new expectations with a triple relationship-focused promise: more personal attention, expertise and simplicity.
Our professional customers now enjoy full support with two expert advisers available to them: one for their working life and the other for their private life. A specific system with dedicated advisers has also been rolled out for the self-employed.
Moreover, 106 areas dedicated to professionals were opened in 2017 and their number will be increased to 150 by end-2018. These areas provide all the experts and services that professional customers need to manage the everyday challenges and development of their activity.
In addition, 450 self-service areas are available to customers enabling them to benefit from extended hours to deposit cheques or cash, withdraw currency, etc. There will be 625 such areas by end-2018.
In the corporate market, 2017 was marked by strong sales momentum. At end-2017, the Bank was serving more than 92,000 corporate customers (+3% compared with 2016).
As part of its commitment to support the economy, the Societe Generale network helps its customers finance their investment projects. Business customer deposits (professionals, corporates, non-profit associations and the public sector) in 2017 came out at EUR 51 billion and loans at EUR 58 billion, compared with EUR 49 billion and EUR 58 billion respectively in 2016.
In the interest of developing ever closer relations with entrepreneurs, the Societe Generale network can rely on the Mid Cap Investment Banking (MCIB) platform. MCIB, the Corporate and Investment bank for French SMEs and mid-caps, works in partnership with Global Banking and Investor Solutions to support listed and unlisted mid-cap companies in their development (both internal and external) and transfers (disposals, capital restructuring). It offers them a broad range of integrated Corporate and Investment Banking services (advisory, bank or market financing, private equity). The MCIB team is made up of nearly 100 professionals based in Paris and in the six regional divisions of the Societe Generale network: Lille, Rennes, Strasbourg, Marseille, Lyon and Bordeaux. This platform complements the Private Banking offer specifically targeting entrepreneurs and rooted in personal attention and responsiveness.
Moreover, the “SG ENTREPRENEURS” programme combines strategic advice for business owners with complementary solutions through the expertise of Retail Banking, Corporate and Investment Banking, Private Banking and Real Estate Finance, grouped together in regional divisions. We are committed to being the preferred partner of business owners through a comprehensive package, Societe Generale Entrepreneurs, and to supporting them at key moments of their career path as entrepreneurs, both in terms of developing their business and from a private and wealth perspective.
In order to support the businesses of the new economy, Societe Generale launched a programme aimed at start-ups in 2017. This programme is structured around several aspects, including a partnership with Bpifrance in order to strengthen relations between our two networks, and the appointment of 150 advisers dedicated to start-ups nationwide.

1
THE GROUP’S CORE BUSINESSES
4 I 1KKEY FIGURES AND PROFIILE OF SOCIETE GGENERALE
S O C I E T E G E N E R AL E G R O U P I 2018 REGISTRATION DOCUMENT I 19
Crédit du Nord Network
Source: CSA 2017 competitive barometer conducted with the customers of 11 major French banking groups.
The Crédit du Nord Group consists of eight regional banks (Courtois, Kolb, Laydernier, Nuger, Rhône-Alpes, Société Marseillaise de Crédit, Tarneaud and Crédit du Nord) and an investment services provider, brokerage firm Gilbert Dupont, specialised in the mid-caps segment. It develops a close relationship with its customers based on expertise, innovation and satisfaction. Its customers enjoy the advantages of both a regional bank and a national and international group.
With in-depth knowledge of the local economic market, the Group’s banks are structured as veritable SMEs with considerable autonomy in managing their business. As such, they are able to make quick decisions and expediently respond to customer requests.
The excellent quality of the relationships built every day by the banks in this network, which are based on personal attention and advisory services, is reflected in the competition surveys. Those conducted by CSA with the customers of major French banking groups(1) this year gave the Crédit du Nord Group a joint first on the individual and corporate customers market. It ranks second on the professional customers market. The Crédit du Nord Group banks also won three prizes as part of the Meilleurebanque.com Banking Quality Awards, among the 17 banking groups on the panel: Crédit du Nord is ranked first in the “Website” category; second in the “Project adviser” category, and third in the “Daily adviser” category.
Nearly 7,700 Crédit du Nord Group employees and a network of 851 branches are on hand to serve over 2.5 million individual customers, 305,000 professional customers and non-profit associations, 50,000 corporates and 5,700 institutional customers.
On average in 2017, Crédit du Nord’s outstanding deposits totalled EUR 42.8 billion (vs. EUR 39.9 billion in 2016) and outstanding loans amounted to EUR 39.8 billion (vs. EUR 37.8 billion in 2016).
Boursorama
Les Dossiers de l’Epargne – 2018 Edition
A wholly-owned subsidiary of Societe Generale, Boursorama, created in 1995, is a pioneer and leader in its three main activities in France: online banking, online brokerage and online financial information with boursorama.com, the leading portal for economic and stock market news.
With more than 1,250,000 customers at end-2017, the acceleration of client acquisition continues, in keeping with the target of reaching more than 2 million customers in France by 2020.
From the device of their choice, Boursorama customers can access a range of banking products and services that:
is comprehensive (conventional banking products – debit card, savings accounts, mortgage loans, personal loans – and investment products such as UCITS and life insurance vehicles, including the full range of products for investing in the markets (equities, trackers, warrants, certificates, turbos, SRD – deferred settlement service –, CFDs, Forex);
is innovative (customers can open an account online in just a few clicks; exclusive money management tools available in their personal banking space, which also offers a free account consolidation and management service, including accounts held with other banks);
offers low and transparent fees (Boursorama Banque was named “Least Expensive Bank in France” for the ninth consecutive year — Le Monde Argent, February 2017); and
is available and safe (advisers available until 10 p.m., secure transactions, SMS alerts, etc.).
In 2017, Boursorama expanded its range of products and services by launching offers intended for professionals, and for children of 12-17 years. The boursorama.com portal also offers a new design and new features to facilitate analyses and decision-making. Accordingly, individual investors and shareholders can place their orders more quickly and effectively.
The Boursorama Group is also present in Spain (online brokerage and banking) through the SelfTrade brand (www.selftrade.es).
Global Transaction & Payment Services
Euromoney Magazine –2017 Global Awards for Excellence
Global Finance Magazine – Trade Finance and Supply Chain Finance Awards 2017
EMEA Finance Magazine Treasury Services Awards 2017
FImetrix Finance Awards 2017
Part of the Group’s French Retail Banking division, Global Transaction and Payment Services (GTPS) is Societe Generale’s payment and flow banking specialist, serving all the Group’s distribution networks and their customers.
Operating commercially in more than 50 countries, GTPS targets all types of customers, including individuals, professionals, non-profit associations, businesses and financial institutions.
(1) CSA 2017 competitive barometer conducted with the customers of 11 major French banking groups.
No. 1 CLIENT SATISFACTION
PRIVATE INDIVIDUAL AND
CORPORATE MARKET
No. 2 CLIENT SATISFACTION
PROFESSIONAL MARKET

1 I 4
THE GROUP’S CORE BUSINESSES KKEY FIGURES AND PROFIILE OF SOCIETE GENERAALE
20 I 2018 REGISTRATION DOCUMENT I S O C I E T E G E N E R AL E G R O U P
With nearly 2,000 employees, GTPS is structured around two activities:
Global Transaction Banking (GTB) is responsible for marketing services intended to facilitate, in France and worldwide, the daily transactional activities of major economic and financial players: financial institutions, large and mid-cap companies with international business, and multinational companies. GTB groups together five businesses of the transaction bank:
– cash management;
– trade finance;
– correspondent banking;
– supply chain finance;
– foreign exchange services associated with these activities.
The expertise of the GTB teams is regularly rewarded: GTB was named “Best cash management services in the
EMEA region” (EMEA Finance, 2017), “Best international trade finance provider in Western Europe” (Global Finance, 2016), “Best factoring institution in the EMEA region” (EMEA Finance, 2016) and “Distinguished Provider of Transaction Banking Services” (FImetrix, 2016);
Global Payment Services (GPS) also provides internal services, which cover the development of products and the processing of transactions for the Group's different distribution networks. It groups together the development of payment and cash management solutions, banking solution engineering (management of projects and developments in the processing system), flow management and transaction processing.
This business was included within Global Banking and Investor Solutions on 1st January 2018.
Western Europe
Czech Republic

1
THE GROUP’S CORE BUSINESSES
4 I 1 KKEY FIGURES AND PROFIILE OF SOCIETE GGENERALE
S O C I E T E G E N E R AL E G R O U P I 2018 REGISTRATION DOCUMENT I 21
INTERNATIONAL RETAIL BANKING AND FINANCIAL SERVICES
LOAN OUTSTANDINGS (IN EUR BN)
DEPOSIT OUTSTANDINGS (IN EUR BN)
* Excluding factoring.
International Retail Banking and Financial Services (IBFS) combines:
International Retail Banking activities, divided into three Business Units: Europe, Russia and AFMO (Africa, Mediterranean Basin and Overseas France);
and three specialised businesses: Insurance, Operational Vehicle Leasing and Fleet Management, and Vendor and Equipment Finance.
Through this pillar, the Group’s ambition is to better serve all its individual and corporate customers, by adapting to changes in the economic and social environments and supporting the international growth of the Group’s customers by drawing on the strength of its network in fast-growing regions. IBFS bases its strategy on the relationship-focused universal banking model, the enhancement of its customer base through an extended range of products, and the distribution and pooling of expertise aimed at improving revenues while continually seeking to optimise risk management and the allocation of scarce resources.
With almost 73,000 employees(1) and commercial operations in 67 countries, IBFS is dedicated to offering a wide range of products and services to its clients (individuals, professionals and corporates).
Boasting a complementary range of expertise, IBFS enjoys solid and recognised positions in its different markets.
International Retail Banking International Retail Banking combines the services of the international banking networks and consumer finance activities. These networks are forging ahead with their growth policy and
currently hold leading positions in their various regions of operation, such as Europe, Russia, the Mediterranean Basin and Sub-Saharan Africa. They help finance the economies in their different regions of development. In this way, the Group will continue to support the development of its activities through these high-potential geographic regions.
EUROPE In WWestern Europe, where the Group is established in France, Germany and Italy, predominantly in consumer finance and car finance activities, outstanding loans grew by 15% in 2017 to EUR 18.2 billion, mainly due to the strong growth on car finance markets.
In CCzech Republic, of balance sheet size, with outstanding loans of EUR 23.7 billion, 386 branches and 8,249 employees (FTE) as of December 2017. KB, which was created in 1990 and became a subsidiary of Societe Generale in 2001, has developed its universal banking activities for individual customers (including in particular the complete overhaul of its everyday banking offer) and expanded its traditionally significant presence among corporate customers and municipalities. The KB Group also offers a range of products intended for individual customers with ESSOX (consumer loans and car financing), Modra Pyramida (mortgage facilities), as well as a range developed in collaboration with Private Banking. In 2017, KB received the “Best Bank” award from the prestigious advisory consultant company Fincentrum.
(1) Headcount at end of period excluding temporary staff.
220.1119.2118.2
99.499.177.9
110.6111.7111.5
66.566.366.1
223.7221.7220.0
118.2115.8
114.3
117.1116.5
115.5 888.6883.9
777.8
220172201622015
o.w. EquipementFinance(1)
o.w. sub-totalInternational RetailBankingWestern Europe(Consumer finance)
Czech Republic
Romania
Other Europe
Russia
Africa et other 119.5119.2118.0
99.377.266.4
99.7111.7111.0
99.599.399.1
229.8225.9224.8
11.911.8
11.7
00.911.0
11.3779.8
775.2771.0
220172201622015

1 I 4
THE GROUP’S CORE BUSINESSES KKEY FIGURES AND PROFIILE OF SOCIETE GENERAALE
22 I 2018 REGISTRATION DOCUMENT I S O C I E T E G E N E R AL E G R O U P
In RRomania, BRD is the leading privately-owned banking network in the country, with 760 branches, and the No. 3 bank in terms of balance sheet size, with market share of approximately 14% in deposits and 13% in loans as of September 2017. The Societe Generale Group became BRD’s main shareholder in 1999. The BRD Group’s activity is divided into three major business lines: Retail Banking (individual and professional customers, SMEs), Corporate and Investment Banking, and Consumer Finance with BRD Finance. The bank was awarded, for the fourth consecutive year, “Safest Bank in Romania” by Global Finance magazine.
Societe Generale also operates in eight other European countries, mainly in the Balkans and in Poland, where it is a major regional player. Outstanding loans and deposits totalled respectively EUR 10.6 billion and EUR 9.7 billion. In Slovenia, Moldova, Montenegro and Macedonia, SKB Banka, Mobiasbanca, Societe Generale Montenegro and Ohridska Banka were rewarded several times in 2017 in their respective countries by The Banker and Euromoney.
In 2017, Societe Generale finalised the 100% disposal of Splitska Banka, its Croatian subsidiary.
RUSSIA The Group is developing its universal banking model and has established itself as the No. 2 banking group financed with foreign capital in Russia based on balance sheet size, with outstanding loans and deposits reaching respectively EUR 9.4 billion and EUR 9.3 billion at the end of 2017. Societe Generale operates in Russia through several banking entities covering the different individual and corporate customer markets: Rosbank, Rusfinance and DeltaCredit entities.
The transformation of the Group in Russia is an ongoing process, with each entity handling its specific area of expertise: DeltaCredit is specialised in home loans, Rusfinance Bank in car loans, and Rosbank is continuing to roll out a more “everyday banking”-oriented range of products and services. Regarding its corporate customers, the Group continues to focus on financing and investment activities (in partnership with SG CIB), targeting Russian and multi-national large corporates in particular, while gradually expanding its target client base. At the same time, operational efficiency and risk reduction continue to be a primary focus.
Furthermore, the Group operates in Russia through other consolidated entities in the Insurance activity (Societe Generale Insurance) and in corporate financial services.
AFRICA, MEDITERRANEAN BASIN AND OVERSEAS FRANCE In AAfrica, Societe Generale is continuing its commitment and contribution to the development of the banking and financial system through its operations in 19 countries. The Group plans to draw on the region’s potential for economic growth and bank account penetration (today’s rates being below 20% in many African countries) to speed up its development across the continent.
In the MMediterranean Basin, the Group is mainly present in Morocco (since 1913), Algeria (since 1999), and Tunisia (since 2002). Overall, this set-up covers 753 branches with more than 2 million customers. At 31st December 2017, outstanding deposits came to EUR 9.1 billion and outstanding loans to EUR 10.4 billion.
In SSub--SSaharan Africa, the Group has a historic presence in 16 countries, with solid local positions, particularly in Côte d’Ivoire (leader in loans and deposits), Senegal (No. 2 in loans and deposits), and Cameroon (No. 2 in loans and in deposits). In 2017, the region experienced a considerable increase in outstanding loans to EUR 5.5 billion (+17%) and deposits to EUR 6.6 billion (+7%). For the third year in a row, Societe Generale was granted the “Best Bank” and “Best Investment Bank” awards in Cameroon, as well as “Best International Bank”, “Best Investment Bank of international banks” and “Best asset manager” in Morocco by EMEA Finance magazine. Societe Generale subsidiaries in Algeria, Cameroon, Côte d’Ivoire, Senegal and Tunisia were granted the title “Best International Trade Finance Bank” by Global Finance.
In OOverseas FFrance, the Group is established in Reunion and Mayotte, the In West Indies (Martinique, Guadeloupe), Guiana, French Polynesia and New Caledonia, where it has been present for more than 40 years. In these regions, Societe Generale offers the same services as available in mainland France for individual and corporate customers.
Insurance (Societe Generale Insurance) Societe Generale Group’s Insurance business covers the needs of individual, professional and corporate customers for life insurance investment solutions, personal protection, and property and casualty insurance.
The business employs more than 2,400 people(1).
Based on an integrated bank insurance model, the life and non-life insurance companies of Societe Generale Insurance offer the Group’s networks, in France and abroad, a full range of insurance products and services in eight product categories: life insurance investment solutions, retirement savings, and personal protection, health, credit life, group life, property and casualty, and other insurance.
In 2017, Societe Generale Insurance forged ahead with the growth of its activities while enriching the services offered to policyholders. Furthermore, the diversification of Societe Generale Insurance’s business mix picked up speed with the development of the share of unit-linked funds in life insurance investment solutions and the development of personal protection and property and casualty insurance.
The Group’s integrated bank insurance model was consolidated by the acquisition, on 1st April 2017, of the majority interest held by Aviva France in Antarius, the life insurance company dedicated to the Crédit du Nord networks.
(1) Headcount at end of period excluding temporary staff.

1
Romania
Africa
Mediterranean Basin
Sub-Saharan Africa
Overseas France
THE GROUP’S CORE BUSINESSES
4 I 1 KKEY FIGURES AND PROFIILE OF SOCIETE GGENERALE
S O C I E T E G E N E R AL E G R O U P I 2018 REGISTRATION DOCUMENT I 23
At the end of 2017, Societe Generale Insurance’s outstandings in life insurance investment solutions rose by +2% and by +16% including Antarius’ life insurance outstandings to reach EUR 114 billion; the share of unit-linked outstandings amounted to 26%, compared with 23% in 2016. In personal protection and property and casualty insurance, revenue was up by 9% compared with 2016.
In 2017, Societe Generale Insurance accelerated the digital transformation of its bank insurance model by favouring the development of innovative products to increase its clients’ satisfaction. In France, Sogessur rolled out the digital signature for the subscription of car insurance and property insurance policies. In Romania, BRD Asigurari de Viata launched My Medcare, an individual health insurance offer, flexible and innovative, distributed by BRD.
In life insurance investment solutions, Societe Generale Insurance enriched its range by offering a Private Equity fund within Sogecap’s policies, and an offer of structured products for Antarius policies.
Societe Generale Insurance also continued the diversification of its business model, in synergy with the Group’s other businesses, such as ALD and Boursorama, as well as with external partners to test new markets and new offers. The consolidation of the partnership with Boursorama led to the launch of Carapass at the end of 2017, a connected car insurance offer with usage-based pricing and a fully online subscription process.
The organisational transformation of Societe Generale Insurance, carried out in May 2017, is focused on clients and innovation, and aligned with the new organisation of the Societe Generale Group.
Financial Services to Corporates
OPERATIONAL VEHICLE LEASING AND FLEET MANAGEMENT (ALD AUTOMOTIVE) ALD Automotive offers mobility solutions centred on operational vehicle leasing and fleet management for businesses of all sizes in both local and international markets, as well as for private individuals. This activity combines the financial benefits of operational leasing with a complete range of high-quality services, including in particular maintenance, tyre management, fuel consumption, insurance and vehicle replacement. The ALD Automotive Group employs more than 6,300 people.
ALD Automotive has the largest geographical coverage of any leasing company (43 countries), and manages more than 1.5 million vehicles. It has unique knowledge of emerging markets and has established partnerships with Wheels in North America, FleetPartners in Australia and New Zealand, Absa in South Africa, AutoCorp in Argentina, and
Arrend Leasing in Central America. Thanks to new partnerships and targeted acquisitions, in particular that of BBVA (Autorenting) & Merrion Fleet, both acquired in 2017, ALD Automotive is strengthening its customer base in SMEs and accelerating its growth in Europe. The business now holds the No. 1 position in Europe in multi-brand operational vehicle leasing and fleet management, and the second position worldwide.
A pioneer in mobility solutions, ALD Automotive is constantly innovating in order to provide the best support to its customers, fleet managers and drivers, with an offer tailored to their needs. This strategy was recognised once again in 2017: for the tenth year in a row, ALD Automotive France won the “2018 Customer Service” award on the operational vehicle leasing market (Inference Operations-Viséo CI survey conducted from May to July 2017).
In June 2017, Societe Generale successfully floated a stake of 20.18% in its subsidiary ALD on the stock market. This strategic operation will enable ALD Automotive to accelerate its growth, through new sales channels and partnerships in particular, while continuing to develop important commercial synergies with the rest of the Group. ALD Automotive will continue to benefit from the Group’s financing capacity.
VENDOR AND EQUIPMENT FINANCE (SGEF) Societe Generale Equipment Finance is specialised in vendor and professional equipment finance. This business is conducted through partnership agreements with vendors (professional equipment manufacturers and distributors), banking networks and also directly. Societe Generale Equipment Finance develops its expertise in three major sectors: transport, industrial equipment and high-tech.
As a leading company in Europe, SGEF operates in 36 countries, employs over 2,000 people(1), and manages a portfolio of EUR 17.8 billion in outstandings. It has a broadly diverse customer base, ranging from large international companies to SMEs, to which it offers a varied range of products (financial leasing, loans, leasing, purchase of receivables, etc.) and services (insurance, truck leasing with services).
Regularly recognised by the leasing industry, Societe Generale Equipment Finance was named “SME Champion - Europe” and “Vendor Finance Provider of the Year” at the Leasing Life Awards held on 30th November 2017 in Amsterdam.
(1) Headcount at end of period excluding temporary staff.

1 I 4
THE GROUP’S CORE BUSINESSES KKEY FIGURES AND PROFIILE OF SOCIETE GENERAALE
24 I 2018 REGISTRATION DOCUMENT I S O C I E T E G E N E R AL E G R O U P
GLOBAL BANKING AND INVESTOR SOLUTIONS The purpose of Global Banking and Investor Solutions (GBIS) is to provide corporate and investment banking, asset management, private banking and securities services around the world to a select customer base of businesses, financial institutions, investors, wealth managers and family offices, and private clients.
At the hub of economic flows between issuers and investors, the GBIS division supports its customers over the long term, offering them a variety of services and integrated solutions tailored to their specific needs.
GBIS employs around 18,000 people* in 37 countries, with operations in more than 50 countries.
Corporate and Investment Banking, Securities Services These activities group together two commercial brands: Societe Generale Corporate and Investment Banking (SG CIB) and Societe Generale Securities Services (SGSS). With a presence across 35 countries, the brands operate in the main financial markets of the Group’s regions of operation, with extensive European coverage and representative offices in Central and Eastern Europe, the Middle East, Africa, the Americas and the Asia-Pacific region. They offer their customers bespoke financial solutions combining innovation, advisory services and quality performance in four areas of expertise: investment banking, financing, market activities and investor services.
They offer issuers (large corporates, financial institutions, sovereigns and the public sector) strategic advice on their development as well as market access to finance this development and hedge their risks. They also offer services for investors managing savings according to set risk/return targets. Whether they are asset managers, pension funds, family offices, hedge funds, sovereign funds, public agencies, private banks, insurance companies or distributors, the Bank provides comprehensive access to the fixed income, credit, foreign exchange, commodity and equity markets along with a range of unique cross-asset solutions and advisory services, drawing on leading research expertise. This offer is completed by a full range of investor services.
The Group’s ambition is to be among the leading Eurozone corporate and investment banks, adopting a model balanced between businesses and regions, while at the same time continuing to transform this model in order to improve its operational efficiency and risk profile, with the main objective of always offering the best customer service.
In order to strengthen its positions and facilitate cross-selling, the division is divided into two businesses:
GGlobal Markets and Investor Services combines in a worldwide platform Global Markets, offering a multi-product view and optimised cross-asset solutions, and Investor Services;
FFinancing and Advisory manages and develops global relations with strategic Corporate and Investment Banking clients, mergers & acquisitions advisory services, other corporate finance advisory services, and finance activities (structured financing, fund-raising (debt or equity), financial engineering and hedging solutions for issuers).
GLOBAL MARKETS AND INVESTOR SERVICES The GGlobal Markets and Investor Services (GMIS) division continues to develop a unique capital markets offering for its customers combining “Fixed Income, Credit, Currencies and Commodities”, “Equities”, “Prime Services” and “Securities Services” departments. As such, the division combines the strength of a leading financial institution with the customer-oriented approach of a broker positioned as a market leader in its activities. In 2017, Societe Generale won the prestigious “Risk Solutions House of the Year” (Risk Awards) and “Europe House of the Year” awards (Structured Products Europe Awards) in recognition of the excellence of its products and services. Global Capital also named SG CIB “Corporate Solutions Provider of the Year”.
To assist its customers in today’s web of increasingly interconnected financial markets, experts (financial engineers, salespeople, traders and specialist advisors) are therefore able to rely on a unique global platform to offer bespoke solutions designed to meet the specific needs and risks of each customer.
FIXED INCOME, CURRENCIES AND COMMODITIES
Fixed income, currencies and commodities (FICC) activities cover a comprehensive range of products and services ensuring the liquidity, pricing and hedging of risks related to the fixed income, credit, forex and commodity activities of SG CIB clients.
Fixed income, currencies and credit: teams based in London, Paris, Madrid and Milan, as well as the United States and the Asia-Pacific region, offer a wide range of flow and derivative products. Covering a variety of underlyings (forex products, private and sovereign bonds, emerging or very liquid markets, cash or derivatives), they provide their customers with high-quality research, solutions tailored to asset and liability management requirements, in addition to risk management and revenue optimisation requirements, and are also recognised on a regular basis(1). In 2017, SG CIB was also named “Most Innovative Investment Bank for FICC Trading” by The Banker and “FICC House of the Year” by Structured Products Europe Awards.
Commodities: with more than 20 years of experience, SG CIB is a major player on the energy and metals markets, and has developed an agricultural commodities offer targeting producers. SG CIB works alongside businesses and institutional investors, providing them with hedging and investment solutions. In commodities, SG CIB maintains its leading position in the Risk & Energy Risk Commodity 2017 rankings(2).
* Full-time equivalent (FTE) headcount at end of period excluding temporary staff. (1) “Best House Interest Rates” and “Best House Credit” by SRP Europe 2017; “#1 France Corporates” by Euromoney FX survey 2017. (2) “#1 Best Overall Dealer” and “#1 Best Research Overall”.

1
Global Markets and Investor Services
Financing and Advisory
Global Markets and Investor Services
THE GROUP’S CORE BUSINESSES
4 I 1 KKEY FIGURES AND PROFIILE OF SOCIETE GENERAALE
S O C I E T E G E N E R AL E G R O U P I 2018 REGISTRATION DOCUMENT I 25
EQUITIES
Thanks to its historic presence on all of the world’s major primary and secondary equity markets and its strong innovation culture, SG CIB is a leader in a comprehensive range of varied solutions covering all cash, derivative and equity research activities. The Equity department is one of the Group’s areas of excellence. For several years, its expertise has been recognised by the industry and its clients. Accordingly, Societe Generale was named “Equity Derivatives House of the Year” (Risk Awards) along with “Best House Equities in Europe” (SRP) in 2017.
Moreover, Societe Generale’s research simplifies the interpretation of market trends, which are subsequently used to develop market strategies, and are regularly acknowledged(1).
PRIME SERVICES
The Prime Services department was created in 2015 following the Group purchase in May 2014 of Credit Agricole’s 50% stake in Newedge.
This business combines clearing activities, prime brokerage and electronic and semi-electronic execution services.
Prime Services proposes a range of expertise that offers global access to a complete cross-asset service in cash and listed derivative instruments. The department provides a single point of access to 130 worldwide markets and execution venues with a state-of-the-art follow-the-sun service making it possible to meet customer requirements at all times. This approach was applauded by the industry several times, notably with the title “Best Global Multi-Asset Prime Brokerage” awarded by The Hedge Fund Journal and “Prime Broker of the Year” by Global Investor Awards in 2017.
SECURITIES SERVICES
Societe Generale Securities Services (SGSS) offers a comprehensive range of cutting-edge services following the latest trends in the financial markets as well as regulatory changes, including the following:
a market-leading clearing service range;
the custody and depository bank activity, covering all asset classes;
fund administration services for managers of complex financial products;
issuer services, comprising primarily the administration of stock option plans, employee shareholding, etc;
liquidity management services (cash and securities);
transfer agent activities, providing a full range of services, from support to fund distribution.
With EUR 3,904 billion in assets under custody at 31st December 2017 (versus EUR 3,955 billion at 31st December 2016), SGSS ranks second among European custodians. It also offers custodian services to more than 3,400 mutual funds and provides valuation services for more than 4,000 mutual funds totalling EUR 651 billion in assets under management in Europe (vs. EUR 602 billion at 31st December 2016).
In 2017, SGSS was named “Real Estate Fund Administrator of the Year” by Global Investor Awards and “Transfer agent of the year” by Custody Risk Global Awards.
FINANCING AND ADVISORY This division combines Coverage and Investment Banking and Global Finance activities.
The Coverage and Investment Banking teams offer their customers, which include businesses, financial institutions and the public sector, an integrated, comprehensive and tailored approach based on:
extensive strategic advisory services, covering mergers and acquisitions and IPO structuring, as well as the secondary offering of shares. SG CIB holds a leading position in the equity capital and equity-related markets, and also in euro-denominated issues for corporate and financial institutions(2). This division received several awards in 2017, notably that of “Overall Most Impressive Bank of Corporate DCM” from Global Capital Bond Awards, and “Most Innovative Equity Linked-House” from The Banker;
access to optimised fund-raising solutions through the joint venture with the Global Finance and Retail Banking teams.
The Global Finance teams rely on global expertise and sector knowledge to provide issuers with a comprehensive offering and integrated solutions in three key areas: fund-raising, structured financing and strategic hedging of interest rate, foreign exchange, inflation and commodity risks.
The fund-raising (debt) solutions offered by the Group are made possible by its ability to offer issuers access to all of the global markets and to create innovative strategic financing and acquisition or LBO financing solutions.
The business offers its customers its world-renowned structured financing expertise in many sectors: natural resources and energy – where SG CIB was named “Commodity Finance House of the Year” by Energy Risk in 2017; international trade and infrastructure and assets – with the title of “Best Investment & Financing Bank in Energy, Infrastructure & Transport” from Trophées Leader de la Finance. The business was also named “Best Investment Bank in France” by Euromoney.
Against a backdrop of growing disintermediation, and given the new regulations, SG CIB is continuing its repositioning process focused on enhancing distribution capacities and streamlining operations that do not generate significant synergies.
Asset Management and Private Banking This business unit encompasses Asset Management (Lyxor Asset Management) and Private Banking, which operates under the Societe Generale Private Banking brand. The business unit employs more than 2,500 people*.
* Full-time equivalent (FTE) headcount at end of period excluding temporary staff. (1) “#1 Global Strategy”; “#1 Quantitative Research”; “#1 Index Analysis” and “#1 Multi Asset Research” in Europe by Extel. (2) “#4 All International Euro-denominated Bonds” and “#3 All International Euro-denominated Corporate Bonds” by Thomson Reuters.

1 I 4
THE GROUP’S CORE BUSINESSES KKEY FIGURES AND PRROFILE OF SOCIETE GENNERALE
26 I 2018 REGISTRATION DOCUMENT I S O C I E T E G E N E R AL E G R O U P
PRIVATE BANKING
Societe Generale Private Banking is a major player in wealth management and offers wealth management services to a domestic and international clientele, drawing on the expertise of its specialist teams in wealth engineering, investment and financing solutions, in accordance with the Tax Code of Conduct as approved by the Board of Directors.
Since January 2014 and in collaboration with the French Retail Banking division, Societe Generale Private Banking has extensively developed its relationship banking model in France, extending its offering to all individual clients with more than EUR 500,000 in its books. These clients are able to benefit from a service combining increased proximity based on 80 regional franchises and the know-how of Private Banking’s teams of experts.
Societe Generale Private Banking has also continued its strategy of refocusing on the Europe, Middle East and Africa region with the strengthening of its commercial operations in Europe (outside of France). Following the disposal of its private banking activities in Asia (2013 and 2014) and the Bahamas (2016), the Bank acquired Kleinwort Benson’s private banking business in the United Kingdom and the Channel Islands in June 2016. Following this acquisition, Societe Generale Private Banking created Kleinwort Hambros, a merger of Kleinwort Benson and Societe Generale Private Banking Hambros, with the aim of consolidating its private banking activities and reinforcing its leading position in the region. Societe Generale Private Banking’s offer is available in 11 countries.
In 2017, Societe Generale Private Banking’s strategy was recognised and the bank was named “Outstanding Private Bank in Western Europe” (Private Banking International). It was also awarded the title of “Best Private Bank for Entrepreneurs, Western Europe” by Global Finance.
At end-2017, Private Banking’s outstanding assets under management totalled EUR 118 billion (vs. EUR 116 billion at end-2016).
LYXOR ASSET MANAGEMENT
Lyxor Asset Management (“Lyxor”) is a wholly-owned subsidiary of the Societe Generale Group and was founded in 1998. Lyxor is a European asset management specialist with expertise in all investment styles and has the ability to create innovative investment solutions to address the challenges of the future.
Thanks to its tradition of engineering and research, and building on an agile combination of passive, active and alternative management styles, Lyxor covers the whole liquidity spectrum and adapts to clients’ needs whatever their financial constraints by offering the best combination of long-term performance and rigorous risk management.
As a financial architect and asset manager, Lyxor advises its clients on their allocation within a comprehensive investment universe, both developed internally and selected externally in an open architecture structure. Lyxor has built a fiduciary services and investment platform to help institutional investors meet their investment objectives while increasing their operational efficiency.
Among the most experienced players in the market, Lyxor pioneered the asset management industry with the creation of the first alternative managed accounts platform in 1998 and the European ETF market with the first ETF on the CAC 40 index in 2001, where Lyxor is now positioned as the third leading European provider with 10.1% market share(1).
At the end of 2017, from ETFs to multi-management, Lyxor’s assets under management and advisory totalled EUR 132 billion.
(1) Source: ETFGI, ranking by total assets under management at end-December 2017.
GROUP MANAGEMENT REPORT

S O C I E T E G E N E R AL E G R O U P I 2018 REGISTRATION DOCUMENT I 27
2
GGROUP MANAGEMENT REPORT
1. Societe Generale Group main activities .............................................................. 28
2. Group activity and results ................................ 30 Analysis of the consolidated income statement ...................... 30
3. Activity and results of the core businesses ...................................... 32 Results by core business .......................................................... 32 French Retail Banking ............................................................... 33 International Retail Banking and Financial Services ................ 35 Global Banking and Investor Solutions .................................... 39 Corporate Centre ...................................................................... 43 Definitions and methodology, alternative performance measures ........................................... 44
4. Significant new products or services .... 50
5. Analysis of the consolidated balance sheet ................................................................................... 59 Main changes in the scope of consolidation ............................ 60 Changes in major consolidated balance sheet items .............. 61
6. Financial policy ........................................................... 62 Group shareholders’ equity ....................................................... 62 Solvency ratios ...........................................................................63 Group debt policy.......................................................................64 Long-term ratings, short-term ratings, counterparty ratings and changes over the financial year..........................................65
7. Major investments and disposals ............. 66
8. Pending acquisitions and major contracts .............................................. 67
9. Property and equipment ................................... 67
10. Post-closing events ............................................... 67
11. Information about geographic locations and activities as at 31st December 2017 .................................................................................... 68

2 I 1
SOCIETE GENERALE GROUP MAIN ACTIVITIES GGROUP MANAGEMENT REPOORT
28 I 2018 REGISTRATION DOCUMENT I S O C I E T E G E N E R AL E G R O U P
1. SOCIETE GENERALE GROUP MAIN ACTIVITIES
* Parent company.
Notes:
– the percentages given indicate the percentage of capital held by the Group in the subsidiary; – the groups are listed under the geographic region where they carry out their principal activities.
SOCIETE GENERALE GROUP
Corporate Centre International Retail Banking and Financial Services (IBFS)
FRANCE
> Societe Generale* > Sogessur 100.0% > Généfinance 100.0% > Sogecap 100.0% > SG Financial SH 100.0% > CGL 99.8% > Sogéparticipations 100.0%
> Temsys 80.0% > Societe Generale SFH 100.0% > Societe Generale SCF 100.0% > Banque Française Océan Indien 50.0%
> Societe Generale Équipement France 100.0% > Sogefim Holding 100.0% > ALD 80.0% > Genegis I 100.0% > Genevalmy 100.0% > Valminvest 100.0% > Sogemarché 100.0% > Sogecampus 100.0%
EUROPE
> Eurobank, Poland 100.0% > Hanseatic Bank, Germany 75.0% > Banka A.S. 60.7%
Czech Republic > SG Express Bank, Bulgaria 99.7% > SKB Banka, Slovenia 99.7% > SG Banka SRBIJA, Serbia 100.0%
> BRD-Groupe SG, Romania 60.2% > PJSC Rosbank, Russia 100.0% > Fiditalia S.P.A, Italy 100.0%
> ALD Lease Finanz, Germany 100.0%
AFRICA - MEDITERRANEAN
> SG Marocaine de Banques, Morocco 57.5% > SG Algeria 100.0%
> Societe Generale de Banques Côte d’Ivoire 73.2%
AMERICAS
ASIA - AUSTRALIA

2
SOCIETE GENERALE GROUP MAIN ACTIVITIES
1 I 2 GGROUP MANAGEMENT REPOORT
S O C I E T E G E N E R AL E G R O U P I 2018 REGISTRATION DOCUMENT I 29
SOCIETE GENERALE GROUP
French Retail Banking (RBDF) Global Banking and Investor Solutions (GBIS)
FRANCE
> Societe Generale* > Societe Generale* > Crédit du Nord 100.0% > Inter Europe Conseil (IEC) 100.0% > Boursorama 100.0% > Lyxor Asset Management 100.0%
> CALIF 100.0% > Franfinance 100.0% > Descartes Trading 100.0% > Sogefinancement 100.0% > Sogelease France 100.0%
> Sogeprom 100.0%
EUROPE
> Societe Generale Bank&Trust 100.0% Luxembourg
> SG Kleinwort Hambros Bank Limited 100.0% United Kingdom
> SG Investments Ltd 100.0% United Kingdom
> Societe Generale International Ltd 100.0% United Kingdom
> SG Effekten, Germany 100.0% > SG Issuer, Luxembourg 100.0% > SGKBB Limited 100.0%
United Kingdom > SGSS Spa, Italy 100.0% > SG Private Banking, Switzerland 100.0% > SG Private Banking, Monaco 100.0%
> Societe Generale* branches in: London, United Kingdom Milan, Italy Frankfurt, Germany Madrid, Spain
AFRICA - MEDITERRANEAN
AMERICAS
> Banco SG Brazil SA, Brazil 100.0% > SG Americas, Inc. 100.0%
United States > SG Americas Securities, LLC 100.0%
United States > SG Americas Securities Holdings, LLC 100.0%
United States
> Societe Generale* branches in: New York, United States Montreal, Canada
ASIA - AUSTRALIA
> Societe Generale Ltd, China 100.0% > SG Securities Asia International 100.0%
Holdings Ltd, Hong Kong > SG Securities Korea Co Ltd, South Korea 100.0% > SG Securities Japan Limited, Japan
100.0% > Societe Generale* branches in:
Seoul, South Korea Taipei, Taiwan Singapore Mumbai, India

2 I 2
GROUP ACTIVITY AND RESULTSGGROUP MANAGEMENT REPOORT
30 I 2018 REGISTRATION DOCUMENT I S O C I E T E G E N E R AL E G R O U P
2 . G R O U P A C T I V I T Y A N D R E S U LT S
Definitions and details of methods used are provided on pages 44 and following.
Information followed by an asterisk is indicated as adjusted for changes in Group structure and at constant exchange rates.
The reconciliation of reported and underlying data is provided in page 45.
ANALYSIS OF THE CONSOLIDATED INCOME STATEMENT
(In EUR m) 2017 2016 Change
Net banking income 23,954 25,298 -55.3% -5.1%*
Operating expenses (17,838) (16,817) +6.1% +6.8%*
Gross operating income 6,116 8,481 -227.9% -28.4%*
Net cost of risk (1,349) (2,091) -35.5% -36.4%*
Operating income 4,767 6,390 -225.4% -25.8%*
Net income from companies accounted for by the equity method 92 129 -28.7%
Net profits or losses from other assets 278 (212) n/s
Impairment losses on goodwill 1 0 n/s
Income tax (1,708) (1,969) -13.3%
Net income 3,430 4,338 -20.9%
o.w. non-controlling interests 624 464 +34.5%
Group net income 2,806 3,874 -227.6% -25.8%*
Cost-to-income ratio 74.5% 66.5%
Average allocated capital 48,087 46,523 +3.6%
ROE after tax 4.9% 7.3%
Total capital ratio 17.0% 17.9%
* When adjusted for changes in Group structure and at constant exchange rates.
Net banking income
The Group’s book net banking income totalled EUR 23,954 million in 2017, down -5.3% vs. 2016. It included several exceptional items: in 2017, the impact of the LIA settlement (EUR -963 million) and the adjustment of hedging costs in French Retail Banking (EUR -88 million) and, in 2016, the capital gain on the disposal of Visa shares for EUR 725 million. When restated for these items, underlying net banking income increased by 0.5% to EUR 25,062 million in 2017 vs. EUR 24,928 million in 2016.
For 2017, French Retail Banking’s net banking income fell -2.9%, excluding the PEL/CEL provision. In a low interest rateenvironment, French Retail Banking fostered thedevelopment of its growth drivers and fee-generatingactivities.
International Retail Banking & Financial Services’ net bankingincome rose +6.6% (+6.2%*) in 2017, still driven by verygood commercial momentum in all businesses and regions.As a result, in 2017, net banking income increased by +5.2%(+7.1%*) for International Retail Banking, +12.0% (+6.6%*)for the Insurance business and +7.5% (+3.5%*) for FinancialServices to Corporates.
Global Banking & Investor Solutions’ revenues declined by -4.5% in 2017.
Global Markets and Investor Services was resilient during theyear despite the low volatility during the second part of theyear. Despite the good performance of financing activities,Financing and Advisory revenues were slightly down due to acommodities derivatives franchise penalised by difficultmarket conditions. For Asset & Wealth Management, Lyxor’sactivities were significantly up while Private Banking wasimpacted by the low rate environment.
For 2017, the accounting impact of the revaluation of the Group’s own financial liabilities was EUR -53 million (EUR -354 million in 2016). The DVA impact was EUR -4 million in 2017 (EUR -1 million in 2016). These two factors constitute the restated non-economic items in the analyses of the Group’s results.
GROUP MANAGEMENT REPORT

2
GROUP ACTIVIT I 2 GGROUP MANAGEMENT REPORT
S O C I E T E G E N E R AL E G R O U P I 2018 REGISTRATION DOCUMENT I 31
Operating expenses The Group’s operating expenses amounted to EUR -17,838 million in 2017, up 6.1% vs. 2016. Restated for exceptional items (in 2017, the exceptional expense related to the acceleration in the adaptation of French Retail Banking networks, amounting to EUR -390 million, the expense related to the receipt of a tax reassessment proposal following the tax audit by the French authorities regarding various operating taxes, amounting to EUR -145 million, the charge related to the consequences of the judgment of the Paris Court of Appeal of 21st December 2017 confirming the fine in respect of the dematerialisation of cheque processing, amounting to EUR -60 million, and in 2016, the partial refund of the Euribor fine for EUR 218 million and RMBS litigation for EUR -47 million), underlying operating expenses totalled EUR -17,243 million in 2017 vs. EUR -16,988 million in 2016, representing a limited increase of +1.5%.
The increase reflects investments in the growth of International Retail Banking & Financial Services, the effects of rigorous cost control in Global Banking & Investor Solutions, as well as investments in the transformation of French Retail Banking’s business model.
Gross operating income The Group’s book gross operating income totalled EUR 6,116 million in 2017 vs. EUR 8,481 million in 2016.
The Group’s underlying gross operating income amounted to EUR 7,819 million in 2017 vs. EUR 7,940 million in 2016.
Cost of risk The Group’s net cost of risk, excluding the variation in the provision for disputes, significantly decreased in 2017 (EUR -949 million vs. EUR -1,741 million in 2016) confirming the improvement in the Group’s risk profile and the economic environment.
The provision for disputes totalled EUR 2.32 billion at end-2017 vs. EUR 2 billion at end-2016 following an allocation of EUR -800 million and a net reversal of EUR 400 million for the LIA settlement.
The commercial cost of risk amounted to 19 basis points in 2017, substantially lower than in 2016 (37 basis points):
in French Retail Banking, the commercial cost of riskamounted to 30 basis points in 2017 vs. 36 basis points in2016 in an improved economic environment in France;
International Retail Banking & Financial Services’ cost of riskwas lower in 2017, at 29 basis points vs. 64 basis points in2016. In an improved macro-economic environment, theGroup continued with its risk management efforts;
Global Banking & Investor Solutions’ cost of risk amountedto -1 basis point in 2017 vs. 20 basis points in 2016.
The Group is expecting a commercial cost of risk of between 25 and 30 basis points for 2018.
The gross doubtful non-performing loans ratio was lower, at 4.4% at end-December 2017 (vs. 5.0% at end-December 2016). The Group’s gross doubtful loans coverage ratio stood at 61% (vs. 64% at end-December 2016).
Operating income The Group’s book operating income totalled EUR 4,767 million in 2017 vs. EUR 6,390 million in 2016.
Underlying operating income amounted to EUR 6,870 million in 2017 vs. EUR 6,199 million in 2016, up +10.8% vs. 2016.
Net income (In EUR m) 2017 2016
Reported Group net income 2,806 3,874
Group net income(1) 2,848 4,107
Underlying Group net income(2) 4,491 4,145
(In EUR m) 2017 2016
Underlying ROE(2) 8.3% 7.9%
Underlying ROTE(2) 9.6% 9.3%
(1) Excluding revaluation of own financial liabilities and DVA. (2) Adjusted for non-economic and exceptional items, and for IFRIC 21.
See methodological notes.
Net income for 2017 included an exceptional expense of EUR -416 million, corresponding to the impact of tax reforms in France and the United States:
In France, the impact of all tax measures (refund of the 3%additional contribution, creation of the exceptional surtax andreduction in the corporate tax rate between now and 2022)amounted to EUR-163 million;
In the United States, the reduction in the federal corporatetax rate resulted in the recognition of an expense of EUR -253 million.
Earnings per share amounted to EUR 2.92 in 2017 (EUR 4.26 in 2016). When adjusted for non-economic items, EPS was EUR 2.98 in 2017 (EUR 4.55 in 2016).

2 I 3
ACTIVITY AND RESULTS OF THE CORE BUSINESSES GGROUP MANAGEMENT REPOORT
32 I 2018 REGISTRATION DOCUMENT I S O C I E T E G E N E R AL E G R O U P
3 . A C T I V I T Y A N D R E S U LT S O F T H EC O R E B U S I N E S S E S
RESULTS BY CORE BUSINESS
(In EUR m)
French Retail BBanking
International Retail BBanking and
Financial Services
Global Banking and IInvestor Solutions
Corporate Centre Group
2017 2016 2017 2016 2017 2016 2017 2016 2017 2016
Net banking income 8,131 8,403 8,070 7,572 8,887 9,309 (1,134) 14 23,954 25,298
Operating expenses (6,108) (5,522) (4,474) (4,273) (6,895) (6,887) (361) (135) (17,838) (16,817)
Gross operating income 2,023 2,881 3,596 3,299 1,992 2,422 (1,495) (121) 6,116 8,481
Net cost of risk (567) (704) (400) (779) 18 (268) (400) (340) (1,349) (2,091)
Operating income 1,456 2,177 3,196 2,520 2,010 2,154 (1,895) (461) 4,767 6,390 Net income from companies accounted for by the equity method
32 51 41 37 2 30 17 11 92 129
Net profits or losses from other assets
7 (12) 36 58 (1) 24 236 (282) 278 (212)
Impairment losses on goodwill 0 0 1 0 0 0 0 0 1 0
Income tax (485) (730) (858) (697) (419) (386) 54 (156) (1,708) (1,969)
Net income 1,010 1,486 2,416 1,918 1,592 1,822 (1,588) (888) 3,430 4,338
o.w. non-controlling interests 0 0 441 287 26 19 157 158 624 464
Group net income 1,010 1,486 1,975 1,631 1,566 1,803 (1,745) (1,046) 2,806 3,874
Cost-to-income ratio 75.1% 65.7% 55.4% 56.4% 77.6% 74.0% n/s n/s 74.5% 66.5%
Average allocated capital 11,,081 10,6200 11,,165 10,7717 14,,442 155,1181 11,4000** 10,,006** 488,0087 46,,523
ROE 9..1%% 14..0%% 17.7%% 15..2%% 100.88% 11.99% n/s n/s 4.9%% 7.33%
* Calculated as the difference between total Group capital and capital allocated to the core businesses.
BASEL 3 CAPITAL ALLOCATION TO THE CORE BUSINESSES (ANNUAL AVERAGE IN EUR BN)
2016 2017
French Retail Banking
International Retail Banking and Financial Services
Global Banking and Investor Solutions
CHANGE IN UNDERLYING RONE FOR THE CORE BUSINESSES AND UNDERLYING ROTE FOR THE GROUP BETWEEN 2016 AND 2017
In this graph, the first column represents the year 2016, and the second 2017.
110.6
10.7
115.2
o.w.Global Markets
111.1
11.2
114.4
o.w.Global Markets
13.6% 15.2%
10.8% 9.3%12.5%
117.7%10.9% 99.6%
French Retail Banking International Retail Bankingand Financial Services
Global Banking andInvestor Solutions
Group
GROUP MANAGEMENT REPORT
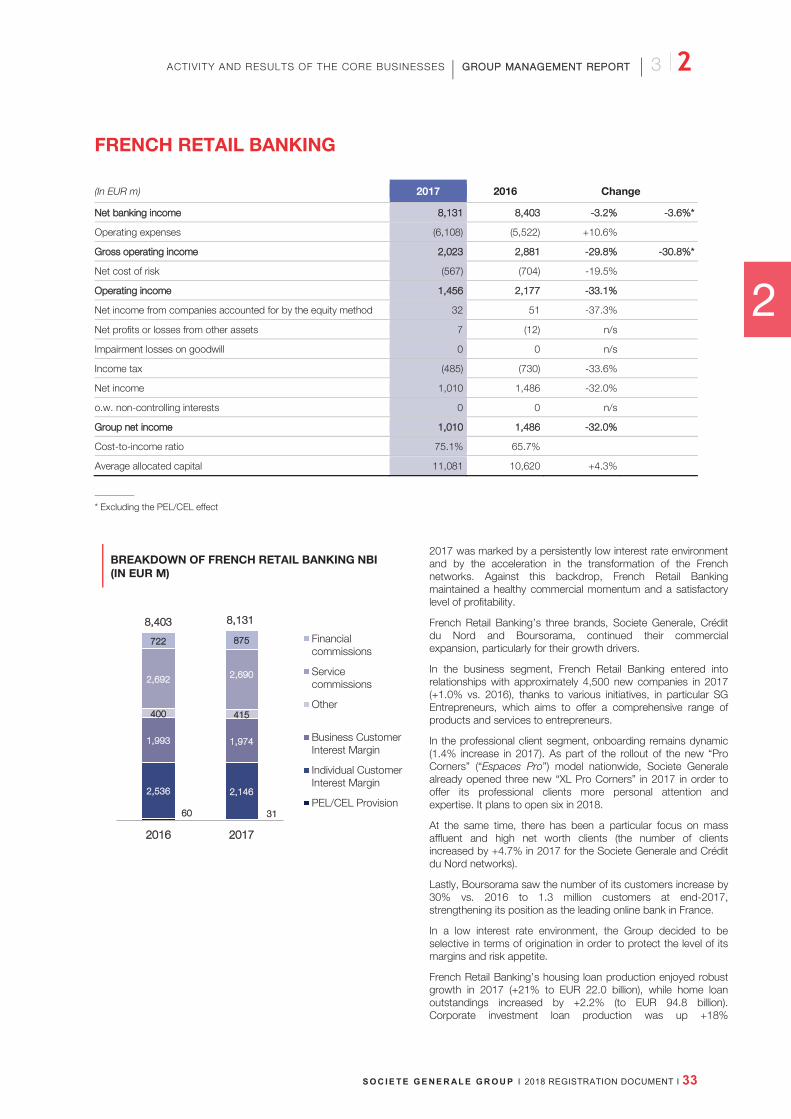
2
ACTIVITY AND RESULTS OF THE CORE BUSINESSES 3 I 2 GGROUP MANAGEMENT REPORT
S O C I E T E G E N E R AL E G R O U P I 2018 REGISTRATION DOCUMENT I 33
FRENCH RETAIL BANKING
(In EUR m) 2017 2016 Change
NNet banking income 88,131 88,403 --33..2% --33..66%%*
Operating expenses (6,108) (5,522) +10.6%
GGross operating income 22,023 22,881 --2299.8% --3300.8%*
Net cost of risk (567) (704) -19.5%
OOperating income 11,456 22,177 --3333.1%
Net income from companies accounted for by the equity method 32 51 -37.3%
Net profits or losses from other assets 7 (12) n/s
Impairment losses on goodwill 0 0 n/s
Income tax (485) (730) -33.6%
Net income 1,010 1,486 -32.0%
o.w. non-controlling interests 0 0 n/s
GGroup net income 11,010 11,486 --3322.0%
Cost-to-income ratio 75.1% 65.7%
Average allocated capital 11,081 10,620 +4.3%
* Excluding the PEL/CEL effect
BREAKDOWN OF FRENCH RETAIL BANKING NBI (IN EUR M)
2017 was marked by a persistently low interest rate environment and by the acceleration in the transformation of the French networks. Against this backdrop, French Retail Banking maintained a healthy commercial momentum and a satisfactory level of profitability.
French Retail Banking’s three brands, Societe Generale, Crédit du Nord and Boursorama, continued their commercial expansion, particularly for their growth drivers.
In the business segment, French Retail Banking entered into relationships with approximately 4,500 new companies in 2017 (+1.0% vs. 2016), thanks to various initiatives, in particular SG Entrepreneurs, which aims to offer a comprehensive range of products and services to entrepreneurs.
In the professional client segment, onboarding remains dynamic (1.4% increase in 2017). As part of the rollout of the new “Pro Corners” (“Espaces Pro”) model nationwide, Societe Generale already opened three new “XL Pro Corners” in 2017 in order to offer its professional clients more personal attention and expertise. It plans to open six in 2018.
At the same time, there has been a particular focus on mass affluent and high net worth clients (the number of clients increased by +4.7% in 2017 for the Societe Generale and Crédit du Nord networks).
Lastly, Boursorama saw the number of its customers increase by 30% vs. 2016 to 1.3 million customers at end-2017, strengthening its position as the leading online bank in France.
In a low interest rate environment, the Group decided to be selective in terms of origination in order to protect the level of its margins and risk appetite.
French Retail Banking’s housing loan production enjoyed robust growth in 2017 (+21% to EUR 22.0 billion), while home loan outstandings increased by +2.2% (to EUR 94.8 billion). Corporate investment loan production was up +18%
660 331
22,536 22,146
11,993 11,974
4400 4415
22,692 22,690
7722 8875
88,403 88,131
22016 22017
Financialcommissions
Servicecommissions
Other
Business CustomerInterest Margin
Individual CustomerInterest Margin
PEL/CEL Provision

2 I 3 ACTIVITY AND RESULTS OF THE CORE BUSINESSES GGROUP MANAGEMENT REPOORT
34 I 2018 REGISTRATION DOCUMENT I S O C I E T E G E N E R AL E G R O U P
year-on-year (at EUR 11.2 billion), reflecting the healthy economic environment and the dynamism of the teams. Average investment loan outstandings rose +1.8% vs. 2016.
Overall, average loan outstandings increased by +1.4% vs. 2016, to EUR 185.8 billion.
Average outstanding balance sheet deposits came to EUR 195.3 billion in 2017. They were up +6.6%, driven by sight deposits (+16.1%), particularly in the business segment. As a result, the average loan/deposit ratio stood at 95% in 2017 (vs. 100% on average in 2016).
Retail Banking’s growth drivers enjoyed a healthy momentum, thereby boosting the contribution of fee-generating activities.
Assets under management for Private Banking in France were up +5.5% in 2017 (at EUR 62.2 billion), while average life insurance outstandings were up +2.0% (at EUR 92.0 billion), with an increase in the proportion of unit-linked products to 22% (+3 points vs. 2016).
Net banking income (after neutralising the impact of PEL/CEL provisions) came to EUR 8,099 million in 2017, down -2.9% (-1.9% excluding the adjustment of hedging costs recorded in Q3 17) primarily due to the contraction in the interest margin, in accordance with expectations.
Net interest income was down -8.0% in 2017, penalised by the negative interest rate environment on the re-investment of deposits and mortgage renegotiation trends. Note, however, further confirmation of the normalisation of the renegotiation trend.
Conversely, commissions were up +4.5%, reflecting the gradual transformation of the business model and the increased momentum of growth drivers. Commissions represented around 44% of income in 2017 (excluding the impact of adjustments in hedging costs) vs. 40% in 2014.
Still buoyant, brokerage and life insurance activities, particularly for unit-linked contracts, resulted in a sharp rise in financial commissions (+21.3% in 2017). The increase also reflects
Antarius’ contribution, after the Group acquired total control of the company. Service commissions were stable, especially for business customers.
For 2018, the Group expects the full-year revenues of French Retail Banking to stabilise.
At end-November 2017, the Group announced a new plan for the reorganisation of the French Retail Banking networks. This will lead to around 900 job cuts in addition to the 2,550 already announced at the beginning of 2016, taking the total number to around 3,450 by 2020. This reorganisation, together with the accelerated overhaul of certain compliance systems, resulted in the Group booking an exceptional expense of EUR -390 million in the 2017 accounts.
Operating expenses for 2017 include an exceptional item relating to the booking of a charge following the judgment of the Paris Court of Appeal of 21st December 2017 confirming the fine in the litigation related to the dematerialisation of cheque processing, amounting to EUR -60 million.
Operating expenses in 2017 increased by +2.5%, excluding exceptional items, in line with the acceleration of digital transformation investments and the development of growth drivers. On this same basis, the cost-to-income ratio stood at 69.1% in 2017. As part of its transformation plan, the Group closed more than 100 branches in France in 2017.
The net cost of risk decreased by -19.5% in 2017 vs. 2016, and amounted to 30 basis points.
Operating income totalled EUR 1,456 million in 2017 (EUR 2,177 million in 2016).
French Retail Banking’s contribution to Group net income was EUR 1,010 million in 2017 (EUR 1,486 million in 2016).
The pillar reported resilient profitability against a backdrop of low interest rates and transformation: when restated for exceptional items and the PEL/CEL provision, RONE was 12.5% in 2017 (13.6% in 2016).
GROUP MANAGEMENT REPORT

2
ACTIVITY AND RESULTS OF THE CORE BUSINESSES 3 I 2 GGROUP MANAGEMENT REPORT
S O C I E T E G E N E R AL E G R O U P I 2018 REGISTRATION DOCUMENT I 35
INTERNATIONAL RETAIL BANKING AND FINANCIAL SERVICES
(In EUR m) 22017 22016 CChange
NNet bbanking income 88,070 77,572 ++6..6% ++6..2%%*
Operating expenses (4,474) (4,273) +4.7% +4.6%*
GGross operating income 33,596 33,299 ++9..0%% ++8..33%%*
Net cost of risk (400) (779) -48.7% -51.6%*
OOperating income 33,196 22,520 ++266.8% ++266.9%%*
Net income from companies accounted for by the equity method 41 37 +10.8% +31.8%*
Net profits or losses from other assets 36 58 -37.9% -41.7%
Impairment losses on goodwill 1 0 n/s
Income tax (858) (697) +23.1% +22.7%*
Net income 2,416 1,918 +26.0% +26.3%*
o.w. non-controlling interests 441 287 +53.7% +34.4%*
GGroup net income 11,975 11,631 ++211.1%% ++244.8%%*
Cost-to-income ratio 55.4% 56.4%
Average allocated capital 11,165 10,717 +4.2%
* When adjusted for changes in Group structure and at constant exchange rates.
Note: the results presented above for the International Retail Banking and Financial Services pillar include the results for International Retail Banking, Financial Services to Corporates, Insurance and all income and expenses not directly related to the businesses’ activities.
BREAKDOWN OF INTERNATIONAL RETAIL BANKING AND FINANCIAL SERVICES NBI (IN EUR M)
The pillar’s net banking income totalled EUR 8,070 million in 2017, up +6.6% vs. 2016, driven by a healthy commercial momentum in all regions and businesses. Operating expenses remained under control and amounted to EUR -4,474 million (+4.7%) over the same period, resulting in a cost-to-income ratio of 55.4% in 2017. Gross operating income totalled EUR 3,596 million (+9.0%) in 2017. There was a significant improvement in the net cost of risk to EUR -400 million in 2017 (down -48.7%), following the improvement in the macroeconomic environment, risk management efforts, and an insurance payout received in respect of Romania. Overall, the pillar made a contribution to Group net income of EUR 1,975 million in 2017, substantially higher than in 2016 (+21.1%), on the back of another record contribution from Europe and Africa, the ongoing recovery in Russia, as well as the good performances of the Insurance business and Financial Services to Corporates.
The pillar reported an increase in profitability, with underlying RONE of 17.7% in 2017 (15.2% in 2016).
55,26455,002
11,80211,677
99898883
115110
88,07077,572
2201722016
Other
Insurance
Financial Services tocorporates
International RetailBanking

2 I 3 ACTIVITY AND RESULTS OF THE CORE BUSINESSES GGROUP MANAGEMENT REPOORT
36 I 2018 REGISTRATION DOCUMENT I S O C I E T E G E N E R AL E G R O U P
International Retail Banking
(In EUR m) 2017 2016 Change
Net banking income 5,264 5,002 +5..2% +7..1%*
Operating expenses (3,154) (3,025) +4.3% +5.4%*
Gross operating income 2,110 1,977 +6..7% +9..7%*
Net cost of risk (341) (716) -52.4% -55.3%*
Operating income 1,769 1,261 +400.3% +477.8%*
Net income from companies accounted for by the equity method 23 18 +27.8%
Net profits or losses from other assets 38 46 -17.4%
Impairment losses on goodwill 1 0 n/s
Income tax (433) (313) +38.3%
Net income 1,398 1,012 +38.1%
o.w. non-controlling interests 366 271 +35.1%
Group net income 1,032 741 +399.3% +488.4%*
Cost-to-income ratio 59.9% 60.5%
Average allocated capital 6,656 6,371 +4.5%
* When adjusted for changes in Group structure and at constant exchange rates.
At end-December 2017, International Retail Banking’s outstanding loans had risen +5.6% (+9.0%*) vs. end-December 2016, to EUR 88.6 billion; the increase was particularly strong in Western Europe and Africa. Deposit inflow remained high in virtually all the international operations; outstanding deposits totalled EUR 79.8 billion at end-December 2017, up +6.1% (+10.4%*) year-on-year.
International Retail Banking revenues were 5.2% higher (+7.1%*) than in 2016 at EUR 5,264 million, whereas operating expenses were up +4.3% (+5.4%*) at EUR -3,154 million. Gross operating income came to EUR 2,110 million, up +6.7% (+9.7%*) vs. 2016. International Retail Banking’s contribution to Group net income amounted to EUR 1,032 million in 2017 (+39.3% vs. 2016), due to a better performance both in Europe and Africa, as well as a much improved situation in Russia.
In Western Europe, outstanding loans were up +15.3% vs. end-2016, at EUR 18.2 billion; car financing remained particularly buoyant over the period. Revenues totalled EUR 762 million in 2017, up +10.0% vs. 2016, whereas operating expenses increased by only +1.6%. As a result, gross operating income rose +19.3% in 2017. The contribution to Group net income came to EUR 199 million, up +29.2% vs. 2016.
In the Czech Republic, the Group delivered a solid commercial performance in 2017. Outstanding loans rose +9.0% (+3.0%*), driven by home loans and consumer loans. Outstanding deposits climbed +14.8% (+8.5%*) year-on-year. Despite this positive volume effect, revenues were slightly lower in 2017 when adjusted for changes in Group structure and at constant exchange rates (-1.2%*) and amounted to EUR 1,046 million (+1.5% in absolute terms), given the persistent low interest rate environment. Over the same period, operating expenses were up +3.7%* (+6.5% in absolute terms) at EUR -576 million, due to an increase in payroll costs in a full employment environment. The contribution to Group net income benefited from an exceptionally
low net cost of risk, on account of net provision write-backs, and therefore amounted to EUR 243 million, up +15.7% vs. 2016.
In Romania, the franchise expanded in a buoyant economic environment but in a highly competitive banking sector, with outstanding loans growing +3.7% (+6.4%*) and deposits rising +2.0% (+4.7%*) vs. end-December 2016. Outstanding loans totalled EUR 6.5 billion, primarily on the back of the growth in the individual customer segment. Deposits totalled EUR 9.5 billion. In this context, net banking income rose +3.6% (+5.4%*). Operating expenses were up +4.7% (+6.5%*), given the investments in the network’s transformation. Concerning the net cost of risk, 2017 was marked by provision write-backs, mainly on account of insurance payouts received over the period. As a result, in Romania, the contribution to Group net income was EUR 128 million; it was EUR 55 million in 2016.
In other European countries, outstanding loans were down -9.4% and deposits were down -16.9% vs. end-December 2016, due to the disposal of Splitska Banka. When adjusted for changes in Group structure and at constant exchange rates, outstanding loans and outstanding deposits were up +9.2%* and +6.7%* respectively. In 2017, revenues increased by +5.7%* when adjusted for changes in Group structure and at constant exchange rates (-14.2% in absolute terms), whereas operating expenses saw a limited increase of +1.1%* (-15.8% in absolute terms), as a result of the cost control in all countries in the region. The contribution to Group net income came to EUR 104 million (vs. EUR 132 million in 2016), with the increase in the contribution to Group net income when adjusted for changes in Group structure and at constant exchange rates amounting to +13.7%*.
* When adjusted for changes in Group structure and at constant exchange rates.
GROUP MANAGEMENT REPORT

2
ACTIVITY AND RESULTS OF THE CORE BUSINESSES 3 I 2 GGROUP MANAGEMENT REPORT
S O C I E T E G E N E R AL E G R O U P I 2018 REGISTRATION DOCUMENT I 37
In Russia, activity in the individual customer segment continued to expand against the backdrop of a stabilisation in the economic environment. Outstanding loans were up +3.2% (+12.4%*) vs. end-December 2016, driven by both corporate loans (+16%*) and loans to individual customers (+10%*). Outstanding deposits were substantially higher (+30.0%; +42.7%*), for both individual and business customers, contributing to the improvement in the financing cost for the Group’s entities in Russia. Net banking income for SG Russia(1) increased significantly in 2017 (+21.7%, given the currency effect, and +8.1%*). Operating expenses were higher (+19.0%; +5.7%*) and the net cost of risk was substantially lower at EUR -54 million (-68.6% vs. 2016). Overall,
SG Russia made a positive contribution to Group net income of EUR 121 million; it was EUR 8 million in 2016.
In Africa and other regions where the Group operates, outstanding loans rose +4.7% (+10.4%* vs. end-2016) to EUR 20.1 billion, driven mainly by Africa. Outstanding deposits were up +1.4% (+6.9%*) at EUR 19.5 billion. Net banking income came to EUR 1,521 million in 2017, an increase vs. 2016 (+8.0%; +11.2%*). Over the same period, operating expenses rose +7.0% (+10.0%*), in conjunction with the Group’s commercial development. The contribution to Group net income came to EUR 270 million in 2017, up +21.1% vs. 2016.
Insurance (In EUR m) 2017 2016 Change NNet banking income 9989 8883 ++12..00% ++6..66%*
Operating expenses (371) (339) +9.4% +7.2%*
GGross operating income 6618 5544 ++13..66% ++6..11%*
Net cost of risk 0 0 n/s n/s
OOperating income 6618 5544 ++13..66% ++6..11%*
Net income from companies accounted for by the equity method 0 0 n/s
Net profits or losses from other assets 0 0 n/s
Impairment losses on goodwill 0 0 n/s
Income tax (210) (174) +20.7%
Net income 408 370 +10.3%
o.w. non-controlling interests 2 2 +0.0%
GGroup net income 4406 3368 ++10..33% ++3..11%*
Cost-to-income ratio 37.5% 38.4%
Average allocated capital 1,788 1,719 +4.0%
* When adjusted for changes in Group structure and at constant exchange rates.
The life insurance savings business saw outstandings increase by +2.3%* in 2017, and by +16.1% including Antarius’ life insurance outstandings. The business also benefited from a stronger trend towards unit-linked products, with the share of unit-linked products in outstandings up +3 points vs. end-December 2016, at 26%.
There was further growth in Personal Protection insurance (premiums up +9.4% vs. 2016). Likewise, Non-Life insurance continued to grow (premiums up +9.4% vs. 2016), with substantial growth internationally (+20% vs. 2016), driven by home insurance.
The Insurance business turned in a good financial performance in 2017, with net banking income up +12.0% at EUR 989 million (+6.6%*), and a still low cost-to-income ratio (37.5%). The contribution to Group net income increased by +10.3% to EUR 406 million in 2017.
* When adjusted for changes in Group structure and at constant exchange rates.(1) SG Russia encompasses the entities Rosbank, Delta Credit Bank, Rusfinance Bank, Societe Generale Insurance, ALD Automotive and their consolidated
subsidiaries.

2 I 3
ACTIVITY AND RESULTS OF THE CORE BUSINESSES GGROUP MANAGEMENT REPOORT
38 I 2018 REGISTRATION DOCUMENT I S O C I E T E G E N E R AL E G R O U P
Financial Services to Corporates
(In EUR m) 2017 2016 Change
Net banking income 1,802 1,677 +7..5% +3..5%*
Operating expenses (905) (825) +9.7% +5.4%*
Gross operating income 897 852 +5..3% +1..7%*
Net cost of risk (51) (58) -12.1% -15.3%*
Operating income 846 794 +6..5% +2..9%*
Net income from companies accounted for by the equity method 17 19 -10.5%
Net profits or losses from other assets 0 0 n/s
Impairment losses on goodwill 0 0 n/s
Income tax (227) (230) -1.3%
Net income 636 583 +9.1%
o.w. non-controlling interests 57 5 +1,040.0%
Group net income 579 578 +0..2% +7..2%*
Cost-to-income ratio 50.2% 49.2%
Average allocated capital 2,579 2,497
* When adjusted for changes in Group structure and at constant exchange rates.
Financial Services to Corporates maintained its commercial momentum in 2017.
Operational Vehicle Leasing and Fleet Management experienced another substantial increase in its vehicle fleet this quarter. The vehicle fleet was up +9.8% in 2017 and exceeded the threshold of 1.5 million vehicles, mainly through organic growth.
The company continued to consolidate its leadership position in the mobility market. In the individual customer segment, the fleet now amounts to 78,000 contracts, up by more than 40%. Moreover, ALD has developed an innovative offering resulting in the creation of new types of car use.
Equipment Finance enjoyed a good level of new business in 2017, with an increase of +7.0% (+7.6%*) vs. 2016. Outstanding
loans were up +3.8% (+6.5%*) vs. 2016, at EUR 17.1 billion (excluding factoring), in a highly competitive environment adversely affecting new business margins.
Financial Services to Corporates’ net banking income rose +7.5% to EUR 1,802 million in 2017 (+3.5%*). Operating expenses were higher over the period at EUR -905 million (+9.7%, +5.4%*), due to operating and technological investments related to the development of activities. The contribution to Group net income was stable at EUR 579 million (+0.2%, despite the reduction in ALD’s contribution following its stock market floatation), and up +7.2%* when adjusted for changes in Group structure and at constant exchange rates.
* When adjusted for changes in Group structure and at constant exchange rates.

2
ACTIVITY AND RESULTS OF THE CORE BUSINESSES
3 I 2 GGROUP MANAGEMENT REPOORT
S O C I E T E G E N E R AL E G R O U P I 2018 REGISTRATION DOCUMENT I 39
GLOBAL BANKING AND INVESTOR SOLUTIONS
(In EUR m) 2017 2016 Change
Net banking income 8,887 9,309 -44.5% -22.9%*
Operating expenses (6,895) (6,887) +0.1% +1.8%*
Gross operating income 1,992 2,422 -117.8% -116.2%**
Net cost of risk 18 (268) n/s n/s
Operating income 2,010 2,154 -66.7% -55.0%**
Net income from companies accounted for by the equity method 2 30 -93.3%
Net profits or losses from other assets (1) 24 n/s
Impairment losses on goodwill 0 0 n/s
Income tax (419) (386) +8.5%
Net income 1,592 1,822 -12.6%
o.w. non-controlling interests 26 19 +36.8%
Group net income 1,566 1,803 -113.1% -111.7%**
Cost-to-income ratio 77.6% 74.0%
Average allocated capital 14,442 15,181 -4.9%
* When adjusted for changes in Group structure and at constant exchange rates.
BREAKDOWN OF GLOBAL BANKING AND INVESTOR SOLUTIONS NBI (IN EUR M)
Global Banking and Investor Solutions’ revenues totalled EUR 8,887 million in 2017 (down -4.5% compared with 2016). The operating expenses were stable, at +0.1% vs. 2016, as 2016 benefited from the partial refund of the Euribor fine paid in 2013. When restated for this effect and the RMBS litigation in Q4 16, operating expenses were down -2.3% vs. 2016, reflecting rigorous control of expenses, helping to offset the sharp rise in regulatory costs (including the contribution to the Single Resolution Fund). At end-2017, 103% of the objectives related to the cost savings plans had thus been achieved. The cost-to-income ratio amounted to 77.6% in 2017.
Gross operating income came to EUR 1,992 million in 2017, down -17.8%.
Net cost of risk saw a recovery of EUR +18 million in 2017 (EUR -268 million in 2016).
The division’s operating income totalled EUR 2,010 million in 2017 (-6.7% compared to 2016).
The division’s contribution to Group net income came to EUR 1,566 million in 2017. The division’s RONE amounted to 10.8% for 2017.
55,67955,936
22,22022,372
998811,001
88,88799,309
2201722016
Asset and WealthManagement
Financing andAdvisory
Global Markets andInvestor Services

2 I 3
ACTIVITY AND RESULTS OF THE CORE BUSINESSES GGROUP MANAGEMENT REPOORT
40 I 2018 REGISTRATION DOCUMENT I S O C I E T E G E N E R AL E G R O U P
Global Markets and Investor Services
(In EUR m) 2017 2016 Change
Net banking income 5,679 5,936 -44.3% -22.5%**
Operating expenses (4,436) (4,390) +1.0% +2.5%*
Gross operating income 1,243 1,546 -119.6% -117.0%**
Net cost of risk (34) (4) x8.5 x8.0*
Operating income 1,209 1,542 -221.6% -119.0%**
Net income from companies accounted for by the equity method 5 4 +25.0%
Net profits or losses from other assets 0 0 n/s
Impairment losses on goodwill 0 0 n/s
Income tax (322) (327) -1.5%
Net income 892 1,219 -26.8%
o.w. non-controlling interests 20 14 +42.9%
Group net income 872 1,205 -227.6% -225.5%%*
Cost-to-income ratio 78.1% 74.0%
Average allocated capital 8,316 8,609 -3.4%
* When adjusted for changes in Group structure and at constant exchange rates.
In a market characterised by historically low volatility, Global Markets and Investor Services’ net banking income proved resilient, at EUR 5,679 million in 2017 (-4.3% vs. 2016), providing further confirmation of the agility of our business model and the successful transformation implemented over the past several years. The business’ expertise was recognised again in 2017, with the titles of “Equity Derivatives House of the Year” and “Interest Rate Derivatives House of the Year”, awarded by Risk Awards.
Equities’ net banking income totalled EUR 1,971 million in 2017, down -6.1% vs. 2016. The division managed to capitalise on its recognised positions in structured products to pursue the development of its commercial franchise. This dynamism allowed the activity to partially offset the drop in volumes on the flow segment, notably on cash and flow derivatives activities, the historically low volatility having led to a slowdown in client demand. The Group nonetheless confirmed its leadership position on these activities (No. 2 globally based on Euronext Global volumes).
At EUR 2,374 million, Fixed Income, Currency & Commodities’ net banking income was down -7.1% in 2017 vs. 2016. The division is also impacted by the decline in volatility, which began early in the year and decreased further during the second half.
Flow revenues, notably Fixed Income and Currency, were the most affected by this environment, with investors clearly taking a wait-and-see approach. Following on from 2016, structured products recorded buoyant results, confirming the successful expansion of our cross-asset structured products franchise.
Prime Services’ net banking income totalled EUR 641 million in 2017, up +3.2% vs. 2016. The business continued to proactively develop its franchises and grow its client base.
Securities Services’ revenues were up +5.0% in 2017 vs. 2016, driven by a rise in commissions, reflecting robust commercial dynamism. The activity also benefits from the effects of the actions implemented to compensate for the low interest rate environment. Securities Services’ assets under custody amounted to EUR 3,904 billion at end-December 2017, down -1.3% year-on-year. Assets under management climbed +8.1% to EUR 651 billion.

2
ACTIVITY AND RESULTS OF THE CORE BUSINESSES 3 I 2 GGROUP MANAGEMENT REPOORT
S O C I E T E G E N E R AL E G R O U P I 2018 REGISTRATION DOCUMENT I 41
Financing and Advisory
(In EUR m) 2017 2016 Change
Net banking income 2,220 2,372 -66.4% -44.9%%*
Operating expenses (1,546) (1,539) +0.5% +3.6%*
Gross operating income 674 833 -119.1% -220.0%%*
Net cost of risk 50 (247) n/s n/s
Operating income 724 586 +233.5% +200.6%*
Net income from companies accounted for by the equity method (3) (2) +50.0%
Net profits or losses from other assets (1) 28 n/s
Income tax (76) (53) +43.4%
Net income 644 559 +15.2%
o.w. non-controlling interests 4 3 +33.3%
Group net income 640 556 +155.1% +113.3%%*
Cost-to-income ratio 69.6% 64.9%
Average allocated capital 5,073 5,581 -9.1%
* When adjusted for changes in Group structure and at constant exchange rates.
Financing and Advisory’s performance was down in 2017 compared to high levels in 2016, with revenues of EUR 2,220 million, down -6.4%. Financing activities enjoyed higher revenues, driven by a healthy commercial momentum and good level of new business, particularly in the Natural Resources division. The securitisation business maintained its healthy
momentum and saw its revenues increase each quarter. These good results were however more than offset by still challenging market conditions, which adversely affected the commodity derivatives franchise, the revenues from which decreased significantly compared to 2016, and corporate hedging activities.

2 I 3
ACTIVITY AND RESULTS OF THE CORE BUSINESSES GGROUP MANAGEMENT REPOORT
42 I 2018 REGISTRATION DOCUMENT I S O C I E T E G E N E R AL E G R O U P
Asset and Wealth Management
(In EUR m) 2017 2016 Change
Net banking income 988 1,0001 -11.33% -00.4%*
Operating expenses (913) (958) -4.7% -4.4%*
Gross operating income 75 43 +744.44% +880.2%*
Net cost of risk 2 (17) n/s n/s
Operating income 77 26 x33 x33*
Net income from companies accounted for by the equity method 0 28 n/s
Net profits or losses from other assets 0 (4) n/s
Impairment losses on goodwill 0 0 n/s
Income tax (21) (6) x3.5
Net income 56 44 +27.3%
o.w. non-controlling interests 2 2 +0.0%
Group net income 54 42 +288.66% +366.5%*
Cost-to-income ratio 92.4% 95.7%
Average allocated capital 1,053 991 +6.2%
* When adjusted for changes in Group structure and at constant exchange rates.
The net banking income of the Asset and Wealth Management business line totalled EUR 988 million in 2017 (down -1.3% vs. 2016), in an unfavourable low rate environment.
In Private Banking, 2017 was marked by the continuation of our strategy of refocusing on our core geographical markets, following the acquisition of Kleinwort Benson and the repositioning of our franchise in Switzerland. Private Banking’s assets under management amounted to EUR 118 billion at end-December 2017, up +1.8% vs. end-2016, with dynamic inflow in France. Net banking income was down -4.8% in 2017, at EUR 777 million. In a market still in “wait-and-see” mode, good
commercial activity, particularly on structured products, partially offset the negative effects of the low interest rate environment and the decline in brokerage commissions.
Lyxor’s assets under management reached an all-time high of EUR 112 billion, up +5.7% vs. end-2016, underpinned by rising markets and strong inflow in the ETF segment, which represented almost EUR 13 billion for 2017. Lyxor consolidated its No. 3 ETF ranking in Europe, with a market share of 10.1% (at end-2017 – source: ETFGI). Revenues amounted to EUR 190 million in 2017, up +18.0% vs. 2016, driven by an excellent commercial momentum across all the businesses.

2
ACTIVITY AND RESULTS OF THE CORE BUSINESSES 3 I 2 GGROUP MANAGEMENT REPOORT
S O C I E T E G E N E R AL E G R O U P I 2018 REGISTRATION DOCUMENT I 43
CORPORATE CENTRE
(In EUR m) 2017 2016 Change
Net banking income (1,,134) 14 n/s
Operating expenses (361) (135) +167.4%
Gross operating income (1,4495) (121) n/s
Net cost of risk (400) (340) +17.6%
Operating income (1,8895) (461) n/s
Net income from companies accounted for by the equity method 17 11 +54.5%
Net profits or losses from other assets 236 (282) n/s
Impairment losses on goodwill 0 0 n/s
Income tax 54 (156) n/s
Net income (1,588) (888) -77.8%
o.w. non-controlling interests 157 158 -0.6%
Group net income (1,7745) (1,,046) -666.8%
The Corporate Centre includes:
the property management of the Group’s head office,
the Group’s equity portfolio,
the Treasury function for the Group,
certain costs related to cross-functional projects and certaincosts incurred by the Group and not re-invoiced to thebusinesses.
The Corporate Centre’s net banking income totalled EUR -1,134 million in 2017 (EUR 14 million in 2016), and EUR -1,081 million excluding the revaluation of the Group’s own financial liabilities (EUR 368 million in 2016).
Operating expenses included the expense related to the tax reassessment proposal received further to an audit by the French tax authorities regarding various operating taxes, which amounted to EUR -145 million.
When restated for non-economic items and exceptional items from previous quarters in 2017 and 2016, gross operating income came to EUR -334 million in 2017 vs. EUR -492 million in 2016.
For full-year 2018, the Group is expecting gross operating income of around EUR -400 million, excluding non-economic and exceptional items, for the Corporate Centre.
In 2017, the net cost of risk amounted to EUR -400 million, corresponding to an additional allocation of EUR -800 million to the provision for disputes and a net reversal of EUR 400 million for the LIA settlement. This took the total of this provision to EUR 2.32 billion at 31st December 2017.
The Corporate Centre’s contribution to Group net income was EUR -1,745 million in 2017 vs. EUR -1,046 million in 2016. When restated for the impact of the revaluation of own financial liabilities, the Corporate Centre’s contribution to Group net income was EUR -1,706 million in 2017 vs. EUR -814 million in 2016.
The contribution to Group net income in Q4 2017 included two exceptional items recorded as tax expenses:
the effect of the tax reform in the United States, amountingto EUR -253 million;
the overall net effect of tax changes in France, amounting toEUR -163 million.

2 I 3
ACTIVITY AND RESULTS OF THE CORE BUSINESSES GGROUP MANAGEMENT REPOORT
44 I 2018 REGISTRATION DOCUMENT I S O C I E T E G E N E R AL E G R O U P
DEFINITIONS AND METHODOLOGY, ALTERNATIVE PERFORMANCE MEASURES
Framework The financial information presented in respect of the financial year ending 31st December 2017 has been prepared in accordance with IFRS as adopted in the European Union and applicable at that date.
Capital allocation In 2017, the allocation of normative capital to the businesses on the basis of their capital consumption was determined in accordance with CRR rules (11% of their risk-weighted assets, supplemented by the consumption of Common Equity Tier 1 capital chargeable to each business, after taking into account non-controlling interests and the adjustment of capital consumption related to the insurance activities). This capital allocation rule therefore applies to the Group’s three pillars (French Retail Banking, International Retail Banking and Financial Services, and Global Banking and Investor Solutions) and allows an evaluation of capital consumption by activity as well as their level of profitability on an autonomous and uniform basis, taking into account the Group’s regulatory constraints.
Net banking income Net banking income (NBI) for each business division includes:
revenues generated by its activity;
the yield on normative capital allocated to the business division, which is calculated on the basis of a long-term rate by currency. In return, in order to facilitate the comparability of performances between the Group’s different business lines, book capital is reassigned to the Corporate Centre at the same rate.
Moreover, capital losses and gains generated by the business divisions on the disposal of shares in non-consolidated entities, and income from management of the Group’s industrial and bank equity portfolios, are booked under NBI, as these securities are classified as available-for-sale financial assets.
Operating expenses Operating expenses for the business divisions correspond to the information reported in Note 8.1 to the Group’s consolidated financial statements as at 31st December 2017 (see p. 406) and include their direct expenses, their management overheads, and a share of the head-office expenses, which are in principle almost fully redistributed between the business divisions. The Corporate Centre only books costs relating to its own activity, along with certain technical adjustments.
Cost-to-income ratio The cost-to-income ratio indicates the operating expenses of a business in relation to its net banking income. This indicator provides a measure of the effectiveness of a system (see glossary).
IFRIC 21 adjustment The IFRIC 21 adjustment corrects the result of the charges recognised in the accounts in their entirety when they are due (generating event) so as to recognise only the portion relating to the current quarter, i.e. a quarter of the total. It consists in smoothing the charge recognised accordingly over the financial year in order to provide a more economic idea of the costs actually attributable to the activity over the period analysed. By applying the IFRIC 21 adjustment, the expense – previously recognised progressively if the obligating event occurs over a period of time – is now recognised once in its entirety.
Non-economic items Non-economic items correspond to the revaluation of the Group’s own financial liabilities and the debt value adjustment on derivative instruments (DVA). These two factors lead to the recognition of self-generated earnings reflecting the market’s evaluation of the counterparty risk related to the Group. They are also restated in respect of the Group’s net banking income and earnings to measure its activity while excluding these self-generated earnings. Furthermore, these items are excluded from prudential ratio calculations.

2
ACTIVITY AND RESULTS OF THE CORE BUSINESSES 3 I 2 GGROUP MANAGEMENT REPOORT
S O C I E T E G E N E R AL E G R O U P I 2018 REGISTRATION DOCUMENT I 45
Other adjustments The Group may need to adjust its earnings and expenses for an easier understanding of its actual performance. In particular, for French Retail Banking, the Group reports net banking income excluding PEL/CEL (cost-to-income ratio, gross operating income and operating income), i.e. adjusted for the provisions covering commitments specific to regulated savings. Other ad hoc adjustments may be applied depending on the exceptional nature of certain earnings and expenses for the period.
Underlying indicators The Group may be required to provide underlying indicators for a clearer understanding of its actual performance. Underlying data is obtained from reported data by restating the latter to take into account non-economic items, exceptional items and the IFRIC 21 adjustment. Several indicators may be provided in this respect: all income statement amounts (for example, net banking income, operating expenses, net cost of risk, net profits or losses from other assets, Group net income), profitability indicators (ROE, RONE, ROTE), earnings per share, cost-to-income ratio, etc.
These items, together with the underlyings derived from reported data, are indicated in the table below.
(In EUR m) 22017 22016 CChange
Net Banking Income 23,954 25,298 -55.3%
Revaluation of own financial liabilities* (53) (354) Corporate Centre
DVA* (4) (1) Group
Visa disposal** 725 Corporate Centre
Adjustment of hedging costs*** (88) French Retail Banking
LIA settlement** (963) Corporate Centre
Underlying Net Banking Income 25,062 24,928 +0.5%
Operating expenses((1) (17,838) (16,817) +6.1%
IFRIC 21
Adaptation of French retail network** (390) French Retail Banking
French tax audit / EIC** (205) French Retail Banking/Corporate Centre
Euribor fine** 218 Global Banking and Investor Solutions
RMBS litigation** (47) Global Banking and Investor Solutions
Underlying ooperating expenses (17,243) (16,988) +1.5%
Net cost of risk (1,349) (2,091) -335.5%
Provision for disputes** (800) (350) Corporate Centre
LIA settlement** 400 Corporate Centre
Underlying nnet cost of risk (949) (1,741) -445.5%
Net profit or losses from other assets 278 (212)
Change in consolidation method of Antarius** 203 Corporate Centre
SG Fortune disposal** 73 Corporate Centre
Splitska Banka disposal** (235) Corporate Centre
Underlying neet profits or losses from other assets 2 23
Group net income 2,806 3,874 -227.6% Effect in Group net income of exceptional and non-economic items*** and IFRIC 21 (1,685) (271)
Underlying Group net income 4,491 4,145 +8.4%
* Non-economic items. ** Exceptional items. *** Including effect of changes in the tax laws in France and the United States. (1) Reflects the sum total of the following items in the financial statements: Personnel expenses + Other operating expenses + Amortisation, depreciation
and impairment of tangible and intangible fixed assets.

2 I 3
ACTIVITY AND RESULTS OF THE CORE BUSINESSES GGROUP MANAGEMENT REPOORT
46 I 2018 REGISTRATION DOCUMENT I S O C I E T E G E N E R AL E G R O U P
Cost of risk Net cost of risk is charged to each business division so as to reflect the cost of risk inherent in their activity during each financial year. Impairment losses concerning the whole Group are booked by the Corporate Centre.
Societe Generale’s commercial net cost of risk is expressed in basis points. It is calculated by dividing the net annual allocation to provisions for commercial risks by average outstanding loans as at the end of the four quarters preceding the closing date. This indicator makes it possible to assess the level of risk of each of the pillars as a percentage of balance sheet loan commitments, including operating leases. The key items used in this calculation are indicated in the table below.
2017 2016
French Retail Banking
Net cost of risk (in EUR m) 567 679
Gross loan outstandings (in EUR m) 191,826 188,049
Cost of rrisk in bp 30 36
International Retail Banking
Net cost of risk (in EUR m) 366 763
Gross loan outstandings (in EUR m) 125,956 118,880
Cost of rrisk in bp 29 64
Global Banking and Investor Solutions
Net cost of risk (in EUR m) (16) 292
Gross loan outstandings (in EUR m) 145,361 148,223
Cost of riisk in bp (1) 20
Societe Generale Group
Net cost of risk (in EUR m) 918 1,723
Gross loan outstandings (in EUR m) 470,976 465,773
Cost of riisk in bp 19 37
The gross coverage ratio for doubtful outstandings “Doubtful outstandings” are outstandings that are in default within the meaning of the regulations.
The gross doubtful outstandings ratio calculates the doubtful outstandings recognised in the balance sheet with respect to gross loan outstandings.
The gross coverage ratio for doubtful outstandings is calculated as the ratio of provisions recognised in respect of the credit risk to gross outstandings identified as being in default within the meaning of the regulations, without taking into account any guarantees provided. This coverage ratio measures the maximum residual risk associated with outstandings in default (“doubtful outstandings”).
Net income/expense from other assets Net income or expense from other assets essentially comprises capital losses and gains on operating fixed assets, or when the Group ceases to control a consolidated subsidiary, as well as goodwill immediately written down when the Group takes control of an entity and revaluation of potential stakes previously held by the Group in entities fully consolidated during the year.
Impairment losses on goodwill Impairment losses on goodwill are booked by the business division to which the corresponding activity is attached.
Income tax The Group’s tax position is managed centrally.
Income tax is charged to each business division on the basis of a normative tax rate which takes into account the local tax rate of the countries in which it conducts its activities and the nature of its revenues. The difference between the income tax charged to the Group’s consolidated companies and the sum of normative taxes of the strategic pillars is assigned to the Corporate Centre.

2
ACTIVITY AND RESULTS OF THE CORE BUSINESSES 3 I 2 GGROUP MANAGEMENT REPOORT
S O C I E T E G E N E R AL E G R O U P I 2018 REGISTRATION DOCUMENT I 47
ROE, ROTE Group ROE and ROTE is calculated on the basis of average Group shareholders’ equity under IFRS.
It excludes:
unrealised or deferred capital gains or losses booked directlyunder shareholders’ equity excluding conversion reserves;
deeply subordinated notes;
undated subordinated notes restated as shareholders’equity.
It deducts:
interest payable to holders of deeply subordinated notes andof the restated, undated subordinated notes;
a provision in respect of the dividends to be paid toshareholders.
For ROTE, the following are also excluded:
average net goodwill in the assets, and underlying averagegoodwill relating to shareholdings in companies accountedfor by the equity method;
intangible assets.
The net income used to calculate ROE is based on Group net income excluding interest, net of tax impact, to be paid to holders of deeply subordinated notes for the period and, since 2006, holders of deeply subordinated notes and restated, undated subordinated notes.
The net income used to calculate ROTE is based on Group net income excluding the goodwill impairment loss but reinstating interest net of tax on deeply subordinated notes for the period (including issuance fees paid, for the period, to external parties and the discount charge related to the issue premium for deeply subordinated notes) and interest net of tax on undated subordinated notes (including issuance fees paid, for the period, to external parties and the discount charge related to the issue premium for undated subordinated notes).
RONE RONE (Return on Normative Equity) determines the return on average normative equity allocated to the Group’s businesses (see “capital allocation” above). The allocation principle in force since 1st January 2016 consists in allocating to each business normative equity corresponding to 11% of its risk-weighted assets.
The key items used in this calculation are indicated in the tables below.
In EUR m
End of period 2017 2016
Group shhareholders’ equity 59,373 61,953
Deeply subordinated notes (8,520) (10,663)
Undated subordinated notes (269) (297)
Interest net of tax payable to holders of deeply subordinated notes & undated subordinated notes, interest paid to holders of deeply subordinated notes & undated subordinated notes, issue premium amortisations
(165) (171)
Unrealised gains/losses booked under shareholders’ equity, excluding conversion reserves
(1,031) (1,273)
Dividend provision (1,762) (1,759)
ROE equity 47,626 47,790
Average ROE equity 48,087 46,530
Average goodwill (4,924) (4,693)
Average intangible assets (1,831) (1,630)
Average ROTE eequity 41,332 40,207
RONE CALCULATION: AVERAGE CAPITAL ALLOCATED TO CORE BUSINESSES (IN EUR M)
2017 2016
French Retail Banking 111,0081 10,620
International Retail Banking and Financial Services 11,165 10,717
Global Banking and Investor Solutions 14,442 15,181

2 I 3
ACTIVITY AND RESULTS OF THE CORE BUSINESSES GGROUP MANAGEMENT REPOORT
48 I 2018 REGISTRATION DOCUMENT I S O C I E T E G E N E R AL E G R O U P
Earnings per share For the calculation of earnings per share, in accordance with IAS 33, “Group net income” for the period is adjusted by the amount, net of tax impact, of capital gains/losses on partial buybacks of securities issued and classified as equity, of the costs pertaining to these equity instruments and of the interest paid on them.
Earnings per share is therefore calculated as the ratio of corrected Group net income for the period to the average
number of ordinary shares outstanding, excluding own shares and treasury shares, but including:
a) trading shares held by the Group, and
b) shares held under the liquidity contract.
The Group also reports its adjusted earnings per share, i.e. corrected for the impact of non-economic items (revaluation of own financial liabilities) and DVA (Debit Valuation Adjustment), as well as its underlying earnings per share, i.e. also corrected for exceptional items and the IFRIC 21 adjustment.
Average number of shares 2017 2016
Existing ssharees (average) 807,754,375 807,293,055
Deductions
Shares allocated to cover stock option plans and free shares awarded to staff (average) 4,960,736 4,293,642
Other own shares and treasury shares (average) 2,197,507 4,231,603
Number of shares used to calculate EPS 800,596,132 798,767,,809
Group net income (in EUR m) 2,806 3,874
Interest, net of tax, on deeply subordinated notes and undated subordinated notes (in EUR m) (466) (472)
Capital gain, net of tax, on partial buybacks (in EUR m) 0 0
Adjusted Group net income (in EUR m) 2,340 3,402
EPS (in EUR) 2.92 4.26
EPS* (in EUR) 2.98 4.55
EPS** (in EUR) 5.03 4.60
* Adjusted for revaluation of own financial liabilities and DVA.
** Adjusted for revaluation of own financial liabilities, DVA and exceptional items.

2
ACTIVITY AND RESULTS OF THE CORE BUSINESSES
3 I 2 GGROUP MANAGEMENT REPOORT
S O C I E T E G E N E R AL E G R O U P I 2018 REGISTRATION DOCUMENT I 49
Net Asset, Net Tangible Asset Value
Net assets comprise Group shareholders’ equity, excluding:
deeply subordinated notes, undated subordinated notespreviously recognised as debt; and
interest payable to holders of deeply subordinated notesand undated subordinated notes, but reinstating thebook value of trading shares held by the Group andshares held under the liquidity contract.
Tangible net assets are corrected for net goodwill in the assets, goodwill under the equity method and intangible assets.
In order to calculate Net Asset Value Per Share or Net Tangible Asset Value Per Share, the number of shares used to calculate book value per share is the number of shares issued, excluding own shares and treasury shares, but including:
trading shares held by the Group; and
shares held under the liquidity contract.
End of period 2017 2016
Group shhareholders’ equity 59,373 61,953
Deeply subordinated notes (8,520) (10,663)
Undated subordinated notes (269) (297)
Interest net of tax payable to holders of deeply subordinated notes & undated subordinated notes, interest paid to holders of deeply subordinated notes & undated subordinated notes, issue premium amortisations
(165) (171)
Book value of own shares in trading portfolio 223 75
Net Asset Value 50,642 50,897
Goodwill (5,154) (4,709)
Intangible Assets (1,940) (1,717)
Net Tangible Asset Value 43,547 44,471
Number of shares used to calculate NAPS** 801,067 799,462
NAPS** (in EUR) 63.2 63.7
Net Tangible Asset Value per share (EUR) (New Methodology) 54.4 55.6
** The number of shares used is the number of ordinary shares issued as at 31st December 2017, excluding own shares and treasury shares but including trading shares held by the Group.
Prudential capital and solvency ratios
The Societe Generale Group’s Common Equity Tier 1 capital is calculated in accordance with applicable CRR/CRD4 rules.
The fully-loaded solvency ratios are presented pro forma for current earnings, net of dividends, for the current financial year, unless specified otherwise.
When there is reference to phased-in ratios, these include the earnings for the current financial year, unless specified otherwise.
The leverage ratio is calculated according to applicable CRR/CRD4 rules including the provisions of the Delegated Act of October 2014.

2 I 4
SIGNIFICANT NEW PRODUCTS OR SERVICESGGROUP MANAGEMENT REPOORT
50 I 2018 REGISTRATION DOCUMENT I S O C I E T E G E N E R AL E G R O U P
4 . S I G N I F I C A N T N E W P R O D U C T S O RS E R V I C E S
Business division New products or services
French Retail Banking Enhancing the Quietis insurance offer
(January 2017, Societe Generale)
As from 1st January 2017, Quietis Particuliers for individual customers can get a warranty extension at no extra cost: household appliances, IT equipment, Hi-Fi or video systems purchased new with an SG bank card are covered for two years beyond the manufacturer warranty in the event of failure.
Contactless Paylib
(January 2017, Societe Generale)
Provision of a new, simple mobile payment solution that is free of charge and secure for Android telephone users: Contactless Paylib. This feature allows customers to use their mobile phones to pay for any purchases at shops with contactless payment terminals in France and abroad.
SG Formule Évolution (January 2017, Societe Generale)
A diversified wealth investment solution enabling customers to invest in European markets in order to benefit from potential returns: possible repayments every year if the index increases from its initial level, and payment of a 6% coupon. This investment offers partial protection of the invested capital upon maturity (capital protection provided the index does not drop by more than 40%) and an annual coupon of 3% provided the index does not drop by more than -15%.
Aggregation of external accounts
(February 2017, Societe Generale)
Provision of an aggregation service for all accounts held with banks other than Societe Generale for customers benefiting from the Jazz or Haute Fidélité offers, as well as Societe Generale Private Banking customers. This service, which can be accessed from the customer’s secure banking area, displays on a single screen all the customers’ external accounts and the breakdown of his or her transactions.
SogeCommerce
(March 2017, Societe Generale)
A new secure online payment solution (offer combining e-money acceptance and acquisition) intended for e-commerce customers, whether they are professionals, corporates or non-profit associations.
Short term pre-assessment
(April 2017, Societe Generale)
Calculating and providing pre-approved short-term loans to professionals.
Stock market app
(April 2017, Societe Generale)
Development of stock market features on the Societe Generale mobile app and website: customers can now purchase or sell securities on the stock market, either in cash or deferred (SRD), across all markets (Euronext and international) for most securities (listed shares, bonds, ETF, Warrants, Turbos and Societe Generale Certificates). They can check their share portfolio(s) and orders placed, monitor market developments, and create lists of their favourite securities at any time, directly from their phone.
Operational Vehicle Leasing
(April 2017, Societe Generale)
In partnership with ALD, the Societe Generale Group now offers its individual and professional customers an operational vehicle leasing solution, for all makes and models of passenger vehicles. In addition, this offer includes several complementary services and insurance solutions.
SYNTEC Supplementary Collective Health Insurance
(May 2017, Societe Generale)
First National Bargaining Agreement (CCN - Convention Collective Nationale) offer for supplementary collective health insurance dedicated to SYNTEC professionals. This offer is aimed at companies associated with the National Bargaining Agreement for “Technical Design Firms, Engineering Consultancy Firms and Consultancy Firms” (IDCC 1486), more commonly referred to as the “SYNTEC Agreement”.
Online loans
(May 2017, Societe Generale)
This first digital loan offer enables our professional customers to file a financing application online.
2
SIGNIFICANT NEW PRODUCTS OR SERVICES 4 I 2 GGROUP MANAGEMENT REPOORT
S O C I E T E G E N E R AL E G R O U P I 2018 REGISTRATION DOCUMENT I 51
Business division New products or services
SG Formule Durable
(June 2017, Societe Generale)
This is the first investment solution accessible to individual customers, allowing them, on the one hand, to invest in European companies selected for their sustainability and social responsibility features, while also benefiting from a repayment of at least 80% of their net principal amount upon maturity. On the other hand, Societe Generale undertakes to hold an amount equivalent to all payments made into this investment account in its balance sheet under positive-impact financial assets with respect to sustainable development.
Online international transfer
(June 2017, Societe Generale)
This offer enables professional customers to make international transfers online.
SG Image 2017
(October 2017, Societe Generale)
Marketing in Q4 2017 of a Societe Generale SOFICA (television financing company) enabling high net worth customers wishing to invest in the production of French cinematographic and audiovisual works to benefit from an income tax reduction. SG Image 2017 is a non-guaranteed long-term investment managed by the partner A PLUS Management.
CGA Avenir Plus
(October 2017, Societe Generale)
This simple and secure factoring offer is intended for B2B professionals.
List of Authorised Mandates
(November 2017, Societe Generale)
Provision of an anti-fraud offer with respect to SEPA debit orders, enabling our Corporate customers to authorise only direct debit mandates contractually indicated to the bank.
IBAN verification service via SEPAmail
(December 2017, Societe Generale)
Building on the SEPAmail DIAMOND solution, which is a secure inter-bank messaging service, Societe Generale offers its customers – whether businesses, non-profit associations or public-sector bodies – a service to verify the banking details of their clients or suppliers, whether they are natural or legal persons, before any transfer or debit order, or when performing a full verification of their database.
MasterCard, Businesscard and Corporate cards
(March 2017, Crédit du Nord)
Marketing of Mastercard, Businesscard and Corporate cards to our professional and corporate customers. These new Mastercards are gradually replacing Visa Business and Visa Affaires cards: upon expiry, for any new subscription or when requesting a replacement.
V-P@ss
(March 2017, Crédit du Nord)
New strong authentication device on PC/Mac and smartphone intended for all our Individual, Professional and Corporate customers to validate their sensitive transactions.
Operational Vehicle Leasing
(April 2017, Crédit du Nord)
In partnership with ALD, the Crédit du Nord Group now offers its individual and professional customers an operational vehicle leasing solution for all makes and models of passenger vehicles. In addition, this offer includes several complementary services and insurance solutions.
Acceptance of UPI and DFS cards in proximity payment
(May 2017, Crédit du Nord)
Enhancement of the sales offer intended for retailer customers who can now accept UnionPay International (UPI) and Discover Global Network (DFS) cards in proximity payments.
Visa Platinum
(June 2017, Crédit du Nord)
A new high-end card is offered, providing an ideal bridge between the Premier and Infinite cards. It is intended specifically for our young and urban Premium customers.
Gérer Seul
(June 2017, Crédit du Nord)
A new extra-banking partnership aimed at our Premium customers: Gérer Seul (Managing Alone) offers customers a simple online rental management solution at a very competitive rate.
Multi-Risk Insurance for Professionals
(June 2017, Crédit du Nord)
In partnership with Sogessur, the Crédit du Nord Group offers its professional customers multi-risk insurance that enables them to insure their professional premises, cover their civil liability and financial losses in the event of an incident, and benefit from a telemonitoring option.

2 I 4 SIGNIFICANT NEW PRODUCTS OR SERVICES GGROUP MANAGEMENT REPOORT
52 I 2018 REGISTRATION DOCUMENT I S O C I E T E G E N E R AL E G R O U P
Business division New products or services
Doctolib
(November 2017, Crédit du Nord)
In partnership with Doctolib, the Crédit du Nord Group offers its customers and prospects in the independent medical professions a solution for making online appointments 24/7 and on all devices.
Espace Flux
(December 2017, Crédit du Nord)
Espace Flux is a turnkey, simple and secure software solution to support our professional, corporate and institutional customers in the management of their banking flows. This file compilation and banking communication software is directly integrated as part of customers’ Internet service; it allows them to perform their banking transactions and monitor their accounts with all banks on a day-to-day basis.
Secure transfer service
(December 2017, Crédit du Nord)
Anti-fraud service aimed at our professional and corporate customers seeking to strengthen the security of their transfers by preparing a “white” list of authorised countries and/or beneficiaries.
SEPAmail DIAMOND
(December 2017, Crédit du Nord)
Anti-fraud service aimed at our professional and corporate customers wanting to protect themselves against fraud, in particular fraud related to false IBAN numbers. Using the DIAMOND service, customers can request the verification of an IBAN with the account-holding institution in France.
Partnership with IRAISER
(December 2017, Crédit du Nord)
Enhancement of our e-commerce partnerships (Oxatis/Payzen/Hipay) with the company IRAISER, which offers a platform for the collection of online donations for our non-profit association and institutional customers seeking to expand their activity.
Boursorama Pro
(January 2017, Boursorama)
At a very competitive price, Boursorama Banque has developed an offer designed specifically for professionals, with the full range of services available in real time and accessible 24/7 from any device.
Easy Move
(February 2017, Boursorama)
With its service for changing bank domiciliation, Boursorama lets customers change banks free of charge with just a few clicks and no paperwork. The whole process, from the mobility request through to the electronic signature of the mandate, is completed in a fully digital and automated way.
Boursorama Vie
(February 2017, Boursorama)
In early 2017, Boursorama expanded its life-insurance offer with a new management mandate, the “responsive” profile, access to 30 additional unit-linked funds, and 20 new ETFs.
Transfer from an external account
(April 2017, Boursorama)
Boursorama Banque customers can now make transfers from their accounts held in other banks, directly from their Boursorama Client Area.
Paperless, 100% mobile property loan
(May 2017, Boursorama)
With the electronic signature and downloading of supporting documents, even while travelling, Boursorama Banque now offers its customers a fully paperless application process.
Revolving credit
(June 2017, Boursorama)
To enable its customers to cover their unexpected expenses, Boursorama offers them a revolving credit solution with Budget+ by Franfinance: once the credit has been used, borrowers will have monthly payments debited from their accounts to reimburse the interest and principal amount; the revolving credit is then re-established as the customer’s principal amount is repaid, and becomes available once again.
New B20 features
(July 2017, Boursorama)
Boursorama offers its individual investor customers a new stock exchange experience with a completely redesigned website to better meet their expectations.
Kador (Offer 12-17)
(December 2017, Boursorama)
Boursorama enhances its offer for young people and enables them to benefit from a free current account and bank card from the age of 12, which they can manage independently on their smartphone via a specific application.

2
SIGNIFICANT NEW PRODUCTS OR SERVICES 4 I 2 GGROUP MANAGEMENT REPOORT
S O C I E T E G E N E R AL E G R O U P I 2018 REGISTRATION DOCUMENT I 53
Business division New products or services
International Retail Banking and Financial Services
C’BIO
(January 2017, SGMA – Morocco) (International Retail Banking)
Eco-friendly bank card, manufactured in polylactic acid (PLA), a biodegradable plant-based plastic produced from corn. This eco-friendly alternative limits the environmental impact of PVC, manufactured from fossil components.
Digitalisation of currency transactions
(January 2017, SGEB – Bulgaria) (International Retail Banking)
New service available on the “Bank On Web Pro” online banking platform. This innovative solution lets customers request and receive a preferential exchange rate for foreign exchange spot deals in real time.
OBSGnet
(March 2017, OBSG – Macedonia) (International Retail Banking)
New, enhanced e-banking platform for businesses, giving them secure access to several new services.
YUP
(April 2017, Senegal and Côte d’Ivoire - Pan-African project) (International Retail Banking)
100% simple and secure banking/Wallet application letting customers pay merchants, withdraw funds, transfer funds, pay invoices, or purchase phone credit.
M-banking
(May 2017; SGS – Serbia) (International Retail Banking)
New mobile banking application dedicated to customers wishing to perform secure banking transactions anywhere and at any time. In particular, it lets them check the status of their account, pay their bills and take advantage of promotions with just a few clicks.
Android Pay
(June 2017, Eurobank – Poland) (International Retail Banking)
All customers with a Visa payment card can make simple, secure payments with their smartphone without having to go through an application or the Internet. These payments can be made through all devices accepting contactless cards.
Welibank
(June 2017, SGBF – Burkina Faso) (International Retail Banking)
First digital agency in the country letting customers perform the most common transactions independently via their tablets.
ALD own my car
(January 2017, ALD Automotive Netherlands) (Financial Services to Corporates and Insurance)
New remarketing service enabling users to either purchase their professional vehicle at the end of the contract or sell it. If drivers do not wish to purchase their rental car, they can also advertise it on social networks (Facebook, LinkedIn, Twitter) or share the offer with people in their personal network (friends and family).
Link Vie
(January 2017, Oradéa Vie - France) (Financial Services to Corporates and Insurance)
First life-insurance savings product distributed through LINK by PRIMONIAL, a 100% online subscription platform. LINK Vie is an accessible and innovative product that invests solely in unit-linked ETF funds, combining digital technology (online subscription, electronic signature, robot) with the expert support of wealth management advisors.
GEFA online
(February 2017, SGEF - Germany) (Financial Services to Corporates and Insurance)
Online portal enabling registered customers to calculate and finalise their leasing contracts, financing contracts and other online credit solutions. GEFA online also displays the detailed characteristics of the contract and lets customers contact GEFA regarding the services related to the contract.

2 I 4 SIGNIFICANT NEW PRODUCTS OR SERVICES GGROUP MANAGEMENT REPOORT
54 I 2018 REGISTRATION DOCUMENT I S O C I E T E G E N E R AL E G R O U P
Business division New products or services
Iriade Emprunteur
(March 2017, Oradéa Vie - France) (Financial Services to Corporates and Insurance)
Insurance for borrowers, developed in partnership with the InsurTech Multinet Services, which enables online subscription with an automated medical decision process and integration of the electronic signature.
Renting para Particulares
(March 2017, ALD Automotive Portugal) (Financial Services to Corporates and Insurance)
Operational vehicle leasing solution with packaged services aimed at individual customers.
There are two available service packages:
maintenance and insurance;
maintenance, insurance, replacement vehicle, tyre management and ALDmove.
My MedCare
(May 2017, BRD Asigurari de Viata - Romania) (Financial Services to Corporates and Insurance)
First offer on the Romanian market enabling customers to get medical care wherever they need it, with their physician of choice. Also includes an innovative service, My MedShare, which enables the insured to share one medical consultation per year with the person of their choice.
Mobile app
(June 2017, Hanseatic Bank - Germany) (Financial Services to Corporates and Insurance)
New banking application for its credit card customers, who can check their account balance, their monthly credit limit and the payment date of their next monthly instalment. The application also displays information, answers to frequently asked questions, and the contact details of Hanseatic Bank’s customer service department. Emails can also be sent from the interface directly.
Dar Al Amane
(October 2017, SGMA – Morocco) (International Retail Banking)
As part of its commitment to financial inclusion, the Dar Al Amane bank, based on a crowd-banking model, aims to improve the local rate of bank account penetration by including people who do not subscribe to the principles of conventional finance, who can now benefit from a full range of products & services and financing & investment offers fully in line with the standards of crowdfunding and the requirements of local political and religious leaders.
“Prêt à partir”
(August 2017, SGBF – Burkina Faso) (International Retail Banking)
In partnership with Air France, SGBF offers its individual customers the opportunity to finance the purchase of their flight ticket thanks to “Prêt à partir” (Ready to go), a 12-month consumer credit capped at FCFA 5m (approximately EUR 7,600), which can be set up within 48 hours, allowing travellers to book their tickets quickly.
Mobil Conseil
(July 2017, SGBG - Guinea) (International Retail Banking)
Mobile banking service that does not require an Internet connection. Mobil Conseil enables the Bank’s customers to get real-time information and carry out simple transactions. To that end, they must simply send their request by SMS, and the module provides them with an automatic response.
DIG’IT!
(July 2017, SGBG - Ghana) (International Retail Banking)
Mobile app operating as a digital self-service platform, accessible 24/7. Accordingly, customers can perform simple transactions, access banking information and express their opinion in a branch or remotely.
Sogelib
(July 2017, SGBG - Senegal) (International Retail Banking)
SGBS has developed the SOGELIB application enabling customers to pre-order cash transactions (deposit, withdrawal) from a terminal in the branch. The transaction entered is sent directly to the branch staff for processing. SOGELIB strives to reduce customers’ waiting time and to free up branches.
NatWest Car Finance Digital Platform
(September 2017, ALD Automotive England) (Financial Services to Corporates and Insurance)
A pilot agreement was launched between ALD Automotive UK and NatWest to jointly market a new online vehicle financing product aimed at NatWest customers. The platform, NatWest Flex Car Finance, offers a fully digital used car rental service, available exclusively to NatWest customers.
2
SIGNIFICANT NEW PRODUCTS OR SERVICES 4 I 2 GGROUP MANAGEMENT REPOORT
S O C I E T E G E N E R AL E G R O U P I 2018 REGISTRATION DOCUMENT I 55
Business division New products or services
ALD Park
(November 2017, ALD Automotive Austria) (Financial Services to Corporates and Insurance)
A digital parking app in the pilot phase in Austria, developed in partnership with the Austrian start-up Parkbob during the International Start-up Challenge, aims to revolutionise user experience when looking for a parking space in urban areas.
Accordingly, the app helps users locate free parking spaces, automatically alerts drivers when they park in a reserved space, and informs them of local parking restrictions and hourly rates in order to optimise the travel time and limit fines.
Global Fleet Reporting
(December 2017, ALD Automotive - France) (Financial Services to Corporates and Insurance)
ALD Automotive has launched GlobalFleetReporting.com in collaboration with its North American partner Wheels: it is a global reporting solution that consolidates the fleet management data taken from multiple sources, including third parties, securely and confidentially.
This solution combines operational performance indicators and the consolidated fleet data on an independent, neutral platform to help customers manage their fleet on a global scale.
Mobile app
(December 2017, La Marocaine Vie - Morocco) (Financial Services to Corporates and Insurance)
This app allows customers to check their insurance contracts in real time (guarantees, premium payments, etc.), to check the procedure regarding claims and service requests, monitor their medical refunds, and check any changes in their savings. It also offers useful day-to-day features, such as keeping copies of medical files on your telephone and finding an on-duty pharmacy, physician or clinic in the immediate vicinity.
Vehicle Insurance electronic signature
(November 2017, Sogessur - France) (Financial Services to Corporates and Insurance)
New feature made available to customers as part of taking out a vehicle contract. Once a quote has been prepared online, by telephone or in the branch, customers receive their contractual documents in their secure customer area and can sign their contracts electronically from said area or via the SG mobile application.
Online downloading of school insurance statements
(June 2017, Sogessur - France) (Financial Services to Corporates and Insurance)
New feature enabling customers to download a School Insurance statement directly from the secure area. This saves time and reduces paper consumption.
Android Pay
(December 2017, - Czech
Republic) (International Retail Banking)
their bank card (on their tablet, smart watch, etc.) to replace the classic plastic card. Activation is fast and secure, and transactions then take only a few seconds.
BankHub
(December 2017, SG Expressbank - Bulgaria) (International Retail Banking)
For the first time in Central and Eastern Europe, customers can benefit from an expert analysis of their income and expenses via the new SGEB online platform, BankHub, thereby simplifying their everyday wealth management.
Garantie Vidange+
(September 2017, CGI Finance - France) (International Retail Banking)
Designed for low- to average-frequency drivers (up to 25,000 kilometres per year), this warranty covers standard maintenance (servicing, oil changes, etc.) as well as expenses related to breakdowns. The offer also includes assistance services, such as 24/7 repairs and towing, or the loan of a courtesy vehicle. Garantie Vidange+, available for new and used vehicles, lets customers control their repair budget, in particular with respect to lease financing. It is also a loyalty-building product for dealers, who can optimise their workshop returns.
2 I 4
SIGNIFICANT NEW PRODUCTS OR SERVICES GGROUP MANAGEMENT REPOORT
56 I 2018 REGISTRATION DOCUMENT I S O C I E T E G E N E R AL E G R O U P
Business division New products or services
Online contract signature
(September 2017, KB – Czech Republic) (International Retail Banking)
Banka now allows its customers to sign their contracts online and receive the necessary documents in digital format. The “documents for processing” are sent to a virtual folder that alerts customers via the different online banking channels. Once signed, they are stored in their digital archives, which can
while enabling customers to sign their contracts securely, anywhere and at any time.
Masterata credit card
(August 2017, SG Srbija - Serbia) (International Retail Banking)
The Masterata credit card lets customers make interest-free monthly payments. As such, holders of this card can make purchases at any time, regardless of their account balance.
New insurance strategy
(October 2017, Hanseatic Bank - Germany) (International Retail Banking)
Hanseatic Bank recently expanded its portfolio by developing “insurance families”. Each family is specific to a certain field, such as travel, for example, and includes three formulas (basic, comfort and premium) offering different prices and services. In August, Hanseatic Bank launched its first family insurance entitled “SicherReise”, or “Travel safely” in English, enabling holders of a Hanseatic Bank credit card to take out insurance based on the package that best suits their needs.
Inventory financing solution
(December 2017, SGEF Norway)
In order to meet the growing needs of its financial partners (vendors) and the dealer networks regarding their inventory financing, SGEF Norway has integrated this digital solution into its portal dedicated to vendors.
Global Banking and Investor Solutions
The Equity Tail Risk Strategies (TETRIS)
(January 2017, Global Markets)
Based on the SG Cross Asset Quant Research publication, “Hedges are not a luxury”, the Equity Tail Risk Indices are designed to hedge the tail risk on equity markets at a reasonable cost (low carry). The strategies aim to replicate a downside variance swap on the S&P 500 (US version) or Eurostoxx 50 (European version) with liquid and transparent plain vanilla options.
Lyxor/Crystal Europe Equity Fund
(January 2017, Lyxor)
Lyxor/Crystal Europe Equity Fund (“Crystal”) is a Long/Short European Large Cap Equity Strategy fund. This is a high-conviction portfolio of long/short investment ideas from a panel of established European equity managers. This original concept allows our clients to access the research and talent of several recognised managers, without investing in a fund of funds structure.
ERP Market Neutral US Indices
(February 2017, Global Markets)
The ERP Market Neutral US Indices are systematic and rules-based long/short indices that aim to track baskets of stocks embedded in the S&P 500 Index selected according to specific factors (Quality, Value, Profitability, Momentum, Low Vol). Each basket is hedged to limit directional exposure to the three main sources of risk in the market. Each Index is rebalanced quarterly (monthly for the Momentum) according to a systematic scoring model based on fundamental and quantitative criteria.
Solvency II optimisation solutions
(March 2017, Lyxor)
Lyxor’s new Solvency II optimisation solution is a service offer that allows insurers to optimise investment returns relative to their Solvency II capital charge (SCR). The offer applies both derivatives and TIPP investment techniques to maximise exposure to return-seeking assets, while limiting drawdown and volatility.
Lyxor Green Bond (DR) UCITS ETF
(March 2017, Lyxor)
The world’s first Green Bond ETF allows investors to contribute directly to the improvement of the environment. Through this ETF, investors can access a portfolio of 160 EUR and USD Investment Grade “Green Bonds”, which have been certified as eligible for inclusion by the Climate Bond Initiative.

2
SIGNIFICANT NEW PRODUCTS OR SERVICES 4 I 2 GGROUP MANAGEMENT REPOORT
S O C I E T E G E N E R AL E G R O U P I 2018 REGISTRATION DOCUMENT I 57
Business division New products or services
Lyxor $ Floating Rate Note UCITS ETF
(May 2017, Lyxor)
The Lyxor $ Floating Rate Note UCITS ETF helps bond investors protect themselves from rising US interest rates. The ETF provides access to investment grade bonds with at least 2 years to maturity, and EUR 500 million outstanding. Bonds issued more than two years ago, or by Emerging Market companies are excluded.
New Custody Information System (NCIS)
(June 2017, Societe Generale Securities Services)
This multi-entity custody platform, a major IT development launched within SGSS’s Development & Competitiveness plan, enhances the existing custody service we provide to our clients with local and global clearing and settlement, cash management, asset servicing, corporate actions and regulatory services supported by a single custody platform throughout Europe. It provides our institutional clients with a renovated, more comprehensive, more agile and better-performing pan-European platform. As a result, our European clients will benefit from both local expertise and the platform’s global reach. Already deployed in Germany in 2016, the first batch of global custody services were rolled out in the UK in July 2017 and the transfer of clients should be finalised by the end of 2017.
Positive Impact Notes
(June 2017, Global Markets)
In June, Societe Generale launched the distribution of the first Positive Impact Note in Italy. This note will be listed in the Italian market and included in the specific segment of green and social bonds. In H1 2017, Societe Generale issued over EUR 170 million of PIF Notes. With a Positive Impact Finance note, Societe Generale commits to holding in its books an amount of Positive Impact Finance projects equivalent to 100% of the nominal amount of structured bonds. These notes enable investors to support Positive Impact Finance, through a product whose financial characteristics can be customised to their needs. Positive Impact Notes provide financial solutions to meet investment needs related to the world’s major challenges such as climate change or population increase.
“Lyxor Fund of ETFs”
(July 2017, Lyxor)
Lyxor launched two funds of ETFs:
Lyxor Planet Global Balanced;
Lyxor Planet Global Equities.
These funds enable investors to enjoy opportunities through the different markets, sectors and investment themes. They rely on Lyxor’s experience in asset allocation and ETFs. The idea is to combine the best of two worlds: active allocation with passive instruments. The funds were developed in collaboration with Societe Generale Private Banking.
“SGI US Market Neutral Index”
(September 2017, Global Markets)
Last September, SGI launched five US Market Neutral indices (Quality, Profitability, Momentum, Low Vol and Value), thereby completing the range of European ERP – Market Neutral indices. Governed by a methodology, these five systematic indices are intended to monitor a basket of shares included in the S&P 500, as well as in the S&P MidCap 400. They are based on five different factor models respectively (one factor per index), and are beta hedged on the three most relevant sources of risk in the market.
“Lyxor Currency Overlay”
(October 2017, Lyxor)
The management of Lyxor currency hedging enables institutional investors to hedge the currency risk of their investments while targeting an improved return. This approach contains a performance driver based on three uncorrelated strategies. While considering the currencies as an asset class, they will make it possible to extract the excess return (alpha) of the currencies. The solution was developed jointly with Societe Generale Securities Services Germany.

2 I 4
SIGNIFICANT NEW PRODUCTS OR SERVICES GGROUP MANAGEMENT REPOORT
58 I 2018 REGISTRATION DOCUMENT I S O C I E T E G E N E R AL E G R O U P
Business division New products or services
“SGI Rise of the Robots Index” Ticker: SGIXROBO
(November 2017, Global Markets)
With the aim of offering its customers an exposure to the best shares related to Artificial and Robotic Intelligence, Societe Generale Research has developed an exclusive partnership with Martin Ford, author of the NY Times best-seller “Rise of the Robots”.
As Artificial Intelligence is at the heart of the next economic revolution, Societe Generale has positioned itself in this field by offering a systematic investment strategy via the creation of an SG Index called: SGI Rise of the Robots (SGIXROBO).
Martin Ford will act as expert consultant on the SGI Rise of the Robots index, helping Societe Generale Research to define an investment universe and to identify players in this constantly changing environment.
The Risk of the Robots index offers a systematic investment strategy selecting 150 shares (including small and mid caps) among a universe of 210 shares (defined jointly by Societe Generale Research and Martin Ford), based on the following three ratios: R&D expenditure/revenue, return on invested capital (ROIC) and three-year sales growth. A liquidity filter has also been established.
“SGI European Dividend Constant Maturity 3Y Beta Hedged Index”
(November 2017, Global Markets)
Two years after the successful launch of the SGI European Dividend Constant Maturity 1Y (SGBVDCM1) index, Societe Generale launched the SGI European Dividend Constant Maturity 3Y Beta Hedged (SGIXDC3H) index last November.
This index aims to capture the performance of a long/short strategy based on a long position on the SGI European Dvd Constant Maturity 3Y (SGIXDCM3) index, rolling futures on dividends of the Euro Stoxx 50 Price Return Index (maintaining a theoretical maturity that is always equal to three years) and beta hedged against the equity market (Euro Stoxx 50), displaying a low correlation with the equity market.
This index aims to monetise the downward trend of futures on dividends due to an underestimation of futures in the longer term and the pessimistic outlook of investors. This makes it possible to capture the non-realisation of the forward, taking a long position on the third and fourth futures contracts of the Euro Stoxx 50 Dividend Futures Index, with the rolling of futures enabling a positive return.
“ESG Reporting”
(November 2017, Societe Generale Securities Services)
The new ESG reporting solution enables institutional investors and fund managers to assess their investments compared with a series of Environmental, Social and Governance (ESG) indicators, using MSCI1 data and methodology. These indicators include different criteria, such as CO2 emissions, the composition of Boards of Directors and the remuneration of members of the Board of Directors and Chief Executive Officers, as well as compliance with social standards and responsible production.
Customers will be able to benefit from an analysis of their portfolios, including these extra-financial factors, and to identify the issuers that are best- and worst-positioned in order to adapt their investment strategies to improve financial profitability along with the societal and environmental impact.

2
I 2 GGROUP MANAGEMENT REPOORT
S O C I E T E G E N E R AL E G R O U P I 2018 REGISTRATION DOCUMENT I 59
5 . A N A LY S I S O F T H E C O N S O L I D AT E DB A L A N C E S H E E T
ASSETS
(in EUR bn) 31.12.2017 31.12.2016
Cash, due from central banks 114.4 96.2
Financial assets at fair value through profit or loss* 419.7 500.2
Hedging derivatives 13.6 18.1
Available-for-sale financial assets 140.0 139.4
Due from banks 60.9 59.5
Customer loans 425.2 426.5
Revaluation differences on portfolios hedged against interest rate risk 0.7 1.1
Held-to-maturity financial assets 3.6 3.9
Tax assets 6.0 6.4
Other assets* 60.5 71.4
Non-current assets held for sale 0.0 4.3
Investments accounted for using the equity method 0.7 1.1
Tangible, intangible fixed assets 24.8 21.8
Goodwill 5.0 4.5
Total 1,275.1 1,354.4
* Amount restated compared to the financial statements published in 2016, further to a change in the balance sheet presentation of premiums to bereceived/paid on options (see Chapter 6, Note 3).
LIABILITIES
(in EUR bn) 31.12.2017 31.12.2016
Due to central banks 5.6 5.2
Financial liabilities at fair value through profit or loss* 368.7 440.1
Hedging derivatives 6.8 9.6
Due to banks 88.6 82.6
Customer deposits 410.6 421.0
Debt securities issued 103.2 102.2
Revaluation differences on portfolios hedged against interest rate risk 6.0 8.5
Tax liabilities 1.7 1.4
Other liabilities* 69.1 81.9
Non-current liabilities held for sale 0.0 3.6
Underwriting reserves of insurance companies 131.0 112.8
Provisions 6.1 5.7
Subordinated debt 13.6 14.1
Group shareholders’ equity 59.4 62.0
Non-controlling interests 4.7 3.7
Total 1,275.1 1,354.4
* Amount restated compared to the financial statements published in 2016, further to a change in the balance sheet presentation of premiums to bereceived/paid on options (see Chapter 6, Note 3).

2 I GGROUP MANAGEMENT REPOORT
60 I 2018 REGISTRATION DOCUMENT I S O C I E T E G E N E R AL E G R O U P
MAIN CHANGES IN THE SCOPE OF CONSOLIDATION The main changes in the scope of consolidation at 31st December 2017, compared with the scope applicable at 31st December 2016, are as follows:
Antarius On 8th February 2017, Aviva France and Sogecap signed an agreement substantiating the acquisition by Sogecap of the 50% interest in Antarius previously held by Aviva France. The shares were transferred on 1st April 2017. Antarius is now 100% owned by the Group, jointly by Sogecap and Crédit du Nord. It has been fully consolidated since that date.
ALD INITIAL PUBLIC OFFERING
On 16th June 2017, the Group sold 80,820,728 shares in ALD SA (the ALD Group), representing 20% of its capital, upon its floating on the Euronext Paris regulated market at a price of EUR 14.30 per share. An over-allotment option of up to an additional 3% of the ALD SA share capital was exercised on 12th July 2017 at the rate of 0.18%.
ACQUISITION OF MERRION FLEET
On 18th July 2017, ALD acquired Merrion Fleet. This acquisition enabled ALD to enter the Irish market.
ACQUISITION OF BBVA AUTORENTING
On 26th September 2017, ALD Automotive SAU acquired BBVA Autorenting, a leasing subsidiary of the second largest Spanish bank, BBVA. This acquisition enabled ALD to consolidate its competitive position on a high-potential Spanish market.
Splitska Banka On 2nd May 2017, the Group sold its full stake in Splitska Banka (100%), its Croatian subsidiary, to OTP Bank.
Fortune SG Fund Management Co Ltd On 11th September 2017, the Group sold its 49% interest in Fortune SG Fund Management Co Ltd, an asset management company in China, to Warburg Pincus Asset Management LP. This interest was included in the Group’s balance sheet using the equity method.
Cash, due from central banks
Financial assets and liabilities at fair value through profit or loss
Customer loans
Customer deposits
Due from banks
Due to banks
Other assets other liabilities
Underwriting reserves of insurance companies
Group shareholders’ equity

2
ANALYSIS OF THE CONSOLIDATED BALANCE SHEET
5 I 2 GGROUP MANAGEMENT REPOORT
S O C I E T E G E N E R AL E G R O U P I 2018 REGISTRATION DOCUMENT I 61
CHANGES IN MAJOR CONSOLIDATED BALANCE SHEET ITEMS At 31st December 2017, the Group’s consolidated balance sheet totalled EUR 1,275.1 billion, down by EUR 79.3 billion (-5.9%) compared to 31st December 2016 (EUR 1,354.4 billion).
CCash, due from central banks (EUR 114.4 billion at 31st December 2017) increased by EUR 18.2 billion (+18.9%) compared to 31st December 2016.
FFinancial assets and liabilities at fair value through profit or loss decreased by EUR -80.5 billion (-16.1%) and EUR -71.4 billion (-16.2%) respectively, compared to 31st December 2016.
Financial instruments at fair value through profit or loss mainly comprise:
debt and equity instruments;
trading derivatives;
securities sold under repurchase agreements and securitiespurchased under resale agreements;
securities lending agreements and amounts payable onborrowed securities.
The decrease in financial assets and liabilities at fair value through profit or loss is mainly attributable to a reduction in our trading portfolio activities, mainly related to securities purchased/sold under resale agreements, and in interest rate and foreign exchange trading derivatives.
The impact of exchange rate fluctuations on the valuation of financial instruments has a mirror effect on assets and liabilities.
CCustomer loans, including securities purchased under resale agreements recognised at amortised cost, decreased by EUR 1.3 billion (-0.3%) compared to 31st December 2016, mainly attributable to a reduction in overdrafts and partially offset by an increase in housing and equipment loans.
CCustomer deposits, including securities sold under repurchase agreements recognised at amortised cost, declined by EUR 10.4 billion (-2.5%) compared to 31st December 2016, mainly due to the decrease in term deposits and securities sold under repurchase agreements.
DDue from banks, including securities purchased under resale agreements recognised at amortised cost, increased by EUR 1.4 billion (+2.4%) compared to 31st December 2016, correlating to the growth in securities purchased under resale agreements partially offset by a decrease in current accounts.
DDue to banks, including securities sold under repurchase agreements recognised at amortised cost, increased by EUR 6.0 billion (+7.3%) compared to 31st December 2016.
OOther assets and oother liabilities decreased by EUR 10.9 billion (-15.2%) and EUR 12.8 billion (-15.6%) respectively compared to 31st December 2016, due to a reduction in guarantee deposits.
UUnderwriting reserves of insurance companies increased by EUR 18.2 billion (+16.2%) compared to 31st December 2016, due to Sogecap’s acquisition in 2017 of a 50% interest in Antarius.
GGroup shareholders’’ eequity amounted to EUR 59.4 billion at 31st December 2017 compared to EUR 62 billion at 31st December 2016. This variation was attributable primarily to the following items:
Net income for the financial year at 31st December 2017:EUR +2.8 billion;
Dividend payment in respect of financial year 2016: EUR -2.5billion;
Translation reserves: EUR -2.1 billion concerning mainly thedepreciation of the US dollar;
Redemption of three deeply subordinated notes: EUR -1.1billion;
The disposal of 20.18% of ALD’s shares further to the initialpublic offering: EUR +0.5 billion.
After taking into account non-controlling interests (EUR 4.7 billion), Group shareholders’ equity came to EUR 64.1 billion at 31st December 2017.
2 I 6
F INANCIAL POLICY GGROUP MANAGEMENT REPOORT
62 I 2018 REGISTRATION DOCUMENT I S O C I E T E G E N E R AL E G R O U P
6 . F I N A N C I A L P O L I C Y
The objective of the Group’s financial policy is to optimise the use of shareholders’ equity in order to maximise short- and long-term return for shareholders, while maintaining a level of capital ratios (Common Equity Tier 1, Tier 1 and Total Capital ratios) consistent with the market status of Societe Generale and the Group’s target rating.
Since 2010, the Group has launched a major realignment programme, strengthening capital and focusing on the rigorous management of scarce resources (capital and liquidity) and proactive risk management in order to apply the regulatory changes related to the implementation of new “Basel 3” regulations.
GROUP SHAREHOLDERS’ EQUITY Group shareholders’ equity totalled EUR 59.4 billion at 31st December 2017. Net asset value per share was EUR 63.22 and net tangible asset value per share was EUR 54.36 using the new methodology disclosed in Chapter 2 of this Registration Document, on page 49. Book capital included EUR 8.5 billion in deeply subordinated notes and EUR 0.3 billion in perpetual subordinated notes.
At 31st December 2017, Societe Generale possessed, directly or indirectly, 6.9 million Societe Generale shares, representing
0.85% of the capital (excluding shares held for trading purposes). In 2017, the Group acquired 5.3 million Societe Generale shares under the liquidity contract concluded on 22nd August 2011 with an external investment services provider. Over this period, Societe Generale also transferred 5.3 million Societe Generale shares via the liquidity contract.
The information concerning the Group’s capital and shareholding structure is available in Chapter 7 of this Registration Document, pages 535 and following.
Available funds
Use of funds

2
FINANCIAL POLICY
6 I 2 GGROUP MANAGEMENT REPOORT
S O C I E T E G E N E R AL E G R O U P I 2018 REGISTRATION DOCUMENT I 63
SOLVENCY RATIOS As part of managing its capital, the Group ensures that its solvency level is always compatible with its strategic targets and regulatory obligations.
Moreover, the Group ensures that its Total Capital Ratio (Common Equity Tier 1 + hybrid securities recognised in additional Tier 1 and Tier 2) offers a sufficient safety buffer for unsecured senior lenders, in particular with a view to implementing resolution rules (see Chapter 4.3, page 169).
The Common Equity Tier 1 ratio stood at 11.4% at 31st December 2017, versus 11.5% at 31st December 2016. At 31st December 2017, the Group’s phased-in Common Equity Tier 1 ratio amounted to 11.6% compared to 11.8% at end-December 2016.
The leverage ratio, calculated according to the CRR/CRD4 rules integrating the Delegated Act of October 2014, reached 4.3% as at 31st December 2017, versus 4.2% at end-December 2016. It was thus in line with the projected progression, under which a target ratio level of 4-4.5% had been set.
The Tier 1 ratio is 13.8% and the Total Capital Ratio amounted to 17.0% at end-2017, above the regulatory requirements.
The projected TLAC (Total Loss-Absorbing Capacity) RWA was 21.4% and the TLAC leverage ratio was 6.6% at end-2017. The Group plans to comply with the future TLAC regulatory requirements (TLAC RWA of 19.5% and TLAC leverage ratio of 6% from 1st January 2019), thanks in particular to the issuance of non-preferred senior instruments.
French Act No. 2016-1691 of 9th December 2016, published in the French Official Journal (Journal Officiel) issue 0287 of 10th December 2016, modified the creditor hierarchy that applies in cases of compulsory liquidation of French credit institutions, by introducing a new category of debt securities intended to cover liquidation losses, positioned after subordinated instruments and before preferred debt instruments. Contracts for issues falling into this new category will have to include a specific indication of this ranking in the creditors’ hierarchy. The new category allows for the issuance of TLAC and MREL eligible securities.
Further details on the regulatory framework governing TLAC and MREL are provided in Chapter 4.1, “Risk factors”, item 11, page 142.
Detailed information on capital management, together with the regulatory framework, is provided in Chapter 4 of this Registration Document, pages 166 and following.
In 2017, the Group’s capital generation and developments in its operations portfolio (specifically the year’s disposals and acquisitions) made it possible to finance the exceptional items of the 2017 financial year, while keeping sufficient margin to ensure dividend distribution and hybrid coupons payment, and while maintaining the Common Equity Tier 1 ratio stable overall.
CREATION AND USE OF THE GROUP SHAREHOLDERS’ EQUITY IN 2017
In 2017, the changes in Common Equity Tier 1 capital were as follows:
Available funds (EUR 5.5 billion):
restated net income of EUR 4.5 billion(1);
portfolio adjustment of EUR 0.5 billion;
EUR 0.5 billion increase in the Common Equity Tier 1 capitalratio.
Use of funds (EUR 5.5 billion):
exceptional items for EUR 1.9 billion;
dividend provision for EUR 1.8 billion;
remuneration of hybrid debt booked in equity for EUR 0.5billion;
growth in the risk-weighted assets of core businesses forEUR 0.3 billion;
AMA operational risk add-on for EUR 0.5 billion;
various items for EUR 0.5 billion.
(1) Net income restated for prudential purposes: adjustments related to goodwill impairments, revaluation of own financial liabilities, adjustments to the Group core businesses’ portfolio (especially acquisitions over the year) and exceptional items.
11.8
11.9
00.3
00.5
00.5
00.5
UUse of funds
Various items
AMA operationalrisk add-on
Remuneration ofhybrid debt
Growth of the risk-weighted assets ofCore Businesses
Exceptional items
Provision fordividends
44.5
0.5
00.5
Available funds
Increase inCommonEquity Tier 1ratio
Portfolioadjustements
Restated netincome

2 I 6
F INANCIAL POLICY GGROUP MANAGEMENT REPOORT
64 I 2018 REGISTRATION DOCUMENT I S O C I E T E G E N E R AL E G R O U P
GROUP DEBT POLICY*
FUNDING STRUCTURE
The Group’s funding structure is broken down as follows:
undated subordinated notes (representing EUR 8.9 billion as of 31st December 2017 and EUR 11.1 billion as of 31st December 2016);
debt securities issued by the Group, of which:
– dated subordinated debt (EUR 14.1 billion at end-2017 and EUR 14.5 billion at end-2016),
– long-term vanilla senior non-preferred debt (EUR 6.6 billion at end-2017 and EUR 1.0 billion at end-2016),
– long-term vanilla senior preferred debt (EUR 26.1 billion at end-2017 and EUR 31.3 billion at end-2016),
– covered bonds issued through the following vehicles: SGSCF (EUR 7.1 billion at end-2017 and EUR 7.6 billion at end-2016); SGSFH (EUR 10.3 billion at end-2017 and EUR 9.3 billion at end-2016); and CRH (EUR 6.0 billion at end-2017 and EUR 6.6 billion at end-2016),
– securitisations and other secured debt issues (EUR 3.5 billion at end-2017 and EUR 4.9 billion at end-2016),
– conduits (EUR 9.5 billion at end-2017 and EUR 10.1 billion at end-2016),
– financial liabilities reported at fair value through P&L, including debt securities issued reported in the trading book, and debt securities issued measured using the fair value option through P&L;
amounts due to customers, in particular deposits.
These resources also include funding via securities lending/borrowing transactions and securities sold under repurchase agreements measured at fair value through P&L totalling EUR 140.6 billion at 31st December 2017, versus EUR 171.1 billion at 31st December 2016 (see Note 3.1 of the consolidated financial statements), which are not included in this graph.
The SSociete Generale Grroup’ss debt policy is designed not only to ensure financing for the growth of the businesses’ commercial activities and debt renewal, but also to maintain repayment schedules that are compatible with the Group’s ability to access the market and its future growth.
The Group’s debt policy is based on two principles:
firstly, maintaining an active policy of diversifying the Societe Generale Group’s sources of refinancing in order to guarantee its stability;
secondly, adopting a Group refinancing structure that consistently matches the maturities of its assets and liabilities.
GROUP LONG-TERM DEBT AT 31ST DECEMBER 2016: EUR 159.6 BN*
Subordinated debt (including subordinated undated debt)(1) (EUR 25.6 bn)
Senior structured issues (EUR 60.2 bn)
Senior vanilla preferred unsecured issues (including CD & CP >1y) (EUR 31.3 bn)
Senior vanilla non-preferred unsecured issues (EUR 1.0 bn)
Secured issues (including CRH) (EUR 23.5 bn)
Debt at subsidiaries’ level (secured and unsecured debt) (EUR 18.0 bn)
* Group short-term debt totalled EUR 39.3 billion as of 31st December 2016, of which EUR 10.1 billion issued by conduits.
(1) Of which EUR 11.1 billion accounted as “other equity instruments” (see consolidated financial statements, changes in shareholders’ equity).
GROUP LONG-TERM DEBT AT 31ST DECEMBER 2017: EUR 151.5 BN*
Subordinated debt (including subordinated undated debt)(1) (EUR 23.0 bn)
Senior structured issues (EUR 57.1 bn)
Senior vanilla preferred unsecured issues (including CD & CP >1y) (EUR 26.1 bn)
Senior vanilla non-preferred unsecured issues (EUR 6.6 bn)
Secured issues (including CRH) (EUR 23.4 bn)
Debt at subsidiaries’ level (secured and unsecured debt) (EUR 15.4 bn)
* Group short-term debt totalled EUR 43.6 billion as of 31st December 2017, of which EUR 9.5 billion issued by conduits.
(1) Of which EUR 8.9 billion accounted as “other equity instruments” (see consolidated financial statements, changes in shareholders’ equity).
* Additional information about the Group liquidity risk management is available in Chapter 4 of this Registration Document, on pages 225 and following, and in Note 4.3 to the consolidated financial statements on page 376.
66 6414 14
102 103
71 69
83 89
421 411
31.12.2016 331.12.2017
Due to customers (Notes3.6 and 3.9)
Due to banks (Note 3.6and 3.9)
Financial liabilities at fairvalue through profit orloss - Structured DebtDebt securities issued(Notes 3.6 and 3.9)
Subordinated Debt
Total equity (incl. TSSand TSDI) 116%
37%220%
1%
115%
11%
115%
38%117%
4%
115%
10%
the Group’s long-term financing plan

2
Societe Generale Group’s debt policy
FINANCIAL POLICY
6 I 2 GGROUP MMANAGEMENT REPORT
S O C I E T E G E N E R AL E G R O U P I 2018 REGISTRATION DOCUMENT I 65
Accordingly, tthe Group’’ss long--tterm financing plan, implemented gradually and in a coordinated manner during the year based on a non-opportunistic issuance policy, is designed to maintain a surplus liquidity position over the medium and long term.
At end-2017, the liquidity raised under the 2017 financing programme amounted to EUR 35.0 billion in senior and subordinated debt. The liquidity raised at the parent company level amounted to EUR 30.0 billion at 31st December 2017.
Refinancing sources broke down as EUR 5.6 billion in senior vanilla non-preferred unsecured issues, EUR 21.3 billion in senior structured issues, EUR 2.5 billion in secured issues (SG SFH) and EUR 0.6 billion in subordinated Tier 2 debt. At the subsidiary level, EUR 5.0 billion had been raised at 31st December 2017.
2016 FINANCING PROGRAMME: EUR 35.3 BN
Subordinated undated debt (EUR 1.4 bn)
Subordinated debt
(EUR 2.4 bn)
Senior vanilla non-preferred
unsecured issues (EUR 1.0 bn)
Senior vanilla preferred unsecured issues (EUR 6.1 bn)
Senior structured issues (EUR 17.9 bn)
Secured issues (including
CRH) (EUR 1.3 bn)
Debt at subsidiaries’ level (secured and unsecured) (EUR 5.2 bn)
2017 FINANCING PROGRAMME: EUR 35.0 BN
Subordinated undated debt
(EUR 0 bn)
Subordinated debt (EUR 0.6 bn)
Senior vanilla non-preferred unsecured issues (EUR 5.6 bn)
Senior vanilla preferred unsecured issues (EUR 0 bn)
Senior structured issues (EUR 21.3 bn)
Secured issues (including CRH) (EUR 2.5 bn)
Debt at subsidiaries’ level (secured and unsecured) (EUR 5.0 bn)
LONG-TERM RATINGS, SHORT-TERM RATINGS, COUNTERPARTY RATINGS AND CHANGES OVER THE FINANCIAL YEAR
The table below summarises Societe Generale’s counterparty ratings and senior long-term and short-term ratings as at 31st December 2017:
DBRS FitchRatings Moody’s R&I Standard & Poor’s
Long-term/short-term counterparty assessment
AA/R-1(high) A+ A1(CR)/P-1(CR) n/a A/A-1
Long-term senior preferred rating A (high) (Stable) A+ (Stable) A2 (Stable) A (Stable) A (Stable)
Short-term senior rating R-1 (middle) F1 P-1 n/a A-1
Over the course of financial year 2017, FitchRatings upgraded the long-term counterparty assessment (to A+) and the long-term senior preferred rating (to A+) with a “Stable” outlook, in light of the improved protection of senior preferred debt within the capital structure. The long-term senior ratings from DBRS (A high), Moody’s (A2), R&I (A) and Standard & Poor’s (A) were all maintained with a “Stable” outlook.
77% 17%
33%
50%
44%
15%
44%
2%
16%
661%
7%
14%

2 I 7
MAJOR INVESTMENTS AND D ISPOSALS GGROUP MANAGEMENT REPOORT
66 I 2018 REGISTRATION DOCUMENT I S O C I E T E G E N E R AL E G R O U P
7 . M A J O R I N V E S T M E N T S A N D D I S P O S A L S
The Group maintained a targeted acquisition and disposal policy in 2017, in line with its strategy focused on its core businesses and the management of scarce resources.
Business division Description of investments
2017
International Retail Banking and Financial Services
Acquisition of BBVA Autorenting (operational vehicle leasing in Spain) and of Merrion Fleet (operational vehicle leasing in Ireland).
International Retail Banking and Financial Services Acquisition of 50% and exclusive control of Antarius (insurance).
2016
International Retail Banking and Financial Services Acquisition of the Parcours Group (operational vehicle leasing in France).
Global Banking and Investor Solutions
Acquisition of the Kleinwort Benson Group (private banking in the United Kingdom and Channel Islands).
2015
International Retail Banking and Financial Services Acquisition of a 65% stake in MCB Mozambique.
French Retail Banking Acquisition of 20.5% and exclusive control of Boursorama. Acquisition of 49% and exclusive control of Seftrade Bank in Spain.
Business division Description of investments
2017
International Retail Banking and Financial Services Disposal of 20% of ALD at the time of the company’s stock market listing.
International Retail Banking and Financial Services
Disposal of Splitska Banka in Croatia.
Global Banking and Investor Solutions Disposal of the entire stake in Fortune (49%) in China.
French Retail Banking Disposal of Onvista in Germany.
2016
International Retail Banking and Financial Services
Disposal of 93.6% of Bank Republic in Georgia.
Corporate Centre Disposal of the Group’s stake in Visa Europe.
Corporate Centre Disposal of the 8.6% stake in Axway.
2015
International Retail Banking and Financial Services
Disposal of consumer credit activities in Brazil.
Global Banking and Investor Solutions
Disposal of the entire stake in Amundi (20%) at the time of the company’s stock market listing.
Corporate Centre Disposal of treasury shares (1% of Societe Generale’s total shares). Disposal of the 7.4% interest held by Geninfo in Sopra Stéria.

2
PENDING ACQUISITIONS AND MAJOR CONTRACTS
8 I 2 GGROUP MANAGEMENT REPOORT
S O C I E T E G E N E R AL E G R O U P I 2018 REGISTRATION DOCUMENT I 67
8 . P E N D I N G A C Q U I S I T I O N S A N D M A J O R C O N T R A C T S
Financing of the main ongoing investments The investments currently underway will be financed using the Group’s usual sources of funding.
Pending acquisitions None.
9 . PROPER TY AND EQ U IPMEN T
The gross book value of Societe Generale Group’s tangible operating fixed assets amounted to EUR 34.7 billion at 31st December 2017. This figure comprises land and buildings (EUR 5.6 billion), assets leased by specialised financing companies (EUR 23.7 billion) and other tangible assets (EUR 5.4 billion).
The gross book value of the Group’s investment property amounted to EUR 0.8 billion at 31st December 2017. The net book value of tangible operating assets and investment property amounted to EUR 22.9 billion, representing only 1.8% of the consolidated balance sheet at 31st December 2017. Due to the nature of Societe Generale’s activities, property and equipment are not material at the Group level.
1 0 . P O S T- C L O S I N G E V E N T S
On 14th December 2017, Societe Generale announced the signature of an agreement for the acquisition of Cegelease, a company specialised in corporate equipment finance. This acquisition was finalised on 28th February 2018.

2 I 11 INFORMATION ABOUT GEOGRAPHIC LOCATIONS
AND ACTIVITIES AS AT 31ST DECEMBER 2017 GGROUP MANAGEMENT REPOORT
68 I 2018 REGISTRATION DOCUMENT I S O C I E T E G E N E R AL E G R O U P
1 1 . I N F O R M AT I O N A B O U T GEOGRAPHIC L O C AT I O N S A N D A C T I V I T I E S A S AT 3 1 S T D E C E M B E R 2 0 1 7
Article L.511-45 of the French Monetary and Financial Code modified by Order No. 2014-158 of 20th February 2014 requires credit institutions to communicate information about the locations and activities of their entities included in their consolidation scope, in each State or territory.
Societe Generale publishes below staff-related and financial information by country or territory.
The list of locations is published in Note 8.6 to the consolidated financial statements.
Country Staff* NBI* Earnings before corporate tax*
Corporate tax*
Deferred corporate
tax* Other taxes* Subsidies*
South Africa 94 14 7 (2) (0) (1) -
Albania 413 27 3 (1) (0) (1) -
Algeria 1,494 170 96 (26) (1) (9) -
Germany 2,981 750 224 (39) (18) (48) -
Australia 22 14 (2) (1) 1 (0) -
Austria 67 12 4 (1) (0) (0) -
Belgium 483 127 45 (14) 0 (14) -
Benin 246 20 (14) (0) 2 (0) -
Bermuda((1) - 7 7 - - - -
Brazil 411 105 104 (21) (3) (1) -
Bulgaria 1,509 135 65 (6) (0) (11) -
Burkina Faso 299 43 16 (2) 1 (1) -
Cameroon 640 90 38 (15) (1) (4) -
Canada 70 30 8 (5) (2) (1) -
China 382 50 16 0 (12) (7) -
South Korea 115 132 77 (24) 2 (3) -
Cote d’’Ivoire 1,142 160 73 (17) 2 (7) -
Croatia 31 43 (7) (0) 1 (0) -
Curacao((2) - 0 0 - - (0) -
Denmark 169 71 42 (3) (1) (5) -
United Arab Emirates 42 5 (3) - - - -
Spain 712 297 110 (5) (9) (18) -
Estonia - - - - - - -
United States 2,462 1,331 206 (7) (291) (5) -
Finland 99 53 36 (6) (1) - -
France 55,903 10,642 (202) (78) (270) (1,153) -

2
INFORMATION ABOUT GEOGRAPHIC LOCATIONS AND ACTIVITIES AS AT 31ST DECEMBER 2017
11 I 2 GGROUP MANAGEMENT REPOORT
S O C I E T E G E N E R AL E G R O U P I 2018 REGISTRATION DOCUMENT I 69
Country Staff* NBI* Earnings before
corporate tax*Corporate
tax*
Deferredcorporate
tax*Other
taxes* Subsidies*
GGhana 581 77 28 (8) (1) (2) -
GGibraltar 39 15 1 (0) 0 (0) -
GGreece 36 5 2 (0) (0) - -
GGuinea 314 38 19 (7) (0) (1) -
EEquatorial Guinea 291 38 12 (7) (0) (0) -
HHong Kong 1,106 713 323 (50) 2 (0) -
HHungary 109 15 7 (0) (0) (0) -
IIsle of Man - - - - - - -
GGuernsey 177 28 6 (1) - - -
CCayman Islands((3) - 0 0 (0) - - -
BBritish Virgin Islands - - - - - -
IIndia((4) 6,592 84 93 (31) 2 (13) -
IIreland 150 59 43 (5) (1) (0) -
IItaly 2,065 712 269 (38) 12 (30) -
JJapan 301 226 86 1 (5) (5) -
JJersey 246 81 10 (1) (1) (5) -
LLatvia - - - - - - -
LLebanon - - 29 - - - -
LLithuania - - - - - - -
LLuxembourg 1,386 738 462 (46) (8) (26) -
MMacedonia 401 27 5 (0) 0 (1) -
MMadagascar 874 51 26 (6) 0 (2) -
MMalta - - - - - - -
MMorocco 3,768 460 170 (78) 14 (29) -
MMauritius - (0) (0) - - - -
MMexico 126 12 5 (1) (0) (1) -
MMoldova 714 30 12 (2) 0 (0) -
MMonaco 340 143 70 (21) - (0) -
MMontenegro 297 26 9 (1) 0 (3) -
NNorway 319 133 77 (7) 1 - -
NNew Caledonia 305 77 37 (16) 0 (0) -
NNetherlands 198 53 21 2 (7) 0 -
PPhilippines((5) - - (0) - - - -
PPoland 2,902 241 49 (13) (0) (18) -
FFrench Polynesia 285 48 25 (11) (4) (1) -
PPortugal 93 15 7 (3) 1 - -
CCzech Republic 8,664 1 212 704 (116) (0) (65) -
RRomania 8,870 611 378 (59) 0 (36) -
UUnited Kingdom 3,736 1 882 706 (109) (58) (185) -
RRussian Federation 16,245 865 265 (57) (14) (36) -
SSenegal 719 89 31 (3) (2) (7) -
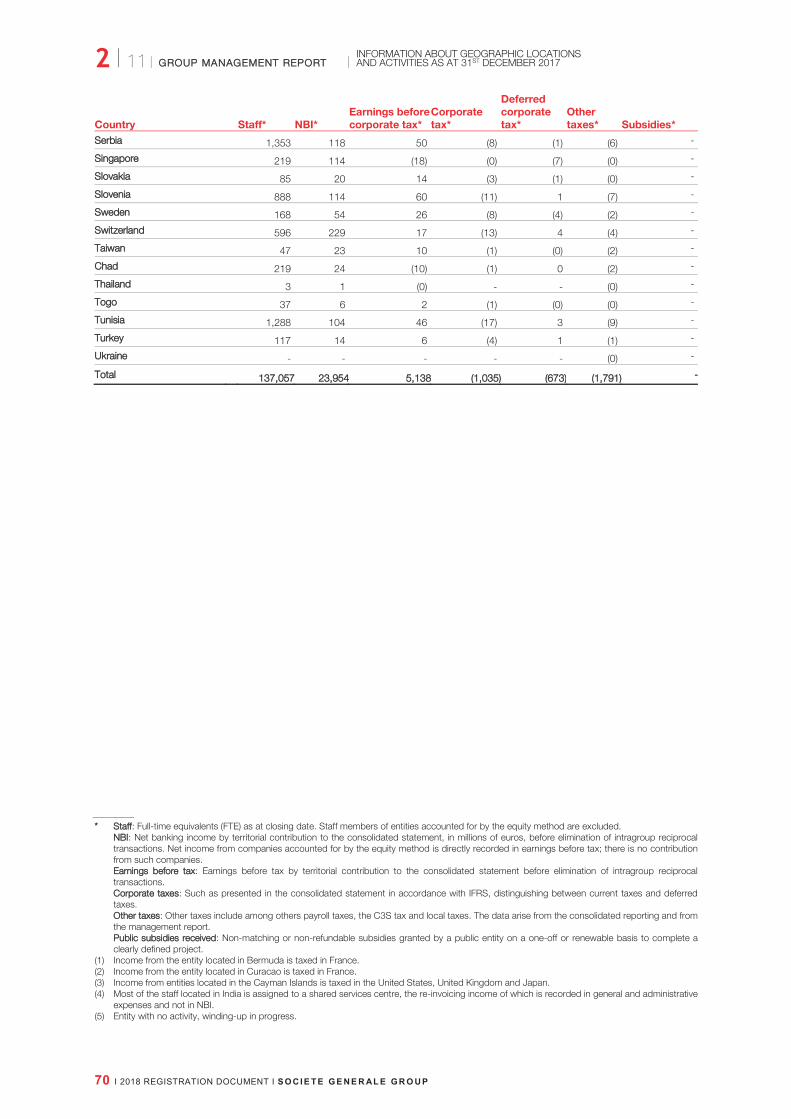
2 I 11 INFORMATION ABOUT GEOGRAPHIC LOCATIONS
AND ACTIVITIES AS AT 31ST DECEMBER 2017 GGROUP MANAGEMENT REPOORT
70 I 2018 REGISTRATION DOCUMENT I S O C I E T E G E N E R AL E G R O U P
Country Staff* NBI* Earnings before corporate tax*
Corporate tax*
Deferred corporate tax*
Other taxes* Subsidies*
SSerbia 1,353 118 50 (8) (1) (6) -
Singapore 219 114 (18) (0) (7) (0) -
Slovakia 85 20 14 (3) (1) (0) -
Slovenia 888 114 60 (11) 1 (7) -
Sweden 168 54 26 (8) (4) (2) -
Switzerland 596 229 17 (13) 4 (4) -
Taiwan 47 23 10 (1) (0) (2) -
Chad 219 24 (10) (1) 0 (2) -
Thailand 3 1 (0) - - (0) -
Togo 37 6 2 (1) (0) (0) -
Tunisia 1,288 104 46 (17) 3 (9) -
Turkey 117 14 6 (4) 1 (1) -
Ukraine - - - - - (0) -
Total 137,0577 23,9544 5,1388 (1,035) (673) (1,791) -
* Staff: Full-time equivalents (FTE) as at closing date. Staff members of entities accounted for by the equity method are excluded. NBI: Net banking income by territorial contribution to the consolidated statement, in millions of euros, before elimination of intragroup reciprocal
transactions. Net income from companies accounted for by the equity method is directly recorded in earnings before tax; there is no contribution from such companies.
Earnings before tax: Earnings before tax by territorial contribution to the consolidated statement before elimination of intragroup reciprocal transactions.
CCorporate taxes: Such as presented in the consolidated statement in accordance with IFRS, distinguishing between current taxes and deferred taxes.
OOther taxes: Other taxes include among others payroll taxes, the C3S tax and local taxes. The data arise from the consolidated reporting and from the management report.
PPublic subsidies received: Non-matching or non-refundable subsidies granted by a public entity on a one-off or renewable basis to complete a clearly defined project.
(1) Income from the entity located in Bermuda is taxed in France. (2) Income from the entity located in Curacao is taxed in France. (3) Income from entities located in the Cayman Islands is taxed in the United States, United Kingdom and Japan. (4) Most of the staff located in India is assigned to a shared services centre, the re-invoicing income of which is recorded in general and administrative
expenses and not in NBI. (5) Entity with no activity, winding-up in progress.
CORPORATE GOVERNANCE

* Staff NBI
Earnings before tax
Corporate taxes
Other taxes
Public subsidies received
S O C I E T E G E N E R AL E G R O U P I 2018 REGISTRATION DOCUMENT I 71
3
CORPORATE GOVERNANCE
1. Board of Directors’ report on corporate governance ........................................... 72
Governance .................................................................................................................................................................. 72 Board of Directors ........................................................................................................................................................ 73 General Management ................................................................................................................................................... 93 Governance bodies ....................................................................................................................................................... 96 Remuneration of Group senior management .................................................................................................................. 99 Additional information ................................................................................................................................................. 129
2. Statutory Auditors’ special report on related-party agreements and commitments ......................................................................... 133

3 I 1
BOARD OF DIRECTORS’ REPORT ON CORPORATE GOVERNANCE CCORPORATE GGOVERNANCE
72 I 2018 REGISTRATION DOCUMENT I S O C I E T E G E N E R AL E G R O U P
1 B O A R D O F D I R E C T O R S ’ R E P O R T O N C O R P O R AT E G O V E R N A N C E
GOVERNANCE (AS AT 1ST JANUARY 2018)
Presentation of the organisation
The composition of the Board of Directors is presented on pages 73 and following of this Registration Document. The Internal Rules of the Board of Directors defining its powers are provided in Chapter 7, page 546. The Board’s work is presented on pages 85 and 86.
The composition of the General Management and Management Committee is presented in the respective sections of this chapter (see pp. 93 and 97).
The role of the supervision committees is described on page 96.
The Chairman and the different Board of Directors’ Committees and their powers, along with their activity reports, are presented on pages 84 and following, in particular:
Role of the Chairman and the report on his activities, p. 84;
Audit and Internal Control Committee, p. 86;
Risk Committee, p. 88;
Compensation Committee, p. 90;
Nomination and Corporate Governance Committee, p. 91.
(AS AT 1ST JANUARY 2018)

3
BOARD OF DIRECTORS’ REPORT ON CORPORATE GOVERNANCE
1 I 3 CCORPORATE GGOVERNANCE
S O C I E T E G E N E R AL E G R O U P I 2018 REGISTRATION DOCUMENT I 73
Organisation of the governance On 15th January 2015, the Board of Directors decided that the offices of Chairman and Chief Executive Officer would be separated following the General Meeting of 19th May 2015. At that date, Lorenzo Bini Smaghi became Chairman of the Board, and Frédéric Oudéa remained Chief Executive Officer.
Frédéric Oudéa is assisted by three Deputy Chief Executive Officers.
Statement on the corporate governance regime Societe Generale refers to the AFEP-MEDEF Corporate Governance Code for listed companies (amended in November 2016, hereinafter the “AFEP-MEDEF Code” – document available at www.afep.com). In accordance with the “comply or explain” principle, Societe Generale specifies that it applies all recommendations from the AFEP-MEDEF Code.
The operation of the Board of Directors and the Committees is governed by internal rules (hereinafter the “Internal Rules”), updated on 12th January 2018. The Internal Rules and the Company’s By-laws are included in the Registration Document (see chapter 7).
BOARD OF DIRECTORS ((AS AT 1SST JJANUARY 22018)
As at 1st January 2018, the Board comprised twelve Directors appointed by the General Meeting and two Directors representing the employees. A representative of the Social and Economic Committee attends meetings of the Board of Directors, without voting rights.
The duration of the term of office of Directors appointed by the General Meeting is four years. The expiry of these terms of office is staggered, enabling the renewal or appointment of between two and five Directors every year.
The two Directors elected by Societe Generale’s employees, France Houssaye and Béatrice Lepagnol, whose terms of office were renewed on 19th March 2015, have a three-year term of office expiring at the end of the General Meeting dated May 2018.
The average age of Directors is 59.
The average seniority of the Board of Directors will be less than six years at the date of the next General Meeting.
Ten Directors are members of one or several Board of Directors’ committees.
Composition of the Board of Directors
Directors Gender Age(1) Nationality Initial year of appointment
End ofterm of
office (GM)
Number of years
on theBoard(2)
Independent Director
Member ofa Board
committee
Number of terms of
offices held in listed
companies
LLorenzo BINI SMAGHI Chairman of the Board ofDirectors
M 61 Italian 2014 2018 4 Yes - 2
FFrédéric OUDÉA Chief Executive Officer
M 54 French 2009 2019 9 No - 1
RRobert CASTAIGNE M 71 French 2009 2018 9 Yes CACI(3)
CONOM(4) 4
WWilliam CONNELLY M 59 French 2017 2021 1 Yes CR(5) 2
KKyra HAZOU F 61 British/
American 2011 2019 7 Yes
CACI(3) CR(5)
1
FFrance HOUSSAYE F 50 French 2009 2018 9 No COREM(6) 1
BBéatrice LEPAGNOL F 47 French 2012 2018 6 No - 1
JJean--BBernard LÉVY M 62 French 2009 2021 9 Yes Chairman of the COREM(6)
CONOM(4) 3
AAna--MMaria LLOPIS RIVAS F 67 Spanish 2011 2019 7 Yes CONOM(4) 2
GGérard MESTRALLET M 68 French 2015 2019 3 Yes Chairman of
the CONOM(4) COREM(6)
4
JJuan Maria NIN GENOVA M 64 Spanish 2016 2020 2 Yes CR(5)
COREM(6) 2
NNathalie RACHOU F 60 French 2008 2020 10 Yes Chairman of
the CR(5) CACI(3)
4
LLubomira ROCHET F 40 French 2017 2021 1 Yes - 1
AAlexandra SCHAAPVELD F 59 Dutch 2013 2021 5 Yes Chairman of the CACI(3)
CR(5) 3
(1) Age as at 1st January 2018. (2) As at the date of the next General Meeting, to be held on
23rd May 2018. (3) Audit and Internal Control Committee.
(4) Nomination and Corporate Governance Committee. (5) Risk Committee. (6) Compensation Committee.

3 I 1
BOARD OF DIRECTORS’ REPORT ON CORPORATE GOVERNANCE CCORPORATE GGOVERNANCE
74 I 2018 REGISTRATION DOCUMENT I S O C I E T E G E N E R AL E G R O U P
CHANGES IN THE COMPOSITION OF THE BOARD OF DIRECTORS IN 2017 Director Departure Appointment Renewal Nationality
Barbara DALIBARD 23rd May 2017 French William CONNELLY 23rd May 2017 French Jean-Bernard LÉVY 23rd May 2017 French Lubomira ROCHET 23rd May 2017 French Alexandra SCHAAPVELD 23rd May 2017 Dutch
EXPERIENCED AND COMPLEMENTARY DIRECTORS The composition of the Board is designed to achieve a balance between experience, expertise and independence, in accordance with parity.
Expertise and experience in the financial world and the management of large international companies are the basic criteria for the selection of Directors. Each year, the balance thus established in the composition of the Board is reviewed by the Nomination and Corporate Governance Committee and the
Board of Directors. The analysis of the Directors’ expertise shows the complementary nature of their various profiles, which cover the entire spectrum of the Bank’s business and the risks associated with its activity.
DIRECTORS’ EXPERTISE The table below summarises the Directors' main areas of expertise and experience. Their biographies can be found in this chapter 3, pages 77 to 83.

3
BOARD OF DIRECTORS’ REPORT ON CORPORATE GOVERNANCE
1 I 3 CCORPORATE GGOVERNANCE
S O C I E T E G E N E R AL E G R O U P I 2018 REGISTRATION DOCUMENT I 75
A BALANCED REPRESENTATION OF WOMEN AND MEN WITHIN THE BOARD OF DIRECTORS As at 1st January 2018, the Board of Directors comprised seven women and seven men, i.e. 50% women or 41.6% if the two Directors representing the employees are excluded from the calculation, in accordance with the provisions of the law dated 27th January 2011.
OVER 90% OF INDEPENDENT DIRECTORS In accordance with the AFEP-MEDEF Code, and based on the report of its Nomination and Corporate Governance Committee, the Board of Directors conducted an examination of the situation of each of its members as at 1st January 2018 in view of the independence criteria defined in the aforementioned report.
The Board of Directors checked the status of the business relationships existing between the Directors or the companies they manage and Societe Generale or its subsidiaries. This concerns both client and supplier relationships.
In particular, it examined the banking and advisory relations between the Group and the companies in which its Directors are also executive officers, in order to assess whether these relations were of such significance and nature as to possibly affect the Directors’ independence of judgement. This analysis is based on a multi-criteria review integrating several parameters (the company’s overall debt and liquidity, the ratio of bank debt to overall debt, the amount of Societe Generale’s commitments and the significance of
these commitments compared to the total bank debt, advisory offices held, and other commercial relations).
This examination was conducted in particular with respect to Jean-Bernard Lévy, Chairman and Chief Executive Officer of EDF, Gérard Mestrallet, Chairman of ENGIE, and William Connelly, Member of the Supervisory Board of Aegon N.V.
In the first two cases, the Committee observed that the economic, financial and other relations between the Directors, the groups they manage and Societe Generale were not of such a nature as to alter the examination conducted in early 2017. Societe Generale’s role in financing the debt of their groups appeared to be compatible with the Committee’s assessment criteria (less than 5%). They are therefore considered independent. The same examination was conducted with respect to William Connelly. He is also considered independent.
Following these analyses, only three Directors are considered not independent: Frédéric Oudéa and the two Directors representing the employees.
As at 1st January 2018, 11 out of 14 Directors were independent, i.e. 91.6% of the members of the Board of Directors, using the AFEP-MEDEF Code’s calculation rule that excludes employee representatives.
This proportion is well above the Board of Directors’ objective of complying with the minimum proportion of 50% of independent Directors recommended in the AFEP-MEDEF Code.
DIRECTORS’ POSITION IN RESPECT OF THE AFEP-MEDEF CODE’S INDEPENDENCE CRITERIA
Lo
ren
zo
BIN
I S
MA
GH
I(1)
Fré
dé
ric
OU
DÉ
A
Ro
be
rt C
AS
TA
IGN
E
Willia
m C
ON
NE
LL
Y
Kyra
HA
ZO
U
Fra
nc
e H
OU
SS
AY
E
Bé
atr
ice
LE
PA
GN
OL
Je
an
-Be
rna
rd L
ÉV
Y
An
a-M
ari
a L
LO
PIS
RIV
AS
Gé
rard
ME
ST
RA
LL
ET
Ju
an
Ma
ria
NIN
GE
NO
VA
Na
tha
lie
RA
CH
OU
Lu
bo
mir
a R
OC
HE
T
Ale
xa
nd
ra S
CH
AA
PV
EL
D
Over the past five years, company employee or Chief Executive Officer status(2)
0 X 0 0 0 X X 0 0 0 0 0 0 0
Existence or otherwise of cross-directorship 0 0 0 0 0 0 0 0 0 0 0 0 0 0
Existence or otherwise of significant business relations
0 0 0 0 0 0 0 0 0 0 0 0 0 0
Existence of close family ties with an executive officer
0 0 0 0 0 0 0 0 0 0 0 0 0 0
Not having been a Statutory auditor for the company over the past five years
0 0 0 0 0 0 0 0 0 0 0 0 0 0
Not having been a company Director for more than twelve years
0 0 0 0 0 0 0 0 0 0 0 0 0 0
Representative of major shareholders 0 0 0 0 0 0 0 0 0 0 0 0 0 0
(1) the Chairman receives neither variable compensation, nor attendance fees, nor securities, nor any compensation contingent on the performance of Societe Generale or the Group.
(2) in a company that the company consolidates, the parent company of the company or a company consolidated by that parent company.

3 I 1
BOARD OF DIRECTORS’ REPORT ON CORPORATE GOVERNANCE CCORPORATE GGOVERNANCE
76 I 2018 REGISTRATION DOCUMENT I S O C I E T E G E N E R AL E G R O U P
DILIGENT DIRECTORS In 2017, Lorenzo Bini Smaghi chaired all Board meetings.
The Directors’ attendance rates at Board and Committee meetings are very high.
The average attendance rate per meeting is 94% (93% in 2016) for the Board of Directors, 93% (100% in 2016) for the Audit and Internal Control Committee (CACI), 96% (98% in 2016) for the Risk Committee (CR), 86% (91% in 2016) for the Nomination and Corporate Governance Committee (CONOM) and 96% (96% in 2016) for the Compensation Committee (COREM).
ATTENDANCE IN 2017
Board of Directors CACI CR CONOM COREM
Number of meetings
Attendance rate
Number of meetings
Attendance rate
Number of meetings
Attendance rate
Number of meetings
Attendance rate
Number of meetings
Attendance rate
Lorenzo BINI SMAGHI 13 100%
Frédéric OUDÉA 13 100%
Robert CASTAIGNE 11 85% 9 82% 6 86%
William CONNELLY(1) 6 100% 3 100%
Barbara DALIBARD(2) 6 86%
Kyra HAZOU 13 100% 11 100% 11 100%
France HOUSSAYE 13 100% 7 100%
Béatrice LEPAGNOL 12 92%
Jean-Bernard LÉVY 13 100% 6 86% 7 100%
Ana-Maria LLOPIS RIVAS 12 92% 5 71%
Gérard MESTRALLET 11 85% 7 100% 6 86%
Juan Maria NIN GENOVA 12 92% 10 91% 7 100%
Nathalie RACHOU 13 100% 11 100% 11 100%
Lubomira ROCHET(3) 5 83%
Alexandra SCHAAPVELD 12 92% 10 91% 10 91%
Number of meetings heldin 2017
13 11 11 7 7
Average attendance rate(%) 94% 93% 96% 86% 96%
(1) As from 23rd May 2017 and Member of CR as from 1st November 2017. (2) Until 23rd May 2017. (3) As from 23rd May 2017.
A COMPOSITION IN KEEPING WITH THE GROUP’S INTERNATIONAL DIMENSION Five different nationalities are represented at the Board of Directors and all members, excluding the Directors representing the employees, have an international experience, they have either performed a function outside of France during their careers, or they have held corporate offices in foreign companies.
DIRECTORS BOUND BY STRINGENT ETHICS RULES AND REQUIRED TO HOLD A SIGNIFICANT NUMBER OF SOCIETE GENERALE SHARES Each Director is required to comply with the ethics rules provided for in the Internal Rules, in particular regarding the regulations relating to insider trading.
EExtract from Article 4 of the Internal Rules:
4.3 - Directors shall abstain from intervening on the market of Societe Generale Financial instruments during the 30 calendar days preceding the publication of Societe Generale’s quarterly, half-yearly and annual results as well as on the day of the said publication.
They shall refrain from carrying out speculative or leveraged transactions on Societe Generale Financial instruments or those of a listed company controlled directly or indirectly by Societe Generale within the meaning of Article L. 233-3 of the French Commercial Code.
They shall inform the Secretary of the Board of Directors of any difficulty they may encounter in enforcing the above.
Directors appointed by the General Meeting must hold a minimum of 600 shares after six months of office and 1,000 shares after one year, in accordance with the provisions of Article 16 of the Internal Rules. As at 31st December 2017, all Directors comply with these rules. The Chairman of the Board of Directors
held 2,000 Societe Generale shares. Each Director shall refrain from hedging his/her shares.
Chief Executive Officers are bound by specific obligations (see p. 128 – Societe Generale share ownership and holding obligations).

3
BOARD OF DIRECTORS’ REPORT ON CORPORATE GOVERNANCE
1 I 3 CCORPORATE GOVERNANCEE
S O C I E T E G E N E R AL E G R O U P I 2018 REGISTRATION DOCUMENT I 77
Presentation of the Board of Directors’ members
DDate of birth: 29th November 1956
YYear of first appointment: 2014
TTerm of office expires in: 2018
Holds 2,000 shares
PProfessional address:
Tours Société Générale,
75886 Paris Cedex 18
Lorenzo BINI SMAGHI Chairman of the Board of Directors
Independent Director
Biography
An Italian national, with a degree in Economic Sciences from the Université Catholique de Louvain (Belgium)and a Ph.D in Economic Sciences from the University of Chicago. Began his career in 1983 as an Economist atthe Research Department of the Banca d’Italia. In 1994, appointed Head of the Policy Division of the EuropeanMonetary Institute. In October 1998, Director-General of International Financial Relations in Italy’s Economy andFinance Ministry. Chairman of SACE from 2001 to 2005. From June 2005 to December 2011, member of theExecutive Board of the European Central Bank. From 2012 to 2016, Chairman of the Board of Directors ofSNAM (Italy). He is currently Chairman of the Board of Directors of Italgas (Italy) since 2016 and of SociétéGénérale since 2015.
Other offices held currently Other offices and positions held in other companies in the past five years
In foreign listed companies
Chairman of the Board of Directors: Italgas (Italy)(since 2016).
In foreign unlisted companies
Director: TAGES Holding (Italy) (since 2014).
Chairman of the Board of Directors: SNAM (Italy) (from 2012 to 2016), ChiantiBanca (Italy) (from2016 to 15th May 2017).
Director: Morgan Stanley (United Kingdom) (from 2013 to 2014).
DDate of birth: 3rd July 1963
Year of first appointment: 2009
Term of office expires in: 2019 Holds:
137,120 shares
2,064 shares through Société Générale Actionnariat (Fonds E)
Professional address:
Tours Société Générale,
75886 Paris Cedex 18
Frédéric OUDÉA Chief Executive Officer
Biography
Frédéric Oudéa is a graduate of the École Polytechnique and the École Nationale d’Administration. From 1987to 1995, he held a number of posts in the French senior civil service, Audit Department of the Ministry ofFinance, Ministry of the Economy and Finance, Budget Ministry and Cabinet of the Ministry of the Treasury andCommunication. He joined Societe Generale in 1995 and went from being Deputy Head to Head of theCorporate Banking arm in London. In 1998, he became Head of Global Supervision and Development ofEquities. Appointed Deputy Chief Financial Officer of the Societe Generale Group in May 2002. Appointed ChiefFinancial Officer in January 2003. Appointed Chief Executive Officer of the Group in 2008. Chairman and ChiefExecutive Officer of Societe Generale from May 2009 to May 2015. Chief Executive Officer since May 2015,further to the separation of the functions of Chairman of the Board of Directors and of Chief Executive Officer.
Other offices held currently Other offices and positions held in other companies in the past five years
None. None.
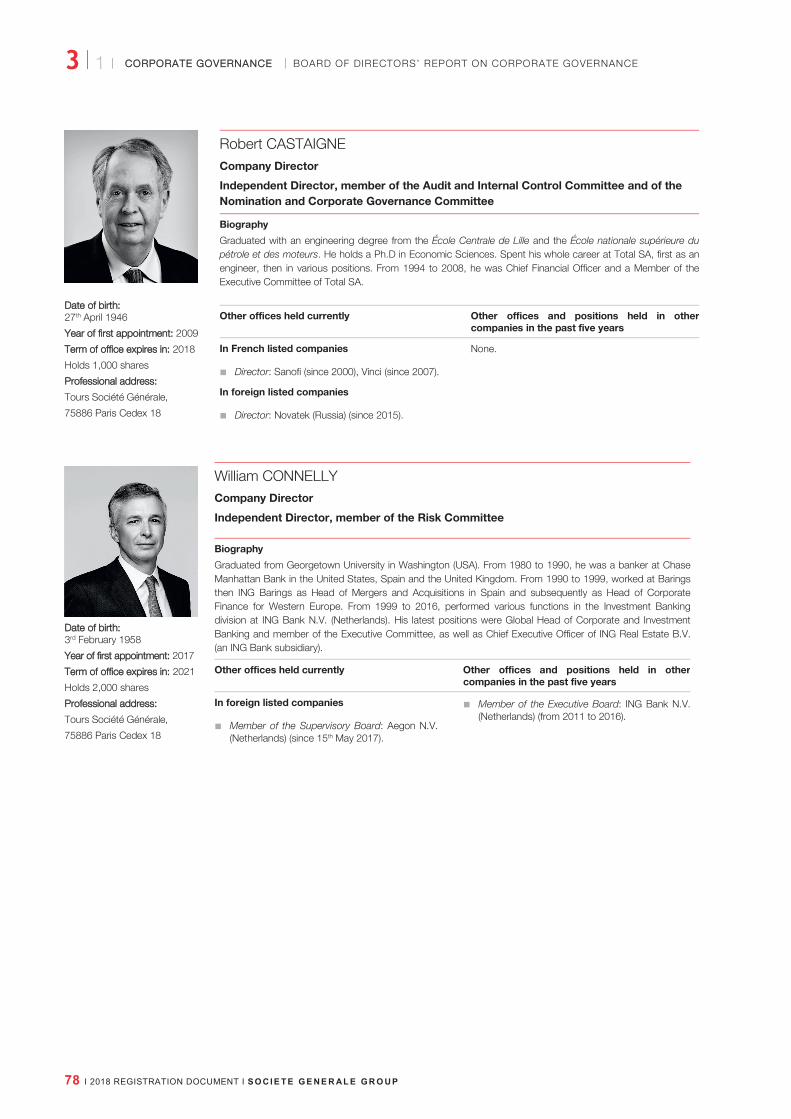
3 I 1
BOARD OF DIRECTORS’ REPORT ON CORPORATE GOVERNANCE CCORPORATE GGOVERNANCE
78 I 2018 REGISTRATION DOCUMENT I S O C I E T E G E N E R AL E G R O U P
DDate of bbirth: 27th April 1946
YYear of first appointment: 2009
TTerm of office expires in: 2018
Holds 1,000 shares
PProfessional address:
Tours Société Générale,
75886 Paris Cedex 18
Robert CASTAIGNE Company Director
Independent Director, member of the Audit and Internal Control Committee and of the
Nomination and Corporate Governance Committee
Biography
Graduated with an engineering degree from the École Centrale de Lille and the École nationale supérieure du
pétrole et des moteurs. He holds a Ph.D in Economic Sciences. Spent his whole career at Total SA, first as an engineer, then in various positions. From 1994 to 2008, he was Chief Financial Officer and a Member of theExecutive Committee of Total SA.
Other offices held currently Other offices and positions held in other companies in the past five years
In French listed companies
Director: Sanofi (since 2000), Vinci (since 2007).
In foreign listed companies
Director: Novatek (Russia) (since 2015).
None.
DDate of birth: 3rd February 1958
Year of first appointment: 2017
Term of office expires in: 2021
Holds 2,000 shares
Professional address:
Tours Société Générale,
75886 Paris Cedex 18
William CONNELLY Company Director
Independent Director, member of the Risk Committee
Biography
Graduated from Georgetown University in Washington (USA). From 1980 to 1990, he was a banker at Chase Manhattan Bank in the United States, Spain and the United Kingdom. From 1990 to 1999, worked at Baringsthen ING Barings as Head of Mergers and Acquisitions in Spain and subsequently as Head of Corporate Finance for Western Europe. From 1999 to 2016, performed various functions in the Investment Banking division at ING Bank N.V. (Netherlands). His latest positions were Global Head of Corporate and InvestmentBanking and member of the Executive Committee, as well as Chief Executive Officer of ING Real Estate B.V. (an ING Bank subsidiary).
Other offices held currently Other offices and positions held in other companies in the past five years
In foreign listed companies
Member of the Supervisory Board: Aegon N.V.(Netherlands) (since 15th May 2017).
Member of the Executive Board: ING Bank N.V.(Netherlands) (from 2011 to 2016).

3
BOARD OF DIRECTORS’ REPORT ON CORPORATE GOVERNANCE
1 I 3 CCORPORATE GOVERNANCEE
S O C I E T E G E N E R AL E G R O U P I 2018 REGISTRATION DOCUMENT I 79
DDate of birth: 13th December 1956
YYear of first appointment: 2011
TTerm of office expires in: 2019
Holds 1,000 shares
PProfessional address:
Tours Société Générale,
75886 Paris Cedex 18
Kyra HAZOU Company Director
Independent Director, member of the Audit and Internal Control Committee and of the
Risk Committee
Biography
A British and US national, graduated with a J.D. from Georgetown University Law Center in Washington (USA). Managing Director and Regional General Counsel for Salomon Smith Barney/Citibank from 1985 to 2000, after acting as a lawyer in London and New York. From 2001 to 2007, was a non-executive Director and a member of the Audit Committee and Risk Committee at the Financial Services Authority in London.
Other offices held currently Other offices and positions held in other companies in the past five years
None. None.
Date of birth: 18th March 1955
Year of first appointment: 2009
TTerm of office expires in: 2021
Holds 1,000 shares
Professional address:
22-30 avenue de Wagram,
75008 Paris
Jean-Bernard LÉVY Chairman and Chief Executive Officer of EDF
Independent Director, Chairman of the Compensation Committee and member of the
Nomination and Corporate Governance Committee
Biography
Graduate of the École Polytechnique and Télécom Paris Tech. From 1978 to 1986, engineer at France Télécom.From 1986 to 1988, technical advisor to the Cabinet of Gérard Longuet, Deputy Minister for the Postal Serviceand Telecommunications. From 1988 to 1993, Head of Telecommunication Satellites at Matra Marconi Space.From 1993 to 1994, Director of the Cabinet of Gérard Longuet, French Minister for Industry, Postal Service,Telecommunications and Foreign Trade. From 1995 to 1998, Chairman and Chief Executive Officer of MatraCommunication. From 1998 to 2002, Chief Executive Officer and then Managing Partner responsible for Corporate Finance of Oddo et Cie. Joined Vivendi in August 2002 as Chief Executive Officer. Chairman of the Management Board of Vivendi from 2005 to 2012. Chairman and Chief Executive Officer of Thalès from 2012 to 2014. Chairman and Chief Executive Officer of EDF since November 2014.
Other offices held currently Other offices and positions held in other companies in the past five years
In French listed companies:
Chairman and Chief Executive Officer: EDF*(since 2014).
In French unlisted companies:
Chairman of the Supervisory Board: Framatome* (since 31st December 2017).
Director: Dalkia* (since 2014), EDF ÉnergiesNouvelles* (since 2015).
In foreign listed companies:
Chairman of the Board of Directors: Edison S.p.A* (Italy) (since 2014).
In foreign unlisted companies:
Director: EDF Energy Holdings* (United Kingdom) (since 1st November 2017).
*EDF Group
Chairman and Chief Executive Officer: Thalès(from 2012 to 2014).
Chairman of the Supervisory Board: Viroxis (from 2007 to 2014).
Chairman of the Board of Directors: JBLConsulting & Investment SAS (from 2012 to2014), EDF Energy Holdings* (United Kingdom)(from 2015 to 1st November 2017).
Director: Vinci (from 2007 to 2015), DCNS (from2013 to 2014).

3 I 1
BOARD OF DIRECTORS’ REPORT ON CORPORATE GOVERNANCE CCORPORATE GGOVERNANCE
80 I 2018 REGISTRATION DOCUMENT I S O C I E T E G E N E R AL E G R O U P
DDate of birth: 5th August 1950
YYear of first appointment: 2011
TTerm of office expires in: 2019
Holds 1,000 shares
PProfessional address:
Tours Société Générale,
75886 Paris Cedex 18
Ana-Maria LLOPIS RIVAS Founder, Chairman and Chief Executive Officer of Global Ideas4all, S.L.
Independent Director, member of the Nomination and Corporate Governance Committee
Biography
A Spanish national, spent 11 years in the Spanish banking sector (Banesto and Santander Group) where shenotably founded an online bank and brokerage firm. Executive Chairman of Razona, a financial consulting firm,then Executive Vice-Chairman of Financial and Insurance Markets of the consultancy Indra. At the same time,Non-Executive Director and member of the Audit Committee of Reckitt-Benckiser, then a member of theSupervisory Board of ABN-AMRO. She is currently the founder, Chairman and Chief Executive Officer of Global Ideas4all, S.L. as well as Non-Executive Chairman of the Board of Directors of DIA Group SA.
Other offices held currently Other offices and positions held in other companies in the past five years
In foreign listed companies:
Non-executive Chairman of the Board of Directors: DIA Group SA (Spain) (since 2011).
In foreign unlisted companies:
Founder, Chairman and Chief Executive Officer: Global Ideas4all, S.L. (Spain) (since 2008).
Director: AXA Spain (Spain) (from 2013 to 2015),R&R Music (United Kingdom) (from 2012 to2014).
DDate of birth: 1st April 1949
Year of ffirst appointment: 2015
Term of office expires in: 2019
Holds 1,200 shares
Professional address:
1 place Samuel-de-Champlain,
Faubourg de l’Arche,
92930 Paris La Défense
Gérard MESTRALLET Chairman of the Board of Directors of ENGIE
Independent Director, Chairman of the Nomination and Corporate Governance
Committee and member of the Compensation Committee
Biography
Graduate of the École Polytechnique and the École Nationale d’Administration. Held different positions in the French Administration before joining the Compagnie Financière de Suez in 1984 as Special Advisor to the Chairman, then as Senior Executive Vice-Chairman in charge of industrial affairs. In February 1991, Executive Director of Societe Generale de Belgique. In July 1995, Chairman and Chief Executive Officer of Compagnie de Suez, then in June 1997, Chairman of the Management Board of Suez Lyonnaise des Eaux and, finally, in 2001, Chairman and Chief Executive Officer of Suez. From July 2008 to May 2016, Chairman and Chief Executive Officer of ENGIE (previously GDF SUEZ). Since May 2016, he is Chairman of the Board of Directors following the separation of the functions of Chairman and Chief Executive Officer.
Other offices held currently Other offices and positions held in other companies in the past five years
In French listed companies:
Chairman of the Board of Directors: ENGIE* (since 2016), SUEZ* (since 2008).
In foreign listed companies:
Member of the Supervisory Board: Siemens AG (Germany) (from 2013 to January 2018).
* ENGIE Group
Chairman and Chief Executive Officer: ENGIE*(from 2008 to 2016).
Chairman of the Board of Directors: Electrabel* (Belgium) (from 2010 to 2016), ENGIE Energy Management Trading* (Belgium) (from 2010 to2016), ENGIE Énergie Services* (from 2005 to2016), GDF SUEZ Rassembleurs d’Énergies S.A.S* (from 2011 to 2014), GDF SUEZ Belgium* (Belgium) (from 2010 to 2014).
Vice-Chairman of the Board of Directors: Aguas de Barcelona (Spain) (from 2010 to 2015).
Director: International Power* (United Kingdom) (from 2011 to 2016), Saint-Gobain (from 1995 to2015), Pargesa Holding SA (Switzerland) (from 1998 to 2014).

3
BOARD OF DIRECTORS’ REPORT ON CORPORATE GOVERNANCE
1 I 3 CCORPORATE GOVERNANCEE
S O C I E T E G E N E R AL E G R O U P I 2018 REGISTRATION DOCUMENT I 81
DDate of birth: 10th March 1953
YYear of first appointment: 2016
TTerm of office expires in: 2020
Holds 1,500 shares
PProfessional address:
Tours Société Générale,
75886 Paris Cedex 18
Juan Maria NIN GENOVA Company Director
Independent Director, member of the Risk Committee and of the Compensation
Committee
Biography
A Spanish national and graduate of the University of Deusto (Spain) and the London School of Economics and Political Sciences (United Kingdom), he is a lawyer and economist who began his career as a Programme Manager in the Spanish Ministry for Relations with the European Community. General Manager of SantanderCentral Hispano from 1980 to 2002, before becoming an advisor of Banco Sabadell until 2007. In June 2007,Chief Executive Officer of La Caixa. In July 2011, Vice-Chairman and Deputy Advisor of CaixaBank until 2014.
Other offices held currently Other offices and positions held in other companies in the past five years
In foreign listed companies:
Director: DIA Group SA (Spain) (since 2015).
In foreign unlisted companies:
Director: Grupo de Empresas Azvi S.L.* (Spain) (since 2015), Azora Capital S.L.* (Spain) (since 2014).
* Grupo de Empresas Azvi, S.L
Chairman of the Board of Directors: VidaCaixa Assurances (Spain) (2014), SegurCaixa Holding SA (from 2007 to 2014).
Vice-Chairman of the Board of Directors andDeputy Advisor: Caixabank SA (Spain) (from2011 to 2014).
Member of the Supervisory Board: ERSTE GroupBank AG (Austria) (from 2009 to 2014), GrupoFinanciero Inbursa (Mexico) (from 2008 to 2014), Banco BPI (Portugal) (from 2008 to 2014).
Director: Naturhouse (Spain) (from 2014 to 2016),Grupo Indukern* (Spain) (from 2014 to 2016), Gas Natural (Spain) (from 2008 to 2015), RepsolSA (Spain) (from 2007 to 2015).
DDate of birth: 7th April 1957
Year of first aappointment: 2008
Term of office expires in: 2020
Holds 2,048 shares
Professional address:
Tours Société Générale,
75886 Paris Cedex 18
Nathalie RACHOU Company Director
Independent Director, Chairman of the Risk Committee and member of the Audit and
Internal Control Committee
Biography
HEC graduate. From 1978 to 1999, held a number of positions within Banque Indosuez and Crédit AgricoleIndosuez: foreign exchange dealer, Head of asset/liability management, founder then Chief Executive Officer ofCarr Futures International Paris (brokerage subsidiary of Banque Indosuez trading on the Paris FuturesExchange), Corporate Secretary of Banque Indosuez and Global Head of Foreign Exchange and CurrencyOptions at Crédit Agricole Indosuez. In 1999, founded Topiary Finance Ltd., an asset management companybased in London. Since 2015, she is Senior Advisor of Rouvier Associés. Foreign Trade Advisor for France since2001.
Other offices held currently Other offices and positions held in other companies in the past five years
In French listed companies:
Director: Veolia Environnement (since 2012),Altran (since 2012).
In foreign listed companies:
Director: Laird PLC (United Kingdom) (since 2016).
Director: Liautaud & Cie (from 2000 to 2013).
Managing Director: Topiary Finance (UnitedKingdom) (from 1999 to 2014).

3 I 1
BOARD OF DIRECTORS’ REPORT ON CORPORATE GOVERNANCE CCORPORATE GGOVERNANCE
82 I 2018 REGISTRATION DOCUMENT I S O C I E T E G E N E R AL E G R O U P
DDate of birth: 8th May 1977
YYear of first appointment: 2017
TTerm of office expires in: 2021
Holds 600 shares
PProfessional address:
Tours Société Générale,
75886 Paris Cedex 18
Lubomira ROCHET Chief Digital Officer of L’Oréal
Independent Director
Biography
Graduate of the École Normale Supérieure and Sciences Po in France, and of the College of Europe in Bruges(Belgium). From 2003 to 2007, Head of Strategy at Sogeti (Capgemini). From 2008 to 2010, Head of Innovation and Start-ups in France at Microsoft. Joined Valtech in 2010 and became Chief Executive Officer in 2012. Since2014, Chief Digital Officer and member of the Executive Committee of L’Oréal.
Other offices held currently Other offices and positions held in other companies in the past five years
In foreign unlisted companies:
Director: Founders Factory Ltd* (United Kingdom) (since 2016).
* L’Oréal Group
None.
DDate of birth: 5th September 1958
Year of first appointment: 2013
Term of office expires in: 2021
Holds 1,000 shares
Professional address:
Tours Société Générale,
75886 Paris Cedex 18
Alexandra SCHAAPVELD Company Director
Independent Director, Chairman of the Audit and Internal Control Committee and member
of the Risk Committee
Biography
A Dutch national, she is a graduate in Politics, Philosophy and Economics from the University of Oxford (United Kingdom) and holds a Master’s degree in Development Economics from Erasmus University Rotterdam
(Netherlands). She began her career in the ABN AMRO Group in the Netherlands, where she held variouspositions in the Investment Banking division from 1984 to 2007, in particular being responsible for relations with the bank’s major corporate clients. In 2008, appointed Head of Investment Banking for Western Europe at the Royal Bank of Scotland Group.
Other offices held currently Other offices and positions held in other companies in the past five years
In French listed companies:
Member of the Supervisory Board: Vallourec SA(since 2010).
In foreign listed companies:
Member of the Supervisory Board: Bumi Armada Berhad (Malaysia) (since 2011).
In foreign unlisted companies:
Member of the Supervisory Board: FMO(Netherlands) (since 2012).
Member of the Supervisory Board: HollandCasino* (Netherlands) (from 2007 to 2016).
* Foundation

3
BOARD OF DIRECTORS’ REPORT ON CORPORATE GOVERNANCE
1 I 3 CCORPORATE GOVERNANCEE
S O C I E T E G E N E R AL E G R O U P I 2018 REGISTRATION DOCUMENT I 83
DDate of birth: 27th July 1967
YYear of ffirst appointment: 2009
TTerm of office expires in: 2018
PProfessional address:
Tours Société Générale,
75886 Paris Cedex 18
France HOUSSAYE Director elected by employees
Branch manager of Bois Guillaume, DEC of Rouen
Member of the Compensation Committee
Biography
Societe Generale employee since 1989.
Other offices held currently Other offices and positions held in other companies in the past five years
None. None.
DDate of birth: 11th October 1970
Year of first appointment: 2012
TTerm of office eexpires in: 2018
PProfessional address:
Tours Société Générale,
75886 Paris Cedex 18
Béatrice LEPAGNOL Director elected by employees
Union activities advisor at the Agen branch
Biography
Societe Generale employee since 1990.
Other offices held currently Other offices and positions held in other companies in the past five years
None. None.

3 I 1
BOARD OF DIRECTORS’ REPORT ON CORPORATE GOVERNANCE CCORPORATE GGOVERNANCE
84 I 2018 REGISTRATION DOCUMENT I S O C I E T E G E N E R AL E G R O U P
The Chairman of the Board of Directors
ROLE OF THE CHAIRMAN OF THE BOARD OF DIRECTORS The Board of Directors appointed Lorenzo Bini Smaghi Chairman of the Board of Directors following the separation of the offices of Chairman of the Board of Directors and Chief Executive Officer on 19th May 2015.
The duties of the Chairman are set out in Article 5 of the Internal Rules.
AArticle 5 of the Internal Rules:
5.1 - The Chairman convenes and chairs the Board of Directors meetings. He/she sets the timetable and agenda of the meetings. He/she organises and manages the work of the Board of Directors and reports on its activities to the General Meeting. He/she chairs the General Meetings of Shareholders.
5.2 - The Chairman ensures the proper functioning of the Company’s bodies and the implementation of the best corporate governance practices, in particular as regards the Committees set up within the Board of Directors, which he/she may attend without the right to vote. He/she may submit questions for the consideration of these Committees.
5.3 – He/she receives all information relevant to his/her missions. He/she is regularly informed by the Chief Executive Officer and, where applicable, the Deputy Chief Executive Officers, of significant events relating to the life of the Group. He/she may request the disclosure of any information or document that may inform the Board of Directors. For the same purpose, he/she may hear the Statutory Auditors and, after having informed the Chief Executive Officer, any Group senior manager.
5.4 – He/she ensures that the Directors are in a position to fulfil their missions and ensures that they are properly informed.
5.5 – He/she is the only person authorised to speak on behalf of the Board of Directors, except in exceptional circumstances or with a specific mandate entrusted to another Director.
5.6 – He/she devotes his/her best efforts to promote in all circumstances the values and the image of the Company. In consultation with the General Management, he/she may represent the Group in its high-level relations, in particular with major clients, regulators, major shareholders and public authorities, both domestically and internationally.
5.7 - He/she has the material resources necessary for the performance of his/her missions.
5.8 - The Chairman has no executive responsibilities, these responsibilities being exercised by the General Management which proposes and applies the Company’s strategy, within the limits defined by law and in compliance with the corporate governance rules and directions set by the Board of Directors.
REPORT ON THE ACTIVITIES OF THE CHAIRMAN OF THE BOARD OF DIRECTORS FOR 2017 In 2017, the Chairman of the Board devoted at least three days per week to the Group.
He chaired all the Board meetings and the executive session. He also attended the meetings of almost all the Committees. He met Directors individually, notably with regard to the assessment of the Board of Directors’ performance, including the individual assessment of Directors. He oversaw, with the Chairman of the Nomination and Corporate Governance Committee, the procedures for the recruitment of new Directors. He also met the Group’s main senior executives (heads of business lines or functions). He visited certain offices, notably within the French
retail banking network. In July 2017, he chaired a meeting of African executives in Accra (Ghana) and met with local authorities and customers. On several occasions, the Chairman met with banking regulators in Europe. He participated in the annual meetings of the IMF, and held several meetings with the ECB. The Chairman also participated in numerous public events both within and outside Europe, where he spoke on a range of themes (macro-economy and banking regulations in particular). The Chairman also expressed his views on several occasions in the media, and met with clients, investors and shareholders. As part of the preparation for the General Meeting, he held meetings with the main shareholders and proxies. Lastly, the Chairman participated in a roadshow in New York, Boston and London in order to present the Group’s governance system to investors.
strategic directions and operations
financial statements and communication
risk management
governance
compensation and wage policy
preventive recovery plan

3
BOARD OF DIRECTORS’ REPORT ON CORPORATE GOVERNANCE
1 I 3 CCORPORATE GOVERNANCEE
S O C I E T E G E N E R AL E G R O U P I 2018 REGISTRATION DOCUMENT I 85
Board of Directors’ expertise The Internal Rules of Societe Generale’s Board of Directors define its organisation and operating procedures. They were updated in January 2017 and January 2018.
The Board of Directors deliberates on any issue falling within its legal and regulatory powers and must devote sufficient time to perform its assignments.
The Board of Directors intervenes in particular on the following subjects (see pp. 546 and 547, Article 1 of the Internal Rules):
ssttrategic directions and operations: it approves the Group’s strategic directions, ensures their implementation and reviews them at least once a year; these directions include the values and the code of conduct of the Group as well as the main thrusts of the policy followed with respect to social and environmental responsibility, human resources, information systems and organisation. It approves the plans for strategic operations, in particular acquisitions or disposals, which may have a significant impact on the Group’s earnings, its balance sheet structure or its risk profile;
ffiinancial statements and communication: it ensures the accuracy and truthfulness of the annual and consolidated annual accounts and the quality of the information provided to the shareholders and the market. It approves the management report. It controls the publication and communication process, and the quality and reliability of the information to be published and communicated;
rriisk management: it approves the global strategy and the appetite in terms of risks of any kind and controls the related implementation. To this end, it approves and regularly reviews the strategies and policies governing the taking, management, monitoring and reduction of the risks to which Societe Generale is or could be exposed, including the risks created by the economic environment. It ensures, in particular, the adequacy and effectiveness of the risk management systems, controls the risk exposure from its activities and approves the overall risk limits. It ensures the effectiveness of the corrective measures taken in the event of a default;
ggoovernance: it appoints the Chairman, Chief Executive Officer and, upon the latter’s proposal, the Deputy Chief Executive Officer(s); it determines any possible limitations on the powers of the Chief Executive Officer and the Deputy Chief Executive Officer(s). It reviews the governance system, periodically assesses its effectiveness and ensures that corrective measures to remedy potential shortcomings have been taken. It ensures, in particular, compliance with the banking regulations with respect to internal control. It also determines the orientations and controls the implementation by the Effective Senior Managers of the oversight systems in order to ensure effective and prudent management of the institution, in particular the avoidance of conflicts of interest. It deliberates on changes to the Group’s management structure prior to their implementation and is informed of the main changes to its organisation. It deliberates at least once a year on its operation and that of its Committees, on the skills, aptitudes and availability of its members as well as on the conclusions of the periodic assessment thereof. It reviews once a year the succession plan for the Chief Executive Officers. It gives, where appropriate, its prior consent to the dismissal of the Chief Risk Officer, after the Risk Committee and the Nomination and Corporate Governance Committee have been consulted. It prepares the report on corporate governance;
ccoompensation and wage policy: it distributes the attendance fees and establishes the compensation policy principles applicable in the Group, in particular regarding regulated persons. It sets the compensation of the Chief Executive Officers, and decides on the allocation of performance shares under the authorisations given by the General Meeting. It deliberates once a year on the Company’s policy regarding professional and wage equality between men and women;
pprreventive recovery plan: it establishes the preventive recovery plan that is communicated to the European Central Bank and deliberates on any similar plan requested by foreign supervisory authorities.
Functioning of the Board of Directors The Internal Rules govern the functioning of the Board of Directors (see Article 6 of the Internal Rules, p. 548). The latter is convened by the Chairman, by any means, or at the request of one-third of the Directors. It meets at least eight times a year, in particular to approve the annual and consolidated annual accounts.
Each Director receives the information required to carry out his or her duties, in particular for the preparation of each Board meeting. The Directors also receive any useful information, including critical information, on significant events for the Company. Each Director receives the training sessions necessary to fulfil his or her mandate.
The Board of Directors’ work In 2017, the Board held 13 meetings, of which the average duration was three hours. The Directors’ attendance rate averaged 94% per meeting (93% in 2016). Outside of these meetings, the Board of Directors held several conference calls on topics of current interest.
The Board of Directors validated the reorganisation of the Group into Business Units and Service Units, as well as the new governance set up under the authority of the General Management. It ensured that this organisation was compliant with the governance principles applicable to credit institutions.
As every year, the Board of Directors prepared the annual, half-yearly and quarterly accounts and reviewed the budget. It deliberated upon the disposals/acquisitions carried out in 2017 and in particular the floatation of part of ALD’s share capital.
During 2017, the Board continued to monitor the Group’s liquidity profile and capital trajectory in light of regulatory requirements. Similarly, at each meeting, it monitored the developments in major ongoing disputes. In particular, it examined the consequences of the LIA settlement and approved the financial communication on this subject. It also approved the signing of a Cease and Desist Order with the US authorities regarding the fight against money laundering.
The Board reviewed the strategy of the Group and its main businesses as well as its competitive environment during a one-day seminar, and prepared the Investor Day, held in November 2017, at a special session.

3 I 1
BOARD OF DIRECTORS’ REPORT ON CORPORATE GOVERNANCE CCORPORATE GGOVERNANCE
86 I 2018 REGISTRATION DOCUMENT I S O C I E T E G E N E R AL E G R O U P
In 2017, the main topics addressed were the following:
strategic plan;
culture and conduct within the Group and in particular the Tax Code of Conduct and the Code of Conduct on Bribery;
customers of the Corporate and Investment Bank;
Russia;
French Retail Banking;
Private Banking;
Retail Banking in Europe;
CSR (corporate social responsibility) policy;
innovation;
information systems and IT security;
customer satisfaction;
compliance;
human resources;
the Group’s image;
resolution and recovery plans.
The Board of Directors was informed of regulatory changes and their consequences on the Group’s organisation and its activity. The Board regularly reviewed the Group’s status in terms of risk. It approved the Group’s risk appetite. It approved the ICAAP and the ILAAP as well as the overall market risk limits. It reviewed the Annual Reports communicated to the French Prudential Supervisory and Resolution Authority (ACPR) on internal control, as well as the responses to the follow-up letters further to inspections by the ACPR and the ECB. It also reviewed the action taken on recommendations from the regulators in the United States.
The Board assessed the performance of the executive officers and set their compensation as well as that of the Chairman. It resolved upon performance share plans. It also discussed the policy pursued with respect to professional and wage equality. Lastly, it reviewed the allocation of attendance fees (see p. 92).
The Board of Directors determined and prepared the resolutions to be submitted to the Annual General Meeting and in particular the ones relating to the renewal of Directors’ terms of office or the appointment of new Directors.
Similarly, it discussed the General Management succession plan.
Each year, the Board conducts a review of its operation. The conclusions of this review in 2017 are indicated in the assessment section of this report (see p. 92).
In January 2017, the Board appointed Didier Valet as a Deputy Chief Executive Officer, set his remuneration and authorised the post-employment commitment concerning him (pension regime).
In January 2018, after a recommendation from the Nomination and Corporate Governance Committee, the Board of Directors updated the Internal Rules to include new provisions and clarify the respective roles of the Board and Committees.
In January 2018, the Board of Directors carried out the annual review of related-party agreements and commitments entered into and authorised during previous financial years and which continued during the 2017 financial year. This covered the
pension commitments for Deputy Chief Executive Officers and the non-compete agreement between the Company and Mr. Oudéa. The Board considered that the ongoing pension commitments, which remain justified, must be maintained. It also decided to harmonise the rules governing the Chief Executive Officer’s or Deputy Chief Executive Officers’ departure from the Group upon termination of their duties. With respect to the non-compete agreement and new related-party agreements and commitments approved by the General Meeting of 23rd May 2017, see page 104.
Furthermore, it was noted that no new related-party agreements were entered into in 2017, directly or indirectly, between, on the one hand, the Chief Executive Officer or the Chairman of the Board of Directors, a Deputy Chief Executive Officer, a Director or a shareholder holding more than 10% of Societe Generale’s voting rights, and, on the other hand, a French or foreign subsidiary in which Societe Generale holds, directly or indirectly, more than half of the share capital. Pursuant to the law, ordinary agreements entered into under normal conditions are excluded from this assessment.
The Board of Directors’ Committees The Board of Directors was assisted by four Committees in 2017:
the Audit and Internal Control Committee;
the Risk Committee;
the Compensation Committee;
the Nomination and Corporate Governance Committee.
Each Committee comprises at least four members. No Director is a member of more than two Committees. Each Committee comprises at least one female and one male member and at least one foreigner.
One Director representing the employees sits on the Compensation Committee. One Director sits on both the Risk Committee and the Compensation Committee.
The Risk Committee and the Audit and Internal Control Committee met on a number of occasions to review topics relating to the Group's activity in the United States.
As from 2018, it has been decided that the Risk Committee will be extended to include the members of the Audit and Internal Control Committee when it acts as US Risk Committee.
The Chairmen of the Risk Committee and the Audit and Internal Control Committee meet with the ECB and the Fed at least once a year to provide an overview on the activity of the Committees.
The duties of the Board of Directors’ four Committees are set forth in Articles 10 to 13 of the Internal Rules (see chapter 7).
AUDIT AND INTERNAL CONTROL COMMITTEE As at 31st December 2017, the Committee comprised four independent Directors: Ms. Hazou, Ms. Rachou, Ms. Schaapveld and Mr. Castaigne. It is chaired by Ms. Schaapveld.
All its members are particularly qualified in the financial and accounting fields, and in the analysis of internal control, as they hold or have held positions as bankers or as bank chief financial officers, auditors, or chief legal officers.

3
BOARD OF DIRECTORS’ REPORT ON CORPORATE GOVERNANCE
1 I 3 CCORPORATE GOVERNANCEE
S O C I E T E G E N E R AL E G R O U P I 2018 REGISTRATION DOCUMENT I 87
AArticle 10 of the Internal Rules:
10.1 - The Audit and Internal Control Committee’s mission is to monitor issues concerning the preparation and control of accounting and financial information as well as the monitoring of the effectiveness of internal control, measurement, monitoring and risk control systems.
10.2 - In particular, it is responsible for:
a) ensuring the monitoring of the process for the production of the financial information, particularly reviewing the quality and reliability of existing systems, making proposals for their improvement and ensuring that corrective actions have been implemented in the event of a malfunction in the process; where appropriate, it makes recommendations to ensure their integrity;
b) analysing the draft accounts to be submitted to the Board of Directors in order to, in particular, verify the clarity of the information provided and assess the relevance and consistency of the accounting methods adopted for drawing up annual accounts and consolidated annual accounts;
c) conducting the procedure for selecting the Statutory Auditors and issuing a recommendation to the Board of Directors, developed in accordance with the provisions of Article 16 of the regulation (EU) n° 537/2014 dated 16 April 2014, concerning their appointment or renewal as well as their remuneration;
d) ensuring the independence of the Statutory Auditors in accordance with the regulations in force;
e) approving, in accordance with Article L. 823-19 of the French Commercial Code and the policy adopted by the Board of Directors, the provision of services other than the certification of accounts referred to in Article L. 822-11-2 of the said Code after analysing the risks to the Statutory Auditor’s independence and the safeguard measures applied by the latter;
f) reviewing the work programme of the Statutory Auditors and, more generally, monitoring the control of the accounts by the Statutory Auditors in accordance with the regulations in force;
g) ensuring the monitoring of the effectiveness of internal control, risk management and internal audit systems, with regard to the procedures for the preparation and processing of the accounting and financial information. To this end, the Committee is responsible in particular for:
– reviewing the internal control and risk control of the business segments, divisions and main subsidiaries;
– reviewing the Group’s periodic monitoring programme and giving its opinion on the organisation and functioning of the internal control departments;
– reviewing the follow-up letters from the banking and markets supervisors and issuing an opinion on draft replies to these letters;
h) reviewing the reports prepared in order to comply with the regulations in terms of internal control.
10.3 - It regularly reports to the Board of Directors on the performance of its missions, including the outcomes of the mission of certification of the accounts, how this mission contributed to the integrity of the financial information and the role it played in this process. It informs the Board of Directors without delay of any difficulty encountered.
10.4 - The Statutory Auditors shall be invited to the meetings of the Audit and Internal Control Committee, unless the Committee decides otherwise. They may also be consulted outside these meetings.
10.5 - The Audit and Internal Control Committee or its Chairman also hear the heads of the internal control functions (risk, compliance, internal audit) as well as the Chief Financial Officer and, as necessary, the managers in charge of drawing up the accounts, internal control, risk control, compliance control and periodic control.
10.6 - The Audit and Internal Control Committee is composed of at least three Directors appointed by the Board of Directors, who have the appropriate financial, accounting, or statutory audit skills. At least two thirds of the Committee’s members are independent within the meaning of the AFEP-MEDEF Corporate Governance Code.
AUDIT AND INTERNAL CONTROL COMMITTEE ACTIVITY REPORT FOR 2017
The Committee met 11 times in 2017, with an attendance rate of 93% (100% in 2016).
The Committee reviewed the draft annual, half-yearly and quarterly consolidated accounts prior to their presentation to the Board and submitted to the Board its opinion on these accounts. It validated the corresponding financial communication.
At each account closing period, the Committee interviewed the Statutory Auditors without the presence of management, before hearing the presentation of the accounts given by the Finance Division. One of the Chief Executive Officers attends some of the meetings dedicated to each account closing, and discusses the highlights of the quarter with the Committee.
The Committee hears the heads of the internal control functions (risk, compliance and audit) at each meeting.
It reviews the annual report on internal control.
The Committee devoted several agenda items to matters relating to internal control and the monitoring of remediation plans (anti-money laundering in the United States, control of Libor/Euribor submissions and other benchmarks). The Committee regularly reviewed the work performed by the General Inspection Department and the Internal Control Division. It was informed of significant compliance incidents.

3 I 1
BOARD OF DIRECTORS’ REPORT ON CORPORATE GOVERNANCE CCORPORATE GGOVERNANCE
88 I 2018 REGISTRATION DOCUMENT I S O C I E T E G E N E R AL E G R O U P
It reviewed the schedule for the General Inspection Department and audits, and the follow-up procedures for audit recommendations. It reviewed the activities of the subsidiaries’ audit committees within the framework of the rules that the Group has determined in this area.
It was also consulted on the Group’s draft replies to the follow-up letters from the ACPR, as well as on replies to the ECB or to foreign regulators. It is responsible for regular monitoring of implementation of the ECB’s recommendations.
The main topics addressed during the year were as follows:
new IFRS 9 standards;
review of acquisitions and disposals;
general organisation of compliance, global framework, roles and responsibilities;
anti-money laundering;
recovery and resolution plans;
tax management;
customer protection;
compliance with the Volcker Rule;
Private Banking/Switzerland.
The Committee travelled to Africa, as well as – for the France network – to Lille. During the trip to Africa, it ensured the proper functioning of audit committees in the African subsidiaries.
It discussed the audit programme and the budget for the Statutory Auditors’ fees for 2017. It defined and implemented new regulations relating to the approval of services other than the certification of the accounts entrusted to the Statutory Auditors. It also issued a recommendation to the Board of Directors for the selection of the Statutory Auditors.
RISK COMMITTEE As at 31st December 2017, the Risk Committee comprised five independent Directors: Ms. Hazou, Ms. Rachou, Ms. Schaapveld, Mr. Connelly and Mr. Nin Genova. It is chaired by Ms. Rachou. Mr. Connelly was appointed as a member as of November 2017.
All its members are particularly qualified in the financial and accounting fields, and in risk analysis, as they hold or have held positions as bankers or as bank chief financial officers, auditors, or chief legal officers.
Article 11 of the Internal Rules:
11.1 - The Risk Committee advises the Board of Directors on the overall strategy and the appetite regarding all kinds of risks, both current and future, and assists it when it controls the implementation of this strategy.
11.2 - In particular, it is responsible for:
a) preparing the debates of the Board of Directors on documents relating to risk appetite;
b) reviewing the risk control procedures and is consulted for the setting of overall risk limits;
c) undertaking a regular review of the strategies, policies, procedures and systems used to detect, manage and monitor the liquidity risk and communicating its conclusions to the Board of Directors;
d) issuing an opinion on the Group’s global provisioning policy, as well as on specific provisions for significant amounts;
e) reviewing the reports prepared to comply with the banking regulations on risks;
f) reviewing the policy concerning risk control and the monitoring of off-balance sheet commitments, especially in the light of the memoranda prepared to this end by the Finance Division, the Risk Division and the Statutory Auditors;
g) reviewing, as part of its mission, whether the prices for the products and services mentioned in books II and III of the French Monetary and Financial Code and offered to clients are consistent with the Company's risk strategy. When these prices do not correctly reflect the risks, it informs the Board of Directors accordingly and gives its opinion on the action plan to remedy the situation;
h) without prejudice to the Compensation Committee's missions, reviewing whether the incentives provided for by the compensation policy and practices are consistent with the Company's situation with regard to the risks to which it is exposed, its capital and its liquidity, as well as the probability and timing of expected benefits;
i) reviewing the risks associated with the Group's implementation of the guidelines on social and environmental responsibility and the indicators relating to the Conduct as part of the "Culture and Conduct" programme;
j) reviewing the enterprise risk management related to the Company’s operations in the United States. When acting as US Risk Committee, the Risk Committee is composed of its members and those of the Audit and Internal Control Committee.(1)
(1) In accordance with the requirements of the U.S. Federal Reserve’s Enhanced Prudential Standards Rules, the Risk Committee will hold quarterly meetings to review the Company’s operations in the United States. The Risk Committee’s obligations in this regard include the review of the enterprise risk management related to the Company’s operations in the United States. As such, the Risk Committee must: a) receive regular reports from the US-based Chief Risk Officer of the Company; b) review the risk management system for the Company’s combined operations in the United States; and c) review the Company’s liquidity risk in the United States.

3
BOARD OF DIRECTORS’ REPORT ON CORPORATE GOVERNANCE
1 I 3 CCORPORATE GOVERNANCEE
S O C I E T E G E N E R AL E G R O U P I 2018 REGISTRATION DOCUMENT I 89
11.3 - It has all information on the Company's risk situation. It may use the services of the Chief Risk Officer or external experts.
11.4 - The Statutory Auditors are invited to the meetings of the Risk Committee, unless the Committee decides otherwise. They may also be consulted outside these meetings.
The Risk Committee or its Chairman hear the heads of the internal control functions (risk, compliance, internal audit) as well as the Chief Financial Officer and, as necessary, the managers responsible for drawing up the accounts, internal control, risk control, compliance control and periodic control.
11.5 - The Risk Committee is composed of at least three Directors appointed by the Board of Directors who have knowledge, skills and expertise concerning risks. At least two thirds of the Committee’s members are independent within the meaning of the AFEP-MEDEF Corporate Governance Code.
RISK COMMITTEE ACTIVITY REPORT FOR 2017
The Risk Committee met 11 times during the year. The attendance rate for its members was 96% (98% in 2016).
At each meeting, the Chief Risk Officer reports to the Risk Committee on changes in the risk environment and highlights. The Committee examines the documents relating to risk appetite and prepares the decisions on the ICAAP and ILAAP. It regularly reviews:
the risk overview and risk mapping;
the risk limits for which it prepares the Board’s decisions (in particular, the market risks);
the liquidity situation of the Group;
the outcome of stress test exercises;
Russia;
the reputation dashboard;
the compliance dashboard;
the dashboard on risks relating to information systems and their security;
the dashboard on regulatory projects;
tax risks;
litigation management.
In 2017, it devoted several agenda items to matters relating to IT security and information systems. It was informed of the main disputes, including tax disputes. It reviewed the organisation of the Risk Division. It also conducted a review of the Compliance Division. It examined risk areas specific to regulatory projects (MiFID II etc.). It also prepared the Board’s work on recovery and resolution plans. It gave the Compensation Committee its opinion on the taking into account of risks in the compensation for regulated employees (market professionals and others).
It examined the risks related to specialised financial services and those related to offshoring. In June, the Committee, together with the Audit and Internal Control Committee, visited the Societe Generale regional delegation in Lille to examine the implementation of risk management and control systems on the ground. In November, together with the Audit and Internal Control Committee, the Committee travelled to Yaoundé (Cameroon) to ensure the proper implementation of risk management and control systems in the African subsidiaries.
As US Risk Committee, the Risk Committee held quarterly meetings to validate the risk appetite of US operations. It also performed the other tasks provided for by US regulations (supervision of liquidity risk, validation of risk policies, etc.). Together with the Audit and Internal Control Committee, it followed up on the remediation requested by the Fed in terms of risk monitoring. The Committee received specific training on its responsibilities as US Risk Committee in November 2017.

3 I 1
BOARD OF DIRECTORS’ REPORT ON CORPORATE GOVERNANCE CCORPORATE GGOVERNANCE
90 I 2018 REGISTRATION DOCUMENT I S O C I E T E G E N E R AL E G R O U P
COMPENSATION COMMITTEE As at 31st December 2017, the Compensation Committee comprised four Directors, including three independent Directors (Mr. Lévy, Mr. Mestrallet and Mr. Nin Genova) and one employee (Ms. Houssaye). It is chaired by Mr. Lévy, an independent Director.
Its members have the skills required to assess the compensation policies and practices, including with regard to the Group’s risk management.
AArticle 12 of the Internal Rules:
12.1 - The Compensation Committee prepares the decisions that the Board of Directors adopts concerning compensation, especially those related to the chief executive officers (dirigeants mandataires sociaux) as well as those that have an impact on the risk and the management of risks in the Company.
12.2 - It conducts an annual review of:
a) the principles of the Company's compensation policy;
b) the compensation, allowances and benefits of any kind granted to the Company's executive officers (mandataires sociaux) as well as the Effective Senior Managers, if they are different;
c) the compensation policy for regulated employees within the meaning of the banking regulations.
12.3 - It controls the compensation of the Chief Risk Officer and the Chief Compliance Officer.
12.4 - It receives all information necessary for its mission and in particular the annual report sent to the European Central Bank.
12.5 - It may be assisted by the internal control services or by external experts.
12.6 - In particular, the Committee:
a) proposes to the Board of Directors, in compliance with the regulations applicable to credit institutions, the principles given by the AFEP-MEDEF Corporate Governance Code and professional standards, the principles of the compensation policy for the chief executive officers (dirigeants mandataires sociaux), and especially the criteria for the determination, the structure and the amount of this compensation, including allowances and benefits in kind, insurance or pension benefits, and compensation of any kind received from all the Group companies; it ensures their application;
b) prepares the annual performance assessment of the chief executive officers (dirigeants mandataires sociaux);
c) proposes to the Board of Directors the policy for performance shares;
d) prepares the decisions of the Board of Directors concerning the employee savings plan.
12.7 - It is composed of at least three Directors and includes a Director elected by the employees. At least two thirds of the Committee’s members are independent within the meaning of the AFEP-MEDEF Code(1). Its composition enables it to exercise a competent and independent judgement on the compensation policies and practices with regard to the management of risks, the equity and the liquidities of the Company.
(1) For the calculation of the rate of independents within the Committees, the AFEP-MEDEF Code does not take employees into account.
COMPENSATION COMMITTEE ACTIVITY REPORT FOR 2017
The Compensation Committee met seven times during the financial year. The attendance rate for its members was 96% (96% in 2016).
During its meetings, the Committee prepared the Board’s decisions on the status and compensation of the Chief Executive Officers. It prepared the decisions regarding the monitoring of long-term or deferred compensation. In particular, it prepared the decisions relating to the Chairman’s compensation. In January 2017, it prepared the decision concerning the compensation of Didier Valet, who has been appointed Deputy Chief Executive Officer.
The Committee prepared the appraisals of the Chief Executive Officers. It recommended annual targets for them to the Board.
In accordance with the CRD4 Directive and its transposition into French law, the Compensation Committee ensured that the Group’s compensation policies comply not only with regulations, but also with the enterprise risk management policy and equity targets.
The Committee reviewed the principles of the compensation policy applicable within the Group, in particular concerning employees whose activities have a significant impact on the Group’s risk profile, in accordance with the new regulations in force. It devoted several meetings to this examination and to ensuring that the structure proposed for regulated employees complies with the new and particularly complex rules. It particularly ensured that the compensation policy effectively takes into account the risks generated by the activities and that employees comply with risk management policies and professional standards. The Risk Committee gave its opinion in this regard and one member sits on both Committees (Mr. Nin Genova). The Committee also relied on work by external and internal control bodies. Lastly, it reviewed the annual report on compensation. The compensation policy is described in detail on pages 99 and following.
Lastly, the Committee proposed the share (or share equivalent) allocation plans to the Board.
The Committee prepared the Board’s work on gender equality within the Company.

3
BOARD OF DIRECTORS’ REPORT ON CORPORATE GOVERNANCE
1 I 3 CCORPORATE GOVERNANCEE
S O C I E T E G E N E R AL E G R O U P I 2018 REGISTRATION DOCUMENT I 91
NOMINATION AND CORPORATE GOVERNANCE COMMITTEE As at 31st December 2017, the Nomination and Corporate Governance Committee comprised four independent Directors:
Ms. Llopis Rivas, Mr. Castaigne, Mr. Lévy and Mr. Mestrallet. It is chaired by Mr. Mestrallet.
Its members have the skills required to assess the nomination and corporate governance policies and practices.
AArticle 13 of the Internal Rules:
13.1 - The Nomination and Corporate Governance Committee:
a) is responsible for making proposals to the Board of Directors for the appointment of Directors and Committees members as well as on the succession of the executive officers (mandataires sociaux), especially in the event of an unforeseeable vacancy, after having carried out necessary studies. To this end, it prepares the selection criteria to be submitted to the Board of Directors, proposes to the Board of Directors an objective to be achieved concerning the balanced representation of women and men on the Board of Directors and develops a policy designed to achieve this objective(1);
b) periodically reviews the structure, size, composition and effectiveness of the Board of Directors' work and submits to the Board of Directors any recommendation relevant to the carrying out of the annual assessment of the Board of Directors and its members;
c) periodically reviews the Board of Directors' policies concerning the selection and appointment of the Effective Senior Managers, the Deputy Chief Executive Officers and the Heads of risk, compliance, audit and finance functions; it makes recommendations in this area;
d) is informed in advance of the appointment of the Heads of risk, compliance, audit and finance functions. It is also informed of the appointment of the Heads of Business Units or of Service Units. It is informed of the succession plan for these senior officers (dirigeants);
e) prepares the review by the Board of Directors of corporate governance issues as well as the Board of Directors’ work on matters relating to Corporate culture. It proposes to the Board of Directors the presentation of the Board of Directors in the Registration Document and in particular the list of independent Directors.
13.2 - It is composed of at least three Directors. At least two thirds of the Committee’s members are independent within the meaning of the AFEP-MEDEF Corporate Governance Code. The Chief Executive Officer is involved, as necessary, in the Committee’s work.
(1) The objective and policy of the credit institutions, as well as the terms of implementation, are made public in accordance with paragraph 2 (c) of Article 435 of regulation (EU) n° 575/2013 dated 26 June 2013.
NOMINATION AND CORPORATE GOVERNANCE COMMITTEE ACTIVITY REPORT FOR 2017
The Nomination and Corporate Governance Committee held seven meetings in 2017. The attendance rate was 86% (91% in 2016).
The Committee prepared the resolutions for the General Meeting. It examined the proposed update of the Internal Rules of the Board of Directors. It prepared the appointments of the new Directors and submitted the selection to the Board, with the help of an outside firm. To this end, it defined selection criteria and ensured the balanced composition of the Board. Each candidate met with one or more members of the Committee.
The Committee reported on this selection stage to the Board. In the case of executive officers, the Committee defined a succession plan and submitted a favourable opinion to the Board of Directors concerning the appointment of Didier Valet as a Deputy Chief Executive Officer, as proposed by Frédéric Oudéa. In the case of the appointment of the Chief Compliance Officer, the Committee verified the quality of the selection process in view of the profile sought for this position.
The Chairman of the Committee, together with the Chairman of the Board, oversaw the procedure for appraisal of the Board (see p. 92). The appraisal questionnaire was validated by the Committee.
It prepared the Board’s review of the “Corporate Governance” chapter of the 2017 Annual Report, in particular concerning the assessment of Directors’ independence.

3 I 1
BOARD OF DIRECTORS’ REPORT ON CORPORATE GOVERNANCE CCORPORATE GGOVERNANCE
92 I 2018 REGISTRATION DOCUMENT I S O C I E T E G E N E R AL E G R O U P
Appraisal of the Board of Directors and its members Each year, the Board of Directors devotes part of a meeting to discussing its operation, based on an appraisal performed by a specialised external consultant every three years, and in other years based on interviews and questionnaires overseen by the Nomination and Corporate Governance Committee. In this respect, the role of the Nomination and Corporate Governance Committee consists in preparing and commencing the appraisal (in July) and then collecting the conclusions and preparing their presentation (in December) for discussion by the Board of Directors (in January). In both cases, the responses are presented on an anonymous basis in a summary document that serves as a basis for the Board’s discussions.
For 2017, the Board decided to rely on an appraisal conducted by the Chairman of the Board of Directors and the Chairman of the Nomination and Corporate Governance Committee. This appraisal focused on the collective operation of the Board as well as on the individual evaluation of each Director. The appraisal was based on an interview guide validated by the Nomination and Corporate Governance Committee. For the individual appraisals, each Director was asked to give his/her viewpoint on the contribution of each of the other Directors.
The results of the individual appraisals were discussed with each of the Directors by the Chairman of the Board of Directors.
The collective appraisal was discussed at the Board of Directors’ meeting on 12th January 2018. Overall, the Directors expressed their satisfaction with the Board’s drive and performance, pointing to consistent improvements.
The composition is considered balanced and includes the skills necessary for the exercise of its mission. Directors unanimously note the increasing proportion of time spent on regulatory issues and would like to see enough time set aside on the agendas for strategic and commercial matters.
The reports of the Committees to the Board are considered very useful. The appraisal of the Committees' work highlights the constant lengthening of agendas under the pressure of regulatory issues.
More generally, the Board of Directors would like the division of roles with the General Management to be clarified, given the regulatory trend in all countries towards giving the Board of Directors ever broader responsibilities. Some of the proposals put forward in the context of the appraisal were taken into account in the amendments to the Internal Rules (role of the Committees in the monitoring of CSR and of the Culture and Conduct programme). In addition, an enhanced training programme will be implemented for 2018 (particularly in respect of risk and prudential rules). Lastly, the appraisal highlighted the excellent quality of the dialogue between the Board and the General Management.
Training The annual seminar and certain topics discussed at Board meetings also aim to provide additional training, particularly on the regulatory and competitive environment. In 2017, a number of training sessions were devoted to the security of information systems and more specifically to cybersecurity. Lastly, certain sessions were devoted to market risks, the fight against money laundering and IFRS 9.
As part of the Board of Directors' appraisal, it was decided to further strengthen the training programme in 2018, particularly in respect of accounting, prudential and risk matters.
Attendance fees paid to the Company’s Directors The annual amount of the attendance fees was set at EUR 1,500,000 by the General Meeting of 18th May 2016. EUR 1,460,000 of this annual amount was used in respect of the 2017 financial year.
The rules governing the allocation of attendance fees between Directors are determined by Article 15 of the Internal Rules (see chapter 7).
The amount of attendance fees allocated is reduced by a lump sum of EUR 130,000, divided between the Chairman of the Audit and Internal Control Committee and the Chairman of the Risk Committee.
The balance is divided into 50% fixed, 50% variable. The number of fixed portions per Director is 6.
Additional fixed portions are allocated:
Chairman of the Audit and Internal Control Committee or of the Risk Committee: 4 portions;
Chairman of the Nomination and Corporate Governance Committee or of the Compensation Committee: 3 portions;
Member of the Nomination and Corporate Governance Committee or of the Compensation Committee: 0.5 portion;
Member of the Audit and Internal Control Committee or of the Risk Committee: 1 portion.
The variable portion of attendance fees is divided up at the end of the year, in proportion to the number of meetings or working meetings of the Board of Directors and of each of the Committees which each Director has attended. However, meetings of the Compensation Committee and the Nomination and Corporate Governance Committee held on the same day are counted as a single unit for members sitting on both Committees. The same applies to the meetings of the Audit and Internal Control Committee and the Risk Committee.
As from 2018, the granting of the fixed portions in full is conditional upon attendance in excess of 80%, and the rule for allocation of the variable portions – according to which meetings of the Audit and Internal Control Committee and of the Risk Committee, or of the Compensation Committee and of the Nomination and Corporate Governance Committee, held on the same day count for only one meeting – is repealed.
The Chairman and the Chief Executive Officer do not receive any attendance fees.
(AS AT 1ST JANUARY 2018)

3
BOARD OF DIRECTORS’ REPORT ON CORPORATE GOVERNANCE
1 I 3 CCORPORATE GOVERNANCEE
S O C I E T E G E N E R AL E G R O U P I 2018 REGISTRATION DOCUMENT I 93
GENERAL MANAGEMENT ((AS AT 1SST JJANUARY 22018)
Organisation of the General ManagementGeneral Management oversees the Company and acts as its representative vis-à-vis third parties. General Management comprises the Chief Executive Officer, Frédéric Oudéa, who is assisted by three Deputy Chief Executive Officers:
Séverin Cabannes, in office since May 2009, who supervises in particular Finance, Risk, Compliance and Resources;
Bernardo Sanchez Incera, in office since 1st January 2010, responsible in particular for all activities related to retail banking customers (individuals, professionals, SMEs, etc.); and
Didier Valet, in office since 16th January 2017, who supervises in particular Global Banking and Investor Solutions.
Limitations imposed on the powers of the Chief Executive Officer and the Deputy Chief Executive Officers The By-laws and the Board of Directors do not impose any special restrictions on the powers of the Chief Executive Officer or Deputy Chief Executive Officers; they shall exercise these powers in accordance with the applicable laws and regulations, By-laws, Internal Rules and guidelines set by the Board of Directors.
Article 1 of the Internal Rules (see Chapter 7, p. 546) defines the cases in which prior approval by the Board of Directors is required (strategic investment projects in excess of a specific amount, etc.).
Presentation of the members of General Management
DDate of birth:
3rd July 1963
Holds:
137,120 shares
2,064 shares through Société Générale Actionnariat (Fonds E)
Frédéric OUDÉA Chief Executive Officer
Biography
See page 77.
Other offices held currently Other offices and positions held in other
companies in the past five years
None. None.

3 I 1
BOARD OF DIRECTORS’ REPORT ON CORPORATE GOVERNANCE CCORPORATE GGOVERNANCE
94 I 2018 REGISTRATION DOCUMENT I S O C I E T E G E N E R AL E G R O U P
DDate of birth:
21st July 1958
Holds 55,618 shares
Séverin CABANNES Deputy Chief Executive Officer
Biography
Worked for Crédit National, Elf Atochem, then La Poste Group (1983-2001). Joined Societe Generale in 2001 as Group Chief Financial Officer until 2002. Deputy Chief Executive Officer responsible for the Steria Group’s strategy and finance, then Chief Executive Officer (2002-2007). Became Societe Generale’s Group Head of Corporate Resources in January 2007, followed by Deputy Chief Executive Officer since May 2008.
Other offices held currently Other offices and positions held in other
companies in the past five years
None. Director: Crédit du Nord* (from 2007 until 19th May 2016), Amundi Group* (from 2009 to 2015), TCW Group (United States) (from 2009to 2013).
Member of the Supervisory Board: Steria ScaGroup (from 2007 to 2014).
* Societe Generale Group
DDate of birth:
9th March 1960
Holds 50,524 shares
Bernardo SANCHEZ INCERA Deputy Chief Executive Officer
Biography
A Spanish national. From 1984 to 1992, corporate relationship manager and Deputy Head of the CorporateBusiness Branch of Crédit Lyonnais La Défense in Paris. From 1992 to 1994, Director and Chief Executive Officer of Crédit Lyonnais Belgium. From 1994 to 1996, Deputy Director of Banca Jover Spain. From 1996 to1999, Chief Executive Officer of Zara France. From 1999 to 2001, Head of International Operations for the Inditex Group, then Chairman of LVMH Mode et Maroquinerie Europe and of LVMH Fashion Group France from2001 to 2003. From 2003 to 2004, Chief Executive Officer of Vivarte France, then in 2004, Executive ManagingDirector for France of the Monoprix Group until 2009. He joined Societe Generale in November 2009, where hehas been a Deputy Chief Executive Officer since 1st January 2010.
Other offices held currently Other offices and positions held in other
companies in the past five years
In French unlisted companies
Chairman of the Board of Directors: Boursorama* (since 2015), Crédit du Nord* (since 2014).
Director: Sogecap* (since 2010).
In foreign listed companies
Director: BRD – Groupe Société Générale SA* (Romania) (since 2011).
Member of the Supervisory Board: PJSC Rosbank* (Russia) (since 2010).
In foreign unlisted companies
Member of the Supervisory Board: Société Générale Marocaine de Banque* (Morocco) (since 2010).
* Societe Generale Group
Director: Société Générale de Banques auSénégal* (Senegal) (from 2010 to 2015),Société Générale de Banques au Cameroun*(Cameroon) (from 2010 to 2015), Société Générale de Banques en Côte d’Ivoire* (Côte d’Ivoire) (from 2010 to 2015), CompagnieGénérale de Location d’Equipements* (from 2011 to 2014), Franfinance* (from 2010 to2014), ALD Automotive Group PLC* (United Kingdom) (from 2010 to 2014), National Société Générale Bank* (Egypt) (from 2010 to2013).
Member of the Supervisory Board:Banka A.S* (Czech Republic) (from 2010 to 2015).

3
BOARD OF DIRECTORS’ REPORT ON CORPORATE GOVERNANCE
1 I 3 CCORPORATE GOVERNANCEE
S O C I E T E G E N E R AL E G R O U P I 2018 REGISTRATION DOCUMENT I 95
DDate of birth:
15th January 1968
Holds:
29,303 shares
8,468 shares through Société Générale Actionnariat (Fonds E)
Didier VALET Deputy Chief Executive Officer
Biography
A graduate of the École Polytechnique, the École Nationale de la Statistique et de l’Administration Economique and the Société Française des Analystes Financiers. Analyst within the Economic and Financial ResearchDepartment of Banque Indosuez from 1992 to 1996. Joined Dresdner Kleinwort Benson from 1996 to 1999 as Equity Research Analyst. Joined Societe Generale Group in 2000 where he held various posts until 2008.Became Chief Financial Officer of the Group in 2008, then Head of Corporate and Investment Banking. From2013 to 2017, Head of Corporate and Investment Banking, Private Banking, Asset Management and Securities Services. Alongside this position, he was also appointed Deputy Chief Executive Officer in 2017.
Other offices held currently Other offices and positions held in other
companies in the past five years
In French unlisted companies
Chairman: Inter Europe Conseil* (since 2010).
* Societe Generale Group
Chairman of the Board of Directors: SG Americas Securities Holdings, LLC* (UnitedStates) (2016).
Director: Sogecap* (from 2013 to 10th May 2017).
Member of the Supervisory Board: PJSC Rosbank* (Russia) (from 2012 to 2016).

3 I 1
BOARD OF DIRECTORS’ REPORT ON CORPORATE GOVERNANCE CCORPORATE GGOVERNANCE
96 I 2018 REGISTRATION DOCUMENT I S O C I E T E G E N E R AL E G R O U P
GOVERNANCE BODIES
General Management Committee Comprising the Group Chief Executive Officer and Deputy Chief Executive Officers, the General Management Committee meets every week.
Reporting to the Chief Executive Officer, the Committee submits the Group’s overall strategy to the Board of Directors and oversees its implementation.
Group Strategy Committee
Comprising the Chief Executive Officer, Deputy Chief Executive Officers, some Heads of Business Unit and Service Unit, and the Head of Strategy, the Group Strategic Committee meets on a bi-monthly basis.
Reporting to the Chief Executive Officer, the Committee is responsible for the implementation of Group strategy.
Strategic Management Committee of the Business Units and Service Units Comprising the General Management, the Head of the Business Unit or Service Unit in question, the Head of Strategy, and the Heads of some Business Units and Service Units, the Strategic Management Committee of the Business Units and Service Units meets at least once a year for each Business Unit and Service Unit. Committee meetings are dedicated to the strategic management of the Business Unit or Service Unit in question.
(As at 1st January 2018)

3
BOARD OF DIRECTORS’ REPORT ON CORPORATE GOVERNANCE
1 I 3 CCORPORATE GOVERNANCEE
S O C I E T E G E N E R AL E G R O U P I 2018 REGISTRATION DOCUMENT I 97
Group Management Committee ((As at 1sst JJanuary 2018)
Comprising around 60 executives appointed by the Chief Executive Officer and belonging to the Service Units and Business Units, the Group Management Committee meets at least once per quarter. The Group Management Committee is a body for communicating and debating strategy and issues of general interest to the Group.
Name Main function within the Societe Generale Group
Frédéric OUDÉA Chief Executive Officer
Séverin CABANNES Deputy Chief Executive Officer
Bernardo SANCHEZ INCERA Deputy Chief Executive Officer
Didier VALET Deputy Chief Executive Officer
Philippe AMESTOY Head of Operations and Transformation in French Retail Banking
Hervé AUDREN de KERDREL Deputy Chief Financial Officer of the Group
Pascal AUGÉ* Head of Global Transaction and Payment Services
Philippe AYMERICH* Chief Executive Officer of Crédit du Nord
Cécile BARTENIEFF* Chief Operating Officer at Global Banking and Investor Solutions
François BLOCH Chief Executive Officer of BRD
Alain BOZZI Head of Group Internal Control Coordination
Gilles BRIATTA* Group General Secretary
Chief Operating Officer at International Banking and Financial Services
Antoine CREUX Chief Security Officer
Thierry D’ARGENT* Co-Head of Coverage and Investment Banking
Véronique DE LA BACHELERIE Executive Director of Societe Generale Bank & Trust
Bruno DELAS* Head of Innovation & Information Technology in French Retail Banking
Frank DROUET* Head of Global Markets
Marie--Christine DDUCHOLET Head of Customer Relations in French Retail Banking
Claire DUMAS Deputy Chief Financial Officer
Ian FISHER Head of the Culture and Conduct Programme
Patrick FOLLÉA Deputy Head of Societe Generale Private Banking, Head of Societe Generale Private Banking France
Jean--Marc GIRAUD* Head of Inspection and Audit Division
Carlos GONCALVES Head of Global Technology Services
Donato GONZALEZ--SANCHEZ Head of Corporate & Investment Banking, Private Banking, Asset Management, Securities Services and Group Country Head for Spain and Portugal
Laurent GOUTARD* Head of Societe Generale Retail Banking in France
Jean--François GRÉGOIRE Deputy Group Chief Risk Officer
Benoît GRISONI* Chief Executive Officer of Boursorama
Éric GROVEN Head of the Real Estate division in French Retail Banking
Caroline GUILLAUMIN* Group Head of Human Resources and Group Head of Communication

3 I 1
BOARD OF DIRECTORS’ REPORT ON CORPORATE GOVERNANCE CCORPORATE GGOVERNANCE
98 I 2018 REGISTRATION DOCUMENT I S O C I E T E G E N E R AL E G R O U P
Name Main function within the Societe Generale Group
Didier HAUGUEL* Group Country Head for Russia
Philippe HEIM* Group Chief Financial Officer
Édouard--Malo HENRY* Group Head of Compliance
Alvaro HUETE Deputy Head of Global Finance and Head of GLFI for the United Kingdom
Arnaud JACQUEMIN Deputy Head of Group Compliance
Jochen JEHMLICH* Head of the Equipment Finance businesses and CEO of GEFA Bank
Jan JUCHELKA Banka and Group Country Head for the Czech
Republic and Slovakia
William KADOUCH--CHASSAING Head of Group Strategy
Jean--Louis KLEIN Head of Corporate Accounts for Societe Generale Retail Banking in France
Slawomir KRUPA* Chief Executive Officer for Societe Generale Americas
Christophe LEBLANC* Group Head of Corporate Resources and Innovation
Diony LEBOT* Group Chief Risk Officer
Xavier LOFFICIAL Head of Transformation, Processes and Information Systems
Michala MARCUSSEN Group Chief Economist and Head of Economic and Sectoral Research
Anne MARION--BOUCHACOURT Group Chief Country Officer for China
Mike MASTERSON* Chief Executive Officer of ALD Automotive
Laetitia MAUREL Group Deputy Head of Communication
Alexandre MAYMAT* Head of the Africa/Asia/Mediterranean Basin & Overseas region, International Banking and Financial Services
Jean--François MAZAUD* Head of Societe Generale Private Banking, Supervisor of Lyxor
Françoise MERCADAL--DELLASALLES Deputy Chief Executive Officer of Crédit du Nord
Hikaru OGATA* Chief Executive Officer of Societe Generale Asia Pacific
Dmitry OLYUNIN Chief Executive Officer of Rosbank
Pierre PALMIERI* Head of Global Finance
Jean--Luc PARER Advisor to the Deputy Chief Executive Officer
Philippe PERRET* Head of the Insurance businesses
Sylvie PRÉA Director of Corporate Social Responsibility
Bruno PRIGENT* Global Head of Societe Generale Securities Services
Sylvie RÉMOND* Co-Head of Coverage and Investment Banking
Sadia RICKE Group Country Head for the United Kingdom and Head of Coverage and Investment Banking in the United Kingdom
Grégoire SIMON--BARBOUX Deputy Group Chief Risk Officer
Giovanni--Luca SOMA* Head of the Europe region, International Banking and Financial Services division
Vincent TRICON Head of Societe Generale’s Mid Cap Investment Banking
Guido ZOELLER Group Country Head for Germany and Head of Societe Generale Corporate & Investment Banking activities in Germany
* Head of a Business Unit or Service Unit.
Fixed Remuneration (FR)
Annual Variable Remuneration (AVR)
Long-Term Incentives (LTIs)

3
BOARD OF DIRECTORS’ REPORT ON CORPORATE GOVERNANCE
1 I 3 CCORPORATE GOVERNANCE
S O C I E T E G E N E R AL E G R O U P I 2018 REGISTRATION DOCUMENT I 99
REMUNERATION OF GROUP SENIOR MANAGEMENT
Policy governing remuneration of Chief Executive Officers, subject to shareholders’ approval The policy governing the remuneration of the Chief Executive Officers, presented below, was defined by the Board of Directors on 7th February 2018 following the recommendations of the Compensation Committee. This policy has essentially remained unchanged since 2017.
In the course of its work, the Compensation Committee relied on studies conducted by the independent firm of Willis Towers Watson. These studies are based on the CAC 40 as well as a panel of comparable European banks providing a benchmark, and enable an assessment of:
the competitiveness of the Chief Executive Officers’ overall remuneration in comparison to a panel of peers;
Societe Generale’s results as compared to the criteria defined by the Group to assess the Chief Executive Officers’ performance; and
the correlation between the Chief Executive Officers’ performance and their remuneration.
In accordance with Article L. 225-37-2 of the French Commercial Code, this policy is subject to the approval of the General Meeting. If it is rejected, then the remuneration policy approved by the General Meeting of 23rd May 2017 will remain in effect.
Furthermore, as from 2018, variable (annual variable remuneration and long-term incentives) or exceptional components of remuneration cannot be paid until they have been approved by the General Meeting.
REMUNERATION PRINCIPLES The remuneration policy for the Chief Executive Officers aims to ensure that the Company’s top-level positions attract the most promising candidates and to cultivate motivation and loyalty on a lasting basis, whilst also ensuring appropriate compliance and risk management. It is also designed to recognise the long-term implementation of the Group’s strategy in the interests of its shareholders, clients and staff, in accordance with the principles laid down by the Group’s Code of Conduct.
The policy takes into account the completeness of the remuneration components and any other benefits granted when performing an overall assessment of the Chief Executive Officers’ compensation. It ensures that these different elements are balanced, in the general interest of the Group. In accordance with the “pay for performance” principle, non-financial aspects are taken into account in addition to financial performance criteria when determining variable remuneration; such non-financial aspects include in particular elements related to corporate social responsibility and compliance with the Group’s leadership model. For the purposes of variable remuneration, performance is assessed on an annual and multi-annual basis, taking into account both Societe Generale’s intrinsic performance and its performance as compared to its market and competition.
Furthermore, the Chief Executive Officers’ remuneration complies with:
the CRD4 Directive of 26th June 2013, the aim of which is to impose remuneration policies and practices compatible with effective risk management. CRD4 has been transposed into
national law and its principles in terms of remuneration have been in effect since 1st January 2014;
the French Commercial Code; and
the recommendations of the AFEP-MEDEF Code.
REMUNERATION OF THE NON-EXECUTIVE CHAIRMAN The Board of Directors’ meeting of 7th February 2018 resolved to maintain Mr. Bini Smaghi’s fixed remuneration at EUR 850,000 throughout the remainder of his term of office, which expires at the end of the General Meeting of 23rd May 2018. This remuneration is unchanged since his appointment on 19th May 2015.
The Board of Directors proposed to renew his term of office as Director and, pursuant to a proposal from the Nomination and Corporate Governance Committee, confirmed that he would remain chairman of the Board provided the General Meeting approved the renewal of his term of office.
In anticipation of these future decisions, the Board of Directors, pursuant to a proposal from the Compensation Committee, resolved to increase his fixed remuneration to EUR 925,000 per annum for the duration (four years) of his new term of office (+ 8.82% compared with his fixed remuneration as set in 2015). The Board based its decision on remuneration trends observed within the Group over the period and a review of the remuneration paid to non-executive Board Chairs in other listed European banks and financial institutions of comparable size and with similar activities.
He does not receive attendance fees.
In order to guarantee total independence in fulfilling his mandate, he receives neither variable compensation, nor securities, nor any compensation contingent on the performance of Societe Generale or the Group.
He is provided with company accommodation for the performance of his duties in Paris.
REMUNERATION OF GENERAL MANAGEMENT
BALANCED REMUNERATION TAKING INTO ACCOUNT THE EXPECTATIONS OF THE VARIOUS STAKEHOLDERS
The remuneration of Chief Executive Officers is broken down into three components:
FFixed Remuneration (FR) rewards experience and responsibilities, and takes into account market practices. It accounts for a significant proportion of overall remuneration.
AAnnual Variable Remuneration (AVR) rewards performances achieved during the year and the contribution of Chief Executive Officers to the success of the Societe Generale Group.
LLong--TTerm Incentives (LTIs) aim to strengthen the association between Chief Executive Officers and shareholders’ interests, and to provide the former with an incentive to deliver long-term performance. Vesting of LTIs is subject to a condition of presence and is based on the Group’s performance as measured against internal and external criteria over periods of four and six years.

3 I 1
BOARD OF DIRECTORS’ REPORT ON CORPORATE GOVERNANCE CCORPORATE GOVERNANCE
100 I 2018 REGISTRATION DOCUMENT I S O C I E T E G E N E R AL E G R O U P
Pursuant to CRD4, and further to the authorisation granted by the General Meeting in May 2014, variable compensation (i.e. annual variable remuneration plus long-term incentives) is capped at 200% of fixed remuneration.
Furthermore, Chief Executive Officers who receive remuneration in the form of shares or share equivalents are prohibited from implementing hedging or insurance strategies over the vesting and holding periods.
FIXED REMUNERATION
In line with the recommendations of the AFEP-MEDEF Code, fixed remuneration is only reviewed at relatively long intervals.
The annual fixed remuneration of Frédéric Oudéa, Chief Executive Officer, amounts to EUR 1,300,000 and that of Séverin Cabannes and Bernardo Sanchez Incera, Deputy Chief Executive Officers, to EUR 800,000. These amounts have not changed since the Board of Directors’ resolution dated 31st July 2014, and were approved by the Joint General Meeting of 23rd May 2017.
The annual fixed remuneration of Didier Valet, appointed Deputy Chief Executive Officer on 13th January 2017, effective 16th January 2017, was set by the Board of Directors on 13th January 2017 at the same amount as for the other Deputy Chief Executive Officers, i.e. EUR 800,000.
Any modification of fixed remuneration decided by the Board of Directors based on a proposal from the Compensation Committee must be approved by the General Meeting before entering into effect.
ANNUAL VARIABLE REMUNERATION
GENERAL PRINCIPLES
The Board of Directors defines each year the evaluation criteria for the Chief Executive Officers’ annual variable remuneration in respect of the previous year.
Annual variable remuneration is 60% based on quantitative criteria, and 40% on qualitative criteria, thus combining an evaluation of the Group’s financial performance with an assessment of managerial skills, in line with the Group’s strategy and leadership model.
60% 40%
Quantitative criteria based on annual financial performance. Indicators and target achievement levels are set in advance by the Board of Directors, primarily based on the budget targets for the Group and the businesses within each Chief Executive Officer’s scope of supervision.
Qualitative criteria based essentially on the achievement of key targets in relation to the Group’s strategy, operational efficiency and risk management, as well as the CSR policy.
Quantitative portion
Qualitative portion

3
BOARD OF DIRECTORS’ REPORT ON CORPORATE GOVERNANCE
1 I 3 CCORPORATE GOVERNANCE
S O C I E T E G E N E R AL E G R O U P I 2018 REGISTRATION DOCUMENT I 101
QQuantitative portion
For Frédéric Oudéa and Séverin Cabannes, the quantitative portion is measured according to the achievement of Group targets in terms of earnings per share, gross operating income and cost-to-income ratio, each indicator being equally weighted. For Bernardo Sanchez Incera and Didier Valet, the economic criteria concern both the Group as a whole and their specific area of responsibility.
These indicators reflect targets in terms of operational efficiency and risk management over the relevant scope of responsibility, and value creation for the shareholders. Comprising both financial and operational elements, these indicators are directly linked to the Group’s strategy and are based on compliance with a predefined budget.
QQualitative portion
Each year, the Board of Directors sets between six and ten qualitative targets for the next financial year. Most of these targets are collective, reflecting the team spirit that is essential within General Management. Targets specific to each Chief Executive Officer are also set, according to their respective areas of responsibility.
These targets, defined in line with the Group’s leadership model, are based on a number of main areas, including:
strategy of the Group and businesses;
operational efficiency and risk management;
customer satisfaction and innovation;
achievement of corporate social responsibility targets, reflected in particular by Societe Generale’s positioning within the upper quartile of the bank rankings established by extra-financial ratings agency RobecoSam.
VESTING AND PAYMENT OF ANNUAL VARIABLE REMUNERATION
With a view to strengthening the correlation between remuneration and the Group’s risk appetite targets, whilst promoting alignment with shareholders’ interests, and in accordance with the CRD4 Directive, vesting of at least 60% of
the annual variable remuneration is deferred for three years, pro rata. This concerns both cash payments and shares or share equivalents granted subject to the achievement of long-term targets in terms of Group profitability and equity; the amount thereof is reduced if the targets are not met. A six-month holding period applies after each definitive vesting date.
The amount of the variable portion granted in shares or share equivalents is converted on the basis of a share price determined each year by the Board of Directors, corresponding to the trade-weighted average based on the last 20 trading days prior to the Board meeting. The portion of annual variable remuneration granted as share equivalents gives rise to the payment of an amount equivalent to the dividend payment, where applicable, throughout the compulsory holding period. No dividends are paid during the vesting period.
Furthermore, if the Board observes that a decision taken by the Chief Executive Officers has particularly significant consequences for the Company’s results or image, it may decide not only to reconsider payment of the deferred annual variable remuneration in full or in part (malus clause), but also to recover, for each award, all or part of the sums already distributed over a five-year period (clawback clause).
11/3
11/3
11/3
Frédéric Oudéa and Séverin Cabannes
Gross operating income (Group)
Earnings per share (Group)
Cost-to-income ratio (Group)
1/6
1/6
1/61/6
1/6
1/6
Bernardo Sanchez Incera and Didier Valet
Gross operating income (Group)
Earnings per share (Group)
Cost-to-income ratio (Group)
Gross operating income (scope of responsibility of each Deputy CEO)
Earnings before tax (scope of responsibility of each Deputy CEO)
Cost-to-income ratio (scope of responsibility of each Deputy CEO)

3 I 1
BOARD OF DIRECTORS’ REPORT ON CORPORATE GOVERNANCE CCORPORATE GOVERNANCE
102 I 2018 REGISTRATION DOCUMENT I S O C I E T E G E N E R AL E G R O U P
Lastly, vesting of the deferred annual variable remuneration is also subject to a condition of presence throughout the term of office concerned. The exceptions to this requirement are as follows: retirement, death, disability, incapacity to carry out duties or termination for reasons of a strategic divergence with the Board of Directors.
After expiry of the term of office concerned, the condition of presence no longer applies. However, if the Board observes, after the departure of the Chief Executive Officer, that a decision taken during his term of office has particularly significant consequences for the Company’s results or image, it may decide to reconsider payment of the deferred annual variable remuneration in full or in part.
CAP
In compliance with the AFEP-MEDEF Code, since 1st September 2014, annual variable remuneration has been capped at 135% of annual fixed remuneration for the Chief Executive Officer and at 115% for the Deputy Chief Executive Officers.
LONG-TERM INCENTIVES
GENERAL PRINCIPLES
In order to implicate the Chief Executive Officers in the Company’s long-term progress and to align their interests with those of the shareholders, since 2012 they have been awarded long-term incentives, consisting of shares or share equivalents.
In order to comply with the recommendations of the AFEP-MEDEF Code, the Board of Directors decides each year, during the meeting approving the financial statements from the previous year, on any award of Societe Generale shares or share equivalents to the Chief Executive Officers; the fair value of any such award upon granting is proportional to other compensation elements and is set in line with practices from previous years. Such fair value is set on the basis of the share closing price on the day before the Board meeting.
Furthermore, Chief Executive Officers cannot be awarded long-term incentives upon leaving office.
VESTING AND PAYMENT OF LONG-TERM INCENTIVES
As in previous years, the plan is as follows:
granting of shares or share equivalents in two instalments, with vesting periods of four and six years, followed by a one-year holding period, thus increasing the indexing periods to five and seven years respectively;
definitive vesting subject to a condition of presence throughout the vesting periods, as well as a performance condition. Vesting depends on the relative performance of the Societe Generale share as measured by the increase in Total Shareholder Return (TSR) compared to that of 11 European peers over the entirety of the vesting periods. Thus, the entirety of the award will only vest if Societe Generale’s TSR is in the upper quartile of the sample; if it is slightly above the median value, the vesting rate will be 50% of the total number of shares or share equivalents granted; no shares or share equivalents will vest if the TSR is too low. If the Group is not profitable in the year preceding the definitive vesting of long-term incentives, no payment will be made, regardless of the performance of the Societe Generale share;(1)
any departure will result in cancellation of the payment under the plan, unless the Chief Executive Officer in question is retiring or leaving the Group due to changes in its structure or organisation, in which case the shares will be awarded or payments made based on the performance observed and assessed by the Board of Directors.
Lastly, the beneficiaries of long-term incentives are also subject to a “malus” clause. Thus, if the Board observes that a decision taken by the Chief Executive Officers has particularly significant consequences for the Company’s results or image, it may decide to reconsider payment of the long-term incentives in full or in part.
(1) The complete vesting chart is shown below:
SG Rank Ranks
1*, 2 and 3 Rank 4 Rank 5 Rank 6Ranks
7, 8 and 9 Ranks
10, 11 and 12
As a % of the max. number granted 100% 83.3% 66.7% 50% 25% 0
* Highest rank in the sample.

3
BOARD OF DIRECTORS’ REPORT ON CORPORATE GOVERNANCE
1 I 3 CCORPORATE GOVERNANCE
S O C I E T E G E N E R AL E G R O U P I 2018 REGISTRATION DOCUMENT I 103
CAP
In accordance with the AFEP-MEDEF Code, the Board of Directors decided, on 7th February 2018, to maintain the cap, at the same level as for annual variable remuneration, on the total amount of long-term incentives awarded (as measured under IFRS). The amount awarded is thus limited to 135% of annual fixed remuneration for Frédéric Oudéa and at 115% for the Deputy Chief Executive Officers.
This provision applies in addition to the cap on the definitive vesting value of shares or the payment value of share
equivalents. These values are capped at an amount corresponding to a multiple of the book value per share of the Societe Generale Group as at 31st December in the year in respect of which the long-term incentives are granted.
In all events, in accordance with applicable regulations, the variable component awarded (i.e. annual variable remuneration and long-term incentives) must not exceed two times the fixed remuneration.
TOTAL REMUNERATION - PAYMENT OR SHARE DELIVERY TIMELINE
POST-EMPLOYMENT BENEFITS: PENSION, SEVERANCE PAY, NON-COMPETE CLAUSE
PENSION
As Frédéric Oudéa terminated his employment contract by resigning when he was appointed Chairman and Chief Executive Officer in 2009, he no longer enjoys the right to any supplementary pension from Societe Generale.
SUPPLEMENTARY PENSION ALLOCATION PLAN
Mr. Cabannes and Mr. Sanchez Incera retain the benefit of the supplementary pension allocation plan for senior managers that applied to them as employees prior to their appointment as Chief Executive Officers(1).
This supplementary plan, introduced in 1991 and satisfying the requirements of Article L. 137-11 of the French Social Security Code, provides senior executives appointed as from this date and “outside classification” with a supplementary pension as from the date on which they claim their French Social Security pension. Their total pension thus amounts to the product of the following:
the average, over the last ten years of their career, of the proportion of their fixed remuneration exceeding “Tranche B” of the AGIRC pension plus variable remuneration of up to 5% of their fixed remuneration;
the rate equal to the number of years of professional service at Societe Generale divided by 60, corresponding to a potential acquisition of annuity rights of 1.67% a year (it being noted that the years of service taken into account are capped at 42).
The AGIRC “Tranche C” pension acquired in respect of their career at Societe Generale is deducted from this total pension. The supplementary amount covered by Societe Generale is increased for beneficiaries who have raised three or more children, as well as for those who retire after the legal retirement age set by French Social Security. It may not be less than one-third of the full-rate service value of the AGIRC “Tranche B” points acquired by the beneficiary since gaining “Outside Classification” status.
(1) Related-party agreements with Mr. Cabannes and Mr. Sanchez Incera approved by the General Meetings of 19th May 2009 and 25th May 2010.

3 I 1
BOARD OF DIRECTORS’ REPORT ON CORPORATE GOVERNANCE CCORPORATE GOVERNANCE
104 I 2018 REGISTRATION DOCUMENT I S O C I E T E G E N E R AL E G R O U P
Each year, potential annuity rights are calculated according to projected length of service and salary at retirement, based on recognised actuarial principles. They are prefinanced with an insurance company.
The rights are subject to the employee being employed by the Company upon claiming their pension.
Upon Didier Valet’s appointment as Chief Executive Officer on 13th January 2017, the Board of Directors authorised a related-party commitment pursuant to which Mr. Valet retains the benefit of the supplementary pension plan for senior managers that applied to him as an employee. This related-party commitment was approved by the General Meeting of 23rd May 2017.
As required by law, the annual increase in supplementary pension benefits conditional upon the beneficiary completing his career within the Company is subject, as from his appointment, to the following performance condition: potential annuity rights for any given year will only be awarded in full if at least 80% of the variable remuneration performance conditions for that year are met. For performance levels of 50% or below, there will be no increase in the annuities. For an achievement rate of between 80% and 50%, the benefits awarded for the year will be calculated on a straight-line basis.
This pension scheme will likely have to be amended in 2018, in view of expected changes in the regulations on supplementary pension schemes involving benefits that are not fixed (Article L. 137-11 of the French Social Security Code).
VALMY PENSION SAVINGS SCHEME (FORMERLY IP VALMY SCHEME)
Mr. Cabannes, Mr. Sanchez Incera and Mr. Valet also remain entitled to the supplementary defined-contribution pension plan that they had as employees prior to their appointment as Chief Executive Officers.
This defined-contribution plan, established in line with Article 83 of the French General Tax Code, was implemented in 1995 and amended on 1st January 2018 (and is now called Epargne Retraite Valmy, i.e. Valmy pension savings scheme). Membership is compulsory for all employees with more than six months’ seniority within the Company and allows beneficiaries to save for their retirement, with benefits being paid in the form of life annuities upon retirement. Contributions correspond to 2% of the employee’s remuneration, capped at twice the annual French Social Security cap, 1.5% of which is paid by the Company. The plan is now insured with Sogecap (as opposed to the insurance company Valmy, as previously).
SEVERANCE PAY
Since 2017, the rules governing the Chief Executive Officer’s or Deputy Chief Executive Officers’ departure from the Group upon termination of their duties have been harmonised. The rules were defined in light of market practices, and are compliant with the AFEP-MEDEF Code.
NON-COMPETE CLAUSE(1)
The Chief Executive Officers (Frédéric Oudéa, Séverin Cabannes, Bernardo Sanchez Incera and Didier Valet) have signed a non-compete clause in favour of Societe Generale, valid for a period of six months as from the date on which their duties as Chief
Executive Officer end, in accordance with standard practice for financial institutions. The clause prohibits them from accepting a position at the same level with either a listed credit institution in Europe (defined as the European Economic Area, including the United Kingdom) or an unlisted credit institution in France. In exchange, they may continue to receive their fixed salary.
The Board of Directors alone can waive such clause, up until the date on which the term of office of the Chief Executive Officer in question ends. In such a case, the Chief Executive Officer will no longer be bound by any commitment, and no sums will be payable to him in such respect.
In the event of breach of the non-compete, the Chief Executive Officer in question will be required to immediately pay a penalty equal to six months’ fixed salary. Societe Generale will in such a case be released from its obligation to pay any financial compensation and may, furthermore, demand the refund of any financial compensation as may have already been paid since the breach.
This amount remains below the recommended limit of 24 months’ fixed plus variable annual remuneration, as stipulated in the AFEP-MEDEF Code.
SEVERANCE PAY(2)
In accordance with the recommendations of the AFEP-MEDEF Code, Frédéric Oudéa gave up his employment contract upon his appointment to the position of Chairman and Chief Executive Officer in 2009. He thus forfeited his entitlement to the benefits and guarantees which he would have enjoyed as an employee with close to 15 years of service. Similarly, as a result of the suspension of the employment contracts of the Deputy Chief Executive Officers, any amounts as may payable to them in statutory or contractual severance pay would be low to nil.
The features of the severance pay are as follows:
payment will only be due in the event of a non-voluntary departure from the Group, justified as such by the Board of Directors. No payment will be due in the event of serious misconduct, resignation or non-renewal of the Chief Executive Officer’s appointment for reasons attributable to the latter;
payment will be contingent upon an overall achievement rate for the annual variable remuneration targets of at least 60% on average over the three years preceding the end of the Chief Executive Officer’s term of office;
no severance pay will be due to a Chief Executive Officer leaving within six months before claiming his French Social Security pension, entitling him to claim the supplementary senior managers’ pension;
the payment will amount to two years’ fixed salary, thus complying with the recommendation in the AFEP-MEDEF Code, i.e. two years’ fixed and variable annual remuneration.
In no circumstances may the severance pay and non-compete payment combined exceed the cap recommended in the AFEP-MEDEF Code (i.e. two years’ fixed and variable annual remuneration plus, if applicable, any other severance pay provided for under the employment contract, especially as stipulated under a collective agreement).
(1) Related-party agreements with Mr. Oudéa, Mr. Cabannes, Mr. Sanchez Incera and Mr. Valet approved by the General Meeting of 23rd May 2017. (2) Related-party commitments with Mr. Oudéa, Mr. Cabannes, Mr. Sanchez Incera and Mr. Valet approved by the General Meeting of 23rd May 2017.
Quantitative portion

3
BOARD OF DIRECTORS’ REPORT ON CORPORATE GOVERNANCE
1 I 3 CCORPORATE GOVERNANCE
S O C I E T E G E N E R AL E G R O U P I 2018 REGISTRATION DOCUMENT I 105
OTHER BENEFITS OF CHIEF EXECUTIVE OFFICERS The Chief Executive Officers have their own company car, available to them for private as well as professional use, and insurance providing the same cover in terms of health and death/invalidity benefits as for employees.
EXCEPTIONAL VARIABLE REMUNERATION
Societe Generale does not generally award exceptional variable remuneration to its Chief Executive Officers. However, in light of the new legislation requiring prior approval of all aspects of the remuneration policy, the Board of Directors would like to reserve the right to pay additional variable remuneration if warranted in certain highly specific situations, for example due to the impact on the Company, or the commitment demanded and challenges involved. Such remuneration would need to be justified, and would be set in accordance with the general principles of the AFEP-MEDEF Code on remuneration, as well as with the recommendations of the French Financial Markets Authority (AMF).
It would be paid on the same terms as the annual variable remuneration, i.e. partially deferred for a period of three years, and subject to the same conditions in terms of vesting. It would be included within the calculation of variable remuneration capped at 200% of the fixed component.
APPOINTMENT OF A NEW CHIEF EXECUTIVE OFFICER As a general rule, the remuneration components and structure described in this remuneration policy will also apply to any new Chief Executive Officer appointed whilst said policy remains in effect, according to his responsibilities and professional experience. The same principle will also apply to all other benefits granted to Chief Executive Officers (supplementary pension plan, insurance, etc.).
The Board of Directors is therefore responsible for setting the new Chief Executive Officer’s fixed salary in light of these elements, in line with the salary of existing Chief Executive Officers and the practices of comparable European financial institutions.
Lastly, any new Chief Executive Officer selected from outside the Societe Generale Group may be awarded a hiring bonus designed to act as compensation, if appropriate, for the remuneration forfeited in leaving his previous employer. This remuneration would vest on a deferred basis, and would be conditional upon the satisfaction of performance conditions similar to those applicable to the Chief Executive Officers’ deferred variable remuneration.
Remuneration of Chief Executive Officers for the 2017 financial year The remuneration of Chief Executive Officers for 2017 complies with the compensation policy approved by the General Meeting of 23rd May 2017.
In accordance with Article L. 225-100 of the French Commercial Code, the variable (i.e. annual variable remuneration and long-term incentives) and exceptional components of this remuneration cannot be paid until they have been approved by the General Meeting to be held on 23rd May 2018.
REMUNERATION OF THE NON-EXECUTIVE CHAIRMAN Lorenzo Bini Smaghi’s remuneration remained unchanged over financial year 2017. It amounted to EUR 850,000 gross per annum, as determined when he was appointed Chairman of the Board on 19th May 2015.
He receives neither variable remuneration, nor attendance fees, nor securities, nor compensation contingent on the performance of Societe Generale or the Group.
He is provided with company accommodation for the performance of his duties in Paris.
REMUNERATION OF GENERAL MANAGEMENT The policy governing remuneration of Chief Executive Officers ensures a balanced remuneration taking into account the expectations of the various stakeholders (see pp. 99-105).
FIXED REMUNERATION
The Chief Executive Officers’ fixed remuneration remained unchanged over financial year 2017. It amounted to EUR 1,300,000 for the Chief Executive Officer and EUR 800,000 for the Deputy Chief Executive Officers.
ANNUAL VARIABLE REMUNERATION IN RESPECT OF FINANCIAL YEAR 2017
CRITERIA FOR DETERMINING AND EVALUATING PERFORMANCE FOR 2017
On 15th March 2017, the Board of Directors defined the evaluation criteria for the Chief Executive Officers’ annual variable remuneration in respect of financial year 2017. In accordance with the compensation policy approved by the General Meeting of 23rd May 2017, these criteria are as follows:
QQuantitative portion
For Frédéric Oudéa and Séverin Cabannes, the quantitative portion is measured according to the achievement of Group targets in terms of earnings per share, gross operating income and cost-to-income ratio, each indicator being equally weighted. For Bernardo Sanchez Incera and Didier Valet, the economic criteria concern both the Group as a whole and their specific area of responsibility, as detailed on page 101.
These indicators reflect targets for operational efficiency and risk management over the relevant scope of responsibility, and value creation for the shareholders. Comprising both financial and operational elements, these indicators are directly linked to the Group’s strategy and are based on compliance with a predefined budget.
At its meeting on 7th February 2018, the Board of Directors recorded the following achievement rates:
Frédéric Oudéa: 69% of quantitative targets achieved,
Séverin Cabannes: 69% of quantitative targets achieved,
Bernardo Sanchez Incera: 71% of quantitative targets achieved,
Didier Valet: 68% of quantitative targets achieved.

3 I 1
BOARD OF DIRECTORS’ REPORT ON CORPORATE GOVERNANCE CCORPORATE GOVERNANCE
106 I 2018 REGISTRATION DOCUMENT I S O C I E T E G E N E R AL E G R O U P
QQualitative portion
The Board of Directors also set qualitative targets at its meeting on 15th March 2017. These are based on targets pertaining to the definition and presentation to the market of the 2020 strategic plan for the Group and the businesses, implementation of a new organisation and governance system, continued progress in terms of customer satisfaction, redefinition of the strategy in respect of corporate social responsibility (CSR), improvements in the Group’s capacity to innovate and management of operational risks related to IT systems. In addition, specific individual targets, such as implementation of the Culture and Conduct programme, transformation of the French networks and regulatory compliance, in particular for the new Compliance Division organisation, are also set.
In light of these targets for 2017, the Board of Directors, at its meeting of 7th February 2018 and based on the Compensation Committee’s recommendation, set the following achievement rates:
Frédéric Oudéa: 82.50% of qualitative targets achieved,
Séverin Cabannes: 79.38% of qualitative targets achieved,
Bernardo Sanchez Incera: 84.38% of qualitative targets achieved,
Didier Valet: 75.00% of qualitative targets achieved.
The Board of Directors particularly took into consideration the performance achieved by the businesses in an environment marked by the ramping-up of necessary transformations, a rapidly evolving regulatory context and a relatively inauspicious monetary and financial context. The Group’s transformation entered into a significant and positive new phase in 2017: continued adaptation of the business model, strengthening of the businesses’ capacity for innovation, definition of the new strategic Transform to Grow plan, and implementation of a new, more agile organisation.
Aside from the impacts of a certain number of exceptional items, the financial results for 2017 reflect the strong commercial momentum observed in all of the Group’s businesses, as well as strict control of costs and risks, and improved underlying profitability. The Board highlighted the continuing progress in CSR, especially the definition of a policy to support energy transition, ongoing improvements in customer satisfaction scores across all Group entities, and Societe Generale’s ranking among the leaders in the CAC 40 for innovation and digital transformation, with the launch, in late 2017, of the Internal Start-Up Call, aimed at promoting the dissemination of the spirit of innovation within the Group.
Target achievement rates are presented in the table below:
Quantitative targets
Qualitative targets
Overall achievement rate for 2017
targets
Group scope
Scope of responsibility of B. Sanchez Incera and
D. Valet
Total quantitative
targets EPS GOI C/I ratio GOI C/I ratio EBT
F. Oudéa Weight 20% 20% 20% - - - 60% 40%
74% Achievement rate
14% 13% 14% - - - 41% 33%
S. Cabannes Weight 20% 20% 20% - - - 60% 40%
73% Achievement rate
14% 13% 14% - - - 41% 32%
B. Sanchez Incera
Weight 10% 10% 10% 10% 10% 10% 60% 40% 76%
Achievement rate
7% 7% 7% 7% 7% 7% 42% 34%
D. Valet
Weight 10% 10% 10% 10% 10% 10% 60% 40% 71%
Achievement rate
7% 7% 7% 6% 7% 7% 41% 30%
Note: Percentages rounded to the nearest full number for the purposes of this chart. EPS: Earnings per Share. GOI: Gross operating income. EBT: Earnings before tax. C/I ratio: Cost-to-income ratio.
The CChief Executive Officer’s annual variable remuneration thus amounted to EUR 1,305,720, corresponding to an overall achievement rate of 74.40%.
His compensation for 2017 (defined as his fixed remuneration for 2017 plus annual variable remuneration awarded in respect of 2017), amounting to EUR 2.6 million, represents 46 times the average gross compensation of an employee of Societe Generale SA France (as compared to 49 in 2016).
The DDeputy Chief Executive Officers’ annual variable remuneration amounted to:
EUR 672,998 for Séverin Cabannes, corresponding to an overall achievement rate of 73.15%;
EUR 702,438 for Bernardo Sanchez Incera, corresponding to an overall achievement rate of 76.35%;
EUR 651,360 for Didier Valet, corresponding to an overall achievement rate of 70.80%.

3
Qualitative portion
Chief Executive Officer Deputy Chief Executive Officers
BOARD OF DIRECTORS’ REPORT ON CORPORATE GOVERNANCE
1 I 3 CCORPORATE GOVERNANCE
S O C I E T E G E N E R AL E G R O U P I 2018 REGISTRATION DOCUMENT I 107
RECORD OF FIXED AND ANNUAL VARIABLE REMUNERATION AWARDED TO CHIEF EXECUTIVE OFFICERS
(In EUR)
Reminder of 2015 fixed + annual variable remuneration
Reminder of 2016 fixed + annual variable remuneration
2017 fixed + annual variable remuneration
Fixed rem.
Annual variable
rem.
Total rem.
Fixed rem.
Annual variable
rem.
Total rem.
Fixed rem.
Annual variable
rem.
Total remuneration
Mr. OOudéa
1,300,000 1,474,200 2,774,200 1,300,000 1,450,262 2,750,262 11,300,000 1,305,720 2,605,720
Mr. CCabannes
800,000 712,080 1,512,080 800,000 744,630 1,544,630 8800,000 672,998 1,472,998
Mr. SSanchez Incera
800,000 759,920 1,559,920 800,000 761,466 1,561,466 8800,000 702,438 1,502,438
Mr. Valet((1)) N/A N/A N/A N/A N/A N/A 8800,000 651,360 1,451,360
Note: Gross amounts in EUR, as calculated at grant date. (1) Didier Valet’s term of office as Deputy Chief Executive Officer commenced on 16th January 2017.
LONG-TERM INCENTIVES FOR THE 2017 FINANCIAL YEAR In accordance with the compensation policy approved by the General Meeting of 23rd May 2017, the long-term incentive plan from which the Chief Executive Officers have benefitted since 2012 was renewed. It aims to implicate the Chief Executive Officers in the Company’s long-term progress and to align their interests with those of the shareholders.
In addition to the existing cap upon vesting, which has applied for a number of years, a cap has also been introduced on the granting of long-term incentives. Such cap has been set at the same level as for the annual variable remuneration. Frédéric Oudéa’s long-term incentives are therefore capped at 135% of his annual fixed remuneration. For Deputy Chief Executive Officers, the cap is 115% of their annual fixed remuneration.
In all events, in accordance with applicable regulations, the variable component awarded (i.e. annual variable remuneration plus long-term incentives) must not exceed two times the fixed remuneration.
On this basis, and in line with previous years, the Board of Directors, at its meeting of 7th February 2018, decided to implement the incentive plan for 2017 – subject to the approval
of the General Meeting of 23rd May 2018 pursuant to Article L.225-100 of the French Commercial Code – as follows:
grant value unchanged over time, expressed in accordance with IFRS. The corresponding number of shares has been calculated on the basis of the Societe Generale share’s book value as at 6th February 2018;
shares granted in two instalments, with vesting periods of four and six years, followed by a one-year holding period, thus increasing the total indexing periods to five and seven years;
definitive vesting subject to a condition of presence throughout the vesting periods, as well as a performance condition. Vesting depends on the relative performance of the Societe Generale share as measured by the increase in Total Shareholder Return (TSR) compared to that of 11 European peers over the entirety of the vesting periods. Thus, the entirety of the award will only vest if Societe Generale’s TSR is in the upper quartile of the sample; if it is slightly above the median value, the vesting rate will be 50% of the total number of shares or share equivalents granted; no shares or share equivalents will vest if the TSR performance is too low.

3 I 1
BOARD OF DIRECTORS’ REPORT ON CORPORATE GOVERNANCE CCORPORATE GOVERNANCE
108 I 2018 REGISTRATION DOCUMENT I S O C I E T E G E N E R AL E G R O U P
The complete vesting chart is shown below:
SG Rank Ranks
1*, 2 and 3 Rank 4 Rank 5 Rank 6 Ranks
7, 8 and 9 Ranks
10, 11 and 12
As a % of the max. number granted 100% 83.3% 66.7% 50% 25% 0
* Highest rank in the sample.
The 2018 peer sample comprises the following financial institutions: Barclays, BBVA, BNP Paribas, Crédit Agricole, Crédit Suisse, Deutsche Bank, Intesa Sanpaolo, Nordea, Santander, UBS and Unicredit.
The final payment value for the shares will be limited to EUR 77 per share, i.e. approximately 1.2 times the book value per Societe Generale Group share at 31st December 2017.
If the Group is not profitable (as measured by Group net income, excluding strictly accounting-related impacts associated with the revaluation of own debt and the Debt Value Adjustment) in the year preceding the definitive vesting of long-term incentives, no payment will be due, regardless of the performance of the Societe Generale share.
Any departure will result in cancellation of the payment under the plan, unless the Chief Executive Officer in question is
retiring or leaving the Group due to changes in its structure or organisation, in which case the shares or payments will be awarded based on the performance observed and assessed by the Board of Directors. Lastly, the beneficiaries of long-term incentives are also subject to a “malus” clause. Thus, if the Board observes behaviour or actions that are not in line with Societe Generale’s expectations, as defined in particular in the Group’s Code of Conduct, or risk-taking that exceeds the level deemed acceptable by Societe Generale, it may decide to withhold payment of the long-term incentives in full or in part.
The table below indicates the number of shares or share equivalents granted to each Chief Executive Officer under the plan with respect to 2017, and their book value:
Amount in book value* Maximum number granted
Frédéric Oudéa EUR 850,000 35,160
Séverin Cabannes EUR 570,000 23,578
Bernardo Sanchez Incera EUR 570,000 23,578
Didier Valet EUR 570,000 23,578
* Based on the share price on the day preceding the Board of Directors’ meeting of 7th February 2018, at which the allocation of the LTIs was determined.
POST-EMPLOYMENT BENEFITS: PENSION, SEVERANCE PAY, NON-COMPETE CLAUSE Details of these benefits are given on pages 103 and 104 and in the charts on pages 110 to 116.
Total remuneration and benefits of any kind paid or granted for financial year 2017 to Chief Executive Officers and subject to shareholders’ approval
TABLE 1
Lorenzo BINI SMAGHI, Chairman of the Board of Directors Remuneration compliant with the policy approved by the General Meeting of 23rd May 2017
Remuneration components paid or granted for financial year 2017
Amount or book value put to a vote Description
Fixed remuneration EUR 850,000 Gross fixed remuneration paid in 2017, unchanged since his appointment as Chairman of the Board of Directors on 19th May 2015.
Annual variable remuneration N/A Lorenzo Bini Smaghi does not receive any variable remuneration.
Attendance fees N/A Lorenzo Bini Smaghi does not receive any attendance fees.
Value of benefits in kind EUR 53,400
He is provided with company accommodation for the performance of his duties in Paris.

3
BOARD OF DIRECTORS’ REPORT ON CORPORATE GOVERNANCE
1 I 3 CCORPORATE GOVERNANCE
S O C I E T E G E N E R AL E G R O U P I 2018 REGISTRATION DOCUMENT I 109
TABLE 2
Frédéric OUDÉA, Chief Executive Officer Remuneration compliant with the policy approved by the General Meeting of 23rd May 2017 Remuneration components paid or granted for financial year 2017
Amount or book value put to a vote Description
Fixed remuneration EUR 1,300,000 Gross fixed remuneration paid in 2017, unchanged since the Board of Director’s decision of 31st July 2014 (confirmed in May 2015 when the functions of Chairman of the Board and Chief Executive Officer wereseparated).
Annual variable remuneration
Frédéric Oudéa benefits from annual variable remuneration broken down into two sub-components: 60% based on financial targets and 40% on qualitative targets. These elements are described on page 105 of the 2018 Registration Document. This annual variable remuneration is capped at 135% of fixed remuneration.
o.w. annual variable remuneration payable in 2018
EUR 261,144 (nominal amount)
Evaluation of 2017 performance – Given the quantitative and qualitative criteria defined by the Board of Directors in March 2017 and the achievement rates observed in financial year 2017, Mr. Oudéa’s annual variable remuneration was set at EUR 1,305,720(1). This corresponds to an overall target achievement rate of 74.40% of his maximum annual variable remuneration (see p.106 of the 2018 Registration Document). In accordance with CRD4, applicable to credit institutions, and Article L. 225-100 of the French CommercialCode, the payment conditions for annual variable remuneration are as follows:
60% of annual variable remuneration is conditional upon achievement of Group profitability and Core Tier1 targets as determined for financial years 2018, 2019 and 2020. Two-thirds of this is converted into Societe Generale shares transferable for 3.5 years, pro rata;
o.w. annual variable remuneration payable in subsequent years
EUR 1,044,576 (nominal amount)
the remainder, i.e. 40% of this variable remuneration, is conditional upon approval by the General Meeting of 23rd May 2018. Half of this is converted into Societe Generale share equivalents subject to a one-year holding period;
payment of the full annual variable remuneration in respect of 2017 is subject to approval by the General Meeting of 23rd May 2018.
Multi-annual variable remuneration
N/A Frédéric Oudéa does not receive any multi-annual variable remuneration.
Exceptional compensation
N/A Frédéric Oudéa does not receive any exceptional compensation.
Value of options granted during the financial year
N/A Frédéric Oudéa has not been awarded any stock options since 2009.
Value of shares or share equivalents granted under the long-term incentive plan in respect of the financial year
EUR 850,000 (Value according to
IFRS 2 at 6th February 2018)
This amount corresponds to an
award of 35,160 shares
Since 2012, the Chief Executive Officers have been eligible for a long-term incentive plan consisting of shares or share equivalents in order to implicate them more closely in the Company’s long-term progress and toalign their interests with those of the shareholders. The details of the plan granted in respect of 2017 by the Board of Directors at its meeting of 7th February 2018 are as follows:
cap on grants, identical to the cap on annual variable remuneration;
an award of 35,160 shares granted in two instalments, with vesting periods of four and six years followedby a one-year holding period after vesting, thus increasing the indexing periods to five and seven years;
payment of the long-term incentives in respect of 2017 is conditional upon approval by the General Meeting of 23rd May 2018, in accordance with Article L. 225-100 of the French Commercial Code;
definitive vesting subject to presence and performance conditions. The performance condition is measured by the increase in Societe Generale’s Total Shareholder Return (TSR) compared to that of 11 European peers over the entirety of the vesting periods. The vesting rate will thus depend on SG’s ranking: rank 1 to 3, 100% vesting; rank 4: 83.3%; rank 5: 66.7%; rank 6, 50%; ranks 7, 8 and 9: 25%; and ranks 10, 11 and 12: 0%;
if the Group is not profitable (as measured by Group net income, excluding strictly accounting-related impacts associated with the revaluation of own debt and the Debt Value Adjustment) in the year preceding the definitive vesting of long-term incentives, no payment will be due, regardless of theperformance of the Societe Generale share;
any departure will result in cancellation of the payment under the plan, unless the Chief Executive Officer in question is retiring or leaving the Group due to changes in its structure or organisation, in which case the shares or payments will be awarded based on the performance observed and assessed by the Board of Directors;
lastly, the Board of Directors decided to cap the final vesting value to EUR 77 per share, i.e. approximately 1.2 times the book value per share of the Societe Generale Group at 31st December 2017.
The award is granted pursuant to the 19th resolution of the General Meeting of 18th May 2016, and represents less than 0.01% of the capital.
Attendance fees N/A
Value of benefits in kind
EUR 5,925 Frédéric Oudéa is provided with a company car.
(1) Nominal amount decided by the Board of Directors on 7th February 2018.

3 I 1
BOARD OF DIRECTORS’ REPORT ON CORPORATE GOVERNANCE CCORPORATE GOVERNANCE
110 I 2018 REGISTRATION DOCUMENT I S O C I E T E G E N E R AL E G R O U P
For information, remuneration components that have been put to a shareholder vote in accordance with the procedure governing related-party agreements or commitments
Amounts or book value
put to a vote Description
Severance pay No amount due in
respect of the financial year
The features of the severance pay, constituting a related-party commitment authorised by the Board meeting of 8th February 2017 and approved by the General Meeting of 23rd May 2017 (5th resolution), are as follows:
payment will only be due in the event of a non-voluntary departure from the Group, justified as such by the Board of Directors. No payment will be due in the event of serious misconduct, resignation or non-renewal of the Chief Executive Officer’s appointment for reasons attributable to the latter;
payment will be contingent upon an overall achievement rate for the annual variable remuneration targets of at least 60% on average over the three years preceding the end of the Chief Executive Officer’s term of office;
no severance pay will be due to a Chief Executive Officer leaving within six months before claiming his French Social Security pension, entitling him to claim the supplementary senior managers’ pension;
the payment will amount to two years’ fixed salary, thus complying with the recommendation in the AFEP-MEDEF Code, i.e. two years’ fixed and variable annual remuneration.
In no circumstances may the severance pay and non-compete payment combined exceed the cap recommended in the AFEP-MEDEF Code (i.e. two years’ fixed and variable annual remuneration).
Non-compete clause
No amount due in respect of the financial year
Frédéric Oudéa is bound by a non-compete clause, constituting a related-party agreement authorised by the Board meeting of 8th February 2017 and approved by the General Meeting of 23rd May 2017 (5th resolution). For a duration of six months as from the date of expiry or termination of his term of office as Chief Executive Officer, such clause prohibits him from accepting a position at the same level with either a listed creditinstitution in Europe (defined as the European Economic Area, including the United Kingdom) or an unlisted credit institution in France. In exchange, he may continue to receive his fixed salary. The Board of Directors alone can waive such clause, up until the date on which the term of office of the Chief Executive Officer in question ends. In such a case, the Chief Executive Officer will no longer be bound by any commitment, and no sums will be payable to him in such respect. In the event of breach of the non-compete, the Chief Executive Officer in question will be required to immediately pay a sum equal to six months’ fixed salary. Societe Generale will in such a case be released from its obligation to pay any financial compensation and may, furthermore, demand the refund of any financial compensation as may have already been paid since the breach. This amount remains below the recommended limit of 24 months’ fixed plus variable annual remuneration, as stipulated in the AFEP-MEDEF Code.
Supplementary pension plan N/A Frédéric Oudéa does not have any supplementary pension plan.

3
BOARD OF DIRECTORS’ REPORT ON CORPORATE GOVERNANCE
1 I 3 CCORPORATE GOVERNANCE
S O C I E T E G E N E R AL E G R O U P I 2018 REGISTRATION DOCUMENT I 111
TABLE 3
Séverin CABANNES, Deputy Chief Executive Officer Remuneration compliant with the policy approved by the General Meeting of 23rd May 2017
Remuneration components paid or granted for financial year 2017
Amount or book value put
to a vote Description
Fixed remuneration EUR 800,000 Gross fixed remuneration paid in 2017, unchanged since the Board of Directors’ decision of 31st July 2014.
Annual variable remuneration
Séverin Cabannes benefits from annual variable remuneration broken down into two sub-components: 60% based on financial targets and 40% on qualitative targets. These elements are described on page 105 of the 2018 Registration Document. This annual variable remuneration is capped at 115% of fixed remuneration.
o.w. annual variable remuneration payable in 2018
EUR 134,600 (nominal amount)
EEvaluation of 2017 performance – Given the quantitative and qualitative criteria defined by the Board of Directors in March 2017 and the achievement rates observed in financial year 2017, Mr. Cabannes’ annual variable remuneration was set at EUR 672,998(1). This corresponds to an overall target achievement rate of 73.15% of his maximum annual variable remuneration (see p. 106 of the 2018 Registration Document). In accordance with CRD4, applicable to credit institutions, and Article L. 225-100 of the French Commercial Code, tthe payment coonditions for annual variable remuneration are as follows:
60% of annual variable remuneration is conditional upon achievement of Group profitability and Core Tier 1
targets as determined for financial years 2018, 2019 and 2020. Two-thirds of this is converted into Societe Generale shares transferable for 3.5 years, pro rata;
o.w. annual variable remuneration payable in subsequent years
EUR 538,398 (nominal amount)
the remainder, i.e. 40% of this variable remuneration, is conditional upon approval by the General Meeting of 23rd May 2018. Half of this is converted into Societe Generale share equivalents subject to a one-year holding period;
payment of the full annual variable remuneration in respect of 2017 is subject to approval by the General Meeting of 23rd May 2018.
Multi-annual variable remuneration
N/A Séverin Cabannes does not receive any multi-annual variable remuneration.
Exceptional compensation
N/A Séverin Cabannes does not receive any exceptional compensation.
Value of options granted during the financial year
N/A Séverin Cabannes has not been awarded any stock options since 2009.
Value of shares or share equivalents granted under the long-term incentive plan in respect of the financial year
EUR 570,000 (Value according
to IFRS 2 at 6th February 2018)
This amount corresponds to an
award of 23,578 shares
Since 2012, the Chief Executive Officers have been eligible for a long-term incentive plan consisting of shares or share equivalents in order to implicate them more closely in the Company’s long-term progress and to align their interests with those of the shareholders. The details of the plan granted in respect of 2017 by the Board of Directors at its meeting of 7th February 2018 are as follows:
cap on grants, identical to the cap on annual variable remuneration;
an award of 23,578 shares granted in two instalments, with vesting periods of four and six years followed by a one-year holding period after vesting, thus increasing the indexing periods to five and seven years;
payment of the long-term incentives in respect of 2017 is conditional upon approval by the General Meeting of 23rd May 2018, in accordance with Article L. 225-100 of the French Commercial Code;
definitive vesting subject to presence and performance conditions. The performance condition is measured by the increase in Societe Generale’s Total Shareholder Return (TSR) compared to that of 11 European peers over the entirety of the vesting periods. The vesting rate will thus depend on SG’s ranking: rank 1 to 3, 100% vesting; rank 4: 83.3%; rank 5: 66.7%; rank 6, 50%; ranks 7, 8 and 9: 25%; and ranks 10, 11 and 12: 0%;
if the Group is not profitable (as measured by Group net income, excluding strictly accounting-related impacts associated with the revaluation of own debt and the Debt Value Adjustment) in the year preceding the definitive vesting of long-term incentives, no payment will be due, regardless of the performance of the Societe Generale share;
any departure will result in cancellation of the payment under the plan, unless the Chief Executive Officer in question is retiring or leaving the Group due to changes in its structure or organisation, in which case the shares or payments will be awarded based on the performance observed and assessed by the Board of Directors;
lastly, the Board of Directors decided to cap the final vesting value to EUR 77 per share, i.e. approximately 1.2 times the book value per share of the Societe Generale Group at 31st December 2017.
The award is granted pursuant to the 19th resolution of the General Meeting of 18th May 2016, and represents less than 0.01% of the capital.
Attendance fees EUR 3,333 Variable remuneration paid to Deputy Chief Executive Officers is reduced by the amount of any attendance fees received from other Societe Generale Group companies.
Value of benefits in kind
EUR 6,411 Séverin Cabannes is provided with a company car.
(1) Nominal amount decided by the Board of Directors on 7th February 2018.

3 I 1
BOARD OF DIRECTORS’ REPORT ON CORPORATE GOVERNANCE CCORPORATE GOVERNANCE
112 I 2018 REGISTRATION DOCUMENT I S O C I E T E G E N E R AL E G R O U P
For information, remuneration components that have been put to a shareholder vote in accordance with the procedure governing related-party agreements or commitments
Amounts or book value put
to a vote Description
Severance pay No amount due in
respect of the financial year
The features of the severance pay, constituting a related-party commitment authorised by the Board meeting of 8th February 2017 and approved by the General Meeting of 23rd May 2017 (6th resolution), are as follows:
payment will only be due in the event of a non-voluntary departure from the Group, justified as such by the Board of Directors. No payment will be due in the event of serious misconduct, resignation or non-renewal of the Chief Executive Officer’s appointment for reasons attributable to the latter;
payment will be contingent upon an overall achievement rate for the annual variable remuneration targets of at least 60% on average over the three years preceding the end of the Chief Executive Officer’s term of office;
no severance pay will be due to a Chief Executive Officer leaving within six months before claiming hisFrench Social Security pension, entitling him to claim the supplementary senior managers’ pension;
the payment will amount to two years’ fixed salary, thus complying with the recommendation in the AFEP-MEDEF Code, i.e. two years’ fixed and variable annual remuneration.
In no circumstances may the severance pay and non-compete payment combined exceed the cap recommended in the AFEP-MEDEF Code (i.e. two years’ fixed and variable annual remuneration plus, ifapplicable, any other severance pay provided for under the employment contract, especially as stipulated under a collective agreement).
Non-compete clause
No amount due in respect of the financial year
Séverin Cabannes is bound by a non-compete clause, constituting a related-party agreement authorised by the Board meeting of 8th February 2017 and approved by the General Meeting of 23rd May 2017 (6th resolution). For a duration of six months as from the date of expiry or termination of his term of office as Chief Executive Officer, such clause prohibits him from accepting a position at the same level with either a listed credit institution in Europe (defined as the European Economic Area, including the United Kingdom) or an unlisted credit institution in France. In exchange, he may continue to receive his fixed salary. The Board of Directors alone can waive such clause, up until the date on which the term of office of the Chief Executive Officer in question ends. In such a case, the Chief Executive Officer will no longer be bound by any commitment, and no sums will be payable to him in such respect. In the event of breach of the non-compete, the Chief Executive Officer in question will be required to immediately pay a sum equal to six months’ fixed salary. Societe Generale will in such a case be released from its obligation to pay any financial compensation and may, furthermore, demand the refund of any financial compensation as may have already been paid since the breach. This amount remains below the recommended limit of 24 months’ fixed plus variable annual remuneration, as stipulated in the AFEP-MEDEF Code.
Supplementary pension plan
No amount due in respect of the financial year
Séverin Cabannes retains the benefit of the supplementary pension allocation plan for senior managers that applied to him as an employee prior to his appointment as Chief Executive Officer. This supplementary plan, introduced in 1991 and satisfying the provisions of Article L. 137-11 of the French Social Security Code, provides beneficiaries with an annual pension, covered by Societe Generale, as described on p. 103. This allowance depends in particular on the beneficiary’s length of service within Societe Generale and the proportion of his fixed compensation exceeding “Tranche B” of the AGIRC pension. For example, assuming he retires at the age of 63, and based on his current annual fixed salary (corrected for the effects of inflation), Mr. Cabannes’ potential pension rights as at 31st December 2017 represented an estimated annual pension of EUR 184k (i.e. 12.5% of his reference remuneration as defined by the AFEP-MEDEF Code), regardless of the conditions under which the commitment is honoured. In accordance with the procedure for related-party agreements, this commitment was authorised by the Board of Directors on 12th May 2008 and approved by the General Meeting on 19th May 2009 (7th resolution). Mr. Cabannes also remains entitled to the supplementary defined-contribution pension plan that he had as an employee prior to his appointment as Chief Executive Officer. This defined-contribution plan, established in line with Article 83 of the French General Tax Code, was implemented in 1995 and amended on 1st January 2018 (and is now called Epargne Retraite Valmy, i.e. Valmy pension savings scheme). Membership is compulsory for all employees with at least six months’ seniority within the Company and allows beneficiaries to save for their retirement, with benefits being paid in the form of life annuities upon retirement. Contributions correspond to 2% of the employee’s remuneration, capped at twice the annual French Social Security cap, 1.5% of which is paid by the Company. The plan is now insured with Sogecap (as opposed to the insurance company Valmy, as previously). At 31st December 2017, Mr. Cabannes had acquired deferred life annuity rights of EUR 939 per annum.

3
BOARD OF DIRECTORS’ REPORT ON CORPORATE GOVERNANCE
1 I 3 CCORPORATE GOVERNANCE
S O C I E T E G E N E R AL E G R O U P I 2018 REGISTRATION DOCUMENT I 113
TABLE 4
Bernardo SANCHEZ INCERA, Deputy Chief Executive Officer Remuneration compliant with the policy approved by the General Meeting of 23rd May 2017 Remuneration components paid or granted for financial year 2017
Amount or book value
put to a vote Description
Fixed remuneration EUR 800,000 Gross fixed remuneration paid in 2017, unchanged since the Board of Directors’ decision of 31st July 2014.
Annual variable remuneration
Bernardo Sanchez Incera benefits from annual variable remuneration broken down into two sub-components: 60% based on financial targets and 40% on qualitative targets. These elements are described on page 105 ofthe 2018 Registration Document. This annual variable remuneration is capped at 115% of fixed remuneration.
o.w. annual variable remuneration payable in 2018
EUR 140,488 (nominal amount)
Evaluation of 2017 performance – Given the quantitative and qualitative criteria defined by the Board of Directors in March 2017 and the achievement rates observed in financial year 2017, Mr. Sanchez Incera’s annual variable remuneration was set at EUR 702,438(1). This corresponds to an overall target achievement rate of 76.35% of his maximum annual variable remuneration (see p. 106 of the 2018 Registration Document). In accordance with CRD4, applicable to credit institutions, and Article L. 225-100 of the French Commercial Code, the payment conditions for annual variable remuneration are as follows:
o.w. annual variable remuneration payable in subsequent years
EUR 561,950 (nominal amount)
60% of annual variable remuneration is conditional upon achievement of Group profitability and Core Tier 1 targets as determined for financial years 2018, 2019 and 2020. Two-thirds of this is converted into Societe Generale shares transferable for 3.5 years, pro rata;
the remainder, i.e. 40% of this variable remuneration, is conditional upon approval by the General Meetingof 23rd May 2018. Half of this is converted into Societe Generale share equivalents subject to a one-year holding period;
payment of the full annual variable remuneration in respect of 2017 is subject to approval by the General Meeting of 23rd May 2018.
Multi-annual variable remuneration N/A Bernardo Sanchez Incera does not receive any multi-annual variable remuneration.
Exceptional compensation N/A Bernardo Sanchez Incera does not receive any exceptional compensation.
Value of options granted during the financial year
N/A Bernardo Sanchez Incera has not been awarded any stock options since 2010.
Value of shares or share equivalents granted under the long-term incentive plan in respect of the financial year
EUR 570,000 (Value according
to IFRS 2 at 6th February 2018)
This amount corresponds to
an award of 23,578 shares
Since 2012, the Chief Executive Officers have been eligible for a long-term incentive plan consisting of shares or share equivalents in order to implicate them more closely in the Company’s long-term progress and to align their interests with those of the shareholders. The details of the plan granted in respect of 2017 by the Board of Directors at its meeting of 7th February 2018 are as follows:
cap on grants, identical to the cap on annual variable remuneration;
an award of 23,578 shares granted in two instalments, with vesting periods of four and six years followed by a one-year holding period after vesting, thus increasing the indexing periods to five and seven years;
payment of the long-term incentives in respect of 2017 is conditional upon approval by the GeneralMeeting of 23rd May 2018, in accordance with Article L. 225-100 of the French Commercial Code;
definitive vesting subject to presence and performance conditions. The performance condition is measured by the increase in Societe Generale’s Total Shareholder Return (TSR) compared to that of 11 European peers over the entirety of the vesting periods. The vesting rate will thus depend on SG’s ranking: rank 1 to 3, 100% vesting; rank 4: 83.3%; rank 5: 66.7%; rank 6, 50%; ranks 7, 8 and 9: 25%; and ranks 10, 11 and 12: 0%;
if the Group is not profitable (as measured by Group net income, excluding strictly accounting-related impacts associated with the revaluation of own debt and the Debt Value Adjustment) in the year preceding the definitive vesting of long-term incentives, no payment will be due, regardless of theperformance of the Societe Generale share;
any departure will result in cancellation of the payment under the plan, unless the Chief Executive Officer in question is retiring or leaving the Group due to changes in its structure or organisation, in which case the shares or payments will be awarded based on the performance observed and assessed by the Board of Directors;
lastly, the Board of Directors decided to cap the final vesting value to EUR 77 per share, i.e. approximately 1.2 times the book value per share of the Societe Generale Group at 31st December 2017.
The award is granted pursuant to the 19th resolution of the General Meeting of 18th May 2016, and represents less than 0.01% of the capital.
Attendance fees EUR 34,338 Variable remuneration paid to Deputy Chief Executive Officers is reduced by the amount of any attendance fees received from other Societe Generale Group companies.
Value of benefits in kind EUR 7,179 Bernardo Sanchez Incera is provided with a company car.
(1) Nominal amount decided by the Board of Directors on 7th February 2018.

3 I 1
BOARD OF DIRECTORS’ REPORT ON CORPORATE GOVERNANCE CCORPORATE GOVERNANCE
114 I 2018 REGISTRATION DOCUMENT I S O C I E T E G E N E R AL E G R O U P
For information, remuneration components that have been put to a shareholder vote in accordance with the procedure governing related-party agreements or commitments
Amounts or book value
put to a vote Description
Severance pay No amount due in
respect of the financial year
The features of the severance pay, constituting a related-party commitment authorised by the Board meeting of 8th February 2017 and approved by the General Meeting of 23rd May 2017 (7th resolution), are as follows:
payment will only be due in the event of a non-voluntary departure from the Group, justified as such by the Board of Directors. No payment will be due in the event of serious misconduct, resignation or non-renewal of the Chief Executive Officer’s appointment for reasons attributable to the latter;
payment will be contingent upon an overall achievement rate for the annual variable remuneration targets of at least 60% on average over the three years preceding the end of the Chief Executive Officer’s term of office;
no severance pay will be due to a Chief Executive Officer leaving within six months before claiming his French Social Security pension, entitling him to claim the supplementary senior managers’ pension;
the payment will amount to two years’ fixed salary, thus complying with the recommendation in the AFEP-MEDEF Code, i.e. two years’ fixed and variable annual remuneration.
In no circumstances may the severance pay and non-compete payment combined exceed the cap recommended in the AFEP-MEDEF Code (i.e. two years’ fixed and variable annual remuneration plus, ifapplicable, any other severance pay provided for under the employment contract, especially as stipulated under a collective agreement).
Non-compete clause No amount due in
respect of the financial year
Bernardo Sanchez Incera is bound by a non-compete clause, constituting a related-party agreement authorised by the Board meeting of 8th February 2017 and approved by the General Meeting of 23rd May2017 (7th resolution). For a duration of six months as from the date of expiry or termination of his term of office as Chief Executive Officer, such clause prohibits him from accepting a position at the same level with either a listed credit institution in Europe (defined as the European Economic Area, including the United Kingdom) or an unlisted credit institution in France. In exchange, he may continue to receive his fixed salary. The Board of Directors alone can waive such clause, up until the date on which the term of office of the ChiefExecutive Officer in question ends. In such a case, the Chief Executive Officer will no longer be bound by any commitment, and no sums will be payable to him in such respect. In the event of breach of the non-compete, the Chief Executive Officer in question will be required to immediately pay a sum equal to six months’ fixed salary. Societe Generale will in such a case be released from its obligation to pay any financial compensation and may, furthermore, demand the refund of any financial compensation as may have already been paid since the breach. This amount remains below the recommended limit of 24 months’ fixed plus variable annual remuneration, as stipulated in the AFEP-MEDEF Code.
Supplementary pension plan
No amount due in respect of the financial year
Bernardo Sanchez Incera retains the benefit of the supplementary pension allocation plan for senior managers that applied to him as an employee prior to his appointment as Chief Executive Officer. This supplementary plan, introduced in 1991 and satisfying the provisions of Article L. 137-11 of the French Social Security Code, provides beneficiaries with an annual pension, covered by Societe Generale, as described on p. 103. Thisallowance depends in particular on the beneficiary’s length of service within Societe Generale and the proportion of his fixed compensation exceeding “Tranche B” of the AGIRC pension. For example, assuming he retires at the age of 63, and based on his current annual fixed salary (corrected for the effects of inflation), Mr. Sanchez Incera’s potential pension rights as at 31st December 2017 represented an estimated annual pension of EUR 148k (i.e. 9.9% of his reference remuneration as defined by the AFEP-MEDEF Code), regardless of the conditions under which the commitment is honoured. In accordance with the procedure for related-party agreements, this commitment was authorised by the Board of Directors on 12th January 2010 and approved by the General Meeting on 25th May 2010 (8th resolution). Mr. Sanchez Incera also remains entitled to the supplementary defined-contribution pension plan that he had as an employee prior to his appointment as Chief Executive Officer. This defined-contribution plan, established in line with Article 83 of the French General Tax Code, was implemented in 1995 and amended on 1st January 2018 (and is now called Epargne Retraite Valmy, i.e. Valmy pension savings scheme). Membership is compulsory for all employees with at least six months’ seniority within the Company and allows beneficiaries to save for their retirement, with benefits being paid in the form of life annuities upon retirement. Contributions correspond to 2% of the employee’s remuneration, capped at twice the annual French Social Security cap, 1.5% of which is paid by the Company. The plan is now insured with Sogecap (as opposed to the insurance company Valmy, as previously). At 31st December 2017, Mr. Sanchez Incera had acquired deferred life annuity rights of EUR 578 per annum.

3
BOARD OF DIRECTORS’ REPORT ON CORPORATE GOVERNANCE
1 I 3 CCORPORATE GOVERNANCE
S O C I E T E G E N E R AL E G R O U P I 2018 REGISTRATION DOCUMENT I 115
TABLE 5
Didier VALET, Deputy Chief Executive Officer Remuneration compliant with the policy approved by the General Meeting of 23rd May 2017
Remuneration components paid or granted for financial year 2017
Amount or book value
put to a vote Description
Fixed remuneration EUR 766,667 Gross annual remuneration, as set by the Board of Directors on 13th January 2017 upon Didier Valet’s appointment as Deputy Chief Executive Officer, effective as from 16th January 2017, amounts to EUR 800,000.
Annual variable remuneration
Didier Valet benefits from annual variable remuneration broken down into two sub-components: 60% based on financial targets and 40% on qualitative targets. These elements are described on page 105 of the 2018Registration Document. This annual variable remuneration is capped at 115% of fixed remuneration.
o.w. annual variable remuneration payable in 2018
EUR 130,272 (nominal amount)
Evaluation of 2017 performance – Given the quantitative and qualitative criteria defined by the Board of Directors in March 2017 and the achievement rates observed in financial year 2017, Didier Valet’s annual variable remuneration was set at EUR 651,360(1). This corresponds to an overall target achievement rate of 70.80% of his maximum annual variable remuneration (see p. 106 of the 2018 Registration Document). In accordance with CRD4, applicable to credit institutions, and Article L. 225-100 of the French Commercial Code, the payment conditions for annual variable remuneration are as follows:
o.w. annual variable remuneration payable in subsequent years
EUR 521,088 (nominal amount)
60% of annual variable remuneration is conditional upon achievement of Group profitability and Core Tier 1 targets as determined for financial years 2018, 2019 and 2020. Two-thirds of this is converted into Societe Generale shares transferable for 3.5 years, pro rata;
the remainder, i.e. 40% of this variable remuneration, is conditional upon approval by the General Meeting of 23rd May 2018. Half of this is converted into Societe Generale share equivalents subject to a one-year holding period;
payment of the full annual variable remuneration in respect of 2017 is subject to approval by the General Meeting of 23rd May 2018.
Multi-annual variable remuneration N/A Didier Valet does not receive any multi-annual variable remuneration.
Exceptional compensation N/A Didier Valet does not receive any exceptional compensation.
Value of options granted during the financial year
N/A Didier Valet has not been awarded any stock options since 2010.
Value of shares or share equivalents granted under the long-term incentive plan in respect of the financial year
EUR 570,000 (Value according
to IFRS 2 at 6th February 2018)
This amount corresponds to
an award of 23,578 shares
Since 2012, the Chief Executive Officers have been eligible for a long-term incentive plan consisting of shares or share equivalents in order to implicate them more closely in the Company’s long-term progress and toalign their interests with those of the shareholders. The details of the plan granted in respect of 2017 by the Board of Directors at its meeting of 7th February 2018 are as follows:
cap on grants, identical to the cap on annual variable remuneration;
an award of 23,578 shares granted in two instalments, with vesting periods of four and six years followed by a one-year holding period after vesting, thus increasing the indexing periods to five and seven years;
payment of the long-term incentives in respect of 2017 is conditional upon approval by the GeneralMeeting of 23rd May 2018, in accordance with Article L. 225-100 of the French Commercial Code;
definitive vesting subject to presence and performance conditions. The performance condition is measured by the increase in Societe Generale’s Total Shareholder Return (TSR) compared to that of 11 European peers over the entirety of the vesting periods. The vesting rate will thus depend on SG’s ranking: rank 1 to 3, 100% vesting; rank 4: 83.3%; rank 5: 66.7%; rank 6, 50%; ranks 7, 8 and 9: 25%; and ranks 10, 11 and 12: 0%;
if the Group is not profitable (as measured by Group net income, excluding strictly accounting-related impacts associated with the revaluation of own debt and the Debt Value Adjustment) in the year preceding the definitive vesting of long-term incentives, no payment will be due, regardless of theperformance of the Societe Generale share;
any departure will result in cancellation of the payment under the plan, unless the Chief Executive Officer in question is retiring or leaving the Group due to changes in its structure or organisation, in which case the shares or payments will be awarded based on the performance observed and assessed by the Board of Directors;
lastly, the Board of Directors decided to cap the final vesting value to EUR 77 per share, i.e. approximately 1.2 times the book value per share of the Societe Generale Group at 31st December 2017.
The award is granted pursuant to the 19th resolution of the General Meeting of 18th May 2016, and represents less than 0.01% of the capital.
Attendance fees N/A Didier Valet did not receive any attendance fees in 2017.
Value of benefits in kind EUR 4,571 Didier Valet is not provided with a company car.
(1) Nominal amount decided by the Board of Directors on 7th February 2018.

3 I 1
BOARD OF DIRECTORS’ REPORT ON CORPORATE GOVERNANCE CCORPORATE GOVERNANCE
116 I 2018 REGISTRATION DOCUMENT I S O C I E T E G E N E R AL E G R O U P
For information, remuneration components that have been put to a shareholder vote in accordance with the procedure governing related-party agreements or commitments
Amounts or book value
put to a vote Description
Severance pay No amount due in
respect of the financial year
The features of the severance pay, constituting a related-party commitment authorised by the Board meeting of 8th February 2017 and approved by the General Meeting of 23rd May 2017 (8th resolution), are as follows:
payment will only be due in the event of a non-voluntary departure from the Group, justified as such by the Board of Directors. No payment will be due in the event of serious misconduct, resignation or non-renewal of the Chief Executive Officer’s appointment for reasons attributable to the latter;
payment will be contingent upon an overall achievement rate for the annual variable remuneration targets of at least 60% on average over the three years preceding the end of the Chief Executive Officer’s term of office;
no severance pay will be due to a Chief Executive Officer leaving within six months before claiming hisFrench Social Security pension, entitling him to claim the supplementary senior managers’ pension;
the payment will amount to two years’ fixed salary, thus complying with the recommendation in the AFEP-MEDEF Code, i.e. two years’ fixed and variable annual remuneration.
In no circumstances may the severance pay and non-compete payment combined exceed the cap recommended in the AFEP-MEDEF Code (i.e. two years’ fixed and variable annual remuneration plus, ifapplicable, any other severance pay provided for under the employment contract, especially as stipulated under a collective agreement).
Non-compete clause No amount due in
respect of the financial year
Didier Valet is bound by a non-compete clause, constituting a related-party agreement authorised by the Board meeting of 8th February 2017 and approved by the General Meeting of 23rd May 2017 (8th resolution). For a duration of six months as from the date of expiry or termination of his term of office as Chief Executive Officer, such clause prohibits him from accepting a position at the same level with either a listed credit institution in Europe (defined as the European Economic Area, including the United Kingdom) or an unlisted credit institution in France. In exchange, he may continue to receive his fixed salary. The Board of Directors alone can waive such clause, up until the date on which the term of office of the ChiefExecutive Officer in question ends. In such a case, the Chief Executive Officer will no longer be bound by any commitment, and no sums will be payable to him in such respect. In the event of breach of the non-compete, the Chief Executive Officer in question will be required to immediately pay a sum equal to six months’ fixed salary. Societe Generale will in such a case be released from its obligation to pay any financial compensation and may, furthermore, demand the refund of any financial compensation as may have already been paid since the breach. This amount remains below the recommended limit of 24 months’ fixed plus variable annual remuneration, as stipulated in the AFEP-MEDEF Code.
Supplementary pension plan
No amount due in respect of the financial year
Didier Valet retains the benefit of the supplementary pension allocation plan for senior managers that applied to him as an employee prior to his appointment as Chief Executive Officer. This supplementary plan, introduced in 1991 and satisfying the provisions of Article L. 137-11 of the French Social Security Code, provides beneficiaries with an annual pension, covered by Societe Generale, as described on p. 103. Thisallowance depends in particular on the beneficiary’s length of service within Societe Generale and the proportion of his fixed compensation exceeding “Tranche B” of the AGIRC pension. For example, assuming he retires at the age of 63, and based on his current annual fixed salary (corrected for the effects of inflation), Mr. Valet’s potential pension rights as at 31st December 2017 represented an estimated annual pension of EUR 452k (i.e. 31.9% of his reference remuneration as defined by the AFEP-MEDEF Code), regardless of the conditions under which the commitment is honoured. Given the overall target achievement rate of 70.80%, his seniority in respect of 2017 will only be awarded in the proportion of 69.33%. In accordance with the procedure for related-party agreements, this commitment was authorised by the Board of Directors on 13th January 2017 and approved by the General Meeting on 23rd May 2017. Didier Valet also remains entitled to the supplementary defined-contribution pension plan that he had as an employee prior to his appointment as Chief Executive Officer. This defined-contribution plan, established in line with Article 83 of the French General Tax Code, was implemented in 1995 and amended on 1st January 2018 (and is now called Epargne Retraite Valmy, i.e. Valmypension savings scheme). Membership is compulsory for all employees with at least six months’ seniority within the Company and allows beneficiaries to save for their retirement, with benefits being paid in the form of life annuities upon retirement. Contributions correspond to 2% of the employee’s remuneration, capped at twice the annual French Social Security cap, 1.5% of which is paid by the Company. The plan is now insured with Sogecap (as opposed to the insurance company Valmy, as previously). At 31st December 2017, Didier Valet had acquired deferred life annuity rights of EUR 2,005 per annum.

3
BOARD OF DIRECTORS’ REPORT ON CORPORATE GOVERNANCE
1 I 3 CCORPORATE GOVERNANCE
S O C I E T E G E N E R AL E G R O U P I 2018 REGISTRATION DOCUMENT I 117
Standard tables in accordance with AMF recommendations
TABLE 1
SUMMARY OF REMUNERATION AND STOCK OPTIONS, SHARES AND SHARE EQUIVALENTS ALLOCATED TO EACH CHIEF EXECUTIVE OFFICER(1)
(In EUR) Financial year 2016 Financial year 2017
Lorenzo BINI SMAGHI, Chairman of the Board of Directors
Remuneration due for the financial year (detailed in Table 2) 902,819 903,400
Value of options granted in respect of the financial year (detailed in Table 4) 0 0
Value of shares or share equivalents granted under a long-term incentive plan in respect of the financial year
0 0
Total 902,819 903,400
Frédéric OUDÉA, Chief Executive Officer
Remuneration due for the financial year (detailed in Table 2) 2,756,187 2,611,645
Value of options granted in respect of the financial year (detailed in Table 4) 0 0
Value of shares or share equivalents granted under a long-term incentive plan in respect of the financial year(2) 850,000 850,000
Total 3,606,187 3,461,645
Séverin CABANNES, Deputy Chief Executive Officer
Remuneration due for the financial year (detailed in Table 2) 1,551,041 1,479,709
Value of options granted in respect of the financial year (detailed in Table 4) 0 0
Value of shares or share equivalents granted under a long-term incentive plan in respect of the financial year(2)
570,000 570,000
Total 2,121,041 2,049,409
Bernardo SANCHEZ INCERA, Deputy Chief Executive Officer
Remuneration due for the financial year (detailed in Table 2) 1,567,754 1,509,617
Value of options granted in respect of the financial year (detailed in Table 4) 0 0
Value of shares or share equivalents granted under a long-term incentive plan in respect of the financial year(2) 570,000 570,000
Total 2,137,754 2,079,617
Didier VALET, Deputy Chief Executive Officer(3)
Remuneration due for the financial year (detailed in Table 2) N/A 1,476,348
Value of options granted in respect of the financial year (detailed in Table 4) N/A 0
Value of shares or share equivalents granted under a long-term incentive plan in respect of the financial year(2)
N/A 570,000
Total N/A 2,046,348
(1) Remuneration expressed in EUR, gross, before tax. (2) This plan is detailed in the chapter on the remuneration of Chief Executive Officers, pages 107 and following. (3) Didier Valet’s term of office as Deputy Chief Executive Officer commenced on 16th January 2017. The amounts indicated include the share of
remuneration received at the beginning of January for his duties as Head of Corporate and Investment Banking, Private Banking, Asset Management and Securities Services.

3 I 1
BOARD OF DIRECTORS’ REPORT ON CORPORATE GOVERNANCE CCORPORATE GOVERNANCE
118 I 2018 REGISTRATION DOCUMENT I S O C I E T E G E N E R AL E G R O U P
TABLE 2
SUMMARY OF THE REMUNERATION OF EACH CHIEF EXECUTIVE OFFICER(1)
Financial year 2016 Financial year 2017
(In EUR) Amounts
paid
Amounts due for the
financial year Amounts paid
Amounts due for the
financial year
Lorenzo BINI SMAGHI, Chairman
– fixed remuneration 850,000 850,000 850,000 850,000
– non-deferred annual variable remuneration 0 0 0 0
– deferred annual variable remuneration 0 0 0 0
– exceptional compensation 0 0 0 0
– attendance fees 0 0 0 0
– benefits in kind(2) 52,819 52,819 53,400 53,400
TOTAL 902,819 902,819 903,400 903,400
Frédéric OUDÉA, Chief Executive Officer
– fixed remuneration 1,300,000 1,300,000 1,300,000 1,300,000
– non-deferred annual variable remuneration(3) 294,840 290,052 290,052 261,144
– deferred annual variable remuneration(3) 812,854 1,160,210 1,257,655(5) 1,044,576
– exceptional compensation 0 0 0 0
– attendance fees 0 0 0 0
– benefits in kind(4) 5,925 5,925 5,925 5,925
TOTAL 2,413,619 2,756,187 2,853,6322 2,611,645
Séverin CABANNES, Deputy Chief Executive Officer
– fixed remuneration 800,000 800,000 800,000 800,000
– non-deferred annual variable remuneration(3) 128,954 148,926 145,592 134,600
– deferred annual variable remuneration(3) 447,179 595,704 633,302(5) 538,398
– exceptional compensation 0 0 0 0
– attendance fees 13,462 0 3,333 0
– benefits in kind(4) 6,411 6,411 6,411 6,411
TOTAL 1,396,006 1,551,0411 1,588,638 1,479,409
Bernardo SANCHEZ INCERA, Deputy Chief Executive Officer
– fixed remuneration 800,000 800,000 800,000 800,000
– non-deferred annual variable remuneration(3) 118,711 152,293 117,955 140,488
– deferred annual variable remuneration(3) 394,169 609,173 626,579(5) 561,950
– exceptional compensation 0 0 0 0
– attendance fees 33,273 0 34,338 0
– benefits in kind(4) 6,288 6,288 7,179 7,179
TOTAL 1,352,441 1,567,754 1,586,051 1,509,617
Didier VALET, Deputy Chief Executive Officer(6)
– fixed remuneration N/A N/A 766,667 766,667
– non-deferred annual variable remuneration(3) N/A N/A 0 130,272
– deferred annual variable remuneration(3) N/A N/A 0 521,088
– other remuneration paid(6) N/A N/A 2,410,423 53,750
– exceptional compensation N/A N/A 0 0
– attendance fees N/A N/A 0 0
– benefits in kind(4) N/A N/A 4,571 4,571
TOTAL 3,181,661 1,476,348
(1) Remuneration expressed in EUR, gross, before tax. The long-term incentives received by Chief Executive Officers are detailed in Tables 1 and 7. (2) Provision of company accommodation. (3) The criteria used to calculate and pay annual variable remuneration are detailed in the chapter on the remuneration of Chief Executive Officers. It is
recalled that payment of 50% of the vested proportion is deferred. (4) Provision of a company car. (5) See table below for a detailed breakdown of the amounts paid. (6) Didier Valet’s term of office as Deputy Chief Executive Officer commenced on 16th January 2017. The amount indicated under “other remuneration paid”
corresponds to fixed and variable remuneration awarded in respect of his previous duties as Head of Corporate and Investment Banking, Private Banking, Asset Management and Securities Services.

3
BOARD OF DIRECTORS’ REPORT ON CORPORATE GOVERNANCE
1 I 3 CCORPORATE GOVERNANCE
S O C I E T E G E N E R AL E G R O U P I 2018 REGISTRATION DOCUMENT I 119
BREAKDOWN OF DEFERRED ANNUAL VARIABLE REMUNERATION PAID IN 2017 TO THE CHIEF EXECUTIVE OFFICERS
Deferred annual variable remuneration paid in 2017 in respect of financial year
(In EUR) 2013(1) 2014(2) 2015(3) 2015(4) Total paid in 2017
Performance condition applicable and status of condition
Core Tier 1* > 8% at 31.12.2016
and 2016 Group netincome>0
Condition met
Core Tier 1* > 8% at 31.12.2016
and 2016 Group netincome>0
Condition met
N/A
Core Tier 1* >9.75%at 31.12.2016
and 2016 Group netincome>0
Condition met
Mr. OUDÉA 308,280 234,483 420,052 294,840 1,257,655
Mr. CABANNES 154,578 133,411 202,897 142,416 633,302
Mr. SANCHEZ INCERA 135,850 122,247 216,498 151,984 626,579
Mr. VALET(5) N/A N/A N/A N/A 2,071,673
* Core Tier 1 ratio measured under Basel 3 conditions (1) Value of shares delivered in October 2017, vested in March 2017 in respect of financial year 2013, including the dividends paid during the holding
period. (2) Second instalment of the non-vested portion of the annual variable remuneration for financial year 2014 indexed against the Societe Generale share
price. (3) Vested portion of the annual variable remuneration for financial year 2015 indexed against the Societe Generale share price. (4) First instalment of the unvested portion of the annual variable remuneration for financial year 2015, granted in cash and not indexed. (5) Didier Valet’s term of office as Deputy Chief Executive Officer commenced on 16th January 2017. The total amount indicated corresponds to deferred
annual variable remuneration paid in 2017 in respect of his previous duties as Head of Corporate and Investment Banking, Private Banking, Asset Management and Securities Services.
TABLE 3
TABLE OF ATTENDANCE FEES AND OTHER REMUNERATION RECEIVED BY NON-EXECUTIVE DIRECTORS
(In EUR) Fees received in 2016 Fees received in 2017 Fees/Remuneration
Non-Executive Directors
Balance for financial year
2015
Interim payment for
financial year 2016
Balance for financial year
2016
Interim payment for
financial year 2017
In respect of financial year
2016
In respect of financial year
2017*
Lorenzo BINI SMAGHI Attendance fees - - - - - - Other remuneration - - - - - - Robert CASTAIGNE Attendance fees 79,714 60,357 72,023 48,820 132,381 127,055 Other remuneration - - - - - - Michel CICUREL Attendance fees 55,403 46,273 8,047 54,320 Other remuneration - - - - - - William CONNELLY Attendance fees(1) - - - - - 55,828 Other remuneration - - - - - - Barbara DALIBARD Attendance fees 31,092 23,137 44,043 29,796 67,180 33,741 Other remuneration - - - - - - Yann DELABRIÈRE Attendance fees 24,311 20,119 10,204 30,323 Other remuneration - - - - - - Kyra HAZOU Attendance fees 79,714 60,357 67,103 50,250 127,460 127,791 Other remuneration - - - - - - France HOUSSAYE Attendance fees(2) 56,811 42,250 63,975 41,749 106,225 102,946 Societe Generale salary - - - - 49,588 52,356

3 I 1
BOARD OF DIRECTORS’ REPORT ON CORPORATE GOVERNANCE CCORPORATE GOVERNANCE
120 I 2018 REGISTRATION DOCUMENT I S O C I E T E G E N E R AL E G R O U P
(In EUR) Fees received in 2016 Fees received in 2017 Fees/Remuneration
Non--Executive Directors
Balance forfinancial year
2015
Interim payment for
financial year 2016
Balance forfinancial year
2016
Interim payment for
financial year 2017
In respect offinancial year
2016
In respect of financial year
2017*
Béatrice LEPAGNOL
Attendance fees(3) 31,092 26,155 51,680 29,796 77,835 76,742
Societe Generale salary - - - - 38,031 38,031
Jean-Bernard LÉVY
Attendance fees 67,559 50,297 77,086 50,333 127,383 124,338
Other remuneration - - - - - -
Ana--Maria LLOPIS RIVAS
Attendance fees 31,092 26,155 57,416 39,645 83,571 94,457
Other remuneration - - - - - -
Gérard MESTRALLET
Attendance fees 74,340 41,244 79,036 48,229 120,280 118,679
Other remuneration - - - - - -
Juan Maria NIN GENOVA
Attendance fees - - 42,543 53,029 42,543 135,545
Other remuneration - - - - - -
Nathalie RACHOU
Attendance fees 121,421 87,445 126,173 84,300 213,618 214,183
Other remuneration - - - - - -
Emmanuel ROMAN
Attendance fees - - 33,263 - 33,263 -
Other remuneration - - - - - -
Lubomira ROCHET
Attendance fees(1) - - - - - 40,171
Other remuneration - - - - - -
Alexandra SCHAAPVELD
Attendance fees 121,421 87,445 126,173 84,300 213,618 208,524
Other remuneration - - - - - -
Total (attendance fees) 1,430,000 1,460,000
* The balance of the attendance fees for financial year 2017 was paid to Board members at the end of January 2018. (1) No interim payment for new Directors. (2) Paid to Societe Generale trade union SNB. (3) Paid to Societe Generale trade union CFDT.
TABLE 4
SHARE PURCHASE OR SUBSCRIPTION OPTIONS AWARDED DURING THE FINANCIAL YEAR TO EACH CHIEF EXECUTIVE OFFICER BY THE ISSUER AND BY ANY GROUP COMPANY
The Board of Directors did not award any options in 2017.
TABLE 5
SHARE PURCHASE OR SUBSCRIPTION OPTIONS EXERCISED DURING THE FINANCIAL YEAR BY EACH CHIEF EXECUTIVE OFFICER
Frédéric Oudéa, Séverin Cabannes and Bernardo Sanchez Incera did not exercise any options during financial year 2017.
(In EUR) Grant date Number of options exercised over the year Strike price
Mr. VALET(1) 09.03.2010 10,180 41.2
(1) Didier Valet’s term of office as Deputy Chief Executive Officer commenced on 16th January 2017. The options exercised over the year were granted in respect of his previous duties.

3
BOARD OF DIRECTORS’ REPORT ON CORPORATE GOVERNANCE
1 I 3 CCORPORATE GOVERNANCE
S O C I E T E G E N E R AL E G R O U P I 2018 REGISTRATION DOCUMENT I 121
TABLE 6
SHARES GRANTED TO EACH CHIEF EXECUTIVE OFFICER
Societe Generale performance shares granted during the financial year to each Chief Executive Officer by the issuer and by any Group company.
(In EUR) Grant date Reasons for
granting
Number of shares
granted during the
year
Value of the shares based
on the method used in the
consolidated financial
statements
Date of assessment of
performance condition
Date of availability
Performance conditions
Mr. BINI SMAGHI N/A N/A N/A N/A N/A N/A N/A
Mr. OUDÉA(1) 15.03.2017
Payment of theannual variable
remuneration duein respect of
financial year 2016
6,577 277,352 31.03.2019 01.10.2019 yes(2)
6,577 266,250 31.03.2020 01.10.2020 yes(2)
Long-term incentives due in
respect of financial year 2016
16,358 445,265 31.03.2021 01.04.2022 yes(2)
16,359 430,896 31.03.2023 01.04.2024 yes(2)
Mr. CABANNES(1) 15.03.2017
Payment of theannual variable
remuneration duein respect of
financial year 2016
3,377 142,408 31.03.2019 01.10.2019 yes(2)
3,377 136,194 31.03.2020 01.10.2020 yes(2)
Long-term incentives due in
respect of financial year 2016
10,970 298,603 31.03.2021 01.04.2022 yes(2)
10,970 288,950 31.03.2023 01.04.2024 yes(2)
Mr. SANCHEZ INCERA(1) 15.03.2017
Payment of theannual variable
remuneration duein respect of
financial year 2016
3,453 145,613 31.03.2019 01.10.2019 yes(2)
3,453 139,259 31.03.2020 01.10.2020 yes(2)
Long-term incentives due in
respect of financial year 2016
10,970 298,603 31.03.2021 01.04.2022 yes(2)
10,970 288,950 31.03.2023 01.04.2024 yes(2)
Mr. VALET(3) 15.03.2017
Payment of theannual variable
remuneration duein respect of
financial year 2016
6,031 243,230 31.03.2020 01.10.2020 yes
Long-term incentives due in
respect of financial year 2016
12,064 527,800 31.03.2022 01.10.2022 yes
(1) The amounts of variable remuneration and long-term incentives were set at the Board meeting of 8th February 2017. The corresponding performance shares were awarded at the Board meeting of 15th March 2017.
(2) Vesting of the annual variable remuneration is subject to two conditions: Group profitability and equity. Vesting of the long-term incentives is subject to two conditions: profitability and relative TSR as compared to a panel of peers. The performance conditions are further detailed in the 2017 Registration Document on pages 105 and 106.
(3) Didier Valet’s term of office as Deputy Chief Executive Officer commenced on 16th January 2017. The amounts indicated correspond to remuneration awarded in respect of his previous duties as Head of Corporate and Investment Banking, Private Banking, Asset Management and Securities Services.

3 I 1
BOARD OF DIRECTORS’ REPORT ON CORPORATE GOVERNANCE CCORPORATE GOVERNANCE
122 I 2018 REGISTRATION DOCUMENT I S O C I E T E G E N E R AL E G R O U P
TABLE 7
SHARES RECEIVED DURING THE FINANCIAL YEAR BY EACH CHIEF EXECUTIVE OFFICER
Grant date Number of shares received
during the financial year
Mr. BINI SMAGHI N/A N/A
Mr. OUDÉA 06.05.2013 31,238(1)
13.03.2014 5,975(2)
Mr. CABANNES 06.05.2013 20,825(1)
13.03.2014 2,996(2)
Mr. SANCHEZ INCERA 06.05.2013 20,825(1)
13.03.2014 2,633(2)
Mr. VALET N/A(3) N/A(3)
(1) Under the long-term incentive plan awarded in 2013 in respect of 2012. Such shares in 2017 correspond to the delivery in 2017 of the first instalment of the LTIs granted by the Board of Directors on 6th May 2013, the vesting of which in March 2016 was entirely subject to the relative performance of the Societe Generale share in relation to its peers. The share performance assessed in early 2016 placed Societe Generale in fourth place in the sample (i.e. vesting of 83.3% of the maximum number granted). These shares, vested in March 2016 as long-term incentives, were taken into account in advance when calculating the number of shares held by Frédéric Oudéa, Séverin Cabannes and Bernardo Sanchez Incera as at 31.12.2016.
(2) Deferred annual variable remuneration granted in 2014 in respect of financial year 2013 (indicated in Table 2). (3) Didier Valet’s term of office as Deputy Chief Executive Officer commenced on 16th January 2017; he received no shares in 2017 as either variable
remuneration or long-term incentives. Note: Shares from the share buyback programme.
SHARE EQUIVALENTS RECEIVED DURING THE FINANCIAL YEAR BY EACH CHIEF EXECUTIVE OFFICER
Grant date Number of share equivalents vested over the financial year
Amount paid (in EUR)
Mr. BINI SMAGHI N/A N/A N/A
Mr. OUDÉA 31.03.2015 4,684(1) 234,483(1)
31.03.2016 8,956(1) 420,052(1)
Mr. CABANNES 31.03.2015 2,665(1) 133,411(1)
31.03.2016 4,326(1) 202,897(1)
Mr. SANCHEZ INCERA 31.03.2015 2,442(1) 122,247(1)
31.03.2016 4,616(1) 216,498(1)
Mr. VALET 31.03.2014 22,902(2) 1,146,483(2)
31.03.2017 6,462(2) 323,490(2)
(1) Share equivalents received as deferred annual variable remuneration granted in 2015 in respect of financial year 2014, and in 2016 in respect of financial year 2015 (indicated in Table 2).
(2) Didier Valet’s term of office as Deputy Chief Executive Officer commenced on 16th January 2017. The total amounts indicated correspond to deferred annual variable remuneration paid in 2017 in respect of his previous duties as Head of Corporate and Investment Banking, Private Banking, Asset Management and Securities Services.

3
BOARD OF DIRECTORS’ REPORT ON CORPORATE GOVERNANCE
1 I 3 CCORPORATE GOVERNANCE
S O C I E T E G E N E R AL E G R O U P I 2018 REGISTRATION DOCUMENT I 123
AUDITED I TABLE 8
RECORD OF SHARE SUBSCRIPTION OR PURCHASE OPTIONS AWARDED INFORMATION ON SUBSCRIPTION OR PURCHASE OPTIONS(1)
Date of General Meeting 27.05.2008
Date of Board meeting 09.03.2010
Total number of shares(2) available for subscription or purchase 1,000,000
o.w. shares available for subscription or purchase by Chief Executive Officers(3)
Mr. BINI SMAGHI N/A
Mr. OUDÉA 0
Mr. CABANNES 0
Mr. SANCHEZ INCERA 0
Mr. VALET(4) 20,360
o.w. shares available for subscription or purchase by Executive Committee members in office at the grant date 395,236
Total number of beneficiaries 684
o.w. Executive Committee members in office at the grant date 10
Start date for exercising options 09.03.2014
Expiry date 08.03.2017
Subscription or purchase price (in EUR)(5) 41.2
Exercise conditions (where the plan includes several instalments)
Fair value (% of the share price at grant date) 26%
Number of shares subscribed at 31.12.2017 288,155
Total number of cancelled or lapsed subscription or purchase options 711,845
Subscription or purchase options outstanding at end of financial year 0
Potential dilutive effect(6) 0.00%
(1) Personnel costs generated by these plans are presented in Note 4.3 to the consolidated financial statements (p. 492). (2) The exercise of one option gives entitlement to one Societe Generale share. This table takes into account adjustments performed following capital
increases. This line does not take into account options exercised since the grant date. (3) Mr. Oudéa and Mr. Cabannes were appointed as Chief Executive Officers in 2008, Mr. Sanchez Incera in 2010, and Mr. Valet in 2017. (4) Mr. Valet’s term of office as Deputy Chief Executive Officer commenced on 16th January 2017. (5) The subscription or purchase price is equal to the average market price of the Societe Generale share over the 20 trading days preceding the meeting
of the Board of Directors. (6) The dilutive effect is the result of dividing the remaining number of options that may be subscribed by the number of shares making up the capital
stock.

3 I 1
BOARD OF DIRECTORS’ REPORT ON CORPORATE GOVERNANCE CCORPORATE GOVERNANCE
124 I 2018 REGISTRATION DOCUMENT I S O C I E T E G E N E R AL E G R O U P
TABLE 9
SHARE SUBSCRIPTION OR PURCHASE OPTIONS AWARDED TO THE TOP TEN EMPLOYEES (NON-EXECUTIVE OFFICERS) AND OPTIONS EXERCISED BY THESE EMPLOYEES
Total number of options
granted/shares subscribed or purchased
Weighted average price
(in EUR)
Options awarded during the financial year by the issuer and any company included in thescope for the award of options to the ten employees of the issuer or any company included inthis scope having been allocated the most options*
0 0
Options held in respect of the issuer and the companies referred to previously and exercisedduring the financial year by the ten employees of the issuer or those companies havingpurchased or subscribed the most options
79,630 45.22
* Societe Generale did not implement any option plan during financial year 2017.

3
BOARD OF DIRECTORS’ REPORT ON CORPORATE GOVERNANCE
1 I 3 CCORPORATE GOVERNANCE
S O C I E T E G E N E R AL E G R O U P I 2018 REGISTRATION DOCUMENT I 125
AUDITED I TABLE 10
RECORD OF PERFORMANCE SHARES AWARDED INFORMATION ON PERFORMANCE SHARES AWARDED
Date of General Meeting 18.05.2016 18.05.2016 20.05.2014 22.05.2012 22.05.2012
Date of Board meeting 15.03.2017 18.05.2016 12.03.2015 13.03.2014 14.03.2013
Total number of shares granted 1,796,759 2,478,926 1,233,505 1,010,775 1,846,313
o.w. number granted to Chief Executive Officers(1)
121,506 140,769
Mr. BINI SMAGHI N/A N/A N/A N/A N/A
Mr. OUDÉA 45,871 62,900 - - -
Mr. CABANNES 28,694 38,644 - - -
Mr. SANCHEZ INCERA 28,846 39,225 - - -
Mr. VALET(2) 18,095 24,942 - - -
Total number of beneficiaries 6,710 6,495 6,733 6,082 6,338
see table below see table below
31.03.2017(3) 31.03.2016(3) 31.03.2015(3)
Vesting date
31.03.2019(4) 31.03.2018(4) 31.03.2017(4)
Holding period end date see table below see table below 31.03.2019(3) 31.03.2018(3) 31.03.2017(3)
Performance conditions(5) yes yes yes yes yes
Fair value (in EUR)(6)
36.4(3) 37.8(3) 26.1(3)
see table below see table below
34.9(4) 38.1(4) 27.1(4)
Number of shares vested at 31.12.2017
0 166 780,075 650,152 1,714,233
Total number of cancelled or lapsed shares 35,023 110,416 72,310 64,824 132,080
Performance shares outstanding at year-end
1,761,736 2,368,344 381,120 295,799 0
(1) For the Chief Executive Officers, see also Tables 6 and 7 of the 2018 Registration Document. (2) Didier Valet’s term of office as Deputy Chief Executive Officer commenced on 16th January 2017. The amounts indicated correspond to remuneration
awarded in respect of his previous duties as Head of Corporate and Investment Banking, Private Banking, Asset Management and Securities Services. (3) French tax residents. (4) Non-French tax residents. (5) The applicable performance conditions are described in Chapter 5, “Corporate Social Responsibility, Employee share plans”. (6) The fair value is calculated using the arbitrage method of valuation.

3 I 1
BOARD OF DIRECTORS’ REPORT ON CORPORATE GOVERNANCE CCORPORATE GOVERNANCE
126 I 2018 REGISTRATION DOCUMENT I S O C I E T E G E N E R AL E G R O U P
SUMMARY OF THE 2016 PERFORMANCE SHARES PLAN(1)
Date of General Meeting 18.05.2016
Date of Board meeting 18.05.2016
Total number of shares granted 2,478,926
Vesting date
29.03.2018 (1st instalment)
29.03.2019 31.03.2020 (1st instalment)
31.03.2021
29.03.2019 (2nd instalment)
31.03.2022 (2nd instalment)
Holding period end date 30.09.2018 30.09.2019 N/A
01.04.2021 01.04.2023 02.10.2021
Fair value (in EUR)(2)
30.18 (1st instalment)
28.92 (2nd instalment)
29.55
22.07 (1st instalment)
21.17 (2nd instalment)
32.76
(1) Under the annual employee LTI plan and awards in the context of the specific loyalty and remuneration policy applicable to regulated persons as defined in banking regulations (including Chief Executive Officers and Executive Committee members).
(2) The fair value is calculated using the arbitrage method of valuation.
SUMMARY OF THE 2017 PERFORMANCE SHARES PLAN(1)
Date of General Meeting 18.05.2016
Date of Board meeting 15.03.2017
Total number of shares granted 1,796,759
Vesting date
29.03.2019 (1st instalment) 31.03.2020
31.03.2021 (1st instalment) 31.03.2022
31.03.2020 (2nd instalment)
31.03.2023 (2nd instalment)
Holding period end date 30.09.2019 02.10.2020
N/A 01.04.2022 01.04.2024
02.10.2022
Fair value (in EUR)(2)
42.17 (1st instalment)
40.33 (2nd instalment)
41.05
27.22 (1st instalment)
26.34 (2nd instalment)
43.75
(1) Under the annual employee LTI plan and awards in the context of the specific loyalty and remuneration policy applicable to regulated persons as defined in banking regulations (including Chief Executive Officers and Executive Committee members).
(2) The fair value is calculated using the arbitrage method of valuation.

3
BOARD OF DIRECTORS’ REPORT ON CORPORATE GOVERNANCE
1 I 3 CCORPORATE GOVERNANCE
S O C I E T E G E N E R AL E G R O U P I 2018 REGISTRATION DOCUMENT I 127
TABLE 11
POSITION OF CHIEF EXECUTIVE OFFICERS IN 2017
Term of office
Employment contract(1)(5)
Supplementary pension plan(2)
Compensation or benefits due or likely to become due as a
result of leaving office or changing
position(3)
Compensation relating to a non-compete clause(4)
start end yes no yes no yes no yes no
Mr. BINI SMAGHI, Chairman of the Board of Directors
2015(6) 2018 X X X X
Mr. OUDÉA Chief Executive Officer 2008(7) 2019 X X X X
Mr. CABANNES, Deputy Chief Executive Officer
2008 2019 X X X X
Mr. SANCHEZ INCERA, Deputy Chief Executive Officer
2010 2019 X X X X
Mr. VALET Deputy Chief Executive Officer
2017 2019 X X X X
(1) According to the recommendations of the AFEP-MEDEF Code, only the following may not hold an employment contract during their term of office: the Chairman of the Board of Directors, the Chairman and Chief Executive Officer, and the Chief Executive Officer in companies with a Board of Directors.
(2) Details of supplementary pension plans can be found on p. 103. (3) Details of the compensation or benefits due or likely to become due to Chief Executive Officers as a result of leaving office or changing position are
provided on p. 103 and 104 and in the tables on p. 110 to 116. (4) Details of non-complete clauses for the Chief Executive Officers are provided on p. 104 and in the tables on p. 110 to 116. (5) The employment contracts of Mr. Cabannes, Mr. Sanchez Incera and Mr. Valet have been suspended for the duration of their respective terms of office. (6) Mr. Bini Smaghi was appointed Chairman of the Board on 19th May 2015. (7) Mr. Oudéa was appointed Chief Executive Officer in May 2008, then Chairman and Chief Executive Officer in May 2009, and Chief Executive Officer on
19th May 2015.

3 I 1
BOARD OF DIRECTORS’ REPORT ON CORPORATE GOVERNANCE CCORPORATE GOVERNANCE
128 I 2018 REGISTRATION DOCUMENT I S O C I E T E G E N E R AL E G R O U P
Societe Generale share ownership and holding obligations Since 2002, in line with the AMF’s recommendations and in order to align the Chief Executive Officers’ interests with those of the Company, the Chief Executive Officers have been required to hold a certain minimum number of Societe Generale shares. On 7th March 2011, the Board of Directors thus defined the following obligations:
80,000 shares for the Chief Executive Officer;
40,000 shares for the Deputy Chief Executive Officers.
These shareholding obligations were all satisfied in 2016.
On 15th March 2016, the Board of Directors decided to increase the minimum shareholding thresholds as follows:
90,000 shares for the Chief Executive Officer;
45,000 shares for the Deputy Chief Executive Officers.
Chief Executive Officers who are also former employees may hold shares either directly or indirectly through the company savings plan.
This minimum shareholding requirement is already satisfied for Frédéric Oudéa, Séverin Cabannes and Bernardo Sanchez Incera. For Didier Valet, this minimum requirement must be satisfied after five years in office. Pending satisfaction of the requirement, the Chief Executive Officer must retain 50% of vested shares granted through Societe Generale share plans and all shares resulting from the exercise of stock options, after deducting the cost of exercising said options and the corresponding social security charges and taxes.
In addition, and in accordance with the law, Chief Executive Officers are required to hold a certain percentage of vested shares granted through Societe Generale share plans or resulting from the exercise of stock options in a registered account until the end of their term of office. For shares, this percentage was reduced by the Board of Directors at its meeting of 15th March 2017 to 5% of vested shares for allocations in respect of 2017, in view of (i) the regulatory requirement for a significant proportion of the variable remuneration to be awarded in shares, and (ii) compliance with the minimum holding levels. For stock options, the percentage is set at 40% of the gains made upon exercising the options, net of tax and any other mandatory deductions and less any capital gains used to finance the acquisition of the shares.
The Chief Executive Officers are therefore required to hold a significant number of shares. They are prohibited from hedging their shares or options throughout the vesting and holding periods.
Each year, the Chief Executive Officers must provide the Board of Directors with all necessary information enabling the latter to ascertain that these obligations have been met in full.
In their statements to the Board, the Chief Executive Officers confirmed that they have not hedged their Societe Generale shares or “Société Générale Actionnariat (Fonds E)” shares and undertook not to do so in the future.
Remuneration of the other members of the executive committee who are not chief executive officers
REMUNERATION The remuneration of the other members of the Executive Committee is established in accordance with CRD4. It is set by General Management and reviewed by the Compensation Committee. It is made up of two components:
fixed remuneration, determined according to each member’s responsibilities and taking into account market practices;
annual variable remuneration, set at the discretion of General Management, dependent on both the Group’s results and the individual’s quantitative and qualitative performance over the previous financial year.
Moreover, the remuneration granted in respect of 2017 to the Chief Risk Officer and Chief Compliance Officer has been approved by the Board of Directors. Under the rules set forth by CRD4, this variable remuneration comprises an unvested component, the entirety of which is subject to conditions pertaining to presence, performance and appropriate risk and compliance management. It is deferred over five years and at least half of it is allocated in Societe Generale shares or share equivalents (50% of the vested component and 60% of the total unvested component).
The component of variable compensation deferred over five years, i.e. the long-term incentives, accounts for 40% of the unvested portion. It is subject to a demanding condition: namely the relative performance of the Societe Generale share measured by the increase in Total Shareholder Return (TSR) compared to 11 European peers over the entirety of the vesting periods.
In addition to this remuneration, these other members of the Executive Committee are also entitled to the general incentive and profit-sharing schemes established under collective agreements.
Lastly, Executive Committee members have their own company car, available to them for private as well as professional use.
The remuneration in respect of 2017 was as follows:
(In EUR m)
Fixed remuneration
Variable remuneration Total
remuneration
Vested portion incash (not deferred) Deferred portion and LTIs
Members of the Executive Committee other than Chief Executive Officers, in respect of 2017(1)
3.3 1.2 4.1 8.6
(1) These amounts include the (annual) remuneration of Ms. Guillaumin, Ms. Lebot, Ms. Mercadal-Delassalles, Mr. Briatta, Mr. Goutard, Mr. Hauguel, Mr. Heim, Mr. Henri, Mr. Leblanc and Mr. Parer, Executive Committee members, for the period during which they were members of the Executive Committee.

3
BOARD OF DIRECTORS’ REPORT ON CORPORATE GOVERNANCE
1 I 3 CCORPORATE GOVERNANCE
S O C I E T E G E N E R AL E G R O U P I 2018 REGISTRATION DOCUMENT I 129
ADDITIONAL INFORMATION
Specific conditions relating to shareholders’ participation in the General Meeting The By-laws (see Chapter 7) define the conditions for shareholders’ participation in the General Meeting.
Under Article 14 of the Company’s By-laws, General Meetings are convened and deliberate in accordance with the conditions set forth by the laws and regulations in force. They meet at the registered office or in any other place in metropolitan France indicated in the convening notice. Such meetings are chaired by the Chairman of the Board of Directors or, failing this, by a Director appointed for this purpose by the Chairman of the Board of Directors.
Regardless of the number of shares held, any shareholder whose shares are registered under the terms and at a date set by decree, has the right, upon proof of their identity and status as a shareholder, to participate in the General Meetings. A shareholder may, in accordance with the laws and regulations in force, personally attend the General Meetings, vote remotely or appoint a proxy. The intermediary registered on behalf of shareholders may participate in the General Meetings, under the conditions set forth by the provisions of the laws and regulations in force.
In order for the ballots to be counted, they must be received by the Company at least two days before the General Meeting is held, unless a shorter period is specified in the convening notice or required by the regulations in force.
Shareholders may participate in General Meetings by videoconference or any other means of telecommunication, when provided for in the convening notice and subject to the conditions defined therein.
The General Meeting may be publicly broadcast by means of electronic communication subject to the approval of and under the terms set by the Board of Directors. Notice will be given in the notice of meeting and/or the convening notice.
In all General Meetings, the voting right attached to shares with a right of usufruct is exercised by the usufructuary.
Any shareholder may participate in the General Meeting online under the conditions indicated in the notice of meeting published in the Bulletin des Annonces Légales Obligatoires (French Mandatory Legal Announcements Gazette).
Information required by Article L. 225-37-5 of the French Commercial Code Within the framework of the provisions of Article L. 225-37-5 of the French Commercial Code, Societe Generale must disclose and, where applicable, explain the following items when they are likely to have an impact in case of a public purchase or exchange offer.
To the best of its knowledge, Societe Generale does not have any specific measures likely to have an impact in case of a public purchase or exchange offer. However, the information required by Article L. 225-37-5 of the French Commercial Code is listed below as it has been included in the Registration Document to meet other obligations.
1. Share capital structure: this information appears in Chapter 7, “Share, share capital and legal information”, section 2, “Information on share capital”, under the heading “Breakdown of capital and voting rights over 3 years”.
2. Statutory restrictions on the exercise of voting rights and share transfers: this information appears in chapter 7, “Share, share capital and legal information”, section 4, “By-laws”, more specifically in Articles 6 and 14.
3. Direct or indirect holdings in the share capital of which Societe Generale is aware pursuant to Articles L. 233-7 and L. 233-12 of the French Commercial Code: this information appears in chapter 7, “Share, share capital and legal information”, section 2, “Information on share capital”, under the heading “Breakdown of capital and voting rights over 3 years”.
4. The list of holders of any securities bearing special control rights and the description of these: not applicable since the cancellation of the preference shares on 23rd December 2009.
5. Control mechanisms provided for under a potential employee share ownership plan, when the control rights are not exercised by the latter: this information appears in Chapter 5, “Corporate Social Responsibility”, section 2, “Societe Generale is a responsible bank”, under the heading “Employee savings plans and employee share ownership”.
6. Shareholder agreements of which Societe Generale is aware and which may result in restrictions on the transfer of shares and the exercise of voting rights: not concerned.
7. Rules applicable to the appointment and replacement of members of the Board of Directors as well as to the amendment of the Company’s By-laws: this information appears in Chapter 7, “Share, share capital and legal information”, section 4, “By-laws”, more specifically in Articles 7 and 14.
8. Powers of the Board of Directors regarding share issuances or buybacks: the delegations granted by the General Meeting to the Board of Directors in this respect appear in this Chapter 3, in this section 1, under this heading, in the subsection “List of outstanding delegations and their use in 2017 and early 2018 (up to 7th February 2018)” and the information about share buybacks appears in Chapter 7, “Share, share capital and legal information”, section 2 “Information on share capital”, under the heading “Share buybacks”.
9. Agreements entered into by Societe Generale that are amended or terminated in case of a change of control of Societe Generale, unless this disclosure would, except in cases where disclosure is a legal obligation, seriously undermine its interests: not concerned.
10. Agreements providing for compensation for members of the Board of Directors or employees if they resign or are dismissed without real and serious grounds, or if their employment is terminated due to a public purchase or exchange offer: this information appears in this Chapter 3, in this section 1, under the heading “Remuneration of Group senior management” for the Directors. For the employees: not concerned.

3 I 1
BOARD OF DIRECTORS’ REPORT ON CORPORATE GOVERNANCE CCORPORATE GOVERNANCE
130 I 2018 REGISTRATION DOCUMENT I S O C I E T E G E N E R AL E G R O U P
List of outstanding delegations and their use
Type of authorisation Purpose of the authorisation granted to the Board of Directors
Validity of the delegation
Share buybacks To buy Societe Generale shares GGranted by: AGM of 18th May 2016, 13th resolution FFor a period of: 18 months SStart date: 19th May 2016 EEarly termination: 23rd May 2017
GGranted by: AGM of 23rd May 2017, 18th resolution FFor a period of: 18 months SStart date: 24th May 2017 EExpiry date: 23rd November 2018
Capital increase To increase the share capital with pre-emptive subscription rights through the issuance of ordinary shares or securities giving access to the share capital
GGranted by: AGM of 18th May 2016, 14th resolution FFor a period of: 26 months EExpiry date: 18th July 2018
To increase the share capital through the incorporation of reserves, profits, premiums or others
GGranted by: AGM of 18th May 2016, 14th resolution FFor a period of: 26 months EExpiry date: 18th July 2018
To increase the share capital without pre-emptive subscription rights through the issuance of ordinary shares or securities giving access to the share capital
GGranted by: AGM of 18th May 2016, 15th resolution FFor a period of: 26 months EExpiry date: 18th July 2018
To increase the share capital in order to remunerate contributions in kind consisting of securities
GGranted by: AGM of 18th May 2016, 16th resolution FFor a period of: 26 months EExpiry date: 18th July 2018
Issuance of subordinated bonds
Issuance of contingent convertible bonds without pre-emptive subscription rights
GGranted by: AGM of 18th May 2016, 17th resolution FFor a period of: 26 months EExpiry date: 18th July 2018
Capital increase in favour of employees
To increase the share capital through the issuance of ordinary shares or securities giving access to the share capital reserved for members of a Societe Generale company or Group Savings Plan
GGranted by: AGM of 18th May 2016, 18th resolution FFor a period of: 26 months EExpiry date: 18th July 2018
Allocation of free shares
To allocate free shares, existing or to be issued, to regulated persons and assimilated
GGranted by: AGM of 18th May 2016, 19th resolution FFor a period of: 26 months EExpiry date: 18th July 2018
To allocate free shares, existing or to be issued, to employees other than regulated persons and assimilated
GGranted by: AGM of 18th May 2016, 20th resolution FFor a period of: 26 months EExpiry date: 18th July 2018
Cancellation of shares
To cancel shares purchased as part of share buyback programmes
GGranted by: AGM of 18th May 2016, 21st resolution FFor a period of: 26 months EExpiry date: 18th July 2018

3
BOARD OF DIRECTORS’ REPORT ON CORPORATE GOVERNANCE
1 I 3 CCORPORATE GOVERNANCE
S O C I E T E G E N E R AL E G R O U P I 2018 REGISTRATION DOCUMENT I 131
in 2017 and early 2018 (up to 7th February 2018)
Limit Use in 2017 Use in 2018 (up to 7th February)
5% of the share capital at the completion date of the purchases Excluding the liquidity agreement: none. On 23rd May 2017, no share was recorded in the liquidity agreement’s account.
NA
5% of the share capital at the completion date of the purchases Excluding the liquidity agreement: none. On 31st December 2017, no share was recorded in the liquidity agreement’s account. (see details on p. 536-537 of the 2018 Registration Document)
Excluding the liquidity agreement: none. On 7th February 2018, no share was recorded in the liquidity agreement’s account.
Nominal EUR 403 million for shares, i.e. 39.99% of the share capital at the date on which the authorisation was granted Note: this limit counts towards those set forth in resolutions 15 to 20 of the AGM of 18th May 2016 Nominal EUR 6 billion for debt securities giving access to the share capital Note: this limit counts towards those set forth in resolutions 15 to 18 of the AGM of 18th May 2016
None None
Nominal EUR 550 million None None
Nominal EUR 100.779 million for shares, i.e. 10% of the share capital at the date on which the authorisation was granted Nominal EUR 6 billion for debt securities giving access to the share capital Note: these limits count towards those set forth in resolution 14, and include those set forth in resolutions 16 to 17 of the AGM of 18th May 2016
None None
10% of the share capital Note: this limit counts towards those set forth in resolutions 14 and 15 of the AGM of 18th May 2016
None None
10% of the share capital Note: this limit counts towards those set forth in resolutions 14 and 15 of the AGM of 18th May 2016
None None
1% of the share capital at the date on which the authorisation was granted Note: this limit counts towards the limit set forth in resolution 14 of the AGM of 18th May 2016
None None
1.4% of the share capital at the date on which the authorisation was granted including a maximum of 0.5% of the share capital with a 2-year vesting period for the payment of the deferred variable compensation Note: this limit counts towards the limit set forth in resolution 14 of the AGM of 18th May 2016 0.1% of the share capital for the Chief Executive Officers Note: this limit counts towards the 1.4% and 0.5% limits set forth in resolution 19 of the AGM of 18th May 2016
On 31st December 2017, allocation of 913,000 shares, i.e. 0.11% of the share capital at the date of allocation
None
0.6% of the share capital at the date on which the authorisation was granted Note: this limit counts towards the limit set forth in resolution 14 of the AGM of 18th May 2016
On 31st December 2017, allocation of 902,000 shares, i.e. 0.11% of the share capital at the date of allocation
None
5% of the total number of shares per 24-month period
None None
3

3 I 1
BOARD OF DIRECTORS’ REPORT ON CORPORATE GOVERNANCE CCORPORATE GOVERNANCE
132 I 2018 REGISTRATION DOCUMENT I S O C I E T E G E N E R AL E G R O U P
Additional information about the Chief Executive Officer, the Deputy Chief Executive Officers and the members of the Board of Directors
ABSENCE OF CONFLICTS OF INTEREST To the best of the Board of Directors’ knowledge:
there are no potential conflicts of interest between the duties of the Chief Executive Officer, the Deputy Chief Executive Officers and the members of the Board of Directors towards Societe Generale and any other obligations or private interests. If necessary, Article 14 of the Board of Directors’ Internal Rules governs conflicts of interest for Directors;
no arrangements or agreements have been entered into with a shareholder, customer, supplier or other party pursuant to which one of the aforementioned persons has been selected;
there is no family relationship between the aforementioned persons;
no restriction other than statutory restrictions shall be accepted by any of the aforementioned persons with regard to the disposal of their stake in Societe Generale’s share capital.
ABSENCE OF CONVICTIONS To the best of the Board of Directors’ knowledge:
no conviction for fraud has been handed down over the past five years against the Chief Executive Officer, any Deputy Chief Executive Officer or any current member of the Board of Directors;
neither the Chief Executive Officer, nor any Deputy Chief Executive Officer, nor any current member of the Board of Directors has been involved (as a member of the Board of Directors, Management Board or Supervisory Board, or as a manager) in any bankruptcy, receivership or liquidation proceedings over the past five years;
neither the Chief Executive Officer, nor any Deputy Chief Executive Officer, nor any current member of the Board of Directors, has been the object of any criminal charges and/or official public sanction from state or regulatory authorities;
neither the Chief Executive Officer, nor any Deputy Chief Executive Officer, nor any current member of the Board of Directors has been prohibited by a court from acting as a member of an administrative, management or supervisory body of an issuer or from taking part in the management or conduct of an issuer’s business over the past five years.
SOCIETE GENERALE
a) with continuing effect during the year
b) without effect during the year

3
STATUTORY AUDITORS’ SPECIAL REPORT ON RELATED-PARTY AGREEMENTS AND COMMITMENTS
2 I 3 CCORPORATE GOVERNANCE
S O C I E T E G E N E R AL E G R O U P I 2018 REGISTRATION DOCUMENT I 133
2 . S TAT U T O R Y A U D I T O R S ’ S P E C I A L R E P O R T O N R E L AT E D - PA R T Y A G R E E M E N T S A N D C O M M I T M E N T S
ERNST & YOUNG et Autres DDELOITTE & ASSOCIÉS
Tour First
TSA 14444
92037 Paris-La Défense Cedex
S.A.S. à capital variable
185, avenue Charles-de-Gaulle
92524 Neuilly-sur-Seine Cedex
SOCIETE GENERALE
Société Anonyme
17, cours Valmy
92972 Paris-La Défense
This is a free translation into English of the Statutory Auditors’ report on related-party agreements and commitments that is issued in the French language. This translation is provided solely for the convenience of English speaking readers. This report on related-party agreements and commitments should be read in conjunction, and construed in accordance with, French law and professional auditing standards applicable in France. It should be understood that the agreements reported on are only those provided by the French Commercial Code and that the report does not apply to those related-party transactions described in IAS 24 or other equivalent accounting standards.
Shareholders’ Meeting held to approve the financial statements for the year ended 31st December 2017 To the Shareholders’ Meeting of Societe Generale,
In our capacity as Statutory Auditors of your company, we hereby report on certain related-party agreements and commitments.
The terms of our engagement require us to communicate to you, based on information provided to us, the principal terms and conditions of those agreements and commitments brought to our attention or which we may have discovered during the course of our audit, as well as the reasons justifying why they benefit the Company, without expressing an opinion on their usefulness and appropriateness or identifying other such agreements and commitments, if any. It is your responsibility, pursuant to Article R. 225-31 of the French Commercial Code (Code de Commerce), to assess the interest involved in respect of the conclusion of these agreements and commitments for the purpose of approving them.
Our role is also to provide you with the information stipulated in Article R. 225-31 of the French Commercial Code relating to the implementation during the past year of agreements and commitments previously approved by the Shareholders’ Meeting.
We conducted the procedures we deemed necessary in accordance with the professional guidelines of the French National Institute of Statutory Auditors (Compagnie Nationale des Commissaires aux Comptes) relating to this engagement. These procedures consisted in verifying the consistency of the information provided to us with the relevant source documents.
Agreements and commitments submitted to the approval of the shareholders’ meeting In accordance with Article L. 225-38 of the French Commercial Code, we inform you that we have not been advised of any agreements or commitments authorised and signed during the year to be submitted for the approval of the Shareholders’ Meeting.
Agreements and commitments previously approved by the shareholders’ meeting
AGREEMENTS AND COMMITMENTS APPROVED IN PRIOR YEARS a) with continnuing effect during the year
We hereby inform you that we have not been advised of any agreement or commitment previously approved by the Shareholders’ Meeting which continued in effect during the year. b) without effect during the year
In addition, we have been informed of the following agreements and commitments, previously approved by the Shareholders’ Meetings of prior years, which had no effect during the year.
3 I 2 STATUTORY AUDITORS’ SPECIAL REPORT
ON RELATED-PARTY AGREEMENTS AND COMMITMENTS CCORPORATE GOVERNANCE
134 I 2018 REGISTRATION DOCUMENT I S O C I E T E G E N E R AL E G R O U P
With Mr. Bernardo Sanchez Incera and Mr. Séverin Cabannes, Deputy Chief Executive Officers of your company NNature and purpose
Pension commitments in favour of Mr. Bernardo Sanchez Incera and Mr. Séverin Cabannes.
TTerms and conditions
The pension commitment in favour of Mr. Bernardo Sanchez Incera was authorised by your Board of Directors on 12th January 2010, and approved by your Shareholders’ Meeting on 25th May 2010. The pension commitment in favour of Mr. Séverin Cabannes was authorised by your Board of Directors on Monday, 12th May 2008, and approved by your Shareholders’ Meeting on Tuesday, 19th May 2009.
Under these commitments, Mr. Bernardo Sanchez Incera and Mr. Séverin Cabannes retain the supplementary pension allocation for senior executives to which they were entitled as employees before their appointment as Deputy Chief Executive Officers. This additional plan, set up in 1991, grants to its beneficiaries, as of the settlement date of their Social Security pension, an overall pension equal to the product of the following:
the average, over the last ten years of their career, of the proportion of basic fixed compensation exceeding the AGIRC (French executives’ retirement fund) “B Tranche” increased by a variable portion limited to 5% of the basic fixed compensation;
the rate equal to the ratio between the number of years of professional service within your company and 60.
The AGIRC “C Tranche” pension vested in respect of their professional services within your company is deducted from this total. The additional allocation to be paid by your company is increased for beneficiaries who have brought up at least three children, as well as for those retiring after the legal retirement age for settlement of the Social Security pension. It may not be less than a third of the full-rate service value of AGIRC “B Tranche” points vested by the manager since his appointment to the “Senior group executives” category of your company.
The rights are subordinated to the presence of the employee in the company at the time when the settlement of his pension takes place.
AGREEMENTS AND COMMITMENTS APPROVED DURING THE YEAR In addition, we have been informed that the following agreements and commitments, previously approved by the Shareholders’ Meeting of 23rd May 2017, as presented in the Statutory Auditors’ special report of 7th March 2017, had no effect during the year.
1. With Mr. Frédéric Oudéa, Chief Executive Officer aa) NNature and purpose
Non-compete clause for Mr. Frédéric Oudéa.
TTerms and conditions
The non-compete clause for Mr. Frédéric Oudéa was authorised by your Board of Directors on 8th February 2017. Provided that he is not employed in a similar position for a six-month period following the termination of his term of office, in a listed bank in Europe or in a non-listed bank in France, Mr. Frédéric Oudéa will be entitled, during the same period, to termination benefits to be paid on a monthly basis, equal to his basic fixed compensation as Chief Executive Officer. The company however reserves the right to waive this clause.
bb) Nature and purpose
Termination benefits in favour of Mr. Frédéric Oudéa. TTerms and conditions
The termination benefits in favour of Mr. Frédéric Oudéa were authorised by the Board of Directors on 8th February 2017. The termination benefits include the following features:
Termination benefits will only be due in the event of a forced departure from the Group and justified as such by the Board of Directors, thereby excluding resignation, non-renewal of the term of office at the initiative of Mr. Frédéric Oudéa or gross negligence.
Payment of the termination benefits will be subject to reaching an overall achievement rate of the targets for the variable portion of his annual compensation of at least 60% on average over the last three fiscal years preceding the termination of his term of office.
No termination benefits will be owed in the event of departure within the six months preceding the settlement of the Social Security pension entailing the right to benefit from the supplementary pension allocation for senior executives.
The amount of the termination benefits will be two years of basic fixed compensation and may not exceed the ceiling recommended by the AFEP-MEDEF Corporate Governance Code of two years of basic fixed and variable compensation.
Furthermore, the shares or equity equivalents allocated as part of the long-term incentive plan of Mr. Frédéric Oudéa and still being vested would be lost in the event of his departure from the Group, as the presence condition would no longer be satisfied. For a departure related to retirement or to an evolution in the Group’s structure or its organisation, shares would be retained or the payments would be made after having taken into consideration the performance observed and assessed by the Board of Directors.
2. With Mr. Didier Valet, Deputy Chief Executive Officer NNature and purpose
Pension commitment in favour of Mr. Didier Valet. TTerms and conditions
The pension commitment in favour of Mr. Didier Valet was authorised by your Board of Directors on 13th January 2017 with effect from 16th January 2017.
a) Nature and purpose
Terms and conditions
b) Nature and purpose
Terms and conditions

3
Nature and purpose
Terms and conditions
a) Nature and purpose
Terms and conditions
b) Nature and purpose
Terms and conditions
Nature and purpose
Terms and conditions
STATUTORY AUDITORS’ SPECIAL REPORT ON RELATED-PARTY AGREEMENTS AND COMMITMENTS
2 I 3 CCORPORATE GOVERNANCE
S O C I E T E G E N E R AL E G R O U P I 2018 REGISTRATION DOCUMENT I 135
Pursuant to this commitment, Mr. Didier Valet retains the rights to the supplementary pension plan for senior executives which applied to him as an employee. This additional plan, set up in 1991, grants to its beneficiaries, as of the settlement date of their Social Security pension, an overall pension equal to the product of the following:
the average, over the last ten years of their career, of the proportion of basic fixed compensation exceeding the AGIRC (French executives’ retirement fund) “B Tranche” increased by a variable portion limited to 5% of the basic fixed compensation;
the rate equal to the ratio between the number of years of professional service within your company and 60.
The AGIRC “C Tranche” pension vested in respect of his professional services within your company is deducted from this total. The additional allocation to be paid by your company is increased for beneficiaries who have brought up at least three children, as well as for those retiring after the legal retirement age for settlement of the Social Security pension. It may not be less than a third of the full-rate service value of AGIRC “B Tranche” points vested by the manager since his appointment to the “Senior group executives” category of your company.
The annual vesting of the contingent rights will be, starting from 2017, subject to the following performance condition: “the rights to potential annuity payments in respect of one year will only be fully vested if at least 80% of the performance conditions of the variable compensation of this same year are satisfied. For a performance of 50% and below, no increase in the annuity will be applied. For an achievement rate of between 50% and 80%, the calculation of the vesting of rights with respect to the year will be calculated on a straight-line basis”.
The rights are subordinated to the presence of the employee in the company at the time when the settlement of his pension takes place.
3. With Mr. Bernardo Sanchez Incera, Mr. Séverin Cabannes and Mr. Didier Valet, Deputy Chief Executive Officers aa) Nature and ppurpose
Termination benefits in favour of Mr. Bernardo Sanchez Incera, Mr. Séverin Cabannes and Mr. Didier Valet. TTerms and conditions
The termination benefits in favour of Mr. Bernardo Sanchez Incera, Mr. Séverin Cabannes and Mr. Didier Valet were authorised by the Board of Directors on 8th February 2017.
The termination benefits include the following features:
Termination benefits will only be due in the event of a forced departure from the Group and justified as such by the Board of Directors, thereby excluding resignation, non-renewal of the term of office at the initiative of Mr. Bernardo Sanchez Incera, Mr. Séverin Cabannes and Mr. Didier Valet or gross negligence.
Payment of the termination benefits will be subject to reaching an overall achievement rate of the targets for the variable portion of their annual compensation of at least 60% on average over the last three fiscal years preceding the termination of their term of office.
No termination benefits will be owed in the event of departure within the six months preceding the settlement of the Social Security pension entailing the right to benefit from the supplementary pension allocation for senior executives.
The amount of the termination benefits will be two years of basic fixed compensation and may not exceed the ceiling recommended by the AFEP-MEDEF Corporate Governance Code of two years of basic fixed and variable compensation.
Furthermore, the shares or equity equivalents allocated as part of the long-term incentive plan of Mr. Bernardo Sanchez Incera, Mr. Séverin Cabannes and Mr. Didier Valet and still being vested would be lost in the event of their departure from the Group, as the presence condition would no longer be satisfied. For a departure related to retirement or to an evolution in the Group’s structure or its organisation, shares would be retained or the payments would be made after having taken into consideration the performance observed and assessed by the Board of Directors.
bb) NNature and purpose
Non-compete clause in favour of Mr. Bernardo Sanchez Incera, Mr. Séverin Cabannes and Mr. Didier Valet. TTerms and conditions
The non-compete clause in favour of Mr. Bernardo Sanchez Incera, Mr. Séverin Cabannes and Mr. Didier Valet was authorised by your Board of Directors on 8th February 2017. Provided that they are not employed in a similar position for a six-month period following the termination of their terms of office, in a listed bank in Europe, or in a non-listed bank in France, Mr. Bernardo Sanchez Incera, Mr. Séverin Cabannes and Mr. Didier Valet will be entitled, during the same period, to termination benefits to be paid on a monthly basis, equal to their basic fixed compensation as Deputy Chief Executive Officers. The company however reserves the right to waive this clause.
Paris-La Défense and Neuilly-sur-Seine, 8th March 2018
The Statutory Auditors
ERNST & YOUNG et Autres
Isabelle SANTENAC
DELOITTE & ASSOCIÉS
José-Luis GARCIA

3 I 2 STATUTORY AUDITORS’ SPECIAL REPORT
ON RELATED-PARTY AGREEMENTS AND COMMITMENTS CCORPORATE GOVERNANCE
136 I 2018 REGISTRATION DOCUMENT I S O C I E T E G E N E R AL E G R O U P
RISK FACTORS AND CAP ITAL ADEQUACY

S O C I E T E G E N E R AL E G R O U P I 2018 REGISTRATION DOCUMENT I 137
4
RISK FACTORS AND CAP IITAL ADEQUACY
1. Risk factors .................................. 138 2. Risk management and internal control
mechanism ................................... 148 Risk appetite ............................................................ 148 Risk appetite – General framework ............................ 150 Risk management ..................................................... 151 Risk mapping framework and stress tests ................. 158 Internal control .......................................................... 159 Control of the production and publication of financial and management information ....................... 163
3. Capital management and adequacy ..................................... 166 The regulatory framework ......................................... 166 Scope of application – Prudential scope .................... 167 Regulatory capital ..................................................... 171 Capital requirements ................................................. 174 Capital management ................................................. 176 Leverage ratio management ...................................... 177 Ratio of large exposures ........................................... 177 Financial conglomerate ratio ...................................... 177
4. Credit risks ................................... 178 Risk supervision and monitoring system .................... 178 Replacement risk ...................................................... 179 Hedging of credit risk ................................................ 181 Risk measurement and internal ratings ...................... 183 Quantitative information ............................................ 191
5. Market risks .................................. 201 Methods for measuring market risk and defining limits ............................................................ 201 Allocation of market risk appetite within the Group ..... 201 99% Value-at-Risk (VaR) ........................................... 202 Stress test assessment ............................................. 206 Market risk capital requirements ................................ 208 Market risk capital requirements and risk-weighted assets ................................................. 210
6. Operational risks ........................... 211 Operational risk measurement .................................. 211 Operational risk monitoring process .......................... 211 Operational risk modelling ........................................ 213 Operational risk insurance ........................................ 215 Capital requirements ................................................ 216
7. Structural interest rate and exchange rate risks ...................................... 217 Organisation of the management of structural interest rate and exchange rate risks ........................ 217 Structural interest rate risk ........................................ 218 Structural exchange rate risk .................................... 220
8. Liquidity risk ................................. 221 Governance and organisation ................................... 221 The Group’s approach to liquidity risk management .. 222 Liquidity reserve ....................................................... 223 Regulatory ratios ...................................................... 223 Balance sheet schedule ........................................... 224
9. Compliance and reputational risk, litigation ........................................ 228 Compliance ............................................................. 228 Litigation .................................................................. 232
10. Other risks .................................... 233 Equity risk ................................................................ 233 Strategic risks .......................................................... 235 Activity risk .............................................................. 235 Risks relating to insurance activities .......................... 235 Environmental and social risks .................................. 235 Conduct risk ............................................................ 235
This section includes information on the risk management linked to financial instruments, and information on capital management and compliance with regulatory ratios, required by IFRS as adopted by the European Union.
Some of this information forms an integral part of the notes to the consolidated financial statements; this information is indicated with the note “Audited I”, (the symbol indicates the end of the audited part). The Societe Generale Group is subject to oversight by supervisory authorities and to regulations on capital requirements applicable to credit institutions and investment firms (Regulation (EU) No. 575/2013 of 26th June 2013). Within the framework of the Third Pillar of the Basel Accord, a detailed and standardised statement is included in the “Risk Report for the purposes of improving published financial disclosures” (Pillar 3 report and cross-reference table). All the information regarding the Pillar 3 Report and the prudential disclosures is available on the www.societegenerale.com website, under Investors, Registration Document and Pillar 3.

4 I 1
RISK FACTORS RRISK FACTORS AND CAPIITAL ADEQUACY
138 I 2018 REGISTRATION DOCUMENT I S O C I E T E G E N E R AL E G R O U P
1 . R I S K FA C T O R S
1. The gglobal economy and financial markets continue to display high levels of uncertainty, which may materially and adversely aaffect the Group’ss business, financial position and results of ooperations.
As part of a global financial institution, the Group’s businesses are sensitive to changes in financial markets and economic conditions generally in Europe, the United States and elsewhere around the world. The Group could face a significant deterioration in market and economic conditions resulting from, in particular, crises affecting capital or credit markets, liquidity constraints, regional or global recessions, sharp fluctuations in commodity prices (including oil), currency exchange rates or interest rates, inflation or deflation, sovereign debt rating downgrades, restructuring or defaults, or adverse geopolitical events (including acts of terrorism and military conflicts). Such events, which may develop quickly and thus potentially not be hedged, could affect the operating environment for financial institutions for short or extended periods and have a material adverse effect on the Group’s financial position, results of operations or cost of risk.
Financial markets have in recent years experienced significant disruptions as a result of concerns regarding the sovereign debt of various Eurozone countries and uncertainty relating to the pace of US monetary policy tightening, as well as fears related to a slowdown of the Chinese economy. The sharp drop in oil prices compared to 2014 has raised questions on the financial stability of certain countries (Gulf States, Africa) and of the oil sector, especially in the United States. Furthermore, an extended period of low interest rates in a low-inflation environment has heightened risk appetite on the markets. A sudden uptick in inflation could trigger an abrupt reassessment of market risks. The increase or accumulation of geopolitical risks (Middle East, North Korea, China Sea, Ukraine, Russian sanctions, etc.) or political risks is another source of uncertainty. The US administration has illustrated the risk of a return to increased protectionism. The implementation of strong protectionist measures (or threats thereof) could affect the strength of international trade in goods and services. Moreover, the uncertainty caused by these sudden political changes, as well as potential consequences of the upcoming political changes in the European Union, could impact economic activity and credit demand, while increasing the volatility of financial markets.
In the Eurozone, the prolonged period of weak growth, the low inflation rate and low-to-negative interest rates have in the past adversely affected banks, and may continue to do so in the future, particularly with respect to interest rate margins for retail banks. The Group is exposed to the risk of substantial losses if sovereign states, financial institutions or other credit counterparties become insolvent or are no longer able to fulfil their obligations to the Group. A resumption of tensions in the Eurozone may trigger a significant decline in the Group’s asset quality and an increase in its loan losses in the affected countries. The Group’s inability to recover the value of its assets in accordance with the estimated percentages of recoverability based on past historical trends (which could prove inaccurate) could further adversely affect its performance. In the event of a pronounced macroeconomic
downturn, it may also become necessary for the Group to invest resources to support the recapitalisation of its businesses and/or subsidiaries in the Eurozone or in countries closely connected to the Eurozone such as those in Central and Eastern Europe. Lastly, the Group’s activities and/or subsidiaries in certain countries could become subject to emergency legal measures or restrictions imposed by local or national authorities, which could adversely affect its business, financial position and results of operations.
2. A number of exceptional measures taken by governments, ccentral banks and regulators could be amended or terminated.
In response to the financial crisis, governments, central banks and regulators implemented measures intended to support financial institutions and sovereign states, and thereby stabilise financial markets. For several years now, central banks have taken measures to facilitate financial institutions’ access to liquidity, in particular by lowering interest rates to historic lows. Various central banks have substantially increased the amount and duration of liquidity provided to banks. They have relaxed collateral requirements and, in some cases, have implemented “non-conventional” measures to inject substantial liquidity into the financial system, including direct market purchases of government bonds, corporate bonds, and mortgage-backed securities. These central banks may decide, acting alone or in concert, to tighten their policies, which could substantially and abruptly decrease the flow of liquidity in the financial system and influence the level of interest rates. In the United States, the Fed has been raising its key interest rate since December 2015. The market is now focusing on the pace of these rate increases and the potential monetary policy in response to the chosen budgetary policy of the US Presidential administration of Donald Trump, or to changes in the inflation rate. Such changes in monetary policy, and concerns about their potential impact, could increase volatility in the financial markets and push US interest rates significantly higher. Given the uncertainty of the strength of global and US economic growth, such changes could have a significant adverse effect on financial institutions and, hence, on the Group’s business, financial position and results of operations.
In the Eurozone, the ECB launched its asset-buying programme in March 2015. In October 2017, it announced that its monthly asset purchases would be reduced to EUR 30 billion starting January 2018 and continuing to September 2018 “or beyond”. The ECB has made it clear that it plans to maintain its balance sheet at constant size “for a prolonged period” after completion of the net asset purchases (by reinvesting the amounts received as the securities it holds reach maturity). In spite of all these measures, a resurgence of financial tension in certain Eurozone member states cannot be ruled out, which could result in national policies restricting cross-border capital flows. Furthermore, the risk of stronger-than-anticipated monetary tightening cannot be excluded, e.g. in the event of a sudden uptick in Eurozone inflation, provoking a sudden correction on the markets and an increase in risk premiums.
3. The Group’s results may be affected by regional market exposures.
4. The Group operates in highly competitive industries, including in its home market.
5. Reputational damage could harm the Group’s competitive position.

4
1. The global economy and financial markets continue to display high levels of uncertainty, which may materially and adversely affect the Group’s business, financial position and results of operations.
2. A number of exceptional measures taken by governments, central banks and regulators could be amended or terminated.
RISK FACTORS
1 I 4RRISK FACTORS AND CAP IITAL ADEQUACY
S O C I E T E G E N E R AL E G R O U P I 2018 REGISTRATION DOCUMENT I 139
33. TThe Group’’ss results may be affected by regional market eexposures.
The Group’s results are significantly exposed to economic, financial and political conditions in the principal markets in which it operates (namely France, Europe and the United States). In France, the Group’s principal market, recovery in growth and low interest rates have resulted in an upturn in the housing market, but a potential relapse of the activity in this area could have a material adverse impact on the Group’s business, resulting in decreased demand for loans, higher rates of non-performing loans and decreased asset values. In the other European Union countries, a slowdown or halt of the current economic recovery, for instance following the decision of the United Kingdom to leave the European Union (Brexit), scheduled for March 2019 (following notification by the United Kingdom in accordance with Article 50 of the Treaty on European Union on 29th March 2017), and could result in increased loan losses or higher levels of provisioning. In the long run, Brexit could weigh down the growth potential of the United Kingdom, given its strong commercial and financial ties with the European Union.
The Group is involved in commercial banking and investment banking operations in emerging markets, in particular in Russia and other Central and Eastern European countries, as well as in North Africa. Capital markets and securities trading activities in emerging markets may be more volatile than those in developed markets and may also be vulnerable to certain specific risks, such as political instability and currency volatility. It is likely that high levels of uncertainty will persist in relation to these markets and therefore the related risk. Unfavourable economic or political developments affecting these markets could have a material adverse effect on the business, results and financial position of the Group.
This is especially true in Russia. As a result of the Ukraine crisis, since March 2014 the United States, the European Union and other countries and international organisations have imposed several rounds of sanctions on Russian individuals and corporates. These sanctions were strengthened by the United States in August 2017. The sanctions, combined with the substantial decline in global oil prices, have adversely impacted the value of the rouble, as well as financing conditions and economic activity in Russia. There is a risk of further adverse developments in the event of increased geopolitical tensions and/or additional sanctions from Western countries and/or Russia, as well as in the event of a further drop in oil prices.
44. TThe Group operates in highly competitive industries, iincluding in its home market.
The Group is subject to intense competition in the global and local markets in which it operates. In local markets, including France, the Group faces substantial competition from locally-established banks, financial institutions, businesses providing financial and other services and, in some instances, governmental agencies. This competition exists in all of the Group’s businesses.
In France, the presence of major domestic competitors in the banking and financial services sector, as well as new market competitors (such as online retail banking and financial services providers), has increased competition for virtually all of the
Group’s products and services. The Group must also cope with the emergence of fintechs, which are reshaping the manner in which consumers interact with financial service providers by offering automated, scalable software-based services rather than branch networks. The French market is a mature market and one in which the Group holds significant market share in most of its businesses. Its financial position and results of operations may be adversely affected if it is unable to maintain or increase its market share in key lines of business. The Group also faces competition from local participants in other geographic markets in which it has a significant presence. Gradually, certain sectors of the financial services industry have become more concentrated, as institutions offering a broad range of financial services have been acquired by or merged into other firms, or have declared bankruptcy. Such changes could result in the Group’s remaining competitors benefiting from greater capital resources or other advantages, such as the ability to offer a broader range of products and services or greater geographic diversity. As a result of all these factors, and competitors’ efforts to increase market share by reducing prices, the Group has experienced pricing pressures in the past, and may face similar pressures in the future.
Competition on a global level, as well as on a local level in France and in other key markets, could have a material adverse effect on the Group’s business, results of operations and financial position.
55. RReputational damage could harm the Group’’ss competitive pposition.
The Group’s reputation for financial strength and integrity is critical to its ability to foster loyalty and develop its relationships with customers and other counterparties (supervisors, suppliers, etc.). Its reputation could be harmed by events attributable to it, flaws in its control measures, non-compliance with its commitments or strategic decisions (business activities, risk appetite, etc.), as well as by events and actions of others outside its control. Negative comments concerning the Group, whether legitimate or not, could have adverse effects on its business and its competitive position.
In particular, the Group’s reputation could be adversely affected by a weakness in its internal control measures (operational risk, regulatory risk, credit risk, market risk, etc.) or following misconduct by employees such as with respect to clients (non-compliance with consumer protection rules) or by issues affecting market integrity (market abuse and conflicts of interest). The Group’s reputation could also be affected by external fraud or information leaks. Similarly, reputational issues could also result from a lack of transparency, communication errors or a restatement of, or corrections to, its financial results. The impact of such events, which could potentially result in litigation, can vary depending on the context and whether they become the focus of extensive media reports. Reputational damage could translate into a loss of business or investor confidence or a loss of the Group’s clients (and prospects), which could have a material adverse effect on the Group’s results of operations and financial position or on its ability to attract and retain employees.

4 I 1
RISK FACTORS RRISK FACTORS AND CAPIITAL ADEQUACY
140 I 2018 REGISTRATION DOCUMENT I S O C I E T E G E N E R AL E G R O U P
66. TThe Group depends on access to financing and other ssources of liquidity, which may be restricted for reasons bbeyond its control.
The ability to access short-term and long-term funding is essential to the Group’s businesses. Societe Generale funds itself on an unsecured basis, by accepting deposits, issuing long-term debt, promissory notes and commercial paper, and obtaining bank loans or lines of credit. The Group also seeks to finance many of its assets on a secured basis, including by entering into repurchase agreements. If the Group is unable to access secured or unsecured debt markets on terms it considers acceptable or if it experiences unforeseen outflows of cash or collateral, including material decreases in customer deposits, its liquidity could be impaired. In addition, if the Group is unable to maintain a satisfactory level of customer deposits collection (especially if competitors raise the interest rates they are willing to pay to depositors, for example, leading customers to move their deposits elsewhere), the Group may be forced to turn to more expensive funding sources, which would reduce the Group’s net interest margin and results.
The Group’s liquidity could also be adversely affected by factors the Group can neither control nor anticipate, such as general market disruptions, operational difficulties affecting third parties, negative views about the financial services industry in general, or the Group’s short-term or long-term financial prospects, as well as changes in the Group’s credit ratings or even market participants’ perception of the Group or other financial institutions.
The Group’s credit ratings can have a significant impact on the Group’s access to funding and also on certain financing and trading revenues. In connection with certain OTC trading agreements and other securities agreements, the Group may be required to provide additional collateral to certain counterparties in the event of a credit rating downgrade. Rating agencies monitor in particular issuer-specific factors, such as governance, strategy, quality and diversity of earnings sources, capital adequacy, quality of the balance sheet structure, risk management and risk appetite. Additionally, they take into account the regulatory and legislative context, as well as the macroeconomic environment in which the Bank operates. Therefore, a deterioration in any of the above factors may lead to a rating downgrade for the Group or other players in the European banking industry.
Lenders have the right to accelerate debt repayment for some of the Group’s debts upon the occurrence of certain events, including the Group’s failure to obtain the necessary collateral following a downgrade of its credit rating below a certain threshold, and other events of default set out in the terms of such indebtedness. If the relevant lenders declare all amounts outstanding due and payable as a result of a default, the Group may be unable to find sufficient alternative financing on acceptable terms, and the Group’s assets might not be sufficient to repay its outstanding indebtedness in full.
Moreover, the Group’s ability to access capital markets and the cost of its long-term unsecured funding are directly related to its credit spreads in both the bond and credit derivatives
markets, which the Group can neither control nor anticipate. Liquidity constraints may have a material adverse effect on the Group’s business, financial position, results of operations and ability to meet its obligations to its counterparties.
77. TThe protracted decline of financial markets or reduced lliquidity in such markets may make it harder to sell assets or mmanoeuvre trade positions and could lead to material losses.
In many of the Group’s businesses, a protracted financial market decline, particularly in asset prices, could reduce the level of activity in the markets involved or reduce their liquidity. These developments could lead to material losses if the Group is not able to close out deteriorating positions in a timely way or adjust the hedge of its positions. This is especially true for the assets the Group holds for which the markets are relatively illiquid by nature. Assets that are not traded in regulated markets or other public trading platforms, such as derivatives contracts between banks, are valued based on the Group’s internal models rather than on their market value. Monitoring or anticipating the deterioration of prices of assets like these is difficult and could lead to losses that the Group did not anticipate.
The continuation of low interest rates and accommodative monetary policy could cause certain yield-seeking participants in the financial markets to change their behaviour and take on additional risks, resulting in lengthened maturities, greater product complexity, the emergence of new market practices, etc. This context could reduce the liquidity of the financial markets in stress periods and increase the risk of dislocation or a flash crash, which could lead to losses or the impairment of assets owned by the Group.
88. TThe volatility of the financial markets may cause the Group to ssuffer significant losses on its trading and investment aactivities.
The volatility of the financial markets could adversely affect the Group’s trading and investment positions in the debt, currency, commodity and equity markets, as well as its positions in private equity, property and other investments. Severe market disruptions and extreme market volatility have occurred in recent years and may occur again in the future, which could result in significant losses for the Group’s capital markets activities. Such losses may extend to a broad range of trading and hedging products, including swaps, forward and future contracts, options and structured products. In 2017, a context of historically low volatility emerged, reflecting generally optimistic sentiments on the markets, as well as the presence of systemic volatility sellers. This situation may increase the risk of a correction, which could impact the Group, especially if key market participants adopt similar positions on certain products.
The volatility of the financial markets makes it difficult to predict trends and implement effective trading strategies; it also increases risk of losses from net long positions when prices decline and, conversely, from net short positions when prices rise. Such losses, if significant, could have a material adverse effect on the Group’s results of operations and financial position.
9. Changes in interest rates may adversely affect the Group’s banking and asset management businesses.
10. Fluctuations in exchange rates could adversely affect the Group’s results of operations.
11. The Group is subject to an extensive supervisory and regulatory framework in each of the countries in which it operates and changes in this regulatory framework could have a significant effect on the Group’s businesses and costs, as well as on the financial and economic environment in which it operates.

4
6. The Group depends on access to financing and other sources of liquidity, which may be restricted for reasons beyond its control.
7. The protracted decline of financial markets or reduced liquidity in such markets may make it harder to sell assets or manoeuvre trade positions and could lead to material losses.
8. The volatility of the financial markets may cause the Group to suffer significant losses on its trading and investment activities.
RISK FACTORS
1 I 4RRISK FACTORS AND CAP IITAL ADEQUACY
S O C I E T E G E N E R AL E G R O U P I 2018 REGISTRATION DOCUMENT I 141
99. CChanges in interest rates may adversely affectt the Group’’ss bbanking and asset management businesses.
The share of the Group’s results arising from interest income is influenced by changes and fluctuations in interest rates in Europe and in the other markets in which it operates. Interest rate sensitivity refers to the relationship between changes in market interest rates and changes in net interest margins and balance sheet values. Any mismatch between interest owed by the Group and interest due to it (in the absence of adequate hedging) could affect the Group’s results of operations.
110. FFluctuations in exchange rates could adversely affect the GGroup’’ss results of operations.
The Group’s main operating currency is the euro. However, a significant portion of the Group’s business is carried out in currencies other than the euro, such as the US dollar, the British pound sterling, the Japanese yen, the Czech koruna, the Romanian leu and the Russian rouble. The Group is exposed to exchange rate movements to the extent that its revenues and expenses, as well as its assets and liabilities, are recorded in different currencies. Because the Group publishes its consolidated financial statements in euros, which is the currency of most of its liabilities, it is also subject to conversion risk in the preparation of its financial statements. Fluctuations in the exchange rates for these currencies against the euro may have a negative impact on the Group’s consolidated results of operations, financial position and cash flows, despite any hedges that may be implemented by the Group to limit its foreign exchange exposure. Exchange rate fluctuations may also affect the value (denominated in euros) of the Group’s investments in its subsidiaries outside the Eurozone.
111. TThe Group is subject to an extensive supervisory and rregullatory framework in each of the countries in which it ooperates and changes in this regulatory framework could hhave a significant effect on the Group’’ss businesses and ccosts, as well as on the financial and economic environment iin which it operates.
The Group is subject to extensive regulation and supervision in all jurisdictions in which it operates. The rules applicable to banks seek principally to limit their risk exposure, preserve their stability and financial solidity and protect clients, depositors, creditors and investors. The rules applicable to financial services providers govern, among other things, the sale, placement and marketing of financial instruments. The Group’s banking entities must also comply with requirements as to capital adequacy and liquidity in the countries in which they operate. Compliance with these rules and regulations requires significant resources. Non-compliance with applicable laws and regulations could lead to fines, damage to the Group’s reputation, forced suspension of its operations or the withdrawal of operating licences.
Since the onset of the financial crisis, a variety of measures have been proposed, discussed and adopted by numerous national and international legislative and regulatory bodies, as well as other entities. Certain of these measures have already been implemented, while others are still under discussion. It therefore remains difficult to accurately estimate the future effects or, in some cases, the likely consequences of these measures.
Since January 2014, Societe Generale has applied the new Basel 3 reforms, implemented in the European Union through the Capital Requirements Regulation (“CRR”) and Capital Requirements Directive 4 (“CRD4”), with certain requirements being phased in over a period of time, up until 2019 or even later. Basel 3 is an international regulatory framework to strengthen capital and liquidity requirements with the goal of promoting a more resilient banking sector. Recommendations and measures addressing the systemic risk exposure of global banks, including additional loss absorbency requirements, have been adopted by the Basel Committee and the Financial Stability Board (“FSB”), which was established following the G20 London summit in 2009. Societe Generale, among other global banks, has been named by the FSB as a “systemically important bank” (“G-SIB”) and as a result is subject to additional capital buffer requirements.
Furthermore, on 7th December 2017, the Group of Central Bank Governors and Heads of Supervision (GHOS), which monitors the Basel Committee on Banking Supervision, adopted the current Basel 3 regulatory reforms undertaken in 2009. The new regulations should apply from 2022 with a global output floor: the banking Risk-Weighted Assets (RWA) will be subject to a floor corresponding to a percentage of the Standardised Approach method (credit, market and operational). The output floor level will increase progressively from 50% in 2022 to 72.5% in 2027. Nonetheless, these regulations will not apply to the Group before their implementation into European Union law (CRR3/CRD6). The timeframe therefore remains subject to further changes.
In France, Act No. 2013-672 dated 26th July 2013 on the separation and regulation of banking activities (as amended by Ordinance No. 2014-158 dated 20th February 2014 stipulating various measures to align French legislation with EU financial law) (the “Banking Law”) mandates the separation of certain market activities performed by significant credit institutions when such activities are considered “speculative” (i.e. those deemed not necessary for the financing of the economy). Unless an exception applies under the law (such as market-making, treasury management, etc.), this obligation covers all banks’ proprietary trading. In accordance with the Banking Law, the Group has segregated the relevant activities in a special subsidiary (Descartes Trading) since July 2015.
Ordinance No. 2015-1024 dated 20th August 2015, ratified by Act No. 2016-1691 dated 9th December 2017, stipulating various measures to align French legislation with EU financial law (the “Ordinance”) amended the provisions of the French Monetary and Financial Code (Code monétaire et financier) in order to implement into French law Directive 2014/59/EU of 15th May 2014 establishing a framework for the recovery and resolution of credit institutions and investment firms (the “BRRD”). Many of the provisions contained in the Banking Law were already similar in effect to the provisions of the Ordinance. Decree No. 2015-1160 dated 17th September 2015 and three orders dated 11th September 2015 regarding (i) recovery planning, (ii) resolution planning and (iii) criteria to assess the resolvability for institutions or groups, supplemented the provisions of the Ordinance implementing the BRRD into French law.

4 I 1
RISK FACTORS RRISK FFACTORS AND CAPITAL AADEQUACY
142 I 2018 REGISTRATION DOCUMENT I S O C I E T E G E N E R AL E G R O U P
The Ordinance requires that credit institutions subject to the direct supervision of the ECB (such as Societe Generale) and credit institutions and investment firms that represent a significant share of the financial system, draw up and submit to the ECB a recovery plan providing for measures to be taken by such institutions to restore their financial position following a significant deterioration of the same.
These reforms could have a significant impact on the Group and its structure, as well as the value of its equity and debt securities.
Regulation (EU) No. 806/2014 of 15th July 2014 establishing uniform rules and a uniform procedure for the resolution of credit institutions and certain investment firms in the framework of a Single Resolution Mechanism and a Single Resolution Fund created the Single Resolution Board (the “SRB”). Since January 2015, the SRB has had the authority to collect information and cooperate with the ACPR for resolution planning purposes. As from January 2016, the resolution powers of the ACPR have been overridden by those of the SRB within the framework of the Single Resolution Mechanism.
Since November 2014, Societe Generale and all other major financial institutions in the Eurozone have been subject to the supervision of the ECB as part of the implementation of the single supervisory mechanism. As set out above, Societe Generale has also been subject to the Single Resolution Mechanism since January 2016. The full impact of this new supervisory structure on the Group cannot yet be fully evaluated.
The MREL ratio (“Minimum Requirement for own funds and Eligible Liabilities”) is defined in the BRRD and has been implemented into French law by the Ordinance. It entered into force in January 2016. The MREL ratio is a minimum requirement for own funds and eligible liabilities that are available to absorb losses and recapitalise the bank according to the conditions stated in the BRRD. This requirement is calculated as the amount of own funds and eligible liabilities expressed as a percentage of the institution’s total liabilities and own funds. The BRRD, which defines the MREL, is being revised in order to converge this ratio with the TLAC.
The TLAC (“Total Loss Absorbing Capacity”) ratio was developed by the FSB at the request of the G20 and finalised in November 2015. The following provisions have become the new international standard for G-SIBs:
(i) G-SIBs are required to meet the TLAC ratio requirement alongside the minimum regulatory requirements set out in the Basel 3 framework. In particular, as from 1st January 2019, G-SIBs are required to meet a minimum TLAC ratio requirement of at least 16% of the resolution group’s risk-weighted assets (TLAC RWA Minimum), on top of which the Basel 3 regulatory capital buffers are added. As from 1st January 2022, the TLAC RWA Minimum requirement will be at least 18%. Minimum TLAC leverage ratio must also be at least 6% of the Basel 3 leverage ratio denominator (TLAC Leverage Ratio Exposure Minimum) as from 1st January 2019, and at least 6.75% as from 1st January 2022. Home authorities may apply additional firm-specific requirements above these minimum standards.
(ii) The standards determine the core features for TLAC-eligible instruments. TLAC instruments must be subordinated (structurally, contractually or statutorily) to operational liabilities. However, EU banks will be allowed to include a limited amount
of senior debt (2.5% of RWA in 2019, 3.5% of RWA in 2022) subject to regulatory approval. TLAC instruments must have a remaining maturity of at least one year. Insured deposits, sight or short-term deposits, derivatives and structured notes are excluded.
(iii) In order to reduce the risk of contagion, G-SIBs may be required to deduct exposures to eligible TLAC instruments and liabilities issued by other G-SIBs from their own TLAC position.
Furthermore, the CRR2/CRD5, a legislative proposal from the European Commission, was published in November 2016, to be voted in Parliament in 2018 depending on the progress of the tripartite discussions, with the application of the majority of the provisions two years after the coming into effect. The new proposals address the following:
Net Stable Funding Ratio (NSFR): new Basel provisions;
Leverage ratio: the minimal requirement of 3% will be inserted in the CRR;
SA-CCR (Standardised Approach Counterparty Credit Risk): SA-CCR is the Basel method that replaces the current “CEM” method to determine the prudential exposure on the derivatives under a Standardised Approach;
Large Exposures: the main change pertains to the calculation of the regulatory limit (25%) on the Tier 1 (instead of the total of own funds), as well as the introduction of a specific limit for exposures between systemic institutions (15%);
TLAC/MREL;
Market risks—FRTB: the final text on the remodelling of the internal and standardised approaches for market risk (Minimum capital requirements for market risk) was published in January 2016, but the Basel Committee is currently reviewing certain structuring elements of this standard and is expected to submit a new version by the end of 2018. The Basel Committee is targeting entry into force of the new market risk capitalisation regulations for 1st January 2022. While its implementation via the CRR2 guidelines is now being considered at the European level, the timeframe for deployment has not yet been decided.
The impact of the new regulatory framework cannot yet be fully estimated; however, the Group’s financial position and cost of funding could be affected.
The US Dodd-Frank Wall Street Reform and Consumer Protection Act of 2010 (“Dodd-Frank Act”) provides a general framework of important financial regulation reforms to enhance banking supervision and regulation and contribute to financial stability. The Dodd-Frank Act and other similar post-financial-crisis regulations implemented in the US have increased costs, restricted business and resulted in greater regulatory supervision, as well as an increased risk of the introduction of additional measures negatively impacting banks. The Dodd-Frank Act has also provided the US market regulators, mainly the CFTC and the SEC, with enhanced regulatory and jurisdictional authority over Societe Generale, and subjected the Group to additional control and monitoring measures.
12. The Group is exposed to counterparty and concentration risks.

4
RISK FACTORS
1 I 4RRISK FACTORS AND CAP IITAL ADEQUACY
S O C I E T E G E N E R AL E G R O U P I 2018 REGISTRATION DOCUMENT I 143
The Dodd-Frank Act also provides for new measures enhancing systemic risk oversight, prudential norms for banks, the orderly resolution of failing systemically-important financial institutions, regulation of over-the-counter derivatives and consumer and investor protection, as well as regulating the ability of banking organisations and their affiliates in relation to proprietary trading activities and certain transactions involving hedge funds and private equity funds.
Although certain rules and regulations are still in draft form, or yet to be proposed, the majority of the rules relevant to the Group have already been finalised and have resulted or will result in additional costs as well as the imposition of certain restrictions on the Group’s activities. The new US Presidential administration has expressed different policy goals, reflected in a series of reports by the US Treasury Department. In addition, some regulatory adjustments are making their way through Congress, which is however expected to leave most of the Dodd-Frank Act intact. Even though the new US Presidential administration is closing in on replacing key leadership positions at important federal financial regulatory agencies, the exact impact of these replacements, and resulting change in the tone from the top at those agencies, remains to be seen. The new policies, tone from the top, and any proposed new regulations or legislation, once adopted, could affect the activities of the Group and the value and liquidity of securities issued by Societe Generale.
In May and June 2017, the European Commission published two regulation proposals amending EMIR (European Market Infrastructure Regulation). Amongst the proposed changes, European Union authorities’ supervisory power over central counterparties of a third country would be strengthened so that European Union authorities could require such central counterparties to become established and authorised in the European Union (“Localisation Policy”) in the event of significant risks to the financial stability of European Union Member States posed by a central counterparty of a third country. While the complete ramifications of the Localisation Policy remain uncertain, particularly in the Brexit context, it could, if implemented, generate operational risks and cost increases, negatively impacting the operational and financial results of the Group.
The implementation of transparency and accountability regulations is still ongoing, notably within the framework of the Dodd-Frank Act in the United States and EMIR in Europe. Among other things, these regulations aim to generalise compensation with clearing houses for “standard” market transactions, and for non-standard transactions, to subject them to bilateral variation margin exchange agreements aimed at covering current exposure, and from certain position thresholds for over-the-counter derivatives, to bilateral initial margins exchange obligations, in order to cover future exposure. In 2017, the variation margin exchange has become mandatory for all financial counterparties. This has represented the largest volume of collateral contract renegotiations (CSA, ARG, etc.). As from September 2017, all category 2 counterparties (financial institutions dealing with more than a certain notional amount) are also required to exchange initial margins. The entry into force of this rule for initial margins will extend until 2020 for the other counterparty categories, which makes an accurate assessment of its impact difficult.
Compliance with personal data protection rules is also of key importance for the Societe Generale Group. Internal instructions set out the rules to be applied and the procedures to be carried out, in conformity with European and local regulations, in order to ensure the protection and security of our clients’ and employees’ data. In anticipation of the implementation of the new General Data Protection Regulation (GDPR), applicable from 25th May 2018, Societe Generale launched a broad Group-wide programme in 2016. This programme encompasses all of the new requirements introduced by the GDPR, in particular with regard to the security and use of personal data, as well as the implementation of strengthened rights for interested parties. Non-compliance with the GDPR could negatively impact the Group’s financial position and results of operations.
In addition, the Group is subject to complex tax rules in the various countries in which it operates. Changes in applicable tax rules, uncertainty regarding the interpretation of such changes, or the effects of such changes on the Group may materially and adversely affect the Group’s business, financial position and results of operations.
112. TThe Group is exposed to counterparty and concentration rrisks.
The Group is exposed to credit risk with respect to numerous counterparties in the ordinary course of its trading, lending, deposit-taking, clearing, settlement and other activities. These counterparties include, among others, institutional clients, brokers and dealers, commercial and investment banks, corporates, clearing houses, hedge funds, and sovereign states. The Group may realise losses if a counterparty defaults on its obligations and if the value of the collateral is not sufficient to fully recover the exposure. Many of the Group’s hedging and other risk management strategies also involve transactions with financial services counterparties. Any default or insolvency on the part of these counterparties may impair the effectiveness of the Group’s hedging and other risk management strategies, which could in turn materially adversely affect its business, results of operations and financial position. Following the financial crisis, regulators have encouraged or imposed the mandatory netting of certain financial instruments formerly traded over-the-counter, which has increased the exposure of the Group and other financial market participants to the clearing houses: the default of any one of them or of one of their members could affect the financial markets and could significantly impact the Group’s activity.
The Group may also have concentrated exposure to a particular counterparty, borrower or issuer (including sovereign issuers), or to a particular country or industry. A significant ratings downgrade, default or insolvency affecting such a counterparty, or a deterioration of economic conditions in such a country or industry, could have an adverse effect on the Group’s business, results of operations and financial position. The devices and methods the Group uses to limit and monitor the level of its credit exposure to individual entities, industries and countries may prove insufficient or defective in preventing the concentration of credit risk. Such a concentration of risk could result in losses for the Group, even when economic and market conditions are generally favourable for its competitors.

4 I 1
RISK FACTORS RRISK FACTORS AND CAPIITAL ADEQUACY
144 I 2018 REGISTRATION DOCUMENT I S O C I E T E G E N E R AL E G R O U P
113. TThe financial soundness and conduct of other financial iinstitutions and market participants could adversely affect the GGroup.
The Group’s ability to engage in funding, investment and derivative transactions could be adversely affected by the soundness of other financial institutions or market participants. Financial services institutions are interrelated as a result of trading, clearing, counterparty, funding and other relationships. As a result, defaults by, or even rumours or questions about, one or more financial services institutions, or a loss of confidence in the financial services industry generally, may result in market-wide liquidity scarcity and could lead to further losses or defaults. The Group has exposure to many counterparties in the financial industry, directly and indirectly, including brokers and dealers, commercial banks, investment banks, mutual and hedge funds, and other institutional clients with which it regularly executes transactions. Many of these transactions expose the Group to credit risk in the event of default by counterparties or clients. It should be noted that the number of cleared transactions is increasing and will continue to do so, thereby increasing our exposure to clearing houses while reducing our bilateral positions.
114. TThe Group’’ss hedging strategies may not prevent all risk of llosses.
If any of the instruments or strategies that the Group uses to hedge its exposure to various types of risk in its businesses is not effective, it may incur significant losses. Many of these strategies are based on historical trading patterns and correlations that may not be appropriate in the future. For example, if the Group holds a long position in an asset, it may hedge that position by taking a short position in another asset whose value has historically moved in an offsetting direction. However, the hedge may cover only part of its exposure to the long position, and the strategies used may not protect against all future risks or may not be fully effective in mitigating its risk exposure in all market environments or against all types of risk in the future. Unexpected market developments may also reduce the effectiveness of the Group’s hedging strategies.
115. TThe Group’’ss results of operations and financial position could bbe adverrsely affected by a significant increase in new pprovisions or by inadequate provisioning for loan losses.
The Group regularly sets aside provisions for loan losses in connection with its lending activities. Its overall level of loan loss provisions, recorded as “cost of risk” in its income statement, is based on its assessment of the recoverability of the loans in question. This assessment relies on an analysis of various factors, including historical losses, the amount and type of lending being granted, industry standards, past due loans, certain economic conditions and the amount and type of any guarantees and collateral. Notwithstanding the care with which the Group carries out such assessments, it could be required to substantially increase its provisions for loan losses, following an increase in defaults or for other reasons. A significant increase in loan loss provisions, or the occurrence of loan losses in excess of its provisions, could have a material adverse effect on its results of operations and financial situation.
Starting in 2018, the Group will record new provisions on performing loans under the IFRS 9 accounting standard. The initial impact of the implementation of this standard,
understood as the difference between the currently accounted provisions on homogeneous groups of performing loans under IAS 39 and the new provisions on performing loans, will be deducted from the Group’s equity. Consequently, the Group’s cost of risk could be negatively impacted by a proven or expected deterioration in the prospects of the amounts outstanding of performing loan portfolios pursuant to the new accounting standard.
116. TTo prepare its consolidated financial statements in aaccordance with IFRS as adopted by the European Union, tthe Group relies on assumptionns and estimates which, if iincorrect, could have a significant impact on its financial sstatements.
When applying the IFRS accounting principles disclosed in the Financial Information (Chapter 6 of this Registration Document) and for the purpose of preparing the Group’s consolidated financial statements, the Group Management makes assumptions and estimates that may have an impact on figures recorded in the income statement or within the profits and losses recorded directly in equity, on the valuation of assets and liabilities in the balance sheet, and on information disclosed in the notes to the consolidated financial statements.
In order to make these assumptions and estimates, the Group Management exercises its judgement and uses information available at the date of preparation of the consolidated financial statements. By nature, valuations based on estimates involve risks and uncertainties relating to their occurrence in the future. Actual future results may therefore differ from these estimates, which could have a significant impact on the Group’s financial statements.
The use of estimates concerns mainly the following valuations:
fair value on the balance sheet of financial instruments that are not quoted on an active market, as well as fair value of financial instruments as presented in the notes to the financial statements;
the amount of impairment of financial assets, tangible or intangible fixed assets and goodwill;
evaluation of the accounting treatment of derivative hedging instruments and measuring the efficiency of the related hedging relationships;
provisions recognised under liabilities (including provisions for litigation in a complex legal context and provisions for employee benefits), underwriting reserves of insurance companies, and deferred profit-sharing;
the amount of deferred tax assets recognised in the balance sheet;
the evaluation of control for determining the scope of consolidated entities, in particular for structured entities;
initial value of goodwill determined for each business combination; and
in the event of the loss of control over a consolidated subsidiary, fair value of the stake potentially retained by the Group in such entity, where applicable.
17. The Group is exposed to legal risks that could negatively affect its financial position or results of operations.
18. If the Group makes an acquisition, it may be unable to manage the integration process in a cost-effective manner or achieve the expected benefits.
19. The Group’s risk management system may not be effective and may expose the Group to unidentified or unanticipated risks, which could lead to significant losses.
20. Operational failure, termination or capacity constraints affecting institutions the Group does business with, or failure or breach of the Group’s information technology systems, could result in losses.
4
13. The financial soundness and conduct of other financial institutions and market participants could adversely affect the Group.
14. The Group’s hedging strategies may not prevent all risk of losses.
15. The Group’s results of operations and financial position could be adversely affected by a significant increase in new provisions or by inadequate provisioning for loan losses.
16. To prepare its consolidated financial statements in accordance with IFRS as adopted by the European Union, the Group relies on assumptions and estimates which, if incorrect, could have a significant impact on its financial statements.
RISK FACTORS
1 I 4RRISK FACTORS AND CAP IITAL ADEQUACY
S O C I E T E G E N E R AL E G R O U P I 2018 REGISTRATION DOCUMENT I 145
117. TThe Group is exposed to legal risks that could negatively aaffect its financiial position or results of operations.
The Group and some of its former and current representatives may be involved in various types of litigation including civil, administrative, fiscal, criminal and arbitration proceedings. The large majority of such proceedings arise from transactions or events that occur in the Group’s ordinary course of business. There has been an increase in client, depositor, creditor and investor litigation and regulatory proceedings against intermediaries such as banks and investment advisors in recent years, in part due to the challenging market environment. This has increased the risk, for the Group as for other financial institutions, of losses or reputational harm deriving from litigation and other proceedings. Such proceedings or regulatory enforcement actions could also lead to civil, administrative, tax or criminal penalties that would adversely affect the Group’s business, financial position and results of operations. For a description of the most significant ongoing proceedings, see “Compliance, reputational and legal risks”.
It is inherently difficult to predict the outcome of litigation and proceedings involving the Group’s businesses, particularly those cases in which the matters are brought on behalf of various classes of claimants, cases where claims for damages are of unspecified or indeterminate amounts, or cases involving unprecedented legal claims.
In preparing the Group’s financial statements, the Group Management makes estimates regarding the outcome of civil, administrative, fiscal, criminal and arbitration proceedings in which it is involved, and records a provision when losses with respect to such matters are probable and can be reasonably estimated. Should such estimates prove inaccurate or should the provisions set aside by the Group to cover such risks prove inadequate, the Group’s financial position or results of operations could be materially and adversely affected.
118. IIf the Group makes an acquisition, it may be unable to mmanage the integration process in a ccost--eeffective manner or aachieve the expected benefits.
The selection of an acquisition target is carried out by the Group following a careful analysis of the businesses or assets to be acquired. However, such analyses may not always be exhaustive, due to various factors. As a result, certain acquired businesses may include undesirable assets or expose the Group to increased risks, particularly if the Group was unable to conduct full and comprehensive due diligence prior to the acquisitions.
The successful integration of a new business typically requires effectively coordinating business development and marketing initiatives, retaining key managers, recruitment and training, and consolidating information technology systems. These tasks may prove more difficult to implement than anticipated, or require more management time and resources than expected. Similarly, the Group may experience higher integration costs and lower savings or earn lower revenues than expected. The pace and degree of synergy building is also uncertain.
119. TThe Group’’ss risk management system may not be effective aand may expose the Group to unidentified or unanticipated rrisks, which could lead to significant losses.
The Group has devoted significant resources to developing its risk management policies, procedures and assessment methods, and intends to continue to do so in the future. Nonetheless, these risk management techniques and strategies may not be fully effective in mitigating its risk exposure in all economic market environments or against all types of risk, including risks that it fails to identify or anticipate. Some of its qualitative tools and metrics for managing risks are based upon observed historical market behaviour. The Group applies statistical and other tools to these observations in order to assess its risk exposures. These tools and metrics may fail to predict accurate future risk exposures that arise from factors the Group did not anticipate or correctly evaluate in its statistical models. Failure to anticipate or manage these risks could have a material adverse effect on the Group’s business, financial position and results of operations.
220. OOperational failure, termination or capacity constraints aaffecting institutions the Group does business with, or failure oor breach oof the Group’’ss information technology systems, ccould result in losses.
The Group is exposed to the risk of operational failure, termination or capacity constraints of third parties, including clients, financial intermediaries that it uses to facilitate cash settlement or securities transactions (such as clearing agents, exchanges and clearing houses), and other market participants. An increasing number of derivative transactions are now required to be cleared on exchanges, or will be in the near future, which has increased the Group’s exposure to these risks, and could affect its ability to find adequate and cost-effective alternatives in the event of any such failure, termination or constraint.
The interconnectivity of multiple financial institutions with clearing agents, exchanges and clearing houses, and the increased concentration of these entities, increases the risk that an operational failure at one institution or entity may cause an industry-wide operational failure that could materially impact the Group’s ability to conduct business. Industry concentration, whether among market participants or financial intermediaries, can exacerbate these risks, as disparate complex systems need to be integrated, often on an accelerated basis. As the Group becomes more interconnected with its clients, it also faces the risk of operational failure with respect to its clients’ information technology and communication systems. Any failure, termination or constraint could adversely affect its ability to effect transactions, provide customer service, manage its exposure to risk or expand its businesses or result in financial losses, liability towards its clients, impairment of its liquidity, disruption of its businesses, regulatory intervention or reputational damage.

4 I 1
RISK FACTORS RRISK FACTORS AND CAPIITAL ADEQUACY
146 I 2018 REGISTRATION DOCUMENT I S O C I E T E G E N E R AL E G R O U P
In addition, an increasing number of companies, including financial institutions, has experienced intrusion attempts or even breaches of their information technology security, some of which have involved sophisticated and targeted attacks on their computer networks and resulted in loss, theft or disclosure of confidential data. Because the techniques used to obtain unauthorised access, disable or degrade service or sabotage information systems change frequently, and often are not recognised until launched against a target, the Group may be unable to anticipate these techniques or to implement effective countermeasures in a timely manner. Similarly, technical internal and external fraud is fluid and protean, and closely follows the technological evolution of financial activities and customer behaviour, leading fraudsters to regularly develop new attack techniques. Such actions could have a material adverse effect on the Group’s business and result in operational losses.
The Group relies heavily on communication and information systems to conduct its business. Any failure, interruption or breach in security of these systems, even if only brief and temporary, could result in business interruptions and lead to additional costs related to information retrieval and verification, reputational harm and a potential loss of business. This could also have a material adverse effect on the Group’s business, results of operations and financial position, and could result in litigation.
221. TThe Group may incur losses as a result oof unforeseen or ccatastrophic events, including terrorist attacks or natural ddisasters.
The occurrence of unforeseen or catastrophic events, including terrorist attacks, natural disasters or a widespread health crisis (or concerns over the possibility of such a crisis), could create economic and financial disruptions, lead to operational difficulties (including travel limitations or relocation of affected employees) that could impair the Group’s ability to manage its businesses, and expose its insurance activities to significant losses and increased costs (such as re-insurance premiums).
222. TThe Group may generate lower revenues from brokerage and oother commission and fee--bbased businesses during market ddownturns.
During the market downturn, the Group experienced a decline in the volume of transactions executed for its clients, resulting in lower revenues from this activity. There is no guarantee that the Group will not experience a similar trend in future market downturns, which may occur periodically and unexpectedly. Furthermore, changes in applicable regulations, such as the adoption of a financial transaction tax, could also impact the volume of transactions that the Group executes for its clients, resulting in lower revenues from these activities. In addition, because the fees that the Group charges for managing its clients’ portfolios are in many cases based on the value or performance of the portfolios in question, a market downturn that reduces the value of its clients’ portfolios or increases the amount of withdrawals would reduce the revenues the Group generates from its asset management, custodial and private banking businesses.
223. TThe Group’’ss inability to attract and retain qualified eemployees, as well as significant changes in the regulatory fframeework related to employees and compensation, may mmaterially adversely affect its performance.
A high rate of turnover and the departure of strategic employees could expose the Group to a loss in its know-how as well as a deterioration in the quality of services provided, particularly in regions where labour markets are highly competitive for qualified personnel (Russia, Romania and India). In order to attract and retain highly qualified employees, the Group must therefore offer career paths, training and development opportunities, and compensation levels in line with market practices, which may negatively impact the profitability of its operations.
Furthermore, the European financial industry is subject to stringent regulation of employee compensation, including rules on bonuses and other incentive-based compensation, and/or deferred payments for certain types of compensation, and the Group, like all participants in the financial industry, must adapt to this changing environment in order to attract and retain qualified employees.
The CRD4 Directive, which has applied since 2014 to banks in the European Economic Area, introduced a ceiling on the variable component of compensation in relation to the fixed component for the regulated population. This regulatory constraint could cause a relative increase in fixed compensation within the Group in relation to the variable component, which could create challenges in attracting and retaining key personnel, increase the fixed cost base of the affected population, and limit the flexibility of the Group’s personnel costs as well as its competitiveness.
224. RRisks related to the implementation of the Group’’ss strategic pplan.
The Group has communicated on a number of strategic objectives, notably its new strategic and financial plan for the 2017-2020 period, introduced on 27th November 2017. These plans and objectives provide for a number of initiatives, in particular a plan to accelerate the digital transformation of its model, the streamlining of its French Retail Banking network, and the strengthening of its internal control function. They include a certain number of financial objectives, such as, among others, objectives related to net banking income, costs, profitability and regulatory ratios. The Group’s future results may differ significantly from these objectives for various reasons, including upon the occurrence of one or more of the risk factors described in this section. If the Group is unable to reach its objectives, or to pursue its various initiatives, it may have an adverse effect on the Group’s activity, results of operations and financial position.

421. The Group may incur losses as a result of unforeseen or
catastrophic events, including terrorist attacks or natural disasters.
22. The Group may generate lower revenues from brokerage and other commission and fee-based businesses during market downturns.
23. The Group’s inability to attract and retain qualified employees, as well as significant changes in the regulatory framework related to employees and compensation, may materially adversely affect its performance.
24. Risks related to the implementation of the Group’s strategic plan.
RISK FACTORS
1 I 4RRISK FACTORS AND CAP IITAL ADEQUACY
S O C I E T E G E N E R AL E G R O U P I 2018 REGISTRATION DOCUMENT I 147
Types of risks Audited The Group’s risk management framework involves the following main categories:
CCredit and counterparty risk (including concentration effects): risk of losses arising from the inability of the Group’s customers, issuers or other counterparties to meet their financial commitments. Credit risk includes the counterparty risk linked to market transactions and securitisation activities. In addition, credit risk may be further amplified by individual, country and sector concentration risk.
MMarket risk: risk of a loss of value on financial instruments arising from changes in market parameters, the volatility of these parameters and correlations between them. These parameters include but are not limited to exchange rates, interest rates, the price of securities (equity, bonds), commodities, derivatives and other assets.
OOperational risks: risk of losses resulting from inadequacies or failures in processes, personnel or information systems, or from external events. They include:
– NNon--ccompliance risk (including legal and tax risks): risk of court-ordered, administrative or disciplinary sanctions, or of material financial loss, due to failure to comply with the provisions governing the Group’s activities;
– RReputational risk: risk arising from a negative perception on the part of customers, counterparties, shareholders, investors or regulators that could negatively impact the Group’s ability to maintain or engage in business relationships and to sustain access to sources of financing;
– MMisconduct risk: from actions (or inactions) of the bank or its employees inconsistent with the Group’s Code of Conduct, which may lead to adverse consequences for our stakeholders, or place the bank’s sustainability or reputation at risk, including in the long term.
MModel risk: the Group makes use of models in the course of its activities. Selecting a particular model and configuring its parameters necessarily involves a simplification of reality and can result in an inaccurate assessment of risk.
SStructural interest and exchange rate risk: risk of losses of interest margin or of banking book value due to changes in interest or exchange rates. Structural interest and exchange rate risks arise from commercial activities and from corporate centre transactions.
LLiquidity and funding risk: liquidity risk is defined as the Group’s inability to meet its financial obligations at a reasonable cost. Funding risk is defined as the risk of the Group being unable to finance the development of its activities in line with its commercial objectives and at a competitive cost.
SStrategic/business risks: risks resulting from the Group’s inability to execute its strategy and business plan.
PPriivate equity risk: risk of losses linked to financial holdings of a private equity nature.
RRisk related to insurance activities: through its insurance subsidiaries, the Group is also exposed to a variety of risks linked to this business. In addition to balance sheet management risks (interest rate, valuation, counterparty and exchange rate risk), these risks include premium pricing risk, mortality risk and the risk of an increase in claims.
RRisk related to specialised finance activities: through its specialised financial services activities, mainly in its operational vehicle leasing subsidiary, the Group is exposed to residual value risk (when the net resale value of an asset at the end of the lease is less than estimated).
In addition, rrisks associated wwith climate change, both physical (increased frequency of extreme weather events) and transition-related (new carbon regulations), have been identified as factors that could aggravate the Group’s existing risks.

4 I 2
RISK MANAGEMENT AND INTERNAL CONTROL MECHANISM RRISK FACTORS AND CAPIITAL ADEQUACY
148 I 2018 REGISTRATION DOCUMENT I S O C I E T E G E N E R AL E G R O U P
2 . R I S K M A N A G E M E N T A N D I N T E R N A L C O N T R O L M E C H A N I S M
RISK APPETITE Risk appetite is defined as the level of risk that the Group is prepared to accept to achieve its strategic goals.
Principles governing risk appetite Societe Generale seeks sustainable development based on a diversified and balanced banking model with a firm European base and a targeted global presence in selected areas of strong business expertise; the Group also strives to maintain long-term relationships with its clients, built on the confidence it has earned, and to meet the expectations of all of its stakeholders.
This results in:
an organisation based on 17 Business Units offering different products and services tailored to clients in different regions;
a geographically balanced model where about 75% of revenues are generated in developed countries and 25% in developing countries. In Retail Banking, the Group focuses its development on Europe and Africa, where it enjoys a historic presence, extensive knowledge of the markets and prominent positions; as regards Global Banking and Investor Solutions, outside the Europe and Africa zones, the Group targets those activities in which it can rely on international expertise;
a targeted growth policy, promoting areas of existing expertise, high-quality client franchise, and the search for synergy gains within the Group’s diversified banking model;
the integration of CSR issues as a core element of its strategy and of its relations with stakeholders;
vigilance regarding the Group’s reputation, which it views as a high-value asset that must be protected.
A strong financial profile Societe Generale seeks to achieve sustainable profitability, relying on a robust financial profile consistent with its diversified banking model, by:
targeting profitable and lasting development of the business lines;
maintaining a target rating allowing access to financial resources at a cost consistent with the development of the Group’s businesses and its competitive positioning;
calibrating its capital and hybrid debt targets to ensure:
– satisfaction of the minimum regulatory requirements in the baseline scenario, with a security buffer,
– a sufficient level of creditor protection, consistent with the Group’s goals with respect to the target rating and future regulatory ratios (Total Loss Absorbency Capacity (TLAC) for instance);
ensuring resilience in its liabilities, which are calibrated taking into account the survival horizon in a liquidity stress ratio, compliance with LCR (Liquidity Coverage Ratio) and NSFR (Net Stable Funding Ratio) regulatory ratios, and the level of dependence on short-term wholesale funding;
controlling financial leverage.
The Group’s goal with respect to its shareholders is to generate adequate profitability relative to the risks incurred. Therefore, the risk/reward ratio is taken into consideration in measuring and managing profitability, as well as in product and service pricing.
Structural interest rate and exchange risks The Group assesses and strictly controls structural risks. The mechanism for controlling interest rate risk, foreign exchange risk and the risk on employee benefits is based on sensitivity or stress limits adapted to each of the various businesses (entities and business lines).
Liquidity and funding risks The Group assesses the solidity of its liquidity profile based on three complementary elements:
Controlling liquidity risk.
The Group assesses the liquidity risk over various time horizons, including intraday, taking into account market access restriction risk.
Controlling funding risk.
The capacity to raise funding is assessed over a three-year horizon.
Complying with regulatory obligations (LCR and NSFR).
The solidity of the liquidity profile is assessed within the Group’s prudential scope, taking into account the liquidity situation in major foreign currencies.
The Group’s larger entities, in particular those which are subject to local regulatory obligations governing liquidity, also assess and specifically monitor their liquidity profile in conjunction with the Group.
The liquidity and funding risks framework is determined within the Group’s ILAAP (Internal Liquidity Adequacy Assessment Process).

4
RISK MANAGEMENT AND INTERNAL CONTROL MECHANISM
2 I 4 RRISK FACTORS AND CAP IITAL ADEQUACY
S O C I E T E G E N E R AL E G R O U P I 2018 REGISTRATION DOCUMENT I 149
Credit and counterparty risks (including concentration effects) When it assumes credit risk, the Group focuses on medium- and long-term client relationships, targeting both clients with which the Bank has an established relationship of trust and prospects offering the potential for profitable business development over the medium-term.
In a credit transaction, risk acceptability is based, first and foremost, on the borrower’s ability to meet its commitments. Security interests are sought to reduce the risk of loss in the event of a counterparty defaulting on its obligations, but may not, except in exceptional cases, constitute the sole justification for taking the risk.
The Group seeks to diversify risk by controlling individual and sector concentration risk and maintaining a policy of spreading risk by sharing it with other financial partners.
So as to closely monitor portfolio quality, the Group has established alert thresholds using a series of credit portfolio quality indicators that are monitored quarterly by the Risk Committees (CORISQ and the Risk Committee of the Board of Directors).
The Group seeks to maintain an exposure to country risks that reflects its strategic selections in terms of its foreign operations and that limits concentrations in high-risk countries.
The Group defines specific credit policies for sectors or types of credit transaction that present concentration risks or have a specific or intrinsically higher risk profile. This mechanism is bolstered by portfolio limits.
As regards Retail Banking in particular:
the criteria for granting housing loans take into account the value of the property financed and climate change issues, but are primarily predicated upon an analysis of the borrower’s ability to repay the loan. In France, the Group favours loans that are eligible for the Crédit Logement guarantee;
consumer credit activities have a risk of loss significantly higher than the other retail banking activities, which requires a commensurate and robust loan pricing and supply policy, as well as proactive collection management;
the Group has a moderate appetite for credit risk in private banking activities. This business targets clients that are inherently low-risk and applies a conservative credit policy, in line with this risk appetite.
Market risks The Group’s market activities are carried out in the context of a business development strategy primarily focused on meeting client requirements with a full range of products and solutions. The market risk is strictly managed through a set of limits for several indicators (such as stress tests, Value at Risk (VaR) and stressed Value at Risk (SVaR), “sensitivity” and “nominal” indicators).
Regular reviewing of these limits ensures that they closely reflect any changes in market conditions.
Within these limits, the global stress test limit, which covers all activities and the main market risk factors, plays a pivotal role in determining the Group’s market risk appetite. The risk/reward ratio – represented by a limit in the form of the Global Stress Test to budgeted Net Banking Income ratio – is subject to specific monitoring.
Proprietary trading transactions are segregated within a dedicated subsidiary (Descartes Trading) and are subject to a limited risk appetite.
Operational risks (including reputation and compliance risk) The Group has no appetite for operational risk but is prepared to assume a potential loss of approximately 1% of recurring revenue.
The Group’s activities strictly comply with all laws and regulations governing financial and banking activities. In particular, the Group strives to:
work with clients and partners whose practices comply with international rules and standards on anti-money laundering and terrorism financing;
work with clients and complete transactions in accordance with rules related to international embargoes and financial penalties;
perform transactions, offer products and advisory services and work with partners in accordance with regulations governing, in particular, client protection and market integrity, as well as in line with its tax and anti-corruption undertakings;
anticipate and manage conflicts of interest;
protect the data of its clients and employees;
control the risk of serious environmental damage or human rights’ infringements associated with its activities, as defined by the French law on the Duty of Vigilance;
develop a culture of compliance among its employees and ensure that they may express concerns and submit complaints (“whistle blowing”).
The Group has defined values and principles of conduct which apply to all of its employees:
it emphasises employee loyalty with respect to clients and the integrity of its practices;
it develops a strong culture that guides employee behaviour in such a manner as to conduct business ethically and responsibly. This culture is spread through values (team spirit, innovation, responsibility, commitment), a Code of Conduct and a leadership model which defines the conduct and skills expected of employees in respect of each Group value;
it ensures that they are implemented and complied with through, in particular, alignment of the HR processes (recruitment, performance evaluations, promotion, compensation, disciplinary procedures, etc.) with these values and principles of conduct.
Societe Generale is extremely careful with respect to its reputation. The prevention and detection of the risk of harm to its reputation are integrated within all the Group’s operating practices. This vigilance forms part of the Group’s sustainable development strategy.

4 I 2
RISK MANAGEMENT AND INTERNAL CONTROL MECHANISM RRISK FACTORS AND CAPIITAL ADEQUACY
150 I 2018 REGISTRATION DOCUMENT I S O C I E T E G E N E R AL E G R O U P
RISK APPETITE – GENERAL FRAMEWORK The risk appetite is determined at Group level and is allocated operationally to the businesses and subsidiaries; it is monitored as described in the “Risk Appetite Framework”, which is summarised below.
Governance The Board of Directors approves the Group risk appetite proposed by General Management. The Risk Division and the Finance and Development Division define the Group’s risk appetite and provide monitoring and second-level control of its implementation, together with the Group Compliance Division. The Internal Audit Division periodically reviews the effectiveness of the Risk Appetite Framework.
Determination and allocation of the risk appetite Risk appetite is developed and allocated based on:
regular identification and assessment of all material risks to which the Group is exposed; this exercise relies on prospective measurement tools (stress tests);
a provisional assessment of the Group’s profitability and solvency under a baseline scenario and a stressed scenario, over a horizon of at least three years, selected to construct the strategic and financial plan;
an allocation of the risk appetite within the Group, down to the appropriate level, taking into account the risk/profitability profile of the business lines and their growth prospects.
The Group’s risk appetite is formalised in a document (“Risk Appetite Statement”) that determines the general guidelines, policies, targets, limits and thresholds governing the Group’s risk appetite. This document is reviewed annually.
Every year, upstream from the budget process, the Finance Division, together with the Risk Division, submits Group-level targets to General Management. Such targets are subsequently submitted for the approval of the Board of Directors.
These targets are designed to ensure:
compliance, with a sufficient safety margin, with the regulatory obligations to which the Group is subject (in particular, minimum regulatory solvency, leverage and liquidity ratios), pre-empting the implementation of new regulations where possible;
sufficient resistance to stress scenarios by means of a safety margin (stress normalised by regulators or defined through an internal Group process).
Risk appetite in relation to the major risks to which the Group is exposed is regulated by limits and thresholds. These metrics support the Group in achieving its financial targets and guide the Group’s profitability profile.
Allocation of risk appetite within the organisation The allocation of risk appetite within the organisation is based on the strategic and financial plan and risk management frameworks.
Based on the Finance Division’s proposal, the financial targets defined at the Group level are broken down into budget allocation targets at the business level as part of the budget and the strategic and financial plan.
Once the budget process has been completed and after validation by General Management, the Group submits the budgetary trajectories in the baseline scenario and in the stressed scenario to the Board of Directors, verifying that the financial targets initially proposed have been met; if not, the Board of Directors may either approve new targets or request that the trajectories be changed.
Likewise, over and above the financial targets, and based on the proposal from the Finance and Risk Divisions, the limits and thresholds defined at Group level are allocated operationally between the business units and businesses, which are then responsible for allocating them downstream and monitoring within their scope.
The Group’s main subsidiaries define their risk appetite, allocate metrics within their organisation and implement an appropriate risk appetite framework. The Corporate Divisions and their functions ensure consistency with the Group risk appetite. Subsidiaries’ risk appetites are validated by their Board of Directors.
Risk Committee
G R O U P S T R A T E G Y C O M M I T T E E
S U P E R V I S O N C O M M I T T E E C O M M I T T E E
G R O U P R I S K S C O M M I T T E E
( C O R I S Q )
F I N A N C E G R O U P I N T E R N A L
C O N T R O L C O O R D I N A T I O N
C O M M I T T E E ( C C C I G )
C O M M I T T E E ( C O M -C O )
STRATEGIC ARCHITECTURE
COMMITTEE (CSAE)
A U D IT AN D I N T ER N AL CO N TO L
C O M MI T TE E R I S K C OM M IT T EE
C O M PE N SA T IO N C O M MI T TE E
N O M IN A T I O N A ND C O R PO R AT E
G O V ER N AN C E C O M MI T TE E

4
RISK MANAGEMENT AND INTERNAL CONTROL MECHANISM
2 I 4 RRISK FACTORS AND CAP IITAL ADEQUACY
S O C I E T E G E N E R AL E G R O U P I 2018 REGISTRATION DOCUMENT I 151
RISK MANAGEMENT Audited I Implementing a high-performance and efficient risk management structure is a critical undertaking for Societe Generale in all businesses, markets and regions in which it operates, as is maintaining a balance between strong awareness of risks and promoting innovation. The Group’s risk management, supervised at the highest level, is compliant with the regulations in
force, in particular the Order of 3rd November 2014 related to internal control of companies in the banking sector, payment services and investment services subject to the control of the French Prudential Supervisory and Resolution Authority (Autorité de Contrôle Prudentiel et de Résolution – ACPR) and European regulations CRR/CRD4. (See Board’s Expertise, p. 85.)
Audited I The main objectives of the Group’s risk management strategy are:
to contribute to the development of the Group’s businesses and profitability by defining the Group’s risk appetite in conjunction with the Finance Division and the business divisions;
to contribute to the Group’s sustainability by establishing a risk management and monitoring system;
to reconcile the independence of the risk management system (with respect to the businesses) with close collaboration with the core businesses, which have primary responsibility for the transactions they initiate.
This can take the form of:
– clear principles for the governance, control and organisation of risks;
– determining and formally defining the Group’s risk appetite;
– effective risk management tools;
– risk awareness that is cultivated and established at each level of the company.
Governance of risk management Audited I Two main high-level bodies govern Group risk management: the Board of Directors and General Management.
General Management presents the main aspects of, and notable changes to, the Group’s risk management strategy to the Board of Directors at least once a year (more often if circumstances so require).
Within the Board of Directors, the Risk Committee (see Art. 11 of the Internal rules of the Board of Directors, p. 550) is more specifically responsible for examining the consistency of the internal risk monitoring framework, as well as compliance with this framework and with the applicable laws and regulations.
The Board of Directors’ Audit and Internal Control Committee (see Art. 10 of the Internal Rules of the Board of Directors, p. 549) ensures that the risk control systems operate effectively.
Chaired by General Management, the specialised committees responsible for central oversight of internal control and risk management are as follows:
the RRisk Committee (CORISQ), which met 20 times in 2017, addresses the Group’s key priorities in term of risks. It takes the major decisions relating to the management of different risks (credit risks, country risks, market and operational risks).
BOARD OF D IRECTORS
GENERAL MANAGEMENT
STRATEGIC SUPERVISION COMMITTEES
OPERATIONAL SUPERVISION COMMITTEES
G R O U P S T R A T E G Y CC O M M I T T E E
Implements the Group’s strategy S U P E R V I S O N C O M M I T T E E
S T R A T E G Y O V E R S I G H T C O M M I T T E E
Reviews markets and clients activities, transformation and innovation projects, HR
and mid-term financial projections and targets
G R O U P R I S K S CC O M M I T T E E
( C O R I S Q )
Supervises guidelines governing risks, in particular the management of different risks:
credit, country, market and operational risks
F I N A N C E C O M M I T T E E ( C O F I )
Defines the Group’s financial strategy and ensures the
monitoring of scare resources, their allocation and the review
of structural risks at Group level and for significant entities
G R O U P I N T E R N A L CC O N T R O L
C O O R D I N A T I O N CC O M M I T T E E
( C C C I G )
Responsible for the design, consistency and effectiveness of the Group’s overall internal
controls
C O M P L I A N C E C O MM M I T T E E ( C O M -
CC O )
Defines compliance principles at Group level
CORPORATE STRATEGIC
AARCHITECTURE COMMITTEE (CSAE) Defines the company’s
architecture in terms of data and reference data bases,
operational processes and IT systems.
Ensures the consistency of Group projects with the target
architecture
A U D IT AN D II N T ER N AL CO N TO L
C O M MI T TE E R I S K C OM M IT T EE
C O MM PE N SA T IO N CC O M MI T TE E
N O M IN A T I O N A ND CC O R PO R AT E
G O V ER N AN C E CC O M MI T TE E
4

4 I 2
RISK MANAGEMENT AND INTERNAL CONTROL MECHANISM RRISK FACTORS AND CAPIITAL ADEQUACY
152 I 2018 REGISTRATION DOCUMENT I S O C I E T E G E N E R AL E G R O U P
The Group also has a Large Exposures Committee, which approves the sales and marketing strategy and risk-taking with regard to major client groups;
the FFinance Committeee (COFI) is responsible for setting out the Group’s financial strategy and for managing scarce resources (capital, liquidity, balance sheet, tax capacity) in the context of the Group’s risk appetite. It validates the Group’s management and structural risk monitoring mechanism and reviews changes in those risks and in significant entities (limits and consumption). It periodically assesses the consumption of scarce resources. It examines ILAAP and ICAAP documents, the budget, the Preventive Recovery Plan, and the Corporate Centre and re-invoicing budget. Lastly, it covers issues of the Group’s taxation (managed jointly by the Group Finance Division and the Corporate Secretary);
the CCompliance Committee (COM-CO) meets quarterly in order to define the Group’s main guidelines and principles in terms of compliance. The Head of Compliance presents the main events having occurred over the period, an update on the compliance system, the main regulatory developments and the state of progress on projects;
the CCorporate SStrategic Architecture Committee (CSAE) defines the company’s architecture from the standpoint of data and reference systems, operational processes and information systems, and ensures the consistency of the Group’s projects with the architecture set out;
the GGroup Internal Control Coordination Committee (CCCIG) is responsible for the overall architecture of the Group’s internal control system, its consistency and its efficiency.
Divisions in charge of risk monitoring TThe Group’’ss Corporate Divisions, which aare independent from the ccore businesses, contribute to the management aand internal ccontrol of risks.
The Corporate Divisions provide the Group’s General Management with all the information needed to assume its role of managing Group strategy under the authority of the Chief Executive Officer. The Corporate Divisions report directly to General Management.
The main responsibilities of the RRisk Division are to contribute to the development of the Group’s businesses and profitability by defining the Group’s risk appetite (broken down by business) under the aegis of General Management and in collaboration with the Finance Division and the business divisions, and to establish a risk management and monitoring system as a second line of defence.
In performing its work, the Risk Division reconciles independence from the businesses with a close working relationship with the core businesses, which are responsible in the first instance for the transactions they initiate.
Accordingly, the Risk Division:
– provides hierarchical and functional supervision for the Group’s Risk function;
– is jointly responsible, with the Finance Division, for setting the Group’s risk appetite as recommended to General Management;
– identifies all Group risks;
– implements a governance and monitoring system for these risks, including cross-business risks, and regularly reports on their nature and extent to General Management, the Board of Directors and the supervisory authorities;
– contributes to the definition of risk policies, taking into account the aims of the businesses and the relevant risk issues;
– defines or validates the methods and procedures used to analyse, measure, approve and monitor risks;
– implements a second-level control to ensure the correct application of these methods and procedures;
– conducts and validates transactions and limits proposed by business managers;
– defines or validates the architecture of the risk information system and ensures its suitability to business requirements.
In addition to its financial management responsibilities, the GGroup Finance Division also carries out extensive accounting and finance controls. As such:
– the Mutualised Operations Activities Department is responsible for accounting, regulatory and tax production for entities under its responsibility (o.w. Societe Generale SA); it is also responsible for coordinating the continuous improvement and management of processes for entities within its scope;
– the missions of the ALM Department, the Balance Sheet and Global Treasury Management Department, and the Strategic Financial Management Department are detailed in the “Structural and liquidity risks” section, page 153 of this report.
The FFinance Departments of the Business Units, which report hierarchically to the Group Finance Division and functionally to the core businesses’ managers, ensure that the financial statements are prepared correctly at the local level and control the quality of the information in the financial reports (accounting, management control, regulations, etc.) submitted to the Group Finance Division.
The GGroup Compliance Division, which has been reporting to General Management since 1st June 2017, ensures that the Group’s banking and investment activities are compliant with all laws, regulations and ethical principles applicable to them. It also ensures the prevention of reputational risk.
The CCorporate Secretary includes the GGroup Legal DDepartment, which monitors the security and legal compliance of the Group’s activities, relying where applicable on the legal departments of subsidiaries and branches, and the GGroup Tax Department, which ensures compliance with tax laws in France and abroad.
The HHuman Resources and Communication Division monitors the implementation of compensation policies, amongst other things.
The CCorporate Resources and Innovattion Division is specifically responsible for defining information system security policies.
The GGroup Internal Audit Division is in charge of internal audits, under the authority of the Head of Group Internal Audit.
Asset and Liability Management Department of the Group Finance Division
Market Risk Department of the Group Risk Division, within a dedicated ALM Risk Monitoring Department
Strategic Financial Management Department
Balance Sheet and Global Treasury Management Department
Risk Division

4
Finance Committee
Compliance Committee
Corporate Strategic Architecture Committee
Group Internal Control Coordination Committee
The Group’s Corporate Divisions, which are independent from the core businesses, contribute to the management and internal control of risks.
Risk Division
Group Finance Division
Finance Departments of the Business Units
Group Compliance Division
Corporate Secretary Group Legal Department
Group Tax Department
Human Resources and Communication Division
Corporate Resources and Innovation Division
Group Internal Audit Division
RISK MANAGEMENT AND INTERNAL CONTROL MECHANISM
2 I 4 RRISK FACTORS AND CAP IITAL ADEQUACY
S O C I E T E G E N E R AL E G R O U P I 2018 REGISTRATION DOCUMENT I 153
In performing their missions, the Risk Division, Compliance Division and Information System Security Department rely on functions in the core businesses and corporate divisions, formed by representatives who report to them directly or functionally.
According to the latest voluntary census (31st December 2017) with respect to full-time equivalent (FTE) employees:
the Group Risk function had 5,390 FTE employees (including 1,000 FTE employees within the Group Risk Division);
the Compliance function had approximately 2,226 FTE employees;
the Information System Security function had approximately 368 FTE employees.
Characteristics by risk
STRUCTURAL AND LIQUIDITY RISKS Structural risks are managed by the AAsset and Liability MManagement Department of the Group Finance Division. This department defines the normative principles and modelling methods (validated by an ad hoc committee chaired by the Risk Division) applicable to all entities. It also develops monitoring indicators and global stress test scenarios for the different types of structural risk. Lastly, the ALM Department checks that the Group’s business lines and entities comply with the framework applicable to them.
The second line of defence tasks, focused on the validation of the Group’s ALM models and the resulting risk monitoring, are carried out by the MMarket Risk Department of the Group Risk Division, wwithin a dedicated ALM Risk Monitoring Department. This Department validates ALM modelling principles as well as model calibrations and backtesting. It also analyses the proposals of the Finance Division pertaining to the definition of ALM risk indicators, stress test scenarios and the associated risk framework. As the second line of defence, the ALM Risk Department also ensures that the risk limits and thresholds are respected and conducts a periodical review of the ALM risk framework in coordination with the first-level control teams.
Each entity carries out first-level controls on structural risks and is responsible for regularly assessing risks incurred, producing the risk report, and developing and implementing hedging options. Each entity is required to comply with Group standards and to adhere to the limits assigned to it.
Given that liquidity is a scarce resource, the Group’s objective is:
to finance its activities at the best possible rates under normal conditions, while maintaining adequate buffers to cover outflows in periods of liquidity stress;
to ensure the stability of the financing for its activities by managing its dependency on market funding and financing stability in line with the timing of its financing needs;
to maintain its short-term and long-term ratings near the Group’s targets.
The scope of the Group’s short- and long-term financing plan, which supplements customer deposits, is conservative, with reduced concentration in the short-term while ensuring diversification in terms of products and regions.
The Finance Division’s SStrategic Financial Management DDepartment is responsible for managing scarce resources in accordance with regulatory requirements and the Group’s risk appetite and budgetary targets.
The Finance Division’s BBalance Sheet and Global Treasury MManagement Department is responsible for managing the Group’s balance sheet and liquidity, in particular by implementing financing plans and contingency funding plans in the event of a liquidity crisis.
CREDIT RISKS Audited I Management of credit risk is based on four core principles:
all transactions involving credit risk (debtor risk, settlement/delivery risk, issuer risk and replacement risk) must be pre-authorised;
responsibility for analysing and approving transactions lies with the dedicated primary customer relations unit and risk unit, which examine all authorisation requests relating to a specific client or client group, to ensure a consistent approach to risk management;
the primary customer relations unit and the risk unit must be independent from each other;
credit decisions must be systematically based on internal risk ratings (obligor rating), as provided by the primary customer relations unit and approved by the Risk Division.
In terms of governance, the Risk Division submits recommendations to the Group Risk Committee (CORISQ) on limits which it deems appropriate for certain countries, geographic regions, sectors, products or types of customers in order to reduce risks with strong correlations. The allocation of limits is also subject to final approval by CORISQ. Major concentration risks are analysed on a regular basis for the entire Group.
Together with the core businesses, the Risk Division has defined a control and monitoring system based on the credit risk policy. Said policy is reviewed on a regular basis by the Board of Directors’ Risk Committee.
Within the RRisk Division, credit risk supervision is organised by business division. The Market Risk Department defines the methods for evaluation of counterparty risk and is in charge of the credit risk supervision on hedge fund counterparts.
Each of these departments is responsible for:
setting or proposing global and individual credit limits by client, client group or transaction type;
authorising transactions submitted by the sales departments in line with the delegation system in place;
validating credit scores or internal client rating criteria;
monitoring large exposures, specific credit portfolios and compromised counterparties;
approving specific and general provisioning policies.

4 I 2
RISK MANAGEMENT AND INTERNAL CONTROL MECHANISM RRISK FACTORS AND CAPIITAL ADEQUACY
154 I 2018 REGISTRATION DOCUMENT I S O C I E T E G E N E R AL E G R O U P
In addition, a specific department performs comprehensive portfolio analyses and provides the associated reports, including those for the supervisory authorities. A monthly report on the Risk Division’s activity is presented to the Risk Committee and the Board of Directors’ Risk Committee, and specific analyses are submitted to General Management.
MARKET RISKS Audited I Although primary responsibility for managing risk exposure lies with the front office managers, the supervision system comes under the Market Risk Department of the Risk Division, which is independent from the businesses.
This department:
checks the existence of an effective market risks monitoring system based on suitable limits;
assesses the limit requests submitted by the different businesses within the framework of the overall limits authorised by the Board of Directors and General Management, and based on the use of these limits;
proposes appropriate market risk limits by Group activity to the Group Risk Committee;
defines methods for evaluating market risk;
approves the valuation models used to calculate risk and results;
defines methodologies for calculating provisions for market risk (reserves and adjustments to earnings).
To carry out these different tasks, the Market Risk Department uses the information provided by the Market Analysts & Certification Community (MACC), which independently monitors the Group’s market positions on a permanent and daily basis, through:
daily calculation and certification of market risk indicators based on formal and secure procedures;
reporting and first-level analysis of these indicators;
daily monitoring of the limits set for each activity, in conjunction with the Market Risk Department;
verification of the market parameters used to calculate risks and results, with the Market Risk Department bearing responsibility for validating sources and defining the methods used to determine the parameters;
monitoring and control of the gross nominal value of positions. This system is based on alert levels applied to all instruments and desks, defined in collaboration with the Market Risk Department, and contributes to the detection of possible rogue trading operations.
In order to perform its tasks, MACC defines the architecture and the functionalities of the information system used to produce the risk indicators for market transactions. MACC ensures it meets the needs of the different businesses and of the Market Risk Department.
In terms of governance, market risk oversight is provided by various committees at different levels of the Group:
risks related to market activities are reviewed during the Market Risk Committee (MRC) led by the Market Risk Department and chaired by the Risk Division and by the Global Markets Division. This committee provides information on risk levels for the main risk indicators as well as for some specific activities pointed out depending on market or business driven events. It also provides an opinion on the market risk framework changes falling under the remit of the Risk Division and Global Markets Division;
the Risk Committee (CORISQ) is regularly informed of Group-level market risks. Moreover, upon a proposal from the Market Risk Division, it validates the main choices with regard to market risk measurement, as well as the key developments on the architecture and implementation of the market risk framework at Group level;
lastly, the Risk Committee of the Board of Directors is informed of the Group’s major market risks; in addition, it issues a recommendation on the most substantial proposed changes in terms of market risk measurement and framework (after prior approval by the CORISQ); this recommendation is then referred to the Board of Directors for a decision.
In addition to these committees, detailed and summary market risk reports, produced on a daily, weekly, monthly or quarterly basis, either related to various Group levels or geographic areas, are sent to the relevant business line and risk function managers.
In terms of valuation, market products are marked to market, when such market prices exist; otherwise, they are valued using parameter-based models.
On the one hand, each valuation model is independently validated by the Market Risk Department.
On the other hand, the parameters used in the valuation models, whether derived from observable market data or not, are checked by the Finance Division and MACC (Independent Pricing Verification), the sources of the parameters having been approved by the Market Risk Department beforehand. If necessary, the valuations obtained are supplemented by reserves or adjustments (such as bid-ask spreads and liquidity), based on computation methodologies approved by the Market Risk Department.
Accounting valuation governance is enforced through two valuation committees, both attended by representatives of the Global Markets Division, the Market Risk department and the Finance Division:
the Global Valuation Committee is convened whenever necessary, at least every quarter, to discuss and approve financial instrument valuation methodologies (model refinements, reserve methodologies, parameter marking methods, etc.). This committee, chaired by the Finance Division and organised by its valuation expert team (Valuation Group) has worldwide accountability with respect to the approval of the valuation policies concerning financial instruments on market activities;
on a quarterly basis, the Global Valuation Review Committee reviews changes in reserves, valuation adjustment figures, and related accounting impacts. This analytical review is performed by the Valuation Group;

4
RISK MANAGEMENT AND INTERNAL CONTROL MECHANISM
2 I 4 RRISK FACTORS AND CAP IITALL ADEQUACY
S O C I E T E G E N E R AL E G R O U P I 2018 REGISTRATION DOCUMENT I 155
lastly, a corpus of Valuation Policies describes the valuation framework and its governance, specifying the breakdown of responsibilities between the stakeholders.
Furthermore, Additional Valuation Adjustments (AVAs) are computed on fair value assets, in compliance with the Regulatory Technical Standards (RTS) published by the European Banking Authority (EBA), which lay out the requirements related to Prudent Valuation, in addition to the principles already specified in the CRD3 (Capital Requirements Directive). These regulatory technical standards define the various uncertainties which have to be taken into account in the Prudent Valuation, and set a target level of confidence to reach (the bank must be 90% confident that the transaction could be liquidated at a better price than the Prudent Valuation).
Within this framework, in order to take into account the various factors which could generate additional exit costs compared to the expected valuation (model risk, concentration risk, liquidation cost, uncertainty on market prices, etc.), Prudent Valuation Adjustments (PVAs) are computed for each exposure. The Additional Valuation Adjustments (AVAs) are defined as the difference between the Prudent Valuation obtained and the accounting fair value of the positions, in order to comply with the target level of confidence to reach. These amounts of AVA are deducted from the Common Equity Tier 1 capital.
In terms of governance, the topics related to Prudent Valuation are dealt with during methodological committees and validation committees, organised quarterly, and both attended by representatives of the Global Markets Division, the Market Risk department and the Finance Division.
OPERATIONAL RISKS The Operational Risk Department within the Group’s Risk Division provides the second line of defence relating to the Group’s operational risks, in consultation with the businesses. This includes risks related to information systems and Group information security, which is the responsibility of the Group’s Chief Information Security Officer, especially in terms of policy definition.
In particular, the Operational Risk Department is responsible for:
defining the framework for the management of operational risks that enables the identification, monitoring and reporting of these risks for all the Group’s businesses;
providing a critical view of the operational risk management system in place in the businesses and of the effective management of the risk.
The Operational Risk Department is also in charge of:
business continuity and crisis management, based on the identification of threats to the Group and their possible effects, while taking into account prevention, protection and deterrence actions;
regarding specifically operational risks related to information systems and information security:
– the critical review of risk management,
– the definition of standards carried out jointly with the information systems security sector.
To cover the entire Group, the Operational Risk Department relies on a central team and regional teams which provide the central team with the necessary information to consolidate a holistic and prospective vision of the Bank’s risk profile, both for internal steering requirements and to meet regulatory requirements.
RISK QUANTIFICATION PROCEDURES AND METHODOLOGIES
The Group has been authorised by its supervisory authorities:
for credit risk, to use the internal ratings-based approach (IRB method) for most of its exposures to credit risk.
Currently, the standard approach is used for certain selected activities and exposures. They have a limited impact on the Group’s regulatory capital. The system for monitoring rating models is operational, in accordance with applicable regulations. This system is described in detail further on in this Registration Document; for these exposures covered by the standard approach, Societe Generale mainly uses the external ratings assigned by Standard & Poor’s, Moody’s and Fitch Ratings.
for market risk, to use internal models (VaR – Value at Risk, Stressed VaR, IRC – Incremental Risk Charge, and CRM – Comprehensive Risk Measure).
These models cover almost all of the transactions involved. Only some transactions are still calculated using the standard method. Over the last several years, the Group has implemented significant improvements in its calculation system, which have been approved by the supervisory authorities:
for counterparty risk on market transactions, to use the internal model since 2013 to calculate the EEPE (Effective Expected Positive Exposure) indicator.
Exposure at Default (EAD) counterparty risk has been calculated on the basis of this indicator since June 2012 for “simple” products and since December 2013 for more complex derivative products. For Group entities where the internal model has been approved (a request for approval for the ex-Newedge scope will be considered in 2018), the internal model covers 96% of derivative and repo transactions. The Group uses the marked-to-market valuation method for the rest of these transactions.
for operational risks, to use the Advanced Measurement Approach (AMA).
Lastly, its information systems are regularly upgraded to accommodate changes in the products processed and the associated risk management techniques, both locally (within the banking entities) and centrally (Risk Division).

4 I 2
RISK MANAGEMENT AND INTERNAL CONTROL MECHANISM RRISK FACTORS AND CAPIITAL ADEQUACY
156 I 2018 REGISTRATION DOCUMENT I S O C I E T E G E N E R AL E G R O U P
Regional teams are responsible for fulfilling the Operational Risk Department’s tasks, taking into account the specific requirements of the regulatory authorities applicable in their region.
The Operational Risk Department exchanges with the first line of defence through a network of operational risk correspondents within each business. As first line of defence, the businesses are responsible for enforcing the system and implementing controls to ensure that risks are identified, analysed, measured, monitored, managed, reported and contained within the limits of the risk appetite defined by the Group. RISKS RELATED TO INFORMATION SYSTEMS
The management, monitoring and communication systems related to Information System Security and risks are coordinated at Group level by the Head of Information System Security and IT Risk Management within the Corporate Resources Division.
These systems can be grouped into four broad categories: awareness, prevention, detection and response. They are derived from best practices (mainly ISO 27002 and security standards of the French National Agency for Information System Security) and are subject to constant monitoring by the Information System Security function. They have been rolled out within each of the Group’s businesses.
At the operating level, the Group relies on a Computer Emergency Response Team that manages incidents, monitors developments in information system security and combats cybercrime using a multitude of information and supervision sources both internal and external to the Group.
The risk of cybercrime, which is increasingly significant for banks, is addressed in a cooperative way by the Information Systems Security and Operational Risk Departments and is monitored by General Management under the Information Security Master Plan.
Given the increasing number and sophistication of digital attacks, Societe Generale places cybersecurity at the heart of its concerns in order to protect its customers, their data and its information systems.
To meet these challenges, the Group guarantees data security and compliance with banking secrecy. It invests continuously to better protect the assets and transactions of its customers.
The information systems’ security strategy is aligned with that of the Group by acting on five areas:
the security of the Group’s sensitive applications;
the security of all customer, personal or banking data;
the Group’s detection and reaction capabilities;
reinforcing the security offered to customers (with robust but also user-friendly tools);
awareness and support of customers and employees.
All anti-cybercrime measures are based on prevention and protection, detection and response, and on raising awareness among customers and employees.
A central team is responsible for managing and monitoring IT operational risks. This team’s main responsibilities are to:
identify and evaluate the Group’s major IT risks, including extreme risk scenarios (e.g. cyber-attack, service provider failure) enabling the Bank to better understand its risks, be better prepared for extreme risk scenarios and better align its investments with its IT risks;
provide information enabling the Bank’s management to steer risks, in particular via Key Risk Indicators (KRIs). These are communicated to Societe Generale’s Risk Committee and to the Board of Directors’ Risk Committee. They are reviewed regularly to stay aligned with the IT and security strategy and their objectives;
more generally, ensure the quality and reliability of all devices addressing IT operational risks. Special attention is paid to the permanent control system for its IT risks, which is based on the definition of the IT Normative Control Library and the support of the Group in the deployment of IT managerial supervision. In 2017, a new version of the IT Normative Control Library was developed, taking into account the requirements of the General Data Protection Regulation.
MODEL RISKS A “Model Risk Management” (MRM) department was created within the Risk Division in 2017 to strengthen the second line of defence and the supervision of risk modelling. This department is responsible for supervising the model risk function and validating certain models that were previously validated in other departments.
The MRM department is mainly responsible for: governing model risk management at Group level: this
includes maintaining the standards and procedures required to ensure models are well managed and comply with regulations, as well as producing reports on the model risks incurred by the Group for General Management, the Board of Directors and the banking supervisory authorities;
managing the Model Risk Management programme, including the improvement of model risk management via three lines of defence;
supervising entities in charge of validating Group models in an independent manner, including valuation models for market positions and ALM models;
validating internal models within its scope in an independent manner, in particular regulatory internal models, decision-making models and IFRS 9 accounting models. The MRM department may perform any due diligence required by regulations in order to prepare independent reviews of all aspects of the models (design strength, implementation, usage, historical data, monitoring of models including backtesting). The scope of the models to be independently reviewed may be gradually expanded in line with the trajectory defined by the MRM programme.

4
RISK MANAGEMENT AND INTERNAL CONTROL MECHANISM
2 I 4 RRISK FACTORS AND CAP IITAL ADEQUACY
S O C I E T E G E N E R AL E G R O U P I 2018 REGISTRATION DOCUMENT I 157
COMPLIANCE RISKS The Group Compliance Division has, since 1st June 2017, reported to General Management. Accordingly, it has become a Corporate Division in its own right, just like the Risk Division and the Internal Audit Division.
The Compliance Division:
ensures that all laws, regulations and ethical principles applicable to the Group’s banking and investment services activities are observed, and that all staff respect codes of good conduct and individual compliance;
develops a homogeneous standardised framework and ensures compliance therewith;
organises awareness-raising and training for all stakeholders on the prevention of compliance and reputational risks;
ensures compliance with data protection regulations, which is a major consideration when developing new technologies and IT systems.
The Compliance Division is organised into departments dedicated to the Group’s businesses and into cross-business departments.
Four departments are dedicated to the businesses: (i) “Retail Banking and Financial Services”, (ii) “Global Banking and Investor Solutions”, (iii) “Private Banking” and (iv) “Insurance”, with a specially appointed manager reporting to the Head of the Compliance Division, except for the department dedicated to the Insurance business line, which reports to him functionally. Subsidiary compliance officers in France and abroad report to the business line compliance officers through a hierarchical or functional link, depending on the local regulations.
The cross-business departments are responsible for developing their skills and expertise across the Group:
“Group Financial Security” for Know your Customer (KYC) obligations, the anti-money laundering and countering terrorist financing (AML/CTF) mechanism, and compliance with embargoes and sanctions;
“Regulatory Expertise and Oversight” for updates to the function’s regulatory framework, awareness-raising and training of employees regarding compliance risks and the coordination of regulatory projects at Group level;
“Control” for the coordination and implementation of a permanent second-level compliance control system, oversight of personnel operations covered by a code of conduct, the Corporate Secretary of the Group Compliance Incidents Committee (CIC), and the production of Group dashboards (compliance and reputation);
“Global and strategic development” assists the Head of Group Compliance with respect to peer comparisons, the anticipation of and support with regulatory developments, and carrying out transformation and efficiency projects. In particular, it coordinates the Compliance function’s Compliance Transformation Programme (CTP) and monitors the United States remediation plan;
The “Data Protection Officer”, a position created in September 2017, ensures compliance with regulations on personal data protection.
On a monthly basis within the Group Compliance Incidents Committee (CIC), the Head of Group Compliance convenes the Deputy Head of Group Compliance, the Head of Group Financial Security, the Heads of Compliance dedicated to the businesses, the Head of Internal Control Coordination, the Chief Legal Officer, a General Inspection Officer, the Data Protection Officer, and the Head of Regulatory Expertise & Oversight. The Committee reviews the most significant compliance events over the period for the entire Group, decides upon the measures to be taken and monitors their implementation.
COMPENSATION POLICY AND RISK
Since the end of 2010, within the regulatory framework defined by the European Capital Requirements Directive (CRD3), Societe Generale has implemented a specific governance structure to determine variable compensation. In addition to financial markets professionals, the rules established by this Directive apply to all persons whose activity is likely to have a material impact on the risk profile of the institutions employing them, including those carrying out control functions.
According to the principles approved by the Board of Directors, based on the proposal of the Compensation Committee, the mechanisms and processes relating to the compensation of such employees take into account not only the financial result generated by the transactions they perform, but also the way in which this result is generated, through the control and management of all risks as well as the observance of risk and compliance policies. The compensation paid to employees performing control functions is independent of the results of the transactions they control, but is instead based on criteria specific to their activity.
The variable part of the compensation includes a non-deferred portion and a deferred portion awarded pro rata over three years subject to conditions of presence, performance and possible claw-back. Fifty per cent at least of this compensation is awarded in the form of shares or share-equivalents. These terms of payment aim to align compensation with the company’s performance and risk horizon.
The Risk Division and Compliance Division contribute to the definition and application of this policy.
The regulatory framework defined by European Directive CRD4 has been in force since 1st January 2014. It does not change the rules for determining the variable compensation of those persons whose activity is likely to have a material impact on the Group’s risk profile or of control function employees. The principles and governance described above remain applicable within the Group.
In addition, Societe Generale has set up a specific system and governance related to trading mandate-holders, intended to ensure that the remuneration policy complies with the requirements of the French Act of 26th July 2013 on the separation and regulation of banking activities and of the Volcker Rule.

4 I 2
RISK MANAGEMENT AND INTERNAL CONTROL MECHANISM RRISK FACTORS AND CAPIITAL ADEQUACY
158 I 2018 REGISTRATION DOCUMENT I S O C I E T E G E N E R AL E G R O U P
REPUTATIONAL RISKS
Every quarter, the Compliance Division, using information from the core businesses and Corporate Divisions, in particular the Human Resources and Communication Division, draws up a reputational risk dashboard. This dashboard is communicated quarterly to the members of the Compliance Committee and of the Board’s Risk Committee.
Moreover, the business line compliance officers are members of various bodies (new product committees, ad hoc committees, etc.) organised to approve new types of transactions, products, projects or clients, and must prepare a written statement on their assessment of the level of risk, especially reputational risk, involved in the initiative discussed.
RISK MAPPING FRAMEWORK AND STRESS TESTS
Group risk mapping framework The risk map is an annual overview of the Group’s risk identification process. Risk identification contributes to the overall assessment of the Group’s risk profile, and is used in various tasks such as the Internal Capital Adequacy Assessment Process (ICAAP). Prepared by the Risk Division under the authority of General Management, the risk map is presented annually to the Board of Directors’ Risk Committee.
The aim of this approach is to estimate potential material losses for the main types of risk to which the Group is exposed, including credit, market, operational and structural risks. The risk map matches potential losses to specific scenarios within defined scopes. The assessment combines expert analysis and various statistical approaches using historical data.
Stress tests Stress tests or crisis simulations are used to assess the potential impact of a downturn in activity on the behaviour of a portfolio, activity or entity. At Societe Generale, they are used to help identify, assess and manage risk, and to evaluate the Group’s capital adequacy with regard to risks. Accordingly, they are an important indicator of the Group’s resilience and that of its activities and portfolios, and a core component in the definition of its risk appetite. The Group’s stress test framework covers credit risk, market risk, operational risk, liquidity risk and structural interest rate and exchange rate risks.
Stress tests are based on extreme but plausible hypothetical economic scenarios defined by the Group’s economists. These scenarios are translated into impacts on the Group’s activities, taking into account potential countermeasures and systematically combining quantitative methods with an expert assessment (risk, finance or business lines).
As such, the stress test framework in place includes:
an annual global stress test, which is integrated into the budget process as part of preparing the Group Risk Appetite and ICAAP. It is used in particular to check the Group’s compliance with the prudential ratios. It covers all of the Group’s activities and is based on two global macroeconomic scenarios: a core budgetary macroeconomic scenario and a macroeconomic scenario of severe but plausible stress extrapolated on the basis of the core scenario. Each scenario is developed for a large number of countries or regions and
incorporates a series of economic and financial variables. Each global scenario is consistent on two levels: consistency between national scenarios and consistency of trends in national aggregates for each individual country;
specific credit stress tests (on portfolios, countries, activities, etc.), performed on a regular basis as well as on request, which complement the global analysis with a more granular approach and allow fine-tuning of the identification, assessment and operational management of risk, including credit risk concentration;
specific market stress tests, which estimate the loss resulting from an extreme change in market parameters (indexes, credit spreads, etc.). This stress test risk assessment is applied to all the Group’s market activities. It is based on a set of historical (3) and hypothetical (15) scenarios, which apply shocks to all substantial risk factors, including exotic parameters (see the “Market risks” section of this document);
operational risk stress tests, which use scenario analyses and the modelling of losses to calibrate the Group’s capital in terms of operational risk, and which are used to assess the exposure to operational losses linked to the severity of economic scenarios, including exposure to rare and extreme losses not covered by the historical period;
stress tests to analyse the Group’s structural fixed-rate position value and interest rate margin sensitivity to structural interest rate risk. The Group measures these sensitivities to different interest rate yield curve configurations (steepening and flattening);
liquidity stress tests to ensure that the time period over which the Group can continue to operate is respected in a stressed market environment;
and finally, reverse stress tests, which are conducted to evaluate scenarios that may result in certain key indicators reaching potentially critical thresholds, such as the minimum solvency level as defined within the Group’s risk appetite framework.
Along with the internal stress test exercises, the Group is part of a selection of European banks that participate in the large-scale international stress tests supervised by the European Banking Authority and European Central Bank.
Internal control is part of a strict regulatory framework applicable to all banking institutions.
body of standards and procedures
In particular, internal control aims to:

4
RISK MANAGEMENT AND INTERNAL CONTROL MECHANISM
2 I 4 RRISK FACTORS AND CAP IITAL ADEQUACY
S O C I E T E G E N E R AL E G R O U P I 2018 REGISTRATION DOCUMENT I 159
INTERNAL CONTROL
Framework IInternal control is part of a strict regulatory framework applicable tto all banking institutions.
In France, the conditions for conducting internal controls in banking institutions are defined in the Order of 3rd November 2014. This Order, which applies to all credit institutions and investment companies, defines the concept of internal control, together with a number of specific requirements relating to the assessment and management of the various risks inherent in the activities of the companies in question, and the procedures under which the supervisory body must assess and evaluate how the internal control is carried out.
The Basel Committee has defined four principles – independence, universality, impartiality, and sufficient resources – which must form the basis of internal control carried out by credit institutions.
Within the Societe Generale Group, these principles are applied primarily through directives, one of which establishes the general framework for the Group’s internal control, and another of which constitutes the Group Audit Charter, while the others relate to the management of credit risks, market risks, operational risks, structural interest rate, exchange rate and liquidity risks, compliance control and reputational risk control.
Control is based on a bbody of standards and procedures.
All Societe Generale Group activities are governed by rules and procedures covered by a set of documents referred to collectively as the “Normative Documentation”. This documentation includes any documents:
setting forth rules for action and behaviour applicable to Group staff;
defining the structures of the businesses and the sharing of roles and responsibilities;
describing the management rules and internal procedures specific to each business and activity.
The Normative Documentation primarily includes:
directives, which define the governance of the Societe Generale Group, the structures and duties of its core businesses and Corporate Divisions, as well as the operating principles of the cross-business systems and processes (Codes of Conduct, Charters, etc.);
guidelines, which set out the operating framework of an activity and the management principles and rules applicable to products and services rendered, and also define internal procedures.
The Normative Documentation has force of law within the Group. It falls under the responsibility of the Group Corporate Secretary.
In addition to the Normative Documentation, operating procedures specific to each Group activity are applied. The rules and procedures in force are designed to follow basic rules of internal control, such as:
segregation of functions;
immediate, irrevocable recording of all transactions;
reconciliation of information from various sources.
Multiple and evolving by nature, risks are present in all business processes. Risk management and control systems are therefore key to the Bank’s ability to meet its targets.
The internal control system is represented by all methods which ensure that the operations carried out and the organisation and procedures implemented comply with:
legal and regulatory provisions;
professional and ethical practices;
the internal rules and guidelines defined by the company’s executive body.
IIn particular, internal control aims to:
prevent malfunctions;
assess the risks involved, and exercise sufficient control to ensure they are managed;
ensure the adequacy and effectiveness of internal processes, particularly those which help safeguard assets;
detect irregularities;
guarantee the reliability, integrity and availability of financial and management information;
check the quality of information and communication systems.
DEFINITION OF “CORE” AND “STRESSED” ECONOMIC SCENARIOS
CCore scenario
It is developed on the basis of a series of observed factors, including the recent economic situation and trends in economic policy (budgetary, monetary, exchange rate policy). Based on these observed factors, economists determine the most likely trajectory for the economic and financial variables over a given time frame.
SStressed scenario
The stress scenario is intended to simulate a loss of business (based on real GDP figures) deviating from the core scenario, on a scale similar to that observed during a past “baseline” recession chosen for its severity. It is a systematic stress scenario, meaning it is constant in scale from one period to the next, whatever the trajectory forecast by the core scenario, as long as the baseline recession remains constant. The stress scenario is also generic, in that its triggering event is not specified. The impact of the stress scenario on the other economic and financial variables is determined by measuring its deviation from the core scenario.

4 I 2
RISK MANAGEMENT AND INTERNAL CONTROL MECHANISM RRISK FACTORS AND CAPIITAL ADEQUACY
160 I 2018 REGISTRATION DOCUMENT I S O C I E T E G E N E R AL E G R O U P
The internal control system is based on ffive basic principles:
the comprehensive scope of the controls, which cover all risk types and apply to all the Group’s entities;
the individual responsibility of each employee and each manager in managing the risks they take or supervise, and in overseeing the operations they handle or for which they are responsible;
the responsibility of functions, in line with their expertise and independence, in defining normative controls and, for three of them, exercising second-level permanent control;
the proportionality of the controls to the magnitude of the risks involved;
the independence of internal auditing.
The internal control system is organised according to the “tthree llines of defence” model in accordance with the texts of the Basel Committee:
The ffirst line of defence comprises all Group employees and operational management, both within the businesses and in corporate divisions (in the latter case, with respect to their own operations).
Operational management is responsible for risks, their prevention and their management – by putting in place first-level permanent control measures, among other things – as well as for implementing corrective or remedial actions in response to any failures identified by controls and/or process steering.
The ssecond line of defence is provided by the compliance, finance and risk functions.
Within the internal control framework, these functions are tasked with continuously verifying that the security and management of risks affecting operations are ensured, under the responsibility of operational management, through the effective application of established standards, defined procedures, methods and controls as instructed.
Accordingly, these functions must provide the necessary expertise to define, within their respective fields, the controls and other means of risk management to be implemented by the first line of defence, and to ensure that they are effectively implemented; they conduct second-level permanent control over all of the Group’s risks, employing the controls they have established or that have been established by other expert functions (e.g. sourcing, legal, tax, human resources, information system security, etc.) and by the businesses.
The tthird line of defence is provided by the Internal Audit Division, which encompasses the Internal Audit and General Inspection functions. This division carries out internal audits that are strictly independent of the business lines and the permanent control function.
IInternal control coordination, under the responsibility of a Deputy Chief Executive Officer, is also provided at Group level and is rolled out in each core business and Corporate Division.
GENERAL INSPECTION
AUDIT
1SST LINE OF DEFENCE
PPERMANENT CONTROL 1
2NND LLINE OF DEFENCE PPERMANENT CONTROL 2
RISK DDIVISION
COMPLIANCE DDIVISION
FINANCE DDIVISION
Businessees Entities
Independent Functions
IINTE
RN
AL C
ON
TRO
L CO
OR
DIN
ATIO
N
first-level permanent control
second-level permanent control
risk prevention systems
managerial supervision
second pair of eyes
control of controls

4
five basic principles
three lines of defence
first line of defence
second line of defence
third line of defence
Internal control coordination
GENERAL
1ST LINE OF DEFENCE
2ND LINE OF DEFENCE
RISK FINANCE
RISK MANAGEMENT AND INTERNAL CONTROL MECHANISM
2 I 4 RRISK FACTORS AND CAP IITAL ADEQUACY
S O C I E T E G E N E R AL E G R O U P I 2018 REGISTRATION DOCUMENT I 161
A Deputy Chief Executive Officer is responsible for ensuring the overall consistency and effectiveness of the internal control system. This Deputy Chief Executive Officer also chairs the Group Internal Control Coordination Committee (Group ICCC), which comprises the Chief Risk Officer, the Chief Financial Officer, the Group Chief Compliance Officer, the Group Chief Information Officer, the Head of Group Internal Audit, and the Head of Internal Control Coordination.
The Group Internal Control Coordination Committee met nine times in 2017. It addressed the following issues:
presentation of the tool aggregating and providing risk and control information;
presentation of the enterprise architecture study on the control and risk management system;
progress in placing Group processes under control and supervision;
system for following up on outsourced essential services;
quarterly results of the permanent control of the IS & ISS function;
assessment of the implementation of the Group’s principles on internal sanctions;
changes in Normative Documentation;
changes in the Risk function;
annual review of the Risk Division;
cybercrime risk and control;
IT production risk and control;
Private Banking review;
French Retail Banking (RBDF) review.
The structure implemented at Group level to coordinate the actions of participants in internal control is rolled out in all business divisions and Corporate Divisions. All of the Group’s business divisions and Corporate Divisions have an Internal Control Coordination Committee. Chaired by the Head of the business division or Corporate Division, these Committees bring together the competent Heads of Internal Audit and Permanent Control for the business division or Corporate Division in question, as well as the Head of Group Internal Control Coordination and the Heads of the Group-level control functions.
Permanent control system The Group’s permanent control system comprises:
ffirst--llevel permanent control, under the responsibility of the businesses, which aims to ensure, at the operational level, the security, quality, regularity and validity of transactions completed.
ssecond--llevel permanent control, independent from the businesses, comes under three Corporate Divisions (Compliance, Risk and Finance Division).
The Group defined the target organisation for the second-level control framework within the major International Retail Banking subsidiaries, creating a single team shared between the finance, risk and compliance functions.
FIRST-LEVEL PERMANENT CONTROL Performed as part of operations, within the businesses and corporate divisions, first-level permanent control guarantees the security and quality of transactions and operations.
First-level permanent control consists of:
rrisk prevention systems: these are security rules and controls – automated or otherwise – included in the processing of operations, or local controls included in operating procedures (the set of mechanisms that make up “operational controls”);
mmanagerial supervision: line managers check the correct operation of systems under their responsibility. Managerial supervision controls that have been formalised mainly relate to the adaptation of key controls from among the library of normative controls. Managerial supervision may be based on controls carried out by dedicated teams, e.g. on the most sensitive processes requiring stricter or automated controls, or to avoid self-controlling practices, and/or where the sharing of control tasks improves productivity.
Whatever the choice of organisation, managers retain oversight of the processes carried out by the teams that report to them; they are responsible for their production quality and for correcting identified anomalies.
A “first-level permanent control coordination” function is set up in each business line. It is responsible for the design and reporting of controls, as well as awareness-raising and training of employees with respect to control issues.
SECOND-LEVEL PERMANENT CONTROL Second-level permanent control is one of the missions of the second line of defence. It involves ensuring the security and risk management of operations at all times, under the responsibility of operational management, through the effective application of established standards, defined procedures, methods and controls, as instructed.
The second line of defence fulfils this role in two different ways:
either through independent and formal “ssecond pair of eyes” controls: for example, the independent review of credit files above a certain threshold, the independent review of limit breaches, or the independent validation of the calculation models used in risk management.
These “second pair of eyes” controls also satisfy an additional objective of the second line of defence, namely to provide an independent opinion on the most significant risk-taking decisions, and to provide expertise in the area of risk-taking;
or through a “ccontrol of controls” to verify the suitability of the controls and the effectiveness and quality of first-level permanent control through the review of managerial supervision and operational controls (selective controls and/or sampling), and to detect any anomalies in the exercise of first-level controls and ensure appropriate follow-up through the first line of defence. These assessments are conducted based on sampling, through documentary controls and on-site testing.

4 I 2
RISK MANAGEMENT AND INTERNAL CONTROL MECHANISM RRISK FACTORS AND CAPIITAL ADEQUACY
162 I 2018 REGISTRATION DOCUMENT I S O C I E T E G E N E R AL E G R O U P
This review results in the formulation, by second-level control teams, of a qualified opinion on the effectiveness of first-level controls for the scope considered.
Second-level permanent control within the Group is exercised by teams reporting to the Corporate Divisions responsible for the following functions:
the Risk function, with regard to credit and market risks, structural risks and operational risks. The latter include risks which are specific to the different businesses (particularly fraud), as well as risks relating to sourcing, communication, real estate, human resources and IT processes and systems;
the Finance function, with regard to the quality of accounting, regulatory and financial information;
the Compliance function, where the second-level control concerns compliance controls, including legal and tax controls other than those of an accounting or operational nature.
Internal audit Reporting to the Group Head of Inspection and Audit, the Inspection and Audit Service Unit (IGAD) is the Group’s third line of defence.
The IGAD Service Unit comprises General Inspection (IGAD/INS), Internal Audit departments (IGAD/AUD) and a support function (IGAD/COO). To fulfil its mandate, the Group’s IGAD Service Unit has adequate resources from a qualitative and quantitative point of view. The Group’s Inspection and Audit Service Unit has about 1,200 employees.
The General Inspection, which reports to a “college” of Inspection Managing Directors (“inspecteurs principaux”), performs the verification tasks set out in the annual plan, while also conducting any studies or analyses required by General Management. It may be involved in the assessment of strategic projects. The General Inspection also supervises the roll-out of data-analysis initiatives within the scope of Inspection and Audit activities. This mission is carried out by a dedicated datalab (INS/DAT) under the responsibility of an Inspection Managing Director. The General Inspection also supervises and coordinates the Service Unit’s relationship with regulators as third line of defence.
Audit departments, supervised by an internal audit officer, each cover a designated scope of activity. A matrix organisation covers the main cross-disciplinary issues within the Group.
The COO function is in charge of the division’s financial and operational steering. IGAD/COO carries out this role by providing various teams with financial and business reports and by conducting inspections on behalf of the Group Head of Inspection and Audit.
As the third line of defence, General Inspection and Internal Audit performs independent audits of the Group’s operating entities, carried out in an objective, thorough and impartial manner in line with professional standards. IGAD covers all Group entities and activities and may focus on any aspect of their operations, without restriction. As part of its missions, IGAD verifies the compliance of transactions carried out, the level of risk actually incurred, the
proper application of procedures, and the effectiveness and appropriate nature of the Group’s permanent control system. IGAD also evaluates the risk awareness of the audited entity’s management and assesses compliance with the Group’s rules of conduct and expected professional practices.
In France, Internal Audit teams report hierarchically to the Group Head of inspection and Audit. Internal Audit teams based in the Group’s overseas affiliates or branches have a strong functional reporting link (control over recruitments, audit plans, audit assignments and monitoring) to IGAD management.
In order to fulfil IGAD’s mandate, General Inspection and Internal Audit teams work together on the annual risk assessment in order to define the intervention plan for the upcoming year. IGAD teams regularly work together on joint assignments. They issue recommendations to correct flaws identified in risk management and generally improve operations and risk management within the Group. IGAD teams are subsequently in charge of monitoring the effective implementation of these recommendations.
IGAD comprises six distinct Audit departments aligned with the Group’s organisation:
French Retail Banking Audit handles the audit of French Retail Banking activities (BDDF Business Unit), the audit of the Boursorama and GTPS Business Units as well as the audit of the Group’s activities in French Overseas territories;
Crédit du Nord Inspection is responsible for the internal audit of Crédit du Nord and its subsidiaries (CDN Business Unit);
Audit for Europe, Russia, Africa – International Retail Banking and Financial Services is responsible for auditing the EURO, AFMO, RUSS, ALDA, SGEF and ASSU Business Units and the IRBS Service Unit;
Global Banking and Investor Solutions Audit is responsible, on a worldwide basis, for auditing the MARK, GLFI, SGSS, WAAM, CORI, AMER and ASIA Business Units and the GBS Service Unit. This department also audits the Group’s Shared Service Centres (SG EBS and SG GSC);
Group Information Systems Audit is responsible for auditing all IT functions within the RESG, GBS and IRBS Service Units and for auditing the ITM Service Unit.
The IT audit teams are organised as a global function with strong expertise on IT security and the ability to interact with all teams within IGAD;
Group functions audit is responsible for auditing the RISQ, DFIN, CPLE, SEGL and DRHG/COMM Service Units, as well as the Purchasing (ACHA) and Real estate (IMM) functions of the RESG Service Unit. Model audit teams are based within that department and may work in close cooperation with other Audit and Inspection teams.
Besides being responsible for the internal audit of the divisions falling within their scope, these teams also provide expertise and coordination in support of the work performed by other audit teams in the areas applicable to them, in particular on issues related to Risk, Compliance and Finance.
Board of Directors
Group Finance Division
Finance Divisions of subsidiaries and core businesses
Risk Division
back offices

4
RISK MANAGEMENT AND INTERNAL CONTROL MECHANISM
2 I 4 RRISK FACTORS AND CAP IITAL ADEQUACY
S O C I E T E G E N E R AL E G R O U P I 2018 REGISTRATION DOCUMENT I 163
The Group Head of Inspection and Audit reports directly to the Group’s Chief Executive Officer, with whom he has regular meetings. The Group Head of Inspection and Audit participates in General Management Committees, chaired by the Chief Executive Officer, in his areas of expertise.
The Group Head of Inspection and Audit meets with the Chairman of the Board of Directors on a regular basis, as well as with the chairpersons of the Audit and Internal Control Committee and Risk Committee respectively. He attends these committees in line with Articles 10 and 11 of the Internal Rules of the Board of Directors.
On a regular basis, the Group Head of Inspection and Audit informs the Group’s General Management as well as the Audit and Internal Control Committee of the main findings of IGAD’s audits in order to provide an overview of risk management within the Group and the status of implementation of recommendations. IGAD also reports on the completion of the annual intervention plan. The annual intervention plan is approved by General Management and presented to the Audit and Internal Control Committee for validation once a year.
In all subsidiaries and countries where the Group is present, the local Head of IGAD is in regular contact with the Head of the local Group entity, members of the Audit Committees and local regulators in line with the rules and regulations applicable locally. IGAD is represented in the Internal Control Coordination Committees and Audit Committees at various Group levels.
Lastly, the Group Head of Inspection and Audit also presents the internal audit section of the Annual Report on Internal Control to the Audit and Internal Control Committee, as required by the provisions of the Order of 3rd November 2014.
The Group Head of Inspection and Audit is also in regular contact with the Group’s Statutory Auditors.
IGAD also has regular discussions with regulators in its areas of expertise. At their request, IGAD provides the European Central Bank (ECB) and the French Prudential Supervisory and Resolution Authority (Autorité de Contrôle Prudentiel et de Résolution – ACPR) with reports on the completion of its work, the main findings of its audits and the monitored implementation of recommendations. The audit plan is presented annually to the ECB and ACPR.
CONTROL OF THE PRODUCTION AND PUBLICATION OF FINANCIAL AND MANAGEMENT INFORMATION
The players involved There are many participants in the production of financial data:
the BBoard of Directors, and more specifically its Audit and Internal Control Committee, has the task of examining the draft financial statements which are to be submitted to the Board, as well as verifying the conditions under which they were prepared and ensuring not only the relevance but also the consistency of the accounting principles and methods applied. There has been a strengthening of the Audit and Internal Control Committee’s role in the follow-up of the process of preparing the financial information in accordance with the audit reform. It also approves the Group’s financial communication. The Statutory Auditors meet with the Audit and Internal Control Committee during the course of their assignment;
the GGroup Finance Division gathers all accounting and management data compiled by the subsidiaries and core businesses in a series of standardised reports. It consolidates and verifies this information so that it can be used in the Group’s overall management and disclosed to third parties (supervisory bodies, investors, etc.).
The Group Finance Division also has a team in charge of the preparation of the Group regulatory reports;
the FFinance Divisions of subsidiaries and core businesses carry out certification of the accounting data and entries booked by the back offices, and of the management data submitted by the front offices. They are accountable for the financial statements and regulatory information required at the local level and submit reports (accounting data, finance control, regulatory reports, etc.) to the Group Finance Division. They can perform these activities on their own or else delegate their tasks to Shared Service Centres operating in finance and placed under Group Finance Division governance;
the RRisk Division consolidates the risk monitoring data from the Group’s core businesses and subsidiaries in order to control credit, market and operational risks. This information is used in Group communications to the Group’s governing bodies and to third parties. Furthermore, in collaboration with
the Group Finance Division, the Risk Division is responsible for the Basel 3 approval process, including producing solvency ratios;
the bback offices are responsible for all support functions to front offices and ensure contractual settlements and deliveries. Among other responsibilities, they check that financial transactions are economically justified, book transactions and manage means of payment.
Beyond consolidating accounting and financial information as described above, the Group Finance Division is charged with significant control responsibilities:
monitoring the financial aspects of the Group’s capital transactions and its financial structure;
managing its assets and liabilities, and consequently defining, managing and controlling the Group’s financial position and structural risks;
ensuring that the regulatory financial ratios are respected;
defining accounting standards, frameworks, principles and procedures for the Group, and ensuring that they are observed;
verifying the accuracy of all financial and accounting data published by the Group.
Accounting and regulatory standards Local financial statements are drawn up in accordance with local accounting standards, and the consolidated Group financial statements are prepared in accordance with the standards defined by the Group Finance Division, which are based on IFRS as adopted by the European Union.
The applicable standards on solvency and liquidity, promulgated by the Basel Committee, were translated into European law by a directive (CRD4) and a regulation (CRR), which entered into force on 1st January 2014. Since then, several delegated and implementing acts have clarified the CRD4/CRR. Lastly, since the Societe Generale Group is considered a “financial conglomerate”, it is subject to additional supervision.
4 I 2
RISK MANAGEMENT AND INTERNAL CONTROL MECHANISM RRISK FACTORS AND CAPIITAL ADEQUACY
164 I 2018 REGISTRATION DOCUMENT I S O C I E T E G E N E R AL E G R O U P
The Group Finance Division has dedicated teams that monitor the applicable normative regulations and draft new internal standards to comply with any changes in the accounting and regulatory framework.
Procedures for producing financial and accounting data Each Group entity prepares its own accounting and management statements on a monthly basis. This information is then consolidated each month at the Group level and published for the markets on a quarterly basis. Data reported are subject to analytical reviews and consistency checks performed by core business Finance Departments or, by delegation under their responsibility, by Shared Service Centres operating in finance, and sent to the Group Finance Division. The Group Finance Division transmits the consolidated financial statements, management reports and regulatory statements to General Management and any interested third parties.
In practice, procedures have been tailored to the growing complexity of products and regulations. Moreover, specific action plans for adaptation can be implemented where necessary.
Internal control procedures governing the production of financial and accounting data Accounting data are compiled independently of the front offices and the sales teams.
The separation of sales functions and all operational processing and operational monitoring functions ensures the quality and objectivity of the accounting and management data. As such, back offices and middle offices are integrated into the Resources Division, and the teams monitoring the production of results are integrated into the Finance Division. These teams carry out a series of controls defined by Group procedures on financial and accounting data, in particular:
daily verification of the economic reality of all information reported;
reconciliation of accounting data with management data, within the specified deadlines using specific procedures;
in market activities, reconciliation of the accounting result (produced by the Finance Division) with the daily economic result (produced by a department of dedicated experts within the Resource Division).
Given the increasing complexity of the Group’s financial activities and organisation, staff training and IT tools are regularly upgraded to ensure that the production and verification of accounting and management data are effective and reliable.
SCOPE OF CONTROL In practice, the internal control procedures implemented in the Group’s businesses are designed to guarantee the quality of financial and accounting information, and notably to:
ensure that the transactions entered in the Group’s accounts are exhaustive and accurate;
validate the valuation methods used for certain transactions;
ensure that the transactions are correctly assigned to the corresponding fiscal period and recorded in the accounts in accordance with the applicable accounting regulations, and that the accounting aggregates used to prepare the Group financial statements are compliant with the regulations in force;
ensure the inclusion of all entities that must be consolidated in accordance with Group regulations;
check that the operational risks associated with the production and transmission of accounting data through the IT system are correctly controlled, that the necessary adjustments are accurately performed, that the reconciliation of accounting and management data is satisfactory, and that the flows of cash payments and other items generated by transactions are exhaustive and adequate.
CONTROL BY THE FINANCE DEPARTMENTS OF CORE BUSINESSES The Finance Department of each subsidiary verifies the accuracy and consistency of the financial statements prepared in accordance with the relevant accounting frameworks (local standards and IFRS for subsidiaries, as well as French standards for branches). It performs checks to guarantee the accuracy of the information disclosed.
The data received for consolidation from each subsidiary are drawn from corporate accounting data by the subsidiaries, after they have been locally brought into compliance with Group accounting principles.
Each subsidiary must be able to explain the transition from the company financial statements to the financial statements reported through the consolidation tool.
The Finance Departments of the core businesses also help to ensure the quality and accuracy of financial statements falling within their scope of activity. As such, their main assignments in terms of accounting control are:
to ensure each data producer has adequate resources in view of the challenges involved;
to supervise the implementation of audit recommendations and the progress of the associated action plans;
to define the procedures for implementing key controls and to certify their results on a quarterly basis.

4
RISK MANAGEMENT AND INTERNAL CONTROL MECHANISM
2 I 4 RRISK FACTORS AND CAP IITAL ADEQUACY
S O C I E T E G E N E R AL E G R O U P I 2018 REGISTRATION DOCUMENT I 165
CONTROL BY THE SHARED SERVICE CENTRES OPERATING IN FINANCE Shared Service Centres operating in finance perform first-level controls, as necessary to ensure the reliability of the accounting, tax and regulatory information, on the financial statements they produce in accordance with French and IFRS standards:
data quality and consistency checks (equity, securities, foreign exchange, financial aggregates from the balance sheet and income statement, deviations from standards);
justification and certification of the financial statements under their responsibility;
intercompany reconciliation of the financial statements;
regulatory statement checks;
verification of evidence of tax charges and balances (current, deferred and duties).
These controls are declared within the managerial supervision and Group accounting certification processes.
The Shared Service Centres have also implemented a process monitoring approach, which consists in:
monitoring the teams’ work and progress according to the various milestones in order to ensure smooth operations, anticipate any delays and prioritise tasks;
communicating on incidents affecting the preparation of the financial statements, in order to issue warnings, coordinate and monitor the corrective action plans;
key indicators: monitoring deadlines and the quality of accounting, regulatory and tax reports; manual entries; internal/intercompany/cash gaps;
follow-up of action plans.
These controls allow the Shared Service Centres to provide all necessary information to the Finance Departments of core businesses and the Group Finance and Accounting Division.
SUPERVISION BY THE GROUP FINANCE DIVISION Once the financial statements produced by the entities have been restated according to Group standards, they are entered into a central database and processed to produce the consolidated statements.
The department in charge of consolidation checks that the consolidation scope is compliant with the applicable accounting standards and performs multiple verifications on data received for consolidation. These verifications include:
confirmation that the data collected are properly aggregated;
verification of recurring and non-recurring consolidation entries;
exhaustive treatment of critical points in the consolidation process;
treatment of any residual differences in reciprocal or intercompany statements.
Accounting audit system
CONTROLS BY ALL OPERATIONAL STAFF INVOLVED IN THE PRODUCTION OF ACCOUNTING, FINANCIAL AND MANAGEMENT DATA The operational staff monitors their activity via a permanent supervision process, under the direct responsibility of their management teams, repeatedly verifying the quality of the controls carried out on accounting data and the associated accounting treatment.
CONTROLS THROUGH AUDITS AND SPECIALISED AUDIT TEAMS OF THE INTERNAL AUDIT DIVISION As part of their assignments, audit teams verify the quality of the control environment contributing to the quality of the accounting and management data produced by the audited entities. They check a certain number of accounts and assess the reconciliations between accounting and management data, as well as the quality of the permanent supervision procedures for the production and control of accounting data. They also assess the performance of IT tools and the accuracy of manual processing.
Within IGAD, a dedicated team is responsible for auditing the Finance Division and the finance function. Reporting to a dedicated business correspondent, this team coordinates and monitors all audits related to accounting and financial matters on a Group-wide basis. It provides expertise in identifying the Group’s main accounting risks and carries out audits to verify the adequate application of accounting standards in areas deemed to be the most significant for the accuracy of the Group’s accounting information. The team also organises training sessions and develops methodologies to help share expertise in the auditing of accounting risks.
Based on their audit findings, these teams issue recommendations to the parties involved in the production and control of accounting, financial and management data in order to improve this process through more specific initiatives targeted towards particular entities or activities.
CONTROL BY THE GENERAL INSPECTION DEPARTMENT The Group’s General Inspection teams typically perform accounting audits as part of their assignments, and thus check the quality of the controls carried out by the persons involved in producing accounting, financial and management data.

4 I 3
CAPITAL MANAGEMENT AND ADEQUACY RRISK FACTORS AND CAPIITAL ADEQUACY
166 I 2018 REGISTRATION DOCUMENT I S O C I E T E G E N E R AL E G R O U P
PREVENTATIVE RECOVERY PLAN AND DATA COLLECTION FOR RESOLUTION
The recovery plan and data collection for resolution plan arise from a European regulatory requirement adopted in 2014 (Bank Recovery and Resolution Directive).
Prepared by the Bank, the Group’s recovery plan strengthens its resilience by describing as a preventative measure the provisions that would allow it to face a major crisis independently. The plan includes all the elements necessary for the effective management of a severe financial crisis: vigilance and warning system, crisis management plan, crisis communication, and a list of recovery options which, depending on the case, would restore a healthy financial situation. Societe Generale’s recovery plan is assessed by the European Central Bank.
The data collection prepared by Societe Generale for the development of the resolution plan includes the information required by the resolution authority (the Single Resolution Board for Societe Generale) to enable it to maintain the resolution plan. It must include strategies and actions that could be undertaken should the Bank default, in order to protect critical functions (essential to the economy), starting for example with deposits and means of payment, while also safeguarding the value of the Group’s various components as far as possible, and limiting the final losses borne by investors and shareholders.
Strictly confidential, the recovery plan, the data collection and the resolution plan are regularly supplemented to reflect changes in applicable regulations and the work of authorities.
3. CAPITAL MANAGEMENT AND ADEQUACY
THE REGULATORY FRAMEWORK Audited I Since January 2014, Societe Generale has been applying the new Basel 3 regulation implemented in the European Union via a directive (CRD4) and a regulation (CRR). Some of the provisions will become effective over a period continuing until at least 2019.
The general framework defined by Basel 3 is structured around three pillars:
Pillar 1 sets the minimum solvency requirements and defines the rules that banks must use to measure risks and calculate the related capital requirements, according to standard or more advanced methods;
Pillar 2 concerns the discretionary supervision implemented by the competent authority, which allows them – based on a constant dialogue with supervised credit institutions – to assess the adequacy of capital requirements as calculated under Pillar 1, and to calibrate additional capital requirements taking into account all the risks to which these institutions are exposed;
Pillar 3 encourages market discipline by developing a set of qualitative or quantitative disclosure requirements which will allow market participants to better assess a given institution’s capital, risk exposure, risk assessment processes and, accordingly, capital adequacy.
In terms of capital, the main new measures introduced to strengthen banks’ solvency were as follows:
the complete revision and harmonisation of the definition of capital, in particular with the amendment of the deduction rules, the definition of a standardised Common Equity Tier 1 (or CET1) ratio, and new Tier 1 capital eligibility criteria for hybrid securities;
new capital requirements for the counterparty risk of market transactions, to factor in the risk of a change in CVA (Credit Value Adjustment) and to hedge exposures on the central counterparties (CCP);
the set-up of capital buffers that can be mobilised to absorb losses in case of difficulties. The new rules require banks to create a conservation buffer and a countercyclical buffer to preserve their solvency in the event of adverse conditions. Moreover, an additional buffer is required for systemically important banks. As such, the Societe Generale Group, as a global systemically important bank (G-SIB), has had its Common Equity Tier 1 ratio requirement increased by an additional 1%. Requirements related to capital buffers gradually entered into force as from 1st January 2016, for full application by January 2019;
the set-up of restrictions on distributions, relating to dividends, AT1 instruments and variable remuneration;
in addition to these measures, there will be measures to contain the size and, consequently, the use of excessive leverage. To this end, the Basel Committee has defined a leverage ratio, for which the definitive regulations were published in January 2014, and included in the Commission’s Delegated Regulation (EU) 2015/62. The leverage ratio compares the bank’s Tier 1 capital to the balance sheet and off-balance sheet items, with restatements for derivatives and pensions. Banks have been required to publish this ratio since 2015.
In December 2017, the Basel Committee’s oversight body, the Group of Central Bank Governors and Heads of Supervision (GHOS), endorsed the ongoing Basel 3 regulatory reforms, implemented in 2009. These new rules will take effect from 2022 with an overall output floor: the RWA of the bank will be floored to a percentage of the standard method (credit, market and operational). The output floor level will increase gradually, from 50% in 2022 to 72.5% in 2027. Nevertheless, these rules will have to be transposed into European law (CRR3/CRD6) to be applicable to the Group. The timeline is therefore likely to change.

4
CAPITAL MANAGEMENT AND ADEQUACY
3 I 4 RRISK FACTORS AND CAP IITAL ADEQUACY
S O C I E T E G E N E R AL E G R O U P I 2018 REGISTRATION DOCUMENT I 167
The Basel Committee has also pushed back to 1st January 2022 the planned implementation date of the revised minimum capital requirements regarding market risk, which were initially set for implementation in 2019.
Furthermore, on 23rd November 2016 the Commission published its draft CRR2/CRD5 text. Most of the provisions will enter into force two years after the CRR2 becomes effective. Depending on the Trilogue, this may not happen before 2019 at the earliest. The final provisions will only be known following the European legislative procedure. Accordingly, the texts are likely to change.
The new provisions concern the following:
NSFR: new Basel provisions on the stable funding ratio;
Leverage ratio: the 3% minimum requirement will be included in the CRR;
Market risk reform – FRTB;
Counterparty derivatives risk (SA-CCR): the SA-CCR method
is the Basel method replacing the current “CEM” method to calculate the prudential exposure to derivatives using the standardised approach;
Large exposures: the main change concerns the calculation of the Tier 1 regulatory limit (25%, instead of total capital), as well as the introduction of a cross-specific limit on systemic institutions (15%).
Lastly, the European Central Bank has confirmed the level of additional capital requirements in respect of Pillar 2 (P2R or “Pillar 2 Requirement”), effective as from 1st January 2017. This level was set at 1.50% for Societe Generale.
Detailed information on the G-SIB requirements and other prudential information is available on the Group’s website, www.societegenerale.com, under “Registration Document” and “Pillar 3”.
Throughout 2017, the Societe Generale Group complied with the minimum ratio requirements applicable to its activities.
SCOPE OF APPLICATION – PRUDENTIAL SCOPE The Group’s prudential reporting scope includes all fully and proportionally consolidated subsidiaries, with the exception of insurance subsidiaries, which are subject to separate capital supervision.
All of the Group’s regulated subsidiaries comply with their prudential commitments on an individual basis.
Non-regulated subsidiaries outside of the scope of consolidation are subject to periodic reviews, at least annually. Any differences with respect to legal capital requirements are adequately provisioned in the Group’s consolidated financial statements.
TABLE 1: DIFFERENCE BETWEEN ACCOUNTING SCOPE AND PRUDENTIAL REPORTING SCOPE
The following table provides the main differences between the accounting scope (consolidated Group) and the prudential scope (banking regulation requirements).
Type of entity Accounting treatment Prudential treatment under CRR/CRD4
Subsidiaries with a financial activity Full consolidation Capital requirement based on the subsidiary’s activities
Subsidiaries with an insurance activity Full consolidation Weighted equity value
Holdings, joint ventures with a financial activity by nature Equity method Weighted equity value
The following table provides a reconciliation of the consolidated balance sheet and the accounting balance sheet within the prudential scope. The amounts presented are accounting data and not a measure of risk-weighted assets, EAD or prudential capital. Prudential filters related to subsidiaries and holdings not associated with an insurance activity are grouped together on account of their non-material weight (<0.2%).

4 I 3
CAPITAL MANAGEMENT AND ADEQUACY RRISK FACTORS AND CAPIITAL ADEQUACY
168 I 2018 REGISTRATION DOCUMENT I S O C I E T E G E N E R AL E G R O U P
TABLE 2: RECONCILIATION OF THE CONSOLIDATED BALANCE SHEET AND THE ACCOUNTING BALANCE SHEET
ASSETS at 31.12.2017 (In EUR m)
Consolidated balance sheet
Prudential restatements
linked to insurance(1)
Prudential restatements linked
to consolidation methods
Accounting balance sheet
within the prudential scope
Cash and amounts due from central banks 114,404 0 0 114,404
Financial assets at fair value through profit and loss 419,680 (46,889) 0 372,791
Hedging derivatives 13,641 (399) 0 13,242
Available-for-sale assets 139,998 (84,706) 0 55,292
Loans and advances to credit institutions 60,866 (7,104) 209 53,971
o.w. subordinated loans to credit institutions 133 0 0 133
Loans and advances to clients 395,587 1,136 15 396,738
Lease financing and equivalent transactions 29,644 0 0 29,644
Revaluation of macro-hedged items 663 0 0 663
Financial assets held to maturity 3,563 0 0 3,563
Tax assets 6,001 (112) 0 5,889 o.w. deferred tax assets that rely on future profitability excluding those arising from temporary differences
2,970 0 (803) 2,167
o.w. deferred tax assets arising from temporary differences 1,795 0 712 2,507
Other assets 60,562 (2,466) 80 58,176
o.w. defined benefit pension fund assets 84 0 0 84
Non-current assets held for sale 13 0 0 13 Investments in subsidiaries and affiliates accounted for by the equity method
700 3,952 (64) 4,588
Tangible and intangible assets 24,818 (767) 0 24,051
o.w. intangible assets exclusive of leasing rights 1,940 0 (129) 1,811
Goodwill 4,988 (325) 0 4,663
Total aassets 1,275,128 (137,680) 240 1,137,688
LIABILITIES at 31.12.2017 (In EUR m)
Consolidated balance sheet
Prudential restatements
linked to insurance(1)
Prudential restatements linked
to consolidation methods
Accounting balance sheet
within the prudential scope
Central banks 5,604 0 0 5,604
Liabilities at fair value through profit or loss 368,705 1,439 0 370,144
Hedging derivatives 6,750 17 0 6,767
Amounts owed to credit institutions 88,621 (3,916) (14) 84,691
Amounts owed to clients 410,633 1,807 120 412,560 Debt securities 103,235 1,608 0 104,843 Revaluation reserve of interest-rate-hedged portfolios 6,020 0 0 6,020 Tax liabilities 1,662 (373) 0 1,289 Other liabilities 69,139 (6,445) 134 62,828 Debts related to non-current assets held for sale 0 0 0 0 Technical provisions of insurance companies 130,958 (130,958) 0 0 Provisions 6,117 (16) 0 6,101 Subordinated debts 13,647 208 0 13,855
o.w. redeemable subordinated notes including revaluation differences on hedging items 13,095 204 0 13,299
Total debts 1,211,091 (136,629) 240 1,074,702
Equity
Equity, Group share 59,373 (203) 0 59,170 o.w. capital and related reserves 19,995 0 0 19,995 o.w. other capital instruments 8,565 0 0 8,565 o.w. retained earnings 5,280 0 0 5,280 o.w. accumulated other comprehensive income (including gains and losses accounted directly in equity)
22,727 0 22,727
o.w. net income 2,806 (203) 0 2,603
Minority interests 4,664 (848) 0 3,816
Total equity 64,037 (1,051) 0 62,986
Total lliabilities 1,275,128 (137,680) 240 1,137,688
(1) Restatement of subsidiaries excluded from the prudential scope and reconsolidation of intragroup transactions related to its subsidiaries.

4
CAPITAL MANAGEMENT AND ADEQUACY
3 I 4 RRISK FACTORS AND CAP IITAL ADEQUACY
S O C I E T E G E N E R AL E G R O U P I 2018 REGISTRATION DOCUMENT I 169
ASSETS at 31.12.2016 (In EUR m)
Consolidatedbalance sheet
Adjustments linkedto insurance(1)
Other adjustmentslinked to consolidation
methods
Accounting balance sheet within the
prudential scope
Cash and amounts due from central banks 96,186 (0) 0 96,186
Financial assets at fair value through profit and loss** 500,215 (32,264) 48 467,999
Hedging derivatives 18,100 (428) - 17,672
Available-for-sale assets 139,404 (75,302) 26 64,128
Loans and advances to credit institutions 59,502 (7,342) 453 52,613
o.w. subordinated loans to credit institutions 157 - - 157
Loans and advances to clients 397,643 897 0 398,540
Lease financing and equivalent transactions 28,858 - - 28,858
Revaluation of macro-hedged items 1,078 - - 1,078
Financial assets held to maturity 3,912 - - 3,912
Tax assets 6,421 (37) 2 6,386 o.w. deferred tax assets that rely on future profitability excluding those arising from temporary differences*
3,083 - (878) 2,205
o.w. deferred tax assets arising from temporary differences* 2,247 - 853 3,100
Other assets** 71,437 (622) (4) 70,811 o.w. defined benefit pension fund assets 59 - - 59
Non-current assets held for sale 4,252 - - 4,252 Investments in subsidiaries and affiliates accounted for by the equity method 1,096 3,457 (125) 4,428
Tangible and intangible assets 21,783 (664) 1 21,120
o.w. intangible assets exclusive of leasing rights 1,717 - (72) 1,645
Goodwill 4,535 - 4 4,539
Total aassets 1,354,422 (1112,305) 405 1,242,522
LIABILITIES at 31.12.2016 (In EUR m)
Consolidated balance sheet
Adjustmentslinked to
insurance(1) Other adjustments linkedto consolidation methods
Accounting balance sheet within the
prudential scope
Central banks 5,238 - - 5,238 Liabilities at fair value through profit or loss** 440,120 1,102 - 441,222 Hedging derivatives 9,594 2 - 9,596 Amounts owed to credit institutions 82,584 (1,310) 147 81,421 Amounts owed to clients 421,002 2,017 - 423,019 Debt securities 102,202 4,586 - 106,788 Revaluation reserve of interest-rate-hedged portfolios 8,460 - - 8,460 Tax liabilities 1,444 (317) 11 1,138 Other liabilities** 81,893 (5,002) 247 77,138 Debts related to non-current assets held for sale 3,612 - - 3,612 Technical provisions of insurance companies 112,777 (112,777) - - Provisions 5,687 (23) 0 5,664 Subordinated debts 14,103 246 - 14,349
o.w. redeemable subordinated notes including revaluation differences on hedging items 13,541 241 - 13,782
Total debts 1,2288,716 (111,476) 405 1,1177,6455 Equity Equity, Group share 61,953 (0) (0) 61,953
o.w. capital and related reserves 19,986 - - 19,986
o.w. other capital instruments 9,680 - - 9,680
o.w. retained earnings 4,096 - - 4,096 o.w. accumulated other comprehensive income (including gains and losses accounted directly in equity) 24,317 - (0) 24,317
o.w. net income 3,874 - - 3,874
Minority interests 3,753 (829) 0 2,924
Total equity 65,706 (829) (0) 64,877
Total lliabilities 1,3554,422 (112,305) 405 1,242,522
(1) Restatement of subsidiaries outside the prudential reporting scope and reconsolidation of intragroup transactions related to its subsidiaries. * Consolidated amounts of deferred tax assets dependent on future profits excluding those resulting from temporary differences and tax assets. ** Amounts restated relative to the financial statements published in 2016, following a change in the presentation of premiums on options to be paid and
received.

4 I 3
CAPITAL MANAGEMENT AND ADEQUACY RRISK FACTORS AND CAAPITAL ADEQUACY
170 I 2018 REGISTRATION DOCUMENT I S O C I E T E G E N E R AL E G R O U P
The main Group companies outside the prudential reporting scope are as follows:
TABLE 3: SUBSIDIARIES OUTSIDE THE PRUDENTIAL REPORTING SCOPE
Company Activity Country
Antarius Insurance France
ALD RE Designated Activity Company Insurance Ireland
Catalyst RE International LTD Insurance Bermuda
Société Générale Strakhovanie Zhizni LLC Insurance Russia
Sogelife Insurance Luxembourg
Genecar - Société Générale de Courtage d’Assurance et de Réassurance Insurance France
Inora Life LTD Insurance Ireland
SG Strakhovanie LLC Insurance Russia
Sogecap Insurance France
Pojstovna A.S. Insurance Czech Republic
La Marocaine Vie Insurance Morocco
Oradea Vie Insurance France
Société Générale RE SA Insurance France
Sogessur Insurance France
Société Générale Life Insurance Broker SA Insurance Luxembourg
SG Reinsurance Intermediary Brokerage, LLC Insurance USA
La Banque Postale Financement Bank France
SG Banque au Liban Bank Lebanon
Regulated financial subsidiaries and affiliates outside of Societe Generale’s prudential consolidation scope are all in compliance with their respective solvency requirements. More generally, all regulated Group undertakings are subject to solvency requirements set by their respective regulators.
The supervising authority accepted that some Group entities may be exempt from the application of prudential requirements on an
individual basis or, where applicable, on a sub-consolidated basis. Accordingly, Societe Generale SA is not subject to prudential requirements on an individual basis.
Any transfer of equity or repayment of liabilities between the parent company and its subsidiaries shall be carried out in compliance with capital and liquidity requirements applicable locally.

4
CAPITAL MANAGEMENT AND ADEQUACY
3 I 4 RRISK FACTORS AND CAP IITAL ADEQUACY
S O C I E T E G E N E R AL E G R O U P I 2018 REGISTRATION DOCUMENT I 171
REGULATORY CAPITAL Reported according to international financial reporting standards (IFRS), Societe Generale’s regulatory capital consists of the following components.
Common Equity Tier 1 capital According to CRR/CRD4 regulations, Common Equity Tier 1 capital is made up primarily of the following:
ordinary shares (net of repurchased shares and treasury shares) and related share premium accounts;
retained earnings;
components of other comprehensive income;
other reserves;
minority interests limited by CRR/CRD4.
Deductions from Common Equity Tier 1 capital essentially involve the following:
estimated dividend payments;
goodwill and intangible assets, net of associated deferred tax liabilities;
unrealised capital gains and losses on cash flow hedging;
income on own credit risk;
deferred tax assets on tax loss carryforwards;
deferred tax assets resulting from temporary differences beyond a threshold;
assets from defined benefit pension funds, net of deferred taxes;
any positive difference between expected losses on customer loans and receivables, risk-weighted using the internal ratings-based (IRB) approach, and the sum of related value adjustments and collective impairment losses;
expected losses on equity portfolio exposures;
value adjustments resulting from the requirements of prudent valuation;
securitisation exposures weighted at 1,250%, where these positions are not included in the calculation of total risk-weighted exposures.
Additional Tier 1 Capital According to CRR/CRD4 regulations, additional Tier 1 capital is made up of deeply subordinated notes that are issued directly by the Bank, and have the following features:
these instruments are perpetual and constitute unsecured, deeply subordinated obligations. They rank junior to all other obligations of the Bank, including undated and dated subordinated debt, and senior only to common stock shareholders;
in addition, Societe Generale may elect, on a discretionary basis, not to pay the interest and coupons linked to these instruments. This compensation is paid out of distributable items;
they include neither a step-up in compensation nor any other incentive to redeem;
they must have a loss-absorbing capacity;
subject to the prior approval of the European Central Bank, Societe Generale has the option to redeem these instruments at certain dates, but no earlier than five years after their issuance date.
Deductions of additional Tier 1 capital essentially apply to the following:
AT1 hybrid treasury shares;
holding of AT1 hybrid shares issued by financial sector entities;
minority interests beyond the minimum T1 requirement in the entities concerned.
Tier 2 Capital Tier 2 capital includes:
undated deeply subordinated notes;
dated subordinated notes;
any positive difference between (i) the sum of value adjustments and collective impairment losses on customer loans and receivables exposures, risk-weighted using the IRB approach and (ii) expected losses, up to 0.6% of the total credit risk-weighted assets using the IRB approach;
value adjustments for general credit risk related to collective impairment losses on customer loans and receivables exposures, risk-weighted using the standard approach, up to 1.25% of the total credit risk-weighted assets.
Deductions of Tier 2 capital essentially apply to the following:
Tier 2 hybrid treasury shares;
holding of Tier 2 hybrid shares issued by financial sector entities;
minority interests beyond the minimum capital requirement in the entities concerned.
All capital instruments and their features are detailed online (www.societegenerale.com/Investors/Registration Document and Pillar 3).

4 I 3
CAPITAL MANAGEMENT AND ADEQUACY RRISK FACTORS AND CAPIITAL ADEQUACY
172 I 2018 REGISTRATION DOCUMENT I S O C I E T E G E N E R AL E G R O U P
TABLE 4: CHANGES IN DEBT INSTRUMENTS ELIGIBLE FOR THE SOLVENCY CAPITAL REQUIREMENTS
(In EUR m)
31.12.2016 Issues Redemptions
Prudential supervision
valuation haircut
Others 31.12.2017
Debt instruments eligible for Tier 1 10,862 0 (1,294) 0 (853) 8,715
Debt instruments eligible for Tier 2 13,039 656 (4) (482) (821) 12,388
Total eligible debt instruments 23,901 656 (11,298) (4482) (11,674) 21,103
Solvency ratio The solvency ratio is set by comparing the Group’s equity with the sum of risk-weighted assets for credit risk and the capital requirement multiplied by 12.5 for market risks and operational risks.
In 2018, based on the various regulatory buffers but excluding the countercyclical buffer, the phased-in Common Equity Tier 1 (CET1) ratio that triggers the maximum distributable amount mechanism will be 8.625%. The G-SIB buffer imposed by the Financial Stability Board (FSB) is equal to 0.75% and will be increased by 0.25% per annum, ultimately reaching 1% in 2019.
The countercyclical buffer – just like the conservation and systemic buffers – plays a role in determining the overall buffer requirement. The countercyclical buffer rate is set by country. Each establishment calculates its countercyclical buffer requirement based on the average countercyclical buffer rate for each country, adjusted to take into account the relevant credit risk exposures in these countries. The countercyclical buffer rate, in force as of 1st January 2016, generally lies between 0% and 2.5% by country, with a transitional period where the rate is capped (0.625% in 2016, 1.25% in 2017 and 1.875% in 2018).
TABLE 5: BREAKDOWN OF PRUDENTIAL CAPITAL REQUIREMENT FOR SOCIETE GENERALE AS AT 01.01.2018 (IN %) – PHASED-IN RATIO
01.01.2018 01.01.2017
Minimum requirement for Pillar 1 4.50% 4.50%
Minimum requirement for Pillar 2 (P2R) 1.50% 1.50%
Minimum requirement for conservation buffer 1.88% 1.25%
Minimum requirement for systemic buffer 0.75% 0.50%
Minimum requirement for CET1 ratio 8.63% 7.75%

4
CAPITAL MANAGEMENT AND ADEQUACY
3 I 4 RRISK FACTORS AND CAP IITAL ADEQUACY
S O C I E T E G E N E R AL E G R O U P I 2018 REGISTRATION DOCUMENT I 173
TABLE 6: REGULATORY CAPITAL AND CRR/CRD4 SOLVENCY RATIOS – FULLY LOADED
(In EUR m) 31.12.2017 31.12.2016
Shareholders’’ eequity (IFRS), Group share 59,3373 61,9953
Deeply subordinated notes (8,521) (10,663)
Perpetual subordinated notes (269) (297)
Group consolidated shareholders’’ eequity net of deeply subordinated and perpetual subbordinated notes
50,5583 50,9993
Non-controlling interests 3,529 2,623
Intangible assets (1,795) (1,626)
Goodwill (4,829) (4,709)
Dividends proposed (to the General Meeting) and interest expenses on deeply subordinated and perpetual subordinated notes (1,880) (1,950)
Deductions and regulatory adjustments (5,381) (4,394)
Common Equity Tier 1 capital 40,2227 40,9937
Deeply subordinated notes and preferred shares 8,715 10,862
Other additional Tier 1 capital 101 (113)
Additional Tier 1 deductions (136) (138)
Total Tier 1 capital 48,9907 51,5548
Tier 2 instruments 12,388 13,039
Other Tier 2 capital 425 374
Tier 2 deductions (1,686) (1,400)
Total regulatory capital 60,0034 63,5561
Total risk--weighted assets 353,3306 355,4478
Credit risk-weighted assets 289,511 294,220
Market risk-weighted assets 14,800 16,873
Operational risk-weighted assets 48,995 44,385
Solvency ratios
Common Equity Tier 1 ratio 11.4% 11.5%
Tier 1 ratio 13.8% 14.5%
Total capital ratio 17.00% 17.99%
The phased-in CRR/CRD4 solvency ratio at 31st December 2017 stood at 11.6% in Common Equity Tier 1 (11.8% at 31st December 2016), and 14.0% in Tier 1 (14.8% at 31st December 2016) for a total ratio of 17.2% (18.2% at 31st December 2016).
Group shareholders’ equity at 31st December 2017 totalled EUR 59.4 billion (compared to EUR 62 billion at 31st December 2016).
After taking into account non-controlling interests and regulatory adjustments, phased-in CET1 regulatory capital was EUR 40.9 billion at 31st December 2017, vs. EUR 42.0 billion at 31st December 2016.
The Additional Tier One deductions mainly concern authorisations to buy back own additional Tier 1 capital instruments as well as subordinated bank and insurance loans.

4 I 3
CAPITAL MANAGEMENT AND ADEQUACY RRISK FACTORS AND CAPIITAL ADEQUACY
174 I 2018 REGISTRATION DOCUMENT I S O C I E T E G E N E R AL E G R O U P
The table below shows the key factors in this change.
TABLE 7: CET1 REGULATORY DEDUCTIONS AND ADJUSTMENTS UNDER CRR/CRD4
(In EUR m) 31.12.2017 31.12.2016
Unrecognised minority interests (1,957) (1,102)
Deferred tax assets (2,102) (2,123)
Prudent Valuation Adjustment (785) (746)
Adjustments related to changes in the value of own liabilities 531 468
Other (1,068) (891)
Total CET1 regulatory deductions and adjustments (5,33811) (4,3394)
CRR/CRD4 prudential deductions and restatements included in “Other” essentially involve the following:
any positive difference between expected losses on customer loans and receivables, measured according to the internal ratings-based (IRB) approach, and the sum of related value adjustments and collective impairment losses;
expected losses on equity portfolio exposures;
unrealised gains and losses on cash flow hedges;
assets from defined benefit pension funds, net of deferred taxes;
securitisation exposures weighted at 1,250%, where these positions are not included in the calculation of total risk-weighted exposures.
CHANGES IN THE FULLY-LOADED COMMON EQUITY TIER ONE (CET1) RATIO
The fully-loaded Common Equity Tier 1 ratio, calculated according to CRR/CRD4 rules, including the Danish compromise for insurance activities, amounted to 11.4% at 31st December 2017, versus 11.5% at 31st December 2016.
CAPITAL REQUIREMENTS The Basel 3 Accord established the new rules for calculating minimum capital requirements in order to more accurately assess the risks to which banks are exposed. The calculation of credit risk-weighted assets takes into account the transaction risk profile based on two approaches for determining risk-weighted assets: (i) a standard method, and (ii) advanced methods based on internal models for rating counterparties.
The following table is defined by the European Banking Authority (EBA) as part of the revision of Pillar 3. It is specified that two
changes have been made to this table as compared to the version published last year, in order to align it with the target format:
the credit risk in the standard method no longer includes exposures below the deduction thresholds and subject to a weighting of 250% (separate line);
total counterparty risk includes contributions to the default fund of a central counterparty.

4
CAPITAL MANAGEMENT AND ADEQUACY
3 I 4 RRISK FACTORS AND CAP IITAL ADEQUACY
S O C I E T E G E N E R AL E G R O U P I 2018 REGISTRATION DOCUMENT I 175
TABLE 8: GROUP CAPITAL REQUIREMENTS AND RISK-WEIGHTED ASSETS
RWA Minimum capital
requirements
(In EUR bn) 31.12.2017 31.12.2016 31.12.2017
Credit risk (excludingg counterparty credit risk) 250,7774 250,6692 20,0062
o.w. standardised approach 97,408 96,165 7,793
o.w. Foundation IRB (F-IRB) approach 4,483 3,998 359
o.w. Advanced IRB (A-IRB) approach 131,373 133,241 10,510
o.w. equity IRB under the simple risk-weighted approach or IMA
17,511 17,288 1,401
Coounterparty credit risk 28,4479 31,7758 2,2278
o.w. risk exposure for contributions to the default fund of a CCP
1,163 899 93
o.w. CVA 3,760 5,089 301
Settlement risk 2 8 0
Securitisation exposures in the banking book (after cap) 1,7779 1,8821 142
o.w. IRB approach 114 154 9
o.w. IRB supervisory formula approach (SFA) 4 27 0
o.w. internal assessment approach (IAA) 1,461 1,380 117
o.w. standardised approach 200 260 16
Market risk 14,8800 16,8873 1,1184
o.w. standardised approach 1,384 1,238 111
o.w. IMA 13,416 15,635 1,073
Large exposures
Operational risk 48,9995 44,3385 3,9920
o.w. basic indicator approach 0 0 0
o.w. standardised approach 3,020 3,071 242
o.w. advanced measurement approach 45,975 41,314 3,678
Amounts below the thresholds for deduction (subject to 250% risk-weighting) 8,477 9,940 678
Floor adjustment 0 0 0
Total 353,3306 355,4478 28,2264
4

4 I 3
CAPITAL MANAGEMENT AND ADEQUACY RRISK FACTORS AND CAPIITAL ADEQUACY
176 I 2018 REGISTRATION DOCUMENT I S O C I E T E G E N E R AL E G R O U P
Change in risk-weighted assets and capital requirements The following table presents the risk-weighted assets by pillar (fully loaded).
TABLE 9: RISK-WEIGHTED ASSETS (RWA) BY PILLAR AND RISK TYPE (IN EUR BN)
(In EUR bn) Credit Market Operational Total 2017 Total 2016
French Retail Banking 94.8 0.0 5.6 100.5 97.3
International Retail Banking and Financial Services 109.0 0.1 7.7 116.8 112.7
Global Banking and Investor Solutions 77.6 14.5 32.0 124.0 131.0
Corporate Centre 8.1 0.2 3.6 12.0 14.4
Group 289..5 14.88 49.00 353.33 355.55
At 31st December 2017, RWA (EUR 353.3 billion) broke down as follows:
credit risk accounted for 82% of RWA (of which 38% for International Retail Banking and Financial Services);
market risk accounted for 4% of RWA (of which 98% for Global Banking and Investor Solutions);
operational risk accounted for 14% of RWA (of which 65% for Global Banking and Investor Solutions).
CAPITAL MANAGEMENT Audited I As part of its capital management, the Group (under the supervision of the Finance Division) ensures that its solvency level is always compatible with the following objectives:
maintaining its financial solidity and respecting the Risk Appetite targets;
preserving its financial flexibility to finance organic growth and growth through acquisitions;
allocating adequate capital to the various businesses, according to the Group’s strategic objectives;
maintaining the Group’s resilience in the event of stress scenarios;
meeting the expectations of its various stakeholders: supervisors, debt and equity investors, rating agencies, and shareholders.
The Group determines its internal solvency targets in accordance with these objectives and regulatory thresholds.
The Group has an internal process for assessing the adequacy of its capital that measures the adequacy of the Group’s capital ratios in light of regulatory constraints.
At 31st December 2017, the Group’s Common Equity Tier 1 ratio was 11.4% (fully loaded) and 11.6% (phased-in).
In 2017, the Group’s capital generation and the developments in the Group’s operations portfolio (specifically the year’s disposals and acquisitions) funded the extraordinary items of the 2017 financial year and helped to maintain a sufficient margin to ensure dividend and hybrid coupon payments, while keeping the Common Equity Tier 1 ratio stable overall.
In addition, the Group maintains a balanced capital allocation among its three strategic pillars:
French Retail Banking;
International Retail Banking and Financial Services;
Global Banking and Investor Solutions.
Each of the Group’s three pillars accounts for around a third of all risk-weighted assets (RWA), with French and International Retail Banking (more than 61% of total business loans and receivables) and credit risks (representing 82% of the Group’s risk-weighted assets) accounting for the largest share.
At 31st December 2017, the Group’s risk-weighted assets were down 0.62% to EUR 353.3 billion, compared to EUR 355.5 billion at end-December 2016.

4
CAPITAL MANAGEMENT AND ADEQUACY
3 I 4 RRISK FACTTORS AND CAP ITAL ADEQQUACY
S O C I E T E G E N E R AL E G R O U P I 2018 REGISTRATION DOCUMENT I 177
LEVERAGE RATIO MANAGEMENT The Group manages its leverage effect according to the CRR leverage ratio rules, as amended by the delegated act of 10th October 2014.
Managing the leverage ratio means both calibrating the amount of Tier 1 capital (the ratio’s numerator) and controlling the Group’s leverage exposure (the ratio’s denominator) to achieve the target ratio levels that the Group sets for itself. To this end, the “leverage” exposure of the different businesses is under the Finance Division’s control.
The Group aims to maintain a consolidated leverage ratio that is significantly higher than the 3% minimum in the Basel Committee’s recommendations. The leverage ratio is in an observation phase in
order to set the minimum requirements. Once they have been set, the Group’s target will be adjusted as needed.
At the end of 2017, Societe Generale’s leverage ratio was 4.3% (compared with 4.2% at end-2016). Return on assets (i.e. net income divided by the balance sheet total as per the consolidated financial statements) for Societe Generale stood at 0.22% in 2017 and 0.31% in 2016. On a prudential basis (fully-loaded), this ratio was 0.23% in 2017 and 0.31% in 2016, calculated by dividing the Group net income reflected in Table 2, page 168, by the balance sheet total for prudential purposes (Table 2, page 168).
TABLE 10: LEVERAGE RATIO SUMMARY AND RECONCILIATION OF PRUDENTIAL BALANCE SHEET AND LEVERAGE EXPOSURE
(In EUR m) 31.12.2017 31.12.2016
Tier 1 capital((1) 48,9907 551,548
Total assets in prudential balance sheet(2) 1,137,688 1,242,522*
Adjustments for fiduciary assets recognised on the balance sheet but excluded from the leverage ratio exposure
0 0
Adjustments for derivative financial instruments (61,148) (84,012)*
Adjustments for securities financing transactions(3) (9,035) (22,029)
Off-balance sheet exposure (loan and guarantee commitments) 93,055 90,602
Technical and prudential adjustments (Tier 1 capital prudential deductions) (10,716) (10,232)
Leverage ratio exposure 1,149,8844 1,216,8851
CRR fully loaded leverage ratio((4) 4.33% 4.22%
(1) Capital overview is available in Table 5: Risk-based capital and Basel 3 solvency ratio. (2) Reconciliation of the consolidated balance sheet and the accounting balance sheet within the prudential scope is available in Table 2. (3) Securities financing transactions: repurchase transactions, securities lending or borrowing transactions and other similar transactions. (4) Fully loaded based on CRR rules adopted in October 2014 by the European Commission (delegated act). * Amounts restated relative to the financial statements published in 2016, following a change in the presentation of premiums on options to be paid and
received.
RATIO OF LARGE EXPOSURES The CRR (European Capital Requirements Regulation) incorporates the provisions regulating large exposures. As such, the Societe Generale Group must not have any exposure where the total amount of net risks incurred on a single beneficiary exceeds 25% of the Group’s capital.
The eligible capital used to calculate the large exposure ratio is the total regulatory capital, with a limit on the amount of Tier 2 capital. Tier 2 capital cannot exceed one-third of Tier 1 capital.
The final rules of the Basel Committee on large exposures will be transposed in Europe via CRR2. The main change compared with the current CRR is the calculation of the regulatory limit (25%), henceforth expressed as a proportion of Tier 1 (instead of total capital), as well as the introduction of a cross-specific limit on systemic institutions (15%).
FINANCIAL CONGLOMERATE RATIO The Societe Generale Group, also identified as a “Financial conglomerate”, is subject to additional supervision by the French Prudential Supervisory and Resolution Authority (Autorité de contrôle prudentiel et de résolution – ACPR).
At 31st December 2017, the Societe Generale Group’s financial conglomerate equity covered the solvency requirements for both
banking activities and insurance activities. At 31st December 2016, the financial conglomerate ratio was 220%, consisting of a numerator (“Own funds of the Financial Conglomerate”) of EUR 68.4 billion, and a denominator (“Regulatory requirement of the Financial Conglomerate”) of EUR 31.1 billion.

4 I 4
CREDIT RISKS RRISK FACTORS AND CAPIITAL ADEQUACY
178 I 2018 REGISTRATION DOCUMENT I S O C I E T E G E N E R AL E G R O U P
4 . C R E D I T R I S K S
Credit risk is defined as the risk of losses arising from the inability of the Group’s customers, issuers or other counterparties to meet their financial commitments. Credit risk includes the counterparty risk linked to market transactions and securitisation activities. In addition, credit risk may be further amplified by individual, country and sector concentration risk.
RISK SUPERVISION AND MONITORING SYSTEM
Portfolio review and sector risk monitoring Authorisation limits are set for each counterparty and the credit approval process must comply with the overall authorisation limit for the group to which the counterparty belongs.
Individual large exposures are reviewed by the Large Exposures Committee chaired by General Management. Societe Generale complies with regulations governing large exposures(1).
Concentrations are measured using an internal model and individual concentration limits are defined for larger exposures. Any concentration limit breach is managed over time by reducing exposures and/or hedging positions using credit derivatives.
Concentration targets are defined for the biggest counterparties at Concentration Committee meetings.
In addition, the Group regularly reviews its entire credit portfolio through analyses by type of counterparty or business sector. In addition to industry research and regular sector concentration analyses, sector research and more specific business portfolio analyses are carried out at the request of the Bank’s General Management, Risk Division or business divisions.
Monitoring of country risk Country risk arises when an exposure (loan, security, guarantee or derivative) becomes susceptible to negative impact from changing regulatory, political, economic, social and financial conditions in the country of exposure.
It includes exposure to any kind of counterparty, including a sovereign state (sovereign risk is also controlled by the system of counterparty risk limits).
Country risk breaks down into two major categories:
political and non-transfer risk covers the risk of non-payment resulting from either actions or measures taken by local government authorities (decision to prohibit the debtor from meeting its commitments, nationalisation, expropriation, non-convertibility, etc.), domestic events (riots, civil war, etc.) or external events (war, terrorism, etc.);
commercial risk occurs when the credit quality of all counterparties in a given country deteriorates due to a national economic or financial crisis, independently of each counterparty’s individual financial situation. This could be a macroeconomic shock (sharp slowdown in activity, systemic banking crisis, etc.), currency depreciation, or sovereign default on external debt potentially entailing other defaults.
Overall limits and strengthened monitoring of exposures have been established for countries based on their internal ratings and governance indicators. Supervision is not limited to emerging markets.
Country limits are approved annually by General Management. They can also be revised downward at any time if the country’s situation deteriorates or is expected to deteriorate.
All Group exposures (securities, derivatives, loans and guarantees) are taken into account by this monitoring. The Country Risk methodology determines an initial country of risk and a final country of risk (after the effects of any guarantees) within the country limits framework.
Specific monitoring of hedge funds Hedge funds are important counterparties for the Group. Whether they are regulated or not, and regardless of the nature of the end investor, hedge funds pose idiosyncratic risks specific to investment strategies, with a strong correlation between credit risk and market risk. Furthermore, because they are able to use significant leverage, there is a higher probability of credit default.
Risks related to hedge funds are governed by various rules, including a set of global limits, some of which are established by General Management:
a Credit VaR limit per counterparty, which controls the maximum replacement risk that may be taken;
a stress test limit governing market risks and the risks associated with financing transactions guaranteed by shares in hedge funds;
a global stress test limit covering hedge fund and proprietary trading group counterparties, to control the risk related to multiple defaults in stressed markets;
concentration risk threshold per counterparty, which forms the basis for monitoring of the wrong-way risk.
Moreover, contractual terms of business established in bilateral master netting agreements enable the Group to mitigate these risks.
Credit stress tests With the aim of identifying, monitoring and managing credit risk, the Risk Division works with the businesses to conduct a set of specific stress tests relating to a country, subsidiary or activity. These specific stress tests combine both recurring stress tests, conducted on those portfolios identified as structurally carrying risk, and ad hoc stress tests, designed to recognise emerging risks. Some of these stress tests are presented to the Risk Committee and used to determine how to govern the activities concerned.
(1) Ratio of large exposures, p. 177.

4
CREDIT RISKS
4 I 4 RRISK FACTORS AND CAP IITAL ADEQUACY
S O C I E T E G E N E R AL E G R O U P I 2018 REGISTRATION DOCUMENT I 179
Like global stress tests, specific stress tests draw on a core scenario and a stressed scenario, which are defined by the Group’s sector experts and economists. The core scenario draws on an in-depth analysis of the situation surrounding the activity or the country concerned. The stressed scenario describes triggering events and assumptions regarding the development of a crisis, in both quantitative terms (changes in a country’s GDP, the unemployment rate, deterioration in a sector) and qualitative terms.
Structured around the portfolio analysis function, the Risk Division teams translate these economic scenarios into impacts on risk parameters (default exposure, default rate, provisioning rate at entry into default, etc.). To this end, the leading methods are based in particular on the historical relationship between economic conditions and risk parameters. As with the global stress tests, in connection with the regulatory pillar, stress tests routinely take into account the possible effect of counterparty performance for those counterparties in which the Group is most highly concentrated in a stressed environment.
Impairment Impairment includes impairments on groups of homogeneous assets, which cover performing loans, and specific impairments, which cover counterparties in default.
The applicable accounting principles are set out in Note 3.8 to the consolidated financial statements provided in Chapter 6 of this Registration Document, page 367.
IMPAIRMENT ON GROUPS OF HOMOGENEOUS ASSETS Impairments on groups of homogeneous assets are collective impairments booked for portfolios that are homogeneous and have a deteriorated risk profile although no objective evidence of default can be observed at an individual level.
These homogeneous groups include sensitive counterparties, sectors or countries. They are identified through regular analyses of the portfolio by sector, country or counterparty type.
These impairments are calculated on the basis of assumptions on default rates and loss rates after default. These assumptions are calibrated by homogeneous group based on each group’s specific characteristics, sensitivity to the economic environment and historical data. They are reviewed periodically by the Risk Division.
SPECIFIC IMPAIRMENT Decisions to book specific impairments on certain counterparties are taken where there is objective evidence of default. The amount of impairment depends on the probability of recovering the amounts due. The expected cash flows are based on the financial position of the counterparty, its economic prospects and the guarantees called up or that may be called up.
A counterparty is deemed to be in default when any one or more of the following conditions are observed:
a significant decline in the counterparty’s financial position leads to a high probability of it being unable to fulfil all of its commitments (credit obligations), thereby generating a risk of loss to the Bank whether or not the debt is restructured; and/or
regardless of the type of loan (property or other), one or more receivables past due at least 90 days have been recorded (with the exception of restructured loans on probation, which are considered to be in default at the first missed payment, in accordance with the technical standard published in 2013 by the EBA relative to restructured loans); and/or
a recovery procedure is underway; and/or
the debt was restructured less than one year previously; and/or
legal proceedings such as a bankruptcy, legal settlement or compulsory liquidation are in progress.
The Group applies the default contagion principle to all of a counterparty’s outstandings. When a debtor belongs to a group, all of the group’s outstandings are generally defaulted as well.
REPLACEMENT RISK Replacement risk, i.e. counterparty risk associated with market transactions, is a type of credit risk (potential loss in the event that the counterparty defaults). It represents the current cost to the Group of replacing transactions with a positive market value should the counterparty default. Transactions giving rise to a replacement risk include, among others, security repurchase agreements, securities lending and borrowing, purchase/sale transactions or foreign exchange transactions performed on Delivery Versus Payment (DVP) terms, and derivative contracts, stemming either from standard market activities (OTC transactions such as swaps, options and futures) or from prime brokerage services(1).
Management of counterparty risk linked to market transactions Audited I Societe Generale places great emphasis on the careful monitoring of its counterparty risk exposure in order to minimise its losses in case of default. Counterparty limits are assigned to all
counterparties (banks, other financial institutions, corporates, public institutions and CCP).
In order to quantify the potential replacement cost, Societe Generale uses an internal model: the future fair value of market transactions with each counterparty is modelled taking into account any netting and correlation effects. The forecasts are derived from Monte Carlo models developed by the Risk Division, based on a historical analysis of market risk factors, and take into account guarantees and collateral.
This internal model is used to compute the Effective Expected Positive Exposure (EEPE), a metric which is used to determine the counterparty risk regulatory capital requirements.
(1) Prime brokerage services, mainly on listed derivatives, where the bank acts as agent between a client and a clearing house.

4 I 4
CREDIT RISKSRRISK FACTORS AND CAPIITAL ADEQUACY
180 I 2018 REGISTRATION DOCUMENT I S O C I E T E G E N E R AL E G R O U P
From an economic standpoint, Societe Generale monitors positions using two indicators to represent the distribution resulting from the Monte Carlo simulations:
current average risk, particularly suitable for analysing the riskexposure for a portfolio of customers;
Credit-Value-at-Risk (or CVaR): the largest loss that could beincurred after eliminating the top 1% of the most adverseoccurrences, used to set the risk limits for individualcounterparties.
Societe Generale has also developed a set of stress test scenarios used to calculate the exposure linked to changes in the fair value of transactions with all its counterparties in the event of an extreme shock on market parameters.
Setting individual counterparty limits The credit profile of counterparties is reviewed on a
regular basis and limits are set according to both the type and maturity of the instruments concerned. The intrinsic creditworthiness of counterparties and the reliability of the associated legal documentation are two factors considered when setting these limits. ▲
Regarding central counterparties (CCP), specific limits in terms of margin and deposit amounts are defined to control and monitor the exposure resulting from the clearing of derivative contracts and of repurchase agreements, stemming either from standard market activities or from prime brokerage services.
Information technology systems allow both traders and the Risk Division to ensure that counterparty limits are not exceeded. Any significant weakening in any of the Bank’s counterparties triggers an urgent internal rating review. A specific supervision and approval process is put in place for more sensitive counterparties or more complex financial instruments.
Calculation of Exposure at Default(1) within the regulatory framework As part of the calculation of capital in respect of counterparty risk, the French Prudential Supervisory and Resolution Authority (Autorité de contrôle prudentiel et de résolution – ACPR) has approved the use of the internal model described above to determine the Effective Expected Positive Exposure (EEPE).
For the entities where this internal model is approved(2), it covers 96% of the transactions on OTC derivatives or security financing transactions.
For other transactions or entities, the Group uses the marked-to-market valuation method. In this method, the EAD relative to the Bank’s counterparty risk is determined by aggregating the positive market values of all the transactions (replacement cost), and increasing the sum with an add-on. This add-on, which is
calculated in line with the CRD (Capital Requirements Directive), is a fixed percentage – based on the type of transaction and the residual maturity – which is applied to the transaction’s nominal value.
In both cases, the effects of netting agreements and collateral are factored in, either by their simulation in the internal model, or by applying the netting rules as defined under the marked-to-market method and by subtracting guarantees or collateral. Regulatory capital requirements also depend on the internal rating of the debtor counterparty.
Credit valuation adjustment for counterparty risk Derivatives and security financing transactions are subject to a Credit Valuation Adjustment (CVA) to take into account counterparty risk. The Group includes in this adjustment all clients that are not subject to a daily margin call or for which the collateral only partially covers the exposure. This adjustment also reflects the netting agreements existing for each counterparty. CVA is determined on the basis of the Group entity’s positive expected exposure to the counterparty, the counterparty’s probability of default (conditional on the entity not defaulting), and the loss in the event of default.
Furthermore, since 1st January 2014, financial institutions have had to determine capital requirements related to CVA, covering its variation over ten days. The scope of counterparties is limited to financial counterparties as defined in the EMIR (European Market Infrastructure Regulation) or certain corporates that may use derivatives beyond certain thresholds and for purposes other than hedging. Societe Generale has implemented an internal model to compute these capital requirements, covering 75% of the scope. The method used is similar to the one used for the market VaR computation (see the “Market Risk” chapter of the Registration Document): it consists of carrying out a historical simulation of the change in CVA due to the variations observed in the credit spreads of the counterparties, with a 99% confidence interval. The computation is done on the credit spreads variation observed, on the one hand, over a one-year rolling period (VaR on CVA), and, on the other hand, over a fixed one-year historical window corresponding to the period of greatest tension in terms of credit spreads (stressed VaR on CVA). The associated capital requirements are equal to the sum of these two computations multiplied by a factor set by the regulator, specific to each bank. For the remaining part determined according to the standard method, Societe Generale applies the rules defined by the Capital Requirements Regulation: weighting by a normative factor of the EAD multiplied by a recomputed maturity.
The management of this exposure and regulatory capital charge led the Bank to buy protection (such as Credit Default Swaps) from major financial institutions. In addition to reducing the credit risk, it decreases their variability deriving from changes in the credit spreads of counterparties.
(1) Exposure at default (EAD) of a loan is equal to its nominal amount. The potential loss amount of a derivative is its marked-to-market valuation when the counterparty defaults, which can be only statistically approximated. Therefore, two methods for the calculation of the EAD of derivatives are allowed, one using the marked-to-market valuation and one using the internal model approach (see above).
(2) Regarding activities of the former Newedge scope, the Group requested an authorisation to use this internal model. The assessment of this request by the regulator is expected in 2018.
Audited I

4
CREDIT RISKS
4 I 4 RRISK FACTORS AND CAP IITAL ADEQUACY
S O C I E T E G E N E R AL E G R O U P I 2018 REGISTRATION DOCUMENT I 181
Wrong-way risk adjustment Wrong-way risk is the risk of the Group’s exposure to a counterparty increasing significantly, combined with a simultaneous increase in the probability of the counterparty defaulting.
There are two types of wrong-way risk:
general wrong-way risk, where there is a significant correlation between certain market factors and the creditworthiness of the counterparty;
specific wrong-way risk, where the amount of exposure is directly related to the credit quality of the counterparty.
The specific wrong-way risk is subject to dedicated regulatory capital requirements, through an add-on applied when calculating the capital requirements. The EEPE indicator for transactions identified as facing a specific wrong-way risk is re-assessed based on the hypothesis of a default from the counterparty (more specifically, a conservative reassessment based on (i) a value of nil for the counterparty’s shares and (ii) a value equal to the recovery rate for the bonds issued by the counterparty).
This process leads to stricter capital requirements regarding counterparty risks on such transactions. The economic counterparty risk (replacement risk) calculated in these specific risk situations is also increased, thereby limiting the exposure on such transactions, as there is no change in the risk limit framework.
The general wrong-way risk is monitored through stress tests (stress tests based on mono- or multi-risk factors covering all transactions with a given counterparty, relying on the same scenarios as used in the market risk stress tests) based on:
a quarterly analysis of the stress tests regarding all counterparties, making it possible to identify the most adverse scenarios linked to a joint deterioration in the quality of the counterparties and the associated positions;
regarding Systemically Important Financial Institutions (SiFi), monthly monitoring of dedicated multi-risk factor stress test scenarios, subject to limits;
regarding hedge funds and proprietary trading groups, weekly monitoring of dedicated mono-risk factor stress test scenarios, subject to limits.
HEDGING OF CREDIT RISK
AAudited I Guarantees and collateral The Group uses credit risk mitigation techniques for both market and commercial banking activities. These techniques provide partial or full protection against the risk of debtor insolvency.
There are two main categories:
personal guarantees are commitments made by a third party to replace the primary debtor in the event of the latter’s default. These guarantees encompass the protection commitments and mechanisms provided by banks and similar credit institutions, specialised institutions such as mortgage guarantors (e.g. Crédit Logement in France), monoline or multiline insurers, export credit agencies, etc. By extension, credit insurance and credit derivatives (purchase of protection) also belong to this category;
collateral can consist of physical assets in the form of property, commodities or precious metals, as well as financial instruments such as cash, high-quality investments and securities, and also insurance policies.
Appropriate haircuts are applied to the value of collateral, reflecting its quality and liquidity.
The Group proactively manages its risks by diversifying guarantees: physical collateral, personal guarantees and others (including CDS).
During the credit approval process, an assessment is performed on the value of guarantees and collateral, their legal enforceability and the guarantor’s ability to meet its obligations. This process also ensures that the collateral or guarantee successfully meets the criteria set forth in the Capital Requirements Directive (CRD).
Guarantor ratings are reviewed internally at least once a year and collateral is subject to revaluation at least once a year. The Risk
function is responsible for approving the operating procedures established by the core businesses for the regular valuation of guarantees and collateral, either automatically or based on an expert opinion, whether during the approval phase for a new loan or upon the annual renewal of the credit application.
The amount of guarantees and collateral is capped at the amount of outstanding loans less provisions, i.e. EUR 272.44 billion at 31st
December 2017 (compared with EUR 265.08 billion at 31st December 2016), of which EUR 137.46 billion for retail customers and EUR 134.98 billion for other types of counterparty (compared with EUR 131.68 billion and EUR 133.39 billion at 31st December 2016, respectively).
The outstanding loans covered by these guarantees and collateral correspond mainly to loans and receivables in the amount of EUR 225.61 billion at 31st December 2017, and to off-balance sheet commitments in the amount of EUR 43.70 billion (compared with EUR 222.10 billion and EUR 39.01 billion at 31st December 2016, respectively).
Guarantees and collateral received for loans with payments past due but not individually impaired amounted to EUR 3.12 billion at 31st December 2017 (versus EUR 2.21 billion at 31st December 2016), of which EUR 1.28 billion for retail customers and EUR 1.84 billion for other types of counterparty (versus EUR 1.21 billion and EUR 0.99 billion at 31st December 2016, respectively).
Guarantees and collateral received for individually impaired loans amounted to EUR 6.61 billion at 31st December 2017 (versus EUR 7.32 billion at 31st December 2016), of which EUR 2.92 billion for retail customers and EUR 3.68 billion for other types of counterparty (versus EUR 3.42 billion and EUR 3.90 billion at 31st December 2016, respectively). These amounts are capped at the amount of outstanding individually impaired loans.

4 I 4
CREDIT RISKS RRISK FACTORS AND CAPIITAL ADEQUACY
182 I 2018 REGISTRATION DOCUMENT I S O C I E T E G E N E R AL E G R O U P
Use of credit derivatives to manage Corporate concentration risk Within Corporate and Investment Banking, the Credit Portfolio Management (CPM) team is responsible for working in close cooperation with the Risk Division and the businesses to reduce excessive portfolio concentrations and react quickly to any deterioration in the creditworthiness of a particular counterparty. CPM forms part of the department responsible for managing scarce resources for the credit and loan portfolio.
The Group uses credit derivatives in the management of its Corporate credit portfolio, primarily to reduce individual, sector and geographic concentrations and to implement a proactive risk and capital management approach. Individual protection is essentially purchased under the over-concentration management policy.
Total outstanding purchases of protection through Corporate credit derivatives decreased to EUR 0.5 billion at end-December 2017 (compared to EUR 0.8 billion at end-December 2016).
The amounts recognised as assets (EUR 2.2 billion at 31st December 2017 versus EUR 3.9 billion at 31st December 2016) and liabilities (EUR 2.6 billion at 31st December 2017 versus EUR 4.2 billion at 31st December 2016) correspond to the fair value of credit derivatives mainly held under a transaction activity but also under the aforementioned protection purchases.
In 2017, the Credit Default Swap (CDS) spreads from European investment-grade issuances (iTraxx index) narrowed from mid-April onwards. The overall sensitivity of the portfolio to spread widening declined, since the average maturity of protection is now much shorter.
Most protection purchases were made from clearing houses (89% of the outstanding amounts as of 31st December 2017), with the remainder being made from bank counterparties with ratings of A- or above.
Mitigation of counterparty risk linked to market transactions Societe Generale uses various techniques to reduce this risk. With regard to counterparties dealing with market transactions, it seeks to implement master agreements with a termination-clearing clause wherever it can. In the event of default, such agreements provide for netting of all due and payable amounts. These agreements usually call for the revaluation of the collateral required at regular intervals (generally on a daily basis) and for the payment of the corresponding margin calls. Collateral is largely composed of cash and high-quality liquid assets, such as government bonds with a good rating. Other tradable assets are also accepted, provided that the appropriate haircuts are made to reflect the lower quality and/or liquidity of the asset.
Accordingly, at 31st December 2017, most over-the-counter (OTC) transactions were secured: by amount(1), 71% of transactions with positive mark-to-market (collateral received by Societe Generale) and 63% of transactions with negative mark-to-market (collateral posted by Societe Generale).
Management of OTC collateral is monitored on an ongoing basis in order to minimise operational risk:
the exposure value of each collateralised transaction is certified on a daily basis;
specific controls are conducted to make sure the process goes smoothly (settlement of collateral, cash or securities; monitoring of suspended transactions, etc.);
all outstanding secured transactions are reconciled with those of the counterparty according to a frequency set by the regulator (mainly on a daily basis) in order to prevent and/or resolve any disputes on margin calls;
any legal disputes are monitored daily and reviewed by a committee.
Moreover, regulations stipulate that a greater number of OTC derivative instruments must be cleared through clearing houses certified by competent authorities and subject to prudential regulations. The implementation of the European Market Infrastructure Regulation (EMIR) and the Dodd Frank Act – Title VII in the United States is an ongoing process in such respect. Among other things, these regulations aim to improve the stability and transparency of the derivatives market, by means of wider collateralisation of transactions, either through the use of clearing houses, for eligible products, or through bilateral and mandatory margin calls to cover actual exposure (variation margin) and future exposure (initial margins). In 2017, the exchange of variation margins became mandatory for all financial counterparties. Since September 2017, the exchange of initial margins has become mandatory for “category 2” counterparties (financial institutions dealing beyond a certain amount in nominal). This measure will be gradually extended to all other types of counterparty by 2020.
Accordingly, at end-December 2017, 19% of the OTC transactions (amounting to 51% of the nominal) were cleared through central counterparties (CCP).
Transactions stemming from prime brokerage activities are subject to systematic margin calls in order to mitigate the counterparty risk (customers post variation margins and initial margins for Societe Generale on a daily basis, to cover actual and future exposure).
Credit insurance In addition to using export credit agencies (for example Coface and Exim) and multilateral organisations (for example the European Bank for Reconstruction and Development – EBRD), the Group has been developing relationships with private insurers over the last several years in order to hedge some of its loans against commercial and political non-payment risks.
This activity is performed within a risk framework and monitoring system approved by the Group’s General Management. The system is based on an overall limit for the activity, along with sub-limits by maturity, and individual limits for each insurance counterparty, the latter being furthermore required to meet strict eligibility criteria.
The implementation of such a policy contributes to sound overall risk reduction.
(1) Excluding OTC deals cleared in clearing houses.

4
CREDIT RISKS
4 I 4 RRISK FACTORS AND CAP IITAL ADEQUACY
S O C I E T E G E N E R AL E G R O U P I 2018 REGISTRATION DOCUMENT I 183
TABLE 11: CREDIT RISK MITIGATION TECHNIQUES – OVERVIEW
(In EUR m) 31.12.2017
Exposures unsecured -
Carrying amount Exposures secured -
Carrying amount Exposures secured
by collateral
Exposures secured by
financial guarantees
Exposures secured by credit
derivatives
Total loans 432,811 166,691 137,766 28,805 120
Total debt securities
55,222 323 0 323 0
Total exposures 488,0034 167,0014 1137,7666 29,,128 120
RISK MEASUREMENT AND INTERNAL RATINGS In 2007, Societe Generale obtained authorisation from its supervisory authorities to apply the internal ratings-based (IRB) approach to most of its exposures in order to calculate the capital requirements in respect of credit risk.
Since the initial authorisation was given, the transition from the standard approach to the IRB approach for some of its activities and exposures has been selective and is subject to discussion with the supervisory authority.
General framework of the internal approach Audited I To calculate its capital requirements under the IRB method, Societe Generale estimates its Risk-Weighted Assets (RWA) and the Expected Loss (EL) that may be incurred in light of the nature of the transaction, the quality of the counterparty and all measures taken to mitigate risk.
To calculate its RWA, Societe Generale uses its own Basel parameters, which are estimated using its internal risk measurement system:
the Exposure at Default (EAD) value is defined as the Group’s exposure in the event that the counterparty should default. The EAD includes exposures recorded on the balance sheet (loans, receivables, accrued income, market transactions, etc.), and a proportion of off-balance sheet exposures calculated using internal or regulatory Credit Conversion Factors (CCF);
the Probability of Default (PD): the probability that a counterparty of the Bank will default within one year;
the Loss Given Default (LGD): the ratio between the loss incurred on an exposure in the event a counterparty defaults and the amount of the exposure at the time of the default.
The Societe Generale Group also takes into account:
the impact of guarantees and credit derivatives, by substituting the PD, the LGD and the risk-weighting calculation of the guarantor for that of the obligor (the exposure is considered to be a direct exposure to the guarantor) in the event that the guarantor’s risk weighting is more favourable than that of the obligor;
collateral used as guarantees (physical or financial). This impact is factored in either at the level of the LGD models for the pools concerned or on a line-by-line basis.
To a very limited extent, Societe Generale also applies an IRB Foundation approach (where only the probability of default is estimated by the Bank, while the LGD and CCF parameters are determined directly by the supervisory authority) to a portfolio of specialised lending exposures granted to the French subsidiary Franfinance Entreprises.
Moreover, the Group has received authorisation from the regulator to use the IAA (internal assessment approach) method to calculate the regulatory capital requirement for ABCP (Asset-Backed Commercial Paper) securitisation. In addition to the capital requirement calculation objectives under the IRBA method, the Group’s credit risk measurement models contribute to the management of the Group’s operational activities. They also constitute tools to structure, price and approve transactions and participate in the setting of approval limits granted to business lines and the Risk function.
TABLE 12: BREAKDOWN OF EAD BY THE BASEL METHOD
31.12.2017 31.12.2016
IRB 78% 75%
Standard 22% 25%
Total 100% 100%

4 I 4
CREDIT RISKS RRISK FACTORS AND CAPIITAL ADEQUACY
184 I 2018 REGISTRATION DOCUMENT I S O C I E T E G E N E R AL E G R O U P
TABLE 13: SCOPE OF APPLICATION OF THE IRB AND STANDARD APPROACHES FOR THE GROUP
IRB approach Standard approach
French Retail Banking Majority of portfolios Some retail customer portfolios, including those of the SOGELEASE subsidiary
International Retail Banking and Financial Services The subsidiaries KB (Czech Republic), CGI, Fiditalia, GEFA and SG Finans, SG Leasing SPA and Fraer Leasing SPA, SGEF Italy
The other subsidiaries
Global Banking and Investor Solutions
Majority of Corporate and Investment Banking portfolios As for Private Banking, Securities Services and Brokerage, mainly the retail portfolios of the following subsidiaries: SG Hambros, SGBT Luxembourg, SGBT Monaco, SG Private Banking Suisse
For Private Banking, Securities Services and Brokerage, exposures granted to banks and companies
Corporate Centre Majority of portfolios -
Credit risk measurement for wholesale clients The Group’s credit risk measurement system, which estimates internal Basel parameters, uses a quantitative evaluation mechanism coupled with an expert opinion.
For Corporate, Banking and Sovereign portfolios, the measurement system is based on three key components:
a counterparty rating system;
a system that automatically assigns Loss Given Default (LGD) and Credit Conversion Factor (CCF) parameters according to the characteristics of each transaction;
a collection of procedures setting out the rules relating to ratings (scope, revision frequency, rating approval procedure, etc.), as well as to the supervision, backtesting and validation of models. Among other things, these procedures help to support the human judgement that provides the critical scrutiny that is an essential complement to the models for these portfolios.
RATING SYSTEM The rating system consists in assigning a rating to each counterparty according to an internal scale, for which each grade corresponds to a probability of default determined using historical series observed by Standard & Poor’s over more than 20 years.
The following table presents Societe Generale’s internal rating scale and the corresponding scales of the main external credit assessment institutions, as well as the corresponding mean probability of default.
The rating assigned to a counterparty is generally proposed by a model and then adjusted and approved by experts in the Risk function further to the individual analysis of each counterparty.
The counterparty rating models are structured in particular according to the type of counterparty (companies, financial institutions, public entities, etc.), the country, geographic region and size of the company (usually assessed through its annual revenue).
The company rating models are underpinned by statistical models (regression methods) of client default. They combine quantitative parameters derived from financial data that evaluate the sustainability and solvency of counterparties and qualitative parameters that evaluate economic and strategic dimensions.
TABLE 14: SOCIETE GENERALE’S INTERNAL RATING SCALE AND CORRESPONDING SCALES OF RATING AGENCIES
Counterparty internal rating
DBRS FitchRatings Moody’s S&P 1 year probability
1 AAA AAA Aaa AAA 0.01%
2 AA high to AA low AA+ to AA- Aa1 to Aa3 AA+ to AA- 0.02%
3 A high to A low A+ to A- A1 to A3 A+ to A- 0.04%
4 BBB high to BBB low BBB+ to BBB- Baa1 to Baa3 BBB+ to BBB- 0.30%
5 BB high to BB low BB+ to BB- Ba1 to Ba3 BB+ to BB- 2.16%
6 B high to B low B+ to B- B1 to B3 B+ to B- 7.93%
7 CCC high to CCC low CCC+ to CCC- Caa1 to Caa3 CCC+ to CCC- 20.67%
8, 9 and 10 CC and below CC and below Ca and below CC and below 100.00%

4
CREDIT RISKS
4 I 4 RRISK FACTORS AND CAP IITAL ADEQUACY
S O C I E T E G E N E R AL E G R O U P I 2018 REGISTRATION DOCUMENT I 185
LGD MODELS The Loss Given Default (LGD) is an economic loss that is measured by taking into account all parameters pertaining to the transaction, as well as the fees incurred for recovering the receivable in the event of a counterparty default.
The models used to estimate the Loss Given Default (LGD) excluding retail clients are applied by regulatory sub-portfolios, type of asset, size and location of the transaction or of the counterparty, depending on whether or not collateral has been posted, and the nature thereof if applicable. This makes it possible to define homogeneous risk pools, particularly in terms of recovery, procedures and the legal environment.
These estimates are founded on statistics when the number of loans in default is sufficient. In such circumstances, they are based on recovery data observed over a long period.
When the number of defaults is insufficient, the estimate is revised or determined by an expert.
CCF models For its off-balance sheet exposures, the Group is authorised to use the internal approach for “term loan with drawing period” products and revolving credit lines.
TABLE 15: PRINCIPAL CHARACTERISTICS OF MODELS AND METHODS – WHOLESALE CLIENTS
Parameter modelled
Portfolio/Category of Basel assets
Number of methods, models Methodology Number of years default/loss
WHOLESALE CLIENTS
Probability of Default (PD)
Sovereigns Expert rating. Expert method, use of the external ratings of agencies. Low default portfolio.
Public sector entities 4 models according to geographic region. Statistical (regression)/expert methods for the rating process, based on the combination of financial ratios and a qualitative questionnaire. Low default portfolio.
Financial institutions 12 models according to type of counterparty: banks, insurance, funds, financial intermediaries, funds of funds.
Expert models based on a qualitative questionnaire. Low default portfolio.
Specialised financing 3 models according to type of transaction. Expert models based on a qualitative questionnaire. Low default portfolio.
Large corporates 10 models according to geographic region.
Mainly statistical models (regression) for the rating process, based on the combination of financial ratios and a qualitative questionnaire. Defaults observed over a period of 8 to 10 years.
Small- and medium- sized companies
17 models according to the size of the company and the geographic region.
Mainly statistical models (regression) for the rating process, based on the combination of financial ratios and a qualitative questionnaire. Defaults observed over a period of 8 to 10 years.
Loss Given Default (LGD)
Public sector entities – Sovereigns
6 models according to type of counterparty. Calibration based on historical data and expert judgements. Losses observed over a period of more than 10 years.
Large corporates – Flat-rate Approach
>20 models Flat-rate approach according to type of collateral.
Calibration based on historical data adjusted by expert judgements. Losses observed over a period of more than 10 years.
Large corporates – Discount Approach
16 models Discount approach according to type of recoverable collateral.
Statistical calibration based on historical market data adjusted by expert judgements. Losses observed over a period of more than 10 years.
Small- and medium- sized companies
15 models Flat-rate approach according to type of collateral or unsecured.
Statistical calibration based on historical data adjusted by expert judgements. Losses observed over a period of more than 10 years.
Project financing 8 models Flat-rate approach according to project type.
Statistical calibration based on historical data adjusted by expert judgements. Losses observed over a period of more than 10 years.
Financial institutions
6 models Flat-rate approach according to type of counterparty: banks, insurance, funds, etc. and the nature of the collateral.
Statistical calibration based on historical data adjusted by expert judgements. Losses observed over a period of more than 10 years.
Other specific portfolios 6 models: factoring, leasing with option to purchase and other specific cases.
Statistical calibration based on historical data adjusted by expert judgements. Losses observed over a period of more than 10 years.
Credit Conversion Factor (CCF)
Large corporates 5 models: term loans with drawing period, revolving credits, Czech Corporates.
Models calibrated by segment. Defaults observed over a period of more than 10 years.
Expected Loss (EL)
Real estate transactions 2 models by slotting. Statistical model based on expert judgements and a qualitative questionnaire. Low default portfolio.
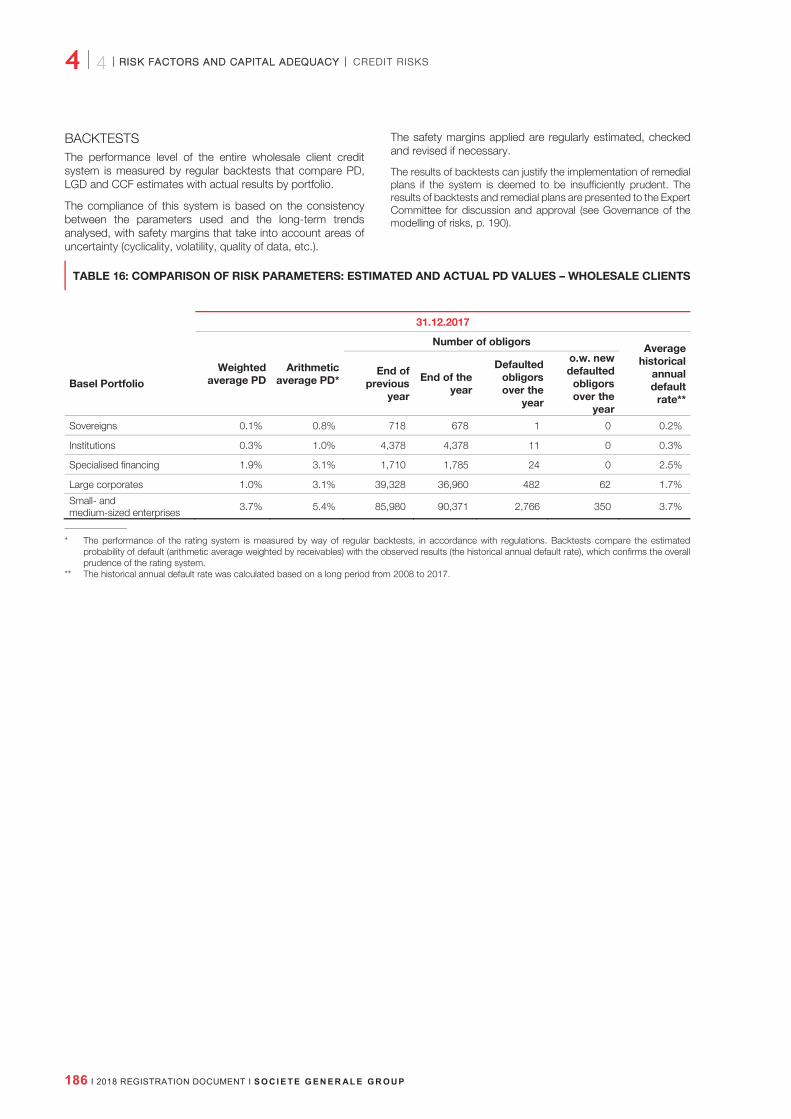
4 I 4
CREDIT RISKS RRISK FACTORS AND CAPIITAL ADEQUACY
186 I 2018 REGISTRATION DOCUMENT I S O C I E T E G E N E R AL E G R O U P
BACKTESTS The performance level of the entire wholesale client credit system is measured by regular backtests that compare PD, LGD and CCF estimates with actual results by portfolio.
The compliance of this system is based on the consistency between the parameters used and the long-term trends analysed, with safety margins that take into account areas of uncertainty (cyclicality, volatility, quality of data, etc.).
The safety margins applied are regularly estimated, checked and revised if necessary.
The results of backtests can justify the implementation of remedial plans if the system is deemed to be insufficiently prudent. The results of backtests and remedial plans are presented to the Expert Committee for discussion and approval (see Governance of the modelling of risks, p. 190).
TABLE 16: COMPARISON OF RISK PARAMETERS: ESTIMATED AND ACTUAL PD VALUES – WHOLESALE CLIENTS
31.12.2017
Weighted average PD
Arithmetic average PD*
Number of obligors Average
historical annual default
rate**
Basel Portfolio End of
previous year
End of the year
Defaulted obligors over the
year
o.w. new defaulted
obligors over the
year
Sovereigns 0.1% 0.8% 718 678 1 0 0.2%
Institutions 0.3% 1.0% 4,378 4,378 11 0 0.3%
Specialised financing 1.9% 3.1% 1,710 1,785 24 0 2.5%
Large corporates 1.0% 3.1% 39,328 36,960 482 62 1.7%
Small- and medium-sized enterprises
3.7% 5.4% 85,980 90,371 2,766 350 3.7%
* The performance of the rating system is measured by way of regular backtests, in accordance with regulations. Backtests compare the estimated probability of default (arithmetic average weighted by receivables) with the observed results (the historical annual default rate), which confirms the overall prudence of the rating system.
** The historical annual default rate was calculated based on a long period from 2008 to 2017.

4
CREDIT RISKS
4 I 4 RRISK FACTORS AND CAP IITAL ADEQUACY
S O C I E T E G E N E R AL E G R O U P I 2018 REGISTRATION DOCUMENT I 187
TABLE 17: COMPARISON OF RISK PARAMETERS: ESTIMATED AND ACTUAL LGD AND EAD VALUES – WHOLESALE CLIENTS
31.12.2017
Basel portfolio Estimated LGD*Actual LGD excluding
safety margin Actual EAD**/estimated EAD
Large corporates 35% 26% 92%
Small- and medium-sized enterprises 39% 27%
* Senior unsecured LGD. ** Modelled CCF (revolving, term loans), only for defaults.
31.12.2016***
Basel portfolio Estimated LGD* Actual LGD excluding
safety marginActual EAD**/estimated EAD
Large corporates 35% 26% 95%
Small- and medium-sized enterprises 40% 29%
* Senior unsecured LGD. ** Modelled CCF (revolving, term loans), only for defaults. *** Taking into account methodological change following the supervisory authority’s remarks as part of an internal models’ review (TRIM).
Credit risk measurements of retail clients
PROBABILITY OF DEFAULT MODELS The modelling of the probability of default of retail client counterparties is carried out specifically by each of the Group’s business lines recording its assets using the IRBA method. The models incorporate data on the payment behaviour of counterparties. They are segmented by type of customer and distinguish between retail customers, professional customers, very small businesses and real-estate investment companies (sociétés civiles immobilières).
The counterparties of each segment are classified automatically, using statistical models, into homogeneous risk pools, each of which is assigned a probability of default.
Once the counterparties have been classified into statistically distinct homogeneous risk pools, the probability of default parameters are estimated by observing the average long-term default rates for each product. These estimates are adjusted by a safety margin to estimate as best as possible a complete default cycle, using a through-the-cycle (TTC) approach.
LGD MODELS The models for estimating the Loss Given Default (LGD) of retail customers are specifically applied by business line portfolio. LGD values are estimated by product, according to the existence or not of collateral.
Consistent with operational recovery processes, estimate methods are generally based on a two-step modelling process that initially estimates the proportion of defaulted loans in loan termination, followed by the loss incurred in case of loan termination.
The expected losses are estimated using internal long-term historical recovery data for exposures that have defaulted. These estimates are adjusted by safety margins in order to reflect the possible impact of a downturn.
CCF MODELS For its off-balance sheet exposures, Societe Generale applies its estimates for revolving loans and overdrafts on current accounts held by retail and professional customers.

4 I 4
CREDIT RISKS RRISK FACTORS AND CAPIITAL ADEQUACY
188 I 2018 REGISTRATION DOCUMENT I S O C I E T E G E N E R AL E G R O U P
TABLE 18: PRINCIPAL CHARACTERISTICS OF MODELS AND METHODS USED – RETAIL CLIENTS
Parameter modelled
Portfolio/Category of Basel assets
Number of models Methodology Number of years of default/loss
RETAIL CLIENTS
Probability of Default (PD)
Residential real estate
8 models according to entity, type of guarantee (security, mortgage), type of counterparty: individuals or professionals/VSB, real-estate investment company (SCI).
Statistical model (regression), behavioural score. Defaults observed over a period of more than 5 years.
Other loans to individual customers
15 models according to entity and to the nature and object of the loan: personal loan, consumer loan, car loan, etc.
Statistical model (regression), behavioural score. Defaults observed over a period of more than 5 years.
Renewable exposures 5 models according to entity and nature of the loan: overdraft on current account, revolving credit or consumer loan.
Statistical model (regression), behavioural score. Defaults observed over a period of more than 5 years.
Professionals and very small businesses
10 models according to entity, nature of the loan (medium- and long-term investment credits, short-term credit, car loans), and type of counterparty (individual or real-estate investment company (SCI)).
Statistical model (regression or segmentation), behavioural score. Defaults observed over a period of more than 5 years.
Loss Given Default (LGGD)
Residential real estate
8 models according to entity, type of guarantee (security, mortgage), and type of counterparty: individuals or professionals/VSB, real-estate investment company (SCI).
Statistical model of expected recoverable flows based on the current flows. Model adjusted by expert opinions if necessary. Losses and recoverable flows observed over a period of more than 10 years.
Other loans to individual customers
17 models according to entity and to the nature and object of the loan: personal loan, consumer loan, car loan, etc.
Statistical model of expected recoverable flows based on the current flows. Model adjusted by expert opinions if necessary. Losses and recoverable flows observed over a period of more than 10 years.
Renewable exposures 7 models according to entity and nature of the loan: overdraft on current account, revolving credit or consumer loan.
Statistical model of expected recoverable flows based on the current flows. Model adjusted by expert opinions if necessary. Losses and recoverable flows observed over a period of more than 10 years.
Professionals and very small businesses
12 models according to entity, nature of the loan (medium- and long-term investment credits, short-term credit, car loans), and type of counterparty (individual or real- estate investment company (SCI)).
Statistical model of expected recoverable flows based on the current flows. Model adjusted by expert opinions if necessary. Losses and recoverable flows observed over a period of more than 10 years.
Credit Conversion Factor (CCF)
Renewable exposures 12 calibrations by entity for revolving products and personal overdrafts.
Models calibrated by segment over a period of observation of defaults of more than 5 years.
Expected Loss ((EL)
Private Banking exposures
PD and LGD derived from loss observations. Models restructured into a PD/LGD-based approach. Implementation under way following authorisation for use from the supervisory authorities.

4
CREDIT RISKS
4 I 4 RRISK FACTORS AND CAP IITAL ADEQUACY
S O C I E T E G E N E R AL E G R O U P I 2018 REGISTRATION DOCUMENT I 189
BACKTESTS The performance level of the entire retail client credit system is measured by regular backtests, which check the performance of PD, LGD and CCF models and compare estimated figures with actual figures.
Each year, the average long-term default rate observed for each homogeneous risk pool is compared with the PD. If necessary, the calibrations of PD are adjusted to preserve a satisfactory safety margin. The discrimination level of the models and changes in the portfolio’s composition are also measured.
Regarding the LGD, the backtest consists in comparing the last estimation of the LGD obtained by computing the average level of payments observed and the value used to calculate regulatory capital.
The difference should in this case reflect a sufficient safety margin to take into account a potential economic slowdown, uncertainties as to the estimation, and changes in the performance of recovery
processes. The adequacy of this safety margin is assessed at an Expert Committee meeting. Likewise, for the CCF, the level of conservatism of estimates is assessed annually by comparing estimated drawdowns to observed drawdowns on the undrawn part.
The results presented below for the PD cover all the portfolios of the Group entities with the exception of Private Banking, for which a new model is currently being implemented.
The exposures to retail customers of subsidiaries specialised in Equipment Financing are integrated into the retail customer portfolio under the “VSB and professionals” sub-portfolio (exposures of GEFA, SGEF Italy, SG Finans).
The figures below aggregate French, Czech, German, Scandinavian and Italian exposures. For all the Basel portfolios of retail clients, the actual default rate is lower than the estimated probability of default (arithmetic average), which confirms the overall conservatism of the rating system.
TABLE 19: COMPARISON OF ESTIMATED RISK PARAMETERS: ESTIMATED AND ACTUAL PD VALUES – RETAIL CLIENTS
31.12.2017
Weighted average PD
Arithmetic average PD*
Numbers of obligors*** Average historical
annual default
rate** Basel Portfolio
End of previous
year End of the
year
Defaulted obligors in
the year
Other loans to individual customers 3.3% 4.3% 2,020,251 2,065,487 70,600 4.2%
Real estate loans**** 1.3% 1.2% 802,333 817,872 8,089 1.2%
Revolving credits 5.3% 2.7% 8,018,541 7,794,888 158,363 2.3%
VSB and professionals 4.3% 4.2% 815,377 823,911 35,257 4.2%
* The performance of the rating system is measured by way of regular backtests, in accordance with regulations. Backtests compare the estimated probability of default (arithmetic average weighted by receivables) with the observed results (the historical annual default rate), which confirms the overall prudence of the rating system.
** The historical annual default rate was calculated based on a long period from 2010 to 2017. *** Include this year creditor current in accordance with the revised guidelines of the EBA publication of 14th December 2016 (EBA/GL/2016/11). **** Guaranteed and non-guaranteed exposures.

4 I 4
CREDIT RISKS RRISK FACTORS AND CAPIITAL ADEQUACY
190 I 2018 REGISTRATION DOCUMENT I S O C I E T E G E N E R AL E G R O U P
TABLE 20: COMPARISON OF RISK PARAMETERS: ESTIMATED AND ACTUAL LGD AND EAD VALUES – RETAIL CLIENTS
31.12.2017
Basel portfolio Estimated LGD* Actual LGD excluding safety margin Actual EAD**/estimated EAD
Real estate loans (excl. guaranteed exposures) 18% 13% -
Revolving credits 45% 39% 73%
Other loans to individual customers 27% 22% -
VSB and professionals 26% 22% 77%
Total Group Retail Clients* 25% 20% 74%
* Excluding guaranteed exposures. ** Revolving credits and current accounts of individual and professional customers. 31.12.2016
Basel portfolio Estimated LGD* Actual LGD excluding safety margin Actual EAD**/estimated EAD
Real estate loans (excl. guaranteed exposures) 17% 13% -
Revolving credits 43% 39% 71%
Other loans to individual customers 26% 22% _
VSB and professionals 26% 22% 77%
Total Group Retail Clients* 24% 20% 73%
* Excluding guaranteed exposures. ** Revolving credits and current accounts of individual and professional customers.
Governance of the modelling of risks Governance consists in developing, validating and monitoring decisions on changes with respect to internal credit risk measurement models. An independent and dedicated validation department within the Risk Division is more specifically responsible for validating the credit models and parameters used for the IRB method and monitoring the use of the rating system. The internal model validation team draws up an annual audit plan specifying the nature and extent of work that needs to be carried out, in particular according to regulatory constraints, model risks, issues covered by the model and the strategic priorities of the business lines. It is careful to coordinate its work with the Internal Audit Division to ensure a simultaneous overall review (modelling and banking aspects) of the business scopes requiring such a review. The model validation team is included within the scope subject to inspections by the Internal Audit Division.
The internal validation protocol for new models and annual backtesting is broken down into three stages:
a preparation stage during which the validation team takes control of the model and the environment in which it is built and/or backtested, ensures that the expected deliverables are complete, and draws up a working plan;
an investigation stage intended to collect all statistical and banking data required to assess the quality of the models. For subjects with statistical components, a review is performed by the independent model control entity, whose conclusions are formally presented to the modelling entities within the framework of a committee (Models Committee);
a validation stage that is structured around an Expert Committee whose purpose is to validate the Basel parameters of an internal model from a banking perspective. The Expert Committee is a body reporting to the Group Chief Risk Officer and to the Management of the business divisions concerned.
The Expert Committee is also responsible for defining the review guidelines and for revising models at the proposal of the Models Committee. These guidelines take into account the regulatory requirements and economic and financial issues of the business lines.
In accordance with the Delegated Regulation (EU) No. 529/2014 of 20th May 2014 regarding the monitoring of internal models used to calculate capital requirements, changes to the Group’s credit risk measurement system are subject to one of three types of notification to the competent supervisory authority, depending on the significance of the change, evaluated according to this rule:
significant changes are subject to a request for authorisation prior to their implementation;
the supervisory authority is notified of changes which are not significant according to the criteria defined by the regulation. Barring a negative response within a two-month period, such changes may be implemented;
the competent authorities are notified of all other changes after their implementation, at least once annually in a specific report.

4
CREDIT RISKS
4 I 4 RRISK FACTORS AND CAP IITAL ADEQUACY
S O C I E T E G E N E R AL E G R O U P I 2018 REGISTRATION DOCUMENT I 191
QUANTITATIVE INFORMATION Audited I The measurement used for credit exposures in this section is EAD – Exposure At Default (on- and off-balance sheet). Under the Standard Approach, EAD is calculated net of collateral and provisions. EAD is broken down according to the guarantor’s characteristics, after taking into account the substitution effect (unless otherwise indicated).
The presentation of the data, applied since last year, is in line with the guidelines on prudential disclosure requirements published by the European Banking Authority (EBA) in December 2016 (document EBA/GL/2016/11).
This presentation highlights the exposure categories as defined in the portfolios of the COREP regulatory financial statements, in relation to EBA requirements on Pillar 3.
Audited I Credit risk exposure At 31st December 2017, the Group’s Exposure at Default (EAD) amounted to EUR 872 billion.
CREDIT RISK EXPOSURE BY EXPOSURE CLASS (EAD) AT 31ST DECEMBER 2017
On- and off-balance sheet exposures (EUR 872 billion in EAD)
CREDIT RISK EXPOSURE BY EXPOSURE CLASS (EAD) AT 31ST DECEMBER 2016
On- and off-balance sheet exposures (EUR 878 billion in EAD).
RETAIL CREDIT RISK EXPOSURE BY EXPOSURE CLASS (EAD) AT 31ST DECEMBER 2017
On- and off-balance sheet exposures (EUR 184 billion in EAD)
RETAIL CREDIT RISK EXPOSURE BY EXPOSURE CLASS (EAD) AT 31ST DECEMBER 2016
On- and off-balance sheet exposures (EUR 177 billion in EAD)
* Institutions: Basel classification bank and public sector portfolios.
25%
12%
34%
21%
8%222%
15%
335%
20%
88%
53%
4%
28%
15%
53%
4%
28%
15%
Institutions*
Retail
Sovereign Corporates
Others
Sovereign Corporates
Retail Others
Institutions*
Revolving credits
Other credits to individuals Small entities and self- employed
Residential mortgages
Small entities and self- employed
Other credits to individuals
Revolving credits Residential mortgages

4 I 4
CREDIT RISKS RRISK FACTORS AND CAPIITAL ADEQUACY
192 I 2018 REGISTRATION DOCUMENT I S O C I E T E G E N E R AL E G R O U P
SECTOR BREAKDOWN OF GROUP CORPORATE EXPOSURE (BASEL PORTFOLIO)
EAD of the Corporate portfolio is presented in accordance with the Basel rules (large corporates, including insurance companies, funds and hedge funds, SMEs, specialist financing, factoring businesses), based on the obligor’s characteristics, before taking into account the substitution effect (credit risk scope: debtor, issuer and replacement risk).
At 31st December 2017, the Corporate portfolio amounted to EUR 319 billion (on- and off-balance sheet exposures measured in EAD). Only the Finance and Insurance sector accounts for more than 10% of the portfolio. The Group’s exposure to its ten largest Corporate counterparties accounts for 6% of this portfolio.
Finance & insurance16%
Real Estate8%
Public administration1%
Food & agriculture4%
Consumer goods2%
Chemicals, rubber, plastics2%
Retail trade5%
Wholesale trade8%
Transport equip. manuf.2%
Construction3%
Hotels & Catering2%
Automobiles2%
Machinery and equipment4% Media 1%
Metals, minerals4%
Oil and gas6%
Health, social services1%
Business services9%
Collective services6%
Telecoms3%
Transport & logistics6%
Others6%
331.12.2017
EEUR 3319 bbnn

4
31.12.2017EUR 319 bn
CREDIT RISKS
4 I 4 RRISK FACTORS AND CAP IITAL ADEQUACY
S O C I E T E G E N E R AL E G R O U P I 2018 REGISTRATION DOCUMENT I 193
Corporate and bank counterparty exposure
AUDITED I BREAKDOWN OF RISK BY INTERNAL RATING FOR CORPORATE CLIENTS AT 31ST DECEMBER 2017 (AS % OF EAD)
BREAKDOWN OF RISK BY INTERNAL RATING FOR CORPORATE CLIENTS AT 31ST DECEMBER 2016 (AS % OF EAD)
Audited I The scope includes performing loans recorded under the IRB method (excluding prudential classification criteria, by weight, of specialised financing) for the entire Corporate client portfolio, all divisions combined, and represents EAD of EUR 237 billion (out of total EAD for the Basel Corporate client portfolio of EUR 295 billion, standard method included).
The breakdown by rating of the Group’s Corporate exposure demonstrates the sound quality of the portfolio. It is based on an
internal counterparty rating system, presented above as its Standard & Poor’s equivalent.
At 31st December 2017, the majority of the portfolio (64% of Corporate clients) had an investment grade rating, i.e. counterparties with an S&P-equivalent internal rating higher than BBB-. Transactions with non-investment grade counterparties were very often backed by guarantees and collateral in order to mitigate the risk incurred.
AUDITED I BREAKDOWN OF RISK BY INTERNAL RATING FOR BANKING CLIENTS AT 31ST DECEMBER 2017 (AS % OF EAD)
BREAKDOWN OF RISK BY INTERNAL RATING FOR BANKING CLIENTS AT 31ST DECEMBER 2016 (AS % OF EAD)
Audited I The scope includes performing loans recorded under the IRB method for the entire bank client portfolio, all divisions combined, and represents EAD of EUR 54 billion (out of total EAD for the Basel bank client portfolio of EUR 109 billion, standard method included). The breakdown by rating of the Societe Generale Group’s bank counterparty exposure demonstrates the sound quality of the portfolio.
It is based on an internal counterparty rating system, presented above as its Standard & Poor’s equivalent.
At 31st December 2017, exposure on banking clients was concentrated in investment grade counterparties (95% of exposure), as well as in developed countries (91%).
AAA AAA A BBBB BB BB <B00%
10%
220%
30%
440%
50%
AAA AAA A BBBB BB BB <B00%
10%
220%
30%
440%
50%
AAA AAA A BBBB BB BB <B00%
10%
220%
30%
440%
50%
AAA AA A BBB BB B <B00%
10%
220%
30%
440%
50%

4 I 4
CREDIT RISKS RRISK FACTORS AND CAPIITAL ADEQUACY
194 I 2018 REGISTRATION DOCUMENT I S O C I E T E G E N E R AL E G R O U P
Audited I Geographic breakdown of Group credit risk exposure
GEOGRAPHIC BREAKDOWN OF GROUP CREDIT RISK EXPOSURE AT 31ST DECEMBER 2017 (ALL CLIENT TYPES INCLUDED): EUR 872 BN
GEOGRAPHIC BREAKDOWN OF GROUP CREDIT RISK EXPOSURE AT 31ST DECEMBER 2016 (ALL CLIENT TYPES INCLUDED): EUR 878 BN
At 31st December 2017, 89% of the Group’s on- and off-balance sheet exposure was concentrated in the major industrialised countries(1). Almost half of the overall amount of outstanding loans was to French customers (28% exposure to non-retail portfolio and 16% to retail portfolio).
GEOGRAPHIC BREAKDOWN OF GROUP CREDIT EXPOSURE ON TOP TEN COUNTRIES AT 31ST DECEMBER 2017: EUR 716 BN
GEOGRAPHIC BREAKDOWN OF GROUP CREDIT EXPOSURE ON TOP TEN COUNTRIES AT 31ST DECEMBER 2016: EUR 712 BN
The Group’s exposure on its top ten countries represented 82% of total exposure (i.e. EUR 716 billion of EAD) at 31st December 2017 (versus 80% and EUR 712 billion of EAD at 31st December 2016).
(1) As defined by the IMF in its World Economic Outlook document of October 2017.
44%
23%
7%
3%
13%
1%5% 4%
France Western Europe (excl. France)Eastern Europe EU Eastern Europe (excl. EU)North America Latin America and CaribbeanAsia Pacific Africa and Middle East
442%
23%
77%
3%
115%
1%55% 4%
France Western Europe (excl. France)Eastern Europe EU Eastern Europe (excl. EU)North America Latin America and CaribbeanAsia Pacific Africa and Middle East
44%
13%5%
5%
4%
3%
2%2%2%
2%
18%
France United StatesUnited Kingdom GermanyCzech Republic SwitzerlandLuxembourg ItalyRussian Federation JapanOthers
42%
14%6%
5%
4%2%2%2%2%1%
20%
France United StatesUnited Kingdom GermanyCzech Republic SwitzerlandLuxembourg ItalyRussian Federation JapanOthers

4
CREDIT RISKS
4 I 4 RRISK FACTORS AND CAP IITAL ADEQUACY
S O C I E T E G E N E R AL E G R O U P I 2018 REGISTRATION DOCUMENT I 195
TABLE 21: GEOGRAPHIC BREAKDOWN OF GROUP CREDIT EXPOSURE ON TOP FIVE COUNTRIES BY EXPOSURE CLASS (IN %)
France United States United Kingdom Germany Czech Republic
2017 2016 2017 2016 2017 2016 2017 2016 2017 2016
Sovereign 21% 20% 37% 32% 11% 9% 22% 21% 22% 25%
Institutions 8% 8% 19% 25% 33% 39% 22% 25% 4% 5%
Corporates 29% 30% 34% 34% 39% 39% 26% 25% 36% 32%
Retail 36% 36% 0% 0% 6% 5% 23% 21% 35% 34%
Other 6% 6% 10% 9% 11% 8% 7% 8% 3% 4%
Counterparty risk
TABLE 22: COUNTERPARTY RISK, EAD AND RWA BY METHOD AND EXPOSURE CLASS (IN EUR M)
Counterparty risk is broken down as follows:
31.12.2017
IRB Standard Total
Exposure class Exposure EAD RWA Exposure EAD RWA Exposure EAD RWA
Sovereign 16,632 16,637 415 78 78 13 16,711 16,715 429
Institutions 19,289 19,289 3,831 30,593 30,593 1,649 49,882 49,882 5,480
Corporates 41,202 41,198 12,481 4,268 4,268 3,987 45,470 45,465 16,468
Retail 114 114 6 280 1 1 395 115 8
Other 12 12 0 1,203 1,203 1,171 1,215 1,215 1,171
Total 77,2250 77,2250 16,7734 36,4422 36,1143 6,8822 113,6672 113,3393 23,5556
31.12.2016
IRB Standard Total
Exposure class Exposure EAD RWA Exposure EAD RWA Exposure EAD RWA
Sovereign 10,442 10,442 235 56 56 1 10,498 10,498 236
Institutions 19,639 19,639 4,411 38,213 38,213 941 57,852 57,852 5,352
Corporates 51,010 51,010 14,754 4,754 4,754 4,344 55,764 55,764 19,098
Retail 42 42 5 249 249 15 291 291 20
Other 15 15 0 1,062 1,062 1,062 1,077 1,077 1,062
Total 81,148 81,148 19,406 44,333 44,333 6,363 125,481 125,481 25,770

4 I 4
CREDIT RISKS RRISK FACTORS AND CAPIITAL ADEQUACY
196 I 2018 REGISTRATION DOCUMENT I S O C I E T E G E N E R AL E G R O U P
Change in risk-weighted assets (RWA) and capital requirements for credit and counterparty risks
TABLE 23: CHANGE IN RISK-WEIGHTED ASSETS (RWA) BY METHOD AND EXPOSURE CLASS ON OVERALL CREDIT RISK (CREDIT AND COUNTERPARTY – IN EUR M)
(In EUR m) RWA - IRB
RWA - Standard
RWA - Total Capital
requirements - IRB
Capital requirements
- Standard
Capital requirements
- total RWA as at end of previous reporting period (31.12.2016)
175,493 113,628 289,121 14,039 9,090 23,130
Asset size 4,124 5,064 9,188 330 405 735
Asset quality 513 (269) 244 41 (22) 20
Model updates (629) 0 (629) (50) 0 (50)
Methodology and policy (2,525) 0 (2,525) (202) 0 (202)
Acquisitions and disposals (90) (1,066) (1,155) (7) (85) (92)
Foreign exchange movements (4,401) (2,779) (7,180) (352) (222) (574)
Other (806) (508) (1,315) (65) (41) (105)
RWA as at end of reporting period (31.12.2017)
171,679 114,070 285,749 13,734 9,126 22,860
The table above presents the data without the CVA (Credit Value Adjustment).
The main effects explaining the EUR 3.4 billion drop in weighted assets (excluding CVA) in 2017 are as follows:
an increase of EUR +9.2 billion related to growth in the ALD fleet (EUR +3.6 billion), growth of EUR +1 billion in Banka, and growth of EUR 1.3 billion in the French network;
a net effect on changes in the prudential scope of EUR -1.2 billion with the disposal of the entity SG Splitska Banka (EUR -2.2 billion) and an increased interest in the insurance scope (EUR +0.6 billion);
a foreign exchange effect (EUR -7.1 billion), related primarily to the depreciation of the American dollar against the euro (EUR -5.3 billion).
The effects are defined as follows:
Asset size: organic changes in book size and composition (including the creation of new business lines and maturing loans) but excluding changes due to acquisitions and disposals of entities.
Asset quality: changes in the quality of the Bank’s assets due to changes in borrower risk, such as rating grade migration or similar effects.
Model updates: changes due to model implementation, changes in model scope, or any changes intended to address model weaknesses.
Methodology and policy: changes due to methodological changes in calculations driven by regulatory changes, including both revisions to existing regulations and new regulations.
Acquisitions and disposals: changes in book size due to acquisitions and disposals of entities.
Foreign exchange movements: changes arising from market fluctuations, such as foreign currency translation movements.
Other: this category is used to capture changes that cannot be attributed to any other category.
The Group’s net cost of risk
French Retail Banking
International Retail Banking and Financial Services’
Global Banking and Investor Solutions’
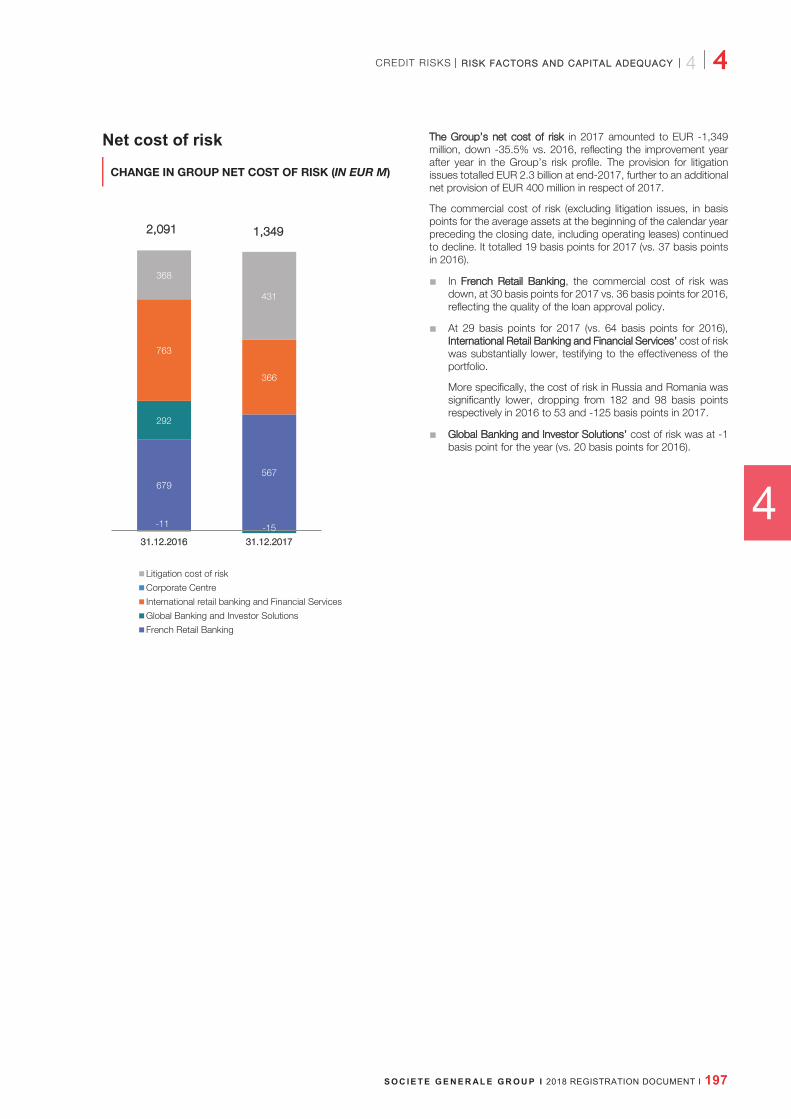
4
CREDIT RISKS
4 I 4 RRISK FACTORS AND CAP IITAL ADEQUACY
S O C I E T E G E N E R AL E G R O U P I 2018 REGISTRATION DOCUMENT I 197
Net cost of risk
CHANGE IN GROUP NET COST OF RISK (IN EUR M)
TThe Group’ss net cost of risk in 2017 amounted to EUR -1,349 million, down -35.5% vs. 2016, reflecting the improvement year after year in the Group’s risk profile. The provision for litigation issues totalled EUR 2.3 billion at end-2017, further to an additional net provision of EUR 400 million in respect of 2017.
The commercial cost of risk (excluding litigation issues, in basis points for the average assets at the beginning of the calendar year preceding the closing date, including operating leases) continued to decline. It totalled 19 basis points for 2017 (vs. 37 basis points in 2016).
In FFrench Retail Banking, the commercial cost of risk was down, at 30 basis points for 2017 vs. 36 basis points for 2016, reflecting the quality of the loan approval policy.
At 29 basis points for 2017 (vs. 64 basis points for 2016), International Retail Banking and Financial Services’’ cost of risk was substantially lower, testifying to the effectiveness of the portfolio.
More specifically, the cost of risk in Russia and Romania was significantly lower, dropping from 182 and 98 basis points respectively in 2016 to 53 and -125 basis points in 2017.
Global Banking and Investor Solutions’’ cost of risk was at -1 basis point for the year (vs. 20 basis points for 2016).
679567
292
-15
763
366
368
431
31.12.2016 331.12.2017
Litigation cost of risk
Corporate Centre
International retail banking and Financial Services
Global Banking and Investor Solutions
French Retail Banking
-11
1,34922,091

4 I 4
CREDIT RISKS RRISK FACTORS AND CAPIITAL ADEQUACY
198 I 2018 REGISTRATION DOCUMENT I S O C I E T E G E N E R AL E G R O U P
Audited I Specific provisions and impairment for credit risks Impairment and provisions for credit risks are primarily booked for doubtful and disputed loans (customer loans and receivables, amounts due from banks, operating leases, lease financing and similar agreements).
BREAKDOWN OF DOUBTFUL AND DISPUTED LOANS BY GEOGRAPHIC REGION AT 31ST DECEMBER 2017
BREAKDOWN OF DOUBTFUL AND DISPUTED LOANS BY GEOGRAPHIC REGION AT 31ST DECEMBER 2016
At 31st December 2017, these individually impaired loans amounted to EUR 20.9 billion (versus EUR 23.9 billion at 31st December 2016).
BREAKDOWN OF PROVISIONS AND IMPAIRMENT BY GEOGRAPHIC REGION AT 31ST DECEMBER 2017
BREAKDOWN OF PROVISIONS AND IMPAIRMENT BY GEOGRAPHIC REGION AT 31ST DECEMBER 2016
At 31st December 2017, these loans were provisioned or impaired for an amount of EUR 11.3 billion (vs. EUR 13.6 billion at 31st December 2016).
The 2016 figures relating to these provisions and impairments were adjusted.
France51%
Western Europe (excl. France)
12%
Eastern Europe EU10%
Eastern Europe (excl. EU)
7%
Africa and Middle East14%
North America4%
Other2%
France48%
Western Europe (excl. France)11%
Eastern Europe EU12%
Eastern Europe (excl. EU)9%
Africa and Middle East11%
North America
7%
Other2%
France46%
Western Europe (excl. France)12%
Eastern Europe EU12%
Eastern Europe (excl. EU)9%
Africa and Middle East16%
North America
2%
Other3%
France41%
Western Europe (excl. France)10%
Eastern Europe EU14%
Eastern Europe (excl. EU)11%
Africa and Middle East13%
North America
8%
Other3%
I

4
CREDIT RISKS
4 I 4 RRISK FACTORS AND CAP IITAL ADEQUACY
S O C I E T E G E N E R AL E G R O U P I 2018 REGISTRATION DOCUMENT I 199
Audited II Impairment on groups of homogeneous assets At 31st December 2017, the Group’s impairment on groups of homogeneous assets amounted to EUR 1.3 billion (vs. EUR 1.5 billion at 31st December 2016).
TABLE 24: PROVISIONING OF DOUBTFUL LOANS (IN EUR BN)
31.12.2017 31.12.2016
Gross book outstandings 478.7 479.1
Doubtful loans 20.9 23.9
Gross doubtful loans ratio 4.4% 5.0%
Specific provisions 11.3 13.7
Provisions on groups of homogeneous assets 1.3 1.5
Gross doubtful loans coverage ratio (Overall provisions/doubtful loans) 61% 64%
Scope: customer loans, amounts due from banks, operating leases, lease financing and similar agreements.
Detail regarding guarantees and collateral is available on page 181.
Restructured debt Audited I For the Societe Generale Group, “restructured” debt refers to loans whose amount, term or financial conditions have been contractually modified due to the borrower’s insolvency (whether insolvency has already occurred or will definitely occur unless the debt is restructured). Societe Generale aligns its definition of restructured loans with the EBA definition.
Restructured debt does not include commercial renegotiations involving customers for which the Bank has agreed to renegotiate the debt in order to maintain or develop a business relationship, in accordance with credit approval rules in force and without relinquishing any of the principal or accrued interest.
Any situation leading to debt restructuring entails placing the customer in question in the Basel default category and classifying the loans themselves as impaired.
The customers whose loans have been restructured are kept in the default category for as long as the Bank remains uncertain of their ability to meet their future commitments and for at least one year.
Restructured debt totalled EUR 6.18 billion at 31st December 2017.
TABLE 25: RESTRUCTURED DEBT (IN EUR M)
(In EUR m) 31.12.2017 31.12.2016
Non-performing restructured debt 5,161 5,819
Performing restructured debt 1,021 1,031
Total 6,1182 6,8850

4 I 4
CREDIT RISKS RRISK FACTORS AND CAPIITAL ADEQUACY
200 I 2018 REGISTRATION DOCUMENT I S O C I E T E G E N E R AL E G R O U P
Audited I Loans and advances past due but not individually impaired
Loans and advances in the on-balance sheet credit portfolio that are past due but not individually impaired are broken down as follows:
TABLE 26: LOANS AND ADVANCES PAST DUE BUT NOT INDIVIDUALLY IMPAIRED (IN EUR BN)
31.12.2017 31.12.2016
(In EUR bn)
between 1 and 30
days
between 31 and 90 days
between 91 and
180 days
more than 180 days Total
between 1 and 30
days
between 31 and 90 days
between 91 and
180 days
more than 180 days Total
Due from banks (A) 0.002 0.002 0.000 0.000 0.004 0.003 0.002 0.000 0.000 0.005
Sovereign (B) 0.01 0.01 0.00 0.01 0.03 0.06 0.00 0.00 0.00 0.06
Corporates (C) 2.96 0.78 0.18 0.16 4.08 1.74 0.64 0.14 0.22 2.74
Retail (D) 2.14 0.75 0.11 0.05 3.05 2.08 0.76 0.06 0.04 2.94
Customer loans (E = B + C + D)
5.111 1.554 0.229 0.222 7.116 3.888 1.440 0.220 0.226 5.774
Total (F = A + E) 5.113 1.556 0.229 0.222 7.220 3.991 1.442 0.220 0.226 5.779
The amounts presented in the table above include loans and advances that are past due for technical reasons, which primarily affect the “between 1 and 30 days” category. Loans and advances past due for technical reasons are loans and advances that are classified as past due on account of a delay between the value date and the date of recognition in the customer’s account.
The total declared past due loans and advances not individually impaired includes all receivables (outstanding principal, interest and past due amounts) with at least one recognised past due amount.
These outstanding loans and advances can be placed on a watch list as soon as the first payment is past due.
At 31st December 2017, past due loans and advances not individually impaired accounted for 1.6% of unimpaired on-balance sheet assets excluding debt instruments and including loans and advances past due for technical reasons (for a total of EUR 439.89 billion). The proportion at 31st December 2016 was 1.3% of unimpaired on-balance sheet assets excluding debt instruments.
4
MARKET RISKS
5 I 4 RRISK FACTORS AND CAP IITAL ADEQUACY
S O C I E T E G E N E R AL E G R O U P I 2018 REGISTRATION DOCUMENT I 201
5 . M A R K E T R I S K S
Audited I Market risks are the risks of loss of value on financial instruments arising from changes in market parameters, the volatility of these parameters, and the correlations between them. These parameters include, but are not limited to, exchange rates,
interest rates, the price of securities (equities or bonds), commodities, derivatives and other assets. They concern all trading book transactions and some banking book portfolios.
METHODS FOR MEASURING MARKET RISK AND DEFINING LIMITS The Group’s market risk assessment is based on several types of indicators, which are monitored through limits:
the 99% Value-at-Risk (VaR): in accordance with the regulatory internal model, this global indicator is used for the day-to-day monitoring of the market risks incurred by the Group within the scope of its trading activities;
stress test measurements, based on decennial shock-type indicators, which make it possible to restrict the Group’s exposure to systemic risk and exceptional market shocks. The measurements can be multi-risk factor (based on historic or hypothetical scenarios), by activity or risk factor in order to take into account extreme risks on a specific market, or event-driven, to temporarily monitor a particular situation;
sensitivity and nominal indicators used to manage the size of positions: sensitivities are used to monitor the risk incurred locally on a given type of position (e.g. sensitivity of an option
to changes in the underlying asset), while nominal indicators are used for significant positions in terms of risk, and make it possible to monitor the order of magnitude on exposures without netting effects;
additional metrics such as concentration risk or holding period, maximum maturity, etc.
The following indicators are also calculated: stressed VaR (SVaR) on a daily basis, and IRC (Incremental Risk Charge) and CRM (Comprehensive Risk Measure) on a weekly basis. The capital charges arising from these internal models complement the VaR by taking into account the rating migration risks and the default risks, and by limiting the procyclical nature of capital requirements.
ALLOCATION OF MARKET RISK APPETITE WITHIN THE GROUP Risk appetite is defined as the level of risk that the Group is prepared to assume to achieve its strategic goals.
The business development strategy of the Group for market activities is primarily focused on meeting client needs(1), with a full range of products and solutions. The risk resulting from these market activities is strictly managed through a set of limits for several indicators (stress tests, VaR, sensitivity and nominal indicators, etc.).
The Market Risk Department is responsible for the assessment and validation of the limit requests submitted by the different business lines. These limits ensure that the Group complies with the market risk appetite approved by the Board of Directors, further to a proposal from General Management(2).
The choice and calibration of these limits thus transpose the Group’s market risk appetite:
they are allocated at various levels of the Group’s structure and/or by risk factor, thereby ensuring the operational transposition of the Group’s market risk appetite through its organisation;
their calibration is determined using a detailed analysis of the risks related to the portfolio managed. This analysis may
include various elements such as market conditions, specifically liquidity, position manoeuvrability, income generated in view of risks taken, etc;
regular reviews make it possible to manage risks according to the prevailing market conditions;
specific limits, or even bans, may be put in place to manage risks for which the Group has little or no risk appetite.
The limits set for each activity are monitored daily by the MACC (Market Analysis and Certification Community), in conjunction with the Market Risk Department.
In addition to the governance structure in place between the various departments of the Risk function, Finance Division and business lines, the monitoring of limits usage, due to the products/solutions provided to clients and the market-making activities, also contributes to ensuring that market risks to which the Group is exposed are properly managed and understood. The continuous monitoring of the market risk profile is the object of regular discussions between the risk and business teams, further to which various risk hedging or mitigation initiatives may be taken by the Front Office in order to remain within the limits defined.
(1) Market transactions not related to client activities are confined in a dedicated subsidiary, Descartes Trading, subject to a specific risk appetite, which is limited.
(2) See “Risk Appetite” section for the detailed description of the governance and implementation of the risk appetite, as well as the role the Risk Division plays in defining it.

4 I 5
MARKET RISKS RRISK FACTORS AND CAPIITAL ADEQUACY
202 I 2018 REGISTRATION DOCUMENT I S O C I E T E G E N E R AL E G R O U P
99% VALUE-AT-RISK (VAR) Audited I The Internal VaR Model was introduced at the end of 1996 and has been approved by the French regulator within the scope of the regulatory capital requirements.
The Value-at-Risk (VaR) assesses the potential losses on positions over a defined time horizon and for a given confidence interval (99% for Societe Generale). The method used is the “historical simulation” method, which implicitly takes into account the correlation between the various markets and is based on the following principles:
storage in a database of the risk factors that are representative of Societe Generale’s positions (i.e. interest rates, share prices, exchange rates, commodity prices, volatility, credit spreads, etc.);
definition of 260 scenarios corresponding to one-day variations in these market parameters over a rolling one-year period; these scenarios are updated daily with the inclusion of a new scenario and the removal of the oldest scenario. There are three coexisting methods for modelling scenarios (relative shocks, absolute shocks and hybrid shocks); the choice between these methods for a given risk factor is determined by its nature and its historical trend;
the application of these 260 scenarios to the market parameters of the day;
revaluation of daily positions, on the basis of the 260 sets of adjusted market parameters: in most cases this calculation involves a full re-pricing. Nonetheless, for certain risk factors, a sensitivity-based approach may be used.
Within the framework described above, the one-day 99% VaR, calculated according to the 260 scenarios, corresponds to the mean of the second and third largest losses computed.
The day-to-day follow-up of market risks is performed via the one-day VaR, which is computed on a daily basis. For regulatory capital requirements, however, we have to take into account a ten-day horizon, thus we also compute a ten-day VaR, which is obtained by multiplying the one-day VaR by the square root of ten. This methodology complies with Basel 2 requirements and has been reviewed and validated by the regulator.
The VaR assessment is based on a model and a certain number of conventional assumptions, the main limitations of which are as follows:
by definition, the use of a 99% confidence interval does not take into account losses arising beyond this point; VaR is therefore an indicator of the risk of loss under normal market conditions and does not take into account exceptionally significant fluctuations;
VaR is computed using closing prices, meaning that intra-day fluctuations are not taken into account;
the use of a historical model is based on the assumption that past events are representative of future events and may not capture all potential events.
The Market Risk Department mitigates the limitations of the VaR model by performing stress tests and other additional measurements.
At present, the market risks for almost all of Corporate and Investment Banking’s activities (including those related to the most complex products) are monitored using the VaR method, as are the main market activities of Retail Banking and Private Banking. The few activities not covered by the VaR method, either for technical reasons or because the stakes are too low, are monitored using stress tests, and capital charges are calculated using the standard method or through alternative in-house methods.
The relevance of the model is checked through continuous backtesting in order to verify whether the number of days for which the negative result exceeds the VaR complies with the 99% confidence interval.
In compliance with regulations, backtesting compares the VaR to the (i) actual and (ii) hypothetical change in the portfolio’s value.
In the first case (backtesting against “actual P&L”), the daily P&L(1) includes the change in book value, the impact of new transactions and of transactions modified during the day (including their sales margins), refinancing costs, the various related commissions (brokerage fees, custody fees, etc.), as well as provisions and parameter adjustments made for market risk.
In the second case (backtesting against “hypothetical P&L”), the daily P&L(2) includes only the change in book value related to changes in market parameters, and excludes all other factors.
In 2017, daily losses were observed on 12 occasions(3), and two backtesting breaches occurred:
on 24th April 2017, against hypothetical P&L, stemming from normalisation movements and flight from quality in the wake of the results from the first round of the French presidential elections;
on 31st August 2017, against actual P&L, due to the impact of the monthly Independent Price Verification (IPV), mainly on equity volatility.
(1) “Actual P&L” by agreement hereinafter. (2) “Hypothetical P&L” by agreement hereinafter. (3) Based on actual P&L.

4
MARKET RISKS
5 I 4 RRISK FACTORS AND CAP IITAL ADEQUACY
S O C I E T E G E N E R AL E G R O U P I 2018 REGISTRATION DOCUMENT I 203
TABLE 27: REGULATORY TEN-DAY 99% VAR AND ONE-DAY 99% VAR (IN EUR M)
31.12.2017 31.12.2016
(In EUR m) VaR (10 days, 99%)((1) VaR (1 day, 99%)((1) VaR (10 days, 99%)((1)) VaR (1 day, 99%)((1)
Period start 113 36 55 17
Maximum value 150 48 99 31
Average value 79 25 67 21
Minimum value 40 13 43 13
Period end 67 21 97 31
(1) Over the scope for which capital requirements are assessed by internal model.
BREAKDOWN OF THE DAILY P&L(1) OF MARKET ACTIVITIES (2017, IN EUR M)
(1) Actual P&L.
0
20
40
60
80
100
< -
10
-10
> <
0
0 >
< 1
0
10 >
< 2
0
20 >
< 3
0
30 >
< 4
0
40 >
< 5
0
50 >
< 6
0
> 6
0
Num
ber o
f tra
ding
day
s

4 I 5
MARKET RISKS RRISK FACTORS AND CAPIITAL ADEQUACY
204 I 2018 REGISTRATION DOCUMENT I S O C I E T E G E N E R AL E G R O U P
TRADING VAR (ONE-DAY, 99%), DAILY ACTUAL P&L(1) AND DAILY HYPOTHETICAL P&L(2) OF THE TRADING PORTFOLIO (2017, IN EUR M)
AUDITED I BREAKDOWN BY RISK FACTOR OF TRADING VAR (ONE-DAY, 99%) – CHANGES IN QUARTERLY AVERAGE OVER THE 2016-2017 PERIOD (IN EUR M)
In 2017, VaR (1 day, 99%) was riskier on average (EUR 25 million compared to EUR 21 million in 2016) with two major trends:
an increase over the first part of the year, due to the inclusion at end-2016 of more volatile scenarios within the VaR computation;
a decrease in early summer, due to (i) an improvement in the calculation method, aiming to more accurately reflect the characteristics of the Cross Currency basis, and (ii) interest rate and FX positions in Europe moving towards a more defensive profile.
(1) Daily profit or loss used for the VaR backtesting against actual P&L, as defined in the “99% Value-at-Risk (VaR)” section of the Group consolidated financial statements on page 202.
--22 --26 --25 --23 --19 --16 --21 --18
22 3 44 5 55 3 33 3116 14 112 14 119 19 115 15
115 16 117 16118 16
113 12
77 12 111 866 8
66 5
220 21 221 22330 32
119 19
QQ1-16 Q2-16 QQ3-16 Q4-16 QQ1-17 Q2-17 QQ3-17 Q4-17
Netting Commodities Forex Equity Rates Credit Total
-60
-40
-20
0
20
40
60
80
Jan-aa Feb-aa Mar-aa Apr-aa May-aa Jun-aa Jul-aa Aug-aa Sep-aa Oct-aa Nov-aa Dec-aa
VaR Real P&L Hypothetical P&L
jan-17 feb-17 mar-17 apr-17 may-17 june-17 july-17 aug-17 sept-17 oct-17 nov-17
Actual P&L(1) Hypothetical P&L
(2)

4
MARKET RISKS
5 I 4 RRISK FACTORS AND CAP IITAL ADEQUAACY
S O C I E T E G E N E R AL E G R O U P I 2018 REGISTRATION DOCUMENT I 205
(2) Daily profit or loss used for the VaR backtesting against hypothetical P&L, as defined in the “99% Value-at-Risk (VaR)” section of the Group consolidated financial statements on page 202.
Stressed VaR (SVaR) Audited I At end-2011, Societe Generale was authorised by the French Prudential and Resolution Supervisory Authority (Autorité de Contrôle Prudentiel et de Résolution – ACPR) to supplement its internal models with the CRD3 requirements, in particular Stressed VaR, for the same scope as VaR.
The calculation method used for the 99% one-day SVaR is the same as under the VaR approach. It consists in carrying out a historical simulation with one-day shocks and a 99% confidence interval. Contrary to VaR, which uses 260 scenarios for one-day fluctuations over a rolling one-year period, SVaR uses a fixed one-year historical window corresponding to a period of significant financial tension.
The method for determining the fixed historical stress window, which has been approved by the regulator, is based on a review of the historic shocks on the risk factors representative of the
Societe Generale portfolio (related to equity, fixed income, foreign exchange, credit and commodity risks): historical shocks are aggregated to determine the period of highest stress for the entire portfolio. Each risk factor is assigned a weighting to account for the weight of each risk factor within its asset class and the weight of the asset class in the Group’s VaR. The historical window used is reviewed annually. In 2017, this window was “September 2008-September 2009”.
The ten-day SVaR used for the computation of the regulatory capital is obtained, as for VaR, by multiplying the one-day SVaR by the square root of ten.
The average SVaR decreased in 2017 compared to 2016, mainly due to changes in interest rate positions in Europe.
TABLE 28: REGULATORY TEN-DAY 99% SVAR AND ONE-DAY 99% SVAR (IN EUR M)
31.12.2017 31.12.2016
(In EUR m) Stressed VaR
(10 days, 99%)(1) Stressed VaR (1 day, 99%)(1)
Stressed VaR (10 days, 99%)(1)
Stressed VaR (1 day, 99%)(1)
Period start 119 38 155 49
Maximum value 198 62 216 68
Average value 85 27 142 45
Minimum value 50 16 89 28
Period end 67 21 164 52
(1) Over the scope for which capital requirements are assessed by internal model.

4 I 5
MARKET RISKS RRISK FACTORS AND CAPIITAL ADEQUACY
206 I 2018 REGISTRATION DOCUMENT I S O C I E T E G E N E R AL E G R O U P
STRESS TEST ASSESSMENT
Methodology Audited I Alongside the internal VaR model, Societe Generale monitors its exposure using stress test simulations to take into account exceptional market disruptions.
A stress test estimates the loss resulting from an extreme change in market parameters over a period corresponding to the time required to unwind or hedge the positions affected.
This stress test risk assessment is applied throughout all the Bank’s market activities. It is based on a set of 18 scenarios (3 historical and 15 hypothetical).
Together with the VaR model, this stress test risk assessment methodology is one of the main pillars of the risk management framework. The underlying principles are as follows:
the stress test corresponds to the worst result derived from the set of historical and hypothetical scenarios;
the shocks applied are calibrated on time horizons specific to each risk factor (the time horizon can range from five days for the most liquid risk factors, to three months for the least liquid);
risks are calculated every day for each of the Bank’s market activities (all products together), using each of the historical and hypothetical scenarios;
stress test limits are established for Societe Generale’s activity as a whole, and then for the Group’s various business lines.
The various stress test scenarios are reviewed by the Risk Division on a regular basis, in conjunction with the Group’s teams of economists and specialists. These reviews are presented during dedicated committee meetings held every six months, attended by the Head of the Market Risk Department, economists and representatives of Societe Generale’s trading activities. These committee meetings cover the following topics: changes in scenarios (introduction, removal, shock review), appropriate coverage of the risk factors by the scenarios, review of the approximations made in terms of calculation, correct documentation of the whole process. The delegation level needed to validate the changes in stress test scenarios depends on the impact of the change in question. At the end of 2016, the time horizons used for shock calibration were reviewed: for some parameters (mainly equity dividends, equity repos, implicit correlations on equity markets), the time horizons used previously were deemed inadequate in view of developments in market conditions, which led us to adjust the shocks used in the scenarios at the beginning of 2017. Furthermore, the foreign exchange shocks were reviewed in various scenarios.
HISTORICAL STRESS TESTS This method consists of an analysis of the major economic crises that have affected the financial markets since 1995 (date from which the financial markets have become global and subject to increased regulatory requirements): changes in the prices of financial assets (equities, interest rates, exchange rates, credit spreads, etc.) during each of these crises have been analysed in order to define scenarios for potential variations in these main risk factors which, when applied to the Bank’s trading positions, could generate significant losses. Accordingly, Societe Generale uses three significant historical scenarios related to the period from October to December 2008.
HYPOTHETICAL STRESS TESTS The hypothetical scenarios are defined with the Group’s economists and are designed to identify possible sequences of events that could lead to a major crisis in the financial markets (e.g. a major terrorist attack, political instability in the main oil-producing countries, etc.). The Group’s aim is to select extreme but plausible events which would have major repercussions on all international markets.
Accordingly, Societe Generale has adopted the 15 hypothetical scenarios described below:
ggeneralised scenario (financial crisis scenario): considerable mistrust of financial institutions after the Lehman Brothers’ bankruptcy, collapse of equity markets, sharp decline in implied dividends, significant widening of credit spreads, pivoting of yield curves (rise in short-term interest rates and decline in long-term interest rates), substantial flight to quality;
GGIIPS crisis: mistrust in risky sovereign issuers and increased interest in higher-rated sovereign issuers such as Germany, followed by the spreading of fears to other markets (equities, etc.);
MMiddle East crisis: instability in the Middle East leading to a significant shock in oil prices and other energy sources, a stock market crash, and a steepening of the yield curve;
tterrorist attack: major terrorist attack on the United States leading to a stock market crash, decline in interest rates, widening of credit spreads and sharp decline in the US dollar;
bbond crisis: crisis in the global bond markets inducing the decoupling of bond and equity yields, strong rise in US interest rates (and a more modest rise for other interest rates), moderate decline on the equity markets, flight to quality with strong widening of credit spreads, rise in the US dollar;
UUS dollar crisis: collapse of the US dollar against major international currencies due to a sharp deterioration in the US trade balance and budget deficit, rise in interest rates and narrowing of US credit spreads;
EEurozone crisis: decline in euro exchange rates, sharp rise in Eurozone interest rates, sharp fall in euro equities and rise in US equities, significant widening of euro credit spreads;
YYen carry trade unwinding: change in monetary policy in Japan leading to yen carry trade strategies being abandoned: significant widening of credit spreads, decline in yen interest rates, rise in US and Eurozone long-term interest rates and flight to quality;
aassets drop: unexpected halt in Central Bank quantitative easing policies leading to a widespread drop in risky assets (equity, credit, emerging) combined with a significant increase in worldwide interest rates;
two other Eurozone crisis scenarios:
Russian crisis:
major hedge fund crisis:
sudden economic rebound:
bursting of an equity bubble:

4
generalised scenario (financial crisis scenario):
GIIPS crisis:
Middle East crisis:
terrorist attack:
bond crisis:
US dollar crisis:
Eurozone crisis:
Yen carry trade unwinding:
assets drop:
MARKET RISKS
5 I 4 RRISK FACTORS AND CAP IITAL ADEQUACY
S O C I E T E G E N E R AL E G R O U P I 2018 REGISTRATION DOCUMENT I 207
ttwo other Eurozone crisis scenarios: exit of Greece from the Eurozone, triggering a widespread drop in risky assets (equity, credit, emerging), more particularly in Europe, and a tightening of the US and Japanese sovereign spreads, mitigated with ECB support (activation of the OMT programme resulting in a decrease in Eurozone interest rates) or without ECB support (dislocation of the basis rates reflecting a freeze in the interbank market);
RRussian crisis: significant depreciation of the Russian currency, default of the Russian government, crisis in the bond markets and drop in equities, more particularly in emerging markets (as seen with the Russian crisis in September 1998);
mmajor hedge fund crisis: risk of dislocation of the international financial system stemming from the near-bankruptcy of a major hedge fund, triggered by a crisis in the bond markets (as seen with the near-bankruptcy of Long Term Capital Management in October 1998);
ssudden economic rebound: sharp rise in equity markets and in US and Eurozone interest rates (as seen with the anticipation of the beginning of the Iraq war in March 2003);
bbursting of an equity bubble: significant drop in the equity markets following the bursting of an equity bubble in a specific business sector (as seen with the Worldcom bankruptcy in July 2002).
Average stress tests in 2017(1) 2017 was characterised by:
a more favourable environment for risky assets (rise in equities, and historically low equity volatility and credit spreads);
solid economic fundamentals;
cautious monetary-policy normalisation by the Fed and the ECB;
temporary geopolitical risks (French elections, Catalonia, Korea, etc).
Against this backdrop, the Group-level global stress test remained low throughout the year (9% lower on average than in 2016) due to a generally defensive profile; there was a temporary rise in the second quarter, stemming from client transactions on FX options and equities.
SIMULATION OF IMPACT OF STRESS SCENARIOS (2017 AVERAGES IN EUR M)
(1) Excluding legacy assets, which are subject to specific risk monitoring.
-400
-200
0
200
400
600
800
10002017 Average - Historical scenarios
2017 Average - Hypothetical scenarios

4 I 5
MARKET RISKS RRISK FACTORS AND CAPIITAL ADEQUACY
208 I 2018 REGISTRATION DOCUMENT I S O C I E T E G E N E R AL E G R O U P
MARKET RISK CAPITAL REQUIREMENTS
Allocation of exposures in the trading book The on- and off-balance sheet items must be allocated to one of the two portfolios defined by prudential regulations: the banking book or the trading book.
The banking book is defined by elimination: all on- and off-balance sheet items not included in the trading book are included by default in the banking book.
The trading book consists of all positions in financial instruments and commodities held by an institution either for trading purposes or in order to hedge other positions in the trading book. The trading interest is documented as part of the traders’ mandates.
The prudential classification of instruments and positions is governed as follows:
the Finance Division’s prudential regulation experts are responsible for translating the regulations into procedures, together with the Risk Division for procedures related to holding period and liquidity. They also analyse specific cases and exceptions. They disseminate these procedures to the business lines;
the business lines comply with these procedures. In particular, they document the trading interest of the positions taken by traders;
the Finance and Risk Departments are in charge of the control framework.
The following controls are implemented in order to ensure that activities are managed in accordance with their prudential classification:
“new product” process: any new product or activity is subject to an approval process that covers its prudential classification and regulatory capital treatment for transactions subject to validation;
holding period: the Market Risk Department has designed a control framework for the holding period for certain instruments;
liquidity: on a case-by-case basis or on demand, the Market Risk Department performs liquidity controls based on certain criteria (negotiability/transferability, bid/ask size, market volumes, etc.);
strict process for any change in prudential classification, involving the business line and the Finance and Risk Divisions;
Internal Audit: through its various periodic assignments, Internal Audit verifies or questions the consistency of the prudential classification with policies/procedures as well as the suitability of the prudential treatment in light of existing regulations.
Regulatory measures At end-2011, Societe Generale received approval from the French Prudential Supervisory and Resolution Authority (Autorité de contrôle prudentiel et de résolution – ACPR) to expand its internal market risk modelling system, in particular to include stressed VaR (VaR over a one-year historical window corresponding to a period of significant financial tensions), IRC (Incremental Risk Charge) and CRM (Comprehensive Risk Measure), for the same scope as for VaR.
VaR and SVaR were detailed in the previous section. IRC and CRM estimate the capital charge on debt instruments that is related to rating migration and issuer default risks. These capital charges are incremental, meaning they are added to the charges calculated based on VaR and SVaR.
In terms of scope, in compliance with regulatory requirements:
IRC is applied to debt instruments, other than securitisations and the credit correlation portfolio. In particular, this includes bonds, CDS and related derivatives;
CRM exclusively covers the correlation portfolio, i.e. CDO tranches and first-to-default products, as well as their hedging using CDS and indices.
Societe Generale estimates these capital charges using internal models(1). These models determine the loss that would be incurred following especially adverse scenarios in terms of rating changes or issuer defaults for the year that follows the calculation date, without ageing the positions. In the case of CRM, the charge determined using the internal model cannot be less than 8% of the charge determined by applying the standard method for securitisation positions.
These models are used to simulate, over a one-year horizon(2), a wide range of scenarios involving change in the factors taken into account, and to assign them an impact in terms of income. Rating change and default rate simulations are calibrated on the basis of past observations of rating migrations and default rates, taking into account:
the frequency of rating migrations and defaults observed over a full economic cycle;
the correlations observed among issuers in the same economic sector, and among those in different sectors.
For CRM, the spread of market parameters used is also simulated over a one-year period: change in credit spreads, recovery rates, and correlation of bases for index tranches and first-to-defaults.
When simulating a change in an issuer’s rating, the decline or improvement in its financial health is modelled by the increase or decrease in its credit spread. In the event of an issuer’s default, the impact on income is modelled based on a precise revaluation of the product.
(1) The same internal model is used for all portfolios for which an IRC calculation is required. The same is true for the portfolios on which a CRM calculation is performed.
(2) The use of a constant one-year liquidity horizon for all portfolios on which IRC and CRM are calculated means that the shocks applied to the positions in order to determine these two metrics are instantaneous one-year shocks. This hypothesis appears to be the most prudent choice in terms of models and capital, rather than shorter liquidity horizons.

4
MARKET RISKS
5 I 4 RRISK FACTORS AND CAP IITAL ADEQUACY
S O C I E T E G E N E R AL E G R O U P I 2018 REGISTRATION DOCUMENT I 209
IRC and CRM are calculated with a confidence interval of 99.9%: they represent the highest risk of loss obtained after eliminating the 0.1% most unfavourable scenarios simulated.
The internal IRC and CRM are subject to similar governance to that of other internal models meeting the Pillar 1 regulatory requirements. More specifically:
the methodology and its implementation have been approved within the Group by the Risk Department in charge of internal models validation, and externally by the French Prudential Supervisory and Resolution Authority (Autorité de contrôle prudentiel et de résolution – ACPR);
a weekly analysis is performed on these metrics;
these metrics are compared with standard stress tests defined by the regulator;
the models’ suitability and calibration are reviewed at least once a year.
Moreover, regular operational checks are performed on the completeness of the scope’s coverage as well as the quality of the data describing the positions.
TABLE 29: IRC (99.9%) AND CRM (99.9%) (IN EUR M)
(In EUR m) 31.12.2017 31.12.2016
Incremental Risk Charge (99.9%)
Period start 183 354
Maximum value 321 396
Average value 256 286
Minimum value 175 184
Period end 282 187
Comprehensive Risk capital charge (99.99%)
Period start 213 163
Maximum value 226 263
Average value 177 194
Minimum value 164 142
Period end 225 214

4 I 5
MARKET RISKS RRISK FACTORS AND CAPIITAL ADEQUACY
210 I 2018 REGISTRATION DOCUMENT I S O C I E T E G E N E R AL E G R O U P
MARKET RISK CAPITAL REQUIREMENTS AND RISK-WEIGHTED ASSETS
TABLE 30: MARKET RISK CAPITAL REQUIREMENTS AND RWA BY RISK FACTOR (IN EUR M)
Risk-weighted assets Capital requirement
31.12.2017 31.12.2016 Change 31.12.2017 31.12.2016 Change
VaR 2,606 4,233 (1,627) 208 339 (130)
Stressed VaR 4,466 6,389 (1,923) 357 511 (154)
Incremental Risk Change (IRC) 3,527 2,343 1,184 282 187 95
Correlation portfolio (CRM) 2,817 2,669 148 225 214 11
Total market riisks assessed by internal model 13,416 15,635 (2,219) 1,073 1,251 (178)
Specific risk related to securitisation positions in the trading portfolio 189 73 116 15 6 9
Risk assessed for currency positions 640 600 40 51 48 3
Risks assessed for interest rates (excl. securitisation)
368 246 122 29 20 10
Risk assessed for ownership positions 108 225 (117) 9 18 (9)
Risk assessed for commodities 79 94 (15) 6 8 (1)
Total market risks assessed by sttandard approach 1,384 1,238 146 111 99 12
Total 14,800 16,873 2,073 1,184 1,350 (166)
TABLE 31: CAPITAL REQUIREMENTS AND RWA BY TYPE OF MARKET RISK (IN EUR M)
Risk-weighted assets Capital requirement
31.12.2017 31.12.2016 31.12.2017 31.12.2016
Risk assessed for currency positions 981 1,206 78 96
Risk assessed for credit (excl. deductions) 7,681 6,893 614 551
Risk assessed for commodities 225 252 18 20
Risk assessed for ownership positions 3,099 3,805 248 304
Risk assessed for interest rates 2,814 4,717 225 377
Total 14,800 16,873 1,184 1,350
Over 90% of Societe Generale’s capital requirements related to market risk are determined using an internal model approach. The standard approach is mainly used for the positions taken by the head office and presenting a foreign exchange risk, which are not part of the trading book, as well as for the Group’s subsidiaries that do not have access to the core IT tools developed internally, and for subsidiaries for which the Group is awaiting approval from the regulator to use the internal models. The main entities concerned are Societe Generale International Limited, SG Americas
Securities Holdings, and some International Retail Banking and Financial Services entities such as Rosbank, SGMA, SG Express Bank, BRD, Societe Generale Banka Srbija. The decrease in capital requirements related to market risk, concentrated on the internal model perimeter, is mainly due to a reduction in SVaR and VaR, stemming from a change in interest rate and foreign exchange (specifically for VaR) positions in Europe, partially offset by an increase in IRC following the expiry of credit protection/hedging on various indices at the end of year.
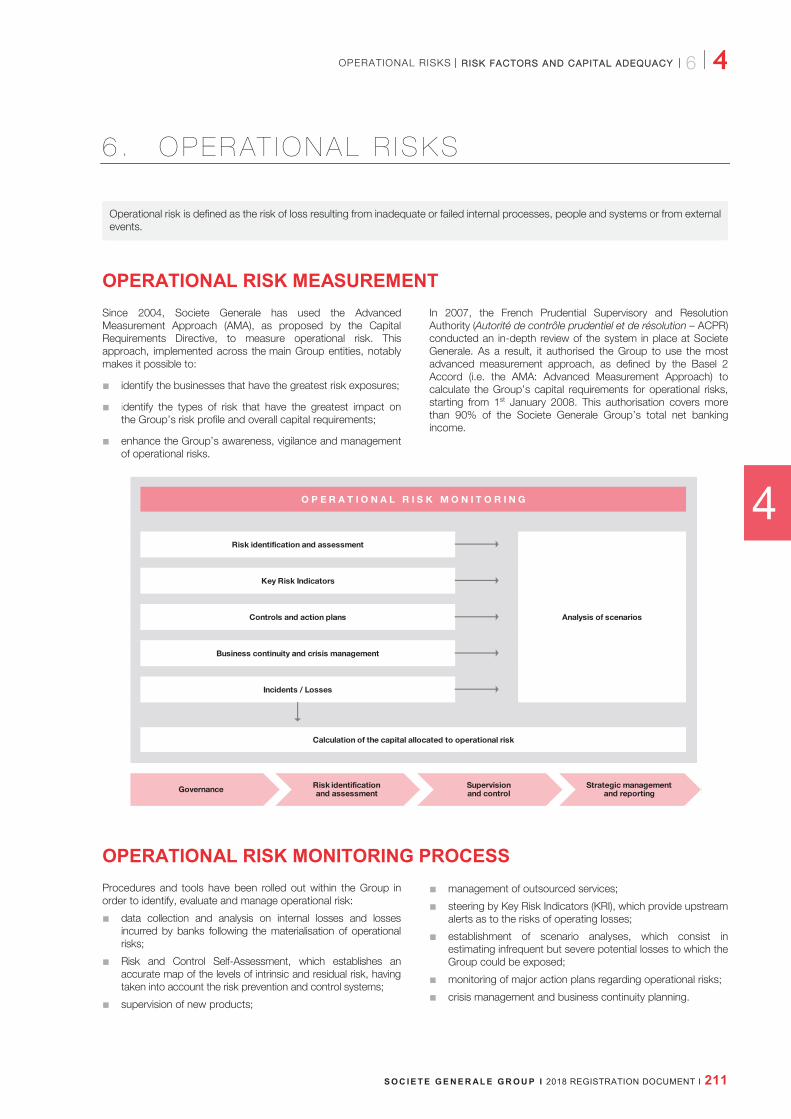
4
OPERATIONAL RISKS
6 I 4 RRISK FACTORS AND CCAP ITAL ADEQUACY
S O C I E T E G E N E R AL E G R O U P I 2018 REGISTRATION DOCUMENT I 211
6 . O P E R AT I O N A L R I S K S
Operational risk is defined as the risk of loss resulting from inadequate or failed internal processes, people and systems or from external events.
OPERATIONAL RISK MEASUREMENT Since 2004, Societe Generale has used the Advanced Measurement Approach (AMA), as proposed by the Capital Requirements Directive, to measure operational risk. This approach, implemented across the main Group entities, notably makes it possible to:
identify the businesses that have the greatest risk exposures;
identify the types of risk that have the greatest impact on the Group’s risk profile and overall capital requirements;
enhance the Group’s awareness, vigilance and management of operational risks.
In 2007, the French Prudential Supervisory and Resolution Authority (Autorité de contrôle prudentiel et de résolution – ACPR) conducted an in-depth review of the system in place at Societe Generale. As a result, it authorised the Group to use the most advanced measurement approach, as defined by the Basel 2 Accord (i.e. the AMA: Advanced Measurement Approach) to calculate the Group’s capital requirements for operational risks, starting from 1st January 2008. This authorisation covers more than 90% of the Societe Generale Group’s total net banking income.
OPERATIONAL RISK MONITORING PROCESS Procedures and tools have been rolled out within the Group in order to identify, evaluate and manage operational risk:
data collection and analysis on internal losses and losses incurred by banks following the materialisation of operational risks;
Risk and Control Self-Assessment, which establishes an accurate map of the levels of intrinsic and residual risk, having taken into account the risk prevention and control systems;
supervision of new products;
management of outsourced services;
steering by Key Risk Indicators (KRI), which provide upstream alerts as to the risks of operating losses;
establishment of scenario analyses, which consist in estimating infrequent but severe potential losses to which the Group could be exposed;
monitoring of major action plans regarding operational risks;
crisis management and business continuity planning.
Calculation of the capital allocated to operational risk
O P E R A T I O N A L R I S K M O N I T O R I N G
Risk identification and assessment
Analysis of scenarios
Key Risk Indicators
Controls and action plans
Business continuity and crisis management
Incidents / Losses
GovernanceRisk identificationand assessment
Supervisionand control
Strategic managementand reporting

4 I 6
OPERATIONAL RISKS RRISK FACTORS AND CAPIITAL ADEQUACY
212 I 2018 REGISTRATION DOCUMENT I S O C I E T E G E N E R AL E G R O U P
Societe Generale’s classification of operational risks in eight event categories and 49 mutually exclusive sub-categories is the cornerstone of its risk modelling, ensuring consistency throughout the system and enabling cross-business analyses throughout the Group.
The eight event categories are as follows:
commercial disputes;
disputes with authorities;
pricing or risk valuation errors;
execution errors;
fraud and other criminal activities;
rogue trading;
loss of operating resources;
IT system interruptions.
Internal loss data collection Internal loss (but also gains and near loss) data has been compiled throughout the Group since 2003, enabling operational staff to:
define and implement the appropriate corrective actions;
achieve a deeper understanding of their risk areas;
enhance awareness and vigilance with respect to operational risks in the Group.
The minimum threshold above which a loss (or gain or near loss) is recorded is EUR 10,000 throughout the Group, except for global market activities, where this threshold is EUR 20,000 due to the scope of such activities and the volumes involved.
Below these thresholds, losses representing weak-signal risks are collected by the Group’s various business divisions and reported as an aggregated sum if they concern the same risk event and the total exceeds the reporting threshold.
Risk and Control Self-Assessment The purpose of Risk and Control Self-Assessment (RCSA) is to assess the Group’s exposure to operational risks in order to improve their monitoring. Based on the results of other operational risk management frameworks (internal losses, KRIs, etc.), risk areas are identified by the functions based on their respective fields of expertise, and interviews are conducted with Group experts.
The objectives are as follows:
identifying and assessing the major operational risks to which each business is exposed (the intrinsic risks, i.e. those inherent in the nature of a business, while disregarding prevention and control systems). Where necessary, risk mapping established by the functions (e.g. Compliance, Information Systems Security, etc.) contributes to this assessment of intrinsic risks;
assessing the quality of major risk prevention and mitigation measures (including their existence and effectiveness in detecting and preventing major risks and/or their capacity to reduce their financial impact);
assessing the risk exposure of each business that remains once the risk prevention and mitigation measures are taken into account (the “residual risk”), while disregarding insurance coverage;
correcting any deficiencies in risk prevention and mitigation measures and implementing corrective action plans;
facilitating and/or supporting the implementation of key risk indicators;
adapting the risk insurance strategy, if necessary. As part of this exercise, the risks within a given scope are described using a double scale of severity and frequency.
Key risk indicators Key risk indicators (KRIs) supplement the overall operational risk management system by providing a dynamic view (warning system) of changes in business risk profiles. Accordingly, regular KRI monitoring assists managers of the business entities in their assessment of the Group’s operational risk exposure, thereby providing them with:
a quantitative, verifiable risk measurement;
a regular assessment of the improvements or deteriorations in the risk profile and the control and prevention environment requiring particular attention or an action plan.
A cross analysis of Group-level KRIs and losses is presented to the Group’s Executive Committee on a quarterly basis via a specific dashboard.
Analysis of scenarios The analysis of scenarios serves two purposes: informing the Group of potential significant areas of risk and contributing to the calculation of the capital required to cover operational risks.
For the calculation of capital requirements, the Group uses scenario analyses to:
measure its exposure to potential losses arising from low frequency/very high severity events;
provide an expert’s opinion of loss distribution for event categories for which the internal loss data history is insufficient.
In practice, various scenarios are reviewed by experts who gauge the severity and frequency of the potential impacts for the Group by factoring in internal and external loss data as well as the internal framework (controls and prevention systems) and the external environment (regulatory, business, etc.). Analyses are undertaken for two types of scenario:
major Group stress scenarios, involving very severe events that cut across businesses and departments, having an external cause in most cases and potentially requiring a business continuity plan (BCP);
New Product Committee

4
OPERATIONAL RISKS
6 I 4 RRISK FACTORS AND CAP IITAL ADEQUACY
S O C I E T E G E N E R AL E G R O U P I 2018 REGISTRATION DOCUMENT I 213
business scenarios that do not, strictly speaking, fall into the category of business continuity, but are used to measure the unexpected losses to which the businesses may be exposed. Specific actions are performed in order to prevent the portfolio from being diluted over too many scenarios and to maintain the system’s focus on risks that could severely impact the Group.
Governance is established in order, in particular, to:
allow the approval of the annual scenario update programme by the Risk Committee (CORISQ);
allow the approval of the scenarios by the senior management of the business and corporate divisions, through the internal control coordination committees of the departments involved or through ad hoc meetings;
conduct an overall review of the Group’s risk hierarchy and of the suitability of the scenarios through CORISQ.
Analysis of external losses External losses correspond to the data on operational losses suffered by the banking and financial sector, provided by databases managed by external providers, as well as the data shared by the banking industry as part of consortiums.
These data are used to enhance the identification and assessment of the Group’s exposure to operational risks by benchmarking internal loss records against industry-wide data.
New Product Committees Each division must submit all new customer products to a NNew PProoduct Committee, jointly coordinated by the Risk Division and the relevant businesses. The aim is to ensure that, prior to the launch of a new product:
all associated risks have been identified, understood and correctly addressed;
compliance issues have been assessed with respect to the laws and regulations in force, the codes of good professional conduct and the Group’s reputational risk;
all support functions have been involved and any and all reservations expressed have been resolved.
This committee is underpinned by a very broad definition of “new product or service”, which ranges from the creation of a new product to the adaptation of an existing product to a new environment or new customer type.
Throughout the whole Group, 548 New Product Committee meetings were held in 2017.
Outsourcing of services The business lines decide on the outsourcing of services within the framework of standards set by the Group. Outsourcing proposals are validated by the Sponsor business further to a risk analysis performed in line with the project governance structure. The Sponsor authorises the Project Manager to conduct the risk analysis. The latter draws on the opinions of experts from different functions according to the Group field of expertise required, to ensure that the evaluations are consistent. The analysis framework is standardised so as to guarantee coherency in the decisions taken at Group level in this area. It systematically incorporates reputational, legal, compliance, fraud, information security and data protection risks. Other types of risk may be analysed, if necessary.
Critical services at Group level are subject to strengthened management via a contract management process that culminates in the signature of a regular contract covering the entire lifetime of these services. These services are identified on the basis of criteria such as the notion of “core business activity”, as well as the financial impact and reputational risk assessed at Group level. These critical services are validated within a dedicated committee, chaired by RISQ/OPE, which ensures consistency at Group level.
Across the Group, 297 services were outsourced in 2017.
Crisis management and business continuity The crisis management and business continuity systems aim to mitigate as far as possible the impacts of potential incidents on customers, staff, activities and infrastructure, thus protecting the Group’s reputation, the image of its brands, and its financial resilience. These systems also satisfy regulatory requirements.
The approach used to implement and optimise the business continuity systems of each Group entity is based on a methodology that meets international standards. It consists primarily in identifying risks to which the company is exposed as well as their possible impacts, establishing a response capacity that can effectively withstand various crisis scenarios (including extreme shocks), and maintaining these systems to ensure they remain effective.
OPERATIONAL RISK MODELLING The method used by the Group for operational risk modelling is based on the Loss Distribution Approach (LDA).
Under this approach, operational risks are modelled using segments, each segment representing a type of risk and a Group core business. The frequency and severity of operational risks, based on past internal losses, external losses, the internal and
external environment, and scenario analyses, are estimated and the distribution of annual losses is calculated for each segment. This approach is supplemented by cross-business scenario analyses that measure cross-business risks for core businesses, such as, for example, property destruction and pandemic risks.

4 I 6
OPERATIONAL RISKS RRISK FACTORS AND CAPIITAL ADEQUACY
214 I 2018 REGISTRATION DOCUMENT I S O C I E T E G E N E R AL E G R O U P
Aside from the individual risks associated with each segment or cross-business scenario analysis, the model takes into account the diversification between the various types of risk and the core businesses, as well as the effect of insurance policies taken out by the Group.
The Group’s regulatory capital requirements for operational risks within the scope covered by the Advanced Measurement Approach (AMA) internal model are then defined as the 99.9% quantile of the Group’s annual loss distribution.
Societe Generale’s total capital requirements for operational risks were EUR 3.9 billion at the end of 2017, representing EUR 48.7 billion in risk-weighted assets. This assessment integrates capital requirements on both the AMA and Standard scopes.
Insurance cover in risk modellingIn accordance with regulations, Societe Generale incorporates risk cover provided by insurance policies when calculating regulatory capital requirements for operational risks, within the limit of 20% of said requirements. These insurance policies cover part of the Group’s major risks, i.e. civil liability, fraud, fire and theft, as well as systems interruptions and operating losses due to a loss of operating resources.
Risk reduction through insurance policies results in a 7% decrease in total capital requirements for operational risks.
Quantitative data The following charts break down operating losses by risk category for the 2013-2017 period.
OPERATIONAL RISK LOSSES: BREAKDOWN BY SOCIETE GENERALE RISK EVENT TYPE – AMOUNTS
OPERATIONAL RISK LOSSES: BREAKDOWN BY SOCIETE GENERALE RISK EVENT TYPE – NUMBER OF EVENTS
Over the past five years, Societe Generale’s operational risks were concentrated on average on four types, accounting for 97% of the Group’s total operating losses:
Commercial disputes represented 46% of total Group operating losses. The amount of losses in this category increased compared with last year due to a settlement agreement with the Libyan Investment Authority;
Disputes with authorities, the second largest category, represented 26% of the Group’s operating losses over the period. Losses incurred through this type of litigation represented relatively high unit amounts, meaning that this category represented only 6% of the total number of losses;
Execution errors represented 13% of total operating losses, thereby constituting the third leading cause of loss for the Group. Thanks to the action plans implemented, the amount of losses for this category is on a downwards trend;
Fraud and other criminal activities represented 13% of the amount of operating losses over the period. They are mainly due to electronic payment fraud and the production of false documents relating to guarantees for financing under collection.
The other categories of Group operational risk (rogue trading, IT system interruptions, pricing or risk assessment errors and operating resource losses) were still relatively insignificant, representing barely 3% of the Group’s losses on average over the 2013 to 2017 period.
25.7%
12.7%
12.7%
46.0%
1.1%1.5%
0.2% DISPUTES WITH AUTHORITIES
FRAUD AND OTHER CRIMINALACTIVITIESEXECUTION ERRORS
COMMERCIAL DISPUTES
ERROR IN PRICING OR RISKEVALUATIONSYSTEMS INTERRUPTION
LOSS OF OPERATINGENVIRONMENT / CAPABILITY
6.4%
38.0%
35.9%
13.3%
1.5%4.0%
1.2%DISPUTES WITHAUTHORITIESFRAUD AND OTHERCRIMINAL ACTIVITIESEXECUTION ERRORS
COMMERCIAL DISPUTES
ERROR IN PRICING OR RISKEVALUATIONSYSTEMS INTERRUPTION
LOSS OF OPERATINGENVIRONMENT / CAPABILITY

4
OPERATIONAL RISKS
6 I 4 RRISK FACTORS AND CAP IITAL ADEQUACY
S O C I E T E G E N E R AL E G R O U P I 2018 REGISTRATION DOCUMENT I 215
OPERATIONAL RISK INSURANCE
Policies of the insurance subscription
GENERAL POLICY Since 1993, Societe Generale has implemented a global policy of hedging Group operational risks through insurance.
This consists in searching the market for the most extensive cover available for the risks incurred and enabling all entities to benefit from such cover wherever possible. Policies are taken out with leading insurers. Where required by local legislation, local policies are taken out, which are then reinsured by insurers that are part of the global programme.
In addition, special insurance policies may be taken out by entities that perform specific activities.
A Group internal reinsurance company intervenes in several policies in order to pool high-frequency, low-level risks between entities. This approach contributes to the improvement of the Group’s knowledge and management of its risks.
Description of main coverage
GENERAL RISKS Buildings and their contents, including IT equipment, are insured at their replacement value. The guarantee covering acts of terrorism abroad has been renewed.
Liability other than professional liability (i.e. relating to operations, Chief Executive Officers and Directors, vehicles, etc.) is covered by insurance policies on a worldwide basis. The amounts insured vary from country to country, according to operating requirements.
RISKS ARISING FROM OPERATIONS Insurance is only one of the measures used to offset the consequences of the risks inherent in the Group’s activity. It complements the Group’s risk management policy.
THEFT/FRAUD
These risks are included in the “Banker’s Blanket Bond” policy that insures all the Group’s financial activities around the world.
Internal fraud (committed by an employee or by a third party acting with the aid of an employee) and external fraud (committed by a third party acting alone), with the intent to obtain illicit personal gain or to harm the Group, are covered.
PROFESSIONAL LIABILITY
The consequences of any legal action against staff or managers as a result of their professional activity are insured under a global policy.
OPERATING LOSSES
The consequences of any accidental interruption to activity are insured under a global policy. This policy supplements the business continuity plans. The amounts insured are designed to cover losses incurred between the time of the event and the implementation of a back-up solution.
CYBER ATTACKS
In an environment – not specific to the banking sector – where new forms of crime are rapidly developing, mainly involving data theft or the compromise or destruction of computer systems, a cyber risk insurance policy has been taken out. It provides cover for the various expenses and business interruption losses that the Group could incur following a cyber attack, as well as any financial consequences arising from its civil liability in such cases.

4 I 6
OPERATIONAL RISKS RRISK FACTORS AND CAPIITAL ADEQUACY
216 I 2018 REGISTRATION DOCUMENT I S O C I E T E G E N E R AL E G R O U P
CAPITAL REQUIREMENTS Societe Generale’s capital requirements related to operational risk are calculated mainly under the internal model (94% in 2017 versus 93% in 2016).
The following table presents the Group’s risk-weighted assets and the corresponding capital requirements at 31st December 2017.
The EUR 4.6 billion increase in weighted assets is mainly due to the evolution of potential incidents on the AMA scope.
TABLE 32: RISK-WEIGHTED ASSETS AND CAPITAL REQUIREMENTS FOR OPERATIONAL RISK (IN EUR M)
31.12.2017 31.12.2016
(In EUR m)
RWA under Standardised
approach
RWA under Advanced
Measurement Approach
(AMA) Total RWA
Capital requirements
RWA under Standardised
approach
RWA under Advanced
Measurement Approach
(AMA) Total RWA
Capital requirements
Global Banking and Investor Solutions
289 31,702 31,991 2,559 401 28,889 29,290 2,343
Corporate Centre 463 3,172 3,635 291 418 2,946 3,364 269
International Retail Banking and Financial Services 2,226 5,501 7,727 618 2,205 4,773 6,978 558
French Retail Banking 42 5,600 5,642 452 47 4,706 4,753 380
Total 3,020 45,975 48,995 3,920 3,071 41,314 44,385 3,5550

4
STRUCTURAL INTEREST RATE AND EXCHANGE RATE RISKS
7 I 4 RRISK FACTORS AND CAP IITAL ADEQUACY
S O C I E T E G E N E R AL E G R O U P I 2018 REGISTRATION DOCUMENT I 217
7 . S T R U C T U R A L I N T E R E S T R AT E A N D E X C H A N G E R AT E R I S K S
Audited I Structural exposure to interest rate and exchange rate risks results from commercial transactions, their associated hedging transactions and corporate centre transactions.
The interest rate and exchange rate risks linked to trading activities are excluded from the structural risk measurement scope as they belong to the category of market risks. Structural and market exposures constitute the Group’s total interest rate and exchange rate exposure.
The general principle is to reduce structural interest rate and exchange rate risks to the greatest extent possible within the
consolidated entities. Wherever possible, commercial and corporate centre transactions within entities are hedged against interest rate and exchange rate risks, either through micro-hedging (individual hedging of each commercial transaction) or macro-hedging techniques (hedging of portfolios of similar commercial transactions within a treasury department). At a consolidated level, some foreign exchange positions are kept in order to minimise the sensitivity of the Group Common Equity Tier 1 ratio to currency fluctuations.
ORGANISATION OF THE MANAGEMENT OF STRUCTURAL INTEREST RATE AND EXCHANGE RATE RISKS The principles and standards for managing these risks are defined at the Group level. The entities are first and foremost responsible for managing these risks. The ALM (Asset and Liability Management) Department within the Group Finance Division supplements the control framework.
The Group Finance Committee, a General Management body The Group Finance Committee:
validates and oversees the structural risk monitoring, management and supervision system;
reviews changes in the Group’s structural risks through consolidated reporting;
examines and validates the measures proposed by the Group Finance Division.
The ALM Department within the Group Finance Division The ALM (Asset and Liability Management) Department is responsible for:
defining the structural risk policies for the Group and formalising risk appetite for structural risks;
defining the steering indicators and overall stress test scenarios for the different types of structural risk and setting the main limits for the entities;
analysing the Group’s structural risk exposure and defining hedging strategies;
monitoring the regulatory environment concerning structural risk;
defining the ALM principles for the Group;
defining the normative environment of the structural risk metrics, as well as modelling and management methods;
defining the models used by the Group’s entities with regard to structural risks;
inventorying, consolidating and reporting on Group structural risks;
monitoring compliance with structural risk limits.
The ALM Risk Control Department within the Risk Division The second-level supervision of the ALM models used within the Group and of associated frameworks is provided by a dedicated service within the Risk Department. Accordingly, this department provides an opinion on the methodological principles, parameters and backtests of ALM models. It analyses proposals from the ALM Department regarding the risk indicators, stress test scenarios and structural risk frameworks. It also conducts second-level controls of risk limits. The Risk Department organises and chairs the Model Validation Committee.
The entities are responsible for structural risk management In this respect, the entities apply the standards defined at the Group level, develop their models, measure their risk exposure and implement the required hedges.
Each entity has its own structural risk manager, who reports to the entity’s Finance Department and is responsible for conducting first-level controls and for reporting the entity’s structural risk exposure to the Group Finance Division via a shared IT system. French and International Retail Banking entities generally have an ad hoc ALM Committee responsible for applying the validated models, managing exposures to interest rate and exchange rate risks, and implementing the hedging programmes in compliance with the principles set out by the Group and the limits validated by the Finance Committee and the pillars’ ALM Committees.

4 I 7
STRUCTURAL INTEREST RATE AND EXCHANGE RATE RISKS RRISK FACTORS AND CAPIITAL ADEQUACY
218 I 2018 REGISTRATION DOCUMENT I S O C I E T E G E N E R AL E G R O U P
STRUCTURAL INTEREST RATE RISK Structural interest rate risk is measured within the scope of structural activities, specifically commercial transactions, the associated hedging transactions and corporate centre transactions for each of the Group’s consolidated entities.
Structural interest rate risk arises mainly from the residual gaps (surplus or deficit) in each entity’s fixed-rate forecasted positions.
Objective of the Group When steering structural interest rate risk, the main aim is to ensure the risk is managed by reducing each Group entity’s exposure to the greatest extent possible.
To this end, each entity and the Group as a whole are subject to sensitivity limits validated by the Finance Committee. Sensitivity is defined as the variation in the net present value of future residual fixed-rate positions (surplus or deficit), stemming from assets and liabilities in a static vision, for a 1% parallel increase in the yield curve (i.e. this sensitivity does not correspond to the net interest margin sensitivity). The limit set at Group level is EUR 1 billion.
Measurement and monitoring of structural interest rate risks Societe Generale uses several indicators to measure the Group’s overall interest rate risk. The two most important indicators are:
the net present value (NPV) sensitivity: this is used to set limits for the entities and is calculated as the sensitivity of the net present value of the balance sheet to variations in interest rates. This measurement is calculated for all currencies to which the Group is exposed;
the net interest margin sensitivity to variations in interest rates in various stress scenarios: this takes into account the sensitivity generated by future commercial productions over a three-year rolling horizon, and is calculated on a dynamic basis.
In order to quantify its exposure to structural interest rate risks, the Group analyses all fixed-rate assets and liabilities in the future. These positions result from transactions remunerated or charged at fixed rates and from their maturities.
Assets and liabilities are analysed independently, without any a priori matching. The maturities of outstanding assets and liabilities are determined based on the contractual terms of transactions, amortisation conventions and models based on customers’ historic behaviour patterns (particularly for sight deposits, regulated savings accounts, loan prepayments) and shareholders’ equity.
Once the Group has identified its fixed-rate positions (surplus or deficit), it calculates the sensitivity (as defined above) to interest rate variations. This sensitivity is defined as the variation in the net present value of the fixed-rate positions for a 1% instantaneous parallel increase in the yield curve.
In addition to this analysis, the Group analyses the sensitivity to different yield curve configurations with a floor at 0% of its fixed-rate position.
The measurement of the net interest margin sensitivity to different yield curve configurations with a floor at 0% over a three-year rolling horizon is also used by the Group to quantify the structural interest rate risk of significant entities.
Throughout 2017, the Group maintained overall sensitivity of the net present value to interest rate risk below 0.6% of Group regulatory capital and below its EUR 1 billion limit.
The following observations can be made with regard to the businesses’ structural interest rate risk:
within French Retail Banking, the outstanding amounts of customer deposits are generally considered to be fixed-rate. Macro-hedging is set up mainly using interest rate swaps, in order to maintain the networks’ net present value and income margin sensitivities to interest rate risk (on the basis of the scenarios adopted) within the limits set. At end-December 2017, the sensitivity of French Retail Banking’s net present value to an instantaneous 1% parallel increase in the yield curve, based on its essentially euro-denominated assets and liabilities, was EUR -171 million;
commercial transactions with large corporates are generally micro-hedged and therefore present no interest rate risk;
commercial transactions with customers of the Specialised Financial Services subsidiaries are generally macro-hedged and therefore present only a very low interest rate risk;
commercial transactions at the Group’s subsidiaries and branches located in countries with weak development of the financial markets can generate structural interest rate risk, due to the difficulties these entities may face in optimally hedging interest rate risk; nonetheless, these positions, managed within limits, remain marginal at Group level;
corporate centre transactions are subject to hedging.
Sensitivity to interest rate variations within the Group’s main entities, accounting for 86% of Group and corporate centre outstanding loans as at 31st December 2017, represented EUR -275 million (for a 1% parallel and instantaneous rise in the yield curve).
TABLE 33: MEASUREMENT OF THE ENTITIES’ SENSITIVITY TO A 1% INTEREST RATE SHIFT, INDICATED BY MATURITY
(In EUR m) < 1
year 1-5
years > 5
years Total
Amount of sensitivity (31.12. 2017)
4 (265) (13) (275)
Amount of sensitivity (31.12.2016) 15 9 87 111
The Group analyses the sensitivity of the interest margin to variations in market interest rates using stress tests on the Group’s net interest margin.

4
STRUCTURAL INTEREST RATE AND EXCHANGE RATE RISKS
7 I 4 RRISK FACTORS AND CAP IITAL ADEQUACY
S O C I E T E G E N E R AL E G R O U P I 2018 REGISTRATION DOCUMENT I 219
At 31st December 2017, the Group’s net interest margin sensitivity for 2018 was as follows:
TABLE 34: SENSITIVITY OF THE GROUP’S INTEREST MARGIN
(In EUR m) 31.12.2017 31.12.2016
Parallel increase in interest rates of 200 bp 490 236
Parallel decrease in interest rates of 200 bp (167) (207)
Parallel increase in interest rates of 100 bp 234 115
Parallel decrease in interest rates of 100 bp (112) (64)
Flattening 210 161
Steepening 143 (54)
Calculations are based on aggregated estimates at 31st December for a scope of Group consolidated entities representing 8/10ths of the Group’s net interest margin.
The dynamic vision of the balance sheet varies according to the amortisation of outstanding transactions and transaction renewals based on outstanding amounts budgeted for 2018. The flattening assumptions used for the simulation allow for a 200 bp increase in short-term rates and a -58 bp decrease in long-term rates. The steepening scenario used allows for a -162 bp decrease in short-term rates and an 88 bp increase in long-term rates.
The Group’s net interest margin sensitivity over the full year of 2018 is low. In the event of a parallel shift in the yield curves of +200 bp, the sensitivity is positive and represents 2% of the net banking income.
The net interest margin sensitivity mainly stems from the impact on:
customer deposits: generally speaking, little to no interest is paid on deposits, and pricing is only partly impacted by fluctuations in interest rates, the margin on deposits being mainly derived from reinvestment rates;
new loan production, for which pricing is not adjusted as quickly as market rates.
The margin sensitivity on outstanding customer transactions results from the renewal of amounts due on reinvested deposits and from the residual sensitivity of the balance sheet to interest rate variations.
The French and International Retail Banking activities are favourably exposed to a rise in interest rates, as deposits can then be reinvested at higher rates, while margins on outstanding loans remain stable. This increase in margin is, however, partially offset by the fall in margins on new loan production (loan rates do not adjust as quickly as market rates) and by an increase in funding costs. Conversely, Retail Banking activities are unfavourably exposed to a fall in interest rates as deposits are then reinvested at lower rates and the margin on outstanding loans falls due to prepayments. This fall in margin is partially offset by the rise in margins on new loan production (customer loan rates do not fall as quickly as market rates) and by a reduction in funding costs.

4 I 7
STRUCTURAL INTEREST RATE AND EXCHANGE RATE RISKS RRISK FACTORS AND CAPIITAL ADEQUACY
220 I 2018 REGISTRATION DOCUMENT I S O C I E T E G E N E R AL E G R O U P
AUDITED I STRUCTURAL EXCHANGE RATE RISK Structural exchange rate risk is mainly caused by:
foreign currency-denominated capital contributions and equity investments financed through the purchase of foreign currencies;
retained earnings in foreign subsidiaries.
Objective of the Group The Group’s policy consists in calibrating the hedging of its net investments in foreign entities to reduce, as far as possible, the sensitivity of its Common Equity Tier 1 ratio to fluctuations in exchange rates. To this end, it enters into hedging transactions to maintain a currency exposure reducing such sensitivity within limits validated by the Finance Committee.
Measurement and monitoring of structural foreign exchange rate risks The Group quantifies its exposure to structural foreign exchange rate risks by analysing all assets and liabilities denominated in foreign currencies, arising from commercial transactions and the corporate centre.
The Group monitors structural exchange rate positions in the different currencies and manages the sensitivity of the Common Equity Tier 1 ratio to exchange rate fluctuations.
Table 35 presents the impact on the Group Common Equity Tier 1 ratio of a 10% currency depreciation or appreciation for 31st December 2017.
TABLE 35: SENSITIVITY OF THE GROUP’S COMMON EQUITY TIER 1 RATIO TO A 10% CHANGE IN THE CURRENCY (IN BASIS POINTS)
Impact on the Common Equity Tier 1 ratio of a 10% currency depreciation
Impact on the Common Equity Tier 1 ratio of a 10% currency appreciation
Currency 31.12.2017 31.12.2016 31.12.2017 31.12.2016
USD 1 2 (1) (2)
GBP 0 (1) 0 1
JPY 0 0 0 0
KRW 0 0 0 0
RON 0 0 0 0
RUB 0 0 0 0
CHF (1) 1 1 (1)
CZK (1) (1) 1 1
Other (2) (2) 2 2
Audited I In 2017, structural positions monitoring reduced the Common Equity Tier 1 ratio sensitivity to currency fluctuations (sensitivity of the Common Equity Tier 1 ratio is managed within limits for each currency, set according to the Group’s risk appetite in these currencies).

4
LIQUIDITY RISK
8 I 4RRISK FAACTORS AND CAP ITAL ADDEQUACY
S O C I E T E G E N E R AL E G R O U P I 2018 REGISTRATION DOCUMENT I 221
8 . L I Q U I D I T Y R I S K
Audited I Liquidity risk is defined as the risk of not being able to meet cash flow or collateral requirements when they fall due and at a reasonable price.
GOVERNANCE AND ORGANISATION The principles and standards applicable to the management of liquidity risks are defined by the Group’s governing bodies, whose duties in the area of liquidity are listed below:
The Board of Directors:
– establishes the level of liquidity risk tolerance as part of the Group’s Risk Appetite exercise, including the time period during which the Group can operate under conditions of stress (“survival horizon”),
– meets regularly (at least quarterly) to examine the Group’s liquidity risk situation;
the Executive Committee:
– sets budget targets in terms of liquidity based on proposals from the Group Finance Division,
– allocates liquidity to the businesses and Group Treasury based on proposals from the Group Finance Division;
the Finance Committee is the body responsible for monitoring structural risks and managing scarce resources. As such, it:
– meets every six weeks, under the chairmanship of the Chief Executive Officer or a Deputy Chief Executive Officer, with the representatives of the Finance and Development Division’s Risk Department and of the businesses,
– oversees and validates the limits set for structural liquidity risk,
– regularly monitors compliance with the budget and liquidity trajectory,
– takes decisions, if necessary, on the implementation of corrective measures,
– takes decisions, if necessary, on methodology issues regarding liquidity risk management,
– examines regulatory changes and their impact.
The businesses are responsible for managing liquidity risk within their scope and are directly supervised by the Group Finance Division. They must ensure compliance with the regulatory requirements applicable to the entities falling within their scope of supervision.
The Group Finance Division manages and monitors liquidity risk through three separate departments, in compliance with the principle of separation between risk steering, execution and control functions:
the Strategic and Financial Steering Department, responsible for:
– establishing the Group’s financial trajectory, in line with its strategic targets, regulatory requirements and market expectations,
– proposing and monitoring the businesses’ budget trajectory,
– monitoring the regulatory environment and developing liquidity steering standards for the businesses;
the Balance Sheet and Global Treasury Management Department, responsible for:
– implementing the Group’s short-term and long-term funding plan (including the management of intraday liquidity risk),
– supervising and coordinating the Group’s Treasury functions,
– monitoring the market and contributing its operational expertise to the establishment of Group liquidity steering objectives and the liquidity allocation for businesses,
– managing the collateral used in refinancing operations (central banks, covered bonds, securitisation, secured funding), and monitoring the liquidity reserve,
– managing the Group’s central funding department (management of liquidity and equity within the Group), including the internal liquidity charts;
the ALM Department, which reports to the Chief Financial Officer, is in charge of, in particular:
– supervising and controlling structural risks (interest rates, exchange rates and liquidity) to which the Group is exposed,
– controlling the structural risk models and their compliance with the Group’s rules and methodologies, and monitoring compliance with risk limits and management practices within the Group’s divisions, business lines and entities.
Second-level supervision of the ALM models used within the Group and of the associated risk framework is conducted by a dedicated team within the Market Risk Department. Accordingly, this team provides an opinion on the methodological principles, parameters and backtests of liquidity models. It analyses proposals from the Finance Division regarding the risk indicators, stress test scenarios and liquidity and funding risk frameworks. It also conducts second-level controls of compliance with the risk limits defined under such a framework.

4 I 8
L IQUIDITY RISK RRISK FACTORS AND CAPIITAL ADEQUACY
222 I 2018 REGISTRATION DOCUMENT I S O C I E T E G E N E R AL E G R O U P
THE GROUP’S APPROACH TO LIQUIDITY RISK MANAGEMENT The Group’s primary objective is to ensure the funding of its activities in the most cost-effective way by managing liquidity risk and adhering to regulatory constraints. The liquidity steering system provides a balance sheet framework based on an assets and liabilities target structure that is consistent with the risk appetite defined by the Board of Directors:
the assets structure should allow the businesses to develop their activities in a way that is liquidity-efficient and compatible with the target liabilities structure. This development must comply with the liquidity gaps defined at Group level (under static and stress scenarios) as well as regulatory requirements;
the liabilities structure is based on the ability of the businesses to collect financial resources from customers and the ability of the Group to sustainably raise financial resources on the markets, in accordance with its risk appetite.
This steering system is based on measurement and supervision of the businesses’ liquidity gaps under reference and stress scenarios, their Group funding needs, the funds raised by the Group on the market, the eligible assets and the businesses’ contribution to regulatory ratios. Accordingly, the principles of liquidity management are as follows:
1. The businesses must maintain low to nil static liquidity gaps within the operating limits of their activities, by using the Group’s Central Treasury, which can, if needed, run an (anti) transformation position and manage it within the framework of the established risk limits.
2. Internal liquidity stress tests, established on the basis of systemic, specific or combined scenarios, are controlled at Group level. They are used to ensure compliance with the survival horizon established by the Board of Directors and to calibrate liquidity reserves. They are accompanied by a Contingency Funding Plan that sets out measures to be taken in the event of a liquidity crisis.
3. The businesses’ funding needs (short-term and long-term) are determined on the basis of the development objectives for the franchises and in line with the Group’s fund-raising targets and capabilities.
4. A plan for long-term funding, which complements the resources raised by the businesses, is designed to cover upcoming repayments and finance the growth of the businesses. It takes into account the Group’s investment capabilities and aims to optimise the cost of fund-raising while complying with limits in terms of market concentration. Diversification in terms of issuers and investor pools is also sought and managed.
5. The Group’s short-term resources are adapted to the financing of the businesses’ short-term needs over periods appropriate to their management and in line with market concentration limits. As outlined above, they are adjusted in light of the liquidity reserve on the assets side, based on the established stress survival horizon as well as the Group’s LCR target (Liquidity Coverage Ratio, see Regulatory Ratios section).
6. The Group’s liquidity steering takes into account compliance with the target regulatory ratios (LCR, NSFR, leverage), the pillars’ contributions to these ratios being subject to supervision.
Lastly, liquidity is governed in terms of cost via the Group’s internal transfer pricing scheme. Funding allocated to the businesses is charged to the latter on the basis of scales that must reflect the liquidity cost for the Group. This system is designed to optimise the use of external financing sources by businesses, and is used to monitor the equilibrium of balance sheet funding.
Societe Generale has undertaken a specific review of its liquidity risks and believes that it is able to meet its upcoming maturities.
–

4
LIQUIDITY RISK
8 I 4RRISK FACTORS AND CAP IITAL ADEQUACY
S O C I E T E G E N E R AL E G R O U P I 2018 REGISTRATION DOCUMENT I 223
LIQUIDITY RESERVE The Group’s liquidity reserve encompasses cash at central banks and assets that can be used to cover liquidity outflows under a stress scenario. The reserve assets are available, i.e. not used in guarantee or as collateral on any transaction. They are included in the reserve after applying a haircut to reflect their expected valuation under stress. The Group’s liquidity reserve contains assets that can be freely transferred within the Group or used to cover subsidiaries’ liquidity outflows in the event of a crisis: non-transferable excess cash (according to the regulatory ratio definition) in subsidiaries is therefore not included in the Group liquidity reserve.
The liquidity reserve includes:
central bank deposits, excluding mandatory reserves;
High-Quality Liquid Assets (HQLAs), which are securities that are quickly transferable on the market via sale or repurchase transactions; these include government bonds, corporate bonds and equities listed on major indices (after haircuts). These HQLAs meet the eligibility criteria for the LCR, according to the most recent standards known and published by regulators. The haircuts applied to HQLA securities are in line with those indicated in the most recent known texts on determining the numerator of the LCR;
non-HQLA Group assets that are central bank-eligible, including receivables as well as covered bonds and securitisations of Group receivables held by the Group.
The composition of the liquidity reserve is reviewed regularly by a special committee comprising the Finance Division, the Risk Division and the Management of the Global Banking and Investor Solutions pillar, and is adjusted by authorisation of the Finance Committee.
TABLE 36 –– LIQUIDITY RESERVE
(In EUR bn) 31.12.2017 31.12.2016
Central bank deposits (excluding mandatory reserves) 94 73
HQLA securities available and transferable on the market (after haircut)
64 79
Other available central bank-eligible assets (after haircut) 16 16
Total 174 168
REGULATORY RATIOS The Basel Committee recommends the international implementation of two standard ratios with harmonised parameters, to regulate bank liquidity risk profiles:
the Liquidity Coverage Ratio (LCR) aims to ensure that banks hold sufficient liquid assets or cash to survive a significant stress scenario combining a market crisis and a specific crisis and lasting for one month;
the Net Stable Funding Ratio (NSFR) is a transformation ratio and compares funding needs with stable resources over a one-year period.
The Basel Committee stabilised its final version of the texts pertaining to the LCR in January 2013 and those pertaining to the NSFR on 31st October 2014.
The transposition of Basel 3 into European Union law under CRD4 and CRR1 was published on 27th June 2013, for implementation as from 1st January 2014. The French transposition was published in the French Official Journal (Journal Officiel) on 5th November 2014.
The LCR definition was finalised, on the basis of technical standards issued by the EBA, through a Delegated Act of the
European Commission on 10th October 2014. The LCR entered into force at European level on 1st October 2015. The corresponding minimum requirement was set at 70% for 2016, increasing gradually until it reached 100% as from 1st January 2018.
For the NSFR, the European Commission presented a proposal in November 2016 for transposition of the Basel regulations, which will be discussed at a trialogue meeting (European Parliament, Commission, Council). The European entry into force of the NSFR will depend on the duration of the legislative process and is not expected to take place before 2020. Societe Generale actively continued its work on transposing the Basel/European legislation and translating it into management standards within the Group. At Group level, the LCR is now managed based on the European standards.
Since implementation of the European regulatory LCR requirement in October 2015, Societe Generale’s LCR has at all times stood at a level exceeding 100%: 140% at end-2017 (vs. 142% at end-2016).

4 I 8
L IQUIDITY RISK RRISK FACTORS AND CAPIITAL ADEQUACY
224 I 2018 REGISTRATION DOCUMENT I S O C I E T E G E N E R AL E G R O U P
BALANCE SHEET SCHEDULE
The main lines comprising the Group’s financial liabilities are presented in Note 3.13 to the consolidated financial statements, under the following template:
FINANCIAL LIABILITIES
31.12.2017
(In EUR m)
Note to the consolidated
financial statements
0-3 m 3 m-1 yr 1-5 yrs > 5 yrs Total
Due to central banks 5,601 2 1 0 5,604
Financial liabilities at fair value through profit or loss, excluding derivatives
Note 3.4 189,204 9,774 7,048 20,155 226,181
Due to banks Note 3.6 48,212 12,078 22,862 5,469 88,621
Customer deposits Note 3.6 320,277 21,602 19,941 48,812 410,633
Securitised debt payables Note 3.6 31,527 14,165 37,802 19,741 103,235
Subordinated debt Note 3.9 732 1,080 634 11,201 13,647
Note: The scheduling assumptions for these liabilities are presented in Note 3.13 to the consolidated financial statements. The data are shown without provisional interest and excluding derivatives, which does not allow for a reconciliation with the amounts under “Financial liabilities at fair value through profit or loss”. Consequently, the impact of the debt revaluation linked to own credit risk and interest accrued at 31st December 2017 are not scheduled.
31.12.2016
(In EUR m)
Note to theconsolidated
financialstatements
0-3 m 3 m-1 yr 1-5 yrs > 5 yrs Total
Due to central banks 5,235 2 1 0 5,238
Financial liabilities at fair value through profit or loss, excluding derivatives Note 3.4 234,561 8,103 7,879 16,439 266,982
Due to banks Note 3.6 50,595 9,697 20,224 2,068 82,584
Customer deposits Note 3.6 336,689 29,867 29,134 25,312 421,002
Securitised debt payables Note 3.6 31,005 21,063 35,437 14,697 102,202
Subordinated debt Note 3.9 296 90 2,302 11,415 14,103

4
LIQUIDITY RISK
8 I 4RRISK FACTORS AND CAP IITAL ADEQUACY
S O C I E T E G E N E R AL E G R O U P I 2018 REGISTRATION DOCUMENT I 225
Symmetrically, the main lines comprising the corresponding financial assets are presented below.
FINANCIAL ASSETS
31.12.2017
(In EUR m)
Note to the consolidated
financial statements
0-3 m 3 m-1 yr 1-5 yrs > 5 yrs Total
Cash, due from central banks 102,750 773 1,834 9,047 114,404
Financial assets at fair value through profit or loss, excluding derivatives
Note 3.1 283,123 2,107 0 0 285,230
Available-for-sale financial assets Note 3.3 129,492 8,620 0 1,886 139,998
Due from banks Note 3.5 48,942 3,950 6,826 1,148 60,866
Customer loans Note 3.5 93,630 60,791 169,802 71,364 395,587
Lease financing and similar agreements Note 3.5 2,387 5,480 17,406 4,371 29,644
31.12.2016
(In EUR m)
Note to the consolidated
financial statements
0-3 m 3 m-1 yr 1-5 yrs > 5 yrs Total
Cash, due from central banks N 93,180 672 1,368 966 96,186
Financial assets at fair value through profit or loss, excluding derivatives
Note 3.1 319,406 12,805 332,211
Available-for-sale financial assets Note 3.3 128,861 8,526 2,017 139,404
Due from banks Note 3.5 42,236 4,264 11,299 1,703 59,502
Customer loans Note 3.5 103,586 52,652 147,769 93,636 397,643
Lease financing and similar agreements Note 3.5 2,772 5,821 15,378 4,887 28,858
It should be noted that due to the nature of its activities, Societe Generale holds derivatives and securities whose residual contractual maturities are not representative of its activities or risks.
By convention, the following residual maturities were used for the classification of financial assets:
1. Assets measured at fair value through profit or loss, excluding derivatives (customer-related trading assets)
– Positions measured using prices quoted on active markets (L1 accounting classification): maturity of less than three months.
– Positions measured using observable data other than quoted prices (L2 accounting classification): maturity of less than three months.
– Positions measured mainly using unobservable market data (L3): maturity of three months to one year.
2. Available-for-sale assets (insurance company assets and Group liquidity reserve assets in particular)
– Available-for-sale assets measured using prices quoted on active markets: maturity of less than three months.
– Bonds measured using observable data other than quoted prices (L2): maturity of three months to one year.
– Lastly, other securities (shares held long-term in particular): maturity of more than five years.

4 I 8
L IQUIDITY RISK RRISK FACTORS AND CAPIITAL ADEQUACY
226 I 2018 REGISTRATION DOCUMENT I S O C I E T E G E N E R AL E G R O U P
As regards the other lines comprising the balance sheet, other assets and liabilities and their associated conventions can be broken down as follows:
OTHER LIABILITIES
31.12.2017
(In EUR m)
Note to the consolidated
financial statements
Not scheduled
0-3 m 3 m-1 yr 1-5 yrs > 5 yrs Total
Revaluation difference on portfolios hedged against interest rate risk
6,020 0 0 0 0 6,020
Tax liabilities Note 6 0 0 1,108 0 554 1,662
Other liabilities Note 4.4 0 69,139 0 0 0 69,139
Non-current liabilities held for sale Note 2.5 0 0 0 0 0 0
Underwriting reserves of insurance companies Note 4.3 0 14,204 8,717 33,841 74,196 130,958
Provisions Note 8.3 6,117 0 0 0 0 6,117
Group shareholders’ equity 59,373 0 0 0 0 59,373
31.12.2016
(In EUR m)
Note to the consolidated
financial statements
Not scheduled
0-3 m 3 m-1 yr 1-5 yrs > 5 yrs Total
Revaluation difference on portfolios hedged against interest rate risk 8,460 0 0 0 0 8,460
Tax liabilities Note 6 0 0 984 0 460 1,444
Other liabilities* Note 4.4 0 81,893 0 0 0 81,893
Non-current liabilities held for sale 0 3,612 0 0 0 3,612
Underwriting reserves of insurance companies
Note 4.3 0 13,022 7,890 29,965 61,900 112,777
Provisions Note 8.5 5,687 0 0 0 0 5,687
Group shareholders’ equity 61,953 0 0 0 0 61,953
* Amounts restated relative to the financial statements published in 2016, following a change in the presentation of premiums on options to be paid and received.

4
LIQUIDITY RISK
8 I 4RRISK FACTORS AND CAP IITAL ADEQUACY
S O C I E T E G E N E R AL E G R O U P I 2018 REGISTRATION DOCUMENT I 227
OTHER ASSETS
31.12.2017
(In EUR m)
Note to the consolidated
financial statements
Not scheduled
0-3 m 3 m-1 yr 1-5 yrs > 5 yrs Total
Revaluation difference on portfolios hedged against interest rate risk
663 0 0 0 0 663
Held-to-maturity financial assets Note 3.9 0 0 0 0 3,563 3,563
Tax assets Note 6 6,001 0 0 0 0 6,001
Other assets Note 4.4 0 60,562 0 0 0 60,562
Non-current assets held for sale 0 1 12 0 0 13
Investments in subsidiaries and affiliates accounted for by the equity method 0 0 0 0 700 700
Tangible and intangible fixed assets Note 8.4 0 0 0 0 24,818 24,818
Goodwill Note 2.2 0 0 0 0 4,988 4,988
(In EUR m)
31.12.2016
Note to the consolidated
financial statements
Not scheduled
0-3 m 3 m-1 yr 1-5 yrs > 5 yrs Total
Revaluation difference on portfolios hedged against interest rate risk
1,078 1,078
Held-to-maturity financial assets Note 3.9 3,912 3,912
Tax assets Note 6 6,421 6,421
Other assets* Note 4.4 71,437 71,437
Non-current assets held for sale 3,569 683 4,252
Investments in subsidiaries and affiliates accounted for by the equity method 1,096 1,096
Tangible and intangible fixed assets Note 8.4 21,783 21,783
Goodwill Note 2.2 4,535 4,535
* Amounts restated relative to the financial statements published in 2016, following a change in the presentation of premiums on options to be paid and received.
1. Revaluation differences on portfolios hedged against interest
rate risk are not scheduled, as they comprise transactions backed by the portfolios in question. Similarly, the schedule of tax assets whose schedule would result in the early disclosure of income flows is not made public.
2. Held-to-maturity financial assets have a residual maturity of more than five years.
3. Other assets and Other liabilities (guarantee deposits and settlement accounts, miscellaneous receivables) are considered as current assets and liabilities.
4. The notional maturities of commitments in derivative instruments are presented in Note 3.2 to the Group’s consolidated financial statements. The net balance of
transactions in derivatives measured at fair value through profit or loss on the balance sheet is EUR -8,074 million (according to the rules set above, this balance is classified as a trading liability < 3 months, see Note 3.4 to the consolidated financial statements).
5. Non-current assets held for sale have a maturity of less than one year, as do the associated liabilities.
6. Investments in subsidiaries and affiliates accounted for by the equity method and Tangible and intangible fixed assets have a maturity of more than five years.
7. Provisions and shareholders’ equity are not scheduled.
4 I 9
COMPLIANCE AND REPUTATIONAL RISK, LITIGATION RRISK FACTORS AND CAPIITAL ADEQUACY
228 I 2018 REGISTRATION DOCUMENT I S O C I E T E G E N E R AL E G R O U P
9 . C O M P L I A N C E A N D R E P U TAT I O N A L R I S K , L I T I G AT I O N
Compliance means acting in accordance with the obligations applicable to the Group’s activities, ranging from laws and regulations to professional, ethical and internal standards and principles.
By ensuring that these provisions are observed, the Group works to protect its employees, customers and all stakeholders.
Compliance with rules is the responsibility of all Group employees, who must demonstrate compliance and integrity in their daily tasks. The Group relies on a recently restructured, clear organisation to ensure the compliance system is both respected and consistent.
COMPLIANCE
The Compliance system The system for prevention of compliance risks is based on shared responsibility between the BU/SUs and CPLE, together with the entire Compliance function:
operational entities (BU/SU) must integrate compliance with laws and regulations, the rules of good professional conduct, and the Group’s internal rules into their daily work;
CPLE and the Compliance function have two main duties: (i) advising and assisting the operational entities so that they may complete their tasks in compliance with their professional and regulatory obligations, and in keeping with the Group’s commitments; and (ii) monitoring and assessing the relevance and efficiency of the system for monitoring and controlling compliance risks.
The Compliance function reports to the Group Compliance Division, which has become a full-function division since 1st January 2017. It is made up of teams dedicated to each business, teams dedicated to the supervision of the various risks and teams dedicated to controls, in addition to key cross-business functions, such as training and digital transformation.
The Legal, Tax, Human Resources, Corporate Social Responsibility, and Corporate Resources and Innovation divisions support the Compliance function within the scope of their respective fields of expertise.
The Head of Group Compliance is responsible for the worldwide coordination of the Compliance function and of relations with the supervisory and regulatory authorities in this regard.
The Compliance Division manages the compliance control and reputational risk monitoring system. It ensures the consistency of the Group’s system for prevention of compliance risks, its efficiency, and the development of appropriate relationships with banking supervisors and regulators.
The work carried out by the Compliance Division concerns the following main tasks:
the definition and implementation of the overall normative framework, including the development, in collaboration with the Legal Department, of procedures intended to ensure compliance with the laws and regulations applicable to banking and financial activities, and the standards of conduct set by General Management;
the adaptation and operational implementation of said normative framework within its scope of hierarchical authority, or else the monitoring of its implementation within its scope of functional supervision (Group subsidiaries);
the second-level control and supervision of the system, including the independent assessment of compliance risk management within the entities/activities having a major impact on the Group’s risk profile, and individually with respect to regulated employees, in compliance with regulations, in particular CRD4;
the implementation of awareness-raising actions among Group employees regarding non-compliance risks and the strengthening of the Group’s compliance culture;
the consolidation and monitoring of significant events within all entities, relying in particular on Group management dashboards and on the information provided by General Management and the Board of Directors, and, in coordination with the Legal Department, the monitoring of relations with banking supervisors and regulators.
The Head of Group Compliance attends meetings of the Group’s highest management bodies. Information is reported in particular through presentations made to these bodies and during Committee meetings dedicated to compliance.
GROUP FINANCIAL CRIME COMPLIANCE SYSTEM Societe Generale has a comprehensive system to prevent and detect risks related to money laundering and terrorism financing, in addition to non-compliance with embargoes and financial sanctions.
This system is organised as follows:
a central department responsible for supervising Group financial crime compliance and handling the most sensitive alerts;
the Compliance Officers for each business implement the financial crime compliance system within their scope and advise the operational teams;
Anti-Money Laundering Officers (AMLO) are responsible for implementing the anti-money laundering and counter-terrorism financing system within their entities.

4
COMPLIANCE AND REPUTATIONAL RISK, L IT IGATION
9 I 4 RRISK FACTORS AND CAP IITAL ADEQUACY
S O C I E T E G E N E R AL E G R O U P I 2018 REGISTRATION DOCUMENT I 229
The entities located abroad must apply measures at least equivalent to French regulatory obligations and to the Group policy, while complying with local obligations. When local regulations impose additional obligations, said obligations must also be applied.
The financial crime compliance teams report suspicious activity to TRACFIN (a service of the French Ministry of Finance) for all of the Group’s French entities (except Crédit du Nord and Boursorama Banque, which report directly), and submit reports on asset freezes and authorisation requests to the French Treasury for Societe Generale SA. Likewise, with respect to entities and subsidiaries located outside France, the AMLOs report suspicious activity to the equivalent local authorities.
APPLICATIONS DEDICATED TO COMPLIANCE ENFORCEMENT
Tools enabling supervision of transactions ensure compliance with regulations and the detection of situations requiring special attention:
exposure to money laundering and terrorism financing, and any market abuse, price manipulation and insider trading;
exposure to embargo- and sanction-related risks, in particular in the event of identification of people, countries or activities targeted by national and international sanctions and by embargoes.
Furthermore, risk reporting and assessment tools are used to produce reports and reviews updating the Bank’s managing bodies, supervisors, regulators, divisions, and more with any relevant information.
Implementation of compliance policies
FINANCIAL CRIME COMPLIANCE
KNOW YOUR CUSTOMER (KYC)
Investments aimed at strengthening our knowledge of our customers were increased in 2017, and these efforts will continue. A risk-based approach is rolled out within the Group with respect to both new and existing customers.
ANTI-MONEY LAUNDERING AND COUNTER-TERRORISM FINANCING (AML/CTF)
New initiatives aimed at increasing the efficiency of the AML/CTF system and the vigilance of Group employees were implemented in 2017.
The following are of particular note:
preparation of the entry into force of the Fourth European Anti-Money Laundering Directive and, in particular, the implementation of European Regulation 2015/847 on the quality of payment messages;
training and awareness-raising efforts implemented with the launch of a new programme in September 2017 for all Group employees and the continued certification of financial crime compliance employees in terms of AML/CTF.
EMBARGOES AND FINANCIAL SANCTIONS
In 2017, the international environment was marked by new sanctions against North Korea and Venezuela, as well as strengthened measures against Russia, involving a highly complex implementation. Differences between the European and US regimes are likely to generate significant operational risks for financial institutions. In view of prevailing uncertainties, the Societe Generale Group does not intend to resume its commercial activities with Iran at this stage, and maintains a tightly regulated policy towards Russia.
To be noted for 2017:
the continued strengthening of the workforce dedicated to embargoes in the Compliance function and the vocational training of employees, in particular through certifications concerning risks related to international sanctions;
the strengthening of vigilance tools with respect to business relations.
OTHER REGULATORY RISKS
CUSTOMER PROTECTION
Customer protection is a major challenge for the Societe Generale Group in view of the reputational risk incurred in the event of breaches and sanctions. The Group must serve its customers’ interests to the best of its ability. The importance of this issue is underscored in the Group’s Code of Conduct, which was updated in October 2016, and in the Group’s Culture and Conduct programme.
As part of implementing the main regulations, the Group has taken significant actions in terms of:
dedicated training and awareness-raising among employees;
adapting existing tools to new regulatory requirements (e.g. MiFID II);
strengthening internal rules pertaining to customer claims (customer claims, conflicts of interest and social media).
CLAIMS AND MEDIATION
A claim is treated first and foremost as a commercial action which contributes to customer satisfaction.
Significant progress has been made by the core businesses over the last three years in terms of processing customer claims. The core businesses benefit from ad hoc governance, an organisation, human and IT resources, formalised procedures, and quantitative and qualitative monitoring indicators. The progress observed is also the result of significant awareness-raising and training initiatives conducted among employees.
A Group "Customer claim processing" guideline was published in January 2017. This guideline includes recommendations from the French Prudential Supervisory and Resolution Authority (Autorité de Contrôle Prudentiel et de Résolution – ACPR) and MiFID II regulatory requirements, as part of strengthening customer protection measures in Europe.

4 I 9
COMPLIANCE AND REPUTATIONAL RISK, LITIGATION RRISK FACTORS AND CAPIITAL ADEQUACY
230 I 2018 REGISTRATION DOCUMENT I S O C I E T E G E N E R AL E G R O U P
MARKET INTEGRITY
CONFLICTS OF INTEREST
The Group has a normative framework on the prevention and management of conflicts of interest, which specifies the principles and mechanisms implemented. The Group’s guideline was updated in 2017 to include the regulatory changes under way (see the MiFID II European regulations on customer protection).
It covers the two categories of potential conflicts of interest: firstly, those that could occur between the Group and its customers, or between the Group’s customers, and secondly, those that could occur between the Group and its employees (in particular in relation to activities involving an employee’s personal interest and/or professional obligations). It sets out the obligations for identifying potential conflicts of interest, which should be entered into a tool for mapping or registering conflicts of interest.
MARKET ABUSE
Since July 2016, a new legal framework has entered into force for market abuse within the European Union (MAR). Accordingly, in 2017 the Compliance function continued to implement efforts aimed at improving and ensuring the compliance of its system. Special attention was given to the modernisation of automated detection and analysis tools, and to the training of employees working in the Compliance function and responsible for these controls.
The Group has a “Market abuse” guideline (published in 2016) and a guideline on the “Management of privileged information on a listed issuer”, which was revised during the year.
In particular, these guidelines highlight the measures to be implemented to prevent or detect market abuse practices undermining the integrity of financial markets, namely:
insider trading (sending and using privileged information);
market manipulation (price manipulation, disseminating false information).
EMPLOYEE ETHICS
Compliance with ethical policies is a key obligation under Societe Generale’s rules of conduct. Procedures and their proper application are closely examined, including those related to the supervision of outside personnel (employees of service providers, temporary employees and trainees). Furthermore, the system for internal control of employees has included the regulatory requirements of the European Union concerning market abuse (‘MAD II/MAR”) since 2016.
EXCEEDING OWNERSHIP THRESHOLDS
The cross-business tool for monitoring equity interests and voting rights held by Societe Generale in listed issuers ensures worldwide compliance (104 countries) with regulations on the exceeding of share ownership thresholds (pursuant to the law or the By-laws, or during public offer periods).
It includes all forms of shares and derivatives with underlying equity securities held. These holdings are calculated in accordance with the specific rules in each country.
TAX COMPLIANCE
Societe Generale implements control measures to ensure its operations comply with local laws and regulations, and with its Tax Code of Conduct. These controls are performed by the Tax Division and the Compliance Division. Accordingly, all new products require approval with respect to these texts; this also applies to complex operations either within the Group or with customers.
Societe Generale complies with tax transparency standards. It applies the Common Reporting Standard (CRS) to all its entities. This standard enables tax authorities to be systematically informed of income received abroad by their tax residents, including if the accounts are held in wealth structures. In 2018, these declarations concerned 37 countries where Societe Generale operates.
Moreover, Societe Generale complies with the requirements of the United States FATCA (Foreign Account Tax Compliance Act), which aims to combat tax evasion schemes involving foreign accounts or entities held by American taxpayers. Non-American financial intermediaries are thus responsible for identifying American taxpayers in their customer base in order to declare the income received by said taxpayers, directly or indirectly, to the American tax administration, thereby enabling an automatic reconciliation with their individual tax returns. The tax transparency objectives have been achieved by means of a tax return filed at the national level and the sharing of tax information between partner countries on the basis of existing bilateral tax treaties and inter-governmental agreements (IGAs).
Lastly, Societe Generale includes fiscal fraud in its anti-money laundering mechanism.
ANTI-CORRUPTION MEASURES
The fight against corruption is intensifying. Many countries have anti-corruption laws and increasingly severe sanctions are regularly imposed on individuals and legal entities. France has significantly strengthened its legislative framework, with the entry into force on 1st June 2017 of the Sapin 2 Act regarding transparency, the fight against corruption and the modernisation of the economy, together with the simultaneous creation of the French anti-corruption agency (Agence Française Anticorruption – AFA) dedicated to preventing corruption and monitoring economic players.
To fight corruption, Societe Generale has long promoted strict principles which form part of its Code of Conduct and comply with the most stringent regulations in this regard, including the UK Bribery and Corruption Act (2011). As from 2000, Societe Generale has demonstrated its commitment in this area by joining the Wolfsberg Group and subscribing to the United Nations Global Compact in 2003.
Ahead of the entry into force of the Sapin 2 Act, Societe Generale launched a review of its system at the end of 2016 and has endeavoured to complete this review in order to comply with the eight measures. In accordance with this Act, an anti-corruption code has been prepared, approved and incorporated into the Internal Rules of Societe Generale France. The Normative Documentation of all entities – in France and abroad – is being updated. Lastly, a training programme dedicated to the senior managers and employees with the greatest risk exposures has been initiated, with the support of a specialised firm. To date, more than 2,500 people across all regions and businesses have benefited from this programme.
DATA PROTECTION
As a trusted partner of its customers, Societe Generale is particularly sensitive to personal data protection.
Societe Generale decided to reinforce its data protection system back in 2007. It therefore created a “Data Protection” department within its Legal Department, specialising in all matters relating to privacy, and working in conjunction with the French Data Protection Commission (CNIL). This department assists, advises and informs all Societe Generale entities on data protection requirements, responds to assistance requests received from Group subsidiaries, and handles relations with the CNIL.

4
COMPLIANCE AND REPUTATIONAL RISK, L IT IGATION
9 I 4 RRISK FACTORS AND CAP IITAL ADEQUACY
S O C I E T E G E N E R AL E G R O U P I 2018 REGISTRATION DOCUMENT I 231
In anticipation of the implementation of a new European General Data Protection Regulation (GDPR), applicable as from 25th May 2018, Societe Generale launched an extensive Group-wide programme in 2016. This programme includes all the new requirements introduced by the GDPR, in particular regarding aspects of security and use of personal data and the implementation of strengthened rights for the people concerned. Within this environment, the Societe Generale Group appointed a Data Protection Officer in September 2017. Working within the Group Compliance Division, the Officer is responsible for ensuring a good level of Group compliance with European regulations.
In accordance with local and European regulations, the internal guidelines and related procedures describe the rules and procedures in place to guarantee the protection of customer and employee data.
OTHER REGULATORY MATTERS
Following the operational implementation of several major regulatory texts by the businesses, in particular the French banking law of 26th July 2013, the Volcker reform, the DFA (“Dodd-Frank Act”), the EMIR (“European Market Infrastructure Regulation”), the Eckert Act, the FATCA (“Foreign Account Tax Compliance Act”), and Common Reporting Standards (“CRS”), the Compliance function continued their supervision in 2017.
THE PERMANENT CONTROL SYSTEM The Compliance function is one of the three control functions of the Societe Generale Group (together with the risk and finance functions) that implements permanent second-level control to review the quality of the compliance checks performed by the businesses.
The roll-out of this control system is currently an important part of the second line of defence.
MANAGEMENT OF REPUTATIONAL RISK Management of reputational risk is governed by an internal directive signed by the Chief Executive Officer of the Societe Generale Group. The control procedures implemented are intended to prevent, identify, assess and control risks.
It is coordinated by the Compliance Division, which:
supports Group employees, and more particularly the Compliance Control Officers of the businesses, in their strategy for preventing, identifying, assessing and controlling reputational risk;
offers and updates training programmes to raise awareness of reputational risk;
defines, analyses and communicates the results of reputational risk management tools (specific dashboard) on a quarterly basis to members of the Compliance Committee (Group COM-CO) and to the Risk Committee (CR).
THE COMPLIANCE FUNCTION’S TRANSFORMATION PROGRAMME The Group has launched a transformation programme targeting the Compliance function and covering the 2015-2020 period. This programme is aimed at (i) strengthening compliance risk control through heightened vigilance and awareness-raising applicable to all players, including the businesses, their support staff and the other divisions, (ii) increasing the operational efficiency of all related processes, and (iii) meeting the requirements of supervisory and regulatory authorities in the long term.
This programme provides for updated governance and greater resources allocated to the Compliance function, whether in terms of recruitment, training, or modernisation of dedicated information systems. It also provides for updating of the normative framework and risk assessments, together with strengthening of controls.
This programme includes a component specific to business operations in the United States, which are subject to special monitoring by General Management and the Board of Directors. The close monitoring of this programme will continue in 2018 with updated commitments in order to include both changes in Group governance and regulators’ requirements, with the support of all three lines of defence (business, compliance, internal audit). Lastly, it should be noted that the programme’s contribution to implementation of the new regulations is helping to accelerate this transformation.
UNITED STATES REMEDIATION COMPLIANCE PLAN
On 14th December 2017, Societe Generale and Societe Generale New York branch (“SGNY”), entered into a Cease & Desist Order with the Board of Governors of the Federal Reserve that addresses SGNY’s Bank Secrecy Act (“BSA”) and Anti Money Laundering (“AML”) compliance program (the “Financial Crime Compliance Program”), including aspects of its Know Your Customer program.
The Order requires Societe Generale and SGNY to enhance governance and oversight of SGNY’s Financial Crime Compliance Program to achieve compliance with certain BSA/AML requirements and to hire an external consultant to conduct a comprehensive review of SGNY’s compliance with BSA/AML requirements. Following this review, the Order requires SGNY to implement an enhanced Financial Crime Compliance Program and an enhanced customer due diligence program.

4 I 9
COMPLIANCE AND REPUTATIONAL RISK, LITIGATION RRISK FACTORS AND CAPIITAL ADEQUACY
232 I 2018 REGISTRATION DOCUMENT I S O C I E T E G E N E R AL E G R O U P
Looking ahead to 2018 Since 1st June 2017, the Compliance Division has reported to a Deputy Chief Executive Officer of the Group, as a full-function Division, just like the Risk Division.
The new organisation established in early 2018 will enable a closer relationship with the businesses, while consolidating the supervision and overall management of compliance risks, thanks in particular to:
greater professionalism in the teams and a stronger compliance culture within the Group; the “Culture and Conduct” programme, supervised directly by General
Management, the rules and principles of which go beyond regulatory requirements, aims to develop training and awareness-raising initiatives for employees and management;
the use of digital and new technologies to drive operational efficiency;
greater human and financial resources allocated to Group Compliance, which will continue to be strengthened in 2018.
LITIGATION The information pertaining to risks and litigation is included in Note 9 to the consolidated financial statements, page 444.

4
OTHER RISKS
10 I 4RRISK FACTORS AND CAP IITAL ADEQUACY
S O C I E T E G E N E R AL E G R O U P I 2018 REGISTRATION DOCUMENT I 233
1 0 . O T H E R R I S K S
EQUITY RISK
Investment strategies and purpose The Societe Generale Group’s exposure to its non-trading equity portfolio relates to several of the Bank’s activities and strategies. It includes equities and equity instruments, mutual fund units invested in equities, and holdings in the Group’s subsidiaries and affiliates which are not deducted from shareholders’ equity for the purpose of calculating solvency ratios. Generally speaking, due to their unfavourable treatment under regulatory capital, the Group’s future policy is to limit these investments.
First, the Group has a portfolio of industrial holdings which mainly reflect its historical or strategic relations with these companies.
It also has some minority holdings in certain banks for strategic purposes, with a view to developing its cooperation with these establishments.
In addition, the equities that are not part of the trading book include Group shares in small subsidiaries which are not included in its consolidation scope and which operate in France and abroad. This includes various investments and holdings that are ancillary to the Group’s main banking activities, particularly in French Retail Banking, Corporate and Investment Banking, and Securities Services (private equity activities in France, closely linked with banking networks, stock market bodies, brokerages, etc.).
Lastly, Societe Generale and some of its subsidiaries may hold equity investments related to their asset management activities (particularly seed capital for mutual funds promoted by Societe Generale), in France and abroad.
Monitoring of banking book equity investments and holdings The portfolio of industrial holdings was significantly reduced in recent years, further to the disposal of non-strategic lines. It now includes only a limited number of investments. It is monitored on a monthly basis by the Group’s Finance Division and, where necessary, value adjustments are recognised quarterly in accordance with the Group’s provisioning policy.
The holdings that are ancillary to the Group’s banking activity are monitored on a quarterly basis by the Group’s Finance Division and, where necessary, value adjustments are recognised quarterly in accordance with the Group’s provisioning policy. Private equity activities in France are subject to dedicated governance and monitoring, within the budgets periodically reviewed by the Group’s General Management. Investment or disposal decisions take the financial aspects and the contribution to the Group’s activities into consideration (supporting customers in their development, cross-selling with flow activities, Corporate and Investment Banking, Private Banking, etc.).
Valuation of banking book equities From an accounting perspective, Societe Generale’s exposure to equity investments that are not part of its trading book is classified under available-for-sale financial assets insofar as these equity investments may be held for an indefinite period or may be sold at any time.
The Societe Generale Group’s exposure to equity investments that are not part of the trading book is equal to their book value net of impairments.
The following table presents these exposures at end-December 2017 and 2016, for both the accounting scope and the regulatory scope. Regulatory data cannot be reconciled with data from consolidated financial statements, specifically because the regulatory scope excludes equity investments held on behalf of clients by the Group’s insurance subsidiaries.
TABLE 38: BANKING BOOK EQUITY INVESTMENTS AND HOLDINGS
(In EUR m) 31.12.2017 31.12.2016
Banking book equity investments and holdings - Accounting scope 15,365 14,657
o.w. equities and other AFS instruments 13,447 12,447
o.w. AFS equities held over the long term 1,918 2,210
Banking book equity investments and holdings - Prudential scope (EAD) 6,194 6,746
o.w. listed shares 81 188
o.w. unlisted shares 6,113 6,558

4 I 10
OTHER RISKS RRISK FACTORS AND CAPIITAL ADEQUACY
234 I 2018 REGISTRATION DOCUMENT I S O C I E T E G E N E R AL E G R O U P
Changes in fair value are recognised in Group shareholders’ equity under “Unrealised or deferred capital gains and losses”. In the event of a sale or durable impairment, changes in the fair value of these assets are recorded in the income statement under “Net gains and losses on available-for-sale financial assets”. Dividends received on equity investments are recognised in the income statement under “Dividend income”.
For listed shares, the fair value is estimated based on the closing share price. For unlisted shares, the fair value is estimated based on
the category of financial instrument and one of the following methods:
the share of net assets owned;
the valuation based on recent transactions involving the company’s shares (acquisition of shares by third parties, expert valuations, etc.);
the valuation based on recent transactions involving companies in the same sector (earnings or NAV multiples, etc.).
TABLE 39: NET GAINS AND LOSSES ON BANKING BOOK EQUITIES AND HOLDINGS
(In EUR m) 31.12.2017 31.12.2016
Gains and losses on the sale of shares (38) 752
Impairment of assets in the equity (64) (36)
In proportion to the net income on the equity portfolios
109 56
Net gains/losses on banking book 7 772
Unrealised gains/losses on holdings 450 546
Regulatory capital requirements To calculate the risk-weighted assets under Basel 3, the Group applies the simple risk weighting method for the majority of its non-trading equity portfolio. Shares in private equity companies are assigned a risk-weighting coefficient of 190%, shares in listed companies a coefficient of 290%, and shares in unlisted companies, including the holdings in our insurance subsidiaries,
a coefficient of 370%. Note that private equity shares acquired before January 2008 can be weighted at 150%. Furthermore, if they are not deducted from equity capital, material investments in the capital of finance companies are assigned a weighting coefficient of 250%.
At 31st December 2017, the Group’s risk-weighted assets related to its non-trading equity portfolio, and its capital requirements, were as follows:
TABLE 40: CAPITAL REQUIREMENTS RELATED TO BANKING BOOK EQUITIES AND HOLDINGS(1)
(In EUR m) 31.12.2017 31.12.2016
Equities & holdings Approach
Weight-ing
Exposure at default
Risk weighted assets
Capital requirements
Exposure at default
Risk weighted assets
Capital requirements
Private equity Standard 150% 4 7 1 8 12 1
Private equity Simple approach
190% 198 376 30 233 442 35
Financial securities
Simple approach
250% 933 2,331 186 963 2,406 192
Listed shares Simple
approach 290% 20 59 5 68 199 16
Unlisted shares
Simple approach 370% 4,615 17,076 1,366 4,499 16,647 1,332
Total 5,7770 19,,849 1,5588 5,7771 19,,706 1,5576
(1) Excluding cash investments.
4
OTHER RISKS
10 I 4RRISK FACTORS AND CAP IITAL ADEQUACY
S O C I E T E G E N E R AL E G R O U P I 2018 REGISTRATION DOCUMENT I 235
STRATEGIC RISKS Strategic risks are defined as the risks inherent in the choice of a given business strategy or resulting from the Group’s inability to execute its strategy. They are monitored by the Board of Directors, which approves the Group’s strategic direction and reviews them at least once every year. Moreover, the Board of Directors approves strategic investments and any transaction (particularly disposals and acquisitions) that could significantly affect the Group’s results, the structure of its balance sheet or its risk profile.
Strategic steering is carried out by the Executive Committee under the authority of General Management, with the assistance of the Group Management Committee. The Executive Committee meets once a week, barring exceptions. The makeup of these various bodies is laid out in the Corporate Governance chapter of this Registration Document (pages 71 and following). The Internal Rules of the Board of Directors (provided in Chapter 7 of this Registration Document, page 546) lay down the procedures for convening meetings.
ACTIVITY RISK Activity risk is the risk of loss if expenses incurred are higher than revenues generated. It is managed by the Finance Division through monthly revenue committee meetings.
During these meetings, which are chaired by a member of General
Management, the Group’s businesses present their results and comment on the state of business, and also present an analysis of their consumption of their budget and scarce resources (especially capital and liquidity).
RISKS RELATING TO INSURANCE ACTIVITIES Through its insurance subsidiaries, the Group is also exposed to a variety of risks inherent to this business. These include ALM risk management (risks related to interest rates, valuations, counterparties and exchange rates) as well as premium pricing risk, mortality risk and structural risk related to life and non-life insurance activities, including pandemics, accidents and catastrophes (such as earthquakes, hurricanes, industrial
disasters, terrorist attacks or military conflicts).
The monitoring structure pertaining to these risks and the related issues are described in Note 4.3 to the consolidated financial statements and in Chapter 6 of this Registration Document (p. 385).
ENVIRONMENTAL AND SOCIAL RISKS The Group’s approach in terms of environmental and social issues is set out in Chapter 5 of this Registration Document (pages 237 and following); in particular, information on risks related to climate change can be found on page 272.
CONDUCT RISK The Group is also exposed to conduct risk through all of its core businesses. The Group defines conduct risk as resulting from actions (or inactions) or behaviours of the Bank or its employees, inconsistent with the Group’s Code of Conduct, which may lead to adverse consequences for its stakeholders, or place the Bank’s sustainability or reputation at risk.
Stakeholders include in particular our clients, employees, investors, shareholders, suppliers, the environment, markets and countries in which we operate.
The implementation of the monitoring structure pertaining to these risks is one of the priorities of the Culture and Conduct programme in 2018 (see pages 239 and following).

4 I 10
OTHER RISKS RRISK FACTORS AND CAPIITAL ADEQUACY
236 I 2018 REGISTRATION DOCUMENT I S O C I E T E G E N E R AL E G R O U P
CORPORATE SOC IAL RESPONS IB I L I TY

S O C I E T E G E N E R AL E G R O U P I 2018 REGISTRATION DOCUMENT I 237
5
CORPORATE SOC IAL RRESPONS IB I L I TY
1. Societe Generale – CSR at a glance .. 238 2. Societe Generale is a
responsible bank ................................ 239 A corporate culture built around values ...................... 239 Ethics and governance ............................................. 241 A responsible employer ............................................. 242 Corporate social responsibility (CSR), an ambition that is integrated into the Group’s strategy .......................... 256 The CSR ambition in the 2017-2020 strategy ............ 260
3. Societe Generale is implementing its CSR ambition ..................................... 262 Customer satisfaction and protection ........................ 262 Management of environmental, social and governance risks (ESG) ................................................................ 265 The 2018 Positive Sourcing Programme, an instrument of change ..................................................................... 270
Societe Generale’s role in the fight against climate change ......................................................... 272 Contribution to Africa’s sustainable development ....... 280 Supporting major societal changes and the economic development of the territories .................................... 282 A bank pioneering responsible finance ....................... 288
4. Appendices ........................................ 291 Note on methodology ............................................... 291 Corporate Social Responsibility – Group key figures ... 293 Independent verifier’s report on the consolidated social, environmental and societal information presented in the management report .................................................. 295
5. Cross-reference table ......................... 297 CSR concordance table (article 225 – Grenelle II) ....... 297

5 I 1
SOCIETE GENERALE – CSR AT A GLANCE CCORPORATE SOCIAL RESPPONSIBILITY
238 I 2018 REGISTRATION DOCUMENT I S O C I E T E G E N E R AL E G R O U P
1. SOCIETE GENERALE – CSR AT A GLANCE
CORPORATE CULTURE A Culture and Conduct programme with a Director who
reports directly to the CEO 1 Code of Conduct, translated into 22 languages, which is
the cornerstone of the Group’s professional ethics 4 behavioural values applied in the main HR processes: team
spirit, responsibility, innovation and commitment The objectives of the Management Committee members will
be aligned with (CSR) responsibility from 2018 1 reesponsible representation of interests and signing of the
Transparency International France “Joint Declaration” 1 Tax Code of Conduct and 11 Anti-ccorruption Code 1 Responsible Sourcing Code
A RESPONSIBLE EMPLOYER 23,966 internal job transfers 15,000 teleworkers 93% of the Group’s employees had a performance appraisal Societe Generale is ranked 114th (1sst FFrench bank) among
more than 3,000 companies in the international ranking on gender equality by the NGO Equileap
25.7 average training hours per employee in 2017, with 80% of employees benefiting from at least one training session
2nnd ccompany and 1st bank iin France for digital maturity, as recognised by the 2017 eCAC40 Awards
CSR AMBITION A CSR ambition, which has been validated by the Board of
Directors and integrated into Group strategy Consultation of 1,500 stakeholders: materiality matrix
definition and 6 strategic CSR challenges Expertise recognised by non-financial agencies Historic commitments
CUSTOMER SATISFACTION AND PROTECTION 9/10 of our SME clients rate our teams as “proficient and
knowledgeable” 15 days’’ maximum response time: Boursorama’s
commitment for handling complaints (AFNOR WebCert Certification)
Won the Viséo Customer Insights “2018 Customer Service of tthe Year Award” for the fifth year running
Voted the “Best Private Bank in Westeern Europe” by Private Banker
A cyber ssecurity system coordinated by an Operational IT Risk and Information System Security Manager
ESG RISK MANAGEMENT 12 Sector policies 97 transactions, with a total value of EUR 55.5 billion,
underwent an E&S evaluation in 2017 Publication of the extra-territorial Duty oof Care Plan Societe Generale is a signatory of the Modern Slavery Act
((MSA) Implementation of the Soft Commodities Impact
commitments Roll-out of the Positive Sourcing Programme
THE FIGHT AGAINST CLIMATE CHANGE A climate strategy committed to the IEA’’s 2DS((1) EUR 100 billion: renewable energy financing target for 2020
(of which EUR 39 billion at end-2017) EUR 30 billion in green bonds since 2016 EUR 66 bbillion in green financing since 2016 End of funding for coal mmines and coal-ffired power stations Limitation of the coal portion of the financed energy mix to
19% by 2020 End of funding for the production of ppetroleum from oil sands
on a global scale End of funding for the production of petroleum in the Arctic
region -225% in CO2 equivalent emissions for our own account by
2020 (of which -13.3% achieved in 2017)
CONTRIBUTION TO AFRICA’S SUSTAINABLE DEVELOPMENT
4 million clients, including 150,000 companies, in 19 countries
19 activess MMFI(2) clients with commitments amounting to EUR 71.3 million (x 2 vs. 2016)
Promising initiatives: PanAfricanValley, SAFARI, 3 innovation llabs
First partner of AFD’s ARIZ risk-sharing mechanism: 1,250 African companies supported
Financial inclusion via digital solutions: YUP, Manko, Bankaty EUR 16 billion loan outstandings at 31st December 2017
SUPPORTING MAJOR SOCIETAL CHANGES AND THE ECONOMIC DEVELOPMENT OF THE TERRITORIES
EUR 15.7 billion dedicated to public economy financing EUR 1.6 billion in credit lines with IFIs (of which around 80%
is for SMEs) EUR 110.6 million in commitments granted on an
international scale via 35 partner MFIs EUR 11.5 million in microcredit lines made available in
partnership with ADIE in France 520,121 SMES and VSBs supported (including 336,278 in
France) 31,000 cases processed on the amicable negotiation
platforms, of which 70% have returned to a sound financial footing
Real--estate projects were rewarded for their sustainable innovation (“Grand Prix 2017” for Les Dunes, “Green Solutions Award”, 3 “Inventons la métropole du Grand Paris” tenders won)
A BANK PIONEERING RESPONSIBLE FINANCE Societe Generale initiated positive impact finance EUR 55 bbillion in positive impact finance since 2016 Lyxor ETFs contributing to SDGs Lyxor is a signatory of the PRI((3) ESG research has won several awards
(1) IEA: International Energy Agency. (2) MFI: Microfinance Institution. (3) PRI: Principles for Responsible Investment.

5
Culture and Conduct
1 Code of Conduct
4 behavioural values
(CSR) responsibility 1 responsible representation of interests
1 Tax Code of Conduct 1 Anti-corruption Code 1 Responsible Sourcing Code
23,966 15,000 93%
14th (1st French bank)
25.7 80%
2nd company and 1st bank in France for digital maturity
CSR ambition
1,500 stakeholders materiality matrix
Expertise recognised Historic commitments
9/10 of our SME clients
15 days’
“2018 Customer Service of the Year Award”
“Best Private Bank in Western Europe”
A cyber security system
1297 5.5
Duty of Care PlanModern Slavery Act
(MSA) Soft Commodities Impact
IEA’s 2DS(1)
EUR 100 billion
EUR 30 billionEUR 6 billion
coal mines and coal-fired power stations
19%petroleum from oil sands
petroleum in the Arctic region-25%
19 countries19 actives MFI(2)
EUR 71.3 millionPanAfricanValley, SAFARI, 3 innovation
labs ARIZ
YUP, Manko, BankatyEUR 16 billion
EUR 15.7 billionEUR 1.6 billion
EUR 110.6 million
EUR 11.5 million
520,121
31,00070%
Real-estate
positive impact financeEUR 5 billion
SDGsPRI(3)
ESG research
SOCIETE GENERALE IS A RESPONSIBLE BANK
2 I 5CCORPORATE SOCIAL RESPPONSIBILITY
S O C I E T E G E N E R AL E G R O U P I 2018 REGISTRATION DOCUMENT I 239
2 . SOCIETE GENERALE IS A RESPONSIBLE BANK
A CORPORATE CULTURE BUILT AROUND VALUES
To be a trusted partner committed to positive transformation, Societe Generale is guided by four fundamental values (team spirit, innovation, responsibility and commitment), and promotes the behaviours and skills through which all its employees should apply these values.
The Code of Conduct, which was updated at the end of 2016 and implemented worldwide, describes the standards to be met and represents a commitment to each stakeholder. This Code applies to all employees in all locations.
In 2016, Societe Generale launched an extensive “Culture and Conduct” programme under the direct supervision of the Chief Executive Officer, which reports on its action to the Board of Directors.
THE CODE OF CONDUCT, A COMMITMENT TO STAKEHOLDERS Societe Generale requires its employees to meet the highest standards of integrity in everything they say and do. The Code of Conduct, available in 22 languages, is a vital tool in this respect. It defines what the Group expects of all its employees and provides the information and resources required to manage its activities ethically and in compliance with the laws of the countries in which the Group operates.
The Code of Conduct is the cornerstone of professional ethics at Societe Generale. It promotes respect for human rights and the environment, the prevention of conflicts of interest and corruption, the fight against money laundering and the financing of terrorism, respect for market integrity, data protection, proper conduct with regard to gifts and invitations, and responsible sourcing.
These rules go beyond the minimum statutory and regulatory requirements in force, especially in certain countries whose laws and regulations do not meet the Group’s high ethical standards.
The Code of Conduct is available and applicable to all Group employees, irrespective of their level of responsibility, and to its managers. It also details the procedure for whistle-blowing in situations where this is appropriate and reiterates the principle of protection for whistle-blowers. The Code of Conduct is available on Societe Generale’s website. It should be noted that it has been supplemented by a Tax Code of Conduct (see p. 265, “2018 Duty of Care Plan”/“Alert mechanism”). Specialised codes of conduct (tax, anti-corruption) provide further clarification.
TRANSLATING VALUES INTO BEHAVIOUR The behavioural skills reflected in the Leadership Model are divided into three categories corresponding to the main levels of responsibility within the company – senior executives, managers and employees – and are common to the whole Group.
The four values, which are customer-oriented, translate into the following behavioural skills:
The Leadership Model’s internal skills guide describes observable and measurable types of behaviour for each of these skills. In conjunction with this guide, a self-assessment intranet tool lets respondents answer 20 questions to determine their performance in relation to expectations, and provides tools allowing them to improve in various areas.
After a Group-wide awareness campaign in 2015, the key HR processes have been aligned with the Leadership Model and are being aligned with the updated Code of Conduct.
THE RECRUITMENT PROCESS For each position to be filled within the company, a matrix is used during job interviews to measure to what extent candidates possess the behavioural skills set out in the Leadership Model. Accordingly, recruiters have been a priority target for training in Leadership Model practices.
THE PERFORMANCE MANAGEMENT PROCESS The annual appraisal, personal development plans and 360° questionnaires are aligned with the Leadership Model and assess the manner in which operational results are obtained. Starting in 2018, the annual appraisal will also include a section on Conduct & Compliance in order to assess risk management, service quality and the employee’s regard for the customer’s interests. In 2017 a total of nearly 118,720 Group employees had an appraisal, i.e. 93% of the present permanent workforce.

5 I 2
SOCIETE GENERALE IS A RESPONSIBLE BANK CCORPORATE SOCIAL RESPPONSIBILITY
240 I 2018 REGISTRATION DOCUMENT I S O C I E T E G E N E R AL E G R O U P
IDENTIFYING AND NURTURING STRATEGIC TALENT The Strategic Talent approach, common to all Group entities, is built around the Leadership Model and aims to identify, develop and retain high-potential employees to prepare the next generation of managers. The Strategic Talent pool represents 2.7% of the Group’s workforce; 40% are women and 43% are not French. The aim is to continue to improve the representation of women in this pool by 2020. The Corporate University is responsible for developing the Strategic Talent of the Group’s most senior managers and senior executives. It offers behavioural skills development modules as part of its targeted programmes. In 2017, these programmes were attended by nearly 755 of the Bank’s employees, of which 39% were women and 23% were not French.
IDENTIFYING THE NEXT GENERATION OF MANAGERS The Group’s senior executives must set an example by living up to Societe Generale’s Leadership Model. Accordingly, this model is central to several key initiatives to identify, train and promote the leaders of today and tomorrow.
SUCCESSION PLANS
Societe Generale is building succession plans to pave the way for the next generation of managers in the Group’s various scopes, both in France and abroad. One of the criteria used to identify potential successors for a key Bank position is whether this behaviour is consistent with the Leadership Model.
360° PERCEPTION OF TOP MANAGERS
Since 2015, a 360° questionnaire based on the Leadership Model has been used to evaluate 300 Group senior executives around the world (members of the Executive Committee and the Management Committee, and holders of key Group positions) and nearly 1,000 managing directors in Global Banking and Investor Solutions every two years. This tool provides information on how the behaviour of Societe Generale’s key managers is perceived by their employees, peers and superiors. The combined results of these exercises provide a means to measure changes in managerial practices over time.
REMUNERATION OF GROUP SENIOR MANAGEMENT
The remuneration policy applicable to the Group’s governing bodies and, more broadly, to its regulated employees(1) promotes best practices by tying variable remuneration to quantitative and qualitative factors and, for certain employees, to an evaluation of their respect for compliance and risk management rules as determined by the Risk and Compliance divisions.
GROUP DISCIPLINARY PRINCIPLES Since 2015, the Group’s disciplinary principles have been presented to the members of its various management
committees. In 2016, a shadow reporting exercise was carried out within the Global Banking and Investor Solutions scope to serve as the basis for future deployment throughout all Group entities. For 2018, the Culture and Conduct Programme, through continued work on the management culture, aims to increase awareness and assist managers and the HR function to establish appropriate disciplinary measures.
ENSURING THE HIGHEST STANDARDS OF SERVICE QUALITY, INTEGRITY AND BEHAVIOUR With the launch of the Culture and Conduct programme in 2016, Societe Generale sought to go one step further by building on the accomplishments of the last few years to lay the groundwork for a strong culture and accelerate its transformation.
This strategic programme aims to build confidence among all its stakeholders, especially its customers, and to develop the Societe Generale culture by placing values, leadership quality and behavioural integrity at the heart of its business conduct and thus achieve the highest standards of service quality, integrity and behaviour.
It is based on the recommendations of the “G30”, an international advisory group on economic and monetary affairs, published in a report entitled “Banking Conduct and Culture – A Call for Sustained and Comprehensive Reform”, which addressed five key themes: development of the perception of culture; governance and responsibilities of the governing bodies; performance management and incentives; staff development and training; and effectiveness of the three lines of defence.
This programme is under the direct authority of General Management and is supervised by the Board of Directors. It is a priority for the Group, whose main objectives in 2018 are, for each of its businesses, to:
ensure that all employees adopt the Group’s Code of Conduct which forms the basis of Societe Generale’s business ethics and promotes responsible business conduct. Workshops enabling each employee to assimilate the content of the code and reflect on best practices and on the types of behaviour to be prohibited on a day-to-day basis will be wrapped up in 2018 with an individual process for evaluating all employees’ knowledge and level of assimilation of the Code of Conduct. It is available on the Group’s website;
implement a system for managing the conduct risk specific to Societe Generale, including a definition and a detailed typology of the different categories of conduct risk, as well as the development of a methodology for assessing conduct risk for each business. On those grounds, an initial assessment of the main conduct risks will be undertaken during the year in certain businesses;
(1) Defined in accordance with the CRD4, AIFMD, UCITS V and Solvency II directives, determined on the basis of identification criteria for the level of responsibility, impact on risk and level of total remuneration.

5
SOCIETE GENERALE IS A RESPONSIBLE BANK
2 I 5CCORPORATE SOCIAL RESPPONSIBILITY
S O C I E T E G E N E R AL E G R O U P I 2018 REGISTRATION DOCUMENT I 241
measure progress on culture and conduct, through the establishment of dedicated indicators; increase visibility of the main conduct risks in our business lines; and identify the action plans required to improve management of these risks;
continue to further align the key human resources management processes with the Group’s culture and conduct goals by building on its values and the Leadership Model.
In 2017, the main achievements of the Culture and Conduct programme were as follows:
the establishment of a dedicated team, which reports to General Management and is led by a Programme Director, to provide the Group businesses with a reference framework and support across all the programme components;
the formalisation of the distribution of roles and responsibilities between the Culture and Conduct programme, centrally, and the heads of the Business and Service Units;
the formalisation of a three-year action plan;
the promotion of the challenges and priorities of the Culture and Conduct Programme among employees;
the updating of the Code of Conduct in 2016 and the preparation of Group-wide action for its dissemination and assimilation;
strengthening the process for mandatory training in order to improve the management of training required by law;
raising awareness of the Culture and Conduct challenges among senior executives (top 300).
ALIGNING THE OBJECTIVES OF THE MANAGEMENT COMMITTEE MEMBERS WITH RESPONSIBILITY CHALLENGES In 2018, the members of the Group Management Committee will have shared collective objectives, including financial performance, customer satisfaction and protection in accordance with the Net Promoter Score approach (see p. 256, “Regular dialogue with stakeholders”), employees’ engagement rate and responsibility (non-financial ratings).
ETHICS AND GOVERNANCE In addition to the Code of Conduct, Societe Generale has also implemented governance arrangements supporting its ethics. These arrangements include Responsible Lobbying Charter, a Tax Code of Conduct, and rules setting out ethics and anti-corruption measures.
RESPONSIBLE REPRESENTATION OF INTERESTS The rules and regulations concerning the Bank’s activities are numerous and complex. Societe Generale therefore strives to engage in proactive dialogue with political players, and its Public Affairs Department contributes to public debates on the drafting of any legislation affecting its activities in a transparent and constructive manner.
The Group’s obligations in terms of transparency translate into voluntary commitments on the one hand, and regulatory obligations on the other hand.
Since February 2014 the Bank has voluntarily undertaken various actions aimed at improving the transparency of its interest representation activities, by:
signing the Transparency International France Joint Declaration, supplemented by a guide for declaring lobbying expenses;
adopting the Societe Generale Charter for responsible representation before public authorities and representative institutions;
registration in the Transparency Register of the European institutions, maintained jointly by the European Parliament and the European Commission, supplemented by a Code of Conduct;
registration in the Transparency Register maintained by the Senate, supplemented by a Code of Conduct.
At the same time, Societe Generale must fulfil the obligations of the Sapin II Act of 9th December 2016, which relates to transparency in public life, the fight against corruption and the
modernisation of economic life. One of its objectives is to “inform citizens about the relations between interest representatives and public authorities” (Article 25).
This Act:
establishes a digital transparency register, administered by the High Authority for Transparency in Public Life (HATVP), which entered into force on 1st July 2017;
requires interest representatives to conduct their work “with honesty and integrity” while complying with a number of ethical obligations.
In accordance with these new obligations:
the Group has registered in the register maintained by the High Authority for Transparency in Public Life (HATVP);
the main positions adopted by the Bank in connection with its responsible representation policy are publicly available and can be viewed in particular on its institutional website in the “Responsible Finance” section:
(https://www.societegenerale.com/en/measuring-our-performance/csr/responsible-finance).
TAX CODE OF CONDUCT The Group’s Tax Code of Conduct, which was approved by the Board of Directors in November 2010, is part of a worldwide movement to fight harmful tax practices, under the auspices of the OECD in particular. To this end, an update was carried out and approved by the Board of Directors in March 2017. It is available on Societe Generale’s website: (https://www.societegenerale.com/en/connaitre-notre-entreprise/responsabilite/conformite/culture-and-conduct).
Under this Code, the Bank undertakes in particular to refrain from facilitating or supporting transactions with customers where the effectiveness of the transaction is dependent on information being withheld from the tax authorities.

5 I 2
SOCIETE GENERALE IS A RESPONSIBLE BANK CCORPORATE SOCIAL RESPPONSIBILITY
242 I 2018 REGISTRATION DOCUMENT I S O C I E T E G E N E R AL E G R O U P
As such, the Group is fully committed to implementing fiscal transparency regulations (FATCA, the EU Directive on administrative cooperation in the field of taxation, and more recently the Common Reporting Standard – CRS). It is particularly noteworthy that all establishments holding accounts within our Private Banking business line are based in countries which meet the highest fiscal transparency standards required by the G20 and OECD since July 2016; all such countries have ratified the Convention on Mutual Administrative Assistance in Tax Matters, implemented the Standard for Automatic Exchange of Financial Account Information (CRS) and been rated “largely compliant” or “compliant” by OECD peer review.
The policy of sending international Private Banking customers information on their duty to comply with all tax laws and regulations in every jurisdiction applicable to them has been strengthened.
In addition, since 2003 Societe Generale has laid down strict internal rules designed to prevent the development of any operations in countries that have been designated as non-cooperating tax havens by the OECD.
In 2010, the Bank decided to close down (and has since taken the necessary steps to do so) all the Group’s subsidiaries in countries and territories which France deems to be non-cooperative (NCCTs), the list of which has been updated by the
ministerial decree of 8th April 2016 (published in the French Official Journal (Journal Officiel) of 10th April 2016). Furthermore, Societe Generale prohibits the setting-up of any new subsidiaries in an extended list of countries (based on countries which have only recently been removed from the OECD grey list), unless authorised by General Management on the grounds of local activities.
In 2017 the Group no longer held, either directly or indirectly, any active establishments in these countries.
Lastly, it complies with the provisions of the Societe Generale Code that have been established in countries where profit is taxed at less than 50% of the rate applicable in France.
Ethics and anti-corruption Societe Generale has long promoted strict anti-corruption principles, which are set out in its Code of Conduct and comply with the highest possible standards, in particular the UK Bribery and Corruption Act (2011). An anti-corruption code, compliant with applicable law, has been prepared, validated and incorporated into Societe Generale’s Internal Rules (see p. 228, Chapter 4.9 “Compliance and reputational risk” and p. 239, “The Code of Conduct: a commitment to stakeholders”).
A RESPONSIBLE EMPLOYER Societe Generale Group’s strategy is based on a long-term vision: a trusted partner of its customers, committed to the positive transformation of our societies and economies. In this context, the Group has set the following strategic priorities for Human Resources:
Support the Group’s changing businesses, by developing the skills its employees need to adjust to transformations in the banking landscape. The Group must anticipate the skills that its businesses will require in the medium and long term. It must also enable employees to develop their employability through training, learning and the formulation of clear career paths, while recruiting the best profiles for the growing or emerging businesses. Lastly, it must fully embrace the digital transition, by offering alternative ways of working, an agile organisation and new forms of interaction with its stakeholders.
Develop a responsible banking culture based on common values (team spirit, innovation, responsibility and commitment). Societe Generale’s corporate culture has been shaped by its history, dating back more than 150 years. The Group is committed to the diversity of its teams and ensures a high-quality dialogue with its partners. It puts the focus on the customer and requires excellence in business conduct.
Foster employee commitment, which ensures team performance and cohesion. Recognising each individual’s contribution to the Group’s long-term performance, ensuring safety and well-being at work and involving employees in civic initiatives are all essential to maintaining their ties to the company and improving efficiency.
The Societe Generale Group’s teams at the end of 2017 Societe Generale employed 147,125 people(1) at the end of 2017 for an overall increase in headcount of 0.9%. This corresponds to 137,057 full-time equivalents (FTEs)(2).
Please refer to page 293, “Appendices”, for all quantitative indicators.
GEOGRAPHIC BREAKDOWN 147,125 employees(1) in 67 countries, including:
12.3% of the workforce in low-income or lower-middle-income countries(3);
24.7% in upper-middle-income countries(4).
Please refer to page 293, “Appendices”, for all quantitative indicators.
(1) Total number of employees on permanent contracts or fixed-term contracts, including work-study contracts, whether they are present or absent. (2) As detailed in Chapter 2, page 68. (3) As defined by the World Bank, in particular Côte d’Ivoire, Ghana, India, Madagascar, Morocco and Senegal. (4) As defined by the World Bank, in particular Algeria, Romania, Russia, Serbia and Tunisia.

5
SOCIETE GENERALE IS A RESPONSIBLE BANK
2 I 5 CCORPORATE SOCIAL RESPPONSIBILITY
S O C I E T E G E N E R AL E G R O U P I 2018 REGISTRATION DOCUMENT I 243
BREAKDOWN BY CORE BUSINESSES The most significant changes in headcount in 2017 reflected the Group’s restructurings and adaptations to the environment. They affected each core business differently:
For the Business Units (BUs) and Service Units (SUs) of International Retail Banking and Financial Services, headcount remained steady overall (0.1% versus 2016) due to the combined effect of the decrease resulting from the effective sale of Splitska Banka in Croatia (nearly 1,500 employees) and the increase resulting from the strength of the insurance activities, which were merged in 2017 into Sogecap (14.9% rise in headcount), the development of the ALD Automotive entities and the inclusion of nine ALD Automotive entities in the scope of consolidation in 2017.
for the BUs and SUs of Global Banking and Investor Solutions, the 1.2% increase in headcount was due to investments in the support and control functions in certain regions (primarily in the Americas, where headcount rose by 5.4%) and to the full integration of private bank Kleinwort Benson in the United Kingdom (an 8.3% increase in headcount), offset by marginal adjustments to headcount in several countries.
In the BUs and SUs of French Retail Banking, the 1.0% contraction in headcount was due to the combined effect of the decrease resulting from departing employees who were not replaced in the Societe Generale network as part of the restructuring plan under way, and from transfers to the central support functions and the increase resulting from momentum in cash management, at Boursorama (headcount up 6.9%) and in IT projects.
for the Group’s other SUs, the 11.4% increase in headcount was due to the ramp-up of the IT and compliance teams, to support the Group’s adaptation to technological developments and regulatory requirements.
BREAKDOWN OF STAFF BY CORE BUSINESSES (HEADCOUNT AT END OF PERIOD EXCLUDING TEMPORARY STAFF)
BREAKDOWN OF STAFF BY STATUS
Please refer to page 293, “Appendices”, for all quantitative indicators.
Supporting the transformation of the businesses and skills development
ANTICIPATING AND SUPPORTING CHANGES IN THE BUSINESSES
STRATEGIC WORKFORCE PLANNING, AN APPROACH TO ANTICIPATING AND SUPPORTING THE TRANSFORMATION OF THE BUSINESSES
The Strategic Workforce Planning approach put in place in 2013, and governed by a social agreement signed in 2016, supports changes in the businesses and in skills. Based on the Group’s strategic plan, it helps paint a picture of the actual conditions at various entities, identify future needs, measure gaps relative to the current situation and develop action plans to meet these needs through various drivers, including employee training, internal mobility and recruitment. It can also be used to define key competencies by business and propose connections between the Bank’s businesses.
The Human Resources Department is also testing a platform that uses artificial intelligence, where employees can voluntarily report their current skills and aspirations. The aim is to establish a dynamic competency framework and ultimately to propose development solutions (newsletters, videos, training courses, etc.) and customised career paths.
FOCUS ON THE #MONJOB2020 INITIATIVE
The #MonJob2020 initiative, part of the French Retail Banking transformation programme announced at the end of 2015 (see p. 10, “A strategy of stronger, profitable and sustainable growth, based on a robust universal banking model”), involves three stages:
Joint development in 2016 with workshops conducted throughout France involving managers, network employees, business lines, HR and the trade unions;
Testing in 2017 with about 2,750 employees;
Roll-out scheduled for 2018-2020.
14.1%Global Banking and InvestorSolutions(20,751 people)
49.4%International Retail Banking andFinancial Services(72,624 people)
26.0%French Retail Banking(38,316 people)
10.5%Corporate Divisions(15,434 people)

5 I 2
SOCIETE GENERALE IS A RESPONSIBLE BANK CCORPORATE SOCIAL RESPPONSIBILITY
244 I 2018 REGISTRATION DOCUMENT I S O C I E T E G E N E R AL E G R O U P
A TALENT ATTRACTION POLICY THAT MEETS THE GROUP’S DIVERSE NEEDS
The recruitment and talent attraction policy is adapted to the characteristics of each business and activity and to the specific regional environment, but promotes a uniform recruitment process, consisting of an HR interview to measure candidates’ adherence to Group values. The careers.societegenerale.com site, the primary interface with candidates, compiles the Group’s job listings in 23 countries. In 2017, nearly 400,000 applications were submitted via the Careers site, which had about 4 million hits. The Group is also attentive to changes that are driven by new technologies and the digitalisation of our environment, which affect its recruitment processes (including online testing and recruitment through social networks).
In France, Societe Generale is the most attractive bank for IT profiles according to the 2017 Universum ranking and came second among banks in the 2018 Glassdoor ranking.
EMPLOYMENT DYNAMICS WITHIN THE GROUP
Please refer to page 293, “Appendices”, for all indicators.
BREAKDOWN OF STAFF BY LENGTH OF SERVICE(1)
The average length of service within the Group is 9.7 years.
SPECIFIC FOCUS ON INTEGRATING YOUNG PEOPLE
Societe Generale is committed to a proactive approach to the professional integration of young people and seeks to attract, recruit and retain recent graduates.
Societe Generale’s former interns, VIEs and work-study participants represent a priority recruiting ground for recent graduates. At Societe Generale SA(2) in France, 45% of junior hires come from this pool.
In 2017, Societe Generale was the leading French company in terms of number of VIEs offered to recent graduates with nearly 600 positions per year in 36 countries and was awarded the “Best VIE Recruiter in 2016” label for the third year in a row by Business France. The drivers for attracting and retaining young people include:
partnerships with schools and higher education institutions in nearly two-thirds of the Group’s entities (43 partnerships in Europe in particular);
funding of educational programmes and research through 13 chairs, with a total commitment of EUR 4.25 million;
internal development programmes, such as GeneratioNext (interns, VIEs and work-study participants) and Junior Programme (recent graduates) for Global Banking and Investor Solutions activities, with 2,000 members worldwide;
centralised management of the intern, VIE and work-study participant pool for Societe Generale SA in France, to better fill vacancies through automated matching of candidates and needs;
a variety of internal and external initiatives that aim to promote banking sector jobs, particularly in the IT professions (internal job forums; @SGInsideIT Twitter account; evening computer programming events; evening recruitment sessions targeting female engineering students; job dating and escape games; “SG Ouvre la Boîte” open days; etc.).
Please refer to page 293, “Appendices”, for all indicators.
(1) Data at 31st December 2017, for 97% of the Group. (2) Legal entity Société Générale Personne Morale as opposed to Societe Generale in France corresponds to Société Générale Personne Morale and the Group’s
French subsidiaries (Crédit du Nord Group, Boursorama, CGA, etc.).
2515551525
less than 1
1 to 2
2 to 5
5 to 10
10 to 15
15 to 20
20 to 25
25 to 35
more than 35
ThousandsHommes Femmes
Years oof service

5
SOCIETE GENERALE IS A RESPONSIBLE BANK
2 I 5 CCORPORATE SOCIAL RESPPONSIBILITY
S O C I E T E G E N E R AL E G R O U P I 2018 REGISTRATION DOCUMENT I 245
INTERNAL MOBILITY – A VEHICLE FOR EMPLOYABILITY AND RETENTION
Societe Generale’s mobility policy is based on the following principles: an emphasis on filling positions through internal mobility, transparency on vacant positions through the internal job exchange (Job@SG), agreement on mobility between employees and their managers, and support for geographic mobility. A number of measures have been put in place to encourage internal mobility:
Job@SG, the internal mobility and external recruitment platform, covering 23 countries out of 67, and the “Jobs” intranet, which helps identify connections between professions and simulates possible career paths;
initiatives that use artificial intelligence, including the ACE (“Appétences Compétences Expériences”) experiment which offers employees some ideas about their career development and mobility, based on the skills and aspirations they have reported;
international mobility and short-term international assignments (lasting a few months) for employees on international teams. In 2017, 130 such short-term assignments were undertaken;
long-established internal promotion drivers: the “Cursus Cadre” (to obtain executive or so-called “cadre” status in France(1), certified since 2017 by Toulouse Business School, the Passerell’E course (to achieve France’s banking classification Level E) and the degree-granting continuing education courses (BP Banque (professional certificate in banking), BTS Banque (two-year course leading to a certificate in banking), Licence Banque (degree in banking) and attendance at the Institut Technique de Banque). In 2017, a total of 563 employees of Societe Generale SA in France completed these programmes. Please refer to page 293, “Appendices”, for all indicators.
FOCUS ON THE HR IMPACTS OF THE TRANSFORMATION OF FRENCH RETAIL BANKING
Carried out in accordance with the social dialogue, the French Retail Banking network’s transformation plan also relies on the following efforts: continued streamlining of the branch network, to be reduced from 2,000 to 1,700 branches; reduction in the number of back-office platforms from 20 to 14; and automation of 80% of internal management processes. This plan will result in the elimination of a total of 3,450 positions by 2020, through internal mobility, attrition and voluntary departures.
Societe Generale SA in France has also pledged, as part of the project to reorganise and adjust the workforce in French Retail Banking’s customer service divisions, that there will be no forced economic dismissals until 2020 and that it will implement a plan that encourages inplacement, gives employees the option to apply for an external voluntary departure and establishes an employment transition plan.
The Group’s ambition is to help develop the professions of tomorrow by promoting the development of new skills, expertise and working methods. With this in mind, Societe Generale has committed to invest EUR 150 million by 2020 in a strengthened and personalised training programme.
DEVELOPING THE SKILLS AND EMPLOYABILITY OF EMPLOYEES
A TRAINING POLICY THAT MEETS THE BUSINESSES’ NEEDS AND ENCOURAGES EMPLOYEE DEVELOPMENT
Most of the hours of training provided concerned the development of skills relevant to the Group’s businesses and were aligned with the transformation programmes for the Group’s different divisions and support functions.
These skills primarily seek to meet the challenges of the continued change in the customer relationship, the use of different innovative technologies, the transformation of working methods, and the evolution of the Group’s business model with respect to its ecosystem (new banking players, start-ups, etc.).
Training is based on diversified and digital learning methods allowing employees to develop their employability. Accordingly, Societe Generale is supplementing its on-site training offer with a digital offer by incorporating MOOCs (more than 8,500 participants in 2017), microlearning modules no more than three minutes long, access to digital resource banks, and blended courses which combine different methods.
In addition, training helps to develop employees’ behavioural skills, in particular their Risk & Compliance culture, their customer focus and the development of their digital skills, as digital technologies are gradually integrated into all of the Group’s activities. The reinforcement of expertise, project-based management and new managerial approaches will also support the Group’s transformation.
Beyond individual training, “academies” specific to each business or function (e.g. large corporate advisory, retail banking salespeople, private banking, human resources and audit, etc.), along with targeted learning communities, provide employees with additional support and help align the practices of the Group’s different entities.
Please refer to page 293, “Appendices” for all indicators.
NEW WAYS OF WORKING AND MORE AGILE ORGANISATIONS
TELECOMMUTING AND REDEFINING THE WORKSPACE
Telecommuting serves a dual purpose: (i) to adapt to the need for flexible work forms and (ii) to help employees achieve a better work-life balance.
A growing number of Group entities are experimenting with telecommuting through mechanisms that are appropriate to the local environment and nearly 15,000 people were telecommuting worldwide at the end of 2017 (up 50% from 2016). The countries with the most teleworkers were France (nearly 7,200), the Czech Republic (more than 1,830), India (about 1,500), the United Kingdom (more than 1,000), Romania (more than 900) and Russia (nearly 700). At Societe Generale SA in France, 40% of employees on permanent contracts in departments eligible for the programme (central departments) were active teleworkers at the end of 2017. Satisfaction with the programme stands at 98% among teleworkers and 94% of managers believe performance has improved or held steady since they implemented telecommuting in their department.
(1) Employees working as senior executives (“cadres”) within the meaning of the collective agreement of the banking industry in France, on account of their education, their functions or their responsibilities.

5 I 2
SOCIETE GENERALE IS A RESPONSIBLE BANK CCORPORATE SOCIAL RESPPONSIBILITY
246 I 2018 REGISTRATION DOCUMENT I S O C I E T E G E N E R AL E G R O U P
The Group has also created workspaces that encourage interaction and innovation, in modular workspaces, using digital tools. That is the case, for example, in Luxembourg, Hong Kong, London, New York and France, at the Boursorama headquarters and at the eastern Paris real-estate complex “Les Dunes”. The FlexWork approach is used at Les Dunes by 5,200 people and at Societe Generale Global Solutions Center in India. The “Les Dunes” complex was also awarded the SIMI 2017 prize in France (commercial real-estate fair).
EXPERIMENTING WITH NEW WORKING METHODS AND INTRAPRENEURSHIP
The open innovation initiative undertaken by the Group since 2015 opens the teams up to external innovation ecosystems (start-ups, FinTechs and experts) to increase the creativity, agility and speed of their project development process. In addition to using alternative working methods (“pizza teams”, Test & Learn method and user experience), 1,300 employees have participated in immersive experiences outside the company in France, India, Senegal and the United Kingdom in 2016 and over 110 experimental projects have been conducted in 2017. The Group has also organised a series of events (hackathons in Africa and India; meetups; Learning Experiences in China, India, Israel and Germany; conferences and workshops; big data, blockchain and automation communities; etc.). For the last two years, the Plateau, located in the “Les Dunes” complex, has also hosted five internal start-ups, nearly 30 external start-ups and more than 10 projects in incubation or acceleration.
At the end of 2017, the Group launched an internal start-up call, with the aim of developing intrapreneurial projects. The teams thus proposed 335 start-up projects, of which some will be presented to the Group’s Management Committee. In October 2017, Societe Generale also provided EUR 2 million in funding for a FinTech/InsurTech incubator called “Swave”, based in La Défense, the Paris business district.
As a result of this commitment to the digital transition and the new working methods, the Societe Generale Group was ranked second as a company and first as a bank in France for its digital maturity at the 2017 eCAC40 awards presented by the editorial team of Echos Executives and Gilles Babinet, digital champion of France at the European Commission.
FOCUS ON ADAPTING THE HR INFORMATION SYSTEMS TO IMPROVE THE USER EXPERIENCE AND ENCOURAGE AGILE HR MANAGEMENT
Supporting changes in the businesses means adapting the HR function and its management tools. In 2016, the Human Resources Department therefore launched HR FOR YOU, a multi-annual programme to transform the architecture of the Group’s HR information systems in order to simplify them, improve the experience of managers and HR teams, develop analytics and facilitate the aggregation of HR data.
Acting responsibly in our relationships with stakeholders
HAVING A POSITIVE SOCIAL IMPACT
PROMOTING A QUALITY SOCIAL DIALOGUE
CONSTRUCTIVE AND STRUCTURED INTERNATIONAL SOCIAL DIALOGUE
In addition to its legal frameworks, Societe Generale has set up dialogue and consultation bodies since 2013 to address the corporate strategy. In 2017, union leaders were given visibility over the strategic and economic directions of the company and the business lines through:
two meetings with the Chief Executive Officer or his representatives at the European Group Works Council meeting;
three specific meetings with the Chief Executive Officer who presented the Group’s new governance and strategic directions;
four meetings of the dialogue and consultation body, attended by Executive Committee members, to discuss strategy and the basis for any projects under consideration;
five meetings with the Chief Executive Officer or his representatives at the meetings of the Central Works Council;
In connection with the job trends observatory: presentation of the strategic workforce planning work for the retail banking, IT, risk, operations, finance, HR and other functions and of connections between the data businesses, the agile method and experiments with self-reporting of skills (see p. 243, “Strategic workforce planning, an approach to anticipating and supporting the transformation of the Businesses”).
Group-wide, Societe Generale is implementing an agreement on fundamental human rights and freedom of association, signed with the UNI Global federation in 2015 (see p. 266, “Regular evaluation procedures and risk prevention and mitigation actions”). The annual follow-up meeting on the agreement between UNI Global Union and the Group’s Human Resources Department was an opportunity to share information about social dialogue in subsidiaries and about the Group’s strategy, and to observe that social dialogue is a reality in France and abroad.
OVERVIEW AND IMPACT OF COLLECTIVE BARGAINING
In 2017, 215 agreements were signed within the Group (including 16 for Societe Generale SA in France and 96 for the subsidiaries of Crédit du Nord). Signed by nearly 75% of the entities, the agreements cover remuneration and employee benefits, while other themes include working conditions, social dialogue practices and diversity. 21 agreements focused specifically on health and safety.

5
SOCIETE GENERALE IS A RESPONSIBLE BANK
2 I 5 CCORPORATE SOCIAL RESPPONSIBILITY
S O C I E T E G E N E R AL E G R O U P I 2018 REGISTRATION DOCUMENT I 247
The expected impact of the 16 agreements signed in 2017 for Societe Generale SA in France is detailed below:
AGREEMENTS SIGNED IMPACTS ON ECONOMIC PERFORMANCE AND WORKING CONDITIONS
EEmployment and job support
Amendment to the agreement on changing professions, skills and employment.
The framework agreement on employment, signed in 2016, provides a three-year structure for the social dialogue policy on strategy, strategic workforce planning, mobility, intergenerationality and framework measures for employment protection plans.
The amendment signed in 2017 extends for one year the objective of recruiting young people under the age of 26 on permanent contracts, the conditions for continuing the career plan and the programme that allows seniors to work part-time for 70% of their pay.
SSociaal issues, remuneration, working conditions and employee benefits
Employee savings plans:
profit-sharing agreement for the 2017-2019 period, modified by a technical amendment;
agreement on supplemental profit-sharing (financial year 2017);
employer contribution agreement for the 2017-2019 period;
collective agreement on the company savings plan (2018-2020).
Implementation of the 2017 Group Employee Share Ownership Plan:
collective amendment to the company savings plan (2015-2017);
amendment to the rules of the Group savings plan (French subsidiaries);
amendment to the rules of the international Group savings plan.
Complementary pension plans:
collective agreement on the defined-contribution complementary pension plan.
Employee benefits and changes in working conditions:
agreement on adapting a subsidiary’s contracts to allow for its integration into Societe Generale. These agreements allow the company’s financial performance to be shared (retirement savings, employee savings and annual wage negotiations) and also reward employee involvement.
Societe Generale is changing its complementary pension plan as from 1st January 2018 to offer eligible employees (those who have worked at the company for at least six months) new benefits (choice of management method, i.e. manager- or employee-based; allocation and shifting of assets among different types of financial vehicles based on the employee’s investor profile; additional payments under a favourable tax system).
OOrganisation of the Staff Representative Bodies
agreement on the means for and expression of the right to organise and social rights;
agreement on the extension of the terms of the staff representative bodies at Societe Generale SA in France;
two agreements on the establishment and operation of the Central Economic and Social Committee;
agreement on changes to the structure of the retail banking institutions.
In a changing regulatory landscape, agreements on the bodies’ operation in terms of organisation and social dialogue ensure that the latter is efficient and of high quality and contribute to the company’s economic performance.

5 I 2
SOCIETE GENERALE IS A RESPONSIBLE BANK CCORPORATE SOCIAL RESPPONSIBILITY
248 I 2018 REGISTRATION DOCUMENT I S O C I E T E G E N E R AL E G R O U P
WORKING TO ADVANCE HUMAN RIGHTS AT THE GROUP’S SITES
With its 2015 commitment to human rights and freedom of association, Societe Generale became the first French bank to sign such an agreement (see p. 246, “Constructive and structured international social dialogue”). It has strengthened the commitments made in the Group’s Code of Conduct to respect human rights and recognise fundamental rights in the workplace (making sure employment and working conditions are fair, adopting a zero-discrimination policy for work relationships and complying with all health and safety regulations).
Societe Generale is also subject to the French law of 27th March 2017 on the duty of care of parent and subcontracting companies (the Duty of Care Act). This law requires implementation of an extraterritorial care plan with the objective of identifying risks and preventing serious violations of human rights, fundamental freedoms, health, safety and the environment resulting from the company’s activities. Respect for human rights in human resources management and safety thus relies on several levers detailed in the Group’s Duty of Care Plan (see p. 265).
ENCOURAGING RESPONSIBLE MOBILITY
In keeping with its climate strategy, Societe Generale is developing a set of measures to reduce the environmental impact of business travel and commuting (see p. 278, “Measures taken to improve environmental efficiency”). These initiatives fall within the scope of the 2015 French law on the energy transition, which requires companies with more than 100 employees in dense urban areas to develop mobility plans to reduce the use of personal vehicles. For 2018, entities belonging to Societe Generale Group in France are thus preparing local mobility plans that are compatible with their employees’ practices.
PROMOTING TEAM DIVERSITY
COMBATING DISCRIMINATION
The Group’s diversity policy aims to fight bias and create a culture of inclusion. Guarding against discrimination during recruitment, in particular, is one of the points that has been subject to continuous monitoring within the Group since 2013. In France, a study conducted by the Ministry for Labour in 2016 on discrimination against candidates of North African descent during the recruitment process did not identify any significant risks for Societe Generale.
Since 2016, the Group has been committed to non-discrimination through its adherence to two international charters:
the Women’s Empowerment Principles, under the aegis of the UN Global Compact, covering gender equality (see p. 256, “Societe Generale’s historical commitments”);
the Global Business and Disability Charter, under the aegis of the International Labour Organization, promoting the inclusion of persons with disabilities in the world of work (see p. 256, “Societe Generale’s historical commitments”).
PROMOTING DIVERSITY
In addition to the ethical responsibility, diversity addresses a performance challenge. The Group has made it a priority to promote women and international profiles to positions of responsibility and seats within the Bank’s management bodies. To do so, it relies on its Diversity Board, composed of Management Committee members. Some HR processes are key drivers of progress in gender balance and internationalisation, in particular succession plans (see p. 239, “Translating values into behaviour”) that include women and international profiles and the creation of Strategic Talent pools (see page 240, “Identifying and nurturing Strategic Talent”). In 2017, 40% of them were women and 43% international, i.e. non-French (unchanged and up 2.5%, respectively, from 2016).
In addition to these priorities, Societe Generale is committed to other components of diversity: intergenerationality, social inclusion and disability. A variety of initiatives are undertaken locally, depending on the challenges and regulations in the different countries.
The Group thus has 138 different nationalities and 57% of employees are not French. Within the Management Committee, 12 nationalities are represented and 25% of members (versus 23% in 2016) are not French.
GENDER BALANCE
In 2016, Frédéric Oudéa signed the UN Global Compact’s Women’s Empowerment Principles, applicable Group-wide, which commit their signatories to making progress on promoting gender balance in the workplace, in the economic ecosystem and within the community. Numerous initiatives have been undertaken on this topic across the Group (https://www.societegenerale.com/ en/measuring-our-performance/csr/responsible-employer). In 2017, Societe Generale was ranked 14th internationally on gender balance by the Equileap NGO(1) (1st French bank of the ranking). The rating assigned is based on 19 criteria (percentage of women in management positions, equal pay, sub-contracting practices, parental leave, etc.).
The Group thus relies on a variety of drivers to achieve gender equality in the workplace, including development initiatives (Women in Leadership (WILL) development course designed for female Strategic Talent, intercompany initiatives such as the JUMP forum and EVE programmes); awareness initiatives; training and mentoring programmes; women’s and mixed internal networks, which have more than 2,400 members worldwide; collective agreements such as the 2015 agreement on equality in the workplace at Societe Generale SA in France; specific measures on maternity leave, including the Maternity programme at Banka in the Czech Republic; and also corporate projects such as the “Opportunités Egales pour Hommes et Femmes” (Equal Opportunities for Men and Women) initiative in Luxembourg, approved and supported by the Luxembourg Ministry for Equal Opportunities.
The agreements on equality in the workplace at Societe Generale SA in France have therefore made it possible to earmark EUR 14.4 million since 2008 to correct nearly 8,300 instances of pay gaps between men and women doing equivalent jobs or at equivalent managerial or seniority levels within the company. Another EUR 1.7 million will be allocated for the same purpose in 2018.
(1) Equileap, backed by Maastricht University, studied the publicly available data of nearly 3,050 listed companies in 23 countries, each with a market capitalisation of at least USD 2 billion.

5
SOCIETE GENERALE IS A RESPONSIBLE BANK
2 I 5CCORPORATE SOCIAL RESPPONSIBILITY
S O C I E T E G E N E R AL E G R O U P I 2018 REGISTRATION DOCUMENT I 249
Overall, attention is paid to supporting parenthood within the Group’s entities. Basic maternity leave is therefore on average 18 weeks(1) and may be supplemented by other programmes (parental leave, paternity/second parent leave). For example, in Romania, the United States, France, Spain and Brazil, Societe Generale entities offer employees two or more weeks of paternity/second parent leave.
Please refer to page 293, “Appendices”, for all indicators.
GENERATION BALANCE
BREAKDOWN OF STAFF BY AGE BRACKET(2)
Within the Group:
23% of employees are under the age of 30;
26% of employees are over the age of 45;
the average age is 37.8.
INTERGENERATIONAL COOPERATION
The Group’s efforts on intergenerational cooperation are made through the inter-company OCTAVE programme, reverse mentoring and the WhyLab intergenerational think tank, which is made up of members of Generation Y from various businesses. WhyLab offers workshops on how to adapt the Group’s projects to young populations.
In France, as part of the effort to adapt the “generation contract”, Group subsidiaries have established specific agreements and/or dedicated action plans for young people and seniors. For example:
Societe Generale SA set a target of recruiting 900 young people under the age of 26 on permanent contracts during the 2016-2017 period; it has far exceeded this target, recruiting 1,822 young people since 2016 (see p. 244, “Specific focus on integrating young people”). It also supports seniors in areas such as training, health and prevention, adjustments to working hours and end-of-career skills transmission (for example, solidarity half-time compensated at 70%, see p. 253, “Half-time for seniors”);
In its agreement on the “generation contract”, Franfinance requires that the percentage of employees aged 55 and over be maintained at more than 8% of the total workforce;
Crédit du Nord aims to recruit on average 7% of employees over the age of 45 during the period covered by its three-year agreement signed in 2017 and to offer career development to 17% of its seniors.
INTEGRATION OF PERSONS WITH DISABILITIES
In 2016, Frédéric Oudéa signed the International Labour Organization’s (ILO) Business and Disability Charter which gave Societe Generale access to a network that facilitates exchanges and best practices on the inclusion of persons with disabilities in the workplace. At the end of 2017, Societe Generale employed 2,476 disabled staff (as defined locally) around the world (mainly in France, the Czech Republic, Russia and Italy), accounting for 1.7% of the overall headcount, including 1,743 persons in France.
In Serbia, Romania, the Czech Republic, Germany, Spain, Algeria, India, Japan and elsewhere, recruitment, awareness-raising, induction and support programmes have been implemented to promote the employment of the disabled. In 2017, Societe Generale SA in France took 620 measures to keep employees in their jobs (adjustments to nearly 4,000 workstations since 2007) and hired 40 employees with disabilities. It has conducted awareness-raising campaigns (Salon Handicap, Emploi & Achats Responsables – an employment and responsible sourcing fair for the disabled – in Paris, European Disability Employment Week, the “Managing employees with disabilities” MOOC, etc.) and continued its programmes targeting integration (HandiFormaBanques work-study programme, Agences & Inclusion programme, scholarships and Biomecam Innovation & Handicap university chair with Paris Tech) and the development of the protected and adapted sector (e.g. strategic workforce planning offering) for the protected sector (see also p. 270, “2018 Positive Sourcing Programme, an instrument of change”).
Societe Generale also ensures that its services are accessible to disabled customers by adapting the Societe Generale and Crédit du Nord automated teller machines (ATMs), providing digital access to the Societe Generale mobile application, offering bank statements in Braille (benefiting 800 people in 2017) and renovating 70% of the Societe Generale branches and 75% of the Crédit du Nord branches (the goal is to achieve full coverage by 2021, excluding historical heritage buildings).
SOCIAL INCLUSION
Over and above the initiatives implemented by the Societe Generale Foundation (see p. 253, “The Societe Generale Corporate Foundation for Solidarity”), Societe Generale SA was one of the first companies to sign the “Entreprises et Quartiers” (Businesses and Neighbourhoods) Charter with France’s Ministry for Urban Affairs in 2013. This commitment is reflected in the establishment of inclusion programmes (225 apprenticeship contracts since 2008 in retail banking, with nearly 80% converted to permanent contracts under the internal programmes forming part of the “Nouvelle Chance” — Second Chance — programme), introduced in 2015 in retail banking and ALD Automotive). It also takes the form of nearly EUR 100,000 in funding per year for inclusive programmes (Institut Villebon Georges-Charpak, etc.) and nearly EUR 200,000 for subsidised contracts within 16 local associations. In 2016, Societe Generale co-founded the Public Interest Group of the Grande École du Numérique (umbrella organisation for training in the digital transition), a certification label for training courses that allows the general public (young people having difficulty finding a job, employees with career development plans, etc.) to develop their digital and IT skills.
(1) Data at 31st December 2017, for 97% of the Group. (2) Data taking into account a wide range of models for financing maternity leave in the countries in which the Group has operations (financed by the public
system and/or by the company).
201001020
less than 18
18 to 25
25 to 30
30 to 35
35 to 40
40 to 45
45 to 50
50 to 55
55 to 70
more than 70
ThousandsMen Women
Age (years)

5 I 2
SOCIETE GENERALE IS A RESPONSIBLE BANK CCORPORATE SOCIAL RESPPONSIBILITY
250 I 2018 REGISTRATION DOCUMENT I S O C I E T E G E N E R AL E G R O U P
Fostering employee commitment
RECOGNISING EACH PERSON’S CONTRIBUTION TO THE COMPANY’S PERFORMANCE
AN ATTRACTIVE AND REWARDING REMUNERATION POLICY
The Societe Generale Group’s monetary remuneration policy is based on principles applied in all the countries and is adjusted to the economic, social and competitive environment of the local markets as well as to the legal obligations.
Monetary remuneration includes a fixed salary, which rewards the ability to satisfactorily hold a position using the requisite skills and is determined in a manner consistent with market practices. It also includes variable remuneration which aims to recognise collective and individual performance (see p. 239, “Translating values into behaviour”).
Since 2014 the individual commission system for the French Retail Banking and Private Banking sales forces in France has been eliminated and replaced with gross global annual remuneration and the variable component.
For the 2017 financial year, personnel expenses for the Group totalled EUR 9.7 billion (see page 391, “Personnel expenses and related-party transactions”). For Societe Generale SA in France, average gross annual remuneration(1) amounted to EUR 54,653, an increase of 1.1% compared with 2016.
TRANSPARENCY AND COMMUNICATION
The principles governing the Group’s remuneration policy, in particular for the categories of staff whose professional activities are liable to have a significant impact on the Group’s risk profile, as per the European Capital Requirements Directive no. 2013/36/EU (CRD 4), are detailed in the Remuneration Policies and Practices Report. It will be published, as it is every year, prior to the General Meeting and provided to the French Prudential Supervisory and Resolution Authority (Autorité de Contrôle Prudentiel et de Résolution – ACPR) in accordance with the provisions of EU Regulation No. 575/2013(2). Detailed quantitative information on those persons likely to have a significant impact on the Bank’s risk profile is also sent to the ACPR.
At the individual level, every year staff on permanent contracts and work-study participants at Societe Generale SA in France receive a Total Reward Statement which provides an overview of the components of their overall remuneration. Crédit du Nord and some Societe Generale subsidiaries abroad provide their teams with a similar document.
EMPLOYEE SAVINGS PLANS AND EMPLOYEE SHARE OWNERSHIP
At the end of 2017, current and former employees of Societe Generale, representing approximately 80,000 people, held a total of 5.93% of the share capital and 10.85% of the voting rights under the Company and Group Savings Plans.
MANDATORY EMPLOYER CONTRIBUTIONS, VOLUNTARY PROFIT-SHARING AND COMPANY SAVINGS PLANS
In France, employees are involved in the long-term development of the Group via profit-sharing and/or employer contribution schemes. These schemes enable employees to finance projects or earn additional income. They are linked to the company’s overall performance (financial and extra-financial) and regulated by Societe Generale agreements signed with the trade unions every three years. For Societe Generale SA in France, the total amount of mandatory employer contributions and voluntary profit-sharing paid in 2017 for the financial year 2016 was EUR 116 million (of which EUR 3 million for the share relating to CSR objectives), a 21.6% increase from the previous year and an 88% rise since 2014, when the three-year agreement was signed. This amount can be attributed to the quality of the financial results and the Group’s strong corporate social responsibility performance.
The savings plans (company savings plan (PEE) and collective retirement savings plan (PERCO)) offer medium/long-term savings and preferential financial conditions(3) and tax rates. The securities offered in these plans consist of a broad range of company mutual funds (FCPEs), of which seven in the PEE, including the employee share ownership fund (Fonds E). Financial remuneration (consisting of the employer contribution and profit sharing(4)) may be invested in the company savings plan (see also “SRI-certified savings for Societe Generale employees” below).
INFORMATION ABOUT THE SOCIETE GENERALE COMPANY MUTUAL FUND: “SOCIÉTÉ GÉNÉRALE ACTIONNARIAT (FONDS E)”
Under the terms of the rules governing the Societe Generale mutual fund, the voting rights attached to the Societe Generale shares included in the Fund’s assets belong individually to the holders of fund units in proportion to the respective shares they hold. The Fund’s Supervisory Board, which is composed of an equal number of unit-holding employee representatives and representatives of management, exercises voting rights for fractional shares and voting rights not exercised by unit holders.
In the event of a public purchase or exchange offer, the Supervisory Board decides whether or not to tender shares to the offer, based on the relative majority of the votes cast. If there is no relative majority, the decision is put to the vote of the unit-holders, who decide according to the relative majority of the votes cast.
SRI-CERTIFIED SAVINGS FOR SOCIETE GENERALE EMPLOYEES
Societe Generale’s employee savings plan offers employees the opportunity to invest in various company mutual funds(5) (FCPE) certified SRI (Socially Responsible Investment) by the CIES (Inter-union Committee on Employee Savings).
As at 31st December 2017, all SRI funds in the Group’s savings plans in France (the various Company Savings Plans, Group Savings Plans and Collective Retirement Savings Plans) represented EUR 542 million in assets under management, up by over 20% compared with 2016.
(1) Average overall remuneration includes fixed and variable components as well as bonuses, excluding financial remuneration (employer contribution and profit-sharing) and employer matching contributions. The average is calculated for all employees excluding those that are regulated (whose professional activities are liable to have a significant impact on the Group’s risk profile), who are also subject to monitoring and disclosure (see p. 250 “Transparency and Communication”).
(2) The 2016 Remuneration Policies and Practices Report was sent to the ACPR in April 2017 and was published on the Societe Generale website. (3) Employer matching contribution on savings paid in and discount on the Societe Generale share in the event of a capital increase reserved for
employees and retirees. (4) In addition to Societe Generale SA in France, for which the amounts of financial remuneration paid in 2017 are detailed in Note 5.1 (p. 391), most
French subsidiaries belonging to the Company Savings Plans are subject to an employer contribution and/or profit-sharing agreement. (5) For Societe Generale: SG Obligations ISR, SG Diversifié ISR, Arcancia Monétaire, Amundi Label Actions Solidaires; for Crédit du Nord: Amundi Label
Équilibre Solidaire, Amundi Label Obligataire et Solidaire, Arcancia Ethique & Solidaire, Étoile Sélection Développement Durable.

5
SOCIETE GENERALE IS A RESPONSIBLE BANK
2 I 5CCORPORATE SOCIAL RESPPONSIBILITY
S O C I E T E G E N E R AL E G R O U P I 2018 REGISTRATION DOCUMENT I 251
EMPLOYEE SHARE PLANS
GENERAL POLICY
The Group suspended grants of stock purchase or subscription options in 2011. Free shares have been issued in France since 2006 and abroad since 2009, as authorised at the General Meeting. The Board of Directors, based on the recommendations of the Compensation Committee, has defined the following policy: granting of performance shares in order to reward, motivate and secure the long-term loyalty of three specific categories of employees. These employees are:
employees who have made a significant contribution to the Group’s results, with respect to their responsibilities;
high-potential employees whose expertise is highly sought-after on the job market;
employees whose work has proved extremely valuable to the company.
In addition, in the context of the specific loyalty and remuneration policy applicable to categories of staff whose professional activities affect the Group’s risk profile, defined in accordance with CRD4 applicable since 1st January 2014 (referred to as regulated persons), part of the variable remuneration of chief executive officers and certain employees from the businesses concerned is deferred, in the form of performance shares.
Grants are wholly contingent on presence within the Group at the vesting date and on collective performance, regardless of the category or level of the beneficiary. In accordance with the recommendations of the AFEP-MEDEF Code, Group performance conditions applied to Group chief executive officers are demanding and established in advance.
The grant of these financial instruments is accounted for under personnel expenses in the company’s financial statements in accordance with IFRS 2.
2017 PLAN
Based on a proposal from the Compensation Committee, the Board of Directors, at its meeting of 15th March 2017, granted performance shares to certain members of staff in accordance with the 19th and 20th resolutions of the General Meeting held on 18th May 2016.
Pursuant to the 19th resolution, the performance shares granted under the specific loyalty and remuneration policy for regulated persons as defined by banking regulations (including chief executive officers and Executive Committee members) represent 0.11% of the share capital, corresponding to a total of approximately 913,000 shares. Their vesting periods range from two to six years, followed by a holding period of at least six months. These shares are wholly subject to performance conditions specific to each core business and business.
Pursuant to the 20th resolution, the beneficiaries of the long-term incentive plan numbered 6,049 receiving approximately 902,000 shares in total, i.e. 0.11% of the share capital. The chief executive officers and members of the Group Management Committee were not beneficiaries of the plan. Plan beneficiaries comprised 2,397 women and 3,652 men belonging to other employee categories (including non-executives) spread over nearly 67 different countries; 39% work outside France.
All shares are granted subject to a condition of presence throughout the vesting period as well as a performance condition based on the Societe Generale Group’s net income. The shares will definitively vest for each beneficiary after three years.
CARING ABOUT EMPLOYEES’ WELL-BEING AT WORK
PROMOTION OF WELL-BEING AT WORK
LIFE AT WORK PROGRAMME
Societe Generale considers employees’ health and, more broadly, their well-being to be a long-term driver of performance. In 2015, the Group launched the “Life at Work” programme (supplemented by an agreement on working conditions for Societe Generale SA in France), which focuses on six themes: individual and collective efficiency (promotion of efficient working methods); health and prevention (relating to the risks inherent in the Group’s businesses); telecommuting and new organisational models; working environment (see p. 245, “New ways of working and more agile organisations”); support during key life events (services that facilitate the work-life balance); and change in managerial culture (training and awareness initiatives in connection with the Leadership Model and the Culture & Conduct programme).
The IT teams’ move to eastern Paris in 2016 (see p. 245, “New ways of working and more agile organisations”) has also been monitored by the Well-being at Work Observatory (joint discussion forum, composed of representatives from management and from the trade unions), based on an annual survey of working conditions (see p. 252, “Focus on the prevention of psychosocial risks”).
As part of the programme, the 2,600 members of the Life at Work internal community also rolled out a series of communication and awareness-raising initiatives in 2017: well-being at work week, thematic conferences and workshops, open houses, challenges, etc. The 2017 Life at Work labels were awarded to well-being at work-related ideas and projects suggested by Group employees worldwide.
INDIVIDUAL AND COLLECTIVE EFFICIENCY
At the end of 2014, Societe Generale’s Executive Committee signed the “15 Commitments for Work-Life Balance” Charter, introduced by the French Ministry of Social Affairs, Health and Women’s Rights and the French Work-Life Balance and Corporate Parenthood Observatory. The initiatives implemented to encourage a better work-life balance include a flexible working hours policy at a quarter of the Group’s entities, a call for managers to pay extra attention to workloads, heightened awareness among employees of meeting schedules and the use of email outside working hours, and employee participation in forums for dialogue about job content and working conditions. Since 2017, the annual appraisals have included a formal conversation between employees and their managers about their workload.
HEALTH, SAFETY, SECURITY AND PREVENTION
SOCIAL PROTECTION
Societe Generale fulfils its social responsibility by actively contributing to the social protection of all its employees, particularly in terms of healthcare, pension, death, invalidity and incapacity benefits. As compulsory benefit plans vary by country, each Group entity is responsible for defining the degree of local additional cover needed and it ensures that it provides a minimum cover comparable to local environmental market practices.
In International Retail Banking, all African subsidiaries offer health cover to employees and their beneficiaries, in most cases personal protection insurance for beneficiaries should the employee die and, in certain cases, complementary pension plans. All employees of the subsidiaries in the Mediterranean Basin and Sub-Saharan Africa had easier access to care and

5 I 2
SOCIETE GENERALE IS A RESPONSIBLE BANK CCORPORATE SOCIAL RESPPONSIBILITY
252 I 2018 REGISTRATION DOCUMENT I S O C I E T E G E N E R AL E G R O U P
benefited from the company’s contribution to their healthcare expenses.
In France, the Societe Generale Group health plan covered nearly 120,500 people (participating members and beneficiaries).
HEALTH AND SAFETY IN THE WORKPLACE
The Group continually monitors the possibility of any risks liable to affect health and personal safety and any social risks throughout the world. Nearly 85% of the Group’s subsidiaries and branches have medical professionals on-site or have agreements with healthcare organisations, and nearly 90% of the entities conduct prevention and health information campaigns in the workplace. The health and safety policy also relies on programmes to prevent psychosocial risks (see p. 252, “Focus on the prevention of psychosocial risks”); harassment, supplemented by listening, mediation, investigative and disciplinary procedures; and aggression, through mandatory training throughout the network for nearly 10 years and a psychological support programme for employees who have been victims of armed assault or aggression. In 2017, Societe Generale SA in France added two articles to its internal rules, one on sexist conduct for all employees and one on religious neutrality for employees whose positions involve contact with customers.
The company’s whistleblowing mechanism (see page 265, “2018 Duty of Care Plan”) is part of this programme and the entire HR function was made aware of it in 2017.
In 2017, moreover, the Group also established a Global Safety Division, which takes a comprehensive view of the control systems and risks for all aspects of safety covered by the specialised divisions, as well as a personal data protection division, covering all the Group’s stakeholders (see p. 263, “Data protection”).
FOCUS ON THE PREVENTION OF PSYCHOSOCIAL RISKS
Stress prevention initiatives are conducted in 92 Group subsidiaries and branches in France and abroad, covering nearly 80% of the Group’s workforce in total. They seek to inform, train and support employees likely to encounter situations that pose psychosocial risks, through free assistance programmes in partnership with healthcare or insurance sector specialists; training on psychosocial risks and/or awareness-raising; stress surveys and evaluations; and leisure and relaxation activities.
In France, more than 15,000 employees (HR, managers and senior managers) have been trained on psychosocial risks in the last 10 years. Since 2016, a working conditions survey has been carried out among more than 37,000 employees on permanent contracts to identify the sources of satisfaction at work and the psychosocial risk factors in each department.
ORGANISATION OF WORKING HOURS
The organisation of working hours depends on the regulations applicable in each country where the Group operates and on the employee’s function. As a result, working time, hours and team organisation vary significantly.
Please refer to page 293, “Appendices”, for all indicators.
For Societe Generale SA in France:
full time for hourly-paid staff (technical employees and executives): 1,607 hours/year(1);
full time for salaried executives: 209 days (or 206 days depending on the length of service and age of employees in 2000, when the agreement took effect)(2);
part time: employees may qualify for schemes that reduce the number of working hours to 90%, 80%, 70%, 60% or 50%.
HEALTH AND SAFETY INDICATORS
Please refer to page 293, “Appendices”, for all indicators.
INVOLVING EMPLOYEES IN CIVIC INITIATIVES In addition to the financial support Societe Generale provides to its partner associations in France and around the world, the Group also gives its employees the opportunity to provide human support to these associations.
The Group can therefore be counted on to provide a pool of volunteers that allows the associations to grow to an even greater extent in all the countries in which the Bank is present. This additional support is in line with Societe Generale’s civic engagement policy, which aims to promote involvement among employees and thus meet their growing demand to engage in community actions.
These employee involvement programmes are social utility drivers that extend the company’s actions in community life. They are also powerful drivers for mobilisation centred around the Bank’s core values and social responsibility, strengthening its image as an employer and consolidating internal cohesion by fostering relations between employees and bringing added value to the teams.
In 2017, more than 16,300 employees throughout the Group were involved in a volunteer or skills sponsorship action proposed by the company during their working hours. As a result, these employees devoted nearly 8,250 man-days to such actions.
VOLUNTEERING
A number of initiatives give employees an opportunity to volunteer and help partner charities. Of these, the “solidarity days” are an intense half-day of action or a full day spent as a team at one of the Foundation’s partner associations with the aim of addressing a one-time, event-based, logistical need (gardening activities with young people facing socio-educational difficulties, painting and renovation work at emergency housing centres, etc.).
(1) In accordance with the agreement on the organisation of working hours of 12th October 2000 and its amendments. (2) In accordance with the agreement of 2nd June 2004 and its amendment.

5
SOCIETE GENERALE IS A RESPONSIBLE BANK
2 I 5CCORPORATE SOCIAL RESPPONSIBILITY
S O C I E T E G E N E R AL E G R O U P I 2018 REGISTRATION DOCUMENT I 253
Citizen Commitment Time, organised every year to foster and promote the benefits of employee commitment worldwide, is one of the highlights of the current civic initiatives. In 2017, nearly 8,000 employees from more than 30 countries in which Societe Generale is present took part in 110 sports and solidarity-related fundraising events. Thanks to their efforts, nearly EUR 440,000 was donated to community projects related to social inclusion through sporting and cultural activities.
SKILLS SPONSORSHIP
Skills sponsorship is one way of making employees available on an ad hoc basis and free of charge during their working hours to non-profit associations supported by Societe Generale. It is geared to each participant’s individual abilities: financial education, mentoring, Pro Bono Days and the half-time programme for seniors.
FINANCIAL EDUCATION
Convinced that the sensible use of banking products and services hinges on financial education, Societe Generale draws on its employees’ skills to roll out, to its network and internationally (Poland, Morocco, etc.), tools to help young people and people in difficulty manage their budget more effectively.
In France, Societe Generale and the non-profit Crésus have devised and implemented a budget education programme, which is delivered within the framework of skills sponsorship. Since 2013, the Financial Education project has been seeking to raise awareness among young people aged 16-25 and people in difficulty of the issues surrounding good budget management, through joint actions within French Apprentice Training Centres (CFA) and communities (the Second Chance Schools (E2C), Capital Filles, Chantiers d’Insertion, etc.). Since the programme was launched, more than 4,700 CFA apprentices and recipients of non-profit services have benefited from the course, thanks to the commitment of nearly 200 employees.
MENTORING
Mentoring involves a company employee providing support to a person who is socially marginalised or furthest from the labour market with his or her schooling, future direction or job search, by sharing experience and advice. In 2017, employees of Societe Generale France were offered the opportunity to act as mentors within the Foundation’s partner associations (Proxité, Nos Quartiers ont des Talents, Solidarités Nouvelles face au Chômage, Article 1, Mozaïk RH, Capital Filles and Kodiko). Worldwide, volunteer employees from many of the Group’s sites (United Kingdom, Morocco, India, Singapore, the United States) are devoted to helping young people prepare for the business world.
PRO BONO DAYS
The objective of the pro bono initiatives is to offer a day’s support to a non-profit association chosen in accordance with the Group’s citizenship strategy. Employees then apply their value-added know-how to address a clearly defined need on the part of the association (communications, marketing, HR, finance, IT, etc.). This skills sponsorship also serves to highlight the expertise of the employees involved. Since 2012, 51 Pro Bono Days have been organised, involving 366 employees and representing nearly 2,800 pro bono hours for the benefit of 41 non-profit associations.
HALF-TIME FOR SENIORS
An agreement on changing professions, skills and employment was signed in February 2016, enabling interested and eligible employees to take on an assignment in the context of sponsorship arrangements between Societe Generale and
certain public interest associations. The employee puts his or her skills to work for a community organisation and leverages his or her experience and know-how in a non-corporate, civic environment. Employees that are three years from retirement are paid 70% of their salary for this half-time work.
Cultural and sports sponsorships and partnerships
OUR COMMITMENTS IN COMMUNITY LIFE
SPONSORSHIP AND PARTNERSHIPS BY SOCIETE GENERALE – COMMITMENTS THAT ECHO THE COMPANY’S VALUES
Societe Generale is not only a bank that serves its clients and the economy, but also a company that strives to play a role in community life by establishing close ties in the countries where the Group is based. In keeping with its values, the Bank pursues a commitment policy built around common priorities in relation to solidarity, culture and sport in order to support a dynamic programme of cohesive initiatives in France and abroad. The Group strives to establish long-term relationships in order to enable its partners to develop their measures over the long term and actively involves its employees in the different approaches.
The Group spent more than EUR 19.1 million in 2017 on sponsoring solidarity-related and cultural initiatives.
CITIZENSHIP
The Bank’s solidarity policy is demonstrated in particular by the actions of the Societe Generale Corporate Foundation for Solidarity, established in 2006, and the implementation of civic engagement initiatives for employees. The Societe Generale Group is particularly proactive in the areas of vocational integration and social inclusion through sport and cultural activities.
SOCIETE GENERALE CORPORATE FOUNDATION FOR SOLIDARITY
The purpose of the Societe Generale Corporate Foundation for Solidarity is to perform and support actions that are in the public interest, aimed at fostering the development of solidarity in society. Since its creation in 2006, it has been working to promote vocational integration, notably by supporting projects to help young people get into work and to fight illiteracy. Since 2015, the Foundation has extended its scope of intervention to include education, electing to support non-profit projects using sport or cultural activities as a means of promoting education and/or social inclusion for people in difficulty. The Chairman of the Foundation is Frédéric Oudéa, the Chief Executive Officer of the Group.
Since its creation in 2006, 951 non-profit projects in 29 countries have been supported through the Societe Generale Corporate Foundation for Solidarity, to the tune of over EUR 24.2 million.
The Foundation is also directly involved in initiatives in both France and the other countries in which the Group is based. In a difficult economic environment, the Foundation supports a hundred or so projects each year by means of an annual endowment of EUR 3 million.

5 I 2
SOCIETE GENERALE IS A RESPONSIBLE BANK CCORPORATE SOCIAL RESPPONSIBILITY
254 I 2018 REGISTRATION DOCUMENT I S O C I E T E G E N E R AL E G R O U P
FOUNDATIONS ABROAD
In the countries in which it is based, the Group supports civic actions to actively promote the social inclusion of people in difficulty. It acts via the actions of its Corporate Foundation and those of Societe Generale solidarity-based structures (akin to a foundation) at the local level. In order to be closer to the needs of the beneficiaries, Societe Generale solidarity-based structures also support non-profit organisations for social inclusion locally by seeking to involve their employees on a voluntary basis as well as their customers.
The Societe Generale Corporate Foundation for Solidarity regularly reinforces the financial involvement of its solidarity-based structures among those non-profit organisations that have already received support. As such, it seeks both to create synergies and to find opportunities to strengthen the ties between Societe Generale solidarity-based structures and the Foundation. This is the case in Brazil and Morocco, solidarity-driven actions in the United Kingdom, Talents & Partage (an association of employees and retirees of the Group) and the Fondation 29 Haussmann (a foundation for Private Banking customers).
In 2017, Societe Generale contributed EUR 10.9 million to solidarity-based initiatives.
MODERN AND CONTEMPORARY ART
IN FRANCE
The Societe Generale Contemporary Art Collection now comprises more than 1,200 works, exhibited at the Group’s premises in La Défense, on Boulevard Haussmann in the centre of Paris and in Val de Fontenay. Projects based around the Collection are aimed at employees, young people and the wider public, and art professionals, as well as partners and clients.
In 2017, the Group’s patronage of the arts took its mediation activities among the general public a step further by offering new exhibition concepts.
The arts patronage commitment of the Group towards cultural organisations is maintained, involving the lending of works and support for art projects for a wider audience, such as that of the city of Le Havre for its 500th anniversary.
The Collection also maintains a very active presence on the Internet and social media (Facebook, Twitter, Instagram, YouTube) with a view to communicating about arts patronage projects, the Collection’s exhibitions and “behind the scenes” details, as well as itinerant events involving the artists featured in the Collection and contemporary art news from France and abroad.
ABROAD
Societe Generale supports contemporary creation directly, particularly in North Africa through its historical collection of more than 1,000 works in Morocco, as well as more recent collections in Tunisia and Algeria, but also through broader projects, such as Scena9 in Romania and its sponsorship of the ARTAGON association, which organises an annual gathering of art school students from all over Europe.
The Group has also been the main partner of the Victoria & Albert Museum in London since 2016 for its landmark exhibitions, as well as of the Pushkin Museum in Moscow, the Städel Museum in Frankfurt and the National Gallery in Prague. It has also supported the French May festival in Hong Kong for many years.
MÉCÉNAT MUSICAL SOCIETE GENERALE ASSOCIATION
The Mécénat Musical Societe Generale Association has been supporting the development of classical music for more than 30 years and, in 2017, had nearly 50 partners. It is, in particular, a
committed sponsor of 25 orchestras and ensembles based at prestigious concert halls, such as the Philharmonie de Paris, as well as of the concert season at the Collège des Bernardins in Paris, the Museum of Grenoble and the Théâtre des Bouffes du Nord, with its “Belle Saison” network of theatres and concert halls.
Particularly focused on meeting the needs of talented young musicians starting out in their careers, the association awards grants to students of the National Conservatories of Paris and Lyon each year – there were 49 such grants for 2017-2018. In the same spirit, 14 instruments are currently on loan to musicians.
As part of its action to reach a new and wider public, Mécénat Musical is the founding patron of the Démos project, through which nearly 3,000 children have now played in one of 30 orchestras throughout France. In 2017, Mécénat Musical continued to support the non-profit association Concerts de Poche – 1,500 workshops and 97 concerts involving 41,000 participants over the year – and is also supporting two new partners: CREA, a centre for theatre and song in Aulnay-sous-Bois, and the “École Harmonique” initiative run by the musical ensemble Le Poème Harmonique in Rouen.
In parallel with its financial support policy, Mécénat Musical offers regular performance opportunities for young musicians or groups of musicians, with 32 concerts organised for employees and clients in 2017.
Mécénat Musical extended these initiatives in 2017, participating in major events in France and abroad, such as the “Fête de la Musique” (40 concerts given by partner ensembles and 400 employees in 12 different countries) and “Nuit Blanche” in Paris (9 late-night concerts open to the public at the Group’s historic headquarters in central Paris).
For the fourth edition of “Playing for ...”, following the successes at the Salle Pleyel in 2013 and 2014, at the Philharmonie de Paris in 2016 and at the Royal Festival Hall in London in 2017, 380 amateur instrumentalists and choristers, all Societe Generale employees, including around sixty from Bucharest and Dakar, will perform alongside the chamber choir Les Métaboles and the orchestra Les Siècles under the direction of François-Xavier Roth for three concerts on 8th, 9th and 10th December 2018.
25 children from the educational programme Démos will join the orchestra for the final movement of Beethoven’s Ninth Symphony.
Professional musicians, budding musicians (Démos) and amateur musicians will come together to form a symphony orchestra and choir performing for the very first time at the Philharmonie de Paris.
PRESTIGIOUS PARTNERS IN FRANCE AND ABROAD
In France, the Group is the partner of several major institutions, such as the Opéra Royal du Château de Versailles, the Opéra de Lille, the Volcan au Havre, the Dominicains de Haute Alsace and the Opéra Grand Avignon, and also supports renowned festivals, such as the Flâneries Musicales de Reims and the Festival Pablo Casals de Prades. In addition, Societe Generale is also a partner of several top-level orchestras, such as the Orchestre National de Lille and the Orchestre des Pays de Savoie.
Societe Generale continues to support prestigious venues, such as Glyndebourne and the Royal Albert Hall (Great Britain), the Philharmonie de Luxembourg, and the National Theatre of Prague (Czech Republic).
SPORT, AN INCREASINGLY INTERNATIONAL DYNAMIC
Societe Generale pursues a policy of forging sports partnerships to support the development of its activities around the world. Whether sponsoring champions during international competitions or
5
SOCIETE GENERALE IS A RESPONSIBLE BANK
2 I 5CCORPORATE SOCIAL RESPPONSIBILITY
S O C I E T E G E N E R AL E G R O U P I 2018 REGISTRATION DOCUMENT I 255
reaching out to younger athletes, Societe Generale is the preferred partner of national leagues and federations and local clubs alike, focusing its support chiefly on rugby, disabled sports and golf.
INCREASINGLY FORWARD-LOOKING RUGBY
Societe Generale has been a devoted partner of local rugby in France, from the amateur level right up to the top, since 1987. Involved in more than 450 clubs, Societe Generale is a major partner of professional rugby and of France’s national team. To mark the 30th anniversary of this commitment, the Group consolidated its main partnerships by renewing its contracts with the French Rugby Federation and with the National Rugby League for another six years (until 2023).
At international level, Societe Generale will for the sixth time be a major partner of the next Rugby World Cup, which will take place in Japan in 2019. This commitment proves the Bank’s ambition to be a strong rugby partner on every continent, particularly in regions with a high potential for development. The partnership agreement signed with the Indian Federation in 2016 is clear proof of this ambition, notably through the support of the Get into Rugby programme, which makes rugby more widely available in the country’s schools.
In addition to the World Cup, Societe Generale is committed to supporting this sport, via its subsidiaries and establishments, in a large number of countries worldwide, from Luxembourg to China, by way of Senegal and Serbia.
The development of rugby in new regions or amongst less exposed populations is also achieved through the promotion of new practices that are more accessible to all players. This is why rugby sevens is at the heart of Societe Generale’s sports sponsorship strategy. The Group has been actively involved in rugby sevens since 2001, has organised the SG Sevens (the French university rugby sevens championship final) since 2014, and supports a large number of competitions across France.
A YEAR OF PREPARATION GEARED AS CLOSELY AS POSSIBLE TO THE NEEDS OF DISABLED ATHLETES
Societe Generale works daily, alongside its employees, to integrate people with disabilities. Since 2003 Societe Generale has opted to join the Paralympic Movement and shares its values with the French Disabled Sports Federation (Fédération Française Handisport – FFH) and the French Adaptive Sports Federation (Fédération Française du Sport Adapté – FFSA).
Whether in terms of long-term support at national level for these two federations, ad hoc assistance for a specific action or proactive involvement for a local event, for Societe Generale this partnership relationship is a perfect illustration of its team spirit, a value at the core of the Bank’s DNA, via support for all athletes of the Paralympic Movement, both on a day-to-day basis and at major events.
Societe Generale will thus support the French Paralympic Team 2018, which is to compete in the Winter Paralympic Games in PyeongChang, including the flag-bearer, downhill skier Marie Bochet, who has been supported by Societe Generale on an individual basis since 2010 and won four gold medals in the 2014 Winter Paralympics in Sotchi.
This partnership provides an opportunity to publicise the practice of disabled sports more widely, particularly via the dedicated Facebook page and the Twitter account TOUS HANDISPORT, which currently has more than 93,000 fans and 7,000 followers.
Societe Generale affirms its role as a bank that cares about all aspects of the development of the practice of sports by disabled individuals. This partnership also resonates abroad through the commitment of its subsidiaries in this field, for instance in Algeria, Benin, the Czech Republic, the United Kingdom, Singapore, etc.
GOLF: AN INSTRUMENT FOR BUILDING RELATIONSHIPS
Societe Generale has been a partner of the French Golf Federation since 2001. In keeping with its conviction that sports activities must be accessible to as many people as possible, Societe Generale also supports Handigolf, a non-profit association promoting golf for people with disabilities.
In line with the growing international interest, the Group has since 2008 been a partner of the only major ladies’ tournament held in continental Europe – the Evian Championship.
5 I 2
SOCIETE GENERALE IS A RESPONSIBLE BANK CCORPORATE SOCIAL RESPPONSIBILITY
256 I 2018 REGISTRATION DOCUMENT I S O C I E T E G E N E R AL E G R O U P
CORPORATE SOCIAL RESPONSIBILITY (CSR), AN AMBITION THAT IS INTEGRATED INTO THE GROUP’S STRATEGY
Societe Generale’s historical commitments Societe Generale conducts its business with the utmost respect for the values and principles under:
the Universal Declaration of Human Rights and its additional commitments;
the fundamental conventions of the International Labour Organization (ILO);
the UNESCO World Heritage Convention;
the Guidelines for Multinational Enterprises of the OECD (Organisation for Economic Co-operation and Development);
the United Nations Guiding Principles on Business and Human Rights (see p. 265, “2018 Duty of Care Plan”).
In addition, the Group has shown its proactive commitment to the following public or private initiatives:
2000: founding member of the Wolfsberg Group;
2001: joined the United Nations Environment Programme Finance Initiative (UNEP-FI);
2003: joined the United Nations Global Compact, which encourages companies to integrate principles relating to human rights, working conditions and the fight against corruption;
2004: signed the Diversity Charter (France);
2007: adopted the Equator Principles (see p. 268, “Equator Principles”);
2007: signed the SME Pact (France);
2010: signed the “Responsible Supplier Relations” Charter (France);
2014: signed the Joint Declaration organised by Transparency International France for the promotion of transparent, honest lobbying;
2014: support for the Green Bond Principles;
2014: Lyxor signed the Principles for Responsible Investment (PRI);
2015: signed a Global Agreement on Fundamental Rights with UNI Global Union;
2015: signed the French Business Climate Pledge;
2015: launched the “Positive Impact Manifesto” of the UNEP-FI;
2015: joined the “Soft Commodities Compact” of the Banking Environment Initiative (with the Consumer Goods Forum) to fight tropical deforestation;
2015: subscribed to the “Principles for Mainstreaming Climate Actions within Financial Institutions”, launched during COP 21;
2016: signed the Women’s Empowerment Principles – WEP, Professional Equality Charter of United Nations, and the International Labour Organization’s Global Business Charter on Disability;
2017: supported the recommendations of the Task Force on Climate-related Financial Disclosure (TCFD);
2017: adopted the Principles for Positive Impact Finance (UNEP-FI).
Regular dialogue with stakeholders
DIALOGUE WITH CUSTOMERS Customer satisfaction is regularly analysed in each of the Bank’s businesses. This is generally done based on the recommendation rate (according to the Net Promoter Score system, which has been gradually rolled out since 2015), which is monitored at the highest level of the Group (see p. 262, “Customer Satisfaction”).
DIALOGUE WITH EMPLOYEES The Employee Satisfaction Survey is a comprehensive and anonymous internal survey conducted every two years throughout the Group. The results are shared with employees and serve as the basis for action plans, with the goal of continuous improvement. From 2018 onwards a shorter survey will also be conducted to establish interim indicators, in particular with respect to commitment. The questions focus on Societe Generale’s values. The results of the 2017 Employee Satisfaction Survey show strong identification with the values of Responsibility (79%) and Team Spirit (76%) and a slight improvement as regards the value of Innovation (73%, 1 point higher than in 2015), while Commitment (68%) was down slightly (2 points lower than in 2015).
DIALOGUE WITH CIVIL SOCIETY Societe Generale makes every effort to promote constructive dialogue with all its stakeholders. In particular, the Group listens and talks to any NGOs that alert it to environmental and social (E&S) issues within its sphere of influence or that can help it to adapt its policies and procedures in a progress-driven approach. The Bank ensures it holds regular discussions on the development and implementation of its policies.
Through its E&S watch list, Societe Generale monitors any projects, companies and sectors, irrespective of whether they are financed by the Bank, that are the subject of public controversy or public campaigns by civil society (see p. 269, “E&S Watch List”).
The Group uses the Corporate and Social Responsibility (CSR) Department to centralise any request or contact by NGOs or other civil society members informing it about the impact of its financing portfolio or other services. Wherever possible, an internal enquiry is conducted and a documented response is given, either in writing or at meetings, where appropriate. The Bank also has a section on its website entitled “Dialogue & transparency” (https://www.societegenerale.com/en/news-and-media/dialogue-and-transparency).

5
SOCIETE GENERALE IS A RESPONSIBLE BANK
2 I 5CCORPORATE SOCIAL RESPPONSIBILITY
S O C I E T E G E N E R AL E G R O U P I 2018 REGISTRATION DOCUMENT I 257
In 2017, Societe Generale participated in various working groups and discussion meetings with around a dozen NGOs (including Friends of the Earth, BankTrack, Human Rights Watch, Oxfam and WWF), either in the form of bilateral meetings or broader consultation meetings organised by the associations themselves, by the OECD or by the Equator Principles Association.
The main topics covered in discussions with NGOs over the year were:
the implementation of fiscal transparency rules;
the impact that the financial sector has on the climate, particularly with regard to the financing of activities related to fossil fuels;
human rights, especially the rights of indigenous populations and populations located in disputed areas;
the role of financing in protecting natural spaces.
DIALOGUE WITH SHAREHOLDERS AND INVESTORS
A DEDICATED TEAM
Societe Generale has a department in charge of institutional and individual shareholder relations, whose role is to oversee the Group’s financial communications about its strategy and results.
MEETING WITH INVESTORS
Societe Generale regularly meets with its investors to present its strategy and results to them and to exchange views with them, including on environmental, social and governance topics. In 2017, the Bank’s Management and the teams from the Finance Division, accompanied by the Investor Relations team, spent nearly 70 days doing equity roadshows and participated in around ten broker conferences in the major international financial centres. Overall, the teams met nearly 300 investors in around 40 towns and cities, representing almost 70% of the capital. Furthermore, Societe Generale held its Investor Day in November in order to unveil its 2020 strategic plan to a wide audience of investors and financial analysts.
The Group has also strengthened its commitment with investors in relation to environmental, social and governance subjects, through dedicated meetings in Europe and in the United States with the Chairman of the Board of Directors.
In order to maintain and develop close relations with its individual shareholders, the Group implements numerous initiatives every year. Societe Generale took part in four information meetings in partnership with other issuers, in Aix-en-Provence, Paris, Lille and Bordeaux, each of which was attended by 150 to 300 people. At the end of the year the Bank took part in an e-meeting (a 45-minute discussion broadcast on the website of a media partner) with nearly 2,000 individual shareholders. Societe Generale participates in the Salon Actionaria, a reference trade fair for individual shareholders drawing more than 25,000 visitors. Five times a year the Group publishes its Letter to Shareholders, which appears quarterly in newsletter format and in June, after the General Meeting, in paper format.
To make sure it continues to meet the needs and expectations of its individual shareholders, the Bank has also had a Shareholders’ Consultative Committee since 1988, whose primary role is to advise on the Group’s individual shareholder relations and communications policy. The Committee meets twice a year and the questions it submits are relayed to the General Meeting.
In 2017 Societe Generale received recognition for its digital shareholder and investor communications in the form of the Bronze Trophy for the Best Digital Communication 2017, awarded by the newspaper Le Revenu. It also won the Grand Prix for Financial Transparency, awarded by an independent scientific committee and organised by Labrador.
Recognised responsibility Non-financial risk management and performance, which is an integral component of Societe Generale’s overall performance, are regularly assessed and rated by the non-financial rating agencies.
The resulting analyses and ratings constitute recognition of the quality and transparency of the information provided and reflect the attention paid to the Group’s CSR actions by an external and independent observer.
These ratings allow some of our stakeholders, such as the investors, to integrate non-financial criteria into their investment selections in addition to “responsible” stock market indices (information available on the Group website www.societegenerale.com).

5 I 2
SOCIETE GENERALE IS A RESPONSIBLE BANK CCORPORATE SOCIAL RESPPONSIBILITY
258 I 2018 REGISTRATION DOCUMENT I S O C I E T E G E N E R AL E G R O U P
2017 score 2016 score Top quartile in sector Indices
MSCI AA BBBB MSCI Low Carbon Leaders Index
RobecoSAM 84/100 84/100 DJSI World
DJSI Europe
Sustainalytics 74/100 74/100
STOXX Global ESG Leaders
STOXX Global ESG Environmental Leaders
STOXX Global ESG Social Leaders
STOXX Global ESG Governance Leaders
EURO STOXX ESG Leaders 50
STOXX Europe ESG Leaders 50
Vigeo 64/100 63/100
Euronext Vigeo World 120
Euronext Vigeo Europe 120
Euronext Vigeo Eurozone 120
Euronext Vigeo France 20
Oekom C-- C [Prime]
FTSE4GOOD 4/5 4/5 FTSE4Good Global Index
FTSE4Good Europe Index
Carbon Disclosure Project A-- B Ecovadis 70/100 68/100
A CSR ambition defined with the stakeholders The Group has a feedback and dialogue system for all its stakeholders, which is described in page 256, “Regular dialogue with stakeholders”.
In addition, Societe Generale launched a more extensive and targeted initiative in 2017 for listening to its internal stakeholders (employees, Staff Representative Bodies) and external stakeholders (investors, shareholders, customers, non-governmental organisations(1), civil society, etc.) in order to anchor and reinforce the Bank’s CSR vision.
With the support of an external consulting firm, the Group performed an extensive consultation of around 1,350 individual customers, supplemented by 150 interviews with external and internal stakeholders. Besides France, this consultation was also conducted in Africa, the United States, Russia and in several other European countries, i.e. around fifteen countries in total.
It enabled the creation of the materiality matrix below, which ranks sustainable development issues in light of the priorities expressed by the internal and external stakeholders. Societe Generale’s new CSR ambition has been developed on the basis of the results of this matrix.
(1) Note/Issues in relation to transposition of the European Directive on non-financial reporting: this materiality matrix of the expectations of our stakeholders is not an analysis matrix of the Group’s major challenges and risks. It is a first step, and will be supplemented by a detailed analysis enabling mapping of the CSR challenges and risks, to be defined at a later stage.

5
SOCIETE GENERALE IS A RESPONSIBLE BANK
2 I 5CCORPORATE SOCIAL RESPPONSIBILITY
S O C I E T E G E N E R AL E G R O U P I 2018 REGISTRATION DOCUMENT I 259
When cross-referencing the stakeholders’ expectations and the measurement of the impact of the challenges on the Group’s activities, five main priorities emerge from this matrix:
The satisfaction and protection of our customers:
– quality of service and sharing of information: offers tailored to customers’ needs, with proper transparency and fairness;
– data security and protection;
– professionalism of the teams;
– vigilance in relation to complaints;
– co-development of new products;
– management of extensive dialogue with follow-up by means of New Promoter Score (NPS) customer satisfaction surveys and any necessary remediation commitments.
Climate change:
– commitment to the 2°C scenario of the International Energy Agency (IEA) for commercial and proprietary activities;
– development of financing for energy transition;
– range of “green” products and services;
– commitments under the Soft Commodities Compact.
Being a responsible employer:
– rooted in the local economic and social fabric;
– guaranteeing respect for human rights, health, safety and good working conditions;
– being mindful of human and social risks;
– promoting diversity, skills development, employability, and an ethical and inclusive culture.
Ethics and governance, incorporating ESG risk management:
– integrity and transparency in the rules of the Code of Conduct;
– tax charter;
– diversity in the Group’s management bodies;
– a “Culture and Conduct” programme focused on Responsibility;
– deployment of the duty of care and of the sector policies;
– implementation of new regulatory requirements.
Societal trends and innovations:
Retail Banking:
– Social and Solidarity Economy (SSE): social entrepreneurship, microfinance, social and financial inclusion, positive impact investment;
– innovation and partnerships with SMEs/start-ups;
– a range of SRI products and responsible products;
– commitment of employees to solidarity-based actions.
Global Banking:
– supporting the megacities of the future (infrastructure, waste, servicizing);
– mobility developments, promoting social inclusion;
The inclusion of the “Contribution to the sustainable development of Africa” priority, which is a cross-business priority, was motivated by the Bank’s historic positioning as a strategic partner on the African continent. It covers the following fields:
– supporting proponents and drivers of growth;
– fighting against poverty and exclusion;
– access to energy, clean water;
– sustainable agriculture;
– education, training, transfer of skills;
– health.
The findings of this consultation were presented to General Management and the Board of Directors last September and taken into consideration for the preparation of Societe Generale’s 2017-2020 strategic plan. This work was also presented on the occasion of the Investor Day on 28th November 2017.
A guide presenting the six priorities has been sent to the head of each Business Unit (BU) and Service Unit (SU) for them to select and implement those that are in line with their activities.
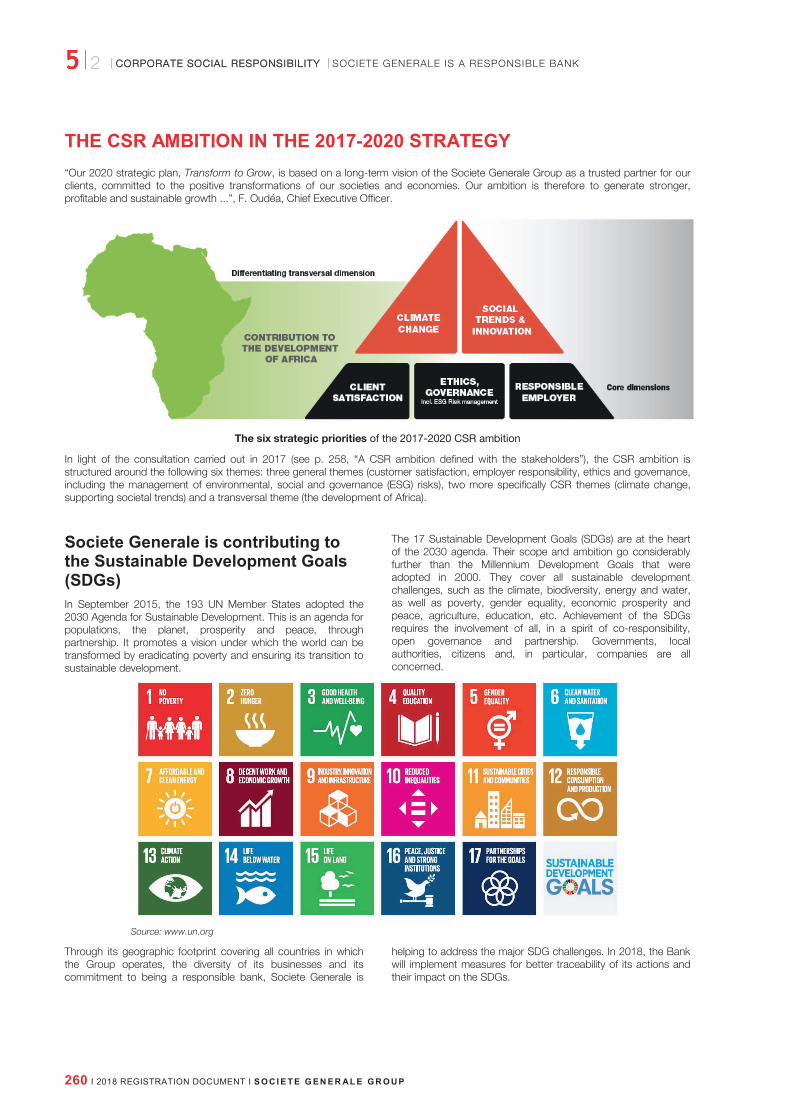
5 I 2
SOCIETE GENERALE IS A RESPONSIBLE BANK CCORPORATE SOCIAL RESPPONSIBILITY
260 I 2018 REGISTRATION DOCUMENT I S O C I E T E G E N E R AL E G R O U P
THE CSR AMBITION IN THE 2017-2020 STRATEGY “Our 2020 strategic plan, Transform to Grow, is based on a long-term vision of the Societe Generale Group as a trusted partner for our clients, committed to the positive transformations of our societies and economies. Our ambition is therefore to generate stronger, profitable and sustainable growth ...”, F. Oudéa, Chief Executive Officer.
The six strategic priorities of the 2017-2020 CSR ambition
In light of the consultation carried out in 2017 (see p. 258, “A CSR ambition defined with the stakeholders”), the CSR ambition is structured around the following six themes: three general themes (customer satisfaction, employer responsibility, ethics and governance, including the management of environmental, social and governance (ESG) risks), two more specifically CSR themes (climate change, supporting societal trends) and a transversal theme (the development of Africa).
Societe Generale is contributing to the Sustainable Development Goals (SDGs) In September 2015, the 193 UN Member States adopted the 2030 Agenda for Sustainable Development. This is an agenda for populations, the planet, prosperity and peace, through partnership. It promotes a vision under which the world can be transformed by eradicating poverty and ensuring its transition to sustainable development.
The 17 Sustainable Development Goals (SDGs) are at the heart of the 2030 agenda. Their scope and ambition go considerably further than the Millennium Development Goals that were adopted in 2000. They cover all sustainable development challenges, such as the climate, biodiversity, energy and water, as well as poverty, gender equality, economic prosperity and peace, agriculture, education, etc. Achievement of the SDGs requires the involvement of all, in a spirit of co-responsibility, open governance and partnership. Governments, local authorities, citizens and, in particular, companies are all concerned.
Source: www.un.org
Through its geographic footprint covering all countries in which the Group operates, the diversity of its businesses and its commitment to being a responsible bank, Societe Generale is
helping to address the major SDG challenges. In 2018, the Bank will implement measures for better traceability of its actions and their impact on the SDGs.

5
SOCIETE GENERALE IS A RESPONSIBLE BANK
2 I 5CCORPORATE SOCIAL RESPPONSIBILITY
S O C I E T E G E N E R AL E G R O U P I 2018 REGISTRATION DOCUMENT I 261
Responsibilities of the CSR Department A new governance for the Group has been in place since 1st September 2017 and the new organisation since 1st January 2018 (see p. 71, Chapter 3). As a trusted partner of all its stakeholders, the Group is engaged in positive transformations. This takes various forms and concerns various topics: the environment – as reflected by the new commitments made by the Group during COP 23 –, the development of new forms of work and entrepreneurship, the anchoring of a strong culture of responsibility, and support for the development of the African continent.
The Chief Executive Officer appointed the Group’s Director of Corporate Social Responsibility (CSR) to the Bank’s Management Committee with effect from 1st January 2017, thereby demonstrating Societe Generale’s intention to further develop and integrate CSR issues into its strategy.
The Board of Directors has validated the 2017-2020 CSR ambition, which is aligned with the overall strategy of the Group for 2020.
The Group’s Corporate Social Responsibility Department is responsible for defining and proposing a CSR (Corporate Social Responsibility) policy for the Group. In addition, the CSR Department is responsible for monitoring CSR actions, although the Group’s BUs/SUs and entities remain responsible for implementation and for aligning their actions with the Group CSR policy.
In such respect, the CSR Department:
proposes to General Management a policy in terms of CSR ambition and strategy;
steers CSR risk management, together with the risk SU and in accordance with the CSR strategy;
develops CSR solutions, in close collaboration with the BUs/SUs and entities, drawing on the team’s expertise;
reports regularly to General Management on implementation;
oversees internal and external CSR communications, together with the Communications SU.
The CSR Department is also responsible for the Environmental and Social policies and key performance indicators (KPI). In such respect, the Department:
contributes to management of the Group’s CSR-related reputational risk;
prepares sector-specific policies and oversees their deployment, and determines the standards and indicators to be implemented;
coordinates and manages the deployment of the environmental and social (E&S) risk management system;
manages the collection of non-financial data and coordinates all regulatory non-financial reporting (Grenelle II Act, Article 225, as well as the reporting required pursuant to Article 173 of the French Energy Transition Act);
contributes to management of the CSR P&L, together with the BUs/SUs, with a view to its optimisation.
Lastly, the CSR Department is responsible for relations with stakeholders. In such respect:
it coordinates regulatory CSR reporting;
it is responsible, together with the Finance and Investor Relations Division, for relations with investors and non-financial ratings agencies in respect of CSR;
it is responsible for relations with professional and interprofessional bodies, organisations specialising in sustainable development, and non-governmental organisations (NGOs) in respect of CSR;
it is tasked with monitoring CSR developments for the Group’s employees, building up expertise so as to identify trends and disseminate CSR innovations;
it raises the awareness of employees in respect of CSR issues and also develops a training programme tailored to the various groups of employees, in conjunction with their managerial supervisors and with the support of the HR SU. Efforts will be made to establish synergies in respect of matters also covered by the Culture and Conduct programme;
it is supported by a CSR community, representing all of the Group’s BUs/SUs worldwide.
The CSR ambition is at the heart of the 2020 Transform to Grow strategy. The Heads of the BUs/SUs are responsible for integrating CSR objectives as part of the development of their activities and also the way in which they conduct their business.
The CSR Director convenes a Committee on a regular basis, which includes her team and strategic partners for various areas of expertise (HR, Sourcing, Communications, investor relations, E&S, etc.); she also runs a “CSR Club” involving the BU/SU contacts. The headcount of the CSR Department was bolstered in 2017 (six new members of staff) to facilitate deployment of the CSR ambition throughout the Group in close coordination with the BUs/SUs.
In 2017, the CSR policy underwent a strategic review by General Management and was presented to the Board of Directors; the CSR policy was included in the documentation supplied for the Investor Day on 28th November 2017, which enabled the priorities to be shared. At the request of the Board of Directors, a Group Risk Committee (CORISQ) meeting, chaired by General Management, was held in relation to managing the risks associated with climate change (see p. 272, “Societe Generale’s role in the fight against climate change”).
In order to evaluate progress in respect of the CSR ambition, every year since 2005 performance indicators have been defined and the corresponding data gathered, consolidated and analysed using a dedicated global CSR reporting system, which was rolled out to the whole Bank in 2014 and to which more than 1,500 people contribute.
The CSR Department carries out awareness raising/promotional and mobilisation actions among employees in coordination with the Communication Division (conferences open to all employees, the European Sustainable Development Week, the internal Environmental Efficiency Awards – as part of which all the Bank’s entities and businesses contribute towards efforts to reduce the Group’s greenhouse gas emissions – the SRI Conference (see p. 289, “SRI research”), the Group Innovation Awards – where one trophy is dedicated to CSR – speeches and round tables on the CSR ambition).
For its part, the Human Resources Department has also continued to organise regular conferences on “Well-Being in the Workplace” as part of its “Life at Work” programme (see p. 251, “Caring about employees’ well-being at work”).
Lastly, the CSR Department seeks to regularly improve and adjust its communications. In 2017, it digitalised the Group’s CSR Report (available on the institutional website) and made it accessible to people with disabilities (the visually impaired and hard of hearing). In parallel, a dedicated section on the website provides information on the implementation of the CSR ambition and an intranet enables all employees and managers to find information about good CSR practices and related events. An additional feature of the intranet is access to discussion boards on related topics facilitated via the Group’s internal collaborative tools.

5 I 3
SOCIETE GENERALE IS IMPLEMENTING ITS CSR AMBITION CCORPORATE SOCIAL RESPPONSIBILITY
262 I 2018 REGISTRATION DOCUMENT I S O C I E T E G E N E R AL E G R O U P
3 . S O C I E T E G E N E R A L E I S I M P L E M E N T I N G I T S C S R A M B I T I O N
As a relationship bank, for which a relationship built on trust is at the core of its mission, Societe Generale rolls out its ambition in accordance with the six priority themes identified with its stakeholders (see p. 258, “A CSR ambition defined with the stakeholders”).
Societe Generale pays particular attention to customer satisfaction and protection, the key factors for sustainable development. It has also instilled a strong corporate culture within its businesses and is mindful of the management of environmental, social and governance risks associated with its activities.
The Group is also aware of its role in the current global context and in societal trends, and thus plays a leading part in the fight against climate change and is a pioneer of positive impact finance.
Lastly, due to its significant historic presence in Africa, the Bank has chosen to take a particularly active role in supporting the continent’s development and the improvement of its positioning within the global arena.
CUSTOMER SATISFACTION AND PROTECTION
Customer satisfaction FOR THE FRENCH RETAIL BANKING NETWORKS For several years now, all entities within French Retail Banking have been committed to a structured approach ensuring that customers are offered a quality service.
In this context, a comprehensive system has been put in place, giving a 360° overview of the quality that is delivered, the quality that is observed and the quality that is perceived by our customers, systematically taking into account their recommendation intentions. Monthly dashboards are produced and distributed to each Regional Director, and more specific tools for each point of sale facilitate the conversion of goals into action. They are developed based on:
a national competitive survey;
quarterly panel discussions with representative samples of the customer base;
local satisfaction surveys for Individual, Professional and Corporate customers;
mystery visits to all points of sale.
The approach to quality also includes “hot” feedback following, for example, each real estate loan transaction and, since October 2016, the establishment of each new relationship. This immediate follow-up after major transactions is carried out across all branches and the results are shared, each month, with all parties involved in the customer service (including Head Office departments).
In 2017:
150,000 individual customers (i.e. 2% of the business), 15,000 professional customers and 4,000 SMEs were polled about their recommendation intention and their overall satisfaction, as well as key aspects of customer satisfaction, such as how their enquiries are handled and how well the services offered suit their needs and projects;
in the corporate market, nine out of ten SME customers (SMEs with 10-500 employees) rate the teams as “proficient and knowledgeable” and the same proportion rate them as “consistent and united”; nine out of ten also feel that they are “benefiting from a personalised relationship” (when they are
in contact with their client relationship manager): 2017 competitive satisfaction survey (CSA) and 2017 Societe Generale satisfaction survey (GN Research);
Viséo Customer Insights’ “Customer Service of the Year Award”, awarded to Societe Generale for the fifth time in 2018, recognises the teams’ efforts to facilitate the everyday lives of their customers, in particular by providing greater accessibility and more expertise via innovative communication channels, such as Facebook Messenger.
In order to support the teams’ work in the field, the Corporate Divisions at Head Office have committed, since 2013, to a programme aimed at developing a service culture. To fuel this continuous improvement plan, the following measures have been put in place:
dedicated staff in each of the Corporate Divisions: the Service Culture Coaches;
an internal barometer for measuring the overall and specific satisfaction levels of the front, middle and back office teams of the Network as regards the services provided by the Head Office teams. The second edition of this barometer recognises and highlights the value of the actions implemented by each of the Corporate Divisions.
AT CRÉDIT DU NORD Customer satisfaction has always been Crédit du Nord’s priority and is the main annual performance target for its branches. This was also demonstrated by the Banking Quality Trophy awarded by meilleure-banque.com to Crédit du Nord’s Multimedia Centre of Expertise, which was recognised for the quality of its remote customer service in December 2017 (https://contactnet.safe.socgen/fr/trophee-qualite-bancaire-2018).
AT BOURSORAMA Boursorama is the only online bank that has been certified by AFNOR (WebCert service commitment). Its recommendation rate (Net Promoter Score) is persistently high: in a study conducted by Opinion Way in December 2016, 91% of the customers responding said they would recommend Boursorama Banque to their family and friends.

5
SOCIETE GENERALE IS IMPLEMENTING ITS CSR AMBITION
3 I 5CCORPORATE SOCIAL RESPPONSIBILITY
S O C I E T E G E N E R AL E G R O U P I 2018 REGISTRATION DOCUMENT I 263
AT CORPORATE AND INVESTMENT BANKING For its Global Banking segment, Societe Generale carries out bi-annual satisfaction surveys according to the NPS (Net Promoter Score©) methodology on a global scale: French, British, German, Italian, Portuguese and Spanish customers are polled in odd years; the other geographic areas are polled in even years. All types of customers are polled (regardless of whether they are major corporations or financial institutions).
Overall, the customers polled represent 70% of the Net Banking Income (NBI) generated by Societe Generale via this customer segment. The results reveal a high and increasing level of potential recommendations.
These surveys enable the definition and implementation of action plans:
on a client-by-client basis, under the responsibility of the banking advisers;
In relation to more structural initiatives (product offering, marketing, customer coverage, processes, etc.), conducted by a dedicated team co-sponsored by the Deputy Chief Executive Officer overseeing Corporate and Investment Banking more particularly, and the joint Heads of the Client Relationship and Investment Banking Business Unit. Structural initiatives progress according to the established plan and are reviewed at quarterly Group Strategic Steering Committee meetings.
Moreover, very particular attention has been paid to back office tools and processing services: 2017 was thus marked by the strong acceleration in the rollout of the CMT (Client Case Management Tool) in Investment Banking’s support teams. This initiative is part of the Bank’s ambition to offer excellent service quality to our clients. Today, this tool is used by more than 2,000 individuals (an additional 1,680 users in 2017). The CMT is a new digital platform, which has been implemented on a global scale to manage customer requests and incidents.
It provides:
responsiveness: follow-up and monitoring until each case has been resolved;
efficiency: automatic customer identification, case assignment, pre-formatted standard messages;
transparency: real-time monitoring, a 360° view of the interactions between management teams and customers;
continuous improvement thanks to the monitoring of performance and actions.
The CMT is a practical means of placing customers at the heart of the day-to-day handling of operations.
Private Banking, for its part, won the distinction of the “2017 Best Private Bank in Western Europe”, awarded by Private Banker International in November 2017.
AT INTERNATIONAL RETAIL BANKING AND FINANCIAL SERVICES The entire International Retail Banking and Financial Services division is also equipped with tools for measuring customer satisfaction. The “CXM IBFS” programme, a retail customer survey developed with IPSOS and which covered 14 countries in 2016, was expanded to 22 countries in 2017. It is based on three key verbs: Understand, Analyse and Monitor. The idea is to have a cross-business monitoring tool which highlights the key factors in customer relationships whilst respecting the specific features of each market. Accordingly, the focus of these surveys carried out with IPSOS is:
to open up new perspectives for a better understanding of the performance and positioning of the subsidiaries in their respective markets from the customer’s point of view;
to develop cross-business analysis and remediation tools;
to develop a powerful lever for optimising investment plans and strategic plans, and to become more agile.
The surveys are carried out in the second quarter such that the results are available and action proposals can be taken into account in the budgetary programmes prepared in the third quarter, thus optimising the teams’ responsiveness.
Each business manager must:
make maximum use of the reports, drawing thereon in defining specific action plans;
ensure the transversality of the approach across all departments within their scope of responsibility;
appoint a Customer Experience representative to ensure this transversality;
implement swift actions, paying particular attention to dissatisfied customers who have to be re-contacted in order to avoid attrition;
share the experiences gained during this process and incorporate them into the business strategy plan during strategic and/or budgetary reviews.
Data protection Societe Generale, as a preferred trusted partner of its customers, is particularly sensitive to the issue of personal data protection (see p. 228, Chapter 4.9, “Compliance and reputational risks”).
Digital security and cyber crime There is a Group-wide system for managing information system security risks. It is coordinated at Group level by an Operational IT Risk and Information System Security Manager within the Corporate Resources Division. This system is rolled out in each of the Group’s Business Units and Service Units (see p. 155, Chapter 4.2, “Risks related to information systems”).
Claims and mediation Each of Societe Generale’s BUs and SUs has its own targeted governance, structure, procedures and methods for handling and following up on complaints.
Particular emphasis is placed on employee training and awareness, particularly within French Retail Banking (Societe Generale, Boursorama Banque and Crédit du Nord) and the Insurance business line (ISO 9001), and this has greatly helped optimise all processes (recording, quality control and response time in relation to customer complaints). Customers are informed about the complaint and mediation procedures via various media (the Internet, contracts, pricing brochures, etc.). The complaint handling policy provides for an escalation procedure as well as the possibility of referring the matter to an internal or external mediator.
5 I 3
SOCIETE GENERALE IS IMPLEMENTING ITS CSR AMBITION CCORPORATE SOCIAL RESPPONSIBILITY
264 I 2018 REGISTRATION DOCUMENT I S O C I E T E G E N E R AL E G R O U P
IN FRANCE Societe Generale is committed to finding a quick or even immediate solution to any complaints or problems relating to Retail Banking which are reported to a branch by a customer. However, should the Bank and its customer still be in disagreement after the initial remedial action, the customer may file a complaint with Customer Relations and, if necessary (i.e. if the customer is still dissatisfied), refer the matter to the ombudsman, whose services are entirely free of charge. Exceptional circumstances aside, customers will receive a reply from Societe Generale within 10 days or from the ombudsman within 90 days.
Referring the matter to the ombudsman is a free dispute resolution process not involving the courts, which has been used by the Group since 1996 and was institutionalised by the legislator in 2001.
Under new regulations, the Bank has created a mediation service, comprising two members who report hierarchically and functionally to the ombudsman. This service is available to all entities that use the Societe Generale mediation process, via dedicated websites. All Societe Generale Group entities in France are thus concerned, except for those financial institutions which use the AMF ombudsman, and Boursorama which uses the FBF ombudsman (and AFNOR Certification services, depending on the case).
Yves Gérard has been the ombudsman for Societe Generale and Crédit du Nord since 1st January 2015. He works alongside the AMF ombudsman for any complaints involving financial products and the FFSA ombudsman (insurance) for insurance products.
He was appointed, in June 2016, by the collegial body of the Consultative Committee for the financial sector and is in the process of being officially recognised by the Evaluation and Control Committee for Consumer Mediation.
In 2017, the ombudsman received 5,724 letters in respect of Societe Generale, of which 4,369 were requests for mediation. He handed down approximately 300 decisions in the year. For Crédit du Nord, the ombudsman received 1,416 letters, of which 1,049 were requests for mediation. Of these, 295 were deemed admissible, and more than 200 decisions were handed down in 2017. Where requests were deemed inadmissible, it was mostly on the grounds of internal avenues not having been exhausted. The increase in the number of cases referred (as compared to 2016) can be explained in part by the use of the ombudsman’s two websites set up in May 2016 (64% of the cases referred were for Societe Generale and 43% were for Crédit du Nord).
As for Boursorama, it is ranked number one among all national financial and economic information websites. In order to ensure the high quality of service it considers essential for growth, the on-line bank has elected to undertake the service commitments required for AFNOR “WebCert” Certification (https://certificats-attestations.afnor.org/certification=196861044288). Boursorama Banque’s customer service department is therefore committed to handling customer complaints and responding within 15 working days, except under extenuating circumstances. Furthermore, and in line with this certification, any customer who is not happy with how their complaint has been handled may, pursuant to the abovementioned commitments, raise the matter with AFNOR Certification directly in writing.

5
SOCIETE GENERALE IS IMPLEMENTING ITS CSR AMBITION
3 I 5CCORPORATE SOCIAL RESPPONSIBILITY
S O C I E T E G E N E R AL E G R O U P I 2018 REGISTRATION DOCUMENT I 265
MANAGEMENT OF ENVIRONMENTAL, SOCIAL AND GOVERNANCE RISKS (ESG)
Regulatory commitments The Bank is determined to act with integrity and in compliance with the applicable laws in all its activities. Societe Generale is in particular subject to certain obligations which have led it to develop policies and processes for managing ESG risks. In order to meet its obligations under section 54 of the 2015 Modern Slavery Act, Societe Generale publishes a statement on slavery and human trafficking on its website (https://www.societegenerale.com/sites/default/files/documents/Document%20RSE/Modern%20Slavery%20Act.pdf).
2018 DUTY OF CARE PLAN
OBJECTIVE
As a French company with over 5,000 employees, Societe Generale is subject to the French Act of 27th March 2017 on the Duty of Care of Parent and Subcontracting Companies (the “Duty of Care Act”). This law requires a duty of care plan to be established and implemented, effectively, with the objective of identifying risks and preventing serious breaches in respect of human rights, fundamental freedoms, the health, safety and security of persons, or the environment as a result of the Group’s activities. In particular, the plan must include mapping of the risks, measures for assessing and mitigating risks of serious breach or harm and an alert mechanism.
Over the years, the Societe Generale Group has voluntarily adopted procedures and tools for identifying, assessing and controlling risks relating to human rights and the environment as part of its management of its human resources, its supply chain and its activities. The Group sees this new regulatory obligation as an opportunity to clarify and strengthen its existing duty of care framework.
CHALLENGES
Societe Generale relies on the Universal Declaration of Human Rights (1948) and the fundamental conventions of the International Labour Organization for defining the concepts of human rights, fundamental freedoms and the health, safety and security of persons with reference to the Duty of Care Act. On this basis, it has identified ten key challenges in relation to human rights on which the activities of a company can have an impact:
forced labour and slavery;
child labour;
respect for indigenous populations and their right of ownership;
discrimination;
freedom of association;
the health, safety and security of persons;
decent working conditions;
decent remuneration;
decent social protection;
the right to privacy.
With regard to the environment, the Rio Declaration on Environment and Development (1992) served as a reference for identifying the six key challenges:
climate change and air quality;
the preservation of water resources and their quality;
responsible land use;
the preservation of natural resources;
the preservation of biodiversity;
the limitation and treatment of waste.
SCOPE OF APPLICATION
The Group’s Duty of Care Plan has been developed on the shared foundation of these ten human rights challenges and six environmental challenges. It will be rolled out across all consolidated companies over which Societe Generale exercises exclusive control. It is built around three pillars in order to adapt the approaches to the specific needs of each of the areas covered:
the “Human Resources, Safety and Security” pillar, which aims to prevent the risk of serious breaches in respect of human rights and fundamental freedoms, the health of employees of the Societe Generale Group, the safety and security of persons, and the protection of personal data;
the “Sourcing” pillar, which aims to manage the potential risk of breaches in respect of human rights, fundamental freedoms, health, safety and security, and the environment related to the activities of its direct suppliers and subcontractors (category 1);
the “Activities” pillar, which aims to prevent the risk of serious breaches in respect of human rights, fundamental freedoms, health, safety, security and the environment directly associated with the Group’s products or services.
GOVERNANCE
The Duty of Care Plan has been developed in accordance with the principle of continuous improvement and will thus evolve in light of the results from the risk mapping and regular assessments, as well as developments in the activities or in connection with the regular review of the risk management policies and tools.
It has been prepared by the Corporate Social Responsibility, Human Resources and Sourcing Departments, in association with the Legal Department, representatives of the Compliance Division, the Culture and Conduct Programme, and certain operational and service entities. It has been approved by General Management and is included in the management report prepared by the Board of Directors and published in the Registration Document.
It is also to be presented to the internal and external stakeholders.
The Corporate Social Responsibility, Human Resources and Sourcing Departments will coordinate the rollout of the Duty of Care Plan, and the operational and service entities concerned will be responsible for implementing it.

5 I 3
SOCIETE GENERALE IS IMPLEMENTING ITS CSR AMBITION CCORPORATE SOCIAL RESPPONSIBILITY
266 I 2018 REGISTRATION DOCUMENT I S O C I E T E G E N E R AL E G R O U P
IDENTIFICATION, RANKING AND MAPPING OF THE RISKS
In the course of its efforts to manage its Environmental and Social (E&S) risks, Societe Generale has, over time, identified salient E&S risks, which have formed the basis for the deployment of its existing E&S management procedures and tools.
The Group has, for example, been formalising E&S risk mapping for several years, based on purchasing categories in order to assess the risks associated with each of these categories. It has also published E&S policies on themes and sectors that have been identified as representing a risk in the context of its activities.
Societe Generale is continuing its efforts so as to ensure, thanks to a mapping exercise, that the major risks of serious breach in relation to the three pillars have been correctly identified.
This risk mapping exercise is organised in two key stages:
mapping of the theoretical risks that do not depend on the Group’s activities;
mapping of the inherent risks specific to Societe Generale in light of its establishments, its purchases, and types of products and services.
THEORETICAL RISK MAPPING
In order to carry out the mapping of theoretical risks, Societe Generale has identified purchasing categories as well as sectors of activity that are considered, a priori, to pose risks to human rights, fundamental freedoms, health, safety, security and the environment (with reference to the 16 challenges listed above).
Following this identification, the Group has started to rank these risks so as to highlight the most salient risks for each of the purchasing categories and sectors. The risks will be ranked on the basis of recognised external sources and expert opinions, and in line with the following criteria:
the potential seriousness of the breach;
the potential extent of the breach (number of persons potentially affected, the geographic scope of the environmental impact);
the probability of its occurrence.
A geographic filter will then be applied and will enable the risk to be flagged up as being critical when the activity is based in a country that is considered(1) to pose a high risk of breach in respect of certain fundamental freedoms or human rights, or the environment.
In the first half of 2018, Societe Generale will have theoretical risk mapping showing, for each purchasing category and sector studied, the main risks of breach in respect of human rights, health, safety, security and the environment, which must then form the object of specific due diligence. Supplementary analyses will be carried out depending on the country of establishment or the main country of supply.
With regard to theoretical risks relating to purchasing categories, the mapping is developed in collaboration with three other French banks.
INHERENT RISK MAPPING
Once the mapping of the theoretical risks has been completed, an analysis of the inherent risks that are specific to Societe Generale will be carried out in light of the countries in which the Group is established (“Human Resources, Safety and Security”), its actual purchases and its countries of supply (“Sourcing”) and its activities (“Activities”), namely for:
the “Human Resources, Safety and Security” pillar: the mapping will highlight the risks applicable to employees in each geographic base of the Group;
the “Sourcing” pillar: the mapping will identify the purchasing categories representing the greatest risk in light of, in particular, the categories and countries of origin of the products or services;
the “Activities” pillar: a review will be carried out to identify dedicated types of Group products and services in the sectors/countries representing the greatest risk according to the theoretical risk mapping.
REGULAR EVALUATION PROCEDURES AND RISK PREVENTION AND MITIGATION ACTIONS
The Group now has an environmental and social (E&S) risk management framework on which to base its duty of care planning. This framework covers a wider scope than that defined within the framework of the Duty of Care Act. The risk management processes for suppliers may, for example, be extended beyond category 1.
With regard to products and services, cross-business E&S assessment systems for transactions and customers have also been developed. These systems will be reviewed as part of the duty of care planning in order to standardise, as far as possible, the risk management approaches.
EXISTING RISK EVALUATION AND PREVENTION SYSTEMS
“HUMAN RESOURCES, SAFETY AND SECURITY” PILLAR
Societe Generale has a human resources (HR) management policy, which it has developed over time to take account of the strategic priorities of the Group, the key challenges of the businesses and the transformation of its activities and its environment. Relying on a set of processes, the Group aims to safeguard the human rights and fundamental freedoms of its employees as well as the safety and security of persons on the organisation’s sites and of employees during business trips. The deployment of this policy at the level of the Group entities is based on:
HR governance at Group level and bodies engaged in social dialogue, which monitor working conditions and the freedom of association (in particular, the Group has signed an agreement with UNI Global Union) as well as the safety and security of persons, infrastructures and data;
governance ensuring the safety and security of persons, property, infrastructures and data, strengthened in 2017 by the creation of a Group Safety and Security Division;
(1) Countries in which human rights violations have been proven, countries which have not ratified fundamental conventions of the ILO, countries with inadequate social or environmental regulations or a lack of local control bodies. These data are drawn from external databases.

5
SOCIETE GENERALE IS IMPLEMENTING ITS CSR AMBITION
3 I 5CCORPORATE SOCIAL RESPPONSIBILITY
S O C I E T E G E N E R AL E G R O U P I 2018 REGISTRATION DOCUMENT I 267
local support teams (HR, logistics, safety and security officers, data protection officers, occupational health care, coaching on quality of life at work, local staff representatives, employment law teams, groups and networks focused on diversity, etc.);
systems for monitoring, training and intervention in relation to personal safety and security, including in particular in relation to expatriate employees and business travellers.
The deployment and results of this policy are evaluated on a regular basis by means of:
direct consultations of employees in respect of their satisfaction and their working conditions, via the Group Employee Satisfaction Survey and local surveys, followed up by action plans;
systems for evaluating the Group in terms of operational and compliance risks, which help to standardise HR, Safety and Security practices;
alert mechanisms in relation to ethical and human rights matters;
internal and external audits of the human resources policy and the standards for health, safety and security, which also result in the implementation of action plans adapted to the areas for improvement that have been identified.
Matters relating to the human resources, safety and security policy are described in detail on page 251, in the chapter “Health, safety, security and prevention”.
“SOURCING” PILLAR
In order to manage E&S risks at various stages of the purchasing process, the Group’s Sourcing Division has equipped itself with tools for its buyers. The purpose of these tools is to identify, assess and manage E&S risks, both at the level of the product or service purchased and at the level of the supplier or service provider. These tools are used for purchases made by the Sourcing Division in France or abroad.
The identification and assessment of risks by the Sourcing Division is based in particular on:
consultation of the E&S risk mapping in relation to purchasing categories;
incorporation of E&S criteria in calls for tenders, where appropriate;
performance of an E&S KYS (Know Your Supplier) assessment for shortlisted suppliers;
non-financial evaluation of certain targeted suppliers.
The management and mitigation of risks involves:
application of an E&S weighting to the rating criteria for offers of services or products;
inclusion of an E&S clause in contracts;
a contractual commitment to abiding by the Group’s Responsible Sourcing Charter;
and lastly, in the event of inadequate E&S performance:
– pushing of remedial action plans;
– possibility to carry out on-site E&S audits in respect of purchasing categories representing a risk;
– regular reviews of any controversies and changes in E&S ratings.
Additional information in relation to Sourcing is presented on page 270, in the chapter “2018 Positive Sourcing Programme, an instrument of change”.
“ACTIVITIES” PILLAR
Societe Generale is subject to a set of regulations (anti-money laundering regulations, compliance with embargoes, legislation personal data protection and on transparency, the fight against corruption and modernisation of the economy, etc.), which constitute the foundation for its risk management.
Beyond its regulatory obligations, the Group has been developing processes for management of the E&S risks associated with its activities for over ten years. These processes are based on both a normative framework of commitments and E&S standards, and the tools for their implementation.
All the Group’s E&S commitments are governed by the E&S General Guidelines, signed by the Chief Executive Officer. They include cross-sector and sector-specific E&S policies applied to certain sectors that are considered to be potentially sensitive from an environmental, social or ethical point of view. These policies describe, in particular, the main risks of harming the environment or the rights of local populations, and stipulate the criteria for evaluating customers or transactions carried out with parties in these sectors.
Tools for identifying and assessing E&S risks are deployed throughout the group and include in particular:
the identification of sectors/countries presenting a high risk in connection with E&S issues, aimed at ensuring that more in-depth due diligence is carried out on the corresponding sectors, projects or companies (updated quarterly);
the E&S exclusion list.
The E&S risk assessment procedures and management systems are described in detail on page 269, in the chapter “E&S procedures and tools”.
EXPECTED CHANGES AND OUTLOOK IN RESPECT OF EVALUATION PROCEDURES
The existing body of E&S risk assessment and management procedures will be reviewed at the end of the risk mapping exercise, which will have made it possible to identify any salient potential risks which are not covered or which are insufficiently covered by the existing management procedures and tools. The conclusions of this analysis will result in enhancements being made to certain risk management policies and systems, or to increased deployment efforts.
“Human Resources, Safety and Security” pillar: changes to the human resources, safety and security management processes as well as supplementary controls and training exercises will be implemented according to the conclusions of the analysis.
“Sourcing” pillar: the tools for identifying and assessing risks and, where applicable, those for controlling and mitigating risks will be updated and gradually rolled out.
“Activities” pillar: the E&S policies and risk management tools will be enhanced in order to gradually include other business sectors or other geographic sectors/countries. Their deployment will also be strengthened.
ALERT MECHANISM
The Duty of Care Act requires an alert mechanism to be put in place, just like the new Act on Transparency, the Fight against Corruption and Modernisation of the Economy (known as the Sapin II Act). The Group has therefore decided to strengthen the existing system by implementing a common alert mechanism (whistleblowing system) meeting the requirements of both of the aforementioned laws. It will be rolled out in 2018 and will be the subject of a consultation with the trade unions.

5 I 3
SOCIETE GENERALE IS IMPLEMENTING ITS CSR AMBITION CCORPORATE SOCIAL RESPPONSIBILITY
268 I 2018 REGISTRATION DOCUMENT I S O C I E T E G E N E R AL E G R O U P
It will make it possible, in particular, to collect alerts about the existence or materialisation of risks of breaches in respect of human rights, fundamental freedoms, the health, safety and security of persons, or the environment. It will be available to employees, external and temporary staff, subcontractors and suppliers and more generally to Societe Generale’s established business relationship partners. They will be able to raise an alert anonymously, and will have the guarantees of confidentiality and protection that are required by the Act on Transparency, the Fight against Corruption and Modernisation of the Economy.
SYSTEM FOR MONITORING MEASURES AND RESULTS
As part of its obligations in relation to non-financial communications and in order to monitor the deployment of E&S risk management processes, Societe Generale has developed several reporting tools. These tools provide the Human Resources, Safety and Security, Sourcing and Corporate Social Responsibility departments with performance monitoring indicators. A common system of non-financial reporting is used across the entire Group in order collect the information used for the non-financial reporting (see p. 261, “Responsibilities of the CSR Department”).
Furthermore, the system for monitoring the duty of care measures will be based on the compliance risk assessment tool, which will include E&S risk for the entire Group in 2018. This tool will enable Societe Generale:
to monitor the deployment of the E&S risk management processes;
to identify the possible areas for improvement and to monitor the associated action plans;
and lastly, to have new indicators for monitoring the results of the surveillance measures implemented for the Group, with a view to an initial communication in such respect in 2019.
Voluntary commitments
ENVIRONMENTAL AND SOCIAL (E&S) COMMITMENTS, INITIATIVES AND STANDARDS
ENVIRONMENTAL AND SOCIAL GENERAL GUIDELINES
Societe Generale is aware of the environmental, social and economic convergence challenges at play within its sphere of influence, and is determined to take them into consideration in its business practices. Over the last ten years or so, it has been gradually incorporating the assessment of E&S criteria into its credit and reputational risk management policies and processes.
In addition to its regulatory obligations, the Group has made many voluntary commitments in this area (see p. 256, “Societe Generale’s historic commitments”). These obligations and commitments are set out in the E&S General Guidelines and the related cross-sector and sector-specific policies. Signed by the Chief Executive Officer, they apply throughout the Group, and establish a reference framework for the E&S evaluation procedures. The Group’s E&S General Guidelines are available on its website. They are revised regularly to reflect developments in E&S challenges relating to the Group’s activities and its new commitments or regulatory requirements.
CROSS-SECTOR AND SECTOR-SPECIFIC E&S POLICIES
Societe Generale has specific policies for sectors that are considered potentially sensitive from an E&S or ethical point of view and in which the Group plays an active role. Energy and mining are covered by a number of sector-specific policies due to their importance for the economy and for the Group, their potentially significant impact in terms of atmospheric emissions (including greenhouse gas emissions) as well as their impact on the natural environment and local communities (dams and hydroelectric energy, power plants, coal-fired power plants, mines, civil nuclear power, and oil and gas). Several policies are also in place for farming and forestry sectors (agriculture, fishing and agrifood, forestry and palm oil). Defence and shipping are also covered.
Societe Generale has also implemented a special cross-sector policy on biodiversity, which applies to all Group banking and financial operations and involves procedures for reviewing dedicated transactions and customers. The E&S General Guidelines also list the UNESCO World Heritage Convention as one of the international conventions signed by the Bank. More generally, particular attention is paid to any areas identified as “key biodiversity areas”. The Equator Principles also include specific standards on biodiversity and several of the initiatives described in Societe Generale’s sector policies also relate to the protection of biodiversity.
Societe Generale’s E&S policies also reflect the Bank’s commitments to protecting human rights, particularly through sector-based initiatives integrating these issues. In 2017, the Group also made a public commitment to imposing stricter requirements, worldwide, in relation to respecting the rights of indigenous populations, in line with international standards.
New E&S commitments were also made by the Group in 2017 in the Oil and Gas sector. These commitments are detailed in the section covering the E&S challenges (see p. 272, “Societe Generale’s role in the fight against climate change”).
Developed by cross-business working groups within the Bank, the E&S policies were approved in 2017 by the Executive Committee. They detail the main E&S challenges and risks of the sectors covered, identify benchmark international standards for such sectors and propose an analytical framework applied to the evaluations of customers and of the subsequent dedicated transactions. As part of the Group’s commitment to ongoing improvement, sector monitoring makes it possible to assess the need to update existing policies.
The E&S policies are public and accessible on the Group’s website (http://www.societegenerale.com/en/measuring-our-performance/csr/responsible-finance).
EQUATOR PRINCIPLES
Adopted by the Group in 2007 and revised in 2013, the Equator Principles (EP) are one of the underlying initiatives of the E&S General Guidelines. Societe Generale has special internal procedures and tools for ensuring they are followed. The EP serve as a common framework for the financial sector to identify, assess and manage the E&S risks of projects for which the 92 international financial institutions that have joined the initiative (as of 1st January 2018) provide financing and advice.

5
SOCIETE GENERALE IS IMPLEMENTING ITS CSR AMBITION
3 I 5CCORPORATE SOCIAL RESPPONSIBILITY
S O C I E T E G E N E R AL E G R O U P I 2018 REGISTRATION DOCUMENT I 269
In 2015, the EP introduced new obligations in order to improve transparency on transactions financed by members of the EP association. Since then, Societe Generale has published a report each year on how it has been applying the initiative; such report is available via a dedicated space on its website (https://cib.societegenerale.com/en/who-are/corporate-social-responsibility/equator-principles/). It describes the way in which the principles are implemented and provides a list of the projects that fall within the scope of the EP and in which the Group has been involved.
In 2017, at the General Meeting of the Equator Principles Association, the Bank presented the methodology developed to align its financing portfolio for coal-related activities with the IEA’s 2°C scenario (see p. 272, “Societe Generale’s role in the fight against climate change”). Societe Generale has also been an active member of the “Designated Countries” Working Group, whose objective is, in particular, to propose changes to the framework for assessing risks associated with respecting the rights of indigenous populations.
SOFT COMMODITIES COMPACT The Soft Commodities Compact, which was devised by the Banking Environment Initiative (in conjunction with the Consumer Goods Forum), aims to mobilise the banking industry around the transformation of supply chains for agricultural commodities. The signatory banks undertake to help their main clients in the sector to achieve the objective of zero net deforestation by 2020.
Since joining the Soft Commodities Compact, Societe Generale has been a member of the Working Group of the Banking Environment Initiative, which has the objective of specifying the expectations in terms of monitoring clients’ performance in relation to the fight against deforestation.
The implementation of the Soft Commodities Compact is primarily based on the deployment of the Group’s sector policies concerning palm oil, forestry and agriculture. Furthermore, the corporate clients of Corporate and Investment Banking operating in the business sectors and regions concerned by the initiative have been specifically identified, and additional E&S analyses of these clients have been carried out in respect of their certifications and their non-deforestation objectives.
E&S PROCEDURES AND TOOLS The Group has adopted various procedures to implement its E&S commitments (E&S General Guidelines and policies and the Equator Principles). These procedures explain how to handle the E&S challenges associated with transactions or customers to whom the Bank provides banking and financial services. Initially only applicable to the activities of Corporate and Investment Banking, they are now being developed and gradually rolled out to cover all of the Group’s financing and investment activities. In addition to facilitating the identification, assessment and appropriate handling of potentially negative E&S impacts, these procedures also make it possible to identify transactions and clients having a positive impact in relation to sustainable development. This dual approach is what underpins positive impact finance (see p. 288, “A bank pioneering responsible finance”).
E&S WATCH LIST
In order to facilitate E&S risk management, an E&S watch list is compiled and updated quarterly by internal E&S experts. It lists any projects, companies or sectors/countries, irrespective of whether they are financed by Societe Generale, that are the subject of controversy or public campaigns on the part of civil society for E&S reasons. The purpose of this internal list is to alert the operational teams at an early stage in the process of reviewing clients and transactions in order to organise a more in-depth evaluation of the transactions and clients concerned.
E&S EXCLUSION LIST
As well as the E&S watch list, there is an E&S exclusion list, which is also updated every quarter. It contains companies that have been excluded under the Defence sector policy due to their involvement in the production, storage or sale of controversial weapons, especially anti-personnel mines or cluster bombs. It is the policy of Societe Generale to not knowingly supply banking or financial services to such companies, their parent companies or their subsidiaries. It can also be decided to exclude companies on a case-by-case basis, for example further to analyses prior to establishing a new relationship.
E&S EVALUATION PROCEDURES FOR TRANSACTIONS
The evaluation of the E&S risks and impacts of transactions constitutes the operational implementation of the Equator Principles (EP) within the scope covered by this initiative. Societe Generale has voluntarily expanded the scope of application of the EP to include a range of transactions that are likely to present E&S challenges, such as equity capital market transactions, debt capital market transactions, mergers and acquisitions, and acquisition financing. Even beyond this scope, any financial transaction entered into by Corporate and Investment Banking involves the identification of any E&S risks relating to the customer, other than financial institutions.
Within Corporate and Investment Banking, a dedicated team of E&S experts lends support to the sales managers when assessing and understanding the E&S impact of transactions and customers. In 2017, Societe Generale continued to roll out the E&S training programme. Around a hundred employees received training.
The main stages for the E&S assessment of transactions at the Bank are the identification stage, followed by the evaluation stage and the action stage.
Over 2017, a total of 97 dedicated transactions that underwent an E&S review were signed off by the Group. Of these transactions, 26 project loans, 5 project-related corporate loans and 14 advisory mandates relating to project financing fell within the scope of the Equator Principles. For the dedicated transactions that underwent an E&S review in 2017, total new funding within the EP scope amounted to EUR 3 billion, and EUR 2.4 billion fell outside the scope of the EP (Societe Generale’s voluntarily extended scope).
E&S EVALUATION PROCEDURES FOR CLIENTS
Corporate and Investment Banking has been conducting assessments of the E&S risk posed by its clients since 2010. It seeks to identify the E&S-related reputational risks arising from the sectors and the location of their activities or from controversies, then to evaluate, for the riskiest ones, the clients’ ability to manage these risks (CSR organisation, practices and maturity, management of E&S controversies and dialogue with stakeholders). The sales managers are involved in this process.
In some cases, where the E&S risks are significant, a dedicated Committee composed of the departments concerned meets in order to define the type of business relationship that is to be established (for instance, establishing a relationship with a prospect, imposing restrictions on an existing relationship or entering into a specific commitment with an existing client with the aim of convincing it to modify its E&S practices).
The scope of the identification of E&S-related reputational risk covers 17,750 clients in Corporate and Investment Banking. Around five per cent of these clients are considered to particularly represent a risk and undergo a more in-depth E&S evaluation by the team of experts.
5 I 3
SOCIETE GENERALE IS IMPLEMENTING ITS CSR AMBITION CCORPORATE SOCIAL RESPPONSIBILITY
270 I 2018 REGISTRATION DOCUMENT I S O C I E T E G E N E R AL E G R O U P
Societe Generale is also continuing to deploy measures for the E&S analysis of its clients in the Group’s other core businesses at the same time. The shared principles of E&S risk identification, assessment and management are reflected in operating procedures.
In French Retail Banking, the 2017 E&S analysis covered the 129 client groups reviewed by the entity in charge of monitoring key corporate clients within the French network, as well as the 178 client groups monitored in the business branches in Paris and La Défense. For just under 80% of these groups, no significant E&S-related reputational risk was identified. The remainder underwent a more in-depth E&S evaluation to clarify how well their CSR practices and commitments aligned with those of the Bank. In certain cases, this led to discussions with the company in question.
In 2017, deployment efforts also covered internal communications (including a dedicated online CSR section, accessible to all employees of the network) and training. Tools also evolved to facilitate the integration of the E&S evaluation framework, with the inclusion of a specific section in loan documentation.
Within the International Retail Banking and Financial Services network, the deployment of measures for E&S evaluation of corporate clients is also continuing.
In 2017, around fifty evaluations of clients identified as presenting an E&S risk were carried out by the corporate E&S and Compliance teams of International Retail Banking and Financial Services. In this regard, and particularly further to the Group’s commitments concerning coal, the clients involved in this sector also underwent specific due diligence. In some cases, these evaluations led to restrictions being placed on the business relationship, or even to some applications to establish new relationships being declined.
Permanent controls to verify the proper application of the normative framework, particularly of the E&S watch and exclusion lists and of the sector policies, have also been defined and are in the process of being integrated into the systems of the banking subsidiaries. Questions relating to E&S risks have also been added to loan application forms. In addition to the analyses carried out when establishing new relationships and the periodic reviews, E&S evaluations of clients have also been conducted when major transactions are involved.
The Group improves its E&S analysis methods regularly in order to better identify and evaluate the E&S impact, both negative and positive, of its clients’ activities.
THE 2018 POSITIVE SOURCING PROGRAMME, AN INSTRUMENT OF CHANGEIn 2017, the Group’s total purchases amounted to EUR 6.6 billion. By pursuing, since 2006, a responsible sourcing policy working towards the fulfilment of Societe Generale’s commitments in relation to contributing to economic and social development and limiting its environmental impact, the Sourcing function has shown itself to be a key player in achieving the Bank’s CSR ambition.
Deployment of the 2018 Positive Sourcing Programme
In 2016, a fourth three-year action plan was launched. Supporting the Group’s values, the 2018 Positive Sourcing Programme is structured around two ambitions:
improving CSR risk management during the sourcing process;
diversifying sourcing practices by helping to improve the Group’s regional and environmental footprint.
This programme follows on from the implementation of internal guidelines on “Responsible Sourcing Practices”, as appended to the Global Agreement on Fundamental Rights signed in June 2015 with UNI Global Union, demonstrating the Group’s intention to apply it across all its entities (see p. 242, “A responsible employer”).
In 2017, the roll-out of the programme to the Sourcing function on an international basis began.
IMPROVING PAYMENT TIMES FOR SUPPLIERS, AN ONGOING GOAL In 2014, the Group launched a project in which it committed to paying all supplier invoices within 30 days. In 2016, Societe Generale won the Prix des Délais de Paiement in the “Major Groups” category, presented by Emmanuel Macron, the then Minister for the Economy. In the course of 2017, Societe Generale made a new digital invoice platform available to its suppliers, which simplifies the invoice processing process. By the end of 2017, the bank had achieved an average payment time for invoices (weighted by value) of 43 days.
STRENGTHENING CSR RISK MANAGEMENT AT EACH STAGE OF THE SOURCING PROCESS
RISK IDENTIFICATION AND ASSESSMENT
CSR RISK MAPPING
In 2006, the Group defined its first system for mapping environmental and social risks, enabling each purchaser to assess the inherent CSR risks(1) of his or her purchasing categories. In 2017, a comprehensive revision of this mapping system was launched, in conjunction with a specialised consulting firm.
(1) “Inherent risk” means CSR risks specific to the products or services purchased, irrespective of Societe Generale’s activities. In other words, the inherent risks associated with a product or service are always the same, regardless of the purchaser of such product or service.

5
SOCIETE GENERALE IS IMPLEMENTING ITS CSR AMBITION
3 I 5CCORPORATE SOCIAL RESPPONSIBILITY
S O C I E T E G E N E R AL E G R O U P I 2018 REGISTRATION DOCUMENT I 271
KNOW YOUR SUPPLIER (KYS) ANALYSIS
By means of regular controls throughout the purchasing process, Category 1 suppliers, as well as their subcontractors where they account for more than 20% of the service provided, are evaluated in view of Societe Generale’s standards and international standards regarding management of operational, compliance and reputational risks (including environmental and social challenges).
NON-FINANCIAL EVALUATION OF SUPPLIERS
In addition to KYS due diligence, for a targeted scope of suppliers under contract, a non-financial evaluation of their environmental, social, business ethics and subcontracting performance by an independent third party is required.
RISK MANAGEMENT
INTEGRATION OF MANDATORY ENVIRONMENTAL AND SOCIAL CRITERIA INTO CALLS FOR TENDER AND APPLICATION OF A CSR WEIGHTING ON PRODUCTS OR SERVICES PURCHASED IN ELIGIBLE CATEGORIES
Based on the risk mapping, CSR criteria that are specific to each eligible purchasing category are integrated into most calls for tender managed by the Group Sourcing Department and are taken into account in the analysis of the tenders (this applied to 86% of the calls for tender during the last three quarters of 2017). Over the same period, the average weighting of the CSR criteria in calls for tender was 6.25%, varying between the 3% minimum required and up to 20%, depending on the sensitivity to CSR risks of the purchasing categories concerned.
SUSTAINABLE SOURCING CHARTER AND CSR CLAUSE IN CONTRACTS
Since April 2017, it has been policy for suppliers of the Sourcing function(1) to receive a copy of the Sustainable Sourcing Charter (https://www.societegenerale.com/sites/default/files/2017/03042017-Sustainable-Sourcing-Charter.pdf), a joint initiative by French companies in the “Banking and Insurance” sector(2) who want to associate their suppliers in the implementation of due diligence measures. The Charter sets out the Group’s CSR commitments, obligations and expectations vis-à-vis its suppliers, and has already been translated into five languages.
The CSR clause is included all standard contracts of the Sourcing Department in France. It refers to the Group’s Code of Conduct, the Sustainable Sourcing Charter and, for certain targeted suppliers, to the requirement for a non-financial evaluation. Its objective is to associate suppliers in the implementation of due diligence measures in relation to human rights, working conditions (health, safety and security), the environment and the fight against corruption.
COMPLIANCE ACTIONS
The Sourcing Department urges its suppliers to adopt a continuous improvement approach and invites those identified as being at risk to implement a remedial action plan. CSR audits may be conducted in advance or in addition. In 2017, the audit process was reviewed: a CSR audit and a progress plan have been launched.
INDIVIDUAL OBJECTIVES AND BUYER TRAINING
A “Sustainable Sourcing” module has been added to the in-house training given to all new members of the procurement team. 85% of buyers working in the Sourcing Department in 2017 had received CSR training.
In addition to regular exercises to raise awareness of sustainable development, the requirement to contribute to the Group’s CSR performance is also included in the job description and operational targets for buyers and team leaders.
MEASURING AND MONITORING THE PERFORMANCE OF THE MEASURES
In 2017, quarterly reporting on compliance with the CSR commitments and on the performance of the CSR risk management process was implemented among the operational teams of the French Sourcing Department.
DIVERSIFYING SOURCING PRACTICES WHILE HELPING TO IMPROVE THE GROUP’S REGIONAL AND ENVIRONMENTAL FOOTPRINT In line with the Group’s CSR ambition, the 2018 Positive Sourcing Programme is based on three priorities:
PRIORITY 1: CONTRIBUTING TO THE GROWTH OF VSBS AND SMES
Societe Generale, the first bank to sign the SME Pact in December 2007, facilitates access to the Group’s contracts for VSBs and SMEs and fosters mutual trust with all its suppliers. The target for the end of 2018 is to increase the volume of purchases from VSBs/SMEs by 20% compared to 2015. In 2017, Societe Generale continued to strengthen its commitment to innovative SMEs and organised its first SME Sourcing Forum, involving sixty SMEs. The 2017 satisfaction score of the VSBs/SMEs in the SME Pact’s supplier relations satisfaction survey was 77%.
PRIORITY 2: CONSOLIDATING ITSELF AS THE PARTNER OF CHOICE IN THE SOCIAL AND SOLIDARITY ECONOMY (SSE)
The aim for the end of 2018 is to double the volume of purchases made from SSE structures as compared to 2015, increasing it to EUR 10 million a year (the SSE sector covers the disabled and protected workers’ sectors as well as back-to-work schemes and positive impact companies).
PRIORITY 3: SUPPORTING THE GROUP’S CLIMATE 2020 INITIATIVE
In line with the Group’s objectives to reduce its CO2 emissions per occupant by 25% by 2020 (compared to 2014) the Sourcing Department helps to systematically seek out innovative products and services with high environmental added value. This will particularly involve the development of Green IT, and improvements in building energy efficiency and the environmental performance of the products and services purchased.
(1) This comprises 21 countries. (2) As at 1st April 2017 the signatories were: Allianz, CNP Assurances, Crédit Agricole SA, Natixis and Societe Generale. The updated list of the Signatories
to the Charter, as well as the Charter itself, are available on the website of each of the signatories.

5 I 3
SOCIETE GENERALE IS IMPLEMENTING ITS CSR AMBITION CCORPORATE SOCIAL RESPPONSIBILITY
272 I 2018 REGISTRATION DOCUMENT I S O C I E T E G E N E R AL E G R O U P
DASHBOARD OF THE POSITIVE SOURCING PROGRAMME The progress achieved in sustainable sourcing as a result of the Positive Sourcing Programme is measured using indicators. After 2016, which was a year of transition marked by the creation of the Positive Sourcing Programme and the development of new tools, 2017 saw their gradual implementation.
Please refer to page 293, “Appendices”, for all indicators.
Additional information about the sustainable sourcing policy is available on the Group’s website, at: https://www.societegenerale.com/en/workingtogether/suppliers/sustainable_sourcing_practice.
SOCIETE GENERALE’S ROLE IN THE FIGHT AGAINST CLIMATE CHANGE In 2017, Societe Generale supported the recommendations of the Task Force on Climate-related Financial Disclosure (TCFD). In such context, this section strives to follow the presentation structure recommended by the TCFD for greater transparency (climate strategy, climate governance, management of risks associated with climate change, indicators and targets).
Climate strategy In 2015, the Conference of the Parties held in Paris (COP 21) marked a turning point: significant progress was made at diplomatic level with the adoption of the Paris Agreement, a universal agreement applying to all signatory States, individually committed by means of national action plans. This agreement, aimed at limiting the global temperature rise to 2°C or even 1.5°C, officially fixed an irreversibility threshold which must not be exceeded and introduced, for the first time, strong pressure on the economy with a set time limit. Civil society as a whole was heavily involved and played a role in the success, including the financial and banking sector, which made commitments for the first time on this occasion to protect the climate. Indeed, once the threshold and the time limit had been fixed by the signatory States, companies, including Societe Generale, were then able to fix their own ambitions.
On the occasion of the COP 21 in December 2015, Societe Generale made the commitment to strive to put the Bank’s action on course to achieve the scenario defined by the International Energy Agency, whereby global warming will be limited to 2°C by 2020. With this commitment, the Group aims to implement, by 2020, governance, risk management, financial, measurement and monitoring tools to enable it to respond in the most appropriate way to the transformation that is taking place though the decarbonisation of the economy. Accordingly, our climate strategy is organised around two lines of action:
the development of energy transition financing in order to support clients in their low-carbon investments;
the implementation of a system for managing climate change-related risks.
The development of energy transition financing will make it possible to mobilise all the Bank’s financing activities in seeking opportunities and in guiding clients towards a decarbonised economy via new financial products and services or partnerships that will help to facilitate green financing. In order to support the development of this line of action, the Group made the commitment in 2015 to double project funding and to mobilise up to EUR 10 billion in funding in the renewable energy sector by 2020. In December 2017, on the occasion of the One Planet Summit held in Paris, the Bank also decided to strengthen its financial commitment by specifying how it is going to fulfil this
commitment in respect of Africa, where addressing climate challenges and development are key to achieving the aims of the Paris Agreement. Consequently, the Group has set itself the objective of helping to raise EUR 100 billion in financing earmarked for energy transition between 2016 and 2020: it will make a contribution, in the form of advice and financing, of around EUR 15 billion to the renewable energy sector – in which the Bank is among the world leaders – and intends to lead (or co-lead) the issue of green bonds for a nominal amount of around EUR 85 billion over the period. Societe Generale undertakes to issue regular reports on the amounts raised.
On the back of its extensive historical presence in 19 countries in Africa, Societe Generale is committed to being a driving force vis-à-vis the players in the private and public sectors in relation to the development of a low-carbon policy, particularly as regards energy infrastructures, which are essential for the sustainable economic growth of these countries. (see p. 280, “Contribution to Africa’s sustainable development”).
In November 2017, the Head of Global Finance, a member of the Group’s Management Committee, was made responsible for overseeing management of the range of sustainable finance and positive impact products (see p. 288, “Sustainable and positive impact finance, a consolidated global offering”).
The implementation of a system for managing climate change-related risks aims to set up internal processes for the governance, measurement, control and monitoring of risks and opportunities related to climate change. Risks associated with climate change take the form of physical risks related to extreme and cumulative phenomena due to the increase in the global average temperature as well as to transition risks further to changes in environmental regulations or of the depreciation of stock market assets. Risks associated with climate change are not a new risk category, but rather an aggravating factor for the types of risks included in the risk management system (particularly credit and operational risks and risk related to insurance activities). The Risk Division and the CSR Department seek to improve and strengthen the identification, measurement and monitoring processes related to the challenges of the fight against climate change.
Moreover, the Group has, for the past ten years or so, adopted a framework for the management of social and environmental risks, including risks associated with climate change. Such framework was formalised in 2010 in the Bank’s General Environmental and Social Guidelines and supplemented by 12 cross-sector and sector-specific E&S policies, which contribute to the management of transition risk (see p. 268, “Environmental and social (E&S) commitments, initiatives and standards”). The commitments made by the Bank since COP 21 have strengthened the requirements for some of these policies (see p. 268, “Cross-sector and sector-specific E&S policies”).

5
SOCIETE GENERALE IS IMPLEMENTING ITS CSR AMBITION
3 I 5CCORPORATE SOCIAL RESPPONSIBILITY
S O C I E T E G E N E R AL E G R O U P I 2018 REGISTRATION DOCUMENT I 273
Governance In 2017, climate change-related risks were integrated into the risk mapping that was presented to the Board of Directors, as well as into the Group’s risk appetite strategy. The CSR policy, which includes the climate strategy, is monitored annually.
Following a specific request by the Board of Directors concerning the climate, in July 2016, the first Group Risk Committee meeting in relation to the management of climate change-related risks, chaired by General Management, was held in January 2017.
Since then, Group Risk Committee meetings in relation to climate change-related risks have been held on an annual basis. The Risk Division and the CSR Department work together to implement all processes.
Since November 2017, the CSR Department has attended and expressed its opinion in Group Risk Committee meetings for sectors that are sensitive to CSR and climate challenges.
Since the climate is one of the major priorities of the CSR ambition, it has been the subject of presentations on various occasions and at various levels of governance (see p. 261, “Responsibilities of the CSR Department”).
Furthermore, five years ago the Bank implemented an internal carbon tax incentive scheme. The tax is levied on the basis of each Group entity’s emissions (EUR 10/tonne of CO2) and the amounts collected are then redistributed to finance internal environmental efficiency initiatives thanks to the Environmental Efficiency Awards. This scheme shows that environmental measures also represent value-creation and innovation opportunities for Societe Generale.
Development of energy transition financing Societe Generale is aware of the role played by economic actors in the transition to a lower carbon economy and intends to be a key player in the energy transition. Strengthened by its presence in 67 countries, the Group actively contributes to the development of the many markets in which it operates. It supports governmental and private sector efforts to transition to a low-carbon economy by targeting (1) the diversification of sources of energy production with increased funding for the renewable energy sector; (2) the reduction of its clients’ energy consumption; and (3) the increase of its energy transition and climate change adaptation efforts in developing countries, particularly in Africa, where Societe Generale has a strong presence, and attracting investors for these projects.
GREEN FINANCING In 2017, overall, the recorded amount of green financing supplied by Societe Generale to private and public sector undertakings and to individuals (energy infrastructures, all forms of renewable energy production, waste and recycling, public transport projects, alternative fuels, clean vehicles, green real estate) was just under EUR 2.9 billion.
RENEWABLE ENERGY FINANCING
Corporate and Investment Banking has extensive experience in the environmental and renewable energy sector. With a global presence and acknowledged sector expertise (in energy, oil and gas, reserve-based finance, etc.), the Bank has been continuously supporting its customers in the development of
these fields for over ten years. Societe Generale pursues a proactive policy in the renewable energy sector (solar, wind and biomass energy, etc.), which in 2017 took the form of the strengthening of its 2015 commitment to renewable energies, as given on the occasion of COP 21 (see above), and a dynamic financing activity resulting in a total of 36 renewable energy transactions over the year (see p. 277, “Indicators and targets”). The development of a consolidated “Sustainable and Positive Impact Finance” product range within the businesses of Global Banking and Investor Solutions will help to reach these objectives (see p. 288, “Sustainable and positive impact finance, a consolidated global offering”). Among the most significant transactions, the following are of note:
financing for Coopers Gap Wind Farm, the largest wind farm in Australia with a capacity of 453 MW, which will make it possible to supply power to 260,000 households and to save 1,180,000 tonnes of CO2 a year;
financing for a 280 MW offshore wind farm located in the North Sea off the German coast (DEUTSCHE BUCHT) to the tune of EUR 1.3 billion. This wind farm will make it possible to supply power to 412,000 households and to save 700,000 tonnes of CO2 a year;
financing for a 50 MW solar park in Australia (Kidston PV Solar Farm) amounting to AUD 100 million, which will make it possible to supply power to 26,000 households and to save 120,000 tonnes of CO2 a year.
Group subsidiaries abroad are also present in the sector. Internationally, Societe Generale helps local authorities, private individuals and companies to develop in a way that preserves the local ecosystem. These international financing deals can benefit from guarantees and advantageous conditions thanks to partnership agreements signed with international financial institutions (IFIs) and refinancing lines dedicated to energy efficiency or renewable energies. For example, in 2017:
Samsung C&T Corporation appointed Societe Generale Expressbank in Bulgaria as the mandated lead arranger, hedging coordinator and bookrunner in connection with a syndicated loan of EUR 53 million for the refinancing of seven photovoltaic power plants. Located in Bulgaria, these installations have a total capacity of 43 MW. Furthermore, Societe Generale Expressbank contributed to the financing of the “Desiree Gas” programme supported by the Bulgarian Ministry of Energy and the EBRD, enabling subsidies to be granted to private individuals who are customers of gas distributors and opt to replace diesel oil, coal or wood with natural gas;
In Italy, Fiditalia (consumer credit) supports the photovoltaic sector and provided financing amounting to EUR 36.6 million in loans for systems and installations related to the production of electricity from solar energy. In the Czech Republic, ESSOX (consumer credit) offers loans to private individuals who want to install solar panels;
In the United Kingdom, Societe Generale Equipment Finance (SGEF) has been providing financing solutions since 2010 for numerous clean and renewable energy systems: solar panels for schools and industrial buildings, LED lighting for warehouses, schools and hospitals, biomass boilers for public institutions and many farm buildings as well as cogeneration systems for major energy centres in the public and private sectors;

5 I 3
SOCIETE GENERALE IS IMPLEMENTING ITS CSR AMBITION CCORPORATE SOCIAL RESPPONSIBILITY
274 I 2018 REGISTRATION DOCUMENT I S O C I E T E G E N E R AL E G R O U P
In 2017, Société Générale de Banques en Côte d’Ivoire (SGBCI) financed a project to provide access to the off-grid energy of the joint venture ZECI, created as a result of the pooling of expertise between EDF International and Off Grid Electric (OGE), in order to meet the demand for electricity of populations not covered by the electricity grid in Côte d’Ivoire. The synergy between the various financial skills of the Societe Generale teams, with the prospect of being able to integrate YUP into the target sales strategy, and the competitiveness of SGBCI’s range of products and services facilitated the launch of phase 1, which enabled the rollout of around 5,195 domestic solar kits at the end of August 2017, with the goal being to reach 15,000 kits by the end of May 2018 (see p. 280, “Contribution to Africa’s sustainable development”).
ENERGY EFFICIENCY FINANCING
Energy efficient financing by the Bank represents EUR 653 million, including the following:
the International Finance Corporation, part of the World Bank Group, provided USD 60 million to assist SG Equipment Finance in expanding its clients’ access to energy-efficient equipment. This financing will help Brazilian companies to replace their obsolete machinery, equipment and vehicles with energy-efficient technologies. By making these technologies more accessible, this investment will make it possible to reduce greenhouse gas emissions by 220,000 CO2 equivalent tonnes a year;
in Poland, Eurobank launched an “eco-loan” in December 2017, intended to offer advantages for households wishing to finance environmental efficiency projects;
in its French banking networks, Societe Generale also offers financing aimed at improving energy efficiency. The Group granted interest-free eco-loans, sustainable development loans and Expresso sustainable development loans representing a total of nearly EUR 18 million in 2017.
GREEN MOBILITY FINANCING
Green mobility financing by the Group was significant in 2017. The following cases were amongst the most significant transactions:
In January 2018, Corporate and Investment Banking closed the EUR 235 million refinancing of Eiffage Rail Express, under the BPL (Brittany-Pays de la Loire) high-speed rail public-private partnership for the 182 km high-speed rail link between Le Mans and Rennes. The line will significantly improve the efficiency and regularity of the transport system in the region whilst reducing the travelling time between Paris and Rennes by 37 minutes on average;
Societe Generale acted as lead arranger in the financing, amounting to EUR 142.6 million, for the acquisition of the Honfleur ferry operated by Brittany Ferries, which included a tranche of EUR 49.5 million fully guaranteed by the European Investment Bank (EIB). The Honfleur is the first vessel to be powered by liquefied natural gas and is scheduled to be commissioned in April 2019 on the route between Caen-Ouistreham (France) and Portsmouth (United Kingdom). Societe Generale’s commitment to financing alternative solutions is demonstrated by its pioneering involvement in the first transaction of the Green Shipping Guarantee (GSG) programme recently established by the European Union. The European Investment Bank’s EUR 750 million programme had been implemented with Societe Generale in 2016;
In Italy, Fiditalia (consumer credit), through its partnership with TESLA, financed more than 230 TESLA electric vehicles (amounting to EUR 19.3 m
contributed EUR 13 million to financing for public transport in the Czech Republic, particularly buses;
Since September 2012, a preferential “clean vehicle” scale has been available within the French Retail Banking network for clients who wish to finance the purchase of new or second-hand electric or hybrid vehicles by a consumer loan. In 2017, Expresso loans for the purchase of new or second-hand clean vehicles amounted to EUR 41.7 million;
Sogecap, Societe Generale’s insurance subsidiary, has implemented a permanent 5% discount on insurance premiums for policyholders with vehicles emitting less than 120 grams of CO2/km, regardless of the package selected (“clean vehicle” policy) and a 10% discount on insurance premiums for policyholders who drive less than 6,000 km/year (“infrequent driver” policy). As at the end of 2017, “infrequent driver” policies accounted for 33% of Sogecap’s portfolio, up 2 points compared to 2015, and “clean vehicle” policies accounted for 22%, up 4 points on 2016.
Its subsidiary ALD AUTOMOTIVE, a specialist in operational leasing and vehicle fleet management, also aims to play a role as a responsible vendor. To this end ALD identifies mobility solutions with the objective of reducing the environmental footprint of its fleet.
Electric vehicles are gradually taking their place in company fleets, but their introduction requires a comprehensive solution in the form of a charging infrastructure network. This offering is combined under the “ALD electric” label in France and has given rise to new partnerships with specialists in the sector (G2Mobility, Engie, Eneco and Enel in various European countries).
New services related to the responsible use of vehicles are emerging, such as the “ALD ecodrive” application, programmes for making drivers more aware of road safety and, more generally, the “ALD profleet” on-board telematics product, which enables the optimisation of journeys and vehicle use.
WASTE MANAGEMENT AND CIRCULAR ECONOMY FINANCING
Societe Generale also contributes to the development of a circular economy. In 2017, three projects stood out in terms of waste recycling:
In September, the Group closed a EUR 82 million financing deal for a waste-to-energy recycling unit in Troyes. This plant, which will have the capacity to process 60,000 tonnes of waste per year from 2020, will generate up to 38,000 MWh of heat for households in Grand Troyes as well as 22,000 MWh of heat for nearby factories and 41,000 MWh of electricity, which will be resold to the urban distribution network;
Societe Generale contributed to the financing of waste-to-energy recycling plants in France and the rest of the world, offering not only an alternative to conventional waste processing, but also a genuine source of energy production;
The Bank also helped to finance the modernisation of a waste-to-energy recycling plant with a capacity of 12,000 tonnes per year on the French island of Saint Barthélemy in the Caribbean. The plant, which is operated by Tiru (a subsidiary of EDF), processes all the island’s waste. The steam from the combustion of the waste powers a seawater desalination plant that produces up to 75% of the island’s drinking water, a valuable resource during the peak tourist season.

5
SOCIETE GENERALE IS IMPLEMENTING ITS CSR AMBITION
3 I 5CCORPORATE SOCIAL RESPPONSIBILITY
S O C I E T E G E N E R AL E G R O U P I 2018 REGISTRATION DOCUMENT I 275
PARTNERSHIPS WITH INTERNATIONAL FINANCIAL INSTITUTIONS (IFIS) In keeping with its global strategy, in the other countries in which it operates the Group strives to forge and develop partnerships with international financial institutions (the French Development Agency – AFD, the European Bank for Reconstruction and Development – EBRD, the European Investment Bank – EIB, the World Bank, etc.) in order to propose joint financing and development aid solutions for local companies and economic players (co-financing, guarantees, risk sharing, etc.). The Export Finance functions of Corporate and Investment Banking contribute to the development of Africa by funding the necessary equipment for urgently-needed infrastructures: hospitals, electricity generation and transportation systems, water distribution systems, sustainable cities, roads, etc. (see p. 280, “Supported by partnerships with international financial institutions”). In 2017, France Overseas subsidiaries financed several installations of solar panels for companies and individuals (French Polynesia, Réunion, New Caledonia).
In Africa, Societe Generale’s establishments in Senegal, Côte d’Ivoire and Benin have signed SUNREF-AFD agreements enabling them to offer their customers or prospects with projects meeting the eligibility criteria – in addition to financing – specific technical assistance by the local SUNREF-AFD contact to support them in the various phases of their renewable energy or energy transition projects; it also enables the provision of technical support to the Bank during the compilation the loan documentation (process launched in Benin for customers or prospects in the mass retail or hotel industries; in Côte d’Ivoire for a clinic and a customer operating in the waste sector). In Côte d’Ivoire, a EUR 30 million (CFA 20 billion) credit facility has been granted. Thanks to this SUNREF UEMOA (West African Economic and Monetary Union) programme, SGBCI has explicitly included a facility in its range of services called GREEN CREDIT, an investment credit line (CMT) with a preferential rate of interest targeting large caps and SMEs in the private sector.
In Moldova, thanks to the financing agreements signed with the EBRD in connection with the European programmes MoSEFF (Moldovan Sustainable Energy Financing Facility), dedicated to companies, and MoREFF (Moldovan Residential Energy Efficiency Financing Facility), dedicated to individuals, Mobiasbanca assists companies and households with financing for their energy efficiency or renewable energy projects. Thanks to these facilities, customers benefit from advantageous borrowing conditions as well as subsidies from the EU of up to 20% of the amount borrowed, in addition to technical expertise provided by the EBRD’s consultants. The most recent facility granted was for EUR 4.4 million.
Partnership agreements signed with the international financial institutions and dedicated to supporting the energy transition and energies represented EUR 80.5 million in 2017 in Europe and Russia.
DEVELOPMENT OF GREEN BONDS The Group is keen to contribute to the development of “green bonds” enabling the financing of projects and acquisitions in renewable energy and energy efficiency, thereby participating in the fight against climate change by bringing the Group’s structuring and bond distribution solutions to the table, combined with its long-standing expertise in ESG management.
In 2017, Societe Generale contributed to the issue of 27 green bonds and was positioned in third place in Europe and seventh place worldwide (for all currencies combined) at the end of 2017.
Among the most significant transactions, on 24th January 2017 the French Republic issued its first sovereign green bond, for a record raise of EUR 7 billion with a maturity of 22 years, thus becoming the first country in the world to issue a sovereign green benchmark bond, in terms of both size and maturity. This green bond will finance a number of projects, including green buildings, green transport and renewable energies, as well as adaptation, pollution control and energy efficiency projects.
The Group also assisted the Industrial and Commercial Bank of China (ICBC) in the issue of certified green bonds for an amount of USD 2.1 billion, issued in three tranches of EUR 1.1 billion, USD 450 million and USD 400 million with maturities at 3 and 5 years. This was the largest single tranche of euro-denominated green bonds to have been issued by a Chinese issuer. The revenues will be used exclusively for financing and refinancing renewable energies, low-carbon emission transport, energy efficiency projects and sustainable water and waste water management projects.
In addition, Societe Generale supported a large number of issuers operating in this green or social bond market for the first time, notably the first German corporate green bond issuer, Innogy, and Cassa Depositi e Prestiti in Italy in respect of its first social bond issue.
Management of climate change-related risks The management of risks associated with climate change requires firstly that these risks be identified.
IDENTIFICATION OF THE RISKS Several tools and processes are in place for identifying the risk factors associated with climate change:
evaluation of the carbon footprint of the Bank’s balance sheet commitments: Article 173 of the French Energy Transition for Green Growth Act requires significant greenhouse gas emissions generated by the company’s businesses, particularly as a result of use of the goods and services that it produces, to be reported.
In connection with its corporate finance business (indirect emissions), a method for evaluating greenhouse gas emissions relating to the Bank’s balance sheet commitments(1) has been put in place at the level of Societe Generale to make it possible to identify the sectors with the highest carbon levels(2). This method takes a global approach using official data from international organisations, such as the United Nations and the OECD, and enables the Bank to determine, based on the climate challenges facing the macro-sectors (e.g. transport, energy, industry, etc.), the proportion of the emissions corresponding to the commitments undertaken by the Bank.
(1) Portfolio of companies by EAD – Exposure At Default – as defined under Basel 2 (“Measure of credit exposure (EAD)”, see p. 191, “Credit risk exposure”).
(2) This is the P9XCA method. Societe Generale has updated and adjusted its variables, notably the geographic and sector breakdown.

5 I 3
SOCIETE GENERALE IS IMPLEMENTING ITS CSR AMBITION CCORPORATE SOCIAL RESPPONSIBILITY
276 I 2018 REGISTRATION DOCUMENT I S O C I E T E G E N E R AL E G R O U P
It does not include greenhouse gas emissions related to financing for individuals. It gives a snapshot, at any given time, of the emissions financed, and hence acts as a “diagnosis” that can be used to define the Bank’s priorities for action in terms of the climate by means of a ranking of the macro-sectors according to their carbon intensity, thereby providing a basis for development of a more microscopic analysis and more focused monitoring of its priority sectors;
macro-sector analyses and stress tests including climate risk factors;
implementation of the recommendations of the TCFD with UNEP-FI: Societe Generale has joined the UNEP-FI initiative along with 15 other banks. The objective of this initiative is to respond to the challenges of implementing some of the TCFD’s recommendations(1) regarding the impact of three separate climate scenarios (1.5°C, 2°C and 4°C, between 2020 and 2040);
inclusion of the risks associated with climate change in the sensitivity analysis when mapping the Bank’s risks;
Sogecap has, pursuant to Article 173(VI) of the French Energy Transition for Green Growth Act, integrated ESG criteria into its investment policy and is assessing the carbon footprint of its portfolios.
MANAGEMENT OF CLIMATE CHANGE-RELATED RISKS Risks associated with climate change are managed through the ongoing analysis of the credit risk (macro-economic analyses and analysis of the project and/or client), by sector policies (particularly in the coal, oil and gas sectors) and through the management of emissions from proprietary activities. This section describes the three aspects of climate change-related risk management.
ONGOING CREDIT RISK MANAGEMENT
In ongoing credit risk management, climate change-related risk is integrated into the macro-economic and macro-sector analyses carried out bi-annually, as well as into the individual credit risk analyses for the countries and sectors with the greatest exposure.
These newly integrated elements make it possible to get a better understanding of the climate governance factors in the BUs. For example, at the level of ALD Automotive, climate change-related risk is monitored indirectly through vehicles’ estimated residual values. The objective of the existing governance of residual value risks, involving reviews by a committee twice yearly and periodic financial re-evaluation of the fleet, is to anticipate changes in the market and to adapt the pricing policy and financial management accordingly. Similarly, the quantitative changes in sales across the various types of powertrain were also closely monitored within the Group’s operational governance bodies (COMEX).
The Group is currently working on identifying – via the models it is developing – risk factors in relation to both transition risks and physical risks, which will then be integrated into the decision-making processes. The work carried out within the scope of the UNEP-FI will be incorporated into the internal models.
RISK MANAGEMENT BY SECTOR POLICIES
In order to set things in motion, the commitment to align with the 2°C global warming trajectory is being gradually implemented across certain business sectors that the Bank supports through its financing portfolio and other services according to priorities that have been identified by the risk management tools and the Risk Division. The energy sector plays a central role due to its significant production of greenhouse gas emissions and its position at the heart of the economy. This is the case for the coal, oil and gas sectors in particular:
Coal-fired power plant and mining policies: in 2015, Societe Generale made a commitment to reduce its coal-related activities in order to align itself, by 2020, with the IEA’s 2°C scenario, by:
– reducing outstanding credit (exposure) related to coal mining by 14% between 2016 and 2020;
– limiting the proportion of installed capacity for coal-fired power plants in the energy mix financed by the Bank to 19% by 2020 (see p. 277, “Indicators and targets”).
The Group has not participated in any dedicated financing for coal-fired power plants or associated infrastructures anywhere in the world since 1st January 2017. Furthermore, it has not been involved in any dedicated financing for the development of coal mines and associated infrastructures since 2015. In addition, specific criteria for establishing new relationships with companies that operate in the coal sector have been defined.
Oil and gas policy: in December 2017, Societe Generale committed to solely financing those activities in the oil and gas sector that have a mitigated impact on the climate. In particular, the Group will no longer finance activities relating to the production of oil from oil sands anywhere in the world or to the production of oil in the Arctic. It will make its support for companies in the oil and gas sector conditional upon the implementation of (or a commitment to implement) measures to limit continuous flaring and methane emissions. Lastly, the Group will make its support for companies using fracking techniques conditional upon the implementation of (or a commitment to implement) best E&S practices, in line with the IEA’s Golden Rules. Regular reports on the E&S performance of the oil and gas portfolio will be made public in order to communicate on the Group’s fulfilment of these commitments.
Forestry policy: since 2016, Societe Generale has been compliant with its commitments under the Soft Commodities Compact of the Banking Environment Initiative and the Consumer Goods Forum, which aims to achieve zero net deforestation of tropical rainforests by 2020 (see p. 269, “Soft Commodities Compact”). Protecting forests through sustainable management and maintaining primary forests help to both mitigate climate change and preserve biodiversity.
(1) The finance ministers and the governors of the central banks of the G20 have asked the Financial Stability Board (FSB) to examine how the financial sector can take climate-related issues into account. The FSB has set up a working group (TCFD) to develop recommendations on the disclosure of information concerning the exposure of private sector companies to climate change-related risks.
The recommendations of the TCFD that are specifically for banks are accessible via this link: TCFD (2017) Implementing the Recommendations of the Task Force on Climate-related Financial Disclosures, pp. 23-27: https://www.fsb-tcfd.org/wp-
content/uploads/2017/12/FINAL-TCFD-Annex-Amended-121517.pdf
*

5
SOCIETE GENERALE IS IMPLEMENTING ITS CSR AMBITION
3 I 5CCORPORATE SOCIAL RESPPONSIBILITY
S O C I E T E G E N E R AL E G R O U P I 2018 REGISTRATION DOCUMENT I 277
MANAGEMENT OF EMISSIONS FROM PROPRIETARY ACTIVITIES
The management of our own business establishments helps to prevent the physical risks associated with climate change within our operational risk management framework. The Group carries out an annual campaign in relation to its proprietary activities (operating emissions) to collect all environmental data relating to energy consumption in its buildings and by its IT infrastructure (including hosted data centres), business trips, goods transport (mail, company shop, transport of funds, etc.), paper consumption (office use and paper for customer communications), waste produced and water consumption. Environmental actions and programmes are conducted in order to reduce the Group’s carbon footprint (see “Indicators and targets” below and p. 278 “Reducing the Group’s carbon footprint”).
Indicators and targets Societe Generale has made a commitment to strive to put the Bank’s action on course to achieve the IEA’s scenario whereby global warming is limited to 2°C by 2020. Through a range of management tools developed in 2016, and which is still being added to as part of a progress-driven approach, Societe Generale defines the priorities for the climate strategy’s two lines of action. These tools provide an overall framework for managing the Bank’s impact on both financing (indirect emissions) and assets held (proprietary activities). Based on this framework, specific actions and procedures are put in place or strengthened.
MONITORING THE CARBON FOOTPRINT OF THE GROUP’S BALANCE SHEET COMMITMENTS In the context of its financing activity for companies (indirect emissions), the Group has for the past two years been evaluating the carbon footprint of its balance sheet commitments. Thus, the transport and energy sectors are the most significant macro-sectors (representing 76% the carbon footprint of the Group’s balance sheet commitments). Actions have already been conducted in the energy sector (end of financing for coal and coal-fired power plants, development of financing for renewable energies, new commitments pertaining to the oil and gas sector, etc.) as well as in the transport sector (e.g. in financing of the maritime sector and monitoring of credit risk in the automotive sector via a stress test and the integration of a CSR outlook analysis within the sector-specific analysis).
MONITORING COMMITMENTS IN RELATION TO COAL AND THE ELECTRICITY MIX FINANCED BY THE GROUP Societe Generale has developed a methodology for ensuring a downward trend in its credit exposure to the coal sector that is compatible with achievement of the mix expected by 2020 under the IEA’s 2°C scenario (2015). The scenarios relating to primary energy production and installed capacity for electricity production have been used to set the Bank’s objectives:
reduction of outstanding credit (exposure) related to coal mining by 14% between 2016 and 2020. The outstanding credit monitored includes both credit associated with financed projects and the relevant proportion of credit that is not dedicated to customers operating in the coal mining sector;
limitation of the proportion of installed capacity for coal-fired power plants in the energy mix financed by the Bank to 19% by 2020.
The Group’s electricity mix was arrived at by considering both transactions dedicated to generating electricity from an identified energy source and loans that are not dedicated to customers operating in the electricity generation sector (outstanding credit). In 2017, Societe Generale strengthened its methodology by integrating, in particular, consistency checks (on the data reported and their consolidation). The monitoring and management of adherence to the limits defined in terms of financing for activities related to coal mining and electricity generation are carried out on a bi-annual basis. The results are provided to General Management and taken into account by the Risk Committees for the sectors concerned.
As at mid-2017, the monitoring of the projected debt for 2020 showed that the Group is on track to meet its commitments at that date, both in relation to the proportion of coal in the electricity mix financed and in relation to the reduction of financing for coal mining. As at mid-2017, coal represented 22.4% of the electricity mix financed by the Group (equivalent MW).
As at mid-2017, the proportion of renewable energies in the electricity mix financed by the Group represented 46.4%.
** Data expressed as a MW-equivalent percentage as at 30th June 2017
REDUCTION IN GREENHOUSE GAS EMISSIONS FROM THE GROUP’S PROPRIETARY ACTIVITIES In the context of its proprietary activities, Societe Generale has decided to accelerate its 2014-2020 carbon reduction programme and set a higher target in such respect at the One Planet Summit, i.e. a 25% reduction in its greenhouse gas emissions per occupant (versus the 20% target set in 2015). The monitoring indicator is greenhouse gas emissions in CO2 equivalent tonnes per occupant. Energy consumption, which accounts for 68% of the Group’s carbon footprint on proprietary activities, is also monitored in kWh per occupant or per m2. In accordance with the commitment it made in 2015, the Group integrated waste within its carbon footprint in 2017, which represents 2.18 CO2 equivalent tonnes per occupant.
22.4%
1.6%
29.6%6.2%
7.3%
32.9%
EElectricty mix financed by SSociete Generale**
Coal
Oil
Gas
Nuclear
Hydro
Renewables

5 I 3
SOCIETE GENERALE IS IMPLEMENTING ITS CSR AMBITION CCORPORATE SOCIAL RESPPONSIBILITY
278 I 2018 REGISTRATION DOCUMENT I S O C I E T E G E N E R AL E G R O U P
General eenvironmental policy
Units
Ref. year 2014
2016
2017
Targets 2014 -- 2020
Change 2014 -- 2017
Total energy consumption per occupant
KWh
5,939
5,323
5,009
-220%
-115,7%
Proportion of green electricity in total energy consumption %
9,4%
21,0%
25,4%
Climate change
Greenhouse gas emissions per occupant
CO22 eeq T
2.52
2.29
2.18
-225%
-113,3%
INCREASING ENERGY TRANSITION FINANCING Societe Generale has set itself the objective of helping to raise EUR 100 billion in financing for energy transition between 2016 and 2020. As at the end of 2017, the total amount raised was EUR 38.65 billion and breaks down as follows:
for advice and financing: a contribution of EUR 8.3 billion to the renewable energies sector (out of EUR 15 billion in commitments);
as the lead or co-lead issuer: issues of green bonds for a nominal amount of EUR 30.4 billion (out of EUR 85 billion in commitments).
Reducing the Group’s carbon footprint Over the last 5 years:
THE GROUP’S CARBON PLAN
The Bank also generates environmental impacts through its business activities. Aware of its responsibility in this respect, Societe Generale continues to apply its environmental policy to its proprietary activities; such policy involves the control and improvement of its direct impact on the environment, in association with its various stakeholders (see p. 277, “Reduction in greenhouse gas emissions from the Group’s proprietary activities”).
INTERNAL CARBON TAX
Over the past five years, internal carbon tax revenues have been allocated to 240 initiatives in 27 participating countries over four continents, achieving the following benefits for an average allocation of EUR 3.1 million per year:
recurring savings of EUR 95 million in overheads;
more than 38,000 tonnes of CO2 avoided over the past five years (i.e. nearly 2.3% of the Group’ s emissions over five years);
220 GWh of energy saved over the past five years (i.e. 5.3% of the Group’s total energy consumption over five years).
For its part, the Sourcing Division plays a significant role in the Group’s CSR ambition, and is committed to reducing the environmental footprint of the Bank’s purchases (see p. 270, “Strengthening CSR risk management at each stage of the sourcing process”).
This has led to genuine enthusiasm among employees, and the Bank is keen to share the programme with its peers and the organisations with which it is involved (EpE (Enterprises for the Environment), ORSE (French Study Centre for Corporate Social Responsibility), Global Compact) so that the initiative can be adopted elsewhere.
MEASURES TAKEN TO IMPROVE ENVIRONMENTAL EFFICIENCY
REAL ESTATE
REDUCTION IN ENERGY CONSUMPTION
With floor space of over 4 million m2 in 2017, the Group has made a commitment to continually enhance the energy performance of its buildings by implementing an environmental strategy for its building stock. To this end, one of the objectives it has set is a 20% improvement in the energy performance of the Group’s buildings (excluding branches) by 2020 in comparison to 2014. In 2017, the energy performance per occupant had improved by 15.7% compared to 2014, with a reduction of over 11.5% in the total energy consumption of the buildings compared to 2014.
As part of the ISO 50001 certification for the 19 corporate centre buildings, obtained in December 2015, an “energy policy” has been defined and implemented. This policy aims to:
satisfy the legal and regulatory requirements pertaining to buildings;
optimise the energy and environmental performance of buildings owned by Societe Generale, as part of the Group’s continuing efforts to ensure the comfort of its buildings’ occupants;
capitalise on the real estate market opportunities and current context to occupy the buildings best suited to the development of the company’s core business values (reliability, business continuity) and to the occupants’ expectations in terms of comfort, health, accessibility and services.
The Group’s real estate environmental policy is based on the implementation of real-time management tools (GREEN, ODE) in respect of energy and water consumption and waste production in all its establishments’ buildings (deployed in France, Asia, the United States, the United Kingdom, Luxembourg, etc.).
In 2017, Sogeprom, Societe Generale’s property development subsidiary, continued to develop the real estate of the future with the construction of WAP, in northern France – the first French tertiary sector building with a wooden structure. With a floor area of 2,500 m2, it enables annual savings of 62.8 MWh, equivalent to 3,767 kg of CO2.

5
SOCIETE GENERALE IS IMPLEMENTING ITS CSR AMBITION
3 I 5CCORPORATE SOCIAL RESPPONSIBILITY
S O C I E T E G E N E R AL E G R O U P I 2018 REGISTRATION DOCUMENT I 279
In addition, at COP 23, Sogeprom beat 17 other international candidates to take the Green Solution Award in the Smart Building category, for the renovation of the Ampère e+ office building at la Défense. The latter is Sogeprom’s new headquarters and is the first office building in France to have been designed in accordance with the principles of both environmental ethics and the circular economy.
Alongside these achievements, the use of renewable energies increased by just under 18% in 2017 compared to 2016, thanks to the production of renewable energy in the Group’s buildings (solar panels and methanisation in some company cafeterias) and to the consumption of green electricity.
REDUCTION IN WATER CONSUMPTION
The Group’s water consumption was 1.8 million m3 in 2017, down 9% compared to 2014. In the Group’s buildings, water management is handled in conjunction with energy management and is monitored in real time. It is supplemented by consumption-cutting measures (motion detectors, replacement of evaporative air-conditioning units, etc.).
MASS CATERING AND COMBATING WASTAGE
Particular attention is paid to the environment and to combating food wastage, in collaboration with the caterers at Societe Generale’s main buildings in Île-de-France. Hence, most of the catering services are provided on site on a just-in-time basis, with a growing proportion being offered on a self-service basis, so that consumers can adjust portion sizes themselves. Management of use-by dates for pre-prepared products is also optimised. In the majority of cafeterias, the remaining waste is sorted and methanised.
WASTE MANAGEMENT AND CIRCULAR ECONOMY
By recycling waste, Societe Generale strives to minimise its direct impact on the environment. At Group level, waste production is estimated at 15,000 tonnes in 2017, down 17% year-on-year.
To meet the target of the 2014-2020 carbon reduction programme, a range of measures to improve waste management exist within the Group. In 2017 the deployment of selective waste collection at seven sites in France enabled more than 400 tonnes of waste to be saved, which is equivalent to 44 tonnes of CO2. Greenhouse gas emissions from waste are now included in the Group’s carbon footprint, in scope 3 (see p. 293, “Note on Methodology”). Another noteworthy example is the initiative by Societe Generale Securities Services in Nantes, which, in addition to sorting, recycling and composting its waste, has set up a virtuous circle, whereby the compost produced is given to an organic farmer from whom the caterer purchases some of its supplies.
IT INFRASTRUCTURE
Societe Generale’s IT Division has set itself the objective of reducing the energy consumption of its IT stock by 4% a year in line with the Group’s commitment. The 2017 initiatives helped save 6.2 GWh/year in energy, i.e. a 4.3% drop in CO2 emissions.
In general, particular emphasis has been placed on electricity consumption, collaboration with the Sourcing Division, and management of the Green IT requirement in projects and international development. The projects are categorised according to three factors: “CSR driver” (CSR is one of the project’s initiating factors), “contributes to CSR” (impact resulting in a CSR profit & loss report), and “does not contribute to CSR”. Regarding international development, governance has been established with the most significant entities (in Bangalore, the United States and Asia firstly) to monitor and put forward CSR initiatives in line with the Group’s CSR ambition.
The governance in place, involving a contact person dedicated to environmental matters at the centre of the process for each project, combined with a major campaign to raise awareness of environmental issues amongst project holders, enables the particularly early identification of projects that could lead to environmental gains.
Efforts to reduce the environmental footprint of the Group’ s IT stock continued in 2017 with the roll-out of cloud solutions, the promotion of BYOD (Bring Your Own Device, in this case smartphones), wider use of pull printing and the replacement of obsolete equipment by eco-friendly equipment, whilst taking the overall environmental impact of the latter into account.
TRANSPORT
Societe Generale has long since implemented measures to reduce the environmental impact of personal and business travel as well as of the transportation of goods.
BUSINESS TRAVEL
Societe Generale employees travelled 524 million km by train, aeroplane and car in 2017, representing 3,438 km per occupant. The Group has thus achieved a 2.2% reduction in travel per occupant compared to 2016.
Since 2012, the Sourcing Division, in collaboration with Societe Generale entities in France, has endeavoured to reduce the Bank’s carbon footprint by referencing the vehicles with the lowest emissions on the market. At the end of 2017, its fleet comprised 68 electric vehicles, versus 52 in 2016, and 124 charging stations had been supplied by the Group’s referenced service provider.
COMMUTING AND TELECOMMUTING
Targeted measures are deployed to promote alternative solutions to the individual use of vehicles. At Societe Generale Head Office, a carpooling platform and a car-sharing service have been set up.
Measures have also been implemented in the subsidiaries: in particular, CGI and ALD International have made bicycles and e-bikes available to their employees (30 bicycles as at the end of 2017 for CGI), which are used for commuting as well as for certain business trips.
Starting from 2017, ALD Automotive France has been allowing its employees to replace use of a company car with a combustion engine by that of an electric vehicle. Employees choosing to do so benefit from an additional 60 days’ short-term rental. The ten vehicles currently in use have enabled savings of 5,244 litres of fuel and 16 tonnes of CO2. In parallel, ALD Automotive France has also developed and made available to its 561 employees a commuter carpooling app, called ALD Community.
Lastly, a growing number of Group entities are trialling telecommuting, with over 15,000 individuals telecommuting worldwide, which is equivalent to 780 tonnes of avoided carbon emissions (versus 520 tonnes for 10,000 individuals in 2016 (see p. 245, “A responsible employer”/ “New ways of working and more agile organisations”).
PAPER
Paper, which is the top consumable used by service businesses, represents a significant economic challenge and a sensitive environmental issue (waste management, fight against climate change and pollution).

5 I 3
SOCIETE GENERALE IS IMPLEMENTING ITS CSR AMBITION CCORPORATE SOCIAL RESPPONSIBILITY
280 I 2018 REGISTRATION DOCUMENT I S O C I E T E G E N E R AL E G R O U P
It is a constant concern for the Group, and an increasing number of initiatives are being implemented to rationalise total consumption, which stood at 13,349 tonnes in 2017 (down 7% on 2016). The downward trend in paper consumption that began in 2007 continued: in 2017, it was 86 kg per occupant for all kinds of paper combined (for office use and for customer communications), i.e. 9% less than in 2016.
The progress achieved is the result of various measures implemented Group-wide, such as good use of printers, conversion of paper materials to digital materials and use of recycled paper. In 2017, Societe Generale provided its
employees in France with an electronic safe to securely store their digital payslips, thereby saving 6 tonnes of paper.
Furthermore, as part of its commitments towards the environment, Societe Generale sits on the Board of Directors of Ecofolio and also, since September 2017, the Board of CITEO, an eco-organisation resulting from the merger between Eco-emballages and Ecofolio and which promotes the circular economy.
Please refer to page 293, “Appendices”, for all quantitative indicators.
CONTRIBUTION TO AFRICA’S SUSTAINABLE DEVELOPMENT
A commitment rooted in history The historic and significant presence of Societe Generale in Africa prompts it to elect to play a special role in supporting the continent’s development and in helping it to become more integrated on the world stage. Present in 19 countries (six of them for more than 100 years), Societe Generale is now one of the two major international banks operating in both retail banking and global banking throughout the continent, from North Africa to the sub-Saharan region, with 4 million clients, of which nearly 150,000 are companies. Africa is one of the most dynamic growth areas amongst the regions in which the Group operates.
Loan outstandings in Africa (Mediterranean Basin and sub-Saharan Africa) amounted to EUR 16 billion at end-2017, up 5.3% on 2016.
Africa is also the continent with the greatest need for a business outlook integrating the UN’s 17 Sustainable Development Goals (SDGs) (see p. 260, “Societe Generale is contributing to the SDGs”).
As a result, the sustainable development of Africa has been made a differentiating line of action in Societe Generale’s CSR ambition, which is based on the following development levers:
presence amongst all the African players (retail banking, SMEs and global banking (large caps, public sector players and financial institutions and multilateral organisations));
partnerships with various international and local financial players;
close cross-sector business relationships with major international industrial players working towards Africa’s development;
more than 12,000 employees on the ground, of which 135 have become managers with high leadership potential, nurtured in the context of a Pan African Valley Community;
strong momentum in innovation, underpinned by three regional innovation labs (in Dakar, Tunis and Casablanca);
expertise across all international structuring activities, working on projects together with local experts.
The Group is thus committed to being a key driving force vis-à-vis the players in the private and public sector by striving to promote sustainable and positive impact projects: development of low-carbon investments, particularly in relation to energy infrastructures, which are essential for the sustainable economic
growth of these countries (see p. 272, “Societe Generale’s role in the fight against climate change”), development of banking products and services that are accessible to vulnerable populations – an activity that is rooted in the Bank’s historic commitments alongside local and international partners such as microfinance institutions and impact funds (see p. 284, “A focus on populations that are vulnerable/have low exposure to banking services”), support for local and/or international SMEs whose business on the continent is growing, and follow-up on major infrastructure investment projects. It targets sustainable and positive impact development designed in a collaborative and inclusive framework.
This dynamic is based on a strong commitment by the employees on the ground: December 2017 marked the official launch of the SAFARI (Societe Generale African Rise) project, a pan-African consultation project bringing together 12,150 employees throughout Africa, which the aim of working together to define Societe Generale’s strategy in Africa for the next ten years. A strategic and ambitious continent-wide initiative, the SAFARI project aims to commit the Group to establishing its development strategy for Africa, as well as for its products, business models, markets, territories and operational model.
Supported by partnerships with international financial institutions (IFIs) In keeping with its global strategy, in the other countries in which it operates, the Group strives to forge and develop partnerships with international financial institutions in order to propose joint financing and development aid solutions for local companies and economic players (see also p. 275, “Partnerships with international financial institutions (IFIs)).
The Bank has been the primary partner of the ARIZ risk-sharing programme since the programme’s inception. This mechanism, which was created by the AFD in 2008, rounds off the range of solutions facilitating the granting of bank loans to very small, small and medium-sized companies. This cooperation between the AFD and the Group for the benefit of African SMEs was renewed in July 2017 by the signing of a new partnership agreement under the ARIZ programme and covers all Societe Generale International Retail Banking subsidiaries.
Together, over the past ten years, the AFD and Societe Generale have helped more than 1,250 African companies with their development projects thanks to over EUR 500 million in financing

5
SOCIETE GENERALE IS IMPLEMENTING ITS CSR AMBITION
3 I 5CCORPORATE SOCIAL RESPPONSIBILITY
S O C I E T E G E N E R AL E G R O U P I 2018 REGISTRATION DOCUMENT I 281
guaranteed by ARIZ. As at the end of June 2017, 457 ARIZ guarantee authorisations had been granted to the Bank (434 individual guarantees and 23 portfolio guarantees). This partnership represents a total amount of EUR 278 million in signed guarantees given (of which EUR 219 million in individual guarantees and EUR 80 million in portfolio guarantees), making Societe Generale the main beneficiary of the ARIZ guarantees, with 12 subsidiaries actively using them. This scheme is also used to support microfinance institutions that are clients of the Group.
In many cases the cooperation between the AFD and Societe Generale has facilitated access to financing for particularly complex or ambitious projects. This was the case, for example, in Madagascar, where BFV-SG, the Bank’s Malagasy subsidiary, was able to finance local operators in the aquaculture sector, such as UNIMA, and thus work towards achieving sustainable aquaculture.
Favouring an innovative model, tailored to the most disadvantaged populations in retail banking Projects related to the retail banking business in Africa essentially concern financial inclusion, with the objective of becoming a leader in alternative banking in Africa. By way of example, in addition to the microfinance and positive impact investment commitments, presented below and on page 275, “Microfinance commitments”, various other innovative projects have also been launched:
in Côte d’Ivoire and in Senegal, following the rollout of YUP, Societe Generale’s electronic mobile money solution officially launched in September 2017, 73,000 electronic wallets were opened and just under 2,000 distribution agents signed up. The next launches of YUP are planned for Ghana, Cameroon, Burkina Faso, Guinea, Mozambique, Madagascar, Togo and Benin, before being extended to the entire African network (see p. 275, “Partnerships with international financial institutions (IFIs)”).
Societe Generale Morocco launched an online banking platform in 2017: Bankaty (“my bank” in Arabic). This new generation service is specifically directed at young people, young professionals and Moroccans living abroad, and is intended to make interactions between the bank and its customers easier and quicker thanks to digitalised and remote access.
Then, in October 2017, Societe Generale Morocco officialised the launch of Dar Al Amane, the new Moroccan participative bank “by Societe Generale”, which aims to establish a separate network of dedicated branches and is a financial inclusion initiative. Eight branches have been opened in the country since Dar Al Amane’s launch, with a target of 15 branches by the end of 2018.
In Senegal, Manko – a wholly-owned subsidiary of Societe Generale that operates as a banking transactions intermediary to support financial inclusion – has been offering banking products and services to populations that are either unbanked or under-banked, without access to the traditional banking system, since 2013. Manko’s model is based on a mobile sales force, equipped with scooters and tablets, and processes that are now completely digitalised. Manko has 3 branches, 75 employees and 10,000 active customers, and granted 5,725 loans in 2017 amounting to the equivalent of EUR 27 million.
Full collaboration with microfinance institutions (MFIs) On the African continent, as at the end of 2017, the Group’s African subsidiaries had 19 MFI clients and a rapidly growing amount in commitments, totalling EUR 71.3 million (versus EUR 37.8 million in 2016).
The traditional refinancing deals for such institutions have been supplemented by acquisitions of equity holdings in microfinance institutions: through its African subsidiaries, Societe Generale holds stakes in five MFIs, subsidiaries of internationally recognised microfinance groups; these minority, but active, interests in Advans Cameroon, Advans Ghana, Advans Côte d’Ivoire, AccèsBanque Madagascar and ACEP Burkina facilitate the development of synergies and complementarity in terms of the financial solutions that can be provided to their respective client bases, such as, for example, the co-development of financial services or gateways facilitating access to services (transfers or international payment transfers, cashing of cheques, co-branded cards and access to Societe Generale ATMs (automated teller machines) in Cameroon and Côte d’Ivoire, sharing of branches in Côte d’Ivoire and sharing of sector expertise.
A focus on the development of local SMEs Entrepreneurship is one of the cornerstones of development of the African continent. Inclusive and sustainable growth depends on the dynamism of small and medium-sized enterprises. It is therefore essential to encourage investments and financing of these SMEs and VSBs, whether in the formal or informal sector, as well as to remove obstacles to business creation. This ambition requires the mobilisation and joint efforts of all players in the public and private sectors.
As at the end of 2016, Societe Generale had invested EUR 13.5 million in the French-African Fund (FFA), making the bank the fund’s joint second largest shareholder along with BPI France et Proparco. The fund, managed by AfricInvest, aims to support French SMEs that wish to develop in Africa as well as fast-growing African SMEs. In December 2017, the fund approved investments in two French SMEs and ten African SMEs.
In addition, at the beginning of 2017, Societe Generale and Investisseurs & Partenaires (I&P – the pioneer of impact investment dedicated to financing start-up or growing SMEs in Africa) confirmed that they wanted to strengthen their partnership and use their shared non-financial values and objectives to promote the region and support African companies in their quest for economic and ESG performance. The first collaboration with I&P was launched in 2015, when Societe Generale in Burkina Faso acquired an equity interest in the Sinergi Burkina fund. In 2017, the local and corporate centre teams of Societe Generale and I&P collaborated closely to bring about the acquisition by Societe Generale in Senegal of a EUR 600,000 stake in the local fund Teranga Capital, and the creation of the pan-African fund IPAE2 with a EUR 2.5 million equity interest held by Societe Generale SA; IPAE2’s objective is to invest EUR 85 million over the next five years in 40-50 in start-ups and SMEs in sub-Saharan Africa and the Indian Ocean region. Further investments by the African subsidiaries in new local funds raised by I&P are also underway.

5 I 3
SOCIETE GENERALE IS IMPLEMENTING ITS CSR AMBITION CCORPORATE SOCIAL RESPPONSIBILITY
282 I 2018 REGISTRATION DOCUMENT I S O C I E T E G E N E R AL E G R O U P
Without forgetting the vital importance of major infrastructure projects Africa’s sustainable development also involves the implementation of major infrastructure projects. The Export Finance functions of Corporate and Investment Banking have made a significant contribution to funding the necessary equipment for infrastructures such as hospitals, electricity production and transportation systems, water distribution systems, sustainable cities, roads, etc.:
in order to leverage these structuring skills, the Africa Division has been setting up regional structured financing platforms since 2016: the task of the regional SFG (Structured Finance Group) is to develop structured financing within the Societe Generale network. In Africa, it currently has two platforms of expertise: one in Casablanca, with 18 experts responsible for North Africa, and a second one, which is more recent but is set to grow, based in Abidjan and covering all of sub-Saharan Africa. The infrastructure and energy sectors are key to sustainable development, and represent areas on which the teams are particularly focused. The Structured Finance Group aims to become a major player in the transformation that has is underway on the African continent, supported by partners, including development finance institutions (DFIs);
electricity generation in Africa is essentially based on fossil fuels, but the transition towards renewable energies is gaining ground. Societe Generale wants to participate in
this transition and enable Africa to benefit from its expertise in project structuring in this area. A number of projects in this field were structured in 2017, particularly in the solar sector in North and West Africa (see p 280, “Supported by partnerships with international financial institutions”);
in 2017, Societe Generale also arranged or contributed to financing representing a total amount of EUR 1.2 billion in Africa, particularly in Kenya (construction of an irrigation dam, preliminary work for construction of the sustainable town of Konza), in Angola, in Senegal (construction of hospitals in various regions), and in Egypt (electric substations and transmission lines, wind electricity generation).
Based on the firm belief that collaborative support between historic industrial partners and innovative start-ups is vital to the development of sustainable infrastructures, in 2017 the Group launched an innovation lab – an incubator for African start-ups – based in Dakar.
The objective of all these measures is to be open to collaborative undertakings with financial and/or industrial players, start-ups and/or historic players, with a view to jointly developing action plans promoting Africa’s sustainable development in a wide-scale dissemination of Societe Generale’s ESG commitments. Aligning the Bank’s expertise with the relationship networks developed with its partners will allow the Bank to make an active contribution to bringing about the development that is at the heart of the Group’s strategy and that is to be aligned with the 17 SDGs.
SUPPORTING MAJOR SOCIETAL CHANGES AND THE ECONOMIC DEVELOPMENT OF THE TERRITORIES Mindful of the expectations of its stakeholders, Societe Generale is developing activities with a positive impact on society, by focusing on inclusion and by paying special attention to societal trends and innovation. New, more environment-friendly technologies and the sharing of data are supporting the emergence of new economic models. Investors, companies, individuals and all the Bank’s customers are increasingly mindful of and eager to implement solutions addressing social and environmental issues.
Moreover, important opportunities for business development are emerging along with the growth of sustainable cities and new mobility models.
A major commitment to companies (VSBs, SMEs and professionals)
IN FRANCE Societe Generale is a key global player in the world of business and entrepreneurship. At the end of October 2017, its customer base comprised 92,000 large and medium-sized companies and 245,000 very small businesses (VSBs) and professionals. The Group is committed to providing regional support to artisans, entrepreneurs and enterprises of every size throughout their life and business cycle. This business presence can be seen through:
LOCAL PRESENCE
The Bank has significantly boosted its support for companies and entrepreneurs in terms of local networks and access to business expertise. The overall level of satisfaction with Societe Generale among SMEs confirms the momentum generated over the past few years. As proof, nearly nine out of ten corporate clients rate Societe Generale’s teams as “proficient and knowledgeable”(1) and the same proportion feel they enjoy a personalised relationship when they are in contact with their client relationship manager(2) (see p. 262, “Customer satisfaction and protection”).
The objective of the new “Societe Generale Entrepreneurs” sales strategy is to make Societe Generale THE reference bank for entrepreneurs. With this offering, the Bank provides owner-managers with a range of services and solutions specifically geared to addressing strategic issues, by pooling expertise from Retail Banking, Corporate and Investment Banking, Private Banking and the Real Estate Division and making it available under one roof in regional centres of excellence. This comprehensive and integrated package enables entrepreneurs to receive better support at every key stage of the development and transfer of ownership of their business.
(1) 2017 Competitive satisfaction survey. Survey carried out among 3,000 banking relationship managers within SMEs by the CSA Institute. (2) 2017 competitive satisfaction survey (CSA Institute) and 2017 Societe Generale satisfaction survey (GN Research Institute).

5
SOCIETE GENERALE IS IMPLEMENTING ITS CSR AMBITION
3 I 5CCORPORATE SOCIAL RESPPONSIBILITY
S O C I E T E G E N E R AL E G R O U P I 2018 REGISTRATION DOCUMENT I 283
In 2017, Societe Generale made changes to its sales strategy for professional clients in order to better meet their specific needs and new expectations. Professional clients now enjoy comprehensive support with two expert advisors at their disposal: one for their professional life and the other for their private life, as was already the case for corporate clients. In particular, the Bank provides professional clients with expert advisors who are devoted to self-employed professions, with 106 branches having areas that are exclusively dedicated to them and 450 having “self-service” areas that are accessible over extended hours.
SUPPORT FOR THE INTERNATIONAL DEVELOPMENT OF SMES
Committed to financing and supporting businesses on an international basis, Societe Generale draws on its expertise, its international network and its network of correspondent banks to support its corporate clients in 67 countries.
Franfinance, a Group subsidiary specialising in consumer loans, plays a key role in the development of its corporate client base, which consists mainly of VSBs, professionals and SMEs. This role was reinforced in 2016 with the launch of the COSME programme(1), in partnership with the EIF(2). The objective of this programme is to facilitate access to financing for microenterprises, VSBs and SMEs, enabling them to make their investment projects a reality. Franfinance undertakes to significantly increase its exposure to categories of business that are deemed to be riskier; in return, the EIF gives it a guarantee that partially covers the risks it has accepted with respect to these clients. In 2017, this agreement enabled Franfinance to provide 4,353 cases of funding coupled with a COSME guarantee. There have now been 5,803 cases of funding under the agreement since it was launched in April 2016, amounting to EUR 150 million in total.
Societe Generale also helps its professional clients to expand beyond their national borders, since international expansion is a key opportunity for this type of customer in general, and for artisans and very small businesses in particular. In France, 30% of exporters are craft businesses, representing 10% of all French exports, i.e. EUR 4 billion a year.
SUPPORT FOR START-UPS
At the end of November 2017, Societe Generale had entered into relationships with 19,664 companies set up in France within the previous year. The addition of these new relationships means that Societe Generale is now supporting a total of 56,938 new companies (less than three years old), of which 20,533 have existed for less than a year.
The Bank is a member of the national Initiative France association and a partner of 92 of its local platforms. These platforms have enabled the start-up or takeover of 7,408 companies, which themselves created or maintained 19,107 direct jobs during their first year. In addition to loans on trust (interest-free, unsecured loans) granted by the 224 Initiative France platforms, the Bank awarded 804 loans amounting to EUR 51 million to entrepreneurs that had been approved by the association in 2016 (figures reported by Initiative France in 2017 in its activity report).
Through the renewal of partnerships with credit guarantee institutions, for example with SIAGI(3) in March 2014 and with Bpifrance in June 2015, Societe Generale also facilitates access to credit for entrepreneurs creating or taking over companies.
In view of its commitments to professionals, artisans and traders, Societe Generale is continuing its partnership with TUDIGO (formerly Bulb in Town)(4), a crowdfunding platform, with the shared goal of facilitating the emergence of new projects and supporting innovation and the local economy. Challenges are launched to generate financial backing for projects on a “reward-based” (gift-for-a-gift), “close to home” basis, in order to encourage and develop entrepreneurship in the region.
A FOCUS ON START-UPS
In 2017, Societe Generale launched a scheme for start-ups with several focal points, including a partnership with Bpifrance for the purpose of strengthening the relationship between the two networks, and the appointment of 150 start-up advisors throughout the country.
A PRESENCE AMONG SOLIDARITY-BASED COMPANIES, DEVELOPED IN THE FORM OF A PARTNERSHIP
In January 2016, Societe Generale and France Active, the leading financier of solidarity-based companies, signed an agreement on facilitating access to bank financing for very small businesses (VSBs) and solidarity-based companies. Thanks to the support of the 42 regional funds of the France Active network, which are distributed across metropolitan France, entrepreneurs optimise their chances of success in their projects. From emergence of the project through to its development, the Societe Generale and France Active teams help entrepreneurs with their financial problems and provide them with the most suitable financing for their needs.
IN EUROPE Societe Generale’s commitment to SMEs in Europe (16 entities in 13 countries) and Russia (3 entities) is strong. Financing all the economic players, including small entrepreneurs and local companies, is the core business of these entities: whether directly or via partnerships, they develop specific support programmes for SMEs. As at the end of December 2017, Societe Generale had 102,695 SME clients in Europe (versus 101,667 in 2016), whereas it had 81,149 SME clients in Russia (versus 76,574 in 2016).
The following initiatives are a few examples of this support:
in Albania, SGAL teamed up with the European Bank for Reconstruction and Development (EBRD) to promote access to financing for farmers and agricultural enterprises by freeing up EUR 60 million worth of credit lines for professionals and enterprises in the agricultural sector (https://www.econostrum.info/Societe-Generale-Albania-va-financer-le-developpement-agricole-en-Albanie_a22702.html);
(1) COSME: 2014-2020 Programme for the Competitiveness of Enterprises and SMEs. (2) EIF: European Investment Fund, a subsidiary of the European Investment Bank. (3) Established in 1966 by the Chambers of Trades and Crafts, SIAGI is involved in the crafts and local activities sectors. It guarantees credit facilities
granted by all the banking institutions in the marketplace. (4) TUDIGO (formerly Bulb in Town) is a crowdfunding platform that supports projects by raising donations, backing in exchange for products or services,
and investment.

5 I 3
SOCIETE GENERALE IS IMPLEMENTING ITS CSR AMBITION CCORPORATE SOCIAL RESPPONSIBILITY
284 I 2018 REGISTRATION DOCUMENT I S O C I E T E G E N E R AL E G R O U P
in Bulgaria, the European Investment Fund (EIF) signed a guarantee agreement with SG Expressbank in January 2017 aiming to facilitate and support the financing of SMEs in the country (https://seenews.com/news/eif-signs-guarantee-deal-with-societe-generales-bulgarian-arm-to-back-smes-553677);
In Romania, the European Investment Fund and BRD entered into a partnership deal to expand the range of financing products and services for SMEs in the country. This partnership aims to distribute EUR 31 million in financing. It is the third partnership of this kind between the EIF and BRD (in 2004 and 2013 – see https://seenews.com/news/eif-romanias-brd-sign-partnership-deal-on-sme-financing-580695). At the same time, BRD created a platform called EUNAT to identify SMEs which are eligible for dedicated financing by the European Investment Fund;
in the Czech Republic, in March 2017 the European Investment Bank (EIB) granted a EUR 100 million loan to Kfor Youth” initiative for SMEs and mid-caps whose employees are under 30 years of age, with the aim of making it easier for Czech SMEs and mid-caps to have access to long-term financing under favourable terms (http://www.eib.org/infocentre/press/releases/all/2017/2017-089-eib-teams-up-with-kb-to-battle-youth-unemployment-climate-change.htm);
In Russia, Rosbank is working with the Federal Corporation for the Development of SMEs in order to facilitate and reduce the cost of financing for SMEs. As a result, 10 SMEs have benefited from financing under this programme (entitled Programme 6.5) totalling around EUR 7.7 million.
In 2017, the value of the partnership deals signed with international financial institutions in Europe and Russia was EUR 1.6 billion, whereby 78.5% of the lines are specifically dedicated and used for the development of SMEs and 5% of the lines are dedicated to backing energy and the energy transition (EUR 80.5 million).
IN AFRICA The Group’s sensitivity to the development of SMEs in Africa is described in detail on page 281, “Contribution to Africa’s sustainable development”/“A focus on the development of local SMEs”.
A significant presence in the financing of the public economy and the non-profit sector
FINANCING OF THE PUBLIC ECONOMY For more than 30 years now, Societe Generale has been contributing to the financing of the public sector, thereby funding public interest investments by sovereign entities, local authorities, social housing associations, public institutions, and semi-public development and services companies. As at 31st December 2017, the Group’s short-, medium- and long-term commitments across these markets amounted to EUR 15.7 billion.
More recently, the Group has been innovating through a cross-sector sales strategy, which is dedicated exclusively to the scope of Greater Paris and aims to align all its skills to meet the credit, advice and service needs among all its clients who are public and private players participating in this major nationwide project (see p. 287, “Adapting the Group’s products and services to the development of sustainable cities”).
The Group complies with the Gissler Charter (a charter on good conduct between banking institutions and local authorities) in its dealings with public authorities.
FINANCING OF THE NON-PROFIT SECTOR IN FRANCE The non-profit sector plays an important part in the French economy and society due to:
the services provided in various highly professionalised sectors, such as catering to the needs of people with disabilities, back-to-work programmes and education initiatives;
the jobs that they generate.
For many years Societe Generale has cultivated close relationships with non-profit associations, thanks to its networks of specialists across the country. With an overall market share of 10% and 100,000 non-profit customers, the Bank lends them its expertise to help achieve their objectives, by financing their development projects, advising them on the management of their assets and supporting them in their day-to-day management.
In addition to these commitments, Societe Generale, in partnership with the law firm Fidal, has organised many information meetings throughout the country on legal and tax-related subjects in order to provide an expert opinion on ongoing reflections within associations to inform volunteer and salaried managers.
A focus on vulnerable populations and those with low exposure to banking services In France and elsewhere in the world, the Group supports financial inclusion through the implementation of new banking models, and combats poverty and exclusion through partnerships with microfinance and investment institutions in impact funds.
IN FRANCE
RIGHT TO HOLD A BANK ACCOUNT AND HAVE ACCESS TO INCLUSIVE PRODUCTS AND SERVICES
In accordance with Article L. 312-1 of the French Monetary and Financial Code on the right to hold a bank account, Societe Generale and Crédit du Nord provide customers who are entitled to this right with free “basic banking services”, as defined by law. As at end-December 2017, 11,687 individual customers had access to basic banking services at Societe Generale and 1,007 individual customers at Crédit du Nord Group.
Since 2005, Societe Generale and Crédit du Nord have sought to “make banking easier” for all by offering a range of alternative payment methods (APMs) to cheques for customers without a cheque book. The entry into force of the Moscovici Act and its implementing legislation in 2014 significantly reinforced the commitments undertaken since 2005 in relation to customers in situations of financial hardship.
Accordingly, the Societe Generale and Crédit du Nord networks, in keeping with their regulatory obligations as defined in Article R. 312-4-3 of the French Monetary and Financial Code, have implemented a detection and monitoring system, combining internal warning mechanisms and KYC intelligence, for customers fulfilling the criteria for financial hardship. This system enables the Bank to contact these customers in writing,

5
SOCIETE GENERALE IS IMPLEMENTING ITS CSR AMBITION
3 I 5CCORPORATE SOCIAL RESPPONSIBILITY
S O C I E T E G E N E R AL E G R O U P I 2018 REGISTRATION DOCUMENT I 285
systematically and at the earliest opportunity, to propose a meeting with their advisor in order to present them with a specific offer designed to limit costs in the event of an incident (at least once a year for all customers in situations of financial hardship as well as any time a new instance of hardship is detected).
Généris, which is available for a monthly fee of EUR 3.00, is the everyday banking package that has been designed to help customers in situations of financial hardship to manage their accounts, in particular through capped costs in the event of an incident and account control thanks to adapted payment methods. As at the end of 2017, 51,112 Societe Generale customers subscribed to the Generis service.
In September 2017, Boursorama Banque enhanced Welcome, which is growing to become a comprehensive free everyday banking package available to any person over 18 years of age, without any restrictions on the level of income or minimum deposits.
This package bears out the latest rankings carried out by Le Monde/Choisir-mabanque.com in February 2018, in which Boursorama Banque was once again rated the least expensive bank for the four eligible profiles “Active population under 25 years of age”, “Middle manager”, “Senior manager” and “Employee” in the online banking universe. This ranking confirms Boursorama’s position as the least expensive bank, which it has held for the past ten years.
Franfinance, a Group subsidiary specialising in consumer loans, offers a loan product that is specifically intended for temporary workers. This innovative product is combined with a completely free back-to-employment assistance plan, with a dedicated employment advisor. In 2017, Franfinance financed 80 loan applications of this type for customers with temporary contracts.
FOR PEOPLE REPRESENTING A SERIOUS HEALTH RISK AND IN A STATE OF DEPENDENCY
Societe Generale develops products and services that match the needs of each individual:
for those at serious risk of health problems: in France, the AERAS agreement (insurance and loans for individuals with an increased health risk) signed by professionals in France’ s banking and insurance sectors in 2006 and later amended in 2011, then again in 2015, facilitates access to insurance and credit for people who are or have been at serious risk of health problems. In this context, Societe Generale and Crédit du Nord make it easier for such people to get a loan (home loans and consumer loans) and provide, in particular, a scheme for sharing some of the costs of additional premiums for customers in the lowest income brackets;
for persons in a state of dependency and their carers: amongst its range of offers for protecting people, Societe Generale offers two dependency solutions, one of which is specifically designed to cover the issues faced by carers. The Garantie Autonomie Aidant policy is a package of cover and support benefits for persons providing daily care for a dependent elderly relative. In addition to this offering, Societe Generale has formed a partnership with the non-profit organisation La Compagnie des Aidants, which develops and runs a dedicated online platform for the carer community. Societe Generale has elected to round off these solutions by an innovative digital package consisting of a web portal with the “Ultralert” application and a permanent teleassistance service at the home of the person being cared for via a connected medallion or bracelet. These support solutions have been awarded the Profideo Innovation Trophy;
with regard to insurance, Sogecap has defined a product solution with UNEP, “Protected Adults”, which offers a life insurance policy for protected adults and their carers. This is based on a very comprehensive range of cover, from care to psychological support, for the protected adult. There is also a range of additional cover for the carer, from training to be a carer to teleassistance, even temporary accommodation.
A SPECIFIC FOCUS ON PERSONS IN SITUATIONS OF FINANCIAL HARDSHIP
Since 2004, the French Retail Banking network has had the resources needed to identify over-indebted customers in order to offer them a responsible solution. The French law governing consumer credit that entered into force in November 2010 modified the regulatory framework without radically affecting the system in place at Societe Generale, which was precursory in this regard.
SUPPORT FOR VULNERABLE PERSONS TO PREVENT OVER-INDEBTEDNESS
The support scheme for vulnerable customers, implemented via dedicated platforms, has been operational across the entire network of branches in France since mid-2013. It is based on:
the identification of all customers corresponding to certain vulnerability criteria (exceeding authorised overdrafts or other limits for a prolonged period, overdue loan repayments, etc.);
the transfer of these customers to a platform of specialist advisors who temporarily take over the business relationship from the branch;
the exploration, together with the customer in question, of solutions for the progressive discharge of unpaid debts, favouring a path back to a healthy financial situation over litigation whenever possible;
resumption of the customer relationship with their branch at the end of the repayment period.
As at the end of December 2017, the platforms for amicable negotiation lent support to more than 31,000 cases. 70% of these customers have returned to a sound financial footing and resumed their banking relationship in their Societe Generale branch.
Franfinance has also introduced various measures to prevent over-indebtedness. Since the end of 2015, it has extended its action plan to support vulnerable customers, so they now benefit from a system of monitoring set up to prevent difficulties at an earlier stage.
In addition, since 2010, Franfinance and CGI have had a partnership agreement with Crésus, a network of non-profit associations founded in 1992 that assists individuals with excessive or poorly structured debt. Under this agreement, the Group’ s two French subsidiaries specialising in consumer loans recommend any customers showing signs of financial vulnerability to contact their local Crésus association. Further to the signing (on a voluntary basis) of a support charter between the association and the customer, a budgetary and social evaluation is performed, followed by close support aimed at safeguarding the customer’s financial equilibrium.
In 2017, 74,421 customers had been supported by amicable negotiation platforms and 75% of these had returned to a sound financial footing after this support.
5 I 3
SOCIETE GENERALE IS IMPLEMENTING ITS CSR AMBITION CCORPORATE SOCIAL RESPPONSIBILITY
286 I 2018 REGISTRATION DOCUMENT I S O C I E T E G E N E R AL E G R O U P
A PROCESS DEDICATED TO MANAGING OVER-INDEBTEDNESS
Societe Generale introduced a dedicated process in 2004 to ensure the responsible management of over-indebted customers. It maintains services for bank accounts that receive income, except in special cases, and informs over-indebted customers of alternative payment methods to cheques. Debtors continue to benefit from any overdrafts already granted. Management of the customer relationship is based on a complementary system:
account managers ensure the everyday monitoring of the account;
back-office operators monitor outstanding credit prior to acceptance of applications and manage repayment schedules once approved. This procedure enables the Bank to avoid any increase in loans borne by over-indebted customers whilst still enabling day-to-day personalised monitoring.
Thus, over-indebted individuals who no longer have access to further credit are offered appropriate bank account services and payment methods, enabling them to maintain a social life. They can then subscribe to the tailored offering that is designed to limit costs in the event of an incident (see p. 284, “Right to hold a bank account and access to inclusive products and services”).
TOOLS TO SUPPORT FINANCIAL EDUCATION
In the interests of transparency and education, Societe Generale makes a large number of simulation or financial calculation tools available to its customers and partners, either online or via partner applications.
In France, Societe Generale helps its customers to financially educate their children through multiple actions:
collaboration with the Play Back Group in relation to the provision of educational content (games, videos, news, etc., enabling children to learn while having fun) on the website abcbanque.fr;
a “Parents Corner” area on this website offering advice and topics for reflection, so that parents can give their children optimal guidance in this learning process;
practical guides and videos specifically for students, which are available in the “Young People” section of the Societe Generale website, so they can learn to manage their day-to-day budgeting.
IN EUROPE Similarly, in Europe:
Eurobank (Poland) has developed a financial educational project (Home Budget with Eurobank) that allows the Bank’s experts to share their knowledge with customers in relation to using banking services responsibly and conscientiously. The Bank makes two dedicated online platforms available to this end (https://www.societegenerale.com/en/about-us/our-commitments/corporate-citizenship/financial-education).
BRD (Romania), in partnership with the National Bank and the Ministry of Education, has developed a programme for teaching primary school pupils the basics of finance (12,000 pupils in 145 towns have followed this programme, involving 105 BRD employees each year).
Microfinance commitments Over and above its impact on jobs and regional development, Societe Generale finances and invests in structures that contribute to the social cohesion of the communities and regions in which it operates.
IN FRANCE Societe Generale has been supporting the ADIE initiative since 2006 in respect of its financing activity in metropolitan France and France overseas. In 2017, the partnership enabled the provision of EUR 11.5 million in credit lines and EUR 167,000 in sponsorship aid.
At end-2017, the financial value of overseas commitments with ADIE was on the rise and stood at EUR 4.2 million.
ABROAD Committed to professional integration and providing entrepreneurs and start-ups with all the support they need, Societe Generale’s international networks make it a leader in microfinance and a contributor to the development of the local economic fabric and the push to bring banking to the masses.
The Group has chosen to focus its microfinance activities in those countries in which it has a presence as a universal bank, notably in the regions of Africa and Europe. Since 2003, it has been lending its support, via its subsidiaries, to the microfinance sector in two ways: granting refinancing lines to microfinance institutions (MFIs) in local currency and acquiring minority stakes in MFIs. This strategy underpins the economic support given to social and local entrepreneurs, and satisfies the MFIs’ need to find local sources of financing, especially in local currency, to ensure their development without being exposed to currency risk.
REFINANCING OF MICROFINANCE FINANCIAL INSTITUTIONS
The MFI partners facilitate access to credit for populations that do not have access to banking facilities and, in doing so, feed the local economies. As at the end of 2017, the Group had recorded EUR 110.6 million in commitments granted by Societe Generale abroad (versus EUR 109 million in 2016) to 35 MFIs (versus 37 in 2016), in Africa (Benin, Ghana, Senegal, Côte d’Ivoire, Burkina, Cameroon, etc.), in the MENA (Middle East and North Africa) region (Jordan and Tunisia), in Eastern Europe (Serbia, Moldova and Albania) and in Asia (India).
In Europe, four subsidiaries (in Albania, Serbia, Moldova and the Czech Republic) support the microfinance sector. As at the end of 2017, the commitment of these entities (apart from the Czech Republic, which is committed to a specific programme) to local MFIs represented around EUR 38 million.
Accordingly:
in Serbia, Societe Generale Srbija has partnered with the MFI Agroinvest since 2012, allowing it to reach a larger market and to provide better support to its customers;
Banka has been committed to a microfinance programme (EaSI Microfinance) with the European Investment Fund. Through this agreement, the bank grants loans to micro-entrepreneurs, individuals who are unemployed and/or on a low income. Thus the “EaSI” guarantee is financed by the European Commission and managed by the European Investment Fund. As at the end of 2017, Komer Banka had disbursed around EUR 4.2 million in loans (versus EUR 1.5 million in 2016) in favour of around 350 beneficiaries;

5
SOCIETE GENERALE IS IMPLEMENTING ITS CSR AMBITION
3 I 5CCORPORATE SOCIAL RESPPONSIBILITY
S O C I E T E G E N E R AL E G R O U P I 2018 REGISTRATION DOCUMENT I 287
abroad, Africa channels 50% of the funding lines dedicated to the microfinance sector (excluding ADIE). However, since January 2017, in order to best address their need to develop in Africa, the customer relationship with the holding companies of the MFIs Advans and Microcred is managed by Head Office (see p. 280, “Contribution to Africa’s sustainable development”).
ACQUISITION OF EQUITY HOLDINGS IN MICROFINANCE INSTITUTIONS
In 2017, this focused on entities in Africa (see p. 280, “Contribution to Africa’s sustainable development”).
Although stakeholders have raised specific expectations around societal trends in terms of supporting SMEs and individual clients, they have also raised significant expectations with regard to the provision of products and banking services tailored to the challenges of major sustainable cities (rehabilitation, creation, development, depending on the country concerned) and to the transformations characteristic of the mobility of persons and goods sector. These challenges concern much larger financing requirements, but draw on the efforts conducted in the customer segments reviewed at the beginning of this chapter (see p. 282 “Supporting major societal changes and the economic development of the territories”).
Adapting the Group’s products and services to the development of sustainable cities In 2017, the Group Real Estate Department and Sogeprom won the annual Grand Prize in the category of new office buildings of over 50,000 m2 at SIMI (a commercial real estate fair) for their Les Dunes project, a fully connected technology park of 126,000 m2, located to the east of Paris, and accommodating 5,000 employees of Societe Generale working on technologies. The jury’s decision for this award was based on criteria including the building’s adaptability to user requirements, the environmental approach and architectural quality. Designed with very exacting sustainability requirements, Les Dunes is perfectly in tune with the Group’s responsibility policy. The technology park, which has HQE exceptional certification (denoting high environmental quality), manages the building’s environmental impacts by reducing energy consumption by 50%, collecting rainwater, producing energy by means of geothermal wells, and guaranteeing the methanisation of organic waste on site. These requirements make Les Dunes a building of high environmental quality and enhances the working conditions for its occupants.
This case is just one illustration of the commitment of Sogeprom, the Group’s property development subsidiary, to developing the real estate of tomorrow by placing the user at the heart of its concerns (comfort, air quality, connectivity, biodiversity, etc.) while simultaneously increasing the value of the real estate assets. It envisions the property development business of tomorrow by considering the building’s overall lifespan: from eco-design to end-of-life considerations for the building and its construction materials. The optimisation of the buildings’ energy consumption is also taken into account, as well as the issue of mobility for the building’s users.
One year after the official launch of the biggest architecture and town planning competition in Europe, “Let’s Invent the Metropolis of Greater Paris”, where 51 prize-winning projects were presented in October 2017, this technical and commercial positioning has enabled three of Sogeprom’s projects to win a prize rewarding the right combination of innovation and ecology:
the “Rêves ‘N’Rives” project and its developments along the banks of the river Marne at Nogent-sur-Marne (east of
Paris): housing (including social housing), shops, leisure space, “guinguette” (open-air café-cum-dance hall);
the “Parcs en Scène” project and its e-sport space at Thiais (south of Paris): housing and public spaces.
the “Village Bongarde” project and the aquaponics at its urban farm at Villeneuve-la-Garenne (north of Paris): housing, housing for the elderly, service sector facilities, business premises, shops and a crèche. The site is located opposite the village that is planned for the 2024 Paris Olympic Games.
In addition, Sogeprom led the WAP project, in northern France, the first French office building with a wooden structure (see p. 278, “Measures taken to improve environmental efficiency”).
In 2017, Societe Generale decided to appoint a member of its Management Committee as the Real Estate Director and the Director of the Greater Paris Project. This appointment reflects the strong commitment to the development of major sustainable city projects.
Furthermore, the Export Finance Department is working on various sustainable city projects in emerging countries in collaboration with various multilateral partners.
Pushing the mobility offering in optimised service and environmental quality conditions
Mobility challenges are at the heart of sustainable city requirements. Societe Generale addresses them through its vehicle leasing subsidiary, ALD Automotive, as far as possible within the context of its traditional banking developments.
ALD monitors the environmental footprint of its fleet of vehicles and invests in the design of new mobility offerings in keeping with the new uses and expectations of society and of its customers. The combination of technical changes in the automobile product, consumption patterns and mobility uses is creating new opportunities.
By way of example:
electrified vehicles will gradually be integrated into company fleets and into the urban mobility of the future (see p. 274, “Green mobility financing”);
SSustainable cities and mmobility
AALD AAutomotive
Ampère E+ building wins the Green Solutions Award in the "smart cities" category at COP 23, in November 2017
SSogeprom
Sogeprom wins three calls for tender as part of the project "Inventing the greater Paris metropolis" in November 2017

5 I 3
SOCIETE GENERALE IS IMPLEMENTING ITS CSR AMBITION CCORPORATE SOCIAL RESPPONSIBILITY
288 I 2018 REGISTRATION DOCUMENT I S O C I E T E G E N E R AL E G R O U P
new usages brought about by the sharing economy and digitalisation are creating a great many opportunities for innovation. ALD now has car-sharing solutions in seven European countries and is accelerating the international roll-out of this product. A carpool solution has been set up in France with the start-up WayzUp under the name ALD Community. A partnership agreement has also been signed with Blablacar, aimed at offering attractive long-term leasing deals to the brand’s ambassadors. More generally, ALD wants to be a part of the Mobility as a Service movement and is multiplying its partnerships and tests in this area (cooperation with Maas Global in Finland, Olympus offering in Belgium);
the development of leasing offers for individuals, a strategic priority for the company, is also in keeping with this trend favouring use over ownership;
the generalisation of the pay-as-you-go philosophy is materialising in ALD’s business model with the launch of the Ricaricar offering by ALD Italy, the first long-term leasing offering where users have the option to lease a vehicle with a low monthly kilometre level and then “recharge” it to increase this kilometre level, depending on their actual travel needs;
the intensification of discussions focusing on smart cities paves the way for cooperation with the various players in urban mobility (e.g. municipalities, service operators, real estate players, technology companies, start-ups);
new services related to the responsible use of vehicles are emerging, such as the “ALD ecodrive” application (dedicated to eco-driving), programmes for making drivers more aware of road safety and, more generally, the “ALD profleet” on-board telematics product, which enables the optimisation of journeys and the use of vehicles;
the partnership formed with Enel in Italy is crystallising a large part of these trends. In addition to supplying company vehicles for Enel in a traditional format, this partnership covers three types of marketing offerings based on electric vehicles and combined under the “e-go” label: a pay-as-you-drive offering, a long-term leasing offering (which Enel publicises to its customers) and, lastly, an electric BtoB car-sharing solution. This wider range of services will enable ALD to position itself as a global mobility provider to its customers.
Moreover, the Group’s banking activities promote ranges of products and services that highlight the benefits of sustainable mobility (see p. 274, “Green mobility financing”). It is also worth noting projects that are monitored by the International Finance and Export Credit Department, aimed at the deployment of public transport services offering mobility that is essential for the economic development of major emerging cities. In 2017, a contract relating to buses was signed in Colombia and major projects are being monitored in other Latin American cities.
A BANK PIONEERING RESPONSIBLE FINANCE
Sustainable and positive impact finance, a consolidated global offering Societe Generale prompted the Positive Impact initiative by UNEP-FI, which brings together 26 financial institutions worldwide and aims to bridge the gap of financing the Sustainable Development Goals (SDGs) set by the United Nations. As such, the Positive Impact Manifesto was published at the end of 2015, followed by the Positive Impact Principles at the beginning of 2017.
These publications have defined Positive Impact Finance as applying to every activity verifiably producing a positive impact on at least one of the sustainable development pillars (economic convergence, populations’ basic needs, the environment) while ensuring that the potential negative impacts have been identified and properly managed.
This concept reflects the reality of economic life (taking into account any negative impacts that must be remedied when they cannot be avoided) and, far from counteracting other initiatives launched in the market under different names, it aims to be all-encompassing.
In the Positive Impact Finance policy, the objectives for a closer analysis of the challenges have been grouped together, such as enabling climate-oriented initiatives to bridge the gap with social challenges for example, clarifying the methods used to measure the diversity of the impacts of certain projects, and establishing impact measures with maximum transparency.
Societe Generale has decided to promote its efforts under the development term “Sustainable Finance”, adding the concept of “Positive impact finance” for all projects to which it was possible to apply the precise analysis methodologies of all the positive and negative impacts in accordance with the Positive Impact Manifesto signed with UNEP-FI.
These efforts form part of a global framework described as “Sustainable and Positive Impact Finance”.
In November 2017, the Group appointed a member of the Management Committee as the Director of financing activities within Global Banking and Investor Solutions in order to accelerate the development of a consolidated Sustainable and Positive Impact Finance range of products and services.
This range is rolled out in the existing business lines and is underpinned by the strengthening of the Positive Impact teams.
It is a cross-business approach that pools various skills within the businesses of financing, structuring and management of market products, and relationships with major corporate and investor clients. Its objective is to develop and diversify the range of product and service offerings by introducing more structuring expertise and advice on impact analysis and measurement, and by incorporating, as far as possible, the UN’s 17 Sustainable Development Goals.
As such, Societe Generale, a trailblazer in implementing this concept of Positive Impact Finance, aims to be a market leader in supporting all its clients.
This ambition is fully integrated into the Bank’s new CSR ambition.
In practical terms, it takes the following forms:
IN STRUCTURED FINANCING Positive impact financing has been reported on since 2012 and is increasing steadily. Over 2012-2017 there was a 4.5-fold increase in the number of positive impact finance transactions. In 2017, positive impact finance transactions amounted to EUR 2.7 billion (versus EUR 2.2 billion in 2016).
Some examples of structured Green and Impact loans in 2017 are as follows:

5
SOCIETE GENERALE IS IMPLEMENTING ITS CSR AMBITION
3 I 5CCORPORATE SOCIAL RESPPONSIBILITY
S O C I E T E G E N E R AL E G R O U P I 2018 REGISTRATION DOCUMENT I 289
Support for clients committed to a CSR approach was strengthened in 2017 with the development of the impact financing product range. They include CSR objectives defined with the client, the performance of which will be measured throughout the credit’s term to maturity.
In its capacity as E&S coordinator, Societe Generale advised Fromageries Bel in respect of an addendum providing for the extension of the maturity date of its EUR 520 million renewable multi-currency revolving credit agreement, in order to integrate environmental and social impact criteria through carbon footprint reduction objectives, the implementation of a nutritional education programme and the development of a sustainable dairy business.
IN THE MARKET PRODUCTS SEGMENT
Green bonds (see p. 275, “Development of green bonds”)
Positive impact notes (see below, “The SRI product range”).
In summary, one might conclude that sustainable and positive impact finance enable Societe Generale today to support and finance clients and to structure products for investors around a wide spectrum of actions within the remit of Global Banking and Investor Solutions:
Meeting investors’ expectations for socially responsible investment (SRI) solutions
SRI RESEARCH Societe Generale offers institutional clients targeted research on Environmental, Social and Governance (ESG) issues, which has been recognised several times over the past few years in the SRI & Sustainability Research category of the Extel Survey. This four-strong team of analysts belongs to the financial research section of Corporate and Investment Banking. Its role is to help investors and asset managers better integrate ESG criteria into their investment decisions, working closely with sector-based financial analysts in order to demonstrate the financial materiality of these issues. Its bi-annual analysis report, “SRI: Beyond Integration”, is a highly valued publication which combines ESG assessments with financial recommendations from financial analysts in order to offer an integrated and practical overview of all companies monitored by the research department. This is supplemented by:
the publication of around ten multi-sector reports, which have been presented to numerous national and international investors;
the organisation of several conferences and road shows in Paris and London, among other locations. The annual SRI/ESG research conference in particular gives a large number of companies the opportunity to come and present the ESG subjects most closely related to their activities to institutional investors.
Lastly, SRI/ESG research is used to help monitor several indices and baskets of listed stocks, resulting in the issue of financial products relating to ESG (e.g. corporate governance, the ageing population, etc.) and/or sustainable development (a list of products and methodologies is available at www.sgbourse.fr).
THE SRI PRODUCT RANGE
WITHIN GLOBAL MARKETS
In 2017, Investment Banking’s strong foothold in relation to SRI and ESG solutions was confirmed and broadened:
Global Markets generated EUR 1.65 billion in SRI and ESG portfolio assets as at the end of 2017, in particular through the Societe Generale Index (SGI) franchise, which offers securities with SRI and ESG components, as well as the distribution of FINVEX indices, which combine an SRI and/or ESG filter with financial filters (EUR 910 million AuM as at end-2017); these two types of indices are used as varied investment solution underlyings, in particular structured solutions and Lyxor ETFs;
Positive Impact notes, debt securities for which Societe Generale has agreed to retain Positive Impact finance assets on its balance sheet for a value equal to all subscriptions to the products, and to do so throughout their lifespan, are proving highly successful in various countries in Europe and Latin America. Overall in 2017, Positive Impact notes of more than EUR 200 million were distributed.
These solutions are distributed to both institutional investors and private individuals. In the latter case, the cooperation between Global Markets and the Societe Generale networks (Private Banking and Retail Banking) have played a key role.
WITHIN ASSET MANAGEMENT ACTIVITIES
Lyxor Asset Management factors the challenges of climate change and the growing demand for responsible investments into its active and passive asset management solutions.
As a pioneer of ETFs in Europe, Lyxor has used its strong capacity for innovation to good effect in order to provide ESG solutions to investors.
To this end, Lyxor offers thematic solutions via its ETF product range, which is aligned with four of the UN’s Sustainable Development Goals (SDGs): water, renewable energies, climate action and gender equality. Lyxor launched a Water ETF in 2007, which has become the largest ETF in Europe, with EUR 600 million in assets under management. In 2017, Lyxor took an innovative step by launching the first Green Bond ETF in the world, which captures performances and positive impacts related to green projects.
At the same time, Lyxor has gradually strengthened the integration of ESG criteria into its active asset management via the smart beta GARI European equity strategies, which incorporate companies’ ESG ratings and risks in the selection of investment universes. In addition, Lyxor has integrated non-financial criteria into the management of an institutional mandate that invests in the debts of French SMEs.
Lyxor is also able to provide ESG and carbon footprint indicators for its investment vehicles in order to address climate-related issues.
FINANCING
INVESTING
* ESG Research * ESG Advisory * Securitisation
* Green and Social Bonds
* ESG Indices and Baskets
* ESG Funds and ETFs * Securities Services
ESG Tools * Positive Impact Notes
* Green Deposits
* Positive Impact Structured Financing * Renewable Project
Finance * Impact Loans
* Partnerships with Supra

5 I 3
SOCIETE GENERALE IS IMPLEMENTING ITS CSR AMBITION CCORPORATE SOCIAL RESPPONSIBILITY
290 I 2018 REGISTRATION DOCUMENT I S O C I E T E G E N E R AL E G R O U P
As at end-2017, Lyxor managed EUR 18 billion in AuM including a shareholder commitment (+38% compared with 2016), EUR 1.1 billion AuM incorporating exclusion list approaches, EUR 722 million AuM integrating environmental themes and EUR 27 million AuM managed using an ESG selection approach.
Lyxor is a signatory of the United Nations Principles for Responsible Investment (UN-PRI) and has been rated “A” in strategy and governance.
FOR PRIVATE INDIVIDUALS
IN PRIVATE BANKING
Private Banking advises wealthy clients and offers value-added investment solutions.
In terms of social impact advice, Private Banking set up a centre of philanthropic expertise in 2016, which supports clients striving to strengthen their public interest commitment by providing turnkey offers through the 29 Haussmann Foundation or guiding clients who want to establish a foundation.
In terms of investment products, it has developed solutions for its clients seeking to integrate sustainable development criteria into the management of their assets:
discretionary management: Societe Generale Private Banking (SGPB) offers management solutions that combine both financial and non-financial criteria. It is based in particular on:
– the exclusion of issuers who are not compatible with the Group’s E&S policies or do not comply with the UN Global Compact;
– an integration policy aimed at combining the issuers’ financial and ESG criteria. This management is organised around a dedicated ESG Committee, which gathers specialised managers together every month and relies on financial and non-financial research from the main partners. Current AuM based on ESF criteria represent EUR 190 million (+25% compared to 2016);
structured products: based on the Group’s Positive Impact Finance expertise, SGPB offers investment products issued by the Bank. Overall, client subscriptions to “Positive Impact Finance” products or products having an ESG underlying amounted to more than EUR 174 million in 2017 (see p. 289, “The SRI product range within Global Markets”);
external funds: SGPB distributes UCITS investment funds managed by both the Group and external asset managers selected by Lyxor’s selection platform. Assets under management exercising an ESG exclusion or selection policy stood at EUR 417 million as at end-November 2017 (+26% compared to 2016).
IN LIFE INSURANCE
To meet the needs of savers looking to diversify and invest in a socially responsible manner, Sogecap offers SRI vehicles in its investment-backed life insurance policies. As at end-December 2017, total assets under management by Sogecap having SRI vehicles amounted to EUR 99 million, up 66% compared to 2016. These assets under management were distributed over 56 vehicles (versus 54 in 2016), of which 17 had an SRI label. Securities managed within the framework of these vehicles are selected according to their capacity to generate capital gains while taking ESG criteria into account. Accordingly, the best securities within each economic sector and/or asset class are selected in line with these criteria.
The assets under management of four vehicles based on the principles of the shared economy and solidarity (SG Solidarité CCFD Terre solidaire, SG Solidarité Fondation pour la recherche médicale, SG Solidarité Habitat et Humanisme and SG Solidarité Les Restaurants du cœur) reached EUR 9.5 million at the end of 2017, i.e. a 385% increase compared with 2016. Through these unit-linked investment vehicles, savings are 0-25% invested in shares and 65-100% invested in interest rate products. 5-10% are invested in unlisted solidarity enterprises of high social use. Each vehicle plans to pay 50% of its annual revenues to one of the four partner associations. In 2017, revenues of around EUR 50,000 were paid to these associations.
In the first half of 2017, a structured product with partial capital protection was offered, the SG FORMULE DURABLE vehicle. The product guarantees 80% of the capital upon maturity, depending on its performance against the Dow Jones Sustainability Europe Index. EUR 10 million was collected during the marketing period.
Lastly, a new reference venture capital fund vehicle is invested in unlisted companies, thus helping to finance the real economy: FCPR Idinvest Strategic Opportunities.

5
APPENDICES
4 I 5CCORPORATE SOCIAL RESPPONSIBILITY
S O C I E T E G E N E R AL E G R O U P I 2018 REGISTRATION DOCUMENT I 291
4 . A P P E N D I C E S
NOTE ON METHODOLOGY The purpose of this note is to explain the reporting methodology used by Societe Generale for matters relating to Corporate Social Responsibility (CSR). This methodology is set out in detail in the Group’s reporting protocol, available on request.
Reporting protocol The information included in the Registration Document, on the CSR website, in other communication media of Societe Generale, as well as in the Group’s activity and sustainable development report, whether pertaining to the 2017 financial year or to previous years, was prepared on the basis of contributions from the Group’s internal network of CSR officers and in accordance with the Group’s CSR reporting protocol and CSR initiatives programme. It is also prepared on the basis of data from the “Planethic Reporting” tool, used for the standardised collection of the indicators used to keep track of the various initiatives. All the reporting is coordinated by the Group CSR Department, which reports to the Group Corporate Secretary. (see p. 261, “Responsibilities of the CSR Department”).
Regular efforts are made to bring contributors and managers on board and familiarise them with the reporting protocol and the tool in the interest of increasing data reliability. This reporting protocol is updated on a regular basis.
Reporting periods SOCIAL, SPONSORSHIP AND BUSINESS DATA Quantitative indicators are calculated for the period running from 1st January 2017 to 31st December 2017 (12 months), with data taken as at 31st December 2017.
ENVIRONMENTAL DATA Quantitative indicators are calculated for the period running from 1st October 2016 to 30th September 2017 (12 months), with data taken as at 30th September 2017.
CSR consolidation scope The reporting scope includes all Societe Generale consolidated entities with more than 50 employees, apart from entities that are consolidated under the equity method of accounting (equity-consolidated companies (ECCs)). Consolidated entities (excluding ECCs) with less than 50 employees having a structure suited to the reporting of information are also included.
Entities included in the reporting scope meet at least one of the following criteria:
entities in which the parent company, Societe Generale SA(SGSA), directly or indirectly holds a controlling interest ofover 50%. The branches are by definition wholly owned,since there are no shareholders;
entities in which SGSA holds a controlling interest of at least20%, and no more than 50%, and over which SGPM has a
strong influence on its subsidiary’s management and financial policy; in particular, the entity’s management team is appointed by Societe Generale and it is regularly monitored by the Group’s business divisions.
The CSR consolidation scope includes 153 companies within the Group’s financial consolidation scope as at 31st December 2017.
Data collection The following data collection methods are used for the scope defined above:
for social, environmental, business and corporatesponsorship data, most of the quantitative indicators arecollected by each Group entity via the “Planethic Reporting”tool by collectors who enter the data at the level of theirsubsidiary, which is validated by validators who review theinput data at the level of their entity before validating it,administrators who check and validate the data at the level ofthe core businesses, and central administrators (Group CSRDepartment) at the Group level, who carry out the finalchecks prior to consolidation;
other data are collected directly from the core businesses’CSR officers or from the relevant departments (SourcingDivision, Risk Division, Human Resources Department) bythe Group CSR Department.
Indicators During a formal communication campaign, all contributors were informed of the data collection schedule, a Group Instruction and a protocol for each category of indicators. The protocol serves as a reminder of indicator definitions and application criteria.
The 2017 indicators were chosen particularly in respect of information requirements under the “Grenelle II” Law (in accordance with Article L. 225-102-1 of the French Commercial Code) as well as in light of the Group CSR strategy and the determination to align a core ambition as closely as possible with the GRI4.
The indicators are generally reported for a global scope. Some indicators, however, cannot be consistently applied to a global scope. In such cases, the indicators were analysed for the scope of France or Societe Generale SA in France (excluding subsidiaries). These indicators are monitored by “France”; the quotation marks indicate that they concern only France.
Scope and rules for calculation of social indicators The workforce taken into account in all the social indicators (unless explicitly stated otherwise) corresponds to the total number of employees on a permanent or fixed-term contract, including work-study contracts, regardless of whether they are present or absent.

5 I
CORPORATE SOCIAL RESPONSIBILITY
APPENDICES
292 I 2018 REGISTRATION DOCUMENT I S O C I E T E G E N E R AL E G R O U P
The frequency rate of accidents in the workplace is the ratio of the number of accidents in the workplace (as defined by local regulations) to the total number of hours worked (workforce present on a permanent or fixed-term contract multiplied by the number of annual working hours in the entity) multiplied by 1,000,000.
The rate of absenteeism is the ratio of the number of reported days of absence paid to the total number of days paid, as a percentage. It is counted in calendar days and on the basis of the total number of employees (workforce present as at 31st December multiplied by 365). The scope of the charts “Breakdown of staff by age bracket” (p. 249) and “Breakdown of staff by length of service” (p. 244) is the CSR consolidation scope as defined above, excluding the headcount of entities in Germany (GEFA, PEMA GmbH), Morocco (Sogelease) and Tunisia (UIB), for which this information is not consolidated.
Scope and main management rules for environmental indicators for own account The scope corresponds to the CSR consolidation scope as defined above. Coverage of the total data collection scope corresponds to the ratio of the headcount of all entities that participated in the data collection campaign to the total headcount of Societe Generale. With data having been collected on 147,138 employees, Societe Generale estimates that the total data collection scope – i.e. accounting for at least the data on occupants and surface area – covers approximately 99% of the workforce.
Restatement of historical data To ensure the transparency of communication and the comparability of data, the emissions for the reference years and for 2014-2017 are presented in the appended table of quantitative data. Similarly, the new indicators that have been incorporated into the calculation of greenhouse gas emissions have also been incorporated into the historical data. These restatements do not correct variations related to the growth or reduction of the activity within the entities.
Furthermore, we have made a change to the methodology concerning the emission factors in order to cancel out the variations related to these same factors. Accordingly, we apply the emission factors for the current year over all the previous years, up until our reference year, which is 2014.
Environmental data: general rules Environmental data are calculated on the basis of invoices, direct readings, information received from suppliers and estimates. The following checks and ratios are used to manage the reported data:
checks on variation compared to the previous year wereperformed for all environmental indicators. Contributorsreceived alerts asking them to check the data recorded if thevariation was greater than 30%;
data collected on energy, office paper and transport isexpressed in relation to the number of occupants declaredby the entity;
energy consumption (electricity, steam, chilled water, oil, gas)is also expressed in relation to the surface area (per m2);
in the interest of continually improving the reliability of data,qualitative questions (answers expected via writtencomments) are used to identify different scopes of data andbest practices, and to understand year-to-year variations.
with the exception of the Societe Generale France network,most subsidiaries consolidate their data in the Group’sreporting tool. Transport and paper consumption data forFrance is reported centrally by the CSR Department on thebasis of data received from the Sourcing Division.
Wherever possible, the number of occupants covered corresponds to the average number of Societe Generale employees or subcontractors working on-site during the reporting period or, failing that, the number of occupants as at 30th September 2017.
Coverage of the data collection scope for each indicator is the ratio of the headcount of all entities having completed the indicator to the total headcount of Societe Generale. Coverage of the data collection scope for each indicator is the ratio of the headcount of all entities having completed the indicator to the total headcount of Societe Generale.
New indicators were incorporated or modified in 2017: new indicators concerning energy consumption, so as to understand the factors applied by the suppliers, thereby enabling us to calculate emissions on a market basis, whereas we currently calculate them on a local basis.
The calculation of greenhouse gas emissions Calculation of the Group’s CO2 emissions is broken down into three categories:
Scope 1 covers direct emissions related to energyconsumption and fugitive emissions of fluorinated gases;
Scope 2 covers indirect emissions related to energyconsumption (external electricity, steam and chilled water);
Scope 3 covers GHG emissions from all office paperconsumption, business travel, transport of goods and energyconsumption of data centres hosted in France since 2012.The scope was extended to include waste in 2017.
CO2 emissions are calculated according to the GHG Protocol method.

5
CORPORATE SOCIAL RESPONSIBILITY APPENDICES
4 I 5CCORPORATE SOCIAL RESPPONSIBILITY
S O C I E T E G E N E R AL E G R O U P I 2018 REGISTRATION DOCUMENT I 293
CORPORATE SOCIAL RESPONSIBILITY – GROUP KEY FIGURES SScope UUnit 22015 22016 2017 Scope Unit 2015 2016 2017
Implemennting sustainable finance Amounts of interest contributed under the solidarity savings service France EUR 2273,000 282,576 354,075
Robeco SAM Group out of 100 882 84 84 Amount of customer donations under the solidarity savings service France EUR 238,067 234,059 303,156
VIGEO Group out of 100 557 63 64 Amount of the Group's contribution under the solidarity savings service
France EUR 23,809 23,408 50,920
Sustainalytics Group out of 100 774 74 74 Partner associations of the charity bank card programme France Number 28 29 29
FTSE4GOOD Group out of 5 44 4 4 Amount contributed to partner associations from charity bank cards
France K EUR 8844.3 882.8 1,056.9
MSCI Group AAA to CCC BBBB BBB A Beneficiary associations of the Filigrane programme France Number 22 2 2
Carbon Disclosure Project Group A+ to C- 999B B A-- Amount contributed to associations of the Filigrane programme France EUR 5544,839 475,451 375,300
Ecovadis Group out of 100 668 68 70 Amount contributed to Secours Populaire Français for the mentoring operation
France EUR 1145,640 - 190,758
Oekom Group C
[[Prime] C
[[Prime] C--
Microfinance abroad: Amount financed Group EUR m -- - 38.1
Number of employees whose remuneration components are impacted by the Robeco SAM rating
France Number -- 43,432 43,487 Amount of authorisations granted by the Group to MFIs France EUR m 996 109 110.6
Sectors covered by our cross-sector and sector-specific policies Group Number 112 11 12 Beneficiary MFIs of amounts granted by the Group France Number 335 37 35
Customer satisfaction survey: Indiv. customers surveyed France Number 1120,000 120,000 150,000 MFIs in which the Group holds a stake France Number 55 5 5
Customer satisfaction survey: Pro. customers surveyed France Number 114,500 14,500 15,000 Amount of credit lines granted to ADIE France EUR m 99.2 9.6 11.5
Customer satisfaction survey: SMEs surveyed France Number 55,000 5,000 4,000 Loans financed by ADIE with the bank’s help France EUR m 77.4 9 9.7
Response time following a complaint France No. days -- 10 10 Microcredits financed by the Group through ADIE France Number 22,139 2,326 2,459
Ombudsman response time in case of disagreement France No. days -- 90 90 Average amount of microcredits granted France EUR 33,041 3,178 3,942
Boursorama’s response time following a complaint Boursorama No. days -- 15 15 Jobs created or maintained thanks to professional microcredits France Number 11,600 2,405 1,525
Cases handled by the ombudsman, decision issued France Number 2267 456 500 Jobs created or maintained thanks to personal microcredits for employment
France Number 5500 - 837
Number of mediation requests France Number -- - 5,418 Customers receiving basic banking services France Number 88,906 10,672 11,687
Customer satisfaction survey: Individual customers surveyed CDN Number 445,990 45,990 46,871 Customers receiving basic banking services at Crédit du Nord CDN Number -- 840 1,007
Customer satisfaction survey: Professional customers surveyed CDN Number 55,568 5,568 5,779 Customers with the Généris service or equivalent (including CDN) France Number 338,527 46,033 51,112
Customer satisfaction survey: Companies surveyed CDN Number 33,571 3,571 3,718 Manko customers Africa Number 55,000 8,500 10,000
Frequency of satisfaction surveys CDN No. months 112 12 12 Number of loans granted Africa EUR m -- 5,500 5,725
Transactions that have undergone an E&S assessment GBIS Number 1106 84 97 Amount of loans granted by Manko to its customers Africa Number 88 16 27
Commitments on transactions undergoing an E&S assessment Group EUR bn 66.6 5.0 5.5 Support by amicable negotiation platforms France Number 333,000 28,000 31,000
Amounts of Positive Impact Financing Group EUR bn 11.86 2.24 2.70 Customers who returned to a sound financial footing after receiving support from the platforms
France % 667% 70% 70%
"Positive Impact Finance" structured products or those with an ESG underlying subscribed by customers
Group EUR m -- 5 174 Societe Generale's role in the fight against climate change
Current assets managed under ESG criteria Group EUR m 2273 134 190 Goal: Amounts contributed to Energy Transition consulting and financing between 2016 and 2020
Group EUR bn -- - 100
Deposits in SRI-certified employee savings plan Group EUR m 4406.8 452 542 o.w. goal: Amounts contributed to consulting and financing for renewable energy projects between 2016 and 2020
Group EUR bn 10 10 15
SRI assets generated by Global Markets Group EUR bn 00.99 1.5 1.65 o.w. goal: Nominal amounts of led or co-led green bond issues between 2016 and 2020
Group EUR bn - - 85
Number of green bond issues, led or co-led France Number 66 8 27
SRI assets managed by life insurance Sogecap EUR m 440.02 59.74 98.9 Amount of green bond issues for 2016-2017 France EUR bn - - 30.4
Offering of SRI financial vehicles Sogecap Number 441 54 56 Amounts relating to consulting and financing for renewable energy projects or 2016-2017
Group EUR bn -- - 8.3
SRI assets under Lyxor management Lyxor EUR bn 00.32 13 18 Amount of green financing Group EUR bn 11.97 3.12 2.89
Assets involving exclusion lists Lyxor EUR bn -- 0.8 1.1 ALD's electric car fleet World Vehicles 66,700 9,132 10,268
Assets involving environmental issues Lyxor EUR m -- 493 722 ALD's electric and hybrid car fleet World Vehicles 33,000 9,132 18,393
Assets involving ESG selection Lyxor EUR m -- 6 27 Amount of deposits in sustainable development savings accounts (LDD)
France EUR bn 88 8 8.19
Societe Generale’s commitment to society Expresso loans for "clean vehicles" granted since their implementation
France Number 66,695 10,000 13,503
Projects supported by the Foundation since 2006 (number of countries)
Group Number 7774 867 951 Amount of Expresso loans granted since their implementation France EUR m 888 128 170
Countries supported by the Foundation since 2006 Group Number 226 29 18 Amount contributed to the ONF through business cards France EUR 1126,855 151,261 180,636
Amounts donated by the Foundation since 2006 for these projects Group EUR m 119 21 24 Reducing the Group's carbon footprint Amounts donated to citizenship and cultural sponsorship/partnerships
Group EUR m -- - 19.1 Group-level carbon price Group EUR / TCO2 110 10 10
Skills sponsorship actions (employees involved) Group Number 113,000 12,600 16,300 Amount of internal carbon tax collected Group EUR m 33.4 3.1 3.1
Employees who have participated in the Citizen Commitment Group Number 77,000 12,000 8,000 Number of initiatives that have won awards as part of the internal carbon tax process since 2012
Group Number 1119 185 240
Countries where citizen engagements have taken place Group Number 339 43 30 Savings on overheads via the internal carbon tax process since 2012
Group EUR m 113 26 95
Amounts contributed to non-profit projects related to social inclusion through sporting and cultural activities
Group K EUR 4430 600 440 Savings on avoided GHG emissions via the internal carbon tax process since 2012
Group Tonnes 44,700 11,000 38,000
Pro Bono days organised since 2012 Group Days 440 49 51 Energy savings via the internal carbon tax process since 2012 Group GWh 330 58 220
Employees who have participated in Pro Bono days since 2012 Group Number 2213 346 366 Goal: reducing GHG emissions in 2020 compared with 2014 Group % -- -220% -225%
Number of hours dedicated to Pro Bono days since 2012 Group Hours 22,000 2,600 2,800 Actual reduction of GHG emissions in 2020 compared with 2014 Group % -- -99.0% -113.3%
Supporting entrepreneurship and the ssocial and solidarity economy Goal: increasing the buildings' energy performance in 2020 compared with 2014
Group % -- 20% 20%
Share of the Group's workforce outside France Group % 660% 60% 60% Energy performance compared with 2014 Group % -- 8.9%% 11.5%%
Presence in Africa, number of countries Africa Number 118 18 19 ISO50001-certified buildings France Number -- 19 19
Number of customers in Africa Africa Millions 33.5 3.4 4.0 Ref. year
2014 2016 2017
of which number of companies Africa Number 120,000 150,000 150,000 Surface area of the building stock Group Millions of m2 44.04 4.01 3.98
Number of large and medium-sized corporate customers of the Group
France Number 880,000 85,000 92,000 Water consumption Group Millions of m3 11.99 1.87 1.82
Number of large and medium-sized corporate customers of the Group
Europe/Russia Number -- - 195,683 Total energy consumption Group GWh 8898 818 795
Number of VSB customers of the Group in France France Number 2260,000 240,000 245,000 Total consumption per occupant Group KWh 55,939 5,323 5,009
Number of SME customers of the Group in Europe (excluding France)
Europe/Russia Number -- - 183,844 Total electricity consumption Group GWh 6627 588 582
Amount of financing granted to SMEs Franfinance EUR m -- - 266 Electricity consumption per occupant Group KWh 44,145 3,829 3,670
Number of new corporate relationships France Number 224,088 19,341 19,664 Share of green electricity in the Group's electricity consumption Group % 114% 29% 36%
Number of partnership agreements signed with IFIs Europe/Russia Number -- - 9 Production from anaerobic digestion of food waste and solar panels
France GWh 00.30 1.57 1.68
Amount of partnerships signed with IFIs Europe/Russia EUR bn -- - 1.6 Waste production Group Tonnes 222,127 18,199 15,075
Lines financed by IFIs for SMEs (78.5%) Europe/Russia EUR bn -- - 1.26 Share of recycled waste Group % 227% 54% 61%
Lines financed by IFIs for the environment (5%) Europe/Russia EUR m -- - 80.50 Km travelled by all employees Group Millions of km 5508 523 524
Number of contracts signed with the EIB Europe/Russia Number -- - 4 Average number of km travelled per employee Group Km 33,435 3,514 3,438
Amounts of contracts signed with the EIB Europe/Russia EUR m -- - 240 Total paper consumption 1 Group Tonnes 117,483 14,386 13,349
Outstanding amounts with states and local authorities Group EUR bn 116.0 16.5 15.7 Office paper consumption per occupant Group Kg 1117 95 86
Outstanding amounts with states and local authorities Franfinance EUR m -- - 15.7 Share of recycled paper in recycled paper consumption Group % 339% 53% 44%
Number of customer associations France Number 1100,000 100,000 100,000 Reduction in paper consumption per year Group % --66.4% -112% -77%
Number of customer associations Franfinance Number -- - 2,629 Carbon footprint Group Tonnes of Co2 3357,294 332,946 327,469
Partner solidarity associations of the Group France Number 550 49 49 Carbon footprint, per occupant Group CO2 T/Occ. 22.52 2.29 2.18
Amount of donations to solidarity associations France EUR m 11.9 1.8 9.6 SCOPE 1 2 Group Tonnes of CO2 e 337,146 29,991 29,174
Beneficiary associations of the solidarity savings service France Number 440 38 37 SCOPE 2 3 Group Tonnes of CO2 e 2206,045 196,253 195,022
Amount contributed to partner associations from charity bank cards since 2008
France EUR m 3.96 4.84 5.90 SCOPE 3 4 Group Tonnes of CO2 e 1114,103 106,702 103,273
Solidarity savings services France Number 444,267 47,639 30,612
(1) Includes office paper, documents for customers, envelopes, account statements and other types of paper. (2) Includes direct emissions related to energy consumption and emissions of fluorinated gases. (3) Includes indirect emissions related to energy consumption. (4) Includes GHG emissions related to overall paper consumption, business travel, transport of goods and energy consumption of data centres hosted in
France and waste.

5 I
CORPORATE SOCIAL RESPONSIBILITY
APPENDICES
294 I 2018 REGISTRATION DOCUMENT I S O C I E T E G E N E R AL E G R O U P
Scope Unit 2015 2016 22017 SScope UUnit 22015 22016 22017
RResponsible Employer Share of the present permanent workforce that has had an appraisal Group % 993% 993% 993%
Countries where the Group is present Group Country 666 665 667 Financing of a Fintech incubator Group EUR m -- -- 22
Group employees Group Individuals 1145,703 1145,672 1147,125 Employees who have participated in Corporate University programmes Group Individuals 6600 6650 7755
of which in Western Europe Europe Individuals 772,061 771,835 773,177 % of women who have participated in a Corporate University programme Group % -- -- 339%
of which share in France France % 440% 440% 440% % of non-French employees who have participated in a Corporate University programme
Group % -- -- 223%
of which in Central and Eastern Europe Europe Individuals 550,457 449,639 448,549 Agreements with employee representatives signed Group Number 1194 2217 2215
of which share in Russia Russia % 113.6%% 113.7%% 113.5%% of which Societe Generale SA in France France Number 884 114 116
of which share in the Czech Republic Czech
Republic % 66.7%% 66.7%% 66.7%% Total amount of staff costs Group EUR m 99,476 99,455 99,749
of which share in Romania Romania % 66.3%% 66.4%% 66.5%% Average amount of gross annual remuneration in France France EUR 553,371 554,068 554,653
of which in Africa and Middle East Africa Individuals 112,402 112,498 112,914 Employees who are also shareholders Group Individuals 990,000 886,000 880,000
of which in Asia and Oceania Asia Individuals 77,761 88,624 99,408 Share of capital held by employees Group % 66.83%% 66.61%% 55.93%%
of which in Americas Americas Individuals 33,022 33,076 33,077 Share of voting rights of employees Group % 111.5%% 112.0%% 110.9%%
Share of workforce in low- or middle-income countries Group % -- -- 112.3%% Share of employees covered in Africa Africa % 999% 1100% 1100%
Share of workforce in upper-middle-income countries Group % -- -- 224.7%% Individuals covered by the Group mutual insurance France Number 1119,500 1120,500 1120,500
Share of the Group's workforce in retail banking and international financial services Group % 550.3%% 449.8%% 449.4%% Psychosocial risk prevention campaigns (subsidiaries and branches) Group % -- -- 990%
Share of the Group's workforce in French Retail Banking France % 226.9%% 226.6%% 226.0%% Medical professionals present in the premises (subsidiaries and branches) Group % -- -- 885%
Share of the Group's workforce in Global Banking and Investor Solutions Group % 114.9%% 114.1%% 114.1%% Average annual working time3 Group Hours 11,739 11,738 11,727
Share of the Group's workforce in the corporate divisions France % 77.9%% 99.5%% 110.5%% Part-time employees Group Number 88,687 88,789 88,889
Number of permanent contracts Group Individuals 1135,050 1135,511 1136,956 Share of part-time employees Group % 66% 66% 66%
of which permanent contracts in France France Individuals - - 555,200 of which part-time employees in France France Number 66,355 66,287 66,279
of which Societe Generale SA France France Individuals - - 440,636 Total overtime hours4 Group Hours 995,633 883,851 1102,661
Number of fixed-term contracts Group Individuals 110,653 110,161 110,169 Average overtime per employee4 Group Hours 11.6 11.4 11.7
Number of temporary workers Group Individuals 110,891 111,338 112,085 Work accidents Group Number 9945 8821 8816
Outside contractors1 Group Individuals 66,850 77,535 88,277 Work accident frequency rate5 Group % 44% 33.5%% 33.5%%
New hires on permanent contracts Group Individuals 115,155 116,283 117,797 Overall absenteeism rate6 Group % 33.5%% 33.5%% 33.6%%
of which new hires on permanent contracts in France France Individuals 33,901 44,151 44,571 Rate of absenteeism due to sick leave Group % 11.9%% 11.9%% 11.9%%
of which new hires on permanent contracts for Societe Generale SA France France Individuals 22,541 22,831 22,754 Rate of absenteeism due to maternity leave Group % 11.3%% 11.3%% 11.3%%
of which share of women Group % 550.6%% 556.9%% 557.0%% Share of women in the Group Group % 559.1%% 559.1%% 558.7%%
New hires on fixed-term contracts Group Individuals 99,627 110,458 111,039 Share of women managers in the Group Group % 443.3%% 444.2%% 444.0%%
of which new hires on fixed-term contracts in France (including work-study contracts)
France Individuals 33,859 44,656 44,699 Share of women in the Group's senior management (Top 1000) Group % 221.2%% 222.2%% 223.2%%
of which share of women Group % 667.3%% 668.7%% 667.2%% Share of women on the Management Committee (63 members)7 Group % 220.0%% 221.3%% 222.0%%
Departures of employees on permanent contracts Group Individuals 119,402 116,714 117,413 Share of women on the Board of Directors (14 members)8 Group % 550.0%% 553.8%% 550.0%%
of which resignations Group % 449% 773% 661% Share of women executives in France France % 445.2%% 445.7%% 446.2%%
of which dismissals Group % 338% 220% 118% Amount allocated to fight against unjustified pay gaps France EUR m 11.7 11.7 11.7
of which share of retirements Group % 110.0%% 77.0%% 99.0%% Number of cases involved in a correction since 2008 Group Individuals 66,600 77,500 88,300
Voluntary turnover rate (due only to resignations) Group % 77.0%% 77.3%% 77.7%% Total amount allocated: fight against unjustified pay gaps since 2008 Group EUR m 110.9 112.7 114.4
Voluntary turnover rate excluding the Russian and Indian entities2
Group excluding
Russia and India
% 55.2%% 55.5%% 55.3%% Amount of employer contribution and profit sharing France EUR m -- 995 1116
Voluntary turnover rate in France France % 33.3%% 33.5%% 33.8%% Nationalities represented in the Group Group Number 1122 1123 1138
Average seniority in the Group Group Years 99.2 99.5 99.7 Share of employees who are not French nationals Group % 558% 558% 557%
Applications processed by the Careers site Group Number 3341,000 3300,000 4400,000 Share of non-French individuals on the Management Committee Group % 225% 223% 225%
Visits to the Careers site Group Millions 33.4 33.4 44.0 Average age of employees Group Number 337.7 337.7 337.8
Work-study participants who have worked for the Group Group Individuals 55,056 55,188 66,145 Share of employees under the age of 30 SG Group % 224% 223% 223%
of which work-study participants as of 31/12 at Societe Generale SA in France France Individuals 22,158 22,150 22,168 Share of employees over the age of 45 SG Group % 226% 226% 226%
of which work-study participants during the year in France Group Individuals 33,330 33,553 33,562 Employees with disabilities SG Group Number 22,302 22,365 22,476
Volunteers for International Experience (VIE) as of 31/12 Group Individuals 4480 5502 5592 of which employees with disabilities in France France Number 11,149 11,684 11,743
Funded chairs Group Number 111 111 113 Share of employees with disabilities SG Group % 11.60%% 11.60%% 11.70%%
Amount of chair funding, in millions of euros Group EUR m 11.5 66.0 44.3 RResponsible Sourcing 22018 Targets 22015 22016 22017
Group internal mobility rate Group % 117% 117% 118% Amount of Group overheads in 2017 Group EUR bn N/A 66.50 66.50 66.63
Employees who have undergone internal mobility Group Individuals 223,385 222,711 224,010 % of invoices paid in 30 days in France over the year 9 France %
75% at end-2017
postponed to 2018
555% 660% 661%
of which Societe Generale SA in France France Individuals 88,700 99,200 110,234 Average payment time in days for invoices in France over the year (weighted by value)10
Group No. days
N/A 440 441 443
Share of positions filled through internal mobility Group % 660% 558% 557% Share of expenditure among French SMEs/mid-caps France % 662% 661% 665%
of which Societe Generale SA in France France % 777% 776% 779% Share of expenditure among French SMEs France % +20%/2015 332% 332% 335%
International mobility workforce Group Individuals 11,000 11,000 9910 Rating in the SME Pact supplier relations survey France % -1 776% 883% 777%
Share of employees proud to belong to Societe Generale Group Group % 884% 884% 881% Share of purchasers trained in CSR Group % 100% -- 880% 885%
Share of employees who completed at least one training programme Group % 777% 884% 880% Number of KYS alerts (E&S controversies) handled Group Number N/A -- 44 00
Hours of training provided Group Millions of
hours 44 33.8 33.8 % of "targeted" suppliers under contract evaluated for CSR Group % 1 -- -- 559%
of which done remotely Group % 114% 226% 229% % of calls for tenders (competitive tendering only) incorporating CSR criteria (on eligible categories)
Group % 1 -- -- 886%
Amounts devoted to training Group EUR m 993 992.3 998.0 Average weighting of CSR criteria in calls for tenders Group % N/A -- -- 66%
Average number of hours of training per employee Group Hours 225.2 226.2 225.6 Number of cases referred to mediation Group Number N/A 00 00 00
Number of teleworkers Group Individuals -- -- 115,000 Number of on-site supplier audits Group Number 10/year 44 77 11
Rates of telecommuting employees in Societe Generale SA departments in France where teleworking is possible
Group % 227% 227% 440% Number of supplier progress plans Group Number 10/year 99 33 11
Employees who have had an appraisal Group Individuals 1116,900 1116,700 1118,720
(1) Monthly average in 2017 for Societe Generale SA in France. Use of outside contractors mainly concerns specialised activities such as IT and consulting. (2) Voluntary turnover varies depending on the business and geographic region: highly competitive financial markets (in particular in Asia) and countries with
a dynamic labour market record higher voluntary turnover rates than most of the Group’s entities (e.g. Russia, India). (3) Time weighted based on the size of the entities’ workforce. (4) The definition of overtime is taken from French law, which means that the reporting scope for this indicator is therefore limited to France (Societe
Generale SA and subsidiaries). (5) See note on methodology on page 291. Given the nature of the Group’s activities, the rate of accident severity is not an indicator currently being
monitored. (6) Number of days absent/total number of days paid, as a percentage. (7) The Management Committee includes the members of the Executive Committee. At 31st December 2017, it included 13 women (vs 11 at the beginning
of 2014, 8 at the beginning of 2011 and 6 at the beginning of 2010). (8) Board of Directors: 7 women (including 2 staff-elected directors). (9) Annual performance vision for 2015, 2016 and 2017 compared with monthly vision communicated in previous years. (10) Ibid. The full report is available at https://www.societegenerale.com/csr-report/index.html, under “The Group’s Environmental and Social Data”.

5
CORPORATE SOCIAL RESPONSIBILITY APPENDICES
4 I 5CCORPORATE SOCIAL RESPPONSIBILITY
S O C I E T E G E N E R AL E G R O U P I 2018 REGISTRATION DOCUMENT I 295
INDEPENDENT VERIFIER’S REPORT ON THE CONSOLIDATED SOCIAL, ENVIRONMENTAL AND SOCIETAL INFORMATION PRESENTED IN THE MANAGEMENT REPORT This is a free translation into English of the original report issued in the French language and it is provided solely for the convenience of English-speaking users. This report should be read in conjunction with, and construed in accordance with, French law and professional standards applicable in France.
Societe Generale – Financial year ended on 31st December 2017 To the Shareholders,
In our quality as an independent verifier accredited by the COFRAC(1) under number 3-1050, and as a member of the network of one of the statutory auditors of Societe Generale, we present our report on the consolidated social, environmental and societal information established for the financial year ended on 31st December 2017, presented in the management report, hereafter referred to as the “CSR Information” pursuant to the provisions of Article L. 225-102-1 of the French Commercial Code (Code de commerce).
RESPONSIBILITY OF THE COMPANY It is the responsibility of the Board of Directors to draw up a management report including the CSR Information referred to in Article R. 225-105 of the French Commercial Code, in accordance with the protocols used by the company (hereafter referred to as the “Criteria”), a summary of which is included in the management report and available on request from the Company’s head office.
INDEPENDENCE AND QUALITY CONTROL Our independence is defined by regulations, the Code of Ethics of our profession as well as the provisions in Article L. 822-11-3 of the French Commercial Code. In addition, we have implemented a quality control system, which includes documented policies and procedures to ensure compliance with ethical standards, professional standards and applicable laws and regulations.
RESPONSIBILITY OF THE INDEPENDENT VERIFIER It is our role, based on our work:
to attest to whether the required CSR Information is presentin the management report or, in the case of its omission, thatan appropriate explanation has been provided, inaccordance with the third paragraph of Article R. 225-105 ofthe French Commercial Code (Attestation of Presence ofCSR Information);
to express a limited assurance conclusion that the CSRInformation, overall, is fairly presented in all material aspectsin accordance with the Criteria (Limited Assurance on CSRInformation).
Nonetheless, it is not our role to give an opinion on the compliance with other legal dispositions where applicable, in particular those provided for in the Article L. 225-102-4 of the French Commercial Code (vigilance plan) and in the Sapin II law n°2016-1691 of 9th December 2016 (anti-corruption).
Our verification work was undertaken by a team of seven people between September 2017 and February 2018 for an estimated duration of fifteen weeks.
We conducted the work described below in accordance with the professional standards applicable in France and the Order of 13th May 2013 determining the conditions under which an
independent verifier conducts its mission, and in relation to the Limited Assurance on CSR Information, in accordance with the international standard ISAE 3000(2).
1. Attestation of presence of CSRInformation NATURE AND SCOPE OF THE WORK We obtained an understanding of the company’s CSR issues, based on interviews with the management of relevant departments, a presentation of the company’s strategy on sustainable development based on the social and environmental consequences linked to the activities of the company and its societal commitments, as well as, where appropriate, resulting actions or programmes.
We have compared the CSR Information presented in the management report with the list as provided for in Article R. 225-105-1 of the French Commercial Code.
In the absence of certain consolidated information, we have verified that the explanations were provided in accordance with the provisions of Article R. 225-105-1, paragraph 3, of the French Commercial Code.
We verified that the CSR Information covers the consolidated perimeter, namely the entity and its subsidiaries within the meaning of Article L. 233-1 of the French Commercial Code and the entities that it controls within the meaning of Article L. 233-3 of the same Code with the limitations specified in the Note on methodology in Chapter 5 of this Registration Document.
CONCLUSION Based on this work, and given the limitations mentioned above, we confirm the presence in the management report of the required CSR Information.
2. Limited assurance on CSRInformation NATURE AND SCOPE OF THE WORK We conducted about 30 interviews with the people responsible for the preparation of the CSR Information in the departments in charge of the data collection process and, where applicable, the people responsible for internal control and risk management processes, in order to:
assess the suitability of the Criteria for reporting, in relation totheir relevance, completeness, reliability, neutrality andunderstandability, taking into consideration, if relevant,industry standards;
verify the implementation of the process for the collection,compilation, processing and control in respect of thecompleteness and consistency of the CSR Information andidentify the procedures for internal control and riskmanagement related to the preparation of the CSRInformation;
(1) The scope of the accreditation is available at www.cofrac.fr. (2) ISAE 3000 - Assurance engagements other than audits or reviews of historical information.

5 I
CORPORATE SOCIAL RESPONSIBILITY
APPENDICES
296 I 2018 REGISTRATION DOCUMENT I S O C I E T E G E N E R AL E G R O U P
We determined the nature and extent of our tests and inspections based on the nature and importance of the CSR Information in relation to the characteristics of the company, its social and environmental issues, and its strategy in relation to sustainable development and industry best practices.
For the CSR Information that we considered the most important(1):
at the level of the consolidated entity and the businessdivisions we consulted documentary sources and conductedinterviews to corroborate the qualitative information(organisation, policies, actions, etc.), we implementedanalytical procedures on the quantitative information andverified, on a random basis, the calculations and theconsolidation of the data, and also verified its coherence andconsistency with the other information presented in themanagement report;
at the level of the representative sample of entities that weselected(2), based on their activity, their contribution to theconsolidated indicators, their location and a risk analysis, weconducted interviews to verify the correct application of theprocedures and carried out detailed tests on the basis ofsamples, consisting of verifying the calculations made andlinking them with supporting documentation. The samplethus selected represents 46% of the total workforce for thesocial data, 19% of energy consumption for theenvironmental data and 22% of the consolidated net bankingincome for the business lines data.
For the other consolidated CSR Information, we assessed its consistency in relation to our knowledge of the company.
Finally, we assessed the relevance of the explanations in light of, where appropriate, the partial or total absence of certain information.
We consider that the sampling methods and sizes of the samples that we considered by exercising our professional judgement allow us to express a limited assurance conclusion; an assurance of a higher level would have required more extensive verification work. Due to the necessary use of sampling techniques and other limitations inherent in the functioning of any information and internal control system, the risk of non-detection of a significant anomaly in the CSR Information cannot be totally eliminated.
CONCLUSION Based on this work, we have not identified any significant misstatement that causes us to believe that the CSR Information, taken as a whole, has not been fairly presented, in compliance with the Criteria.
OBSERVATIONS Without qualifying our conclusion above, we draw your attention to the following points:
Sectoral policies and environmental and social assessment of clients, which are voluntary commitments from Societe Generale, are not sufficiently implemented within certain Group business lines and geographical locations, in particular within International Retail Banking.
Paris La Défense, 8th March 2018
Independent Verifier
ERNST & YOUNG et Associés
Caroline Delerable
Partner, Sustainable Development
Hassan Baaj
Partner
(1) SSocietal and business information:
Indicators (quantitative information): the number and amount of dedicated transactions reviewed under E&S assessment (under the Equator Principles scope as well as the voluntary extended scope of Societe Generale), the number of Corporate and Investment Banking clients having undergone an E&S reputational risk assessment, the amounts of new positive impact financing.
Qualitative information: the Group’s CSR ambition and governance, the range of responsible products, the Positive Impact Finance initiative, the implementation of the Group’s environmental and social commitments in performing its activities (integration of ESG issues in risk management topics, sector policies, Equator Principles, E&S evaluations of transactions and clients), taking into account social and environmental issues in the sourcing policy.
Environmental information:
- Indicators (quantitative information): CO2 emissions per occupant.
- Qualitative information: the general environmental policy, management tools for climate strategy, including the methodology for monitoring outstandings in the coal sector.
Social information:
- Indicators (quantitative information): total headcount, new hires, departures including dismissals, total number of hours of training and average number per employee.
- Qualitative information: general policy implemented in strategic workforce planning and skills (#MonJob2020) and the development of a new HR information system.
(2) The entities selected are:
- For societal/business, environmental and social data: Crédit du Nord Group (France), ALD Automotive Group (world), BRD (Romania), SGBCI (Côte d’Ivoire);
- For social data: SGPM (France);
- For societal/business data: Societe Generale New York (United States), SGBT (Luxembourg).
5
CORPORATE SOCIAL RESPONSIBILITY
Societal and business information:
Environmental information:
Social information:
CROSS-REFERENCE TABLE
5 I 5CCORPORATE SOCIAL RESPPONSIBILITY
S O C I E T E G E N E R AL E G R O U P I 2018 REGISTRATION DOCUMENT I 297
5 . C R O S S - R E F E R E N C E TA B L E
CSR CONCORDANCE TABLE (ARTICLE 225 – GRENELLE II)
INDICATORS WHERE CAN THEY BE
FOUND?
1. Social information Page
a) Employment
Total headcount and breakdown by gender, age and geographic region 14, 242-244, 249, 294
New hires and dismissals 244, 294
Compensation, changes in compensation 250-251, 294
b) Organisation of work
Organisation of working time 252, 294
Absenteeism 252, 294
c) Labour relations
Organisation of labour-management dialogue, especially procedures used to inform, consult and negotiate with staff 246-248, 294
Summary of collective agreements 246-247
d) Health and safety
Health and safety conditions at work (Stress + Health + Well-being) 251, 252, 294
Agreements signed with trade unions or staff representatives regarding health and safety at work 246-248, 294
Work accidents, including frequency and severity 252, 294
e) Training (Skills development)
Training policies implemented 245
Total number of training hours 245, 294
f) Equal treatment
Measures taken to promote gender equality 248-249, 294
Measures taken to promote job equality and the integration of people with disabilities 248-249, 294
Non-discrimination policy 248, 265-268
g) Promotion and respect of the International Labour Organization’s fundamental conventions:
- on protecting freedom of association and the right to collective bargaining 256, 265-268, 246-248
- on eliminating discrimination in employment and occupation 256, 265-268, 248-249
- on eliminating forced or compulsory labour 256, 265-268
- on abolishing child labour 256, 265-268

5 I
CORPORATE SOCIAL RESPONSIBILITY
CROSS-REFERENCE TABLE
298 I 2018 REGISTRATION DOCUMENT I S O C I E T E G E N E R AL E G R O U P
INDICATORS WHERE CAN THEY BE
FOUND?
2. Environmental information Page
a) General environmental policy
Company policy addressing environmental issues and, where applicable, steps taken to evaluate environmental performance or obtain environmental certification 268-269, 272-280
Employee training and awareness on environmental protection 261, 271
Resources implemented to prevent environmental risks and pollution 265-270, 275-279
Amount of provisions and guarantees for environmental risks, provided that such information is not liable to harm the company’s interests in any ongoing legal disputes No provisions
b) Pollution
Measures for preventing, reducing or offsetting emissions into the air, water and soil with a severe impact on the environment 278, 268-269
Sound pollution and any other form of business-specific pollution Not material for the company’s activity
c) Circular economy
i) WWaste prevention and management
Measures for prevention, recycling, reuse, other forms of recovery and waste disposal 274, 279, 293
Actions to reduce food wastage 279
ii) SSustainable use of resources
Water consumption and water supply based on local constraints 265, 279, 293
Consumption of commodities and steps taken to promote more efficient use thereof As a tertiary sector company, Societe Generale does not have any physical
production activity. Its commodities consumption
is therefore not material. 268-269, 293
Energy consumption, steps taken to improve energy efficiency and use of renewable energy sources 272-280, 288-290, 293
Land use Not material for the company’s activity
d) Climate change
Significant sources of greenhouse gas emissions generated by the company’s activities, in particular through the use of the goods and services it produces 272, 276, 277
Adapting to the consequences of climate change 265-269, 275-276, 277, 288-290
e) Actions taken to preserve and develop biodiversity 268
3. Information on CSR commitments
a) Regional, economic and social impacts of the company’s activities
In relation to jobs and regional development 282-283
On surrounding and local communities 256, 265-270, 284, 286
b) Relations with persons or organisations concerned by the company’s activities
Conditions for dialogue with these persons or organisations 239, 241, 256-259, 262-
264,265-270
Partnerships and corporate sponsorship 252-255, 284, 294
c) Subcontractors and suppliers
Incorporation of CSR criteria into the purchasing policy 267, 270-271
Importance of outsourcing and incorporation of CSR criteria in relations with suppliers and subcontractors 267, 270-271
d) Loyalty of practices
Anti-corruption initiatives 228-229, 241-242
Measures in favour of consumer health and safety 263-264, 284-286
e) Other human rights initiatives 249, 265-270, 270-271
F INANC IAL INFORMAT ION

CORPORATE SOCIAL RESPONSIBILITY
S O C I E T E G E N E R AL E G R O U P I 2018 REGISTRATION DOCUMENT I 299
6 F INANC IAL II N FORMAT ION
1. Consolidated financial statements .................................................................... 302
2. Notes to the consolidated financial statements ................................................ 309
3. Statutory Auditors’ report on the consolidated financial statements .................. 448
4. Societe Generale management report .............................................................. 454
5. Financial statements ........................................................................................ 461
6. Notes to the parent company financial statements ........................................... 464
7. Statutory Auditors’ report on the financial statements ...................................... 524

6 I 1
CONSOLIDATED FINANCIAL STATEMENTS FF I N A N C I A L I N F O R M A T I O NN
300 I 2018 REGISTRATION DOCUMENT I S O C I E T E G E N E R AL E G R O U P
1. CONSOLIDATED FINANCIAL STATEMENTS
2. NOTES TO THE CONSOLIDATED FINANCIAL STATEMENTS

6
CONSOLIDATED FINANCIAL STATEMENTS
1 I 6FF I N A N C I A L I N F O R M A T I O NN
S O C I E T E G E N E R AL E G R O U P I 2018 REGISTRATION DOCUMENT I 301
Contents of the consolidated financial statements 11. CCONSOLIDATED FINANCIAAL STATEMENTSS CONSOLIDATED BALANCE SHEET - ASSETS ............................................................................................................................................................... 302 CONSOLIDATED BALANCE SHEET - LIABILITIES .......................................................................................................................................................... 303 CONSOLIDATED INCOME STATEMENT ......................................................................................................................................................................... 304 STATEMENT OF NET INCOME AND UNREALISED OR DEFERRED GAINS AND LOSSES ............................................................................................ 305 CHANGES IN SHAREHOLDERS’ EQUITY ....................................................................................................................................................................... 306 CASH FLOW STATEMENT .............................................................................................................................................................................................. 308 22. NNOTES TO THE CONSOLIDATED FINANCIAL STATEMENTS NOTE 1 - SIGNIFICANT ACCOUNTING PRINCIPLES ...................................................................................................................................................... 309 NOTE 2 - CONSOLIDATION ............................................................................................................................................................................................ 324
NOTE 2.1 - CONSOLIDATION SCOPE ............................................................................................................................................................... 327 NOTE 2.2 - GOODWILL ...................................................................................................................................................................................... 328 NOTE 2.3 - ADDITIONAL DISCLOSURES FOR CONSOLIDATED ENTITIES AND INVESTMENTS ACCOUNTED FOR USING THE EQUITY METHOD ............................................................................................................................................................................................................ 332 NOTE 2.4 - UNCONSOLIDATED STRUCTURED ENTITIES ................................................................................................................................ 335
NOTE 3 - FINANCIAL INSTRUMENTS ............................................................................................................................................................................. 337 NOTE 3.1 - FINANCIAL ASSETS AND LIABILITIES AT FAIR VALUE THROUGH PROFIT OR LOSS .................................................................. 341 NOTE 3.2 - FINANCIAL DERIVATIVES ................................................................................................................................................................ 344 NOTE 3.3 - AVAILABLE-FOR-SALE FINANCIAL ASSETS .................................................................................................................................. 349 NOTE 3.4 - FAIR VALUE OF FINANCIAL INSTRUMENTS MEASURED AT FAIR VALUE .................................................................................... 351 NOTE 3.5 - LOANS AND RECEIVABLES ............................................................................................................................................................ 361 NOTE 3.6 - DEBTS ............................................................................................................................................................................................. 363 Note 3.7 - INTEREST INCOME AND EXPENSE ....................................................................................................................... 365 NOTE 3.8 - IMPAIRMENT AND PROVISIONS .................................................................................................................................................... 367 NOTE 3.9 - FAIR VALUE OF FINANCIAL INSTRUMENTS MEASURED AT AMORTISED COST ......................................................................... 373 NOTE 3.10 - COMMITMENTS AND ASSETS PLEDGED AND RECEIVED AS SECURITIES ............................................................................... 375 NOTE 3.11 - TRANSFERRED FINANCIAL ASSETS ............................................................................................................................................ 377 NOTE 3.12 - OFFSETTING FINANCIAL ASSETS AND FINANCIAL LIABILITIES ................................................................................................. 379 NOTE 3.13 - CONTRACTUAL MATURITIES OF FINANCIAL LIABILITIES ........................................................................................................... 382
NOTE 4 - OTHER ACTIVITIES .......................................................................................................................................................................................... 383 NOTE 4.1 - FEE INCOME AND EXPENSE .......................................................................................................................................................... 383 NOTE 4.2 - INCOME AND EXPENSE FROM OTHER ACTIVITIES ...................................................................................................................... 384 NOTE 4.3 - INSURANCE ACTIVITIES ................................................................................................................................................................. 385 NOTE 4.4 - OTHER ASSETS AND LIABILITIES .................................................................................................................................................. 389
NOTE 5 - PERSONNEL EXPENSES AND EMPLOYEE BENEFITS ................................................................................................................................... 390 NOTE 5.1 - PERSONNEL EXPENSES AND RELATED-PARTY TRANSACTIONS ............................................................................................... 391 NOTE 5.2 - EMPLOYEE BENEFITS .................................................................................................................................................................... 392 NOTE 5.3 - SHARE-BASED PAYMENT PLANS ................................................................................................................................................. 397
NOTE 6 - INCOME TAX ................................................................................................................................................................................................... 398 NOTE 7 - SHAREHOLDERS’ EQUITY .............................................................................................................................................................................. 402
NOTE 7.1 - TREASURY SHARES AND SHAREHOLDERS’ EQUITY ISSUED BY THE GROUP .......................................................................... 402 NOTE 7.2 - EARNINGS PER SHARE AND DIVIDENDS ...................................................................................................................................... 405
NOTE 8 - ADDITIONAL DISCLOSURES ........................................................................................................................................................................... 406 NOTE 8.1 - SEGMENT REPORTING .................................................................................................................................................................. 406 NOTE 8.2 - OTHER OPERATING EXPENSES .................................................................................................................................................... 410 NOTE 8.3 - PROVISIONS ................................................................................................................................................................................... 411 NOTE 8.4 - TANGIBLE AND INTANGIBLE FIXED ASSETS ................................................................................................................................. 412 NOTE 8.5 - FOREIGN EXCHANGE TRANSACTIONS ......................................................................................................................................... 413 NOTE 8.6 - COMPANIES INCLUDED IN THE CONSOLIDATION SCOPE .......................................................................................................... 414 NOTE 8.7 - FEES PAID TO STATUTORY AUDITORS ......................................................................................................................................... 443
NOTE 9 - INFORMATION ON RISKS AND LITIGATION ................................................................................................................................................... 444
The information on the types of risks, the risk management linked to financial instruments as well as the information on capital management and compliance with regulatory ratios, required by IFRS as adopted by the European Union, are disclosed in Chapter 4 of the present Registration Document (Risks and capital adequacy).
The main characteristics of Societe Generale stock-option plans and free share plans are disclosed in Chapter 3 of the present Registration Document (Corporate governance).
This information belongs to the notes to the consolidated financial statements and has been audited by Statutory Auditors; it is identified as such in Chapters 3 and 4 of the present Registration Document.

6 I 1
CONSOLIDATED FINANCIAL STATEMENTS FF I N A N C I A L I N F O R M A T I O NN
302 I 2018 REGISTRATION DOCUMENT I S O C I E T E G E N E R AL E G R O U P
1 . C O N S O L I D AT E D F I N A N C I A L S TAT E M E N T S
CONSOLIDATED BALANCE SHEET - ASSETS
(In EUR m) 31.12.2017 31.12.2016
Cash, due from central banks 114,404 96,186
Financial assets at fair value through profit or loss* Notes 3.1, 3.2 and 3.4 419,680 500,215
Hedging derivatives Note 3.2 13,641 18,100
Available-for-sale financial assets Notes 3.3 and 3.4 139,998 139,404
Due from banks Notes 3.5 and 3.9 60,866 59,502
Customer loans Notes 3.5 and 3.9 425,231 426,501
Revaluation differences on portfolios hedged against interest rate risk 663 1,078
Held-to-maturity financial assets Note 3.9 3,563 3,912
Tax assets Note 6 6,001 6,421
Other assets* Note 4.4 60,562 71,437
Non-current assets held for sale 13 4,252
Investments accounted for using the equity method
700 1,096
Tangible and intangible fixed assets Note 8.4 24,818 21,783
Goodwill Note 2.2 4,988 4,535
Tootal
1,275,128 1,354,422
* Amounts restated compared to the 31st December 2016 consolidated financial statements, following a change in the balance sheet presentation of premiums to be received / to be paid on options (see Note 3).

6
CONSOLIDATED FINANCIAL STATEMENTS
1 I 6FF I N A N C I A L I N F O R M A T I O NN
S O C I E T E G E N E R AL E G R O U P I 2018 REGISTRATION DOCUMENT I 303
CONSOLIDATED BALANCE SHEET - LIABILITIES
(In EUR m) 31.12.2017 31.12.2016
Due to central banks
5,604 5,238
Financial liabilities at fair value through profit or loss* Notes 3.1, 3.2 and 3.4 368,705 440,120
Hedging derivatives Note 3.2 6,750 9,594
Due to banks Notes 3.6 and 3.9 88,621 82,584
Customer deposits Notes 3.6 and 3.9 410,633 421,002
Debt securities issued Notes 3.6 and 3.9 103,235 102,202
Revaluation differences on portfolios hedged against interest rate risk 6,020 8,460
Tax liabilities Note 6 1,662 1,444
Other liabilities* Note 4.4 69,139 81,893
Non-current liabilities held for sale Note 2.5 - 3,612
Underwriting reserves of insurance companies Note 4.3 130,958 112,777
Provisions Note 8.3 6,117 5,687
Subordinated debt 13,647 14,103
Total lliabilities
1,211,091 1,288,716
Shareholders’’ eequity
Shareholders’’ eequity, Group share
Issued common stocks, equity instruments and capital reserves 29,427 30,596
Retained earnings 27,791 25,813
Net income 2,806 3,874
Sub--total
60,024 60,283
Unrealised or deferred capital gains and losses (651) 1,670
Sub--total equity, Group share
59,373 61,953
Non-controlling interests Note 2.3 4,664 3,753
Total equity
64,037 65,706
Total
1,275,128 1,354,422
* Amounts restated compared to the 31st December 2016 consolidated financial statements, following a change in the balance sheet presentation of premiums to be received / to be paid on options (see Note 3).

6 I 1
CONSOLIDATED FINANCIAL STATEMENTS FF I N A N C I A L I N F O R M A T I O NN
304 I 2018 REGISTRATION DOCUMENT I S O C I E T E G E N E R AL E G R O U P
CONSOLIDATED INCOME STATEMENT
(In EUR m) 2017 2016
Interest and similar income Note 3.7 23,679 24,660
Interest and similar expense Note 3.7 (13,263) (15,193)
Fee income Note 4.1 10,504 10,116
Fee expense Note 4.1 (3,681) (3,417)
Net gains and losses on financial transactions 5,826 7,143
o.w. net gains and losses on financial instruments at fair value through profit or loss Note 3.1 5,113 5,759
o.w. net gains and losses on available-for-sale financial assets Note 3.3 713 1,384
Income from other activities Note 4.2 22,045 20,780
Expenses from other activities Note 4.2 (21,156) (18,791)
Net banking income 23,954 25,298
Personnel expenses Note 5 (9,749) (9,455)
Other operating expenses Note 8.2 (7,083) (6,423)
Amortisation, depreciation and impairment of tangible and intangible fixed assets
(1,006) (939)
Gross operating income
6,116 8,481
Cost of risk Note 3.8 (1,349) (2,091)
Operating income 4,767 6,390
Net income from investments accounted for using the equity method Note 2.3 92 129
Net income/expense from other assets 278 (212)
Value adjustments on goodwill Note 2.2 1 -
Earnings before tax
5,138 6,307
Income tax Note 6 (1,708) (1,969)
Consolidated net income 3,430 4,338
Non-controlling interests Note 2.3 624 464
Net income, Group share 2,806 3,874
Earnings per ordinary share Note 7.2 2.92 4.26
Diluted earnings per ordinary share Note 7.2 2.92 4.26
6
CONSOLIDATED FINANCIAL STATEMENTS
1 I 6FF I N A N C I A L I N F O R M A T I O NN
S O C I E T E G E N E R AL E G R O U P I 2018 REGISTRATION DOCUMENT I 305
STATEMENT OF NET INCOME AND UNREALISED OR DEFERRED GAINS AND LOSSES
(In EUR m)
2017 2016
Net income 3,430 4,338
Unrealised or deferred ggains and losses that will be reclassified subsequently into income (2,371) 50
Translation differences(1) (2,088) 389
Available-for-sale financial assets (218) (321)
Revaluation differences 69 661
Reclassified into income (287) (982)
Hedging derivatives (100) (6)
Revaluation differences (94) 1
Reclassified into income (6) (7)
Unrealised gains and losses of entities accounted for using the equity method and that will be reclassified subsequently into income (20) -
Tax on items that will be reclassified subsequently into income 55 (12)
Unrealised or deferred gains and losses that will not be reclassified subsequently into income 19 (64)
Actuarial gains and losses on post-employment defined benefits plans 42 (54)
Tax on items that will not be reclassified subsequently into income (23) (10)
Total unrealised or deferred gains and losses (2,352) (14)
Net income and unrealised or deferred gains and losses 1,078 4,324
o.w. Group share 504 3,891
o.w. non-controlling interests 574 433
(1) The variation in translation differences amounted to EUR -2,088 million and consisted of a: - EUR -2,079 million variation in Group translation differences, mainly due to the appreciation of the Euro against the US dollar (EUR -1,722 million) and
against the Russian rouble (EUR -73 million); - EUR -9 million variation in translation differences attributable to non-controlling interests.

6 I 1
CONSOLIDATED FINANCIAL STATEMENTS FF I N A N C I A L I N F O R M A T I O NN
306 I 2018 REGISTRATION DOCUMENT I S O C I E T E G E N E R AL E G R O U P
CHANGES IN SHAREHOLDERS’ EQUITY Capital and associated reserves
Retained earnings
Net income,
Group Share (In EUR m)
Issued common
stocks
Issuing premium
and capital reserves
Elimination of treasury stock
Other equity instruments Total
Shareholders’’ eequity at 1st January 2016 1,008 20,206 (449) 8,772 29,537 27,906 -
Increase in common stock 2 6 8 (2) -
Elimination of treasury stock 78 78 (20) -
Issuance / Redemption of equity instruments 908 908 251 -
Equity component of share-based payment plans 65 65 -
2016 dividends paid (2,289) -
Effect of acquisitions and disposals on non-controlling interests
23 -
Sub--total of changes linked to relations with sshareholders 2 71 78 908 1,059 (2,037) -
Unrealised or deferred gains and losses (59) -
Other changes 3 -
2016 net income for the period 3,874
Sub--total - - - - - (56) 3,874
Change in equity of associates and joint ventures accounted for by the equity method
Shareholders’’ eequity at 31st December 2016 1,010 20,277 (371) 9,680 30,596 25,813 3,874
Appropriation of net income 3,874 (3,874)
Shareholders’’ eequity at 1sst JJanuary 22017 1,010 20,277 (371) 9,680 30,596 29,687 -
Increase in common stock 8 8
Elimination of treasury stock (see Note 7.1) (122) (122) (29)
Issuance / Redemption of equity instruments (see Note 7.1) (1,114) (1,114) 198
Equity component of share-based payment plans (see Note 5.3) 59 59
2017 dividends paid (see Note 7.2) - (2,500)
Effect of acquisitions and disposals on non-controlling interests - 419
Sub--total of changes linked to relations with sshareholders - 67 (122) (1,114) (1,169) (1,912)
Unrealised or deferred gains and losses - 19
Other changes - (3)
2017 net income for the period - 2,806
Sub--total - - - - - 16 2,806
Change in equity of associates and joint ventures accounted for using the equity method - -
Shareholders’’ eequity at 31st December 2017 1,010 20,344 (493) 8,566 29,427 27,791 2,806
6
CONSOLIDATED FINANCIAL STATEMENTS
1 I 6FF I N A N C I A L I N F O R M A T I O NN
S O C I E T E G E N E R AL E G R O U P I 2018 REGISTRATION DOCUMENT I 307
Unrealised or deferred gains and losses (net of tax) that
will be reclassified subsequently into income
Shareholders’ equity, Group
share
Non-controlling interests
Total consolidated
shareholders’ equity
Translation reserves
Change in fair value of
available-for-sale assets
Change in fair value of
hedging derivatives Total
Capital and Reserves
Other equity instruments
issued by subsidiaries
Unrealised or deferred
gains and losses Total
12 1,495 87 1,594 59,037 2,779 800 59 3,638 62,675
- - - - 6 - - - - 6
- - - - 58 - - - - 58
- - - - 1,159 - - - - 1,159
- - - - 65 - - - - 65
- - - - (2,289) (291) - - (291) (2,580)
- - - - 23 (31) - - (31) (8)
- - - - (978) (322) - - (322) (1,300)
385 (297) (12) 76 17 (5) - (26) (31) (14)
- - - - 3 4 - - 4 7
- - - - 3,874 464 - - 464 4,338
385 (297) (12) 76 3,894 463 - (26) 437 4,331
- 1 (1) - - - - - - -
397 1,199 74 1,670 61,953 2,920 800 33 3,753 65,706
- - -
397 1,199 74 1,670 61,953 2,920 800 33 3,753 65,706
- 8 - 8
- (151) - (151)
- (916) - (916)
- 59 - 59
- (2,500) (276) (276) (2,776)
- 419 614 614 1,033
- - - - (3,081) 338 - - 338 (2,743)
(2,079) (158) (70) (2,307) (2,288) (1) (49) (50) (2,338)
- (3) (1) (1) (4)
- 2,806 624 624 3,430
(2,079) (158) (70) (2,307) 515 622 - (49) 573 1,088
(14) (14) (14) - (14)
(1,682) 1,027 4 (651) 59,373 3,880 800 (16) 4,664 64,037

6 I 1
CONSOLIDATED FINANCIAL STATEMENTS FF I N A N C I A L I N F O R M A T I O NN
308 I 2018 REGISTRATION DOCUMENT I S O C I E T E G E N E R AL E G R O U P
CASH FLOW STATEMENT
(In EUR m) 2017 2016
Net income (I) 3,430 4,338
Amortisation expense on tangible fixed assets and intangible assets (including operational leasing) 4,283 3,876
Depreciation and net allocation to provisions 108 4,238
Net income/loss from investments accounted for using the equity method (92) (129)
Change in deferred taxes 673 655
Net income from the sale of long-term available-for-sale assets and subsidiaries (110) (716)
Other changes 4,367 3,201
Non--cash items included in net income and others adjustments eexcluding net iincome on financial instruments at fair value through prrofit or looss (II)
9,229 11,125
Income on financial instruments at fair value through profit or loss (5,113) (5,760)
Interbank transactions 5,200 (1,020)
Customers transactions (4,996) 20,672
Transactions related to other financial assets and liabilities* 22,876 (5,248)
Transactions related to other non-financial assets and liabilities* (2,228) (1,377)
Net increase/decrease in cash related to operating assets and liabilities (III) 15,739 7,267
Net cash inflow (outflow) related to operating activities ((A) = (I) + (II) + (III) 28,398 22,730
Net cash inflow (outflow) related to acquisition and disposal of financial assets and long-term investments (280) 1,294
Net cash inflow (outflow) related to tangible and intangible fixed assets (5,928) (5,531)
Net cash inflow (outflow) related to investment activities ((B) (6,208) (4,237)
Cash flow from/to shareholders (3,836) (1,357)
Other net cash flows arising from financing activities (331) 1,306
Net cash inflow (outflow) related to financing activities ((C) (4,167) (51)
Net inflow (outflow) in cash and cash equivalents ((A) + (B) + (C) 18,023 18,442
Cash, due from central banks (assets) 96,186 78,565
Due to central banks (liabilities) (5,238) (6,951)
Current accounts with banks (see Note 3.5) 24,639 26,113
Demand deposits and current accounts with banks (see Note 3.6) (14,337) (14,920)
Cash and cash equivalents at the start of the year 101,250 82,808
Cash, due from central banks (assets) 114,404 96,186
Due to central banks (liabilities) (5,604) (5,238)
Current accounts with banks (see Note 3.5) 22,159 24,639
Demand deposits and current accounts with banks (see Note 3.6) (11,686) (14,337)
Cash and cash equivalents at the eend of the year 119,273 101,250
Net inflow (outflow) in cash and cash equivalents 18,023 18,442
* Amounts restated compared to the 31st December 2016 consolidated financial statements, following a change in the balance sheet presentation of premiums to be received / to be paid on options (see Note 3).

6
NOTES TO THE CONSOLIDATED FINANCIAL STATEMENTS
2 I 6FF IINANCIAL INFORMATION
S O C I E T E G E N E R AL E G R O U P I 2018 REGISTRATION DOCUMENT I 309
2 . N O T E S T O T H E C O N S O L I D AT E D F I N A N C I A L S TAT E M E N T S
The consolidated financial statements were approved by the Board of Directors on 7th February 2018.
NOTE 1 - SIGNIFICANT ACCOUNTING PRINCIPLES
1. Introduction
AACCOUNTING STANDARDS
In accordance with European Regulation 1606/2002 of 19th July 2002 on the application of International Accounting Standards, the Societe Generale Group (“the Group”) prepared its consolidated financial statements for the year ended 31st December 2017 in accordance with International Financial Reporting Standards (IFRS) as adopted by the European Union and in force at that date.
These standards are available on the European Commission website at:
http://ec.europa.eu/finance/company-reporting/standards-interpretations/index_en.htm
The Group also continued to make use of the provisions of IAS 39, as adopted by the European Union, for applying macro-fair value hedge accounting (IAS 39 “carve-out”).
FINANCIAL STATEMENTS PRESENTATION
As the IFRS accounting framework does not specify a standard model, the format used for the financial statements is consistent with the format proposed by the French Accounting Standards Setter, the ANC, under Recommendation 2013-04 of 7th November 2013.
Disclosure provided in the notes to the consolidated financial statements focus on information that is both relevant and material to the financial statements of the Societe Generale Group, its activities and the circumstances in which it conducted its operations over the period.
PRESENTATION CURRENCY
The presentation currency of the consolidated financial statements is the euro.
The balance sheet items of consolidated companies reporting in foreign currencies are translated into euros at the official exchange rates prevailing at the closing date. Income statement items of these companies are translated into euros at the average month-end exchange rates.
The figures presented in the financial statements and in the notes are expressed in EUR millions, unless otherwise specified. The effect of rounding can generate discrepancies between the figures presented in the financial statements and those presented in the notes.
2. New accounting standards applied by the group as of 1st January 2017
Amendments to IAS 12 “Recognition of Deferred Tax Assets for Unrealised Losses”
Amendments to IAS 7 “Disclosure Initiative”
The application of these amendments has no significant impact on the Group’s net income and equity.

6 I 2
NOTES TO THE CONSOLIDATED FINANCIAL STATEMENTS FF I N A N C I A L I N F O R M A T I O NN
310 I 2018 REGISTRATION DOCUMENT I S O C I E T E G E N E R AL E G R O U P
AMENDMENTS TO IAS 12 “RECOGNITION OF DEFERRED TAX ASSETS FOR UNREALISED LOSSES”
These amendments clarify how to account for deferred tax assets related to unrealised losses on debt instruments measured at fair value.
AMENDMENTS TO IAS 7 “DISCLOSURE INITIATIVE”
These amendments aim to enhance the information on changes in liabilities arising from financing activities, including both cash and non-cash changes.
3. Accounting standards, amendments or interpretations to be applied by the Group in the future Not all the accounting standards, amendments or interpretations published by the IASB had been adopted by the European Union at 31st December 2017. They are required to be applied from annual periods beginning on 1st January 2018 at the earliest or on the date of their adoption by the European Union. They were therefore not applied by the Group as of 31st December 2017.
These standards are expected to be applied according to the following schedule:
ACCOUNTING STANDARDS, AMENDMENTS OR INTERPRETATIONS ADOPTED BY THE EUROPEAN UNION
IFRS 9 “Financial Instruments” and IFRS 16 “Leases” are presented in paragraphs 4 and 5.
2018
IFRS 9 "Financial Instruments" [Adopted by EU] (see paragraph 4)
Amendments to IFRS 9 "Prepayment Features with Negative Compensation" (see paragraph 4)
IFRS 15 "Revenue from Contracts with Customers" and subsequent clarifications [Adopted by EU]
Amendments to IFRS 4: Applying IFRS 9 "Financial Instruments" with IFRS 4 "Insurance Contracts" [Adopted by EU] (see paragraph 4)
Annual improvements (2014-2016)
Amendments to IFRS 2 "Classification and Measurement of Share-based Payment Transactions"
Amendments to IAS 40 "Transfers of Investment Property"
IFRIC 22 "Foreign Currency Transactions and Advance Consideration"
2019
IFRS 16 "Leases" [Adopted by EU] (see paragraph 5)
IFRIC 23 "Uncertainty over Income Tax Treatments"
Amendments to IAS 28 "Long-term Interests in Associates and Joint Ventures"
Annual improvements (2015-2017)
2021IFRS 17 "Insurance Contracts"
Step 1: Step 2: Step 3: Step 4: Step 5:

6
2018
2019
NOTES TO THE CONSOLIDATED FINANCIAL STATEMENTS
2 I 6FF I N A N C I A L I N F O R M A T I O NN
S O C I E T E G E N E R AL E G R O U P I 2018 REGISTRATION DOCUMENT I 311
IFRS 15 “REVENUE FROM CONTRACTS WITH CUSTOMERS” AND SUBSEQUENT CLARIFICATIONS
Adopted on 22nd September 2016 and 31st October 2017
This standard sets out the requirements for recognising revenue that apply to all contracts with customers, except for lease contracts, insurance contracts, financial instruments and guarantees.
The recognition of revenues in the income statement shall depict the transfer of promised goods or services to customers in an amount that reflects the consideration to which the entity expects to be entitled in exchange for those goods or services.
To apply this core principle, IFRS 15 provides a five-step model from the identification of the contract with the customer until the recognition of the related revenue when the performance obligation is fulfilled:
In the Group, the contracts that are the most concerned by the new standard are:
banking services contracts that lead to the recognition of fee income (packages of banking services, fees related to asset management or to loan syndication, etc.);
services providing linked to leasing activities (such as maintenance services for operational vehicle leasing and fleet management);
real estate development transactions.
The review of the accounting treatments currently applied to recognise revenues from these contracts is being finalised. As the 2017 consolidated financial statements are approved, the Group expects that the first application of IFRS 15 will have no significant impact on its 2018 opening balance of equity.
ACCOUNTING STANDARDS, AMENDMENTS OR INTERPRETATIONS NOT YET ADOPTED BY THE EUROPEAN UNION AT 31ST DECEMBER 2017
ANNUAL IMPROVEMENTS (2014-2016)
Issued by IASB on 8th December 2016
As part of the annual Improvements to International Financial Reporting Standards, the IASB has issued amendments to IAS 28 “Investments in Associates and Joint Ventures” and IFRS 12 “Disclosure of Interests in Other Entities”.
The amendment to IAS 28 clarifies the measurement of investments in associates or joint ventures held by a venture capital organisation or other qualifying entity.
The amendment to IFRS 12 clarifies the disclosure requirements related to an entity’s interests that are classified as held for sale or as discontinued operations in accordance with IFRS 5 “Non-current Assets Held for Sale and Discontinued Operations”.
AMENDMENTS TO IFRS 2 “CLASSIFICATION AND MEASUREMENT OF SHARE-BASED PAYMENT TRANSACTIONS”
Issued by IASB on 20th June 2016
These amendments clarify how to account for certain types of share-based payment transactions: modelling vesting conditions regardless of settlement method, impacts of tax withholdings on share-based payment transactions, accounting treatment of modifications that change the classification of the share-based payment transactions.
AMENDMENTS TO IAS 40 “TRANSFERS OF INVESTMENT PROPERTY”
Issued by IASB on 8th December 2016
These amendments reinforce the principle according to which the entity shall transfer property into or out of the investment property category. Such a transfer shall occur if and only if property meets, or ceases to meet, the definition of investment property and if there is evidence of a change in management’s intentions regarding the use of the property.
IFRIC 22 “FOREIGN CURRENCY TRANSACTIONS AND ADVANCE CONSIDERATION”
Issued by IASB on 8th December 2016
This interpretation clarifies the accounting for foreign currency transactions (payments or prepayments). The transaction shall provide a consideration that is denominated or priced in a foreign currency. Before this transaction, a prepayment asset or a deferred income liability shall be recognised and considered as a non-monetary item. The date of the transaction, for determining the exchange rate, is the date of initial recognition of the non-monetary asset or liability, except when there are multiple payments or receipts in advance, in which case the date of transaction will be established for each payment or receipt.
Step 1:
Identification of a contract
Step 2:: Identification of performance obligations
Step 3: Determination of the transaction
price
Step 4: Allocation of the transaction price
Step 5: Recognition of
revenue

6 I 2
NOTES TO THE CONSOLIDATED FINANCIAL STATEMENTS FF I N A N C I A L I N F O R M A T I O NN
312 I 2018 REGISTRATION DOCUMENT I S O C I E T E G E N E R AL E G R O U P
IFRIC 23 “UNCERTAINTY OVER INCOME TAX TREATMENTS”
Issued by IASB on 7th June 2017
This interpretation provides clarifications about the measurement and accounting treatment of income tax when there is uncertainty over income tax treatments. The approach to be used should be the one that provides the best predictions of the resolution of the uncertainty.
AMENDMENTS TO IAS 28 “LONG-TERM INTERESTS IN ASSOCIATES AND JOINT VENTURES”
Issued by IASB on 12th October 2017
The amendments clarify that IFRS 9 “Financial Instruments” shall be applied to financial instruments that form part of the net investment in an associate or a joint venture but to which the equity method is not applied.
ANNUAL IMPROVEMENTS (2015-2017)
Issued by IASB on 12th December 2017
As part of the annual Improvements to International Financial Reporting Standards, the IASB has issued amendments to IFRS 3 “Business Combinations”, IFRS 11 “Joint Arrangements”, IAS 12 “Income Taxes” and IAS 23 “Borrowing Costs”.
IFRS 17 “INSURANCE CONTRACTS”
Issued by IASB on 18th May 2017
This new standard will replace IFRS 4 “Insurance Contracts” that was issued in 2004 and which currently allows entities to use national requirements for the accounting of insurance contracts.
IFRS 17 provides new rules for the recognition, measurement, presentation and disclosure of insurance contracts that belong to its application scope (insurance contracts issued, reinsurance contracts held and investment contracts issued with discretionary participation features). The underwriting reserves currently recognised among liabilities in the balance sheet will be replaced by a current value measurement of insurance contracts.
The general model provided for the measurement of insurance contracts in the balance sheet will be based on a building-blocks approach: a current estimate of future cash flows, a risk adjustment, and a contractual service margin.
Positive contractual service margins will be recognised as income over the duration of the insurance service. But negative margins will be immediately recognised as expense, as soon as the insurance contract is identified as onerous.
The general model will be the default measurement model for all insurance contracts.
But IFRS 17 also provides a mandatory alternative model for insurance contracts with direct participation features. Under this model, called “variable fee approach”, the measurement of the
insurance contract liability shall take into account the obligation to pay to policyholders a substantial share of the fair value returns on the underlying items, less a fee for future services provided by the insurance contract (changes in the fair value of underlying items due to policyholders are then recognised as an adjustment of the contractual service margin).
A simplified measurement for short-term contracts (less than 12 months) is also allowed by the standard under conditions (premium allocation approach).
Insurance contract liability
Contractual Service Margin
Unearned future profit measured on initial recognition.
Fulfilment cash flows
Estimates of future cash flows Premiums, claims, directly
attributable costs.
Discount Time value of money and other financial risks not included in estimated future cash flows.
Risk adjustment for non--financial risks
Compensation for uncertainties about estimates of future cash flows

6
NOTES TO THE CONSOLIDATED FINANCIAL STATEMENTS
2 I 6FF I N A N C I A L I N F O R M A TT I O N
S O C I E T E G E N E R AL E G R O U P I 2018 REGISTRATION DOCUMENT I 313
These measurement models will have to be applied to homogeneous portfolios of insurance contracts. The level of aggregation of these portfolios will be assessed considering:
contracts that are subject to similar risks and managed together,
without including contracts issued more than one year apart in the same portfolio, and
dividing each portfolio to distinguish a group of contracts that are onerous at initial recognition, a group of contracts that at initial recognition have no significant possibility of becoming onerous subsequently, and a group of the remaining contracts.
4. Preparation for the first application of IFRS 9 “Financial Instruments” IFRS 9 aims to replace IAS 39 “Financial Instruments – Recognition and Measurement”.
The following treatments will be applicable to accounting periods beginning on 1st January 2018, replacing the accounting principles currently applied for financial instruments and that are described in Note 3.
Classification and measurement
A single approach for financial assets, based on the characteristics of the contractual cash flows and the business model within which they are held.
Credit risk
A more timely depreciation model, based on expected credit losses.
Hedge accounting (general mmodel)
An improved model more closely aligned with risk management; but also, a policy choice, selected by the Group, to continue to apply the hedge accounting requirements of IAS 39.
Macro--hedging
Excluded from the scope of IFRS 9 (specific research project).
ACCOUNTING TREATMENTS PROVIDED BY IFRS 9
CLASSIFICATION AND MEASUREMENT OF FINANCIAL ASSETS
Financial assets are required to be classified into three categories according to applicable measurement methods (amortised cost, fair value through profit or loss and fair value through other comprehensive income). Classification will depend on the contractual cash flow characteristics of the instruments and the entity’s business model for managing its financial instruments.
The aim of this approach is to limit the possibility of recognising revenues from financial assets using the effective interest rate method to the only instruments whose characteristics are consistent with a basic lending arrangement, which implicitly requires a high predictability of the related cash flows. All other financial assets that do not have such characteristics will be measured at fair value through profit or loss, whatever the business model may be.

6 I 2
NOTES TO THE CONSOLIDATED FINANCIAL STATEMENTS FF I N A N C I A L I N F O R M A T I O NN
314 I 2018 REGISTRATION DOCUMENT I S O C I E T E G E N E R AL E G R O U P
The following diagram broadly describes the classification criteria to be used for financial assets according to IFRS 9:
CHARACTERISTICS OF CASH FLOWS
Contractual cash flows that are solely payments of principal and interest on the principal amount outstanding are consistent with a basic lending arrangement (SPPI cash flows: Solely Payment of Principal and Interest).
In a basic lending arrangement, interest is mainly consideration for the time value of money and credit risk. Interest can also include consideration for liquidity risk and for administrative costs associated with holding the financial asset, and a commercial profit margin. Negative interest is not inconsistent with this definition of a basic lending arrangement.
All contractual terms shall be analysed, particularly those that could change the timing or amount of contractual cash flows. A contractual term that permits the borrower or the lender to prepay or to put the debt instrument back to the issuer before maturity remains consistent with SPPI cash flows, provided the prepayment amount substantially represents the principal remaining due and accrued but unpaid contractual interest, which may include a reasonable compensation. The amendment to IFRS 9 issued on 12th October 2017 has indicated that such compensation can be either positive or negative; the process for endorsement of this amendment by the European Union is currently in progress.
The prepayment compensation will especially be considered as reasonable when:
the amount is calculated on the remaining outstanding amount of the loan and is capped by regulations (in France, for example, compensation for the prepayment of mortgage loans by individuals is capped by the law at an amount equal to six months of interest or 3% of the principal outstanding), or is limited by competitive market practices;
the amount is equal to the difference between contractual interest that should have been received until the maturity of the loan and interest that would be obtained by the reinvestment of the prepaid amount in a rate that reflects the relevant benchmark interest rate.
Some loans are prepayable at their current fair value, while others can be prepayable at an amount that includes the fair value cost to terminate an associated hedging swap. It will be possible to consider such prepayment amounts as SPPI provided that they reflect the effect of changes in the relevant benchmark interest rate.
AAccounting classification
SSPPI
(SSolely PPayments of PPrincipal and IInterest) BBasic debt
ffinancial aassets
NNON ––SSPPI CComplex debt
ffinancial assets
EEquity financial aassets
DDerivatives
CCollecting contractual ccash flows
CCollecting contractual ccash flows and selling
TTrading portfolio
RRegardless of the bbusiness model
++ Fair value ooption (to eliminate or reduce an accounting mismatch)
++ FFair value through OCI option
without subsequent recycling in the income statement(non-trading equity financial assets)
CCash flow ccharacteristics BBusiness model
FFair vvalue tthrough OCI with subsequent recycling in the
income statement
AAmortised ccost
FFair value through pprofit or lloss
FFair value through OCI without subsequent recycling in
the income statement
FFair value through pprofit or loss
FFair value through pprofit or lloss

6
NOTES TO THE CONSOLIDATED FINANCIAL STATEMENTS
2 I 6FF I N A N C I A L I N F O R M A T I O NN
S O C I E T E G E N E R AL E G R O U P I 2018 REGISTRATION DOCUMENT I 315
Basic financial assets (SPPI) are debt instruments which mainly include:
fixed-rate loans,
variable-rate loans that can include caps or floors,
fixed or variable-rate debt securities (public or private bonds, other negotiable debt securities),
securities purchased under resale agreements (reverse repos),
guarantee deposits paid,
trade receivables.
Contractual terms that would introduce exposure to risks or volatility in the contractual cash flows that would be unrelated to a basic lending arrangement (such as exposure to changes in equity prices or stock indexes for instance, or leverage features) could not be considered as being SPPI, except if their effect on the contractual cash flow remains de minimis.
Embedded derivatives will not be separated anymore from their host contracts when these contracts are financial assets, thereby the entire hybrid instrument will be considered as non-basic and measured at fair value through profit or loss, if its contractual cash flows do not pass the SPPI test.
Non--basic financial assets (non--SPPI) mainly include:
derivative instruments,
shares and other equity instruments held by the entity,
equity instruments issued by mutual funds,
debt financial assets that can be converted or redeemed into a fixed number of shares (convertible bonds, equity-linked securities, etc.).
When the time value component of interest can be modified according to the contractual term of the instrument, it may be necessary to compare the contractual cash flow with cash flow that would arise from a benchmark instrument. For instance, that is the case when an interest rate is periodically reset, but the frequency of that reset does not match the tenor of the interest rate (such as an interest rate reset every month to a one-year rate), or when the interest rate is periodically reset to an average of short- and long-term interest rates.
If the difference between undiscounted contractual cash flows and undiscounted benchmark cash flows is significant or can become significant, then the instrument is not considered basic.
Depending on the contractual terms, comparison with benchmark cash flow may be performed through a qualitative assessment; but in other cases, a quantitative test will be required. The difference between contractual and benchmark cash flows will have to be considered in each reporting period and cumulatively over the life of the instrument. When performing this benchmark test, the entity shall consider factors that could affect future undiscounted contractual cash flows: using the interest rate curve at the date of the initial assessment is not enough, and the entity will also have to consider whether the curve could change over the life of the instrument according to reasonably possible scenarios.
Within the Group, financial instruments concerned by a benchmark test include, for instance, variable-rate housing loans for which interest rates are reset every year based on the twelve-month Euribor average observed over the two months previous to the reset. Another example is loans granted to real estate professionals for which interests are revised quarterly based on the one-month Euribor average observed over the three months previous to the reset. Following the benchmark analysis performed by the Group, it has been concluded that these loans are basic.
Furthermore, a specific analysis of contractual cash flow is required when financial assets are instruments issued by a securitisation vehicle or a similar entity that prioritises payments to the holders using multiple contractually linked instruments that create concentrations of credit risk (tranches). When assessing whether contractual cash flows are SPPI or not, the entity must analyse the contractual terms, as well as the credit risk of each tranche and the exposure to credit risk in the underlying pool of financial instruments. To that end, the entity must apply a “look-through approach” to identify the underlying instruments that are creating the cash flows.
All financial assets that are not basic will be mandatorily measured at fair value through profit or loss, whatever may be the business model for managing them.
The Group can make the irrevocable election to classify and measure an investment in an equity financial instrument that is not held for trading purposes at fair value through other comprehensive income. Subsequently, the profit or loss accumulated in other comprehensive income will never be reclassified into profit or loss (only dividends from those investments will be recognised as income). The Group expects to use this optional classification for very limited cases only.

6 I 2
NOTES TO THE CONSOLIDATED FINANCIAL STATEMENTS FF I N A N C I A L I N F O R M A T I O NN
316 I 2018 REGISTRATION DOCUMENT I S O C I E T E G E N E R AL E G R O U P
BUSINESS MODELS
The business model refers to how financial instruments are managed to generate cash flows and revenues.
When carrying on its different business activities, the Group makes use of various business models. Business models are assessed on how groups of financial instruments are managed together to achieve a particular business objective. The business model is not assessed on an instrument-by-instrument basis, but at a portfolio level, considering relevant evidence such as:
how the performance of the portfolio is evaluated and reported to the Group’s management;
how risks related to financial instruments within that business model are managed;
how managers of the business are compensated;
and also, sales of assets realised or expected (size, frequency, purpose).
To determine the classification and measurement of financial assets, three different business models shall be distinguished:
a business model whose objective is to collect contractual cash flows;
a business model whose objective is achieved by both collecting contractual cash flows and selling financial assets;
and a separate business model for other financial assets, and especially those that are held for trading purpose, where collecting contractual cash flows is only incidental.
COLLECTING CONTRACTUAL CASH FLOWS:
Under this model, financial assets are managed to realise cash flows by collecting contractual payments over the life of the instrument.
To achieve the objective of this business model, the entity need not hold all of those instruments until maturity. Selling assets remains consistent with a business model whose objective is to collect contractual cash flows in the following cases:
the financial asset is sold following an increase in the asset’s credit risk;
the sale of the financial asset occurs close to its maturity and the proceeds from the sale approximates the collection of the remaining contractual cash flows.
Other sales can be consistent with the objectives of collecting contractual cash flows, as well, provided they are infrequent (even if significant in value) or insignificant in value, both individually and in aggregate (even if frequent). Such other sales include sales made to manage credit concentration risk (without an increase in the asset’s credit risk). The Group has set up procedures for reporting and analysing all significant projected sales of financial assets held for collecting contractual cash flows, as well as a periodic review of sales that have occurred.
Financing activities
Within the Group, the “hold to collect” business model is mainly applied by financing activities managed by French Retail Banking, International Retail Banking and Financial Services and by Global Banking and Investor Solutions, except for syndicated loans that are expected to be sold.
COLLECTING CONTRACTUAL CASH FLOWS AND SALES:
The objective of this business model is to realise cash flows by both collecting contractual payments and selling financial assets. In this type of business model, the sales of financial assets are not incidental or exceptional, but they are integral to achieving the business’s objectives.
Cash management
Within the Group, the “hold to collect and sale” business model is mainly applied by cash management activities for managing HQLA securities (High Quality Liquid Assets) included in the liquidity reserve. Only a few subsidiaries apply a “hold to collect” business model for managing their HQLA securities.
TRADING ACTIVITIES:
Financial assets held for trading are:
acquired with the intention of selling them in the short term, or
held for market-making purposes, or
acquired for the purposes of the specialised management of a trading portfolio, including derivative financial instruments, securities or other financial instruments that are managed together and for which there is evidence of a recent pattern of short-term profit-taking.

6
NOTES TO THE CONSOLIDATED FINANCIAL STATEMENTS
2 I 6FF I N A N C I A L I N F O R M A T I O NN
S O C I E T E G E N E R AL E G R O U P I 2018 REGISTRATION DOCUMENT I 317
Global market activities
The trading business model is applied by Global Banking and Investor Solutions to manage its global market activities.
It is also applied for managing syndicated financing commitments and loans that are not intended to be kept by the Group and that have been identified since their origination as to be sold shortly (within 6 to 12 months) on the secondary market.
Run-off portfolios of financial assets are also measured at fair value through profit or loss.
Such financial assets mainly include the remaining investments of the Group in CDO (Collateralised Debt Obligations) and ABS (Asset Backed Securities) that were reclassified into Loans and receivables in 2008 and that are currently expected to be sold through an organised and pre-determined disposal programme.
Assessing the business model is not required for classifying non-SPPI financial assets. Nevertheless, when such non-SPPI financial assets are held for trading purposes, they will be displayed in the notes to financial statements together with SPPI financial assets held for trading. In the notes to financial statements, the other non-SPPI financial assets, that are also measured at fair value through profit or loss but that are held for other purposes, will be displayed separately from trading assets.
FAIR VALUE OPTION
A non-SPPI financial asset that is not held for trading purposes can be designated, upon initial recognition, to be measured at fair value through profit or loss if such designation eliminates or significantly reduces discrepancies in the accounting treatment of certain financial assets and liabilities (accounting mismatch).
Nearly all debt securities and equity securities, that are currently classified as Financial instruments measured using the fair value option through profit or loss, are held by life-insurance subsidiaries and are designated as such to reduce or eliminate an accounting mismatch with the related insurance liabilities. This classification will be maintained as far as the Group has decided that all its insurance subsidiaries will defer the application of IFRS 9.
Loans and receivables currently classified as Financial instruments measured using the fair value option through profit or loss are mainly hybrid instruments containing one or more embedded derivatives, and whose contractual cash flows are not SPPI.
CLASSIFICATION AND MEASUREMENT OF FINANCIAL LIABILITIES
Requirements for the classification and measurement of financial liabilities contained in IAS 39 have been incorporated into IFRS 9 without any modification, except for financial liabilities designated at fair value through profit or loss (using the fair value option). For these financial liabilities, the amount of change in their fair value attributable to changes in credit risk will be recognised in Unrealised or deferred gains and losses, without subsequent reclassification into income (changes in the fair value attributable to other factors will continue to be recognised in profit or loss). IFRS 9 also details how to recognise renegotiations of financial liabilities that do not result in derecognition.
The scope of financial liabilities designated by the Group to be measured at fair value through profit or loss will not be modified by IFRS 9.
DERECOGNITION OF FINANCIAL ASSETS AND FINANCIAL LIABILITIES
Derecognition rules for financial assets and financial liabilities have been carried forward unchanged from IAS 39 to IFRS 9.
CREDIT RISK
All debt instruments classified as financial assets measured at amortised cost or at fair value through other comprehensive income, as well as lease receivables, loan commitments and issued financial guarantee contracts, will be systematically subject to depreciation or provision for expected credit losses. This depreciation or provision will be recognised as soon as loans are granted, a soon as commitments are issued or as soon as debt securities are acquired, without waiting for objective evidence of impairment to occur.
The purpose of this approach is to recognise credit losses in profit or loss on a timely basis, symmetrically to the recognition in profit or loss of the credit spread embedded in the interest income.

6 I 2
NOTES TO THE CONSOLIDATED FINANCIAL STATEMENTS FF I N A N C I A L I N F O R M A T I O NN
318 I 2018 REGISTRATION DOCUMENT I S O C I E T E G E N E R AL E G R O U P
Thus, these financial assets will be allocated among three categories according to the gradual deterioration of their credit risk since their initial recognition, and an impairment loss will be recognised for each of these categories as follows:
The significant increase of the credit risk will be assessed on an instrument-by-instrument basis, but it will also be possible to assess it on the basis of consistent portfolios of similar assets, where individual assessment does not appear to be relevant. A counterparty-based approach (applying the default contagion principle to all the counterparty’s outstanding loans) will also be possible if it gives similar outputs.
The Group will have to consider all available information, as well as potential consequences of a change in macro-economic factors, so that any significant increase in the credit risk on a financial asset may be assessed as early as possible.
There will be a rebuttable presumption that the credit risk on a financial asset has increased significantly when the contractual payments on this asset are more than 30 days past due. However, this 30-day late period is an ultimate indicator. The entity should use all available information (behaviour scores, “loan to value” type indicators, etc.) and apply a forward-looking view to assess whether there is significant increase in credit risk before contractual payments are over 30 days past due.
The application of IFRS 9 will not alter the definition of default currently used to determine whether there is objective evidence of impairment of a financial asset. An asset will notably be presumed in default if one or more contractual payments are more than 90 days past due.
Impairments on groups of homogeneous assets will be replaced by loss allowances measured at an amount equal to 12-month or to lifetime expected credit losses:
financial assets on counterparties which have encountered financial difficulties since they were initially recognised, without any objective evidence of impairment having yet been identified at the individual level (sensitive assets), will be partly included in the stage 2, with loss allowance measured at an amount equal to lifetime expected credit losses;
financial assets on counterparties linked to economic sectors considered as being in crisis further to the occurrence of loss events, or on geographic sectors or countries in which a deterioration of credit risk has been assessed, will be spread between stage 1 (loss allowances measured at an amount equal to 12-month expected credit losses) and stage 2 (loss allowances measured at an amount equal to lifetime expected credit losses) depending on their individual credit risk, taking into account the deterioration in the sector or country between the origination of the loan and the balance sheet date.
12-month expected credit losses will be measured considering past events, but also the current situation, as well as reasonable forecasts of future economic conditions. Thus, such losses will not be calculated according to average data observed through an economic cycle.
Lifetime expected credit losses will be measured considering past events and the current situation, as well as reasonable forecasts of future economic conditions based on several scenarios, and also relevant macro-economic factors until the contract term.
HEDGE ACCOUNTING
The Group has analysed the various options offered by IFRS 9 in its transition guidance for hedge accounting and has decided, as allowed by IFRS 9, not to modify the hedge accounting methods currently applied in accordance with IAS 39 as adopted in the European Union. Nevertheless, the Group will update the information disclosed in the notes to financial statements according to IFRS 7, giving a more detailed description of its risk management strategies and the related hedging transactions, as well as the effect of hedge accounting in its financial statements.
The Group will also continue to keep abreast of IASB research on macro-hedge accounting.
Transfer criteria
Measurement of credit rrisk
Credit risk ccategory
12-month expected credit losses
Lifetime expected credit losses
Lifetime expected credit losses
Initial recognition of the instrument in stage 1
Maintained if the credit risk has not increased significantly
Credit risk on the instrument has increased significantly since initial recognition/30 days past due
Evidence that the instrument is become credit-impaired / 90 days past due
Stage 1 Performing assets
Interest income rrecognition basis
Gross carrying amount of the asset before impairment
Observed deterioration of credit risk ssince initial recognition of the financial asset
Stage 2 Deteriorated assets
Stage 3 Credit-impaired assets
Gross carrying amount of the asset before impairment Net carrying amount of the
asset after impairment

6
NOTES TO THE CONSOLIDATED FINANCIAL STATEMENTS
2 I 6FF I N A N C I A L I N F O R M A T I O NN
S O C I E T E G E N E R AL E G R O U P I 2018 REGISTRATION DOCUMENT I 319
IMPLEMENTATION OF IFRS 9
In 2013, the Group began preliminary assessments aimed at determining the potential consequences of the future IFRS 9 standard. To this end, a project structure was established by the Finance Division and a joint programme has been launched between the Risk Division and the Finance Division to review the parts of the standard that concern credit risk.
As soon as IFRS 9 was published in July 2014, the Group Risk and Finance functions set up a special structure to organise the works to be performed to implement the new standard and to be ready to apply it on 1st January 2018.
Under the aegis of the governance bodies established for this purpose, the Group conducted analyses of the standard (banking implications) and performed a planning study concerning the adaptation of its information systems and processes.
The specifications necessary to adapt the Group’s and the entities’ information systems for Risk and Finance functions, on the one hand, and to update the consolidation processes and reporting schedules, on the other hand, and the related developments were delivered in 2016 and 2017. During the second and third quarters of 2017, the Group carried out a dry run exercise and a general rehearsal to test the entire new system built for the application of IFRS 9.
CLASSIFICATION AND MEASUREMENT
The Group’s portfolios of financial assets were reviewed to determine their future accounting treatment under IFRS 9, considering the characteristics of their contractual cash flows and the Group’s business models for managing them. The Group then assessed the scope of financial assets, whose classification and measurement will be modified when applying IFRS 9.
Methodologies have been developed for analysing the contractual flows of financial assets, particularly to be able to compare them with a benchmark instrument when the time value component included in the interest is subject to modification according to the instrument’s contractual terms.
During the fourth quarter of 2017, the Group took into account the modifications brought by the amendment to IFRS 9 issued by IASB on 12th October 2017 regarding prepayment features with negative compensation.
CREDIT RISK
Since 2015, the Group has set up a framework methodology defining the rules for assessing the deterioration of credit risk and for determining 12-month and lifetime expected credit losses, factoring in macroeconomic projections reflecting the credit cycle. Simultaneously, the Group has built a governance for the approval and the control of parameters used for measuring expected credit losses as well as for Management’s exercise of judgement.
METHODOLOGIES FOR MEASURING DEPRECIATIONS AND PROVISIONS
The measurement of expected credit losses is primarily calculated as the product of the instruments’ probability of default (PD), loss given default (LGD) and exposure at default. Estimates of 12-month expected credit losses use a maximum of 12-month probability of default, while estimates of lifetime expected credit losses use a probability of default assessed over the remaining life of the instrument.
Parameters necessary for these evaluations will be assessed on the basis of financial asset portfolios. For that purpose, portfolios of the Group’s financial assets and commitments were segmented to ensure their homogeneity in terms of credit risk characteristics and their correlation with the international and local macroeconomic variables that can affect them. This segmentation addresses all specificities encountered in the Group’s entities.
This new segmentation of portfolios was determined consistently with that used for the needs of the Basel prudential calculations to guarantee the uniqueness of the historical data of default and losses that are used.
ASSESSMENT OF THE INCREASE IN CREDIT RISK
Increases in a financial asset’s credit risk since its initial recognition, entailing transfer from stage 1 (performing assets) to stage 2 (deteriorated assets), and from stage 2 to stage 3 (non-performing or doubtful loans), are firstly assessed on the basis of the internal credit risk rating currently used by the Group. Significant degradation of the rating is assessed on a portfolio basis according to default probability curves used to measure provisions and depreciations for credit risk under IFRS 9.
A more than 30 day past due payment automatically triggers the transfer of the related financial asset into stage 2.
In addition, if at the closing date a significant increase in credit risk has been identified on a given counterparty, all the outstandings on this counterparty at this date will then be transferred to stage 2 and depreciated for lifetime expected losses. After this transfer to stage 2, any new instrument concluded with the same counterparty will then be initially recognised in stage 1 and will then follow the process of assessment of the subsequent degradation of the credit risk.
The identification of a default situation leading to a transfer to stage 3 is assessed according to the same criterion as those previously used under IAS 39 for the assessment of an incurred credit risk on an individual outstanding (see Note 3.8). In the same way, as currently done under IAS 39, the assessment of a default situation on an individual outstanding implies by contagion that all the outstandings on the defaulting counterparty are transferred to stage 3.
FORWARD LOOKING APPROACH
Using a forward-looking approach to determine the amount of expected credit losses (12-month or lifetime) depends above all on the integration of the economic perspectives in the evaluation of the probabilities of default. The main macroeconomic variables used in that calculation are the economic growth rate of the various geographic zones (France, the United States, emerging countries, developed countries). For the entities in the international network, it is generally the economic growth rate of the country of the entity that is used.
Concerning the calculation of expected losses in case of default (Loss Given Default - LGD), the forward-looking approach is currently limited to finance lease portfolios.
Expected credit losses are calculated on the basis of probabilised average of three macroeconomic scenarios established by the Group’s economists for all the consolidated entities (a base scenario and a stress scenario, plus an optimistic scenario).

6 I 2
NOTES TO THE CONSOLIDATED FINANCIAL STATEMENTS FF I N A N C I A L I N F O R M A T I O NN
320 I 2018 REGISTRATION DOCUMENT I S O C I E T E G E N E R AL E G R O U P
For some portfolios, the calculation method is completed by a sectorial adjustment increasing or reducing the amount of the expected credit losses, to better anticipate the crisis and recovery phases of certain cyclical branches of industry.
In addition, a marginal adjustment can be applied, following expert appraisal, to increase or decrease the total expected credit losses calculated, in order to take into account future risks that cannot be modelled (mostly related to legislative or regulatory changes).
OPERATIONAL IMPLEMENTATION
The operational implementation of the new processes for measuring depreciations and provisions for credit risk has been carried out as follows:
centralisation of the provisioning models for IFRS 9 although their implementation takes local specificities into account,
use of a common calculator for the major part of the assets,
central collection of the assets and their provisions to meet the needs related to communication, explanation and regulatory reporting on the provisions calculation.
After being launched in 2016, calibration and validation streams as well as IT developments have continued through 2017. These streams also included simulations of different management rules and calibration methodologies for measuring parameters (as consistent as possible with the ones developed for Basel requirements) in order to determine the best conjunctions between normative and business criteria. The Group has also carried out other streams to define backtests. Furthermore, a governance has been defined for updating the models and the weighted macro-economic scenarios in compliance with the accounting closing period.
The joint programme between the Risk Division and the Finance Division, dedicated to credit risks, will be maintained during the first half of 2018 until the final implementation of the new governance, and will also supervise the last developments in the IT systems (especially for reporting the additional information to be disclosed in the notes to financial statements).
TRANSITION
The new requirements of IFRS 9 for classification and measurement of financial instruments as well as for credit risk shall be applied retrospectively as at 1st January 2018. But, as allowed by the transition guidance of IFRS 9, the Group will not restate the comparative figures for prior periods.
Consequently, as far as financial instruments are concerned, comparative figures for 2017 that will be provided with figures related to 2018 will remain as determined according to IAS 39 as adopted by the European Union.
As at 1st January, valuation adjustments of financial assets and liabilities, of provisions and depreciations for credit risk, and of unrealised or deferred gains and losses due to the retrospective application of IFRS 9 at that date will be recognised directly in equity (Retained earnings or Unrealised or deferred capital gains and losses, and Non-controlling interests).
Transition guidance of IFRS 9 also allowed for the early application of direct recording in equity of any change in value attributable to credit risk variations on financial liabilities that are designated to be measured at fair value through profit or loss (using the fair value option). As of 31st December 2017, the Group did not anticipate the application of this treatment.
Moreover, on 12th October 2017, IASB issued an amendment to IFRS 9 related to prepayment features with negative
compensation. Subject to its adoption by the European Union, this amendment shall be applied for annual periods beginning on or after 1st January 2019, but can be applied earlier. On 9th November 2017, EFRAG (European Financial Reporting Advisory Group) issued a positive advice for the adoption of this amendment by the European Union. The Group closely keeps abreast of the adoption process and considers as highly probable that it will be effective before preparation of the 2018 half-yearly financial statements. Then, consistently with recommendations issued by market authorities (ESMA and AMF), the Group has decided to apply this amendment early as from 1st January 2018, to ensure continuity in the accounting standards applied in accordance with IFRS 9 from that date. All things being equal, precisions that have been provided by this amendment to IFRS 9 should not modify the Group’s current assessment of the SPPI qualification of loans with prepayment features that are classified in Loans and receivables and measured at amortised cost as at 31st December 2017.
DEFERRAL OF THE APPLICATION OF IFRS 9 BY INSURANCE SUBSIDIARIES
Applying IFRS 9 to financial assets held by insurance entities from 1st January 2018, before the first application of IFRS 17 “Insurance Contracts” that will become effective in 2021, replacing the current IFRS 4 for the recognition and measurement of their insurance contract liabilities, raises significant issues (operational complexity due to the successive transitions to these two major standards, potential occurrence of accounting mismatches and resulting volatility of profit or loss).
On 12th September, IASB published amendments to IFRS 4 (Applying IFRS 9 "Financial Instruments" with IFRS 4 "Insurance Contracts") providing temporary solutions to address these issues. The amendments permit entities that predominantly undertake insurance activities to defer the effective date of IFRS 9 until 1st January 2021, keeping the current IAS 39 until that date.
The European Union adopted these amendments on 3rd November 2017. Through this adoption, the European Commission also extended the deferral option to allow financial conglomerates falling within the scope of Directive 2002/87/EC to elect that all their entities operating in the insurance sector within the meaning of that Directive will defer the effective date of IFRS 9 until 1st January 2021.
The Group decided that all its insurance subsidiaries will defer the effective date of IFRS 9 and will continue to apply IAS 39 as adopted by the European Union. Financial assets held by the insurance subsidiaries are disclosed in Note 4.3. As required by the adoption regulation of 3rd November 2017, the Group has made the necessary arrangements to forbid all transfers of financial instruments between its insurance sector and any other sector in the Group that would lead to a derecognition of the instrument by the seller, except for transfers of financial instruments that will be measured at fair value through profit or loss by both sectors involved in such transfers.
From 2018, and as proposed by the French Accounting Standard Setter, the ANC, in its Recommendation 2017-02 of 2nd June 2017 related to the presentation of IFRS consolidated financial statements prepared by banking entities, specific line items dedicated to insurance activities will be introduced in the primary consolidated financial statements to enhance their legibility: Investments of insurance companies in the asset side of the balance sheet, Insurance contracts related liabilities in the liability side of the balance sheet, and Net income from insurance activities within the Net banking income in the income statement.

6
NOTES TO THE CONSOLIDATED FINANCIAL STATEMENTS
2 I 6FF I N A N C I A L I N F O R M A T I O NN
S O C I E T E G E N E R AL E G R O U P I 2018 REGISTRATION DOCUMENT I 321
FIRST APPLICATION OF IFRS 9
Classification of financial assets as well as parameters used for measuring depreciations and provisions for credit risk were validated by the Group before 31st December 2017. For adjusting the opening balance of 2018, the measurement of financial assets that will have been reclassified as well as the amounts of depreciations and provisions for credit risk will be finalised in late February 2018 based on financial assets reclassified on 1st January 2018.
At the date of approval of these consolidated financial statements by the Board of Directors, the Group estimates the first application of IFRS 9 to lead to an overall reduction in the consolidated shareholders’ equity of approximately EUR 1 billion after income tax, mostly due to an increase of the total amount of depreciations and provisions for credit risk.
5. Preparation for the first application of IFRS 16 “leases” This new standard will supersede the existing standard, IAS 17 and modify accounting requirements for leases, and more specifically in relation to the lessees’ financial statements, with very few impacts for the lessors.
ACCOUNTING TREATMENTS PROVIDED BY IFRS 16
For all lease agreements, the lessee will be required to recognise a right-of-use asset representing its right to use the underlying leased asset and a lease liability representing its obligation to make lease payments. In its income statement, the lessee will separately recognise the depreciation of the right-of-use assets and the interest expense on lease liabilities. This treatment is currently applied by lessees to finance-lease transactions and it will then be extended to operating leases as well:
SCOPE
IFRS 16 concerns any contract meeting the definition of a lease except for:
leases to explore for or use non-regenerative resources and leases of biological assets,
service concession arrangements,
licences of intellectual property,
rights held by a lessee under licensing agreements for such items as motion picture films, video recordings, plays, manuscripts, patents and copyrights.
Lessees are not required to apply this standard to intangible assets leases (software for example). In preparing the application of the standard, the Group will use this optional exemption.
Furthermore, lessees may elect not to apply the new requirements to short-term leases (including options to extend the leases) and leases for which the underlying asset is of low value. This latter exemption applies to leases of small devices (such as tablets and personal computers, little office furniture and telephones). In its basis for conclusions, the IASB suggested a value, when new, in the order of magnitude of USD 5,000 or less.
__ _ _ __ _ _
€€ €
€€ €
IIncome statement FFixed assets LLiabilities OOff balance sheet rights aand oobligations
IIAS 17 LLease payments in Other ooperating expenses
IIFRS 16 IInterest expense iin NBI
++
AAmortisation eexpense
__ _ _

6 I 2
NOTES TO THE CONSOLIDATED FINANCIAL STATEMENTS FF I N A N C I A L I N F O R M A T I O NN
322 I 2018 REGISTRATION DOCUMENT I S O C I E T E G E N E R AL E G R O U P
The Group, as lessee, currently records its leases as operating leases and lease payments are recognised as income according to the straight-line method over the term of the lease, in compliance with IAS 17 (see Note 8.2).
Most lease payments (nearly 80%) concern property leases concluded for the rental of retail spaces (branch offices in the retail banking networks in France or abroad) and office buildings (used by some departments belonging to Group headquarters in France and local headquarters of the main overseas subsidiaries, and in some locations on the main international financial markets: London, New York, Hong Kong).
The other lease payments concern mostly leasing of IT equipment and, very incidentally, vehicle leasing.
DISTINGUISHING BETWEEN LEASE CONTRACTS AND SERVICE CONTRACTS
IFRS 16 includes new requirements to distinguish a lease contract from a service contract.
In the financial statements of lessees, the standard will no longer separate operating leases from finance-leases.
However, contracts must be analysed in order to determine whether they meet the definition of a lease contract and to separate, if applicable, each lease component from non-lease components (or services).
A contract is a lease or contains a lease component if the contract conveys the right to control the use of an identified asset for a period of time in exchange for consideration.
If the lessee is not able to separate lease components within the same contract from non-lease components, the contract will be accounted for as a single lease component.
ACCOUNTING TREATMENT OF LEASE CONTRACTS FOR THE LESSEES
Accounting of a lease liability for the lessees
At the time that the asset is made available for use, the lessee shall recognise a lease liability corresponding to the present value of the lease payments that will be paid during the lease period.
Subsequently, this lease liability is measured at amortised cost using the effective interest rate method: each lease payment will be recognised, for one part, in Interest and similar expense and, for the other part, as an amortisation of the lease liability in the balance sheet.
The amount of the lease liability shall be adjusted subsequently in case of change in the lease contract, change in the lease term or change in future lease payments resulting from a change in an index or a rate.
And, if any, the lessee shall recognise a provision for costs in dismantling or restoring the underlying asset to the conditions required by the terms of the lease.
LEASE TERM
In determining the lease term used for the present value of the lease payments, the lease period is the non-cancellable period of a lease, together with both:
periods covered by an option to extend the lease if the lessee is reasonably certain to exercise that option,
periods covered by an option to terminate the lease if the lessee is reasonably certain not to exercise that option.
In assessing whether a lessee is reasonably certain to exercise an option to extend a lease, or not to exercise an option to terminate a lease, the lessee shall consider all relevant facts and circumstances that create an economic incentive to exercise the option to extend the lease, or not to exercise the option to terminate the lease.
DISCOUNT RATE OF LEASES
The lease payments shall be discounted using the interest rate implicit in the lease, if that rate is available or can be readily
determined; if not, the lessee’s incremental borrowing rate will be used. The lessee’s incremental borrowing rate is determined at the legal entity of the lessee and not at Group level, taking into account borrowing conditions and own credit risk.
LEASE AMOUNTS
The lease payments included in the measurement of the lease liability comprise fixed lease payments, variable lease payments that depend on an index (consumer price index or index of construction costs, etc.) or a rate (Euribor, etc.), amounts expected to be payable by the lessee under residual value guarantees, the exercise price of a purchase option and payments of penalties for terminating the lease.
However, variable lease payments are not included in the measurement of the lease liability, such as those based on a use model (index based on turnover or kilometres covered). These variable leases are recognised in the income statement over time according to fluctuations of the contractual index.

6
NOTES TO THE CONSOLIDATED FINANCIAL STATEMENTS
2 I 6FF I N A N C I A L I N F O R M A T I O NN
S O C I E T E G E N E R AL E G R O U P I 2018 REGISTRATION DOCUMENT I 323
Accounting of a right of use for the lessees
At the time that the asset is made available for use, the lessee shall recognise the right-of-use asset for an initial amount equal to the initial measurement of the lease liability, plus any lease payments made at or before the commencement date, and any initial direct costs.
This asset is subsequently amortised linearly over the same term of the lease as the one defined to evaluate the lease liability.
The accounting value of the asset can be adjusted subsequently if the lease is modified in case of change in the lease contract, change in the lease term or change in future lease payments resulting from a change in an index or a rate.
Rights of use are presented in the lessee’s balance sheet under the same heading as other properties of the same nature held in full ownership. In the income statement, depreciation and amortisation of rights of use are presented with the amortisation, depreciation and impairment of assets held in full ownership.
ORGANISATION OF THE IFRS 16 STANDARD IMPLEMENTATION PROGRAMME
Starting in the 4th quarter of 2016, after a preliminary effects analysis of this new standard, the Group began a framework project for the implementation transition of its information systems and processes, and to define the lease contracts to be included in the scope of this new standard.
To that end, a project structure was established by the Finance Division and the Group Resources Division.
In 2017, the Group undertook an initial collection of lease agreements that concern property assets, and began a collection of leases that concern IT equipment, both to be used to fill a contract data base that is under construction.
At the same time, the Group undertook the development of a tool to be used for calculations and exploitation of the contract data base and which will generate the data necessary for the recognition of leases under IFRS 16.
At this stage of the IFRS 16 implementation project, the consequences of its application to the Group financial statement cannot reasonably be estimated.
6. Use of estimates and judgement When applying the accounting principles disclosed in the following notes for the purpose of preparing the Group’s consolidated financial statements, the Management makes assumptions and estimates that may have an impact on figures recorded in the income statement, on the valuation of assets and liabilities in the balance sheet, and on information disclosed in the notes to the consolidated financial statements.
In order to make these assumptions and estimates, the Management uses information available at the date of preparation of the consolidated financial statements and can exercise its judgement. By nature, valuations based on estimates include risks and uncertainties relating to their occurrence in the future. Consequently, actual future results may differ from these
estimates and may then have a significant impact on the financial statements.
The use of estimates mainly concerns the following valuations:
fair value in the balance sheet of financial instruments not quoted in an active market which are classified as Financial assets and liabilities at fair value through profit or loss, Hedging derivatives or Available-for-sale financial assets (described in Notes 3.1, 3.2, 3.3 and 3.4) and fair value of instruments measured at amortised cost for which this information must be disclosed in the notes to the financial statements (see Note 3.9);
the amount of impairment of financial assets (Loans and receivables, Available-for-sale financial assets, Held-to-maturity financial assets), tangible and intangible fixed assets and goodwill (see Notes 2.2, 3.8 and 8.4);
provisions recognised under liabilities (in particular, provisions for disputes in a complex legal environment and provisions for employee benefits), including Underwriting reserves of insurance companies (see Notes 3.8, 4.3 and 5.2);
the amount of deferred tax assets recognised in the balance sheet (see Note 6);
the assessment of control of the Group over an entity when updating the consolidation scope, mainly when structured entities are concerned (see Note 2);
the initial value of goodwill determined for each business combination (see Notes 2.1 and 2.2);
in the event of the loss of control of a consolidated subsidiary, the fair value that is used to remeasure the portion retained by the Group in this entity, where applicable (see Note 2).
The United Kingdom organised on 23rd June 2016 a referendum following which a majority of British citizens voted to leave the European Union (Brexit). After this decision, a long period of negotiations has begun to redefine the economic relationships between the United Kingdom and the European Union. The Group closely follows the progress of the discussions and their consequences in the short, medium and long term. If needed, the Group takes these consequences into account when making assumptions and estimates for preparing its consolidated financial statements.

6 I 2
NOTES TO THE CONSOLIDATED FINANCIAL STATEMENTS FF I N A N C I A L I N F O R M A T I O NN
324 I 2018 REGISTRATION DOCUMENT I S O C I E T E G E N E R AL E G R O U P
NOTE 2 - CONSOLIDATION
MAKING IT
SIMPLE
The various activities of the Societe Generale Group in France and abroad are carried out by Societe Generale – Parent company (which includes the Societe Generale foreign branches) and by all of the entities that it controls either directly or indirectly (subsidiaries and joint arrangements) or on which it exercises significant influence (associates). All of these entities make up the scope of the Group consolidation.
Consolidation uses a standardised accounting process to give an aggregated presentation of the accounts of Societe Generale – Parent company and its subsidiaries, joint arrangements and associates, presented as if they were a single entity.
To do so, the individual accounts of the entities that make up the Group are restated so that they are in accordance with IFRS, as adopted by the European Union, in order to present consistent information in the consolidated financial statements.
In addition, the accounting balances (assets, liabilities, income and expense) generated by transactions between Group entities are eliminated through the consolidation process so that the consolidated financial statements present only the operations and results made with third parties outside of the Group.
ACCOUNTING PRINCIPLES
The consolidated financial statements of Societe Generale include the financial statements of the parent company and of the main French and foreign companies as well as foreign branches over which the Group exercises control, joint control or significant influence.
CONSOLIDATED ENTITIES
Subsidiaries
Subsidiaries are the entities over which the Group has exclusive control. The Group controls an entity if and only if the following conditions are met:
the Group has power over the entity (ability to direct its relevant activities, i.e. the activities that significantly affect the entity’s returns), through the holding of voting rights or other rights; and
the Group has exposure or rights to variable returns from its involvement with the entity; and
the Group has the ability to use its power over the entity to affect the amount of the Group’s returns.
Power
When determining voting rights for the purpose of establishing the Group’s degree of control over an entity and the appropriate consolidation methods, potential voting rights are taken into account where they can be freely exercised at the time the assessment is made or at the latest when decisions about the direction of the relevant activities need to be made. Potential voting rights are instruments such as call options on ordinary shares outstanding on the market or rights to convert bonds into new ordinary shares.
When voting rights are not relevant to determine whether or not the Group controls an entity, the assessment of this control shall consider all the facts and circumstances, including the existence of one or more contractual arrangements. Power over an investee exists only if the investor has substantive rights that give it the current ability to direct relevant activities without barriers.
Some rights are designed to protect the interests of their holder (protective rights) without giving that party power over the investee to which those rights relate.
If several investors each have substantive rights that give them the unilateral ability to direct different relevant activities, the investor that has the current ability to direct the activities that most significantly affect the variable returns of the investee is presumed to have power over the investee.
Exposure to variable returns
Control exists only if the Group is significantly exposed to the variability of variable returns generated by its investment or its involvement in the entity. These returns, which could be dividends, interest, fees, etc., can be only positive, only negative or both positive and negative.

6
NOTES TO THE CONSOLIDATED FINANCIAL STATEMENTS
2 I 6FF I N A N C I A L I N F O R M A T I O NN
S O C I E T E G E N E R AL E G R O U P I 2018 REGISTRATION DOCUMENT I 325
Special case of structured eentities
A structured entity is an entity that has been designed so that voting or similar rights are not the dominant factor in deciding who controls the entity. Such is the case, for example, when the relevant activities are directed by means of contractual arrangements.
A structured entity often presents certain characteristics such as a limited business activity, a specific and carefully defined purpose, or insufficient capital to fund its activities without the use of subordinated financing.
Structured entities may assume different legal forms: stock companies, partnerships, securitisation vehicles, mutual funds, unincorporated entities, etc.
When assessing the existence of control over a structured entity, all facts and circumstances shall be considered, among which:
the purpose and design of the entity;
the structuring of the entity;
risks to which the entity is exposed by way of its design and the Group’s exposure to some or all of these risks;
potential returns and benefits for the Group.
Unconsolidated structured entities are those that are not exclusively controlled by the Group.
Joint arrangements
Through a joint arrangement (either a joint operation or a joint venture) the Group exercises joint control over an entity if decisions about the direction of its relevant activities require the unanimous consent of the parties that collectively control the entity. Assessing joint control requires an analysis of the rights and obligations of all the parties.
In the case of a joint operation, the parties to the arrangement have rights to the assets and obligations for the liabilities.
In the case of a joint venture, the parties have rights to the net assets of the entity.
Associates
Associates are companies over which the Group exercises significant influence and are accounted for using the equity method in the Group’s consolidated financial statements. Significant influence is the power to participate in the financial and operating policies of an entity without exercising control. In particular, significant influence can result from Societe Generale being represented on the Board of Directors or Supervisory Board, from its involvement in strategic decisions, from the existence of significant intercompany transactions, from the exchange of management staff, or from the company’s technical dependency on Societe Generale. The Group is assumed to exercise significant influence over the financial and operating policies of an entity when it directly or indirectly holds at least 20% of the voting rights in this entity.
CONSOLIDATION RULES AND METHODS
The consolidated financial statements are built up from the financial statements of the entities that are included in the consolidation scope. Companies with a fiscal year ending more than three months before or after that of Societe Generale prepare pro-forma statements for a twelve-month period ended 31st December. All significant balances, profits and transactions between Group companies are eliminated.
The results of newly acquired subsidiaries are included in the consolidated financial statements from the date the acquisition became effective and results of subsidiaries disposed of during the fiscal year are included up to the date where the Group relinquished control.
Consolidation methods
The subsidiaries, which may include structured entities over which the Group has exclusive control, are fully consolidated.
In the consolidated balance sheet, full consolidation consists in replacing the value of the subsidiary’s equity securities held by the Group with each of the subsidiary’s assets and liabilities, in addition to the goodwill recognised when the Group assumed control over the entity (see Note 2.2).
In the income statement and the statement of net income and unrealised or deferred gains and losses, the subsidiary’s expense and income items are aggregated with those of the Group.
The share of non-controlling interests in the subsidiary is presented separately in the consolidated balance sheet and income statement. However, in consolidating structured entities that are controlled by the Group, the shares of said entities not held by the Group are recognised as Debt in the balance sheet.
In the case of a joint operation, the Group distinctly recognises in its consolidated financial statements its share in the assets and liabilities as well as its share in the related revenue and expense.
Associates and joint ventures are accounted for using the equity method in the consolidated financial statements of the Group. Under the equity method, on initial recognition the investment in an associate is recognised under Investments accounted for using the equity method at the cost of the Group’s investment in the joint venture or associate, including goodwill and after the date of acquisition the carrying amount is increased or decreased to recognise the changes in the investor’s share in the net asset value of the investee.

6 I 2
NOTES TO THE CONSOLIDATED FINANCIAL STATEMENTS FF I N A N C I A L I N F O R M A T I O NN
326 I 2018 REGISTRATION DOCUMENT I S O C I E T E G E N E R AL E G R O U P
These investments are tested for impairment if there is objective evidence of impairment. If the recoverable amount of the investment (value in use or market value net of selling costs, whichever is higher) is lower than its carrying amount, an impairment loss is recorded on the balance sheet at the carrying amount of the investment. Impairment allowances and reversals are recorded under Net income from investments accounted for using the equity method.
The Group’s share in the entity’s net income and unrealised or deferred gains and losses is presented on separate lines in the consolidated income statement and the consolidated statement of net income and unrealised or deferred gains and losses. If the Group’s share in the losses of an entity consolidated using the equity method becomes greater than or equal to its ownership interest in the company, the Group ceases to recognise its share in subsequent losses unless it is required to do so by legal or implied obligations, in which case it records a provision for said losses.
Capital gains and losses generated on disposal of companies accounted for using the equity method are recorded under Net income/expense from other assets.
Translation of foreign entity financial statements
The balance sheet items of consolidated companies reporting in foreign currencies are translated into euro at the official exchange rates prevailing at the closing date. Income statement items of these companies are translated into euro, at the average month-end exchange rates. Gains and losses arising from the translation of capital, reserves, retained earnings and income are recognised under Unrealised or deferred gains and losses – Translation differences. Gains and losses arising from the translation of the capital contribution of foreign branches of Group banks are also included in changes in consolidated shareholders’ equity under the same heading.
In accordance with the option allowed under IFRS 1, the Group allocated all differences arising on translation of foreign entity financial statements at 1st January 2004 to consolidated reserves. As a result, if any of these entities are sold, the proceeds from the sale will only include write-backs of those translation differences arising since 1st January 2004
Changes in Group’s ownership interest in a consolidated entity
In the event of an increase in the Group’s ownership interest in a subsidiary over which it already exercises control: the differences between the price paid for the additional stake and the assessed fair value of the proportion of net assets acquired at this date is recorded under Retained earnings, Group share.
Also, in the event of a reduction in the Group’s stake in an entity over which it keeps control, the difference between the selling price and the carrying amount of the shares of interests sold is accounted for under Retained earnings, Group share.
The cost relative to these transactions is recognised directly in equity.
At this date, when the Group loses control of a consolidated subsidiary, any investment retained in the former subsidiary is then remeasured at fair value through profit or loss, and at the same time the capital gain or loss is recorded under Net income/expense from other assets in the consolidated income statement. The gain or loss on disposal includes a share of goodwill previously allocated to the cash-generating units to which the subsidiary belongs. This share is determined using a relative approach based on the normative capital allocated to the subsidiary that is sold and to the portion of cash-generating unit that is retained.
COMMITMENTS TO BUY OUT MINORITY SHAREHOLDERS IN FULLY CONSOLIDATED SUBSIDIARIES
The Group has awarded minority shareholders in some fully consolidated Group subsidiaries commitments to buy out their stakes. For the Group, these buyout commitments are put option sales. The exercise price for these options can be established using a formula agreed upon at the time of the acquisition of the shares in the subsidiary that takes into account its future performance. It can also be set as the fair value of these shares at the exercise date of the options.
The commitments are recorded as follows:
in accordance with IAS 32, the Group records a financial liability for the put options granted to minority shareholders of the subsidiaries over which it exercises control. This liability is initially recognised at the present value of the estimated exercise price of the put options under Other Liabilities;
the obligation to recognise a liability even though the put options have not been exercised means that, in order to be consistent, the Group must use the same accounting treatment as that applied to transactions in Non-controlling interests. As a result, the counterpart of this liability is a write-down in value of non-controlling interests underlying the options, with any balance deducted from Retained earnings, Group share;
subsequent variations in this liability linked to changes in the estimated exercise price of the options and the carrying value of Non-controlling interests are recorded in full in Retained earnings, Group share;
if the buy-out takes place, the liability is settled by the cash payment linked to the acquisition of non-controlling interests in the subsidiary in question. However if, when the commitment reaches its term, the buy-out has not occurred, the liability is written off against Non-controlling interests and Retained earnings, Group share for their respective portions;
as long as the options have not been exercised, the results linked to Non-controlling interests with a put option are recorded under Non-controlling interests on the Group’s consolidated income statement.

6
NOTES TO THE CONSOLIDATED FINANCIAL STATEMENTS
2 I 6FF I N A N C I A L I N F O R M A T I O NN
S O C I E T E G E N E R AL E G R O U P I 2018 REGISTRATION DOCUMENT I 327
NOTE 2.1 - CONSOLIDATION SCOPE
The scope of consolidation is presented by location in Note 8.6.
The consolidation scope includes subsidiaries and structured entities under the Group’s exclusive control, joint arrangements (joint ventures and joint operations) and associates whose financial statements are significant relative to the Group’s consolidated financial statements, notably regarding Group consolidated total assets and gross operating income.
The main changes to the consolidation scope at 31st December 2017, compared with the scope applicable at the closing date of 31st December 2016, are as follows:
ANTARIUS
On 8th February 2017, Aviva France and Sogecap signed an agreement substantiating the acquisition by Sogecap of the 50% interest in Antarius previously held by Aviva France. The transfer of the shares has been effective since 1st April 2017. Antarius is now 100% owned by the Group, jointly by Sogecap and Crédit du Nord. It is fully consolidated since that date.
This operation generated a profit in the income statement under Net income/expense from other assets totalling EUR 203 million, resulting from the fair value adjustment of the share held by Crédit du Nord before the acquisition. Goodwill for an amount of EUR 325 million has been recognised and allocated to CGU Insurance (see Note 2.2).
The Group’s balance sheet increased by EUR 16 billion, mainly through EUR 9 billion under Available-for-sale financial assets and EUR 5 billion under Financial assets at fair value through profit or loss in the assets, and EUR 15 billion under Underwriting reserves of insurance companies in the liabilities.
SPLITSKA BANKA
On 2nd May 2017, the Group sold its entire stake in Splitska Banka (100%), its Croatian subsidiary, to OTP Bank.
The sale reduced the Group’s balance sheet by EUR 3.6 billion, mainly through reductions of EUR 2 billion in Customer loans and of EUR 2.7 billion in Customer deposits, reported respectively under Non-current assets held for sale and Non-current liabilities held for sale at 31st December 2016.
ALD
INITIAL PUBLIC OFFERING
On 16th June 2017, the Group sold 80,820,728 shares of ALD SA (The ALD Group) representing 20% of its capital, when it was introduced on the regulated market of Euronext Paris at a price of EUR 14.30 per share.
An over-allotment option of up to an additional 3% of the share capital of ALD SA was exercised on 12th July 2017 for 0.18%.
This introduction resulted in the sale of existing ordinary shares by Societe Generale Group, for a total of EUR 1,166 million, representing an increase in Shareholders’ equity, Group share of EUR 457 million and EUR 641 million in Non-controlling interests.
ACQUISITION OF MERRION FLEET
On 18th July 2017, ALD acquired Merrion Fleet. This acquisition enabled ALD to enter the Irish market.
The Group’s balance sheet increased by EUR 61 million, specifically with EUR 44 million in assets under Tangible and Intangible Fixed Assets and EUR 42 million in liabilities under Due to Banks.
ACQUISITION OF BBVA AUTORENTING
On 26th September 2017, ALD Automotive SAU acquired BBVA Autorenting, a leasing subsidiary of the second largest Spanish bank, BBVA. This operation enabled ALD to consolidate its competitive position on a high-potential Spanish market.
The Group’s balance sheet increased by EUR 0.6 billion, specifically with EUR 0.4 billion in assets under Tangible and Intangible Fixed Assets and EUR 0.4 billion in liabilities under Due to Banks.
FORTUNE SG FUND MANAGEMENT CO LTD
On 11th September 2017, the Group sold its shares in Fortune SG Fund Management Co Ltd, an asset management company in China. This represented 49% of the company’s capital and was sold to Warburg Pincus Asset Management LP. This participation was included in the Group’s balance sheet using the equity method.
The sale generated a gain of EUR 73 million, recorded in the profit and loss account under Net income/expense from other assets.

6 I 2
NOTES TO THE CONSOLIDATED FINANCIAL STATEMENTS FF I N A N C I A L I N F O R M A T I O NN
328 I 2018 REGISTRATION DOCUMENT I S O C I E T E G E N E R AL E G R O U P
NOTE 2.2 - GOODWILL
MAKING IT
SIMPLE
When the Group acquires a company, it integrates in its consolidated balance sheet all of the new subsidiary’s assets and liabilities at fair value, as if they had been individually acquired.
But the acquisition price of a company is generally higher than the net revalued amount of its assets and liabilities. The excess value, called goodwill, can represent part of the company’s intangible capital (reputation, quality of its personnel, market shares, etc.) which contributes to its overall value, or the value of the future synergies that the Group hopes to develop by integrating the new subsidiary in its existing activities.
In the consolidated balance sheet, the goodwill is recognised as an intangible asset, the useful life of which is presumed to be unlimited; it is not amortised and therefore does not generate any recurring expense in the Group’s future results.
However, every year, the Group assesses whether the value of its goodwill has not depreciated. If it has, an irreversible expense is immediately recognised in the Group results, which indicates that the profitability of the intangible capital of the acquired entity is inferior to initial expectations, or that the anticipated synergies have not been fulfilled.
ACCOUNTING PRINCIPLES
The Group uses the acquisition method to recognise its business combinations.
At the acquisition date, all assets, liabilities, off-balance sheet items and contingent liabilities of the acquired entities that are identifiable under the provisions of IFRS 3 “Business Combinations” are measured individually at their fair value regardless of their purpose. The analyses and professional appraisals required for this initial valuation must be carried out within 12 months as from the acquisition date, as must any corrections to the value based on new information related to facts and circumstances existing at the acquisition date. At the same time, Non-controlling interests are valued according to their share of the fair value of the identifiable assets and liabilities of the acquired entity. However, for each business combination, the Group may also choose to measure Non-controlling interests initially at their fair value, in which case a fraction of goodwill is allocated.
The acquisition cost is calculated as the total fair value, at the date of acquisition, of all assets given, liabilities incurred or assumed and equity instruments issued in exchange for the control of the acquired entity. The costs directly linked to business combinations are recognised in the income statement for the period except those related to the issuance of equity instruments.
Any contingent consideration is included in the acquisition cost at its fair value on the acquisition date, even if its occurrence is only potential. It is recognised under equity or debt in the balance sheet depending on the settlement alternatives; if recognised as debt, any subsequent adjustments are recorded under income for financial liabilities in accordance with IAS 39 and within the scope of the appropriate standards for other debts. For equity instruments, these subsequent adjustments are not recognised. Any excess of the price paid over the assessed fair value of the proportion of net assets acquired is recorded on the asset side of the consolidated balance sheet under Goodwill. Any deficit is immediately recognised in the income statement. On the date of acquisition of an entity, any stake in this entity already held by the Group is remeasured at fair value through profit or loss. In the case of a step acquisition, goodwill is therefore determined by referring to the fair value on the acquisition date.
At the acquisition date, each item of goodwill is allocated to one or more cash-generating units expected to derive benefits from the acquisition. When the Group reorganises its reporting structure in a way that changes the composition of one or more cash-generating units, goodwill previously allocated to modified units is reallocated to the units affected (new or existing). This reallocation is generally performed using a relative approach based on the normative capital requirements of each cash-generating unit affected.
Goodwill is reviewed regularly by the Group and tested for impairment whenever there is any indication that its value may have diminished, and at least once a year. Any impairment of goodwill is calculated based on the recoverable value of the relevant cash-generating unit(s).
If the recoverable amount of the cash-generating unit(s) is less than its (their) carrying amount, an irreversible impairment is recorded in the consolidated income statement for the period under Value adjustments on goodwill.

6
NOTES TO THE CONSOLIDATED FINANCIAL STATEMENTS
2 I 6FF I N A N C I A L I N F O R M A T I O NN
S O C I E T E G E N E R AL E G R O U P I 2018 REGISTRATION DOCUMENT I 329
The table below shows the changes in the net values of goodwill recorded by the Cash-Generating Units (CGUs) in 2017:
(In EUR m) Net book value at
31.12.2016 Acquisitions and other increases
Disposals Impairment
losses Net book value at
31.12.2017
French Retail Banking 815 - - - 815
Societe Generale Network 304 304
Crédit du Nord 511 511
International Retail Banking & FFinancial Services 2,756 453 - - 3,209
Europe 1,787 1,787
Russia - -
Africa, Asia, Mediterranean Basin and Overseas 231 231
Insurance 10 325 335
Equipment and Vendor Finance 335 335
Auto Leasing Financial Services 393 128 521
Global Banking and Investor SSolutions
964 - - - 964
Global Markets and Investor Services 501 501
Financing and Advisory 39 39
Asset and Wealth Management 424 424
Tootal 4,535 453 - - 4,988
The scope of certain CGUs changed over 2017 (see Note 2.1), including in particular:
Insurance, following the acquisition of Antarius;
Auto Leasing Financial Services, following:
- the acquisition of Merrion Fleet in Ireland and BBVA Autorenting in Spain; - the change in consolidation method of ALD automotive Magyarorszag KFT in Hungary which generates the recording of the
goodwill of the acquisition of Mkb-Euroleasing.

6 I 2
NOTES TO THE CONSOLIDATED FINANCIAL STATEMENTS FF I N A N C I A L I N F O R M A T I O NN
330 I 2018 REGISTRATION DOCUMENT I S O C I E T E G E N E R AL E G R O U P
At 31st December 2017, goodwill recorded by the 11 CGUs can be broken down as follows:
Pillars Activities
FFrench Retail Banking
Societe Generale Network Societe Generale’s retail banking network, Boursorama online banking activities, consumer and equipment financing in France and transaction and payment management services
Crédit du Nord Retail banking network of Crédit du Nord and its 7 regional banks
IInternational Retail Banking and Financial Services
Europe Retail banking and consumer finance services in Europe, notably in Germany (Hanseatic Bank, BDK), Italy (Fiditalia), Czech Republic (KB, Essox), Romania (BRD) and Poland (Eurobank)
Russia Integrated banking group including Rosbank and its subsidiaries DeltaCredit and Rusfinance
Africa, Asia, Mediterranean Basin and Overseas
Retail banking and consumer finance in Africa, Asia, the Mediterranean Basin and Overseas, including in Morocco (SGMA), Algeria (SGA), Tunisia (UIB), Cameroon (SGBC), Côte d’Ivoire (SGBCI) and Senegal (SGBS)
Insurance Life and non-life insurance activities in France and abroad (including Sogecap, Sogessur, Oradéa Vie and Antarius)
Equipment and Vendor Finance Financing of sales and professional equipment by Societe Generale Equipment Finance
Auto Leasing Financial Services Operational vehicle leasing and fleet management services (ALD Automotive)
GGlobal Banking and Investor Solutions
Global Markets and Investor Services Market solutions for businesses, financial institutions, the public sector, family offices and a full range of securities services, clearing services, execution, prime brokerage and custody
Financing and Advisory Advisory and financing services for businesses, financial institutions and the public sector
Asset and Wealth Management Asset and Wealth Management Solutions in France and abroad
The Group performed an annual impairment test at 31st December 2017 for each CGU to which goodwill had been allocated. A CGU is defined as the smallest identifiable group of assets that generates cash inflows, which are largely independent of the cash inflows from the Group’s other assets or groups of assets. Impairment tests consist in assessing the recoverable value of each CGU and comparing it with its carrying value. An irreversible impairment loss is recorded in the income statement if the carrying value of a CGU, including goodwill, exceeds its recoverable value. This loss is booked to the impairment of goodwill.
The recoverable amount of a cash-generating unit is calculated using the most appropriate method, generally the discounted cash flow (DCF) method applied to the entire cash-generating unit. The cash flows used in this calculation are income available for distribution generated by all the entities included in the cash-generating unit, taking into account the Group targeted equity allocated to each CGU.
The cash flows were determined this year on a six-year period, with the prospective five-year budgets (from 2018 to 2022) extrapolated over the year 2023, this one corresponding to a “normative” year used to calculate the terminal value:
allocated equity at 31st December 2017 amounted to 11% of risk-weighted assets, excepted for Crédit du Nord, whose allocated equity amounted to 10.5%, in accordance with the entity’s management guidelines;
the discount rate is calculated using a risk-free rate grossed up by a risk premium based on the CGU’s underlying activities. This risk premium, specific to each activity, is calculated from a series of equity risk premiums published by SG Cross Asset Research and from its specific estimated volatility (beta). Where appropriate, the risk-free rate is also grossed up by a sovereign risk premium, representing the difference between the risk-free rate available in the area of monetary assignment (mainly US dollar area or Euro area) and the interest rate observed on liquid long-term treasury bonds issued (mainly US dollar area or Euro area), in proportion with risk-weighted assets for CGUs covering several countries;
the growth rates used to calculate the terminal value is determined using forecasts on long-term economic growth and sustainable inflation. These rates are estimated using two mains sources, namely the International Monetary Fund and the economic analyses produced by SG Cross Asset Research which provide 2021-2022 forecasts.
No goodwill impairment was recognised as at 31st December 2017 as a result of the annual CGU impairment test.

6
NOTES TO THE CONSOLIDATED FINANCIAL STATEMENTS
2 I 6FF I N A N C I A L I N F O R M A T I O NN
S O C I E T E G E N E R AL E G R O U P I 2018 REGISTRATION DOCUMENT I 331
The table below presents discount rates and long-term growth rates specific for the CGUs of the Group’s three core businesses:
Assumptions at 31st December 2017 Discount
rate Long-term
growth rate
FFrench Retail Banking
Societe Generale Network and Crédit du Nord 8.2% 2%
IInternational Retail Banking and Financial Services
Retail Banking and Consumer Finance 10.2% to 15.4% 3%
Insurance 9.1% 2.5%
Equipment and Vendor Finance and Auto Leasing Financial Services 9.6% 2%
GGlobal Banking and Investor Solutions
Global Markets and Investor Services 11.5% 2%
Financing and Advisory 9.9% 2%
Asset and Wealth Management 9.7% 2%
Budget projections are based on the following main business line and macroeconomic assumptions:
FFrench Retail Banking
Societe Generale Network and Crédit du Nord
In a challenging environment (regulatory constraints, low inflation, historically low rates), ongoing efforts to shift operations and relationship banking at Societe Generale and Crédit du Nord towards a digital model
Confirmation of Boursorama’s customer acquisition plan
IInternational Retail Banking & Financial Services
Europe Continued adaptation of our models to capture growth potential in the region and consolidate the competitive positions of our operations
Strict discipline applied to operating expenses and normalisation of cost of risk
Russia Achievement of recovery of activities in Russia in stabilising economic conditions
Strict discipline applied to operating expenses and cost of risk
Africa, Asia, Mediterranean Basin and Overseas
Continued development of Societe Generale’s sales network and expansion of services through the mobile banking offer
Continued focus on operating efficiency
Insurance Reinforcement of the integrated bank insurance model with the acquisition of Antarius and continued dynamic growth in France and abroad in synergy with the retail banking network, Private Banking and financial services to businesses
Equipment and Vendor Finance
Consolidation of leadership in these corporate financing businesses
Consolidation of profitability by continuing to focus on activities with the best risk/reward
Auto Leasing Financial Services
Reinforcement of leadership of ALD relative to solutions of mobility and continued growth for the long-time leasing to retail customers
GGlobal Banking and Investor Solutions
Global Markets and Investor Services
Adaptation of market activities to a competitive environment, coupled with further business and regulatory investments.
Consolidation of market-leading franchises (equities) and development of prime brokerage activities
Continued optimisation measures and investments in information systems
Financing and Advisory Continuation of origination momentum of financing activities
Consolidation of market-leading franchises (commodity and structured financing)
Management of cost of risk despite challenging economic conditions
Asset and Wealth Management
Continued development of synergies with retail bank networks, both in France or abroad, development of synergies between private banking and asset and wealth management, improvement of commercial and operational efficiency
Sensitivity tests are carried out to measure the impact on each CGU’s recoverable value of the variation in certain assumptions.
At 31st December 2017, in light of the risks associated with business activity in the current environment (market volatility, regulatory uncertainties), sensitivities to variations in the discount rate and to long-term growth were measured.
According to the results of these tests:
an increase of 50 basis points applied to all discount rates for the CGUs disclosed in the table above would lead to a decrease of 18.1% in recoverable value and would not generate any additional impairment;
similarly, a decrease of 50 basis points in long-term growth rates would lead to a decrease of 6.5% in recoverable value and would not generate any additional impairment.

6 I 2
NOTES TO THE CONSOLIDATED FINANCIAL STATEMENTS FF I N A N C I A L I N F O R M A T I O NN
332 I 2018 REGISTRATION DOCUMENT I S O C I E T E G E N E R AL E G R O U P
NOTE 2.3 - ADDITIONAL DISCLOSURES FOR CONSOLIDATED ENTITIES AND INVESTMENTS ACCOUNTED FOR USING THE EQUITY METHOD
This Note provides additional disclosures for entities included in the consolidation scope.
These disclosures concern entities over which Societe Generale exercises exclusive control, joint control or significant influence, provided these entities have significant impact on the Group’s consolidated financial statements. The significance of the impact is considered in particular regarding Group consolidated total assets and gross operating income.
1. CONSOLIDATED STRUCTURED ENTITIES
Consolidated structured entities include:
collective investment vehicles such as SICAVs (open-ended investment funds) and mutual funds managed by the Group’s asset management subsidiaries;
securitisation funds and conduits issuing financial instruments that can be subscribed for by investors and that generate credit risks inherent in an exposure or basket of exposures which can be divided into tranches; and
asset financing vehicles (aircraft, rail, shipping or real estate finance facilities).
The Group has not provided any financial support to these entities outside of any contractual framework for the closing period and as of 31st December 2017 does not intend to support them financially.
The Group has entered into contractual agreements with certain consolidated structured entities that may lead to financial support for these entities due to their exposure to credit, market or liquidity risks.
Securities issued by structured debt vehicles carry an irrevocable and unconditional guarantee from Societe Generale for payment of amounts due by issuer. These issuers also enter into hedging transactions with Societe Generale to enable them to meet their payment obligations. As of 31st December 2017, the amount of outstanding loans thus guaranteed is EUR 51 billion.
As part of its securitisation activities on behalf of its clients or investors, Societe Generale grants two liquidity lines to ABCP (Asset Back Commercial Paper) for a total amount of EUR 18.3 billion as of 31st December 2017.
2. NON-CONTROLLING INTERESTS
Non-controlling interests refer to equity holdings in fully consolidated subsidiaries that are neither directly nor indirectly attributable to the Group. They include equity instruments issued by these subsidiaries and not held by the Group, as well as the share of income and accumulated reserves, and of unrecognised or deferred gains and losses attributable to the holders of these instruments.
Non-controlling interest amounted to EUR 4,664 million at 31st December 2017 (vs. EUR 3,753 million at 31st December 2016) and accounted for 7% of Group shareholders’ equity at 31st December 2017 (vs. 6% at 31st December 2016).
The Non-controlling interests of a significant amount in terms of contribution to the total Group consolidated shareholders’ equity relate to:
listed subsidiaries Banka A.S, BRD - Groupe Societe Generale SA and SG Marocaine de Banques;
Sogecap, fully owned, with the subordinated notes issued in December 2014.
31.12.2017
(In EUR m) Group voting
interest
Group ownership
interest
Net income attributable to non-
controlling interests
Total non-controlling
interests
Dividends paid during the year to holders of
non-controlling interests
BANKA A.S 60.73% 60.73% 214 1,390 (104)
BRD - GROUPE SOCIETE GENERALE SA
60.17% 60.17% 122 634 (43)
SG MAROCAINE DE BANQUES 57.53% 57.53% 37 409 (7)
SOGECAP 100.00% 100.00% 33 829 (33)
Other entities - - 218 1,402 (89)
Total - - 624 4,664 (276)

6
NOTES TO THE CONSOLIDATED FINANCIAL STATEMENTS
2 I 6FF I N A N C I A L I N F O R M A T I O NN
S O C I E T E G E N E R AL E G R O U P I 2018 REGISTRATION DOCUMENT I 333
31.12.2016
(In EUR m) Group voting
interest
Group ownership
interest
Net income attributable to non-
controlling interests
Total non-controlling
interests
Dividends paid during the year to holders of
non-controlling interests
BANKA A.S 60.73% 60.73% 190 1,228 (162)
BRD - GROUPE SOCIETE GENERALE SA 60.17% 60.17% 77 589 (19)
SG MAROCAINE DE BANQUES 57.46% 57.46% 21 400 (4)
SOGECAP 100.00% 100.00% 33 829 (33)
Other entities - - 143 707 (73)
Total - - 464 3,753 (291)
SUMMARISED FINANCIAL INFORMATION FOR MAIN NON-CONTROLLING INTERESTS
The information below are the data of the entities (excluding Sogecap) taken at 100% and before the elimination of intragroup operations.
31.12.2017
(In EUR m) Net banking
income Net income Net income and unrealised or
deferred gains and losses Total balance sheet
BANKA A.S 1,140 567 925 38,655
BRD - GROUPE SOCIETE GENERALE SA 585 310 184 11,701
SG MAROCAINE DE BANQUES 384 89 90 7,890
31.12.2016
(In EUR m) Net banking
income Net income Net income and unrealised or
deferred gains and losses Total balance sheet
BANKA A.S 1,131 505 797 33,655
BRD - GROUPE SOCIETE GENERALE SA 596 196 139 11,349
SG MAROCAINE DE BANQUES 339 53 81 7,968
3. INVESTMENTS ACCOUNTED FOR USING THE EQUITY METHOD (ASSOCIATES AND JOINT VENTURES)
SUMMARISED FINANCIAL INFORMATION FOR JOINT VENTURES AND ASSOCIATES
(In EUR m) Joint ventures Associates
Total investments accounted for using the
equity method
Group share: 2017 2016 2017 2016 2017 2016
Net income 19 72 73 57 92 129
Unrealised or deferred gains and losses (net of tax) - - (14) (14) Net income and unrealised or ddeferred gains and losses
19 72 59 57 78 129
In 2017, the activities of joint ventures mainly include real estate development.

6 I 2
NOTES TO THE CONSOLIDATED FINANCIAL STATEMENTS FF I N A N C I A L I N F O R M A T I O NN
334 I 2018 REGISTRATION DOCUMENT I S O C I E T E G E N E R AL E G R O U P
COMMITMENTS TO RELATED PARTIES
(In EUR m) 31.12.2017 31.12.2016
Loan commitments granted - -
Guarantee commitments granted 75 17
Forward financial instrument commitments 6 90
4. RESTRICTIONS
SIGNIFICANT RESTRICTIONS ON THE ABILITY TO ACCESS OR USE THE ASSETS OF THE GROUP
Legal, regulatory, statutory or contractual constraints or requirements may restrict the ability of the Group to transfer assets freely to or from entities within the Group.
The ability of consolidated entities to distribute dividends or to grant or repay loans and advances to entities within the Group depends on, among other things, local regulatory requirements, statutory reserves and financial and operating performance. Local regulatory requirements may concern regulatory capital, exchange controls or non-convertibility of the local currency (as it is the case in countries belonging to the West African Economic and Monetary Union or to the Economic and Monetary Community of Central Africa), liquidity ratios (as in the United States) or large exposures ratios that aim to cap the entity’s exposure in relation to the Group (regulatory requirement to be fulfilled in most countries in Eastern and Central Europe, Maghreb and sub-Saharan Africa).
The ability of the Group to use assets may also be restricted in the following cases:
assets pledged as security for liabilities, notably guarantees provided to the central banks, or assets pledged as security for transactions in financial instruments, mainly through guarantee deposits with clearing houses;
securities that are sold under repurchase agreements or that are lent;
assets held by insurance subsidiaries in representation of unit-linked liabilities with life-insurance policy holders;
assets held by consolidated structured entities for the benefit of the third-party investors that have bought the notes or securities issued by the entity;
mandatory deposits placed with central banks.

6
NOTES TO THE CONSOLIDATED FINANCIAL STATEMENTS
2 I 6FF I N A N C I A L I N F O R M A T I O NN
S O C I E T E G E N E R AL E G R O U P I 2018 REGISTRATION DOCUMENT I 335
NOTE 2.4 - UNCONSOLIDATED STRUCTURED ENTITIES
The information provided hereafter concerns entities structured but not controlled by the Group. This information is grouped by main type of similar entities, such as Financing activities, Asset management and Others (including Securitisation and Issuing vehicles).
Asset financing includes lease finance partnerships and similar vehicles that provide aircraft, rail, shipping or real estate finance facilities.
Asset management includes mutual funds managed by the Group’s asset management subsidiaries.
Securitisation includes securitisation funds or similar vehicles issuing financial instruments that can be subscribed for by investors and that generate credit risks inherent in an exposure or basket of exposures which can be divided into tranches.
The Group’s interests in unconsolidated entities that have been structured by third parties are classified among financial instruments in the consolidated balance sheet according to their nature (Financial assets at fair value through profit or loss or Liabilities at fair value through profit or loss, Available-for-sale financial assets, Loans and Deposits, Debts, etc.).
1. INTERESTS IN UNCONSOLIDATED STRUCTURED ENTITIES
The Group’s interests in an unconsolidated structured entity refer to contractual and non-contractual involvements that expose the Group to the variability of returns from the performance of this structured entity.
Such interests can be evidenced by:
the holding of equity or debt instruments (regardless of their rank of subordination);
other funding (loans, cash facilities, loan commitments, liquidity facilities, etc.);
credit enhancement (guarantees, subordinated instruments, credit derivatives, etc.);
issuance of guarantees (guarantee commitments);
derivatives that absorb all or part of the risk of variability of the structured entity’s returns, except Credit Default Swap (CDS) and options purchased by the Group;
contracts remunerated by fees indexed to the structured entity’s performance;
tax consolidation agreements.
Asset financing Asset management Others
(In EUR m) 31.12.2017 31.12.2016 31.12.2017 31.12.2016 31.12.2017 31.12.2016
Total balance sheet of the entity((1) 8,777 8,730 102,355 90,537 41,067 19,204
Net carrying amount of GGroup interests in unconsolidated structured entities:
Assets: 3,629 3,915 10,452 10,274 13,054 6,654
Financial assets at fair value through profit or loss
411 522 9,906 9,836 7,819 2,633
Available-for-sale financial assets 85 67 14 17 556 613
Bank and customer loans and receivables 3,127 3,318 458 419 4,677 3,403
Others 6 8 74 2 2 5
Liabilities: 1,641 1,803 11,180 10,893 7,580 5,048
Financial liabilities at fair value through profit or lloss 225 255 9, 549 9,235 6,699 3,414
Due to banks and customer deposits 1,389 1,513 1,580 1,631 876 1,587
Others 27 35 51 27 5 47
(1) For Asset management, NAV (Net Asset Value) of funds.

6 I 2
NOTES TO THE CONSOLIDATED FINANCIAL STATEMENTS FF I N A N C I A L I N F O R M A T I O NN
336 I 2018 REGISTRATION DOCUMENT I S O C I E T E G E N E R AL E G R O U P
The Group did not provide any financial support to these entities outside of any binding contractual arrangement and, as of 31st December 2017, it did not have any intention to provide such support.
The maximum exposure to loss related to interests in unconsolidated structured entities is measured as:
the amortised cost or fair value(1) for non-derivative financial
assets entered into with the structured entity depending on how they are measured on the balance sheet;
the fair value(1) of derivative financial assets recognised in the
balance sheet;
the notional amount of written Credit Default Swaps (maximum amount to pay);
the notional amount of loan commitments or guarantee commitments granted.
Asset financing Asset management Others
(In EUR m) 31.12.2017 31.12.2016 31.12.2017 31.12.2016 31.12.2017 31.12.2016
Amortised cost or fair value(1) (according to the measurement of the financial instrument) of non-derivative financial assets entered into with the structured entity
3,190 3,714 5,993 6,798 3,229 1,718
Fair value(1) of derivative financial assets recognised in the balance sheet 283 357 5,990 4,926 6,295 2,436
Notional amount of CDS sold (maximum amount to be paid) - - - 2 - -
Notional amount of loan or guarantee commitments granted 535 562 1,536 1,468 788 1,049
Maximum exposure to loss 4,008 4,633 13,519 13,194 10,312 5,203
The amount of maximum exposure to loss can be mitigated by:
the notional amount of guarantee commitments received;
the fair value(1) of collateral received;
the carrying amount of surety deposits received.
These mitigating amounts must be capped in case of legal or contractual limitation of their realisable or recoverable amounts. They amounted to EUR 1,727 million and mainly concern Asset financing.
2. INFORMATION ON UNCONSOLIDATED STRUCTURED ENTITIES SPONSORED BY THE GROUP
The Group may have no ownership interest in a structured entity, but still be considered as a sponsor of this structured entity if it acts or has acted as:
a structurer;
an originator for potential investors;
an asset manager;
an implicit or explicit guarantor of the entity’s performance (in particular via capital or return guarantees granted to mutual fund unit holders).
A structured entity is also considered to be sponsored by the Group if its name includes the name of the Group or the name of one of its subsidiaries.
Conversely, entities that are structured by the Group according to specific needs expressed by one or more customers or investors are considered to be sponsored by said customers or investors.
At 31st December 2017, the total amount of the balance sheet of these unconsolidated structured entities, sponsored by the Group, and in which the Group does not have any interest, was EUR 7,602 million (including EUR 3,977 million for Other structures).
In 2017, the amount of income from these structured entities (mainly Asset financing) was EUR 3.6 million from gains on derecognition of interests in structured entities.
(1) Fair value at the closing date, which may fluctuate in subsequent periods.
6
NOTES TO THE CONSOLIDATED FINANCIAL STATEMENTS
2 I 6FF I N A N C I A L I N F O R M A T I O NN
S O C I E T E G E N E R AL E G R O U P I 2018 REGISTRATION DOCUMENT I 337
NOTE 3 - FINANCIAL INSTRUMENTS
MAKING
IT
SIMPLE
The financial instruments represent the contractual rights or obligations to receive or to pay cash or other financial assets. The Group’s banking activities generally take the form of financial instruments covering a broad spectrum of assets and liabilities, such as loans, investment portfolios (equity, bonds, etc.), deposits, regulated savings accounts, debt securities issued and derivative instruments (swaps, options, forward contracts, credit derivatives, etc.).
In the financial statements, classification and valuation of financial assets and liabilities depend on the nature of those assets and liabilities and the reasons for which they are held.
However, this distinction is not applicable to derivative instruments, which are always measured at fair value in the balance sheet, no matter what their purpose is (market activities or hedging transactions).
ACCOUNTING PRINCIPLES
CLASSIFICATION OF FINANCIAL INSTRUMENTS
When initially recognised, financial instruments are presented in the balance sheet under categories that determine their accounting treatment and their subsequent valuation method. This classification depends on the type of financial instrument and the purpose of the transaction.
Financial assets are classified into one of the following four categories:
Financial assets at fair value through profit or loss: these are financial assets held for trading purposes, which by default include derivative financial assets not qualifying as hedging instruments and non-derivative financial assets designated by the Group upon initial recognition to be carried at fair value through profit or loss in accordance with the fair value option;
Loans and receivables: these include non-derivative financial assets with fixed or determinable payments that are not quoted in an active market and are not held for trading purposes, not held for sale from the time they are originated or acquired, and not designated upon initial recognition to be carried at fair value through profit or loss (in accordance with the fair value option). They are measured at amortised cost, and impairment, determined on an individual or a collective basis, may be recorded if appropriate;
Held-to-maturity financial assets: these are non-derivative financial assets with fixed or determinable payments and a fixed maturity, that are quoted in an active market and which the Group has the intention and ability to hold to maturity. They are measured at their amortised cost and may be subject to impairment as appropriate. Amortised cost includes premiums and discounts as well as transaction costs;
Available-for-sale financial assets: these are non-derivative financial assets held for an indeterminate period, which the Group may sell at any time. By default, they are any assets that do not fall into one of the above three categories. These instruments are measured at fair value against Unrealised or deferred gains and losses. Interest accrued or paid on debt securities is recognised in the income statement using the effective interest rate method while dividend income earned on equity securities is recorded in the income statement under Net gains and losses on available-for-sale financial assets.
Financial liabilities are classified into one of the following two categories:
Financial liabilities at fair value through profit or loss: these are financial liabilities held for trading purposes, which by default include derivative financial liabilities not qualifying as hedging instruments and non-derivative financial liabilities designated by the Group upon initial recognition to be carried at fair value through profit or loss in accordance with the fair value option;
Debts: these include the other non-derivative financial liabilities and are measured at amortised cost.
Derivative financial assets and liabilities qualifying as hedging instruments are carried on separate lines of the balance sheet (see Note 3.2).
RECLASSIFICATION OF FINANCIAL ASSETS
After their initial recognition, financial assets may not later be reclassified as Financial assets at fair value through profit or loss.
A non-derivative financial asset, initially recognised as an asset held for trading purposes under Financial assets at fair value through profit or loss, may be reclassified out of this category when it meets the following conditions:
if a financial asset with fixed or determinable payments initially held for trading purposes can no longer, after acquisition, be quoted in an active market and the Group has the intention and ability to hold it for the foreseeable future or until maturity, then this financial asset may be reclassified as Loans and receivables, provided that the eligibility criteria for this category are met at the date of transfer;
if rare circumstances generate a change in the holding purpose of non-derivative financial assets initially held for trading, then these assets may be reclassified as Available-for-sale financial assets or as Held-to-maturity financial assets, provided that the eligibility criteria for the category in question are met at the date of transfer.

6 I 2
NOTES TO THE CONSOLIDATED FINANCIAL STATEMENTS FF I N A N C I A L I N F O R M A T I O NN
338 I 2018 REGISTRATION DOCUMENT I S O C I E T E G E N E R AL E G R O U P
In any case, financial derivatives and financial assets measured using the fair value option may not be reclassified out of Financial assets at fair value through profit or loss. A financial asset initially recognised under Available-for-sale financial assets may be reclassified to Held-to-maturity financial assets, provided that the eligibility criteria for this category are met. Furthermore, if a financial asset with fixed or determinable payments initially recognised under Available-for-sale financial assets can subsequently no longer be quoted in an active market and if the Group has the intention and ability to hold it for the foreseeable future or until maturity, then this financial asset may be reclassified to Loans and receivables provided that the eligibility criteria for this category are met at the date of transfer.
These reclassified financial assets are transferred to their new category at their fair value at the date of reclassification and are subsequently measured according to the rules that apply to the new category. The amortised cost of financial assets reclassified out of Financial assets at fair value through profit or loss or Available-for-sale financial assets to Loans and receivables and the amortised cost of financial assets reclassified out of Financial assets at fair value through profit or loss to Available-for-sale financial assets are determined on the basis of estimated future cash flows measured at the date of reclassification. The estimated future cash flows must be reviewed at each closing date. In the event of an increase in estimated future cash flows resulting from an increase in their recoverability, the effective interest rate is adjusted prospectively. However, if there is objective evidence that the financial asset has been impaired as a result of an event occurring after reclassification, and the loss event in question has a negative impact on the estimated future cash flows of the financial asset, the impairment of this financial asset is recognised under Cost of risk in the income statement.
FAIR VALUE
Fair value is the price that would be received upon sale of an asset or paid to transfer a liability in an orderly transaction between market participants at the measurement date. The valuation methods used by the Group to establish the fair value of financial instruments are detailed in Note 3.4.
INITIAL RECOGNITION
Purchases and sales of financial assets recorded under Financial assets at fair value through profit or loss, Held-to-maturity financial assets and Available-for-sale financial assets are recognised in the balance sheet at the delivery-settlement date. Changes in fair value between the trade and settlement dates are recorded in the income statement or booked to shareholders’ equity depending on the accounting category of the relevant financial assets. Loans and receivables are recorded in the balance sheet on the date they are paid or at the maturity date for invoiced services.
When initially recognised, financial assets and liabilities are measured at fair value including transaction costs directly attributable to their acquisition or their issuance, except for financial instruments recognised at fair value through profit or loss, for which these costs are booked directly to the income statement.
If the initial fair value is based on observable market data, any difference between the fair value and the transaction price, i.e. the sales margin, is immediately recognised in the income statement. However, if valuation inputs are not observable or if the valuation models are not recognised by the market, the initial fair value of the financial instrument is deemed to be the transaction price and the sales margin is then generally recognised in the income statement over the life of the instrument. For some instruments, due to their complexity, this margin is recognised at their maturity or in the event of early sale. When valuation inputs become observable, any portion of the sales margin that has not yet been recorded is recognised in the income statement at that time (see Note 3.4.7).
DERECOGNITION OF FINANCIAL ASSETS AND LIABILITIES
The Group derecognises all or part of a financial asset (or group of similar assets) when the contractual rights to the cash flows on the asset expire or when the Group has transferred the contractual rights to receive the cash flows and substantially all of the risks and rewards linked to ownership of the asset.
The Group also derecognises financial assets over which it has retained the contractual rights to the associated cash flows but is contractually obligated to pass these same cash flows through to a third party (“pass-through agreement”) and for which it has transferred substantially all the risks and rewards.
Where the Group has transferred the cash flows of a financial asset but has neither transferred nor retained substantially all the risks and rewards of its ownership and has effectively not retained control of the financial asset, the Group derecognises it and, where necessary, recognises a separate asset or liability to cover any rights and obligations created or retained as a result of the asset’s transfer. If the Group has retained control of the asset, it continues to recognise it in the balance sheet to the extent of its continuing involvement in that asset.
When a financial asset is derecognised in its entirety, a gain or loss on disposal is recorded in the income statement for an amount equal to the difference between the carrying value of the asset and the payment received for it, adjusted where necessary for any unrealised profit or loss previously recognised directly in equity and for the value of any servicing asset or servicing liability. Indemnities billed to borrowers following the prepayment of their loan are recorded in the income statement on the prepayment date among Interest and similar income.
The Group only derecognises all or part of a financial liability when it is extinguished, i.e. when the obligation specified in the contract is discharged, cancelled or expired.
A financial liability may also be derecognised in the event of a substantial amendment to its contractual conditions or where an exchange is made with the lender for an instrument whose contractual conditions are substantially different.

6
NOTES TO THE CONSOLIDATED FINANCIAL STATEMENTS
2 I 6FF I N A N C I A L I N F O R M A T I O NN
S O C I E T E G E N E R AL E G R O U P I 2018 REGISTRATION DOCUMENT I 339
IFRS 9
As from 1sst JJanuary 2018, the accounting classification of financial assets will depend on the contractual cash flow characteristics of the instrument and on the Group’s business model for managing them. By default, financial assets will be classified in Financial assets at fair value through profit or loss (see Note 1).
CHANGE IN THE PRESENTATION OF PREMIUMS RELATED TO OPTIONS
Conditional financial derivatives (options and assimilated instruments) purchased or sold by the Group include in some cases forward settled premiums. The amounts of premiums to be received and premiums to be paid were previously recognised in the balance sheet under Other assets and Other liabilities, separately from the items of the balance sheet in which fair value of purchased and sold conditional instruments were presented.
As those premiums are inseparable from the related derivative instruments, their presentation in the balance sheet has been modified to make the consolidated financial statements more understandable. The amount of premiums to be paid and premiums to be received are included in the book value of the related conditional derivatives instruments purchased or sold (under Financial assets and Financial liabilities at fair value through profit or loss). This change of presentation has no impact on the consolidated income statement.
CHANGE IN THE PRESENTATION OF SOME STRUCTURED BONDS ISSUED
Since 2013, structured debt instruments are no longer issued within the trading portfolio. Nevertheless, they remain measured at fair value through profit or loss because such designation allows the Group to either ensure consistency between their accounting treatment and that of the derivatives hedging the associated market risks, or measure at fair value hybrid instruments that contain one or more embedded derivatives that would otherwise be separated. Structured bonds issued that remained marginally accounted for among trading liabilities since that date are now presented with Financial liabilities measured using the fair value option through profit or loss, according to their business model.

6 I 2
NOTES TO THE CONSOLIDATED FINANCIAL STATEMENTS FF I N A N C I A L I N F O R M A T I O NN
340 I 2018 REGISTRATION DOCUMENT I S O C I E T E G E N E R AL E G R O U P
The impacts of those changes on comparative 2016 figures are as follows:
The information on the types of risks, the risk management linked to financial instruments as well as the information on capital management and compliance with regulatory ratios, required by IFRS as adopted by the European Union, are disclosed in Chapter 4 of the present Registration Document (Risks and capital adequacy).
31.12.2016 31.12.2016
Impacts related to
premium to be received / to be paid on
options
Impacts related to
structured bonds issued (In EUR m)
Before After
CONSOLIDATED BALANCE SHEET -- AASSETS 1,382,241 1,354,422 (27,819) --
Financial assets at fair value through profit or loss 514,715 500,215 (14,500) -
Trading portfolio 450,593 436,093 (14,500) -
Trading derivatives 182,504 168,004 (14,500) -
Other assets 84,756 71,437 (13,319) -
CONSOLIDATED BALANCE SHEET -- LLIABILITIES 1,382,241 1,354,422 ((27,819) --
Financial liabilities at fair value through profit or loss 455,620 440,120 (15,500) -
Trading portfolio 389,508 357,694 (15,500) (16,314)
Debt securities issued 16,314 - - (16,314)
Trading derivatives 188,638 173,138 (15,500) -
Financial instruments measured using the fair value option through profit or loss
66,112 82,426 - 16,314
Other liabilities 94,212 81,893 (12,319) -
CONSOLIDATED INCOME STATEMENT
Net gains and losses on financial transactions 7,143 7,143 - -
Net gain/loss on trading portfolio (2,276) (1,161) - 1,115
Net gain/loss on financial instruments measured using fair value option
16 (1,099) - (1,115)
ASSETS

6
NOTES TO THE CONSOLIDATED FINANCIAL STATEMENTS
2 I 6FF I N A N C I A L I N F O R M A T I O NN
S O C I E T E G E N E R AL E G R O U P I 2018 REGISTRATION DOCUMENT I 341
NOTE 3.1 - FINANCIAL ASSETS AND LIABILITIES AT FAIR VALUE THROUGH PROFIT OR LOSS
31.12.2017 31.12.2016
(In EUR m) Assets Liabilities Assets Liabilities
Trading portfolio* 342,616 288,689 436,093 357,694
Financial instruments measured using the fair value option through profit or loss*
77,064 80,016 64,122 82,426
Total 419,680 368,705 500,215 440,120
o.w. securities purchased/sold under resale/repurchase agreements 101,414 105,737 152,803 126,436
* Amounts restated compared to the 31st December 2016 consolidated financial statements, following a change in the balance sheet presentation of premiums to be received / to be paid on options and structured bonds issued (see Note 3).
1. TRADING PORTFOLIO AT FAIR VALUE THROUGH PROFIT OR LOSS
ACCOUNTING PRINCIPLES
The trading portfolio contains financial assets and liabilities which, upon initial recognition, are:
acquired or incurred with the intention of selling or repurchasing them in the short term; or
held for market-making purposes; or
acquired or incurred for the purposes of the specialised management of a trading portfolio including derivative financial instruments, securities or other financial instruments that are managed together and for which there is evidence of a recent pattern of short-term profit-taking.
This portfolio also includes, among Other trading assets, physical commodities that are held by the Group as part of its market-maker activity on commodity derivative instruments.
By default, derivative financial instruments are classified into the trading portfolio, unless they qualify as hedging instruments (see Note 3.2).
The financial instruments recorded in the trading portfolio are measured at fair value at the balance sheet date and recognised in the balance sheet under Financial assets or liabilities at fair value through profit or loss. Changes in their fair value are recorded in the income statement as Net gains and losses on financial instruments at fair value through profit or loss.
ASSETS
(In EUR m) 31.12.2017 31.12.2016
Bonds and other debt securities 26,933 41,430
Shares and other equity securities 80,097 69,549
Trading derivatives* 134,450 168,004
Other trading assets 101,136 157,110
Total 342,616 436,093
o.w. securities lent 15,807 13,332
* Amounts restated compared to the 31st December 2016 consolidated financial statements, following a change in the balance sheet presentation of premiums to be received / to be paid on options (see Note 3).

6 I 2
NOTES TO THE CONSOLIDATED FINANCIAL STATEMENTS FF I N A N C I A L I N F O R M A T I O NN
342 I 2018 REGISTRATION DOCUMENT I S O C I E T E G E N E R AL E G R O U P
LLIABILITIES
(In EUR m) 31.12.2017 31.12.2016
Debt securities issued* - -
Amounts payable on borrowed securities 34,844 44,655
Bonds and other debt instruments sold short 5,416 11,592
Shares and other equity instruments sold short 1,002 1,958
Trading derivatives* 142,524 173,138
Other trading liabilities 104,903 126,351
Total 288,689 357,694
* Amounts restated compared to the 31st December 2016 consolidated financial statements, following a change in the balance sheet presentation of premiums to be received / to be paid on options and structured bonds issued (see Note 3).
2. FINANCIAL INSTRUMENTS AT FAIR VALUE THROUGH PROFIT OR LOSS USING FAIR VALUE OPTION
ACCOUNTING PRINCIPLES
Financial assets and liabilities at fair value through profit or loss also include non-derivative financial assets and liabilities designated by the Group upon initial recognition to be carried at fair value through profit or loss in accordance with the fair value option. Changes in the fair value of these items are recognised through profit or loss under Net gains and losses on financial instruments at fair value through profit or loss.
This option is only applied in the following cases:
when it eliminates or significantly reduces discrepancies in the accounting treatment of certain financial assets and liabilities;
when it applies to a hybrid instrument containing one or more embedded derivatives that would otherwise be subject to a separate recognition;
when a group of financial assets and/or liabilities is managed and its performance is measured on a fair value basis.
The Group thus recognises some structured bonds issued by Societe Generale Corporate and Investment Banking at fair value through profit or loss. These issues are purely commercial and the associated risks are hedged on the market using financial instruments managed in trading portfolios. By using the fair value option, the Group can ensure consistency between the accounting treatment of these bonds and that of the derivatives hedging the associated market risks, which have to be carried at fair value.
The Group also recognises the financial assets held to guarantee the unit-linked policies of its life insurance subsidiaries at fair value through profit or loss to ensure that their accounting treatment matches that of the corresponding insurance liabilities. Under IFRS 4, insurance liabilities must be recognised according to local accounting principles. Revaluations of underwriting reserves on unit-linked policies, which are directly linked to revaluations of the financial assets underlying their policies, are therefore recognised in the income statement. The fair value option thus allows the Group to record changes in the fair value of the financial assets through profit or loss so that they match fluctuations in value of the insurance liabilities associated with these unit-linked policies.
Furthermore, in order to simplify their accounting treatment by avoiding the separate recognition of embedded derivatives, the Group applies the fair value option to convertible bonds that are not held for trading purposes.
IFRS 9
As from 11st January 2018, changes in value attributable to the Group’s own credit risk will cease to be recognised in profit or loss. They will be directly recorded in unrealised or deferred gains and losses (OCI) without subsequent reclassification into income (see Note 1).
ASSETS
LIABILITIES

6
LIABILITIES
NOTES TO THE CONSOLIDATED FINANCIAL STATEMENTS
2 I 6FF I N A N C I A L I N F O R M A T I O NN
S O C I E T E G E N E R AL E G R O U P I 2018 REGISTRATION DOCUMENT I 343
AASSETS
(In EUR m) 31.12.2017 31.12.2016
Bonds and other debt securities 26,707 23,238
Shares and other equity securities 28,019 18,921
Customer loans 20,419 19,604
Other financial assets 1,377 1,803
Separate assets for employee benefit plans 542 556
Total 77,064 64,122
LIABILITIES
Financial liabilities measured at fair value through profit or loss in accordance with the fair value option predominantly consist of structured bonds issued by the Societe Generale Group. The change in fair value attributable to the Group’s own credit risk generated an expense of EUR 53 million at 31st December 2017. The revaluation differences attributable to the Group’s issuer credit risk are determined using valuation models taking into account the Societe Generale Group’s actual financing terms and conditions on the markets and the residual maturity of the related liabilities.
At 31st December 2017, the difference between fair value of financial liabilities measured using the fair value option through profit or loss (EUR 80,016 million versus EUR 82,426* million at 31st December 2016) and the amount repayable at maturity (EUR 79,597 million versus EUR 82,046* million at 31st December 2016) was EUR 419 million (EUR 380* million at 31st December 2016).
* Amounts restated compared to the 31st December 2016 consolidated financial statements, following a change in the balance sheet presentation of structured bonds issued (see Note 3).
3. NET GAINS AND LOSSES ON FINANCIAL INSTRUMENTS AT FAIR VALUE THROUGH PROFIT OR LOSS
(In EUR m) 2017 2016
Net gain/loss on trading portfolio* 10,440 (1,161)
Net gain/loss on financial instruments measured using fair value option* (5,131) (1,099)
Net gain/loss on derivative instruments** (1,272) 8,119
Net gain/loss on hedging transactions 0 (175)
Net gain/loss on fair value hedging derivatives** (2,746) 736
Revaluation of hedged items attributable to hedged risks 2,746 (911)
Net gain/loss on foreign exchange transactions 1,076 75
Total((1) 5,113 5,759
* Amounts restated compared to the 31st December 2016 consolidated financial statements, following a change in the balance sheet presentation of structured bonds issued (see Note 3).
** Amounts restated relative to the financial statements published at 31st December 2016. (1) Insofar as income and expenses recorded in the income statement are classified by type of instrument rather than by purpose, the net income
generated by activities in financial instruments at fair value through profit or loss must be assessed as a whole. It should be noted that the income shown here does not include the refinancing cost of these financial instruments, which is shown under interest expense and interest income.

6 I 2
NOTES TO THE CONSOLIDATED FINANCIAL STATEMENTS F I N A N C I A L I N F O R M A T I O N
344 I 2018 REGISTRATION DOCUMENT I S O C I E T E G E N E R AL E G R O U P
NOTE 3.2 - FINANCIAL DERIVATIVES
MAKING IT
SIMPLE
Derivative instruments are financial instruments for which the value changes according to that of an underlying item and can be accompanied by a leverage effect. The items underlying these instruments are various (interest rates, exchange rates, equity, indexes, commodities, credit rating, etc.), as are their forms (forward contracts, swaps, calls and puts, etc.).
The Group may use these derivative instruments for their market activities to provide its customers with solutions to meet their risk management or revenue optimisation needs. In that case, they are accounted for as trading derivatives.
The Group may also use derivative instruments to manage and hedge its own risks. In that case, they are qualified as hedging derivatives. Hedging transactions can concern individual items or transactions (micro-hedging relationships) or portfolios of financial assets and liabilities that can generate a structural interest-rate risk (macro-hedging relationships).
Contrary to other financial instruments, derivative instruments are always measured at fair value in the balance sheet, regardless of their purpose (market activities or hedging transactions). The fair value adjustments of trading derivatives are directly recognised in the income statement. However, the accounting method used on hedging transactions aims to neutralise in the income statement the effects of the revaluation of hedging derivatives, as long as the hedge is effective.
ACCOUNTING PRINCIPLES
Derivatives are financial instruments meeting the following three criteria:
their value changes in response to the change in a specified interest rate, foreign exchange rate, share price, index of prices, commodity price, credit rating, etc.;
they require little to no initial investment;
they are settled at a future date.
All financial derivatives are recognised at fair value in the balance sheet as financial assets or financial liabilities. They are considered to be trading derivatives by default, unless they are designated as hedging instruments for accounting purposes.
SPECIAL CASE - FINANCIAL DERIVATIVES HAVING SOCIETE GENERALE SHARES AS THEIR UNDERLYING INSTRUMENT
Financial derivatives having Societe Generale shares as their underlying instrument or shares in Group subsidiaries and whose liquidation entails the payment of a fixed amount in cash (or another financial asset) against a fixed number of Societe Generale shares (other than derivatives) are equity instruments. These instruments, and any related premiums paid or received, are recognised directly in equity, and any changes in the fair value of these derivatives are not recorded. For sales of put options on Societe Generale shares, a debt is recognised for the present value of the strike price as a contra-entry of the equity.
Other financial derivatives having Societe Generale shares as their underlying instrument are recorded in the balance sheet at fair value in the same manner as derivatives with other underlying instruments.
EMBEDDED DERIVATIVES
An embedded derivative is a component of a hybrid instrument. If this hybrid instrument is not measured at fair value through profit or loss, the Group separates the embedded derivative from its host contract if, at the inception of the transaction, the economic characteristics and risks of the derivative are not closely related to the economic characteristics and risk profile of the host contract and it would separately meet the definition of a derivative. Once separated, the derivative is recognised at its fair value in the balance sheet under Financial assets or liabilities at fair value through profit or loss and accounted for as above. The host contract is classified and measured according to its accounting category.
1. TRADING DERIVATIVES
ACCOUNTING PRINCIPLES
Trading derivatives are recorded in the balance sheet under Financial assets or liabilities at fair value through profit or loss. Changes in fair value are recorded in the income statement under Net gains and losses on financial instruments at fair value through profit or loss.
Changes in the fair value of financial derivatives involving counterparties which subsequently went into default are recorded under Net gains and losses on financial instruments at fair value through profit or loss until the termination date of these instruments. At this termination date, receivables and debts on these counterparties are recognised at fair value in the balance sheet. Any further impairment of these receivables is recognised under Cost of risk in the income statement.

6
NOTES TO THE CONSOLIDATED FINANCIAL STATEMENTS
2 I 6FF I N A N C I A L I N F O R M A T I O NN
S O C I E T E G E N E R AL E G R O U P I 2018 REGISTRATION DOCUMENT I 345
BBREAKDOWN OF TRADING DDERIVATIVES
31.12.2017 31.12.2016
(In EUR m) Assets Liabilities Assets Liabilities
Interest rate instruments* 89,652 92,250 116,636 115,973
Foreign exchange instruments* 16,568 17,810 22,117 22,951
Equity and index instruments* 19,959 22,781 18,801 22,854
Commodity instruments* 5,948 6,070 6,359 6,267
Credit derivatives 2,245 2,588 3,902 4,179
Other forward financial instruments 78 1,025 189 914
Total 134,450 142,524 168,004 173,138
* Amounts restated compared to the 31st December 2016 consolidated financial statements, following a change in the balance sheet presentation of premiums to be received / to be paid on options (see Note 3).
The Group uses credit derivatives in the management of its Corporate credit portfolio, primarily to reduce individual, sector and geographic concentration and to implement a proactive risk and capital management approach. All credit derivatives,
regardless of their purpose, are measured at fair value through profit or loss and cannot be qualified as hedging instruments for accounting purposes. Accordingly, they are recognised at fair value among trading derivatives.
2. HEDGING DERIVATIVES
ACCOUNTING PRINCIPLES
In order to be hedged against certain market risks, the Group sets up hedging derivatives. From an accounting standpoint, the Group designates the hedging transaction as a fair value hedge, a cash flow hedge, or a hedge of a net investment in a foreign operation, depending on the risk and on the instruments that are hedged.
To designate an instrument as a hedging derivative, the Group must document the hedging relationship in detail, from the inception of the hedge. This documentation specifies the asset, liability, or future transaction hedged, the risk to be hedged and the associated risk management strategy, the type of financial derivative used and the valuation method that will be used to measure its effectiveness.
A derivative designated as a hedging instrument must be highly effective in offsetting the change in fair value or cash flows arising from the hedged risk. This effectiveness is verified when changes in the fair value or cash flows of the hedged instrument are almost entirely offset by changes in the fair value or cash flows of the hedging instrument, with the expected ratio between the two changes ranging from 80% to 125%. Effectiveness shall be assessed both when the hedge is first set up and throughout its life. Effectiveness is measured each quarter prospectively (expected effectiveness over the future periods) and retrospectively (effectiveness measured on past periods). Where the effectiveness falls outside the range specified above, hedge accounting is discontinued.
Hedging derivatives are recognised in the balance sheet under Hedging derivatives.
FAIR VALUE HEDGES
The purpose of these hedges is to protect the Group against an adverse fluctuation in the fair value of an instrument which could affect profit or loss if the instrument were derecognised from the balance sheet.
Changes in the fair value of the hedging derivative are recorded in the income statement under Net gains and losses on financial instruments at fair value through profit or loss; for interest rate derivatives, however, accrued interest income and expenses on the derivative are recorded in the income statement under Interest income and expense – Hedging derivatives at the same time as accrued interest income and expenses related to the hedged item.
In the balance sheet, the carrying value of the hedged item is adjusted for gains and losses attributable to the hedged risk, which are reported in the income statement under Net gains and losses on financial instruments at fair value through profit or loss. To the extent that the hedge is highly effective, changes in the fair value of the hedged item and changes in the fair value of the hedging derivative are accurately offset through profit or loss, the difference corresponding to an ineffectiveness gain or loss.

6 I 2
NOTES TO THE CONSOLIDATED FINANCIAL STATEMENTS FF I N A N C I A L I N F O R M A T I O NN
346 I 2018 REGISTRATION DOCUMENT I S O C I E T E G E N E R AL E G R O U P
Prospective effectiveness is assessed via a sensitivity analysis based on probable market trends or via a regression analysis of the statistical relationship (correlation) between certain components of the hedged item and the hedging instrument. Retrospective effectiveness is assessed by comparing any changes in the fair value of the hedging instrument with any changes in the fair value of the hedged item.
If it becomes apparent that the derivative has ceased to meet the effectiveness criteria for hedge accounting or if it is terminated or sold, hedge accounting is discontinued prospectively. Thereafter, the carrying amount of the hedged asset or liability ceases to be adjusted for changes in fair value attributable to the hedged risk and the cumulative adjustments previously recognised under hedge accounting are amortised over its remaining life. Hedge accounting is also discontinued if the hedged item is sold prior to maturity or redeemed early.
CASH FLOW HEDGES
The purpose of interest rate cash flow hedges is to protect against changes in future cash flows associated with a financial instrument on the balance sheet (loans, securities or floating-rate notes) or with a highly probable future transaction (future fixed rates, future prices, etc.). The purpose of these hedges is to protect the Group against adverse fluctuations in the future cash-flows of an instrument or transaction that could affect profit or loss.
The effective portion of changes in the fair value of hedging derivatives is booked to Unrealised or deferred gains and losses, while the ineffective portion is recognised in the income statement under Net gains and losses on financial instruments at fair value through profit or loss. For interest rate derivatives, accrued interest income and expenses on the derivative are recorded in the income statement under Interest income and expense – Hedging derivatives at the same time as accrued interest income and expenses related to the hedged item.
The effectiveness of the hedge is assessed using the hypothetical derivative method, which consists in i) creating a hypothetical derivative bearing exactly the same characteristics as the instrument being hedged (in notional terms, in terms of the date on which the rates are reset, in terms of the rates themselves, etc.), but which moves in the opposite direction and whose fair value is nil when the hedge is set up, then ii) comparing the expected changes in the fair value of the hypothetical derivative with those of the hedging instrument (sensitivity analysis) or performing a regression analysis on the prospective effectiveness of the hedge. Here, only any “over-hedging” is deemed ineffective.
Amounts directly recognised in equity in respect of the revaluation of cash flow hedging derivatives are subsequently reclassified to Interest income and expense in the income statement at the same time as the cash flows being hedged.
Whenever the hedging derivative ceases to meet the effectiveness criteria for hedge accounting or is terminated or sold, hedge accounting is discontinued prospectively. Amounts previously recognised directly in equity are reclassified under Interest income and expense in the income statement over the periods during which interest income is affected by cash flows arising from the hedged item. If the hedged item is sold or redeemed earlier than expected or if the hedged forecast transaction ceases to be highly probable, unrealised gains and losses recognised in equity are immediately reclassified in the income statement.
HEDGING OF A NET INVESTMENT IN A FOREIGN OPERATION
The purpose of a hedge of a net investment in a foreign company is to protect against exchange rate risk.
The hedged item is an investment in a country whose currency differs from the Group’s functional currency. The hedge therefore serves to protect the net position of a foreign subsidiary or branch against an exchange rate risk linked to the entity’s functional currency.
The effective portion of the changes in the fair value of a hedging derivative designated for accounting purposes as a hedge of a net investment is recognised in equity under Unrealised or deferred gains and losses, while the ineffective portion is recognised in the income statement.
MACRO-FAIR VALUE HEDGES
In this type of hedge, interest rate derivatives are used to globally hedge against structural interest rate risks usually arising from Retail Banking activities. When accounting for these transactions, the Group applies the IAS 39 “carve-out” standard as adopted by the European Union, which facilitates:
the application of fair value hedge accounting to macro-hedges used for asset-liability management, including customer demand deposits in the fixed-rate positions being hedged;
the performance of effectiveness tests required by IAS 39 as adopted by the European Union.
The accounting treatment of financial derivatives designated as macro-fair value hedges is similar to that of other fair value hedging instruments. Changes in the fair value of the portfolio of macro-hedged instruments are reported on a separate line in the balance sheet under Revaluation differences on portfolios hedged against interest rate risk through profit or loss.

6
NOTES TO THE CONSOLIDATED FINANCIAL STATEMENTS
2 I 6FF I N A N C I A L I N F O R M A T I O NN
S O C I E T E G E N E R AL E G R O U P I 2018 REGISTRATION DOCUMENT I 347
BREAKDOWN OF HEDGING DERIVATIVES
31.12.2017 31.12.2016
(In EUR m) Assets Liabilities Assets Liabilities
Fair value hedge
Interest rate instruments 12,906 6,578 17,365 9,289
Foreign exchange instruments 53 4 45 4
Equity and index instruments - - 1 -
Cash flow hedge
Interest rate instruments 469 103 584 121
Foreign exchange instruments 204 61 72 179
Other financial instruments 9 4 33 1
Total 13,641 6,750 18,100 9,594
The Group sets up hedging relationships recognised for accounting purposes as fair value hedges in order to protect its fixed-rate financial assets and liabilities (primarily loans/borrowings, securities issued and fixed-rate securities) against changes in long-term interest rates. The hedging instruments used mainly consist of interest rate swaps. Through some of its Corporate and Investment Banking operations, the Group is exposed to future cash flow changes in its short and medium-term funding requirements, and sets up
hedging relationships recognised for accounting purposes as cash flow hedges. Highly probable funding requirements are determined using historic data established for each activity and representative of balance sheet outstandings. These data may be increased or decreased with changes in management methods.
The following tables specify the amount of cash flow that is subject to a cash flow hedge relationship (broken down by expected due date) and the amount of highly probable hedged forecast transactions.
(In EUR m) Up to 3 months
From 3 months to 1 year
From 1 year to 5 years Over 5 years
31.12.2017
Floating cash flows hedged (rates, etc.) 131 341 573 4,358 5,403
Highly probable forecast transaction - 5 3 - 8
Other (Forex, etc.) 3 1 - - 4
Total fflows covered by CCash Flow Hedge
134 347 576 4,358 5,415
(In EUR m) Up to 3 months From 3 months
to 1 year From 1 year to
5 years Over 5 years 31.12.2016
Floating cash flows hedged (rates, etc.)
174 505 862 5,270 6,811
Highly probable forecast transaction 44 95 115 109 363
Other (Forex, etc.) 13 - 3 - 16
Total flows covered by Cash FFlow Hedge
231 600 980 5,379 7,190

6 I 2
NOTES TO THE CONSOLIDATED FINANCIAL STATEMENTS FF I N A N C I A L I N F O R M A T I O NN
348 I 2018 REGISTRATION DOCUMENT I S O C I E T E G E N E R AL E G R O U P
3. FORWARD FINANCIAL INSTRUMENT COMMITMENTS (NOTIONAL AMOUNTS)
31.12.2017 31.12.2016
(In EUR m) Trading Hedging Trading Hedging
Interest rate iinstruments
Firm instruments
Swaps 7,973,157 428,089 7,659,277 425,723
FRAs 2,054,971 294 1,643,107 372
Options 2,182,837 1,622 2,508,569 2,238
Foreign exchange instruments
Firm instruments 2,455,220 12,483 2,406,365 12,713
Options 806,307 - 899,930 -
Equity and index instruments
Firm instruments 135,363 - 81,292 -
Options 778,215 - 1,803,498 -
Commodity instruments
Firm instruments 149,532 - 151,588 -
Options 39,671 - 49,075 -
Credit derivatives 312,198 - 485,505 -
Other forward financial instruments 35,303 148 32,041 226
Total 16,922,774 442,636 17,720,247 441,272
4. MATURITIES OF FINANCIAL DERIVATIVES (NOTIONAL AMOUNTS)
These items are presented according to the contractual maturity of the financial instruments.
(In EUR m) Up to 3 months From 3 months
to 1 year From 1 year to
5 years Over 5 years 31.12.2017
Interest rate instruments 1,283,214 3,273,839 4,540,585 3,543,332 12,640,970
Foreign exchange instruments 1,639,107 814,533 571,829 248,541 3,274,010
Equity and index instruments 265,014 230,712 169,535 248,317 913,578
Commodity instruments 101,772 43,062 16,588 27,781 189,203
Credit derivatives 18,210 61,724 211,461 20,803 312,198
Other forward financial instruments 5,085 13,944 16,288 134 35,451
Total 3,312,402 4,437,814 5,526,286 4,088,906 17,365,410

6
NOTES TO THE CONSOLIDATED FINANCIAL STATEMENTS
2 I 6FF I N A N C I A L I N F O R M A T I O NN
S O C I E T E G E N E R AL E G R O U P I 2018 REGISTRATION DOCUMENT I 349
NOTE 3.3 - AVAILABLE-FOR-SALE FINANCIAL ASSETS
ACCOUNTING PRINCIPLES
Available-for-sale financial assets are non-derivative financial assets held for an indeterminate period which the Group may sell at any time. By default, they are any financial assets that are not classified under Loans and receivables, Financial assets at fair value through profit or loss, or Held-to-maturity financial assets.
Interest accrued or paid on fixed-income securities is recognised in the income statement using the effective interest rate method under Interest and similar income – Transactions in financial instruments. Dividend income earned on these securities is recorded in the income statement under Net gains and losses on available-for-sale financial assets.
At the balance sheet date, available-for-sale financial assets are measured at fair value, and any changes in fair value, excluding income, are booked to Unrealised or deferred capital gains and losses, except for foreign exchange losses or gains on foreign-currency monetary assets, which are taken to the income statement.
If these financial assets are sold, the unrealised gains and losses booked to equity are reclassified as Net gains and losses on available-for-sale financial assets.
If, at the balance sheet date, there is objective evidence of impairment of an available-for-sale financial asset arising from one or more events subsequent to its initial recognition, the unrealised loss previously accumulated in equity is reclassified under Cost of risk for debt instruments and under Net gains and losses on available-for-sale financial assets for equity instruments. The impairment rules applied by the Group are described in Note 3.8.
1. AVAILABLE-FOR-SALE FINANCIAL ASSETS
31.12.2017 31.12.2016
(In EUR m) Net o.w. allowances for impairment
Net o.w. allowances for impairment
Debt instruments 124,632 (105) 124,747 (257)
Equity instruments(1) 13,447 (469) 12,447 (567)
Long-term equity investments 1,919 (420) 2,210 (518)
Total 139,998 (9944) 139,404 (1,342) o.w. securities lent 509 - 2 -
(1) Including UCITS.
CHANGES IN AVAILABLE-FOR-SALE FINANCIAL ASSETS
(In EUR m) 2017
Balance at 11st January 2017 139,404
Acquisitions 42,899
Disposals / redemptions(1) (47,533)
Change in scope and others 9,265
Gains and losses on changes in fair value recognised directly in equity during the period (1,013)
Change in impairment on debt instruments recognised in P&L: 152
increase (48)
write-backs 205
others (5)
Impairment losses on equity instruments recognised in P&L (118)
Change in related receivables 64
Translation differences (3,122)
Balance at 31sst DDecember 2017 139,998
(1) Disposals are valued according to the weighted average cost method.

6 I 2
NOTES TO THE CONSOLIDATED FINANCIAL STATEMENTS FF I N A N C I A L I N F O R M A T I O NN
350 I 2018 REGISTRATION DOCUMENT I S O C I E T E G E N E R AL E G R O U P
2. NET GAINS AND LOSSES AND INTEREST INCOME ON AVAILABLE-FOR-SALE FINANCIAL ASSETS
(In EUR m) 2017 2016
Dividend income 503 460
Gains and losses on sale of debt instruments(1) 86 182
Gains and losses on sale of equity instruments(2) 160 (54)
Impairment losses on equity instruments(3) (58) (254)
Profit-sharing on available-for-sale financial assets of insurance companies (44) 315
Gains and losses on sale of long-term equity investments(4) (5) 126 766
Impairment losses on long-term equity investments (60) (31)
Total net gains and losses on available--for--sale assets 713 1,384
Interest income oon available-ffor-ssale assets 2,424 2,496
(1) o.w. EUR -51 million for Insurance activities in 2017. (2) o.w. EUR 159 million for Insurance activities in 2017. (3) o.w. EUR -55 million for Insurance activities in 2017. (4) o.w. EUR 8 million for Insurance activities in 2017. (5) Sale of Visa Europe shares generated a profit in the income statement under Net gains and losses on available-for-sale financial assets in 2016 by EUR
725 million.
3. BREAKDOWN OF UNREALISED GAINS AND LOSSES RECOGNISED DIRECTLY IN EQUITY
31.12.2017
(In EUR m) Unrealised
gains Unrealised
losses Net
revaluation
Unrealised gains and losses on available-for-sale equity instruments 467 (18) 449
Unrealised gains and losses on available-for-sale debt instruments 728 (270) 458
Unrealised gains and losses of insurance companies 438 (27) 411
Total 1,633 (315) 1,318
31.12.2016
(In EUR m) Unrealised gains
Unrealised losses
Net revaluation
Unrealised gains and losses on available-for-sale equity instruments 586 (40) 546
Unrealised gains and losses on available-for-sale debt instruments 867 (377) 490
Unrealised gains and losses of insurance companies 698 (198) 500
Total 2,151 (615) 1,536

6
NOTES TO THE CONSOLIDATED FINANCIAL STATEMENTS
2 I 6FF II N A N C I A L I N F O R M A T I O N
S O C I E T E G E N E R AL E G R O U P I 2018 REGISTRATION DOCUMENT I 351
NOTE 3.4 - FAIR VALUE OF FINANCIAL INSTRUMENTS MEASURED AT FAIR VALUE
MAKING IT
SIMPLE
The financial assets and liabilities recognised in the Group balance sheet are measured either at fair value or at amortised cost. In the latter case, the fair value of the instruments is disclosed in the notes (see Note 3.9).
If an instrument is quoted on an active market, its fair value is equal to its market price.
But many financial instruments are not listed (for example, most customer loans and deposits, interbank debts and claims, etc.), or are only negotiable on illiquid markets or over-the-counter markets (which is the case for many derivative instruments).
In such situations, the fair value of the instruments is calculated using measurement techniques or valuation models. Market parameters are included in these models and must be observable; otherwise they are determined based on internal estimates. The models and parameters used are subject to independent validations and internal controls.
ACCOUNTING PRINCIPLES
DEFINITION OF FAIR VALUE
Fair value is the price that would be received upon sale of an asset or paid to transfer a liability in an orderly transaction between market participants at the measurement date.
In the absence of observable prices for identical assets or liabilities, the fair value of financial instruments is determined using another measurement technique that maximises the use of observable market input based on assumptions that market operators would use to set the price of the instrument in question.
FAIR VALUE HIERARCHY
For information purposes, in the notes to the consolidated financial statements, the fair value of financial instruments is classified using a fair value hierarchy that reflects the observability level of the inputs used. The fair value hierarchy is composed of the following levels:
Level 1 (L1): instruments valued on the basis of quoted prices (unadjusted) in active markets for identical assets or liabilitties.
Level 1 instruments carried at fair value on the balance sheet include in particular shares listed in an active market, government or corporate bonds priced directly by external brokers/dealers, derivatives traded on organised markets (futures, options), and units of funds (including UCITS) whose net asset value is available on the balance sheet date.
A financial instrument is regarded as quoted in an active market if quoted prices are readily and regularly available from an exchange, dealer, broker, industry group, pricing service or regulatory agency, and they reflect actual and regular market transactions on an arm’s length basis.
Determining whether a market is inactive requires the use of indicators such as a sharp decline in trading volume and the level of activity in the market, a sharp disparity in prices over time and among the various abovementioned market participants, or the fact that the latest transactions conducted on an arm’s length basis did not take place recently enough.
Where a financial instrument is traded in several markets to which the Group has immediate access, its fair value is represented by the market price at which volumes and activity levels are highest for the instrument in question.
Transactions resulting from involuntary liquidations or distressed sales are usually not taken into account to determine the market price.
Level 2 (L2): instruments valued using inputs other than quoted prices included in Level 1 that are observable for the asset oor liability, either directly (i.e. as prices) or indirectly (i.e. derived from pricees).
Instruments quoted in an insufficiently liquid market and those traded over-the-counter belong to this level. Prices published by an external source derived from the valuation of similar instruments are considered as data derived from prices.
Level 2 instruments include in particular securities carried at fair value on the balance sheet that are not directly quoted (e.g. corporate bonds, mortgage-backed securities, units of funds), and firm derivatives and options traded over-the-counter: interest rate swaps, caps, floors, swaptions, equity options, index options, foreign exchange options, commodity options and credit derivatives. The maturities of these instruments are linked to ranges of terms commonly traded in the market, and the instruments themselves can be simple or offer a more complex remuneration profile (e.g. barrier options, products with multiple underlying instruments), with said complexity remaining limited however. The valuation techniques used in this category are based on common methods shared by the main market participants.
This category also includes the fair value of loans and receivables at amortised cost granted to counterparties whose credit risk is quoted via Credit Default Swap (see Note 3.9).

6 I 2
NOTES TO THE CONSOLIDATED FINANCIAL STATEMENTS FF I N A N C I A L I N F O R M A T I O NN
352 I 2018 REGISTRATION DOCUMENT I S O C I E T E G E N E R AL E G R O U P
Level 3 (L3): instruments valued using inputs that are not based on observable market data (referred to as unobservable inputs).
Level 3 instruments carried at fair value on the balance sheet are valued based on financial models with unobservable market inputs or observable inputs that are not quoted on active markets. For the Group, those instruments match with the instruments for which the sales margin is not immediately recognised in profit or loss (see Note 3.4.7).
Accordingly, Level 3 financial instruments include derivatives with longer maturities than those usually traded and/or with specifically-tailored return profiles, structured debts including embedded derivatives valued based on a method using unobservable inputs or long-term equity investments valued based on a corporate valuation method, which is the case for unlisted companies or companies listed on an insufficiently liquid market.
The main L3 complex derivatives are:
Equity derivatives: options with long maturities and/or incorporating bespoke remuneration mechanisms. These instruments are sensitive to market inputs (volatility, dividend rates, correlations, etc.). In the absence of market depth and an objective approach made possible by regularly observed prices, their valuation is based on proprietary methods (e.g. extrapolation from observable data, historical analysis). Hybrid equity instruments (i.e. having at least one non-equity underlying instrument) are also classified as L3 insofar as correlations between the different underlyings are generally unobservable;
Interest rate derivatives: long-term and/or exotic options, products sensitive to correlation between different interest rates, different exchange rates, between interest rates and exchange rates or, for quanto products for example (in which the instrument is settled in a currency different from the currency of the underlying); they are liable to be classified as L3 because the valuation inputs are unobservable due to the liquidity of the correlated pair and the residual maturity of the transactions (e.g. exchange rate correlations are deemed unobservable for the USD/JPY);
Credit derivatives: L3 credit derivatives mainly include baskets of instruments exposed to time to default correlation (“N to default” products in which the buyer of the hedge is compensated as of the Nth default, which are exposed to the credit quality of the issuers comprising the basket and to their correlation, or CDO Bespoke products, which are Collateralised Debt Obligations created specifically for a group of investors and structured according to their needs), as well as products subject to credit spread volatility;
Commodity derivatives: this category includes products involving unobservable volatility or correlation inputs (i.e. options on commodity swaps or instruments based on baskets of underlyings).

6
NOTES TO THE CONSOLIDATED FINANCIAL STATEMENTS
2 I 6FF I N A N C I A L I N F O R M A T I O NN
S O C I E T E G E N E R AL E G R O U P I 2018 REGISTRATION DOCUMENT I 353
1. FINANCIAL ASSETS MEASURED AT FAIR VALUE
31.12.2017 31.12.2016
(In EUR m) Level 1 Level 2 Level 3 Total Level 1 Level 2 Level 3 Total
Trading portfolio 96,178 111,818 170 208,166 104,225 163,469 395 268,089
Bonds and other debt securities 24,143 2,621 169 26,933 38,161 3,253 16 41,430
Shares and other equity securities 72,035 8,061 1 80,097 65,790 3,758 1 69,549
Other trading assets(1) - 101,136 - 101,136 274 156,458 378 157,110
Financial assets measured using fair value ooption through profit or loss
50,667 24,460 1,937 77,064 39,621 23,282 1,219 64,122
Bonds and other debt securities 26,324 346 37 26,707 22,926 224 88 23,238
Shares and other equity securities 24,343 3,633 43 28,019 16,695 2,153 73 18,921
Other financial assets - 19,939 1,857 21,796 - 20,349 1,058 21,407
Separate assets for employee benefit plans - 542 - 542 - 556 - 556
Trading dderivatives* 38 131,829 2,583 134,450 162 164,844 2,998 168,004
Interest rate instruments* 19 87,807 1,826 89,652 46 114,697 1,893 116,636
Foreign exchange instruments* 16 16,426 126 16,568 98 21,819 200 22,117
Equity and index instruments* - 19,535 424 19,959 - 18,302 499 18,801
Commodity instruments* - 5,888 60 5,948 - 6,297 62 6,359
Credit derivatives - 2,108 137 2,245 - 3,724 178 3,902
Other forward financial instruments 3 65 10 78 18 5 166 189
Hedging derivatives - 13,641 - 13,641 - 18,100 - 18,100
Interest rate instruments - 13,375 - 13,375 - 17,949 - 17,949
Foreign exchange instruments - 257 - 257 - 117 - 117
Equity and index instruments - - - - - 1 - 1
Other forward financial instruments - 9 - 9 - 33 - 33
Available--for--sale financial assets 129,492 8,620 1,886 139,998 128,861 8,526 2,017 139,404
Debt securities 119,512 4,821 299 124,632 118,429 6,115 203 124,747
Equity securities 9,854 3,550 43 13,447 10,251 2,160 36 12,447
Long-term equity investments 126 249 1,544 1,919 181 251 1,778 2,210
Total financial assets at fair value** 276,375 290,368 6,576 573,319 272,869 378,221 6,629 657,719
* Amounts restated compared to the 31st December 2016 consolidated financial statements, following a change in the balance sheet presentation of premiums to be received / to be paid on options (see Note 3).
(1) o.w. EUR 100,037 million of securities purchased under resale agreements at 31st December 2017 vs. EUR 151,001 million at 31st December 2016.

6 I 2
NOTES TO THE CONSOLIDATED FINANCIAL STATEMENTS FF I N A N C I A L I N F O R M A T I O NN
354 I 2018 REGISTRATION DOCUMENT I S O C I E T E G E N E R AL E G R O U P
2. FINANCIAL LIABILITIES MEASURED AT FAIR VALUE
31.12.2017 31.12.2016
(In EUR m) Level 1 Level 2 Level 3 Total Level 1 Level 2 Level 3 Total
Trading portfolio** 6,755 139,410 - 146,165 13,518 170,841 197 184,556
Debt securities issued* - - - - - - - -
Amounts payable on borrowed securities 337 34,507 - 34,844 13 44,642 - 44,655
Bonds and other debt instruments sold short 5,416 - - 5,416 11,547 45 - 11,592
Shares and other equity instruments sold short
1,002 - - 1,002 1,958 - - 1,958
Other trading liabilities(1) - 104,903 - 104,903 - 126,154 197 126,351
Financial liabilities measured usinng fair value option through profit or loss**
334 41,008 38,674 80,016 325 45,376 36,725 82,426
Trading derivatives** 16 137,336 5,172 142,524 96 168,991 4,051 173,138
Interest rate instruments* - 88,433 3,817 92,250 22 113,324 2,627 115,973
Foreign exchange instruments* 1 17,755 54 17,810 69 22,850 32 22,951
Equity and index instruments* - 21,893 888 22,781 - 22,058 796 22,854
Commodity instruments* - 6,048 22 6,070 - 6,201 66 6,267
Credit derivatives - 2,197 391 2,588 - 3,649 530 4,179
Other forward financial instruments 15 1,010 - 1,025 5 909 - 914
Hedging derivatives - 6,750 - 6,750 - 9,594 - 9,594
Interest rate instruments - 6,681 - 6,681 - 9,410 - 9,410
Foreign exchange instruments - 65 - 65 - 183 - 183
Equity and index instruments - - - - - - - -
Other financial instruments - 4 - 4 - 1 - 1
Total financial liabilities at fair value** 7,105 324,504 43,846 375,455 13,939 394,802 40,973 449,714
* Amounts restated compared to the 31st December 2016 consolidated financial statements, following a change in the balance sheet presentation of premiums to be received / to be paid on options and structured bonds issued (see Note 3).
(1) o.w. EUR 104,090 million of securities sold under repurchase agreements at 31st December 2017 vs. EUR 125,146 million at 31st December 2016.
FINANCIAL ASSETS AT FAIR VALUE

6
NOTES TO THE CONSOLIDATED FINANCIAL STATEMENTS
2 I 6FF I N A N C I A L I N F O R M A TT I O N
S O C I E T E G E N E R AL E G R O U P I 2018 REGISTRATION DOCUMENT I 355
3. VARIATION IN LEVEL 3 FINANCIAL INSTRUMENTS
FFINANCIAL ASSETS AT FFAIR VALUE
(In EUR m) Balance at 01.01.2017
Acquisitions Disposals /
redemptions Transfer
to Level 2
Transfer from
Level 2
Gains and
losses
Translation differences
Change in scope
and others
Balance at 31.12.2017
Trading portfolio 395 227 (399) (5) 2 13 (53) (10) 170 Bonds and other debt securities 16 227 (67) (5) 2 13 (7) (10) 169
Shares and other equity securities 1 - - - - - - - 1
Other trading assets 378 - (332) - - - (46) - -
Financial assets measured uusing fair value option through profit or loss
1,219 598 (87) (138) - 489 (147) 3 1,937
Bonds and other debt securities 88 2 (52) - - (1) - - 37
Shares and other equity securities 73 9 (8) - - (31) - - 43
Other financial assets 1,058 587 (27) (138) - 521 (147) 3 1,857 Separate assets for employee benefit plans
- - - - - - - - -
Trading derivatives 2,998 73 (137) (105) 78 (89) (235) - 2,583
Interest rate instruments 1,893 1 (8) (44) 58 66 (140) - 1,826 Foreign exchange instruments 200 22 (5) (2) 6 (80) (15) - 126
Equity and index instruments 499 47 - (23) 12 (62) (49) - 424
Commodity instruments 62 3 - - - (4) (1) - 60
Credit derivatives 178 - - (33) 2 1 (11) - 137 Other forward financial instruments
166 - (124) (3) - (10) (19) - 10
Hedging derivatives - - - - - - - - -
Available--for--sale financial aassets
2,017 295 (368) (5)) 122 (29) (182) 146 1,886
Debt securities 203 160 (90) - - - (12) 38 299
Equity securities 36 7 (12) - 12 1 (1) - 43 Long-term equity investments 1,778 128 (266) (5) - (30) (169) 108 1,544
Total financial assets at ffair value
6,629 1,193 (991) (2553) 922 384 (617) 139 6,576

6 I 2
NOTES TO THE CONSOLIDATED FINANCIAL STATEMENTS FF I N A N C I A L I N F O R M A T I O NN
356 I 2018 REGISTRATION DOCUMENT I S O C I E T E G E N E R AL E G R O U P
FFINANCIAL LIABILITIESS AT FAIR VALUE
(In EUR m)
Balance at 01.01.2017
Issues Acquisitions /
disposals Redemptions
Transfer to Level 2
Transfer from
Level 2
Gains and
losses
Translation differences
Balance at 31.12.2017
Trading portfolio** 197 - (197) - - - - - -
Debt securities issued* - - - - - - - - - Amounts payable on borrowed securities - - - - - - - - -
Bonds and other debt instruments sold short
- - - - - - - - -
Shares and other equity instruments sold short
- - - - - - - - -
Other trading liabilities 197 - (197) - - - - - -
Financial liabilities mmeasured using fair value option through pprofit or loss*
36,725 18,271 (1,086) (13,063) (2,615) 1,727 1,026 (2,311) 38,674
Trading derivatives 4,051 463 (1) (70) (414) 996 362 (215) 5,172
Interest rate instruments 2,627 9 (1) - (259) 951 615 (125) 3,817 Foreign exchange instruments 32 16 - (5) (6) 5 14 (2) 54
Equity and index instruments 796 431 - (65) (49) 38 (192) (71) 888
Commodity instruments 66 7 - - - - (50) (1) 22
Credit derivatives 530 - - - (100) 2 (25) (16) 391 Other forward financial instruments
- - - - - - - - -
Hedging derivatives -- - - - - - - - -
Total financial liabilities aat fair value 40,973 18,734 (1,284) (13,133) (3,029) 2,723 1,388 (2,526) 43,846
* Amounts restated compared to the 31st December 2016 consolidated financial statements, following a change in the balance sheet presentation of structured issued bonds (see Note 3).

6
FINANCIAL LIABILITIES AT FAIR VALUE
NOTES TO THE CONSOLIDATED FINANCIAL STATEMENTS
2 I 6FF I N A N C I A L I N F O R M A T I O NN
S O C I E T E G E N E R AL E G R O U P I 2018 REGISTRATION DOCUMENT I 357
4. VALUATION METHODS OF FINANCIAL INSTRUMENTS CARRIED AT FAIR VALUE ON THE BALANCE SHEET
For financial instruments recognised at fair value on the balance sheet, fair value is determined primarily on the basis of the prices quoted in an active market. These prices can be adjusted if none are available on the balance sheet date or if the clearing value does not reflect transaction prices.
However, due notably to the varied characteristics of financial instruments traded over-the-counter on the financial markets, a large number of financial products traded by the Group does not have quoted prices in the markets.
For these products, fair value is determined using models based on valuation techniques commonly used by market participants to measure financial instruments, such as discounted future cash flows for swaps or the Black & Scholes formula for certain options, and using valuation parameters that reflect current market conditions at the balance sheet date. These valuation models are validated independently by the experts from the Market Risk Department of the Group’s Risk Division.
Furthermore, the inputs used in the valuation models, whether derived from observable market data or not, are checked by the Finance Division of GBIS (Global Banking and Investor Solutions), in accordance with the methodologies defined by the Market Risk Department.
If necessary, these valuations are supplemented by additional reserves (such as bid-ask spreads and liquidity) determined reasonably and appropriately after an analysis of available information.
Derivatives and security financing transactions are subject to a Credit Valuation Adjustment (CVA) or Debt Valuation Adjustment (DVA). The Group includes all clients and clearing houses in this adjustment, which also reflects the netting agreements existing for each counterparty.
CVA is determined on the basis of the Group entity’s positive expected exposure to the counterparty, the counterparty’s probability of default (conditional to the entity not defaulting) and the loss given default. The DVA is determined symmetrically based on the negative expected exposure. These calculations are carried out over the life of the potential exposure, with a focus on the use of relevant and observable market data.
Similarly, an adjustment to take into account the costs or profits linked to the financing of these transactions (FVA, Funding Value Adjustment) is also performed.
Observable data must be: independent, available, publicly distributed, based on a narrow consensus and/or backed up by transaction prices.
For example, consensus data provided by external counterparties are considered observable if the underlying market is liquid and if the prices provided are confirmed by actual transactions. For high maturities, these consensus data are not observable. This is the case for the implied volatility used for the valuation of equity options with maturities of more than five years. However, when the residual maturity of the instrument falls below five years, its fair value becomes sensitive to observable inputs.
In the event of unusual tensions on the markets, leading to a lack of the usual reference data used to measure a financial instrument, the Risk Division may implement a new model in accordance with pertinent available data, similar to methods used by other market players.
SHARES AND OTHER EQUITY SECURITIES
For listed shares, fair value is taken to be the quoted price on the balance sheet date. For unlisted shares, fair value is determined depending on the type of financial instrument and according to one of the following methods:
valuation based on a recent transaction involving the issuing company (third party buying into the issuing company’s capital, appraisal by a professional valuation agent, etc.);
valuation based on a recent transaction in the same sector as the issuing company (income multiple, asset multiple, etc.);
proportion of net asset value held.
For unlisted securities in which the Group has significant holdings, valuations based on the above methods are supplemented by a discounted future cash flow valuation based on business plans or on valuation multiples of similar companies.
DEBT INSTRUMENTS HELD IN PORTFOLIO, ISSUES OF STRUCTURED SECURITIES MEASURED AT FAIR VALUE AND FINANCIAL DERIVATIVES
The fair value of these financial instruments is determined based on the quoted price on the balance sheet date or prices provided by brokers on the same date, when available. For unlisted financial instruments, fair value is determined using valuation techniques. Concerning liabilities measured at fair value, the on-balance sheet amounts include changes in the Group’s issuer credit risk.
OTHER DEBTS
For listed financial instruments, fair value is taken as their closing quoted price on the balance sheet date. For unlisted financial instruments, fair value is determined by discounting future cash flows to present value at market rates (including counterparty risks, non-performance and liquidity risks).

6 I 2
NOTES TO THE CONSOLIDATED FINANCIAL STATEMENTS FF I N A N C I A L I N F O R M A T I O NN
358 I 2018 REGISTRATION DOCUMENT I S O C I E T E G E N E R AL E G R O U P
5. ESTIMATES OF MAIN UNOBSERVABLE INPUTS
The following table provides the valuation of Level 3 instruments on the balance sheet and the range of values of the most significant unobservable inputs by main product type.
(In EUR m) Value in balance
sheet
CCassh instruments and dderivatives((1) Assets Liabilities Main products
Valuation techniques used
Significant unobservable
inputs
Range of inputs min & max
Equities/funds 1,796 28,828
Simple and complex instruments or derivatives on funds, equities or baskets of stocks
Various option models on funds, equities or baskets of stocks
Equity volatilities 6.7%; 75.1%
Equity dividends 0%; 20.7%
Correlations -99%; 97.8%
Hedge fund volatilities
8.3%; 20.0%
Mutual fund volatilities
1.5%; 53.3%
Rates and Forex 2,708 14,605
Hybrid forex / interest rate or credit / interest rate derivatives
Hybrid forex interest rate or credit interest rate option pricing models
Correlations -10.89%; 90%
Forex derivatives Forex option pricing models Forex volatilities 1.0%; 27.42%
Interest rate derivatives whose notional is indexed to prepayment behaviour in European collateral pools
Prepayment modelling Constant prepayment rates
0%; 45%
Inflation instruments and derivatives Inflation pricing models Correlations 64.4%; 91%
Credit 468 391
Collateralised Debt Obligations and index tranches
Recovery and base correlation projection models
Time to default correlations 0%; 100%
Recovery rate variance for single name underlyings
0%; 100%
Other credit derivatives Credit default models
Time to default correlations
0%; 100%
Quanto correlations -50%; 40% Credit spreads 0 bp; 1,000 bps
Commodities 60 22 Derivatives on commodities baskets
Option models on commodities Correlations 6.82%; 97.45%
Long-term equity investments
1,544 - Securities held for strategic purposes
Net Book Value / Recent transactions
Not applicable -
TTOTAL 66,,5576 443,,8846
(1) Hybrid instruments are broken down by main unobservable inputs.
SENSITIVITY OF LEVEL 3 FAIR VALUE TO A REASONABLE VARIATION IN UNOBSERVABLE INPUTS

6
NOTES TO THE CONSOLIDATED FINANCIAL STATEMENTS
2 I 6FF I N A N C I A L I N F O R M A T I O NN
S O C I E T E G E N E R AL E G R O U P I 2018 REGISTRATION DOCUMENT I 359
6. SENSITIVITY OF FAIR VALUE FOR LEVEL 3 INSTRUMENTS
Unobservable inputs are assessed carefully, particularly in this persistently uncertain economic environment and market. However, by their very nature, unobservable inputs inject a degree of uncertainty into the valuation of Level 3 instruments.
To quantify this, fair value sensitivity was estimated at 31st December 2017 on instruments whose valuation requires certain unobservable inputs. This estimate was based either on a “standardised” variation in unobservable inputs, calculated for
each input on a net position, or on assumptions in line with the additional valuation adjustment policies for the financial instruments in question.
The “standardised” variation is:
either the standard deviation of consensus prices (TOTEM, etc.) used to measure an input nevertheless considered as unobservable; or
the standard deviation of historic data used to measure the input.
SSENSITIVITY OF LEVEL 33 FAIR VALUE TO A REEASONABLE VARIATION IIN UNOBSERVABLE INPUTTS
31.12.2017 31.12.2016
(In EUR m) Negative impact
Positive impact
Negative impact
Positive impact
Shares and other equity iinstruments aand derivatives (5) 88 (20) 94
Equity volatilities 0 18 0 17
Dividends 0 6 (1) 5
Correlations (5) 59 (19) 59
Hedge Fund volatility 0 0 0 8
Mutual Fund volatility 0 6 0 5
Rates or Forex instruments and derivatives (6) 50 (5) 49
Correlations between exchange rates and/or interest rates (4) 45 (3) 42
Forex volatilities (1) 2 (2) 5
Constant prepayment rates 0 0 0 0
Inflation / inflation correlations (1) 2 (1) 3
Credit instruments and derivatives (2) 6 (8) 16
Time to default correlations (1) 1 (1) 1
Recovery rate variance for single name underlyings 0 0 (7) 7
Quanto correlations 0 4 0 8
Credit spreads (1) 1 (1) 1
Commodity derivatives 0 1 0 2
Commodities correlations 0 1 0 2
Long--term securities valued using internal models NA NA (15) 27
It should be noted that, given the already conservative valuation levels, this sensitivity is higher for a favourable impact on results than for an unfavourable impact. Moreover, the amounts shown above illustrate the uncertainty of the valuation as of the
computation date on the basis of a reasonable variation in inputs. Future variations in fair value or consequences of extreme market conditions cannot be deduced or forecast from these estimates.

6 I 2
NOTES TO THE CONSOLIDATED FINANCIAL STATEMENTS FF I N A N C I A L I N F O R M A T I O NN
360 I 2018 REGISTRATION DOCUMENT I S O C I E T E G E N E R AL E G R O U P
7. DEFERRED MARGIN RELATED TO MAIN UNOBSERVABLE INPUTS
The remaining amount to be recorded in the income statement, resulting from the difference between the transaction price and the amount determined at this date using valuation techniques, minus the amounts recorded in the income statement after initial
recognition, is shown in the table below. This amount is recorded in the income statement over time, or when the inputs become observable.
(In EUR m) 2017 2016
Deferred margin at 11st January 1,142 1,029
Deferred margin on new transactions during the period 880 779
Margin recorded in the income statement during the period (741) (666)
o.w. amortisation (317) (290)
o.w. switch to observable inputs (49) (90)
o.w. disposed, expired or terminated (375) (285)
Deferred margin at 331st December 1,281 1,142

6
NOTES TO THE CONSOLIDATED FINANCIAL STATEMENTS
2 I 6FF I N A N C I A L I N F O R M A T I O NN
S O C I E T E G E N E R AL E G R O U P I 2018 REGISTRATION DOCUMENT I 361
NOTE 3.5 - LOANS AND RECEIVABLES
ACCOUNTING PRINCIPLES
Loans and receivables include non-derivative financial assets with fixed or determinable payments that are not quoted in an active market and are not held for trading purposes, not held for sale from the time they are originated or acquired and not designated by the Group upon initial recognition to be measured at fair value through profit or loss in accordance with the fair value option.
Loans and receivables are recognised in the balance sheet under Due from banks or Customer loans depending on the type of counterparty. After their initial recognition, they are measured at amortised cost using the effective interest rate method and impairment, determined on an individual or a collective basis, may be recorded if appropriate (see Note 3.8).
Loans and receivables may be subject to commercial renegotiations provided that the borrowing customer is not experiencing financial difficulties and is not insolvent. Such transactions involve customers whose debt the Group is willing to renegotiate in the interest of maintaining or developing a commercial relationship, in accordance with the credit approval procedures in force, and without relinquishing any principal or accrued interest. Renegotiated loans and receivables are derecognised at the renegotiation date and replaced with the new loans, taken out under renegotiated conditions, which are recorded on the balance sheet at the same date. These new loans are subsequently measured at amortised cost, based on the effective interest rate arising from the new contractual conditions and taking into account the renegotiation fees billed to the customer.
Customer loans include lease receivables where they are classified as finance leases. Leases granted by the Group are classified as finance leases if they transfer substantially all the risks and rewards incidental to ownership of the leased asset to the lessee. Otherwise, they are classified as operating leases (see Notes 4.2 and 8.4).
These finance lease receivables represent the Group’s net investment in the lease, calculated as the present value of the minimum payments to be received from the lessee discounted at the interest rate implicit in the lease, plus any unguaranteed residual value. In the event of a subsequent reduction in the estimated unguaranteed residual value used to calculate the lessor’s investment in the finance lease, the present value of this reduction is recognised as a loss under Expenses from other activities in the income statement and as a reduction of finance lease receivables on the asset side of the balance sheet.
1. DUE FROM BANKS
(In EUR m) 31.12.2017 31.12.2016
Current accounts 22,159 24,639
Deposits and loans(1) 21,902 21,675
Subordinated and participating loans 133 157
Securities purchased under resale agreements 16,544 12,890
Related receivables 125 141
Due from banks before impairment 60,863 59,502
Impairment of individually impaired loans (25) (35)
Revaluation of hedged items 28 35
Net due from banks 60,866 59,502
(1) At 31st December 2017, the amount of receivables with incurred credit risk was EUR 100 million compared to EUR 97 million at 31st December 2016.

6 I 2
NOTES TO THE CONSOLIDATED FINANCIAL STATEMENTS FF I N A N C I A L I N F O R M A T I O NN
362 I 2018 REGISTRATION DOCUMENT I S O C I E T E G E N E R AL E G R O U P
2. CUSTOMER LOANS
(In EUR m) 31.12.2017 31.12.2016
Overdrafts(1) 19,791 25,880
Other customer loans(1) 364,096 360,389
Lease financing agreements(1) 30,269 29,562
Related receivables 2,243 1,611
Securities purchased under resale agreements 21,004 23,432
Customer loans before impairment 437,403 440,874
Impairment of individually impaired loans (11,214) (13,281)
Impairment of groups of homogeneous receivables (1,311) (1,534)
Revaluation of hedged items 353 442
Net ccustomer loans 425,231 426,501
(1) At 31st December 2017, the amount of receivables with incurred credit risk was EUR 20,642 million compared to EUR 23,639 million at 31st December 2016.
BREAKDOWN OF OTHER CUSTOMER LOANS
(In EUR m) 31.12.2017 31.12.2016
Trade notes 10,173 10,289
Short-term loans 108,087 108,575
Export loans 10,395 11,718
Equipment loans 54,772 51,671
Housing loans 124,324 119,547
Loans secured by notes and securities 89 139
Other loans 56,256 58,450
Other ccustomer loans 364,096 360,389
ADDITIONAL INFORMATION ON LEASE FINANCING AND SIMILAR AGREEMENTS
(In EUR m) 31.12.2017 31.12.2016
Gross investments 32,714 32,230
less than one year 8,525 8,294
1-5 years 18,784 18,042
more than five years 5,405 5,894
Present value of minimum payments receivable 28,827 28,151
less than one year 7,942 7,600
1-5 years 16,852 16,006
more than five years 4,033 4,545
Unearned financial income 2,403 2,584
Unguaranteed residual values receivable bby the lessor 1,484 1,495

6
NOTES TO THE CONSOLIDATED FINANCIAL STATEMENTS
2 I 6FF I N A N C I A L I N F O R M A T I O NN
S O C I E T E G E N E R AL E G R O U P I 2018 REGISTRATION DOCUMENT I 363
NOTE 3.6 - DEBTS
ACCOUNTING PRINCIPLES
Debts include non-derivative financial liabilities that are not measured at fair value through profit or loss.
They are recognised in the balance sheet under Due to banks, Customer deposits, Debt securities issued and Subordinated debts.
Subordinated debts are all dated or undated borrowings, whether or not in the form of debt securities, which in the event of the liquidation of the borrowing company may only be redeemed after all other creditors have been paid.
Debts are initially recognised at cost, measured as the fair value of the amount borrowed net of transaction fees. These liabilities are measured at period-end and at amortised cost using the effective interest rate method. As a result, issue or redemption premiums on bonds are amortised using the actuarial method over the life of the instruments in question.
The Group’s obligations arising from mortgage savings accounts and plans are recorded under Customer deposits – Regulated savings accounts. A provision may be recorded in respect of CEL mortgage savings accounts and PEL mortgage savings plans (see Note 3.8).
1. DUE TO BANKS
(In EUR m) 31.12.2017 31.12.2016
Demand deposits and current accounts 11,686 14,337
Overnight deposits and borrowings and others 2,145 2,157
Term deposits 68,265 60,625
Related payables 127 86
Revaluation of hedged items 147 235
Securities sold under repurchase agreements 6,251 5,144
Total 88,621 82,584
2. CUSTOMER DEPOSITS
(In EUR m) 31.12.2017 31.12.2016
Regulated savings accounts 92,023 87,253
Demand 66,515 62,091
Term 25,508 25,162
Other demand deposits(1) 216,102 211,228
Other term deposits(1) 85,454 98,102
Related payables 381 451
Revaluation of hedged items 268 321
Total customer deposits 394,228 397,355
Borrowings secured by notes and securities - 2
Securities sold to customers under repurchase agreements 16,405 23,645
Total 410,633 421,002
(1) Including deposits linked to governments and central administrations.

6 I 2
NOTES TO THE CONSOLIDATED FINANCIAL STATEMENTS FF I N A N C I A L I N F O R M A T I O NN
364 I 2018 REGISTRATION DOCUMENT I S O C I E T E G E N E R AL E G R O U P
BREAKDOWN BY CUSTOMER TYPE
(In EUR m) 31.12.2017 31.12.2016
Other demand deposits
Businesses and sole proprietors 97,930 87,923
Individual customers 69,591 64,071
Financial customers 36,261 41,942
Others(1) 12,320 17,292
Sub--total 216,102 211,228
(1) Including deposits linked to governments and central administrations.
3. DEBT SECURITIES ISSUED
(In EUR m) 31.12.2017 31.12.2016
Term savings certificates 515 577
Bond borrowings 22,470 20,910
Interbank certificates and negotiable debt instruments 78,485 78,287
Related payables 770 808
Sub--total 102,240 100,582
Revaluation of hedged items 995 1,620
Total 103,235 102,202
o.w. floating-rate securities 30,762 26,146

6
NOTES TO THE CONSOLIDATED FINANCIAL STATEMENTS
2 I 6FF I N A N C I A L I N F O R M A T I O NN
S O C I E T E G E N E R AL E G R O U P I 2018 REGISTRATION DOCUMENT I 365
NOTE 3.7 - INTEREST INCOME AND EXPENSE
MAKING
IT
SIMPLE
Interest is compensation for a financial service, consisting in a lender making a certain amount of cash available to a borrower for an agreed period of time. Such compensated financing arrangements can be loans, deposits or securities (bonds, negotiable debt securities, etc.).
This compensation is a consideration for the time value of money, and additionally for credit risk, liquidity risk and administrative costs, all borne by the lender for the duration of the financing agreement. The interest can also include a margin used by the lending bank to remunerate equity instruments (such as ordinary shares) that are required by prudential regulation to be issued in relation to the amount of financing granted, so as to guarantee its own solvency.
Interest is recognised as expense or income over the life of the financing service granted or received, proportionally to the principal amount outstanding.
ACCOUNTING PRINCIPLES
Interest income and expense are recognised in the income statement under Interest and similar income and Interest and similar expense for all financial instruments measured at amortised cost using the effective interest rate method (loans and receivables, debts, held-to-maturity financial assets) and for debt securities classified as Available-for-sale financial assets.
The effective interest rate is taken to be the rate used to net discount future cash inflows and outflows over the expected life of the instrument in order to establish the net book value of the financial asset or liability. The calculation of this rate considers the future cash flows estimated on the basis of the contractual provisions of the financial instrument without taking account of possible future credit losses and also includes commissions paid or received between the parties where these may be assimilated to interest, directly linked transaction costs, and all types of premiums and discounts.
When a financial asset or group of similar financial assets has been impaired following an impairment of value, subsequent interest income is recorded on the basis of the effective interest rate used to discount the future cash flows when measuring the loss of value.
Moreover, except for those related to employee benefits, provisions recognised as balance sheet liabilities generate interest expenses that are calculated using the same interest rate as that used to discount the expected outflow of resources.
2017 2016
(In EUR m) Income Expense Net Income Expense Net
Transactions with banks 1,993 (1,427) 566 1,550 (1,161) 389
Demand deposits and interbank loans 1,608 (1,375) 233 1,127 (1,107) 20 Securities purchased/sold under resale agreements and borrowings secured by notes and securities 385 (52) 333 423 (54) 369
Transactions with customers 11,823 (4,899) 6,924 11,957 (4,769) 7,188
Trade notes 410 - 410 531 - 531
Other customer loans 10,508 (1) 10,507 10,638 (2) 10,636
Demand deposits and current accounts 744 - 744 705 - 705
Regulated savings accounts - (887) (887) - (875) (875)
Other customer debts 36 (3,959) (3,923) 13 (3,861) (3,848) Securities purchased/sold under resale agreements and borrowings secured by notes and securities
125 (52) 73 70 (31) 39
Transactions in financial instruments 8,743 (6,937) 1,806 9,976 (9,263) 713
Available-for-sale financial assets 2,424 - 2,424 2,496 - 2,496
Held-to-maturity financial assets 141 - 141 260 - 260
Debt securities issued - (1,902) (1,902) - (2,033) (2,033)
Subordinated and convertible debt - (581) (581) - (557) (557)
Securities lending/borrowing 14 (20) (6) 9 (25) (16)
Hedging derivatives 6,164 (4,434) 1,730 7,211 (6,648) 563
Lease financing agreements 1,120 - 1,120 1,177 - 1,177
Real estate lease financing agreements 199 - 199 225 - 225
Non-real estate lease financing agreements 921 - 921 952 - 952
Total Interest income and expense 23,679 (13,263) 10,416 24,660 (15,193) 9,467
o.w. interest income from impaired financial assets 519 - - 373 -

6 I 2
NOTES TO THE CONSOLIDATED FINANCIAL STATEMENTS FF I N A N C I A L I N F O R M A T I O NN
366 I 2018 REGISTRATION DOCUMENT I S O C I E T E G E N E R AL E G R O U P
These interest expenses include the refinancing cost of financial instruments at fair value through profit or loss, of which the results are classified in net gains or losses on these instruments (see Note 3.1). Given that income and expenses booked in the
income statement are classified by type of instrument rather than by purpose, the net income generated by activities in financial instruments at fair value through profit or loss must be assessed as a whole.
BREAKDOWN OF OTHER CUSTOMER LOANS INCOME:
(In EUR m) 2017 2016
Short-term loans 3,996 3,928
Export loans 267 280
Equipment loans 1,740 1,843
Housing loans 3,278 3,602
Other customer loans 1,227 985
Total 10,508 10,638

6
NOTES TO THE CONSOLIDATED FINANCIAL STATEMENTS
2 I 6FF I N A N C I A L I N F O R M A T I O NN
S O C I E T E G E N E R AL E G R O U P I 2018 REGISTRATION DOCUMENT I 367
NOTE 3.8 - IMPAIRMENT AND PROVISIONS
MAKING
IT
SIMPLE
Some financial assets (loans, debt securities) involve credit risk which exposes the Group to a potential loss if the borrower, the counterparty or the securities issuer were to be unable to respect their financial commitments.
Fluctuations to credit risk on financial assets measured at fair value through profit and loss (particularly instruments held as part of market activities) are directly integrated in the revaluation of the instruments and are thereby recorded as profit or loss without waiting for the occurrence of a default.
Conversely, the credit risk to which the Group is exposed on the other financial assets (loans and receivables, available-for-sale securities, held-to-maturity investments) does not lead to the recording of an expense until the credit loss is incurred following the occurrence of a loss event (occurrence of past-due payments, bankruptcy, significant deterioration of the borrower’s financial situation, etc.).
The evidence of an incurred credit loss shall firstly be assessed individually for each financial asset, and further assessed at the level of homogeneous portfolios of financial instruments.
Impairment of assets reduces their book value in the balance sheet and can be subsequently reversed in case of an improvement in the counterparty’s credit risk.
1. IMPAIRMENT OF FINANCIAL ASSETS
ACCOUNTING PRINCIPLES
FINANCIAL ASSETS MEASURED AT AMORTISED COST
At each balance sheet date, the Group assesses whether there is objective evidence that any financial asset or group of financial assets has been impaired as a result of one or more events occurring since they were initially recognised (a “loss event”) and whether that loss event (or events) has (have) an impact on the estimated future cash flows of the financial asset or group of financial assets that can be reliably estimated.
The Group first assesses whether objective evidence of impairment exists individually for financial assets that are individually significant, and individually or collectively for financial assets that are not individually significant. Notwithstanding the existence of a guarantee, the criteria used to assess objective evidence of credit risk include the following conditions:
a significant decline in the counterparty’s financial situation leads to a high probability of said counterparty being unable to fulfil its overall commitments (credit obligations), hence a risk of loss to the Bank;
concessions are granted to the clauses of the loan agreement, in light of the borrower’s financial difficulties, that would not have been granted in other circumstances;
one or more over 90-day past-due payments are recorded (with the exception of restructured loans on probation, which are considered in default at the first missed payment) and/or a collection procedure is initiated;
or, regardless of whether or not any past-due payments are recorded, there is objective evidence of impairment or legal proceedings have been initiated (bankruptcy, legal settlement, compulsory liquidation).
The Group applies the impairment contagion principle to all of the defaulting counterparty’s outstanding loans. When a debtor belongs to a group, all of the group’s outstanding loans are generally impaired as well.
If there is objective evidence that loans or other receivables, or financial assets classified as Held-to-maturity financial assets, are impaired, an impairment is recognised for the difference between the carrying amount and the present value of estimated future recoverable cash flows, taking into account any guarantees, this discount is calculated using the financial assets’ original effective interest rate. The impairment is deducted from the carrying value of the impaired financial asset. Allocations to and reversals of impairments are recorded in the income statement under Cost of risk. The impaired loans or receivables are remunerated for accounting purposes by the reversal over time of the discounting to present value, which is recorded under Interest and similar income in the income statement.

6 I 2
NOTES TO THE CONSOLIDATED FINANCIAL STATEMENTS FF I N A N C I A L I N F O R M A T I O NN
368 I 2018 REGISTRATION DOCUMENT I S O C I E T E G E N E R AL E G R O U P
Where there is no objective evidence that an impairment loss has been incurred on a financial asset considered individually, be it significant or not, the Group includes that financial asset in a group of financial assets having similar characteristics in terms of credit risk and tests the whole group for impairment. In a homogeneous portfolio, as soon as a credit risk is incurred on a group of financial instruments, impairment is recognised without waiting for the risk to individually affect one or more receivables.
Homogeneous portfolios thus impaired can include:
receivables on counterparties which have encountered financial difficulties since these receivables were initially recognised, without any objective evidence of impairment having yet been identified at the individual level (sensitive receivables); or
receivables on counterparties linked to economic sectors considered as being in crisis further to the occurrence of loss events; or
receivables on geographic sectors or countries in which a deterioration of credit risk has been assessed.
The amount of impairment on a group of homogeneous assets is calculated on the basis of assumptions on default rates and loss given default, or, if necessary, on the basis of ad hoc studies. These assumptions are calibrated for each homogeneous group based on its specific characteristics, sensitivity to the economic environment and historical data. They are reviewed periodically by the Risk Division and then adjusted to reflect any relevant current economic conditions. Allocations to and reversals of such impairment are recorded under Cost of risk.
RESTRUCTURING OF LOANS AND RECEIVABLES
When an asset recorded under Loans and receivables is restructured, contractual changes are made to the amount, term or financial conditions of the initial transaction approved by the Group, due to the financial difficulties or insolvency of the borrower (whether insolvency has already occurred or will definitely occur unless the debt is restructured), and these changes would not have been considered in other circumstances.
Restructured financial assets are classified as impaired and the borrowers are considered to be in default. These classifications are maintained for at least one year and for as long as any uncertainty remains for the Group as to whether or not the borrowers can meet their commitments.
At the restructuring date, the carrying amount of the restructured financial asset is decreased to the present amount of the estimated new future recoverable cash flows discounted using the initial effective interest rate. This loss is booked to profit or loss under Cost of risk.
Restructured financial assets do not include loans and receivables subject to commercial renegotiations and involving customers whose debt the Group has agreed to renegotiate in the interest of maintaining or developing a commercial relationship, in accordance with the credit approval procedures in force and without relinquishing any principal or accrued interest.
AVAILABLE-FOR-SALE FINANCIAL ASSETS
An available-for-sale financial asset is impaired if there is objective evidence of impairment as a result of one or more events that occurred after the initial recognition of this asset.
For listed equity instruments, a significant or prolonged decline in their price below their acquisition cost constitutes objective evidence of impairment. For this purpose, the Group considers as impaired listed shares showing an unrealised loss greater than 50% of their acquisition price on the balance sheet date, as well as listed shares for which the quoted prices have been below their acquisition price on every trading day for at least the last 24 months before the balance sheet date. Further factors, such as the financial situation of the issuer or its development outlook, can lead the Group to consider that the cost of its investment may not be recovered even if the abovementioned criteria are not met. An impairment loss is then recorded through profit or loss equal to the difference between the last quoted price of the security on the balance sheet date and its acquisition price.
For unlisted equity instruments, the criteria used to assess the evidence of impairment are identical to those mentioned above. The value of these instruments at the balance sheet date is determined using the valuation methods described in Note 3.4.
The criteria for the impairment of debt instruments are similar to those for the impairment of financial assets measured at amortised cost.
When a decline in the fair value of an available-for-sale financial asset has been recognised directly in shareholders’ equity under Unrealised or deferred gains and losses and subsequent objective evidence of impairment emerges, the Group recognises the total accumulated unrealised loss previously recorded in shareholders’ equity in the income statement under Cost of risk for debt instruments and under Net gains and losses on available-for-sale financial assets for equity securities.
This cumulative loss is measured as the difference between the acquisition cost (net of any repayments of principal and amortisation) and the present fair value, less any impairment of the financial asset that has already been recorded through profit or loss.
Impairment losses recognised through profit or loss on an equity instrument classified as available-for-sale are only reversed through profit or loss when the instrument is sold. Once an equity instrument has been recognised as impaired, any further loss of value is recorded as an additional impairment loss. For debt instruments, however, an impairment loss is reversed through profit or loss if they subsequently recover in value following an improvement in the issuer’s credit risk.

6
NOTES TO THE CONSOLIDATED FINANCIAL STATEMENTS
2 I 6FF I N A N C I A L I N F O R M A T I O NN
S O C I E T E G E N E R AL E G R O U P I 2018 REGISTRATION DOCUMENT I 369
IFRS 9
As from 1sst JJanuary 2018, the measurement of credit risk expense will be based on expected credit losses instead of incurred credit losses. Depreciation or provisions for credit risk will then be recorded from the origination of the loans or the purchase debt securities, without waiting for the occurrence of an objective evidence of impairment (see Note 1).
BREAKDOWN OF ASSET IMPAIRMENTS
(In EUR m)
Asset impairments at
31.12.2016 Allocations
Write-backs
available
Net impairment
losses Reversals
used
Currency and scope
effects
Asset impairments at
31.12.2017
Banks 335 6 (5) 11 (11) - 25
Customer loans 112,5355 4,845 (3,760) 11,,085 (2,906) (161) 10,,553
Lease financing and similar agreements 7466 290 (213) 777 (171) 9 661
Groups of homogeneous assets 11,5344 449 (639) ((190) - (33) 1,,311
Available-for-sale assets(1)(2) 11,3433 167 (578) ((411) - 62 9944
Others(1) 77644 34 (176) ((142) (64) 24 5822
Total 16,9577 5,791 (5,371) 4420 (3,152) (99) 14,,126
(1) Including a EUR 61 million net allowance for counterparty risks. (2) o.w. write-down on equity securities, excluding insurance activities, of EUR 64 million, which can be broken down as follows:
- EUR 1 million: impairment loss on securities not written down at 31st December 2016; - EUR 63 million: additional impairment loss on securities already written down at 31st December 2016.
2. PROVISIONS
ACCOUNTING PRINCIPLES
Provisions include provisions for credit risk related to off-balance sheet loan and guarantee commitments granted to third parties by the Group, provisions related to PEL/CEL commitments, and provisions representing liabilities whose timing or amount cannot be precisely determined (primarily legal disputes and restructuring).
Provisions may be recorded:
where, by virtue of a commitment to a third-party, the Group will probably or certainly incur an outflow of resources to this third-party without receiving at least the equivalent value in exchange;
and when the amount of probable outflow of resources can be reliably estimated.
The expected outflows are then discounted to present value to determine the amount of the provision, where this discounting has a significant impact. Allocations to and reversals of provisions are recorded through profit or loss under the items corresponding to the future expense. Probable losses incurred by the Group in identifying objective evidence of credit risk related to off-balance sheet loan and guarantee commitments are recorded in the income statement under Cost of risk against a provision booked to liabilities.
Information on the nature and amount of the associated risks is not disclosed when the Group considers that such disclosure could seriously undermine its position in a dispute with other parties on the object of the provision.

6 I 2
NOTES TO THE CONSOLIDATED FINANCIAL STATEMENTS FF I N A N C I A L I N F O R M A T I O NN
370 I 2018 REGISTRATION DOCUMENT I S O C I E T E G E N E R AL E G R O U P
BREAKDOWN OF PROVISIONS
(In EUR m) Provisions at
31.12.2016 Allocations Write-backs
available Net
allocation Write-backs
used
Currency and scope
effects
Provisions at
31.12.2017
Provisions for off-balance sheet commitments to banks 6 5 (3) 22 - 4 12
Provisions for off-balance sheet commitments to customers
442 410 (421) ((11) - (26) 405
Provision for disputes 22,232 1,174 (122) 11,052 (757) (140) 2,387
Other provisions(1) 9909 401 (201) 2200 (42) (16) 1,051
Provisions on financial iinstruments and disputes
3,589 1,990 (747) 11,243 (799) (178) 3,855
(1) Including a EUR -32 million net write-back for PEL/CEL provisions at 31st December 2017 (see Note 3.8.3) and an allocation of EUR 72 million for social supports related to the adaptation of the French Retail Banking network.
PROVISIONS FOR OFF-BALANCE SHEET COMMITMENTS
Provisions for off-balance sheet commitments represent the probable losses incurred by the Group following the identification of a proven credit risk on an off-balance sheet financing or guarantee commitment that would not be considered as a derivative instrument or designated as financial asset through profit or loss.
PROVISIONS FOR DISPUTES
The Group is subject to an extensive legal and regulatory framework in the countries where it operates. In this complex legal context, the Group and some of its former and current representatives may be involved in various legal actions, including civil, administrative and criminal proceedings. The vast majority of these proceedings are part of the Group’s current business. In recent years, litigation with investors and the number of disputes involving financial intermediaries such as banks and investment advisors has increased, partly due to a difficult financial environment.
It is by nature difficult to foresee the outcome of disputes, regulatory proceedings and acts involving Group entities, particularly if they are initiated by various categories of complainants, if the amount of claims for damages is not specified or is indeterminate or if the proceedings have no precedent.
In preparing its financial statements, the Group assesses the consequences of the legal, regulatory or arbitration proceedings in which it is involved. A provision is booked when losses from these proceedings become probable and the amount can be estimated reliably.
To assess the probability of losses and the amount of these losses, and thus to determine the amount of provisions to book, estimations are important. Management makes these estimates by exercising its judgement and taking into account all information available when financial statements are prepared. In particular, the Group takes into account the nature of the dispute, the underlying facts, ongoing proceedings and court decisions already taken, as well as its experience and the experiences of other companies dealing with similar cases (assuming that the Group has knowledge thereof) and, where appropriate, the opinion and reports of experts and independent legal advisers.
Each quarter, the Group carries out a detailed examination of outstanding disputes that present a significant risk. The description of these disputes is presented in the Note 9 “Information on risks and litigation”.
To take into account changes in legal risks related to public law litigation for which investigations and proceedings are under way with US authorities (such as The Office of Foreign Assets Control) and European authorities, as well as the dispute on the “précompte”, the Group has recognised a provision among its liabilities, under Provisions for disputes; this provision has been adjusted in 2017 by an additional allowance of EUR 1,150 million and a use for EUR 750 million under Cost of risk, bringing it to a total of EUR 2,318 million.
OTHER PROVISIONS
Other provisions include provisions for restructuring, provisions for commercial litigations, provisions for future repayment of funds in connection with customer financing transactions and provisions for commitments linked to PEL/CEL accounts (see Note 3.8.3).

6
NOTES TO THE CONSOLIDATED FINANCIAL STATEMENTS
2 I 6FF I N A N C I A L I N F O R M A T I O NN
S O C I E T E G E N E R AL E G R O U P I 2018 REGISTRATION DOCUMENT I 371
3. COMMITMENTS UNDER MORTGAGE SAVINGS AGREEMENTS
ACCOUNTING PRINCIPLES
In France, Comptes d’épargne-logement (CEL or mortgage savings accounts) and Plans d’épargne-logement (PEL or mortgage savings plans) are special savings schemes for individual customers which are governed by Act 65-554 of 10th July 1965. These products combine an initial deposit phase in the form of an interest-earning savings account, followed by a lending phase where the deposits are used to provide mortgage loans. The lending phase is subject to the prior existence of the savings phase and is therefore inseparable from it. The savings deposits collected and loans granted are measured at amortised cost.
These instruments create two types of commitments for the Group: the obligation to pay interest on customer savings for an indeterminate future period at an interest rate established at the inception of the mortgage savings agreement, and the obligation to subsequently lend to the customer at an interest rate also established at the inception of the savings agreement.
If it is clear that commitments under the PEL/CEL agreements will have negative consequences for the Group, a provision is recorded on the liabilities side of the balance sheet. Any changes in these provisions are recognised as net banking income under Net interest income. These provisions only relate to commitments arising from PEL/CEL that are outstanding at the date of calculation.
Provisions are calculated for each generation of mortgage savings plans (PEL), with no netting between different PEL generations, and for all mortgage saving accounts (CEL) making up a single generation.
During the deposit phase, the underlying commitment used to determine the amount to be provisioned is calculated as the difference between the average expected amount of deposits and the minimum expected amount. These two amounts are determined statistically on the basis of the historical observations of past customer behaviour.
During the lending phase, the underlying commitment to be provisioned includes loans already granted but not yet drawn at the date of calculation, and future loans that are considered statistically probable on the basis of deposits that are currently recognised in the balance sheet at the date of calculation and on the basis of historical observations of past customer behaviour.
A provision is recognised if the discounted value of expected future earnings for a given generation of PEL/CEL is negative. Earnings are estimated on the basis of interest rates available to individual customers for equivalent savings and loan products, with a similar estimated life and date of inception.
OUTSTANDING DEPOSITS IN PEL/CEL ACCOUNTS
(In EUR m) 31.12.2017 31.12.2016
PEL accounts 19,291 19,318
less than 4 years old 5,847 7,869
between 4 and 10 years old 8,344 6,483
more than 10 years old 5,100 4,966
CEL accounts 1,394 1,396
Total 20,685 20,714
OUTSTANDING HOUSING LOANS GRANTED WITH RESPECT TO PEL/CEL ACCOUNTS
(In EUR m) 31.12.2017 31.12.2016
less than 4 years old 4 9
between 4 and 10 years old 128 265
more than 10 years old 6 6
Total 138 280

6 I 2
NOTES TO THE CONSOLIDATED FINANCIAL STATEMENTS FF I N A N C I A L I N F O R M A T I O NN
372 I 2018 REGISTRATION DOCUMENT I S O C I E T E G E N E R AL E G R O U P
PROVISIONS FOR COMMITMENTS LINKED TO PEL/CEL ACCOUNTS
(In EUR m) 31.12.2016 Allocations Reversals 31.12.2017
PEL accounts 222 10 (43) 189
less than 4 years old 20 (1) 19
between 4 and 10 years old 21 10 31
more than 10 years old 181 (42) 139
CEL accounts 3 1 4
Total 225 11 (43) 193
The level of provisions is sensitive to long-term interest rates. Since long-term rates were low during 2017, the provisions for PEL and CEL mortgage savings accounts were mainly linked to the risks attached to the commitment to pay interest on the deposits. Provisioning for PEL/CEL savings amounted to 0.93% of total outstandings at 31st December 2017.
METHODS USED TO ESTABLISH PROVISION VALUATION INPUTS
The inputs used to estimate future customer behaviour are derived from historical observations of customer behaviour patterns over a long period (more than 10 years). The values of
these inputs can be adjusted whenever changes are made to regulations that may undermine the effectiveness of past data as an indicator of future customer behaviour.
The values of the different market inputs used, notably interest rates and margins, are calculated on the basis of observable data and constitute a best estimate, at the date of valuation, of the future value of these items for the period in question, in line with the retail banking division’s policy of interest rate risk management.
The discount rates used are derived from the zero coupon swaps vs. Euribor yield curve at the valuation date, averaged over a 12-month period.
4. COST OF RISK
ACCOUNTING PRINCIPLES
Cost of risk includes allocations, net of reversals, for provisions and impairments for credit risk, the amount of the loan considered uncollectible and the amount recovered on loans previously written off, as well as allocations to and reversals of provisions for other risks.
(In EUR m) 2017 2016
Counterparty risk
Net allocation to impairment losses (1,025) (1,629)
Losses not covered (182) (299)
on bad loans (151) (255)
on other risks (31) (44)
Amounts recovered 273 164
on bad loans 258 161
on other risks 15 3
Other risks
Net allocation to other provisions (415) (327)
Total (1,349) (2,091)
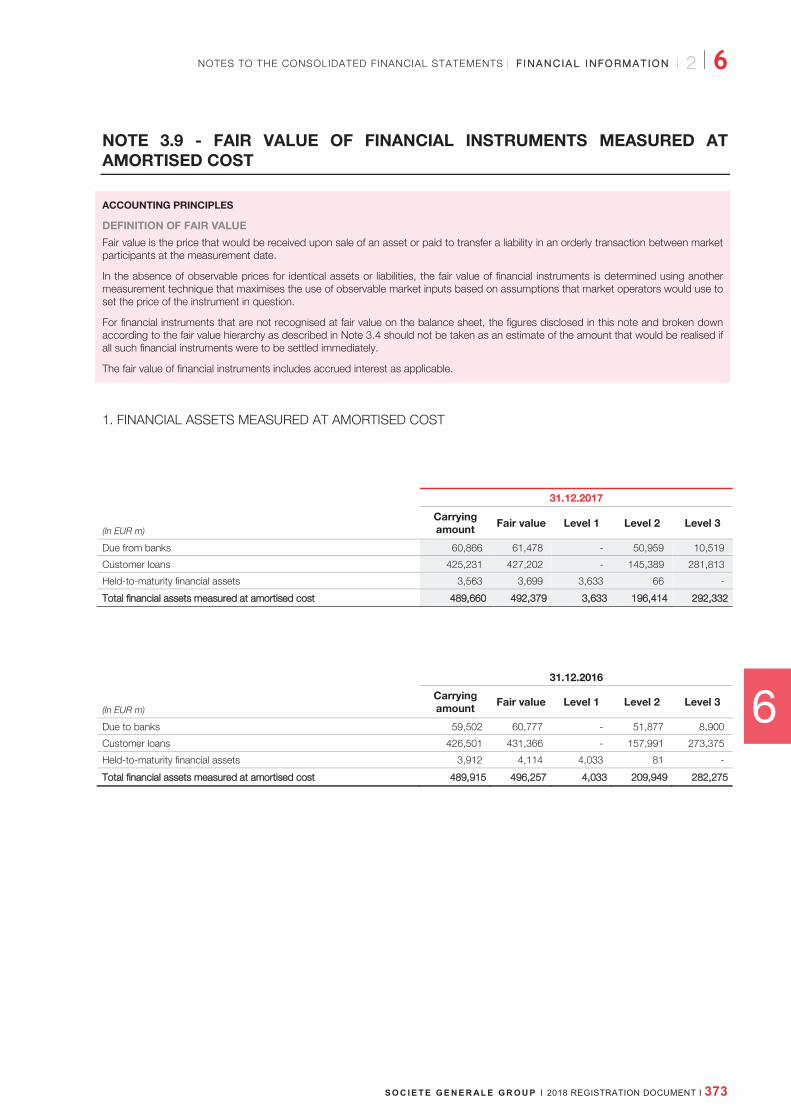
6
NOTES TO THE CONSOLIDATED FINANCIAL STATEMENTS
2 I 6FF I N A N C I A L I N F O R M A T I O NN
S O C I E T E G E N E R AL E G R O U P I 2018 REGISTRATION DOCUMENT I 373
NOTE 3.9 - FAIR VALUE OF FINANCIAL INSTRUMENTS MEASURED AT AMORTISED COST
ACCOUNTING PRINCIPLES
DEFINITION OF FAIR VALUE
Fair value is the price that would be received upon sale of an asset or paid to transfer a liability in an orderly transaction between market participants at the measurement date.
In the absence of observable prices for identical assets or liabilities, the fair value of financial instruments is determined using another measurement technique that maximises the use of observable market inputs based on assumptions that market operators would use to set the price of the instrument in question.
For financial instruments that are not recognised at fair value on the balance sheet, the figures disclosed in this note and broken down according to the fair value hierarchy as described in Note 3.4 should not be taken as an estimate of the amount that would be realised if all such financial instruments were to be settled immediately.
The fair value of financial instruments includes accrued interest as applicable.
1. FINANCIAL ASSETS MEASURED AT AMORTISED COST
31.12.2017
(In EUR m)
Carrying amount
Fair value Level 1 Level 2 Level 3
Due from banks 60,866 61,478 - 50,959 10,519
Customer loans 425,231 427,202 - 145,389 281,813
Held-to-maturity financial assets 3,563 3,699 3,633 66 -
Total financial assets measured at amortised cost 489,660 492,379 3,633 196,414 292,332
31.12.2016
(In EUR m)
Carrying amount
Fair value Level 1 Level 2 Level 3
Due to banks 59,502 60,777 - 51,877 8,900
Customer loans 426,501 431,366 - 157,991 273,375
Held-to-maturity financial assets 3,912 4,114 4,033 81 -
Total ffinancial assets measured at amortised cost 489,915 496,257 4,033 209,949 282,275
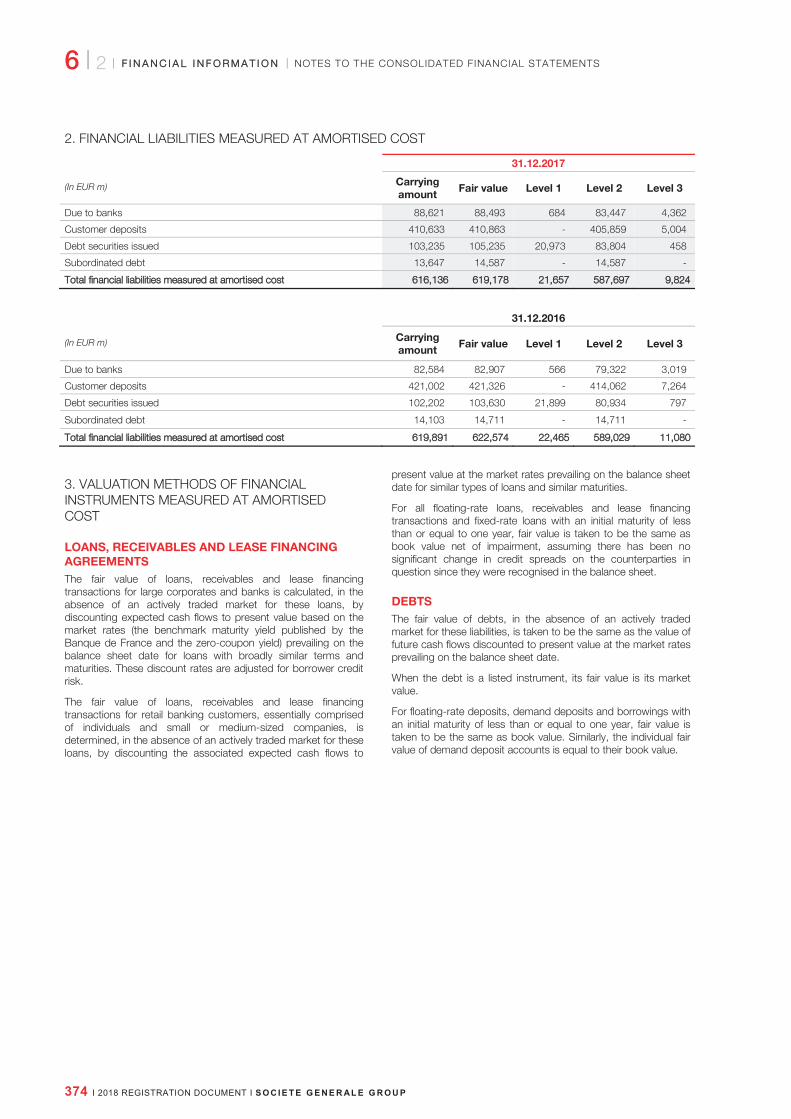
6 I 2
NOTES TO THE CONSOLIDATED FINANCIAL STATEMENTS FF I N A N C I A L I N F O R M A T I O NN
374 I 2018 REGISTRATION DOCUMENT I S O C I E T E G E N E R AL E G R O U P
2. FINANCIAL LIABILITIES MEASURED AT AMORTISED COST
31.12.2017
(In EUR m) Carrying amount
Fair value Level 1 Level 2 Level 3
Due to banks 88,621 88,493 684 83,447 4,362
Customer deposits 410,633 410,863 - 405,859 5,004
Debt securities issued 103,235 105,235 20,973 83,804 458
Subordinated debt 13,647 14,587 - 14,587 -
Total financial liabilities measured at amortised cost 616,136 619,178 21,657 587,697 9,824
31.12.2016
(In EUR m) Carrying amount
Fair value Level 1 Level 2 Level 3
Due to banks 82,584 82,907 566 79,322 3,019
Customer deposits 421,002 421,326 - 414,062 7,264
Debt securities issued 102,202 103,630 21,899 80,934 797
Subordinated debt 14,103 14,711 - 14,711 -
Total financial liabilities measured at amortised cost 619,891 622,574 22,465 589,029 11,080
3. VALUATION METHODS OF FINANCIAL INSTRUMENTS MEASURED AT AMORTISED COST
LOANS, RECEIVABLES AND LEASE FINANCING AGREEMENTS
The fair value of loans, receivables and lease financing transactions for large corporates and banks is calculated, in the absence of an actively traded market for these loans, by discounting expected cash flows to present value based on the market rates (the benchmark maturity yield published by the Banque de France and the zero-coupon yield) prevailing on the balance sheet date for loans with broadly similar terms and maturities. These discount rates are adjusted for borrower credit risk.
The fair value of loans, receivables and lease financing transactions for retail banking customers, essentially comprised of individuals and small or medium-sized companies, is determined, in the absence of an actively traded market for these loans, by discounting the associated expected cash flows to
present value at the market rates prevailing on the balance sheet date for similar types of loans and similar maturities.
For all floating-rate loans, receivables and lease financing transactions and fixed-rate loans with an initial maturity of less than or equal to one year, fair value is taken to be the same as book value net of impairment, assuming there has been no significant change in credit spreads on the counterparties in question since they were recognised in the balance sheet.
DEBTS
The fair value of debts, in the absence of an actively traded market for these liabilities, is taken to be the same as the value of future cash flows discounted to present value at the market rates prevailing on the balance sheet date.
When the debt is a listed instrument, its fair value is its market value.
For floating-rate deposits, demand deposits and borrowings with an initial maturity of less than or equal to one year, fair value is taken to be the same as book value. Similarly, the individual fair value of demand deposit accounts is equal to their book value.

6
NOTES TO THE CONSOLIDATED FINANCIAL STATEMENTS
2 I 6FF I N A N C I A L I N F O R M A T I O NN
S O C I E T E G E N E R AL E G R O U P I 2018 REGISTRATION DOCUMENT I 375
NOTE 3.10 - COMMITMENTS AND ASSETS PLEDGED AND RECEIVED AS SECURITIES
ACCOUNTING PRINCIPLES
LOAN COMMITMENTS
Loan commitments that are not considered as financial derivatives are initially recognised at fair value. Thereafter, provided they are not granted or received for trading purposes and thus measured at fair value through profit or loss, they are provisioned as necessary in accordance with the accounting principles for Provisions (see Note 3.8).
GUARANTEE COMMITMENTS
When considered as non-derivative financial instruments, financial guarantees issued by the Group are initially recognised in the balance sheet at fair value. Thereafter, they are measured at either the amount of the obligation or the amount initially recognised (whichever is higher) less, when appropriate, the cumulative amortisation of a guarantee commission. Where there is objective evidence of impairment, a provision for financial guarantees given is recognised on the liabilities side of the balance sheet (see Note 3.8).
SECURITIES COMMITMENTS
Securities bought and sold, which are booked to Financial assets at fair value through profit or loss, Held-to-maturity financial assets and Available-for-sale financial assets, are recognised on the balance sheet at the settlement-delivery date. Between the trade date and the settlement-delivery date, securities receivable or deliverable are not recognised on the balance sheet. Changes in the fair value of securities measured at fair value through profit or loss and available-for-sale securities between the trade date and the settlement-delivery date are booked to profit or loss or equity, depending on the accounting classification of the securities in question.
1. COMMITMENTS
COMMITMENTS GRANTED
(In EUR m) 31.12.2017 31.12.2016
Loan commitments
To banks 21,983 23,438
To customers 180,004 159,382
Issuance facilities - -
Confirmed credit lines 168,874 155,859
Others 11,130 3,523
Guarantee commitments
On behalf of banks 6,641 9,290
On behalf of customers(1) 61,024 59,614
Securities commitments
Securities to be delivered 25,711 31,063
(1) Including capital and performance guarantees given to the holders of UCITS managed by entities of the Group.
COMMITMENTS RECEIVED
(In EUR m) 31.12.2017 31.12.2016
Loan commitments
From banks 52,222 73,141
Guarantee commitments
From banks 91,742 108,647
Other commitments(1) 126,409 112,500
Securities commitments
Securities to be received 26,958 34,478
(1) Including guarantees granted by government and official agencies and other guarantees granted by customers for EUR 62,394 million at 31st December 2017 versus EUR 47,642 million at 31st December 2016.

6 I 2
NOTES TO THE CONSOLIDATED FINANCIAL STATEMENTS FF I N A N C I A L I N F O R M A T I O NN
376 I 2018 REGISTRATION DOCUMENT I S O C I E T E G E N E R AL E G R O U P
2. FINANCIAL ASSETS PLEDGED AND RECEIVED AS SECURITY
FINANCIAL ASSETS PLEDGED
(In EUR m) 31.12.2017 31.12.2016
Book value of assets pledged as security for liabilities(1) 316,565 252,338
Book value of assets pledged as security for transactions in financial instruments(2) 45,291 57,149
Book value of assets pledged as security for off-balance sheet commitments 2,515 783
Total 364,371 310,270
(1) Assets pledged as security for liabilities mainly include loans given as guarantees for liabilities (guarantees notably provided to the central banks). (2) Assets pledged as security for transactions in financial instruments mainly include security deposit.
FINANCIAL ASSETS RECEIVED AS SECURITY AND AVAILABLE FOR THE ENTITY
(In EUR m) 31.12.2017 31.12.2016
Fair value of securities purchased under resale agreements 138,956 189,144
The Group generally purchases securities under resale agreements under normal market terms and conditions. It may re-use the securities received under resale agreement by selling them outright, selling them under repurchase agreements or pledging them as security, provided that it returns these or equivalent securities to the counterparty to the resale agreement at its term. Securities purchased under resale agreements are not recognised on the balance sheet. Their fair value, as shown above, includes securities sold or pledged as collateral.

6
NOTES TO THE CONSOLIDATED FINANCIAL STATEMENTS
2 I 6FF I N A N C I A L I N F O R M A T I O NN
S O C I E T E G E N E R AL E G R O U P I 2018 REGISTRATION DOCUMENT I 377
NOTE 3.11 - TRANSFERRED FINANCIAL ASSETS
ACCOUNTING PRINCIPLES
Transferred financial assets that are not derecognised include securities lending transactions and repurchase agreements, as well as certain loans transferred to consolidated securitisation vehicles.
The tables below show securities lending and repurchase agreements that only concern securities recognised on the asset side of the balance sheet.
Securities involved in a repurchase agreement or securities lending transaction are held in their original position on the asset side of the Group’s balance sheet. For repurchase agreements, the obligation to return the amounts deposited is recorded under Liabilities on the liabilities side of the balance sheet, with the exception of transactions initiated under trading activities, which are recorded under Financial liabilities at fair value through profit or loss.
Securities involved in a reverse repurchase agreement or securities borrowing transaction are not recorded in the Group’s balance sheet. However, in the event the borrowed securities are subsequently sold, a debt representing the return of these securities to their lender is recorded on the liabilities side of the Group’s balance sheet, under Financial liabilities at fair value through profit or loss. For securities received under a reverse repurchase agreement, the right to recover the amounts delivered by the Group is recorded under Loans and receivables on the asset side of the balance sheet, with the exception of transactions initiated under trading activities, which are recorded under Financial assets at fair value through profit or loss.
Securities lending and securities borrowing transactions that are fully matched by cash are assimilated to repurchase and reverse repurchase agreements and are recorded and recognised as such in the balance sheet.
With securities lending and repurchase agreements, the Group remains exposed to issuer default (credit risk) and to increases or decreases of securities value (market risk). The underlying securities cannot simultaneously be used as collateral in other transactions.
1. TRANSFERRED FINANCIAL ASSETS NOT DERECOGNISED
REPURCHASE AGREEMENTS
31.12.2017 31.12.2016
(In EUR m) Carrying amount of transferred assets
Carrying amount of associated liabilities
Carrying amount of transferred assets
Carrying amount of associated liabilities
Customer / interbank loans 45 45
Available-for-sale securities 14,771 12,743 16,224 13,742
Securities at fair value through profit or loss 24,586 21,143 20,148 17,892
Total 39,402 33,931 36,372 31,634
SECURITIES LENDING
31.12.2017 31.12.2016
(In EUR m) Carrying amount of transferred assets
Carrying amount of associated liabilities
Carrying amount of transferred assets
Carrying amount of associated liabilities
Securities at fair value through profit or loss* 15,793 - 12,920 3
* Amounts restated relative to the financial statements published at 31st December 2016.

6 I 2
NOTES TO THE CONSOLIDATED FINANCIAL STATEMENTS FF I N A N C I A L I N F O R M A T I O NN
378 I 2018 REGISTRATION DOCUMENT I S O C I E T E G E N E R AL E G R O U P
SECURITISATION ASSETS FOR WHICH THE COUNTERPARTIES TO THE ASSOCIATED LIABILITIES HAVE RECOURSE ONLY TO THE TRANSFERRED ASSETS
Customer loans (In EUR m) 31.12.2017 31.12.2016
Carrying amount of transferred assets 904 1,558
Carrying amount of associated liabilities 798 1,385
Fair value of transferred assets (A) 908 1,562
Fair value of associated liabilities (B) 801 1,389
Net position (A)-(B) 107 173
The Group remains exposed to the majority of the risks and rewards associated with these receivables; furthermore, these receivables may not be used as collateral or sold outright as part of another transaction.
2. TRANSFERRED FINANCIAL ASSETS PARTIALLY OR FULLY DERECOGNISED
At 31st December 2017, the Group carried out no material transactions resulting in the partial or full derecognition of financial assets leaving the Group with a continuous involvement in said assets.

6
NOTES TO THE CONSOLIDATED FINANCIAL STATEMENTS
2 I 6FF I N A N C I A L I N F O R M A T I O NN
S O C I E T E G E N E R AL E G R O U P I 2018 REGISTRATION DOCUMENT I 379
NOTE 3.12 - OFFSETTING FINANCIAL ASSETS AND FINANCIAL LIABILITIES
ACCOUNTING PRINCIPLES
A financial asset and a financial liability are offset and the net amount presented on the balance sheet when the Group has a legally enforceable right to set off the recognised amounts and intends either to settle the asset and liability on a net basis, or to realise the asset and settle the liability simultaneously. The legal right to set off the recognised amounts must be enforceable in all circumstances, in both the normal course of business and in the event of default of one of the counterparties. In this respect, the Group recognises in its balance sheet the net amount of derivative financial instruments traded with certain clearing houses where they achieve net settlement through a daily cash margining process, or where their gross settlement system has features that eliminate or result in insignificant credit and liquidity risk, and that process receivables and payables in a single settlement process or cycle.
The following tables present the amounts of financial assets and financial liabilities set off on the Group’s consolidated balance sheet. The gross outstanding amounts of these financial assets and financial liabilities are matched with the consolidated outstanding amounts presented in the balance sheet (net balance sheet amounts), after indicating the amounts set off on the balance sheet for these various instruments (amounts offset) and aggregating them with the outstanding amounts of other financial assets and financial liabilities not subject to a Master Netting Agreement or similar agreement (amounts of assets and liabilities not eligible for offsetting).
These tables also indicate the amounts which may be offset, as they are subject to a Master Netting Agreement or similar agreement, but whose characteristics make them ineligible for
offsetting in the consolidated financial statements under IFRS. This information is provided in comparison with the accounting treatment applied under US GAAP. This affects in particular financial instruments that may only be offset in the event of the default, insolvency or bankruptcy of one of the counterparties, as well as instruments pledged by cash or securities collateral. These mainly include over-the-counter interest rate options, interest rate swaps and securities purchased/sold under resale/repurchase agreements.
Net positions resulting from these various offsettings are not intended to represent the Group’s actual exposure to counterparty risk through these financial instruments, insofar as counterparty risk management uses other risk mitigation strategies in addition to netting and collateral agreements.

6 I 2
NOTES TO THE CONSOLIDATED FINANCIAL STATEMENTS FF I N A N C I A L I N F O R M A T I O NN
380 I 2018 REGISTRATION DOCUMENT I S O C I E T E G E N E R AL E G R O U P
1. AT 31ST DECEMBER 2017
During this year the Group has performed a detailed review of the netting contractual agreements related to securities purchased/sold under resale/repurchase agreements, and the operational processes to settle receivables and debts incurred under these operations have been updated. Such work enabled to increase the amounts set off on the balance sheet for these instruments with the same counterparty (Securities purchased under resale agreements on the assets side, Securities sold under repurchase agreements on the liabilities side).
ASSETS
Impact of offsetting
on the balance sheet Impact of Master Netting Agreements (MNA)
and similar agreements(1)
(In EUR m)
Amount of assets not subject to offsetting
Gross amount
Amount offset
Net amount presented on the balance
sheet
Financial instruments
recognised in the balance
sheet
Cash collateral received
Financial instruments received as collateral
Net amount
Derivative financial instruments (see Note 3.2)
30,291 182,376 (64,576) 148,091 (93,223) (13,429) (1) 41,438
Securities lent (see Notes 3.1 and 3.3)
2,534 13,782 - 16,316 (12,028) - - 4,288
Securities purchased under resale agreements (see Notes 3.1 and 3.5)
41,458 168,163 (70,659) 138,962 (34,145) (204) (51,164) 53,449
Guarantee deposits pledged (see Note 4.4)
28,650 12,334 - 40,984 - (12,334) - 28,650
Other assets not subject to offsetting
930,775 - - 930,775 - - - 930,775
Total assets 1,033,708 376,655 (135,235) 1,275,128 (139,396) (25,967) (51,165) 1,058,600
LIABILITIES
Impact of offsetting
on the balance sheet Impact of Master Netting Agreements
(MNA) and similar agreements(1)
(In EUR m)
Amount of assets not subject to offsetting
Gross amount
Amount offset
Net amount presented on the balance
sheet
Financial instruments recognised
in the balance sheet
Cash collateral pledged
Financial instruments pledged as collateral
Net amount
Derivative financial instruments (see Notes 3.1 and 3.2)
31,915 181,935 (64,576) 149,274 (93,223) (12,334) - 43,717
Amount payable on borrowed securities (see Note 3.1)
17,486 17,358 - 34,844 (12,028) - - 22,816
Securities sold under repurchase agreements (see Notes 3.1 and 3.6)
50,646 148,406 (70,659) 128,393 (34,145) - (17,620) 76,628
Guarantee deposits received (see Note 4.4)
25,484 13,633 - 39,117 - (13,633) - 25,484
Other liabilities not subject to offsetting
859,463 - - 859,463 - - - 859,463
Total liabilities 9884,9994 361,332 (1335,2235) 1,211,091 (139,396) (25,967) (117,6620) 1,0228,1108
(1) Fair value of financial instruments and collateral, capped at the net book value of the balance sheet exposure, so as to avoid any over-collateralisation effect.

6
NOTES TO THE CONSOLIDATED FINANCIAL STATEMENTS
2 I 6FF I N A N C I A L I N F O R M A T I O NN
S O C I E T E G E N E R AL E G R O U P I 2018 REGISTRATION DOCUMENT I 381
2. AT 31ST DECEMBER 2016
ASSETS
Amount of assets not subject to offsetting
Impact of offsetting on the balance sheet
Impact of Master Netting Agreements (MNA) and similar agreements(1)
(In EUR m)
Gross amount
Amount offset
Net amount presented on the balance
sheet
Financial
instruments recognised
in the balance sheet
Cash collateral received
Financial instruments received as collateral
Net amount
Derivative financial instruments (see Note 3.2) *
33,378 249,157 (96,431) 186,104 (121,894) (16,780) (12) 47,418
Securities lent (see Notes 3.1 and 3.3)
2,913 10,421 - 13,334 (6,298) (10) - 7,026
Securities purchased under resale agreements (see Notes 3.1 and 3.5) **
46,190 180,216 (37,281) 189,125 (42,884) (473) (88,700) 57,068
Guarantee deposits pledged (see Note 4.4)
31,728 17,017 - 48,745 - (17,017) - 31,728
Other assets not subject to offsetting *
917,114 - - 917,114 - - - 917,114
Total assets 1,0031,3323 456,811 (1333,7712) 1,354,422 (171,076) (34,280) (888,7712) 1,0660,3354
LIABILITIES
Amount of liabilities
not subject to offsetting
Impact of offsetting on the balance sheet
Impact of Master Netting Agreements (MNA) and similar agreements(1)
(In EUR m)
Gross amount
Amount offset
Net amount presented on the balance
sheet
Financial instruments recognised
in the balance sheet
Cash collateral pledged
Financial instruments pledged as collateral
Net amount
Derivative financial instruments (see Note 3.2) *
30,866 248,297 (96,431) 182,732 (121,894) (16,952) (446) 43,440
Amount payable on borrowed securities (see Note 3.1)
29,085 15,570 - 44,655 (6,298) - (2) 38,355
Securities sold under repurchase agreements (see Notes 3.1 and 3.6) **
56,061 136,445 (37,281) 155,225 (42,884) (65) (37,975) 74,301
Guarantee deposits received (see Note 4.4)
33,115 17,263 - 50,378 - (17,263) - 33,115
Other liabilities not subject to offsetting *
855,726 - - 855,726 - - - 855,726
Total liabilities 1,004,,853 417,575 (1333,7712) 1,288,716 (171,076) (34,280) (338,4423) 1,0444,9937
* Amounts restated compared to the 31st December 2016 consolidated financial statements, following a change in the balance sheet presentation of premiums to be received / to be paid on options (see Note 3).
** Amounts restated compared to the 31st December 2016 consolidated financial statements. (1) Fair value of financial instruments and collateral, capped at the net book value of the balance sheet exposure, so as to avoid any over-collateralisation
effect.
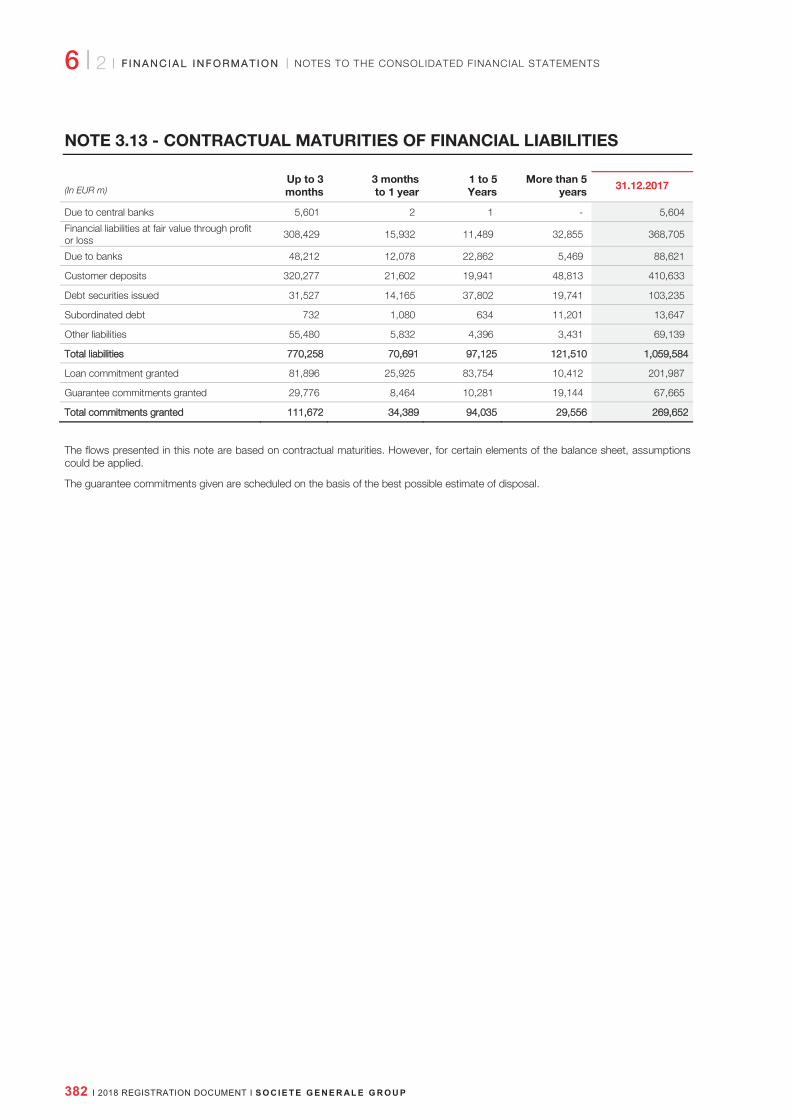
6 I 2
NOTES TO THE CONSOLIDATED FINANCIAL STATEMENTS FF I N A N C I A L I N F O R M A T I O NN
382 I 2018 REGISTRATION DOCUMENT I S O C I E T E G E N E R AL E G R O U P
NOTE 3.13 - CONTRACTUAL MATURITIES OF FINANCIAL LIABILITIES
(In EUR m) Up to 3 months
3 months to 1 year
1 to 5 Years
More than 5 years
31.12.2017
Due to central banks 5,601 2 1 - 5,604
Financial liabilities at fair value through profit or loss
308,429 15,932 11,489 32,855 368,705
Due to banks 48,212 12,078 22,862 5,469 88,621
Customer deposits 320,277 21,602 19,941 48,813 410,633
Debt securities issued 31,527 14,165 37,802 19,741 103,235
Subordinated debt 732 1,080 634 11,201 13,647
Other liabilities 55,480 5,832 4,396 3,431 69,139
Total liabilities 770,258 70,691 97,125 121,510 1,059,584
Loan commitment granted 81,896 25,925 83,754 10,412 201,987
Guarantee commitments granted 29,776 8,464 10,281 19,144 67,665
Total commitments ggranted 111,672 34,389 94,035 29,556 269,652
The flows presented in this note are based on contractual maturities. However, for certain elements of the balance sheet, assumptions could be applied.
The guarantee commitments given are scheduled on the basis of the best possible estimate of disposal.

6
NOTES TO THE CONSOLIDATED FINANCIAL STATEMENTS
2 I 6FF I N A N C I A L I N F O R M A T I O NN
S O C I E T E G E N E R AL E G R O U P I 2018 REGISTRATION DOCUMENT I 383
NOTE 4 - OTHER ACTIVITIES
NOTE 4.1 - FEE INCOME AND EXPENSE
ACCOUNTING PRINCIPLES
Fee income and Fee expense combine fees on services rendered and received, as well as fees on commitments, that cannot be assimilated to interest. Fees that can be assimilated to interest are integrated into the effective interest rate on the associated financial instrument and are recorded under Interest and similar income and Interest and similar expense (see Note 3.7).
The Group recognises fee income and expense for services provided and received in different ways depending on the type of service:
fees for ongoing services, such as some payment services, custody fees, or digital service subscriptions, are recognised as income over the life of the service;
fees for one-off services, such as fund activity, finder’s fees received, arbitrage fees, or penalties on payment incidents, are recognised as income when the service is provided.
In syndication deals, the effective interest rate for the share of the issuance retained on the Group’s balance sheet is comparable to that applied to the other members of the syndicate including, when needed, a share of the underwriting fees and participation fees; the balance of these fees for services rendered is then recorded under Fee income at the end of the syndication period. Arrangement fees are recorded as income when the placement is legally complete.
2017 2016
(In EUR m) Income Expense Net Income Expense Net
Transactions with banks 133 (168) (35) 128 (120) 8
Transactions with customers 2,971 - 2,971 2,661 - 2,661
Financial instruments operations 2,416 (2,240) 176 2,412 (2,139) 273
Securities transactions 596 (959) (363) 601 (814) (213)
Primary market transactions 208 - 208 227 - 227
Foreign exchange transactions and financial derivatives 1,612 (1,281) 331 1,584 (1,325) 259
Loan and guarantee commitments 748 (62) 686 745 (79) 666
Services 3,934 - 3,934 3,886 - 3,886
Others 302 (1,211) (909) 284 (1,079) (795)
Total 10,504 (3,681) 6,823 10,116 (3,417) 6,699
Fee income and expense include:
(In EUR m) 2017 2016
Fee income excluding the effective interest rate linked to financial instruments which are not booked at fair value through profit or loss
4,041 3,752
Fee income linked to trust or similar fiduciary activities 2,258 2,033
Fee expense excluding the effective interest rate linked to financial instruments which are not booked at fair value through profit or loss
(62) (79)
Fee expense linked to trust or similar fiduciary activities (1,396) (1,189)

6 I 2
NOTES TO THE CONSOLIDATED FINANCIAL STATEMENTS FF I N A N C I A L I N F O R M A T I O NN
384 I 2018 REGISTRATION DOCUMENT I S O C I E T E G E N E R AL E G R O U P
NOTE 4.2 - INCOME AND EXPENSE FROM OTHER ACTIVITIES
ACCOUNTING PRINCIPLES
LEASING ACTIVITIES
Leases granted by the Group which do not transfer to the lessee virtually all the risks and benefits associated with ownership of the leased asset are classified as operating leases.
Assets held under operating leases, including investment property, are recorded on the balance sheet under Tangible and intangible fixed assets at their acquisition cost, less depreciation and impairment (see Note 8.4).
Leased assets are depreciated, excluding residual value, over the life of the lease. Lease payments are recognised as income according to the straight-line method over the term of the lease. Meanwhile, the purpose of the accounting treatment of income invoiced in respect of maintenance services related to operating lease activities is to reflect a constant margin between this income and the expenses incurred in providing the service over the term of the service agreement.
Income and expenses, and capital gains or losses on investment properties and leased assets, are recorded under Income and expenses from other activities on the Real estate leasing and Equipment leasing lines, as well as income and expense on maintenance services related to operating lease activities.
These lines also include losses incurred in the event of a decline in the unguaranteed residual value of finance-lease transactions, and capital gains or losses on disposal related to unleased assets once the lease finance agreements are terminated.
OTHER ACTIVITIES
The accounting principles applied by the Group to insurance activities are presented in Note 4.3.
2017 2016
(In EUR m) Income Expense Net Income Expense Net
Real estate development 93 (4) 89 96 (3) 993
Real estate leasing 67 (68) (1) 83 (59) 224
Equipment leasing 9,158 (6,447) 2,711 8,309 (5,770) 22,539
Other activities* 12,727 (14,637) (1,910) 12,292 (12,959) ((667)
o.w. Insurance activities 12,346 (12,052) 294 11,685 (11,391) 294
Total 22,045 (21,156) 889 20,780 (18,791) 1,989
* For 2017, the Expenses from other activities include EUR 963 million, the exchange value of GBP 813.26 million, in compensation for the settlement agreement between Societe Generale and the Libyan Investment Authority.

6
NOTES TO THE CONSOLIDATED FINANCIAL STATEMENTS
2 I 6FF I N A N C I A L I N F O R M A T I O NN
S O C I E T E G E N E R AL E G R O U P I 2018 REGISTRATION DOCUMENT I 385
NOTE 4.3 - INSURANCE ACTIVITIES
MAKING IT
SIMPLE
Insurance activities (life insurance, personal protection and non-life insurance) add to the range of products included in the banking services offered to Group customers.
These activities are carried out by dedicated subsidiaries, subject to regulations specific to the insurance sector.
The rules for measuring and accounting for risks associated with insurance contracts are specific to the Insurance sector as well as the presentation of income and expenses on the Group’s insurance activities that are disclosed in this note and which are classified on the basis of their function.
ACCOUNTING PRINCIPLES
FINANCIAL ASSETS AND LIABILITIES
The financial assets and liabilities of the Group’s insurance companies are recognised and measured according to the rules governing financial instruments explained in Note 3.
UNDERWRITING RESERVES OF INSURANCE COMPANIES
Underwriting reserves correspond to the commitments of insurance companies with respect to policyholders and the beneficiaries of policies.
In accordance with IFRS 4 on insurance policies, life and non-life underwriting reserves continue to be measured under the same local regulations.
Risks covered by life insurance policies are principally death, invalidity and incapacity for work. Life insurance underwriting reserves mainly comprise actuarial reserves, which correspond to the difference between the present value of commitments falling to the insurer and those falling to the policyholder, and the reserve for claims incurred but not settled.
Underwriting reserves for unit-linked policies with discretionary profit-sharing or any other significant feature (mortality, invalidity, etc.) are measured at the balance sheet date on the basis of the market value of the assets underlying these policies.
Risks covered by non-life insurance policies are principally linked to home, car and accident protection guarantees. Underwriting reserves comprise reserves for unearned premiums (share of premium income relating to subsequent financial years) and for outstanding claims.
Under the principles defined in IFRS 4, and in compliance with local regulations applicable with respect thereto, life insurance policies with discretionary profit-sharing features are subject to “mirror accounting”, whereby any changes in the value of financial assets liable to affect policyholders are recorded in Deferred profit-sharing. This reserve is calculated to reflect the potential rights of policyholders to unrealised gains on financial instruments measured at fair value or their potential share of unrealised losses.
To demonstrate the recoverability of the deferred profit-sharing asset in the event of an unrealised net loss, two approaches are verified by the Group in order to show that the liquidity requirements caused by an unfavourable approach economic environment would not require assets to be sold in the event of unrealised losses:
the first approach consists in simulating deterministic (“standardised” or extreme) stress scenarios. This is used to show that in these scenarios no significant losses would be realised on the assets existing at the balance sheet date for the scenarios tested;
the aim of the second approach is to ensure that in the long or medium term, the sale of assets to meet liquidity needs would not generate any significant losses. The approach is verified considering projections based on extreme scenarios;
a liability adequacy test is also carried out quarterly using a stochastic model based on parameter assumptions consistent with those used for the MCEV (Market Consistent Embedded Value). This test takes into account all of the future cash flows from policies, including management charges, fees and policy options and guarantees.
INCOME AND EXPENSES
Income and expenses related to insurance policies issued by Group insurance companies are recognised in the income statement under Income and expenses from other activities. Other income and expenses are recorded under the related headings. Changes in provisions for deferred profit-sharing are booked to the income statement or to Unrealised or deferred gains or losses under the headings related to the associated underlying assets.
IIFRS 4
Until 1sst JJanuary 2021, the Group’s insurance subsidiaries will continue to apply IAS 39 “Financial Instruments – Recognition and Measurement” as they will defer the application of IFRS 9 “Financial Instruments” as allowed by the European Regulation 1606/2002 (see Note 1).

6 I 2
NOTES TO THE CONSOLIDATED FINANCIAL STATEMENTS FF I N A N C I A L I N F O R M A T I O NN
386 I 2018 REGISTRATION DOCUMENT I S O C I E T E G E N E R AL E G R O U P
1. BREAKDOWN OF UNDERWRITING RESERVES
1. UNDERWRITING RESERVES OF INSURANCE COMPANIES
(In EUR m) 31.12.2017 31.12.2016
Underwriting reserves for unit-linked policies 29,643 22,449
Life insurance underwriting reserves 89,563 79,705
Non-life insurance underwriting reserves 1,332 1,262
Deferred profit-sharing booked in liabilities 10,420 9,361
Unnderwriting reserves of insurance companies 130,958 112,777
Attributable to reinsurers (731) (274)
Underwriting reserves of insurance companies (including provisions for deferred pprofit-ssharing) net of the share attributable to reinsurers 130,227 112,503
STATEMENT OF CHANGES IN UNDERWRITING RESERVES
(In EUR m)
Underwriting reserves for unit-
linked policies
Life insurance underwriting reserves
Non-life insurance
underwriting reserves
Reserves at 11st January 2017 (except provisions for deferred profit--sharing) 22,449 79,705 1,262
Allocation to insurance reserves 1,860 (836) 66
Revaluation of unit-linked policies 879 - -
Charges deducted from unit-linked policies (162) - -
Transfers and allocation adjustments 1,276 (1,278) -
New customers 3,184 10,688 19
Profit-sharing 140 1,238 -
Others 17 46 (15)
Reserves at 31sst DDecember 22017 (except provisions for deferred profit--sharing) 29,643 89,563 1,332
In accordance with IFRS 4 and Group accounting standards, the Liability Adequacy Test (LAT) was performed on 31st December 2017. This test assesses whether recognised insurance liabilities are adequate, using current estimates of future cash flows under
insurance policies. It is carried out on the basis of stochastic models similar to those used for asset/liability management. The result of the test on 31st December 2017 was conclusive.
UNDERWRITING RESERVES BY REMAINING MATURITY
(In EUR m) Up to 3 months
3 months to 1 year
1 to 5 years
More than 5 years
31.12.2017
Underwriting reserves of insurance companies 14,204 8,717 33,841 74,196 130,958

6
NOTES TO THE CONSOLIDATED FINANCIAL STATEMENTS
2 I 6FF I N A N C I A L I N F O R M A T I O NN
S O C I E T E G E N E R AL E G R O U P I 2018 REGISTRATION DOCUMENT I 387
2. NET INVESTMENTS OF INSURANCE COMPANIES
(In EUR m before elimination of intercompany transactions) 31.12.2017 31.12.2016
Financial assets at fair value through pprofit or lloss 55,398 44,906
Debt instruments 27,374 26,016
Equity instruments 28,024 18,890
Due from bbanks 9,195 9,738
Available--for--sale financial assets 86,509 77,758
Debt instruments 72,973 65,554
Equity instruments 13,536 12,204
Investment property 618 576
Total((1) 151,720 132,978
(1) Investments in other Group companies that are made in representation of unit-linked liabilities are kept in the Group’s consolidated balance sheet without any significant impact thereon.
3. BREAKDOWN OF UNREALISED GAINS AND LOSSES ON AVAILABLE-FOR-SALE ASSETS
31.12.2017
(In EUR m) Unrealised gains Unrealised losses Net revaluation
Unrealised gains and losses of insurance subsidiaries 438 (27) 411
on available-for-sale equity instruments 1,537 (38) 1,499
on available-for-sale debt instruments and assets reclassified as Loans and receivables 7,748 (327) 7,421
Deferred profit-sharing (8,847) 338 (8,509)
31.12.2016
(In EUR m) Unrealised gains Unrealised losses Net revaluation
Unrealised gains and losses of insurance subsidiaries 698 (198) 500
on available-for-sale equity instruments 1,177 (147) 1,030
on available-for-sale debt instruments and assets reclassified as Loans and receivables 8,582 (405) 8,177
Deferred profit-sharing (9,061) 354 (8,707)
4. UNDERWRITING INCOME OF INSURANCE COMPANIES
(In EUR m) 2017 2016
Written premiums 11,466 11,292
Cost of benefits (including changes in reserves) (11,221) (10,438)
Net income from investments 4,330 3,153
Other net technical income (expense) (3,592) (3,179)
Contribution to operating income before elimination of intercompany ttransactions
983 828
Elimination of intercompany transactions(1) 774 326
Contribution to operating iincome after elimination of intercompany transactions 1,757 1,154
(1) This essentially concerns the elimination of fees paid by the insurance companies to the distribution networks and the elimination of financial income on investments made in other Group companies.

6 I 2
NOTES TO THE CONSOLIDATED FINANCIAL STATEMENTS FF I N A N C I A L I N F O R M A T I O NN
388 I 2018 REGISTRATION DOCUMENT I S O C I E T E G E N E R AL E G R O U P
5. NET FEE INCOME
(In EUR m before elimination of intercompany transactions) 2017 2016
Fees rreceived
Acquisition fees 696 603
Management fees 950 785
Others 40 37
Fees ppaid
Acquisition fees (635) (549)
Management fees (416) (396)
Others (64) (30)
Total feees 571 450
6. MANAGEMENT OF INSURANCE RISKS
There are two main types of insurance risks:
underwriting risks, particularly risk through life insurance, individual personal protection and non-life insurance. This risk can be biometrical: disability, longevity, mortality, or related to policyholders’ behaviour (risk of lapses). To a lesser extent, the Insurance business line is also exposed to non-life and health risks. Such risks can come from pricing, selection, claims management or catastrophic risk;
risks related to financial markets and ALM: the Insurance business line, mainly through life insurance, is exposed to instabilities on the financial markets (changes in interest rates and stock market fluctuations) which can be made worse by policyholder behaviour.
Management of these risks is key to the Insurance business line’s activity. It is carried out by qualified and experienced teams, with major bespoke IT resources. Risks undergo regular monitoring and are reported to the General Management of both the entities concerned and the business lines.
Risk management techniques are based on the following:
heightened security for the risk acceptance process, with the aim of guaranteeing that the price schedule matches the policyholder’s risk profile and the guarantees provided;
regular monitoring of indicators on product claims rates in order to adjust certain product parameters, such as pricing or the level of guarantee, if necessary;
implementation of a reinsurance plan to protect the business line from major/serial claims;
application of policies on risk, provisioning and reinsurance.
Management of risks linked to the financial markets and to ALM is an integral part of the investment strategy just like objectives on long-term performance. The optimisation of these two factors is highly influenced by the asset/liability balance. Liability commitments (guarantees offered to customers, maturity of policies), as well as the amounts booked under the major items on the balance sheet (shareholders’ equity, income, provisions, reserves, etc.) are analysed by the Finance and Risk Department of the insurance business line. Societe Generale’s overall asset and liability management policy is validated by the Group’s General Management at the ALM Committee meetings held every six months.
Risk management related to financial markets (interest rates, credit and shares) and to ALM is based on the following:
monitoring short and long-term cash flows (match between the term of a liability and the term of an asset, liquidity risk management);
particular monitoring of policyholder behaviour (redemption);
close monitoring of financial markets;
hedging of exchange rate risks (both rising and falling);
defining thresholds and limits per counterparty, per rating issuer and per category of assets;
stress tests, the results of which are presented annually at entities’ Board of Directors’ meetings, as part of the ORSA report (Own Risk and Solvency Assessment), transferred to the ACPR after approval by the Board;
application of policies related to ALM and investment risks.

6
NOTES TO THE CONSOLIDATED FINANCIAL STATEMENTS
2 I 6FF I N A N C I A L I N F O R M A T I O NN
S O C I E T E G E N E R AL E G R O U P I 2018 REGISTRATION DOCUMENT I 389
NOTE 4.4 - OTHER ASSETS AND LIABILITIES
1. OTHER ASSETS
(In EUR m) 31.12.2017 31.12.2016
Guarantee deposits paid(1) 40,984 48,745
Settlement accounts on securities transactions 7,436 8,353
Prepaid expenses 989 775
Miscellaneous receivables* 10,378 13,011
Miscellaneous receivables - Insurance 1,033 807
Gross amount 60,820 71,691
Impairment (258) (254)
Net amount 60,562 71,437
* Amounts restated compared to the 31st December 2016 consolidated financial statements, following a change in the balance sheet presentation of premiums to be received / to be paid on options (see Note 3).
(1) Mainly relates to guarantee deposits paid on financial instruments, their fair value is taken to be the same as their book value net of depreciation for incurred credit risk.
2. OTHER LIABILITIES
(In EUR m) 31.12.2017 31.12.2016
Guarantee deposits received(1) 39,117 50,378
Settlement accounts on securities transactions 6,816 7,359
Expenses payable on employee benefits 2,542 2,560
Deferred income 1,633 1,642
Miscellaneous payables* 13,314 15,842
Miscellaneous payables - Insurance 5,717 4,112
Total 69,139 81,893
* Amounts restated compared to the 31st December 2016 consolidated financial statements, following a change in the balance sheet presentation of premiums to be received / to be paid on options (see Note 3).
(1) Mainly relates to guarantee deposits received on financial instruments, their fair value is taken to be the same as their book value.

6 I 2
NOTES TO THE CONSOLIDATED FINANCIAL STATEMENTS FF I N A N C I A L I N F O R M A T I O NN
390 I 2018 REGISTRATION DOCUMENT I S O C I E T E G E N E R AL E G R O U P
NOTE 5 - PERSONNEL EXPENSES AND EMPLOYEE BENEFITS
MAKING
IT SIMPLE
Employee benefits correspond to the compensation granted by the Group to its employees in exchange for work carried out during the annual reporting period.
All forms of compensation for work rendered are recorded in the expenses:
- whether it be paid to employees or to outside social security agencies;
- whether it be paid during the annual reporting period or to be paid by the Group in the future as entitlements to employees (pension plans, retirement benefits, etc.);
- whether it be paid in cash or in Societe Generale shares (free share plans, stock options).
ACCOUNTING PRINCIPLES
Employee benefits are divided into four categories:
Short-term employee benefits which are employee benefits expected to be settled wholly before twelve months after the end of the annual reporting period in which the employees render the related service, such as fixed and variable compensation, annual leave, taxes and social security contributions, mandatory employer contributions and profit-sharing;
Post-employment benefits, including defined contribution plans and defined benefit plans such as pension plans and retirement benefits;
Long-term employee benefits which are employee benefits not expected to be settled wholly before twelve months, such as defined variable compensation paid in cash and not indexed to the Societe Generale share, long service awards and time saving accounts;
Termination benefits.
Information related to the Group headcount is presented in the Chapter 5 of the Registration Document (Corporate Social Responsibility), part 5.

6
NOTES TO THE CONSOLIDATED FINANCIAL STATEMENTS
2 I 6FF I N A N C I A L I N F O R M A T I O NN
S O C I E T E G E N E R AL E G R O U P I 2018 REGISTRATION DOCUMENT I 391
NOTE 5.1 - PERSONNEL EXPENSES AND RELATED-PARTY TRANSACTIONS
ACCOUNTING PRINCIPLES
Personnel expenses include all expenses related to personnel, including employee benefits and expenses related to payments based on Societe Generale shares.
Short-term employee benefits are recorded under Personnel expenses during the period according to the services provided by the employee.
The accounting principles relating to post-employment benefits and long-term benefits are described in Note 5.2. Those related to share-based payments are described in Note 5.3.
1. PERSONNEL EXPENSES
(In EUR m) 2017 2016
Employee compensation (7,018) (6,812)
Social security charges and payroll taxes (1,605) (1,567)
Net pension expenses - defined contribution plans (713) (705)
Net pension expenses - defined benefit plans (112) (97)
Employee profit-sharing and incentives (301) (274)
Total (9,749) (9,455)
2. RELATED-PARTY TRANSACTIONS
ACCOUNTING PRINCIPLES
Personnel expenses include related-party transactions, within the meaning of IAS 24.
The Group’s related parties include the members of the Board of Directors, corporate officers (the Chairman, the Chief Executive Officer and the three Deputy Chief Executive Officers), their respective spouses and any children residing in the family home, subsidiaries which are either controlled exclusively or jointly by the Group, and companies over which Societe Generale exercises significant influence.
REMUNERATION OF THE GROUP’S MANAGERS
This includes amounts effectively paid by the Group to Directors and corporate officers as remuneration (including employer contributions) and other benefits as indicated below.
(In EUR m) 2017 2016
Short-term benefits 20.7 14.2
Post-employment benefits 1.5 0.6
Long-term benefits - -
Termination benefits - -
Share-based payments 2.4 2.1
Total 24.6 16.9
RELATED-PARTY TRANSACTIONS
The transactions with members of the Board of Directors, Chief Executive Officers and members of their families included in this note only comprise loans and guarantees outstanding at 31st December 2017 for a total amount of EUR 4.1 million. All other transactions with these individuals are insignificant.
TOTAL AMOUNTS PROVISIONED OR BOOKED BY THE SOCIETE GENERALE GROUP FOR THE PAYMENT OF PENSIONS AND OTHER BENEFITS
The total amount provisioned or booked by the Societe Generale Group at 31st December 2017 under IAS 19 for the payment of pensions and other benefits to Societe Generale’s Chief Executive Officers (Mr. Cabannes, Mr. Sanchez Incera, Mr. Valet and the two staff-elected Directors) is EUR 14.4 million.

6 I 2
NOTES TO THE CONSOLIDATED FINANCIAL STATEMENTS FF I N A N C I A L I N F O R M A T I O NN
392 I 2018 REGISTRATION DOCUMENT I S O C I E T E G E N E R AL E G R O U P
NOTE 5.2 - EMPLOYEE BENEFITS
Group entities in France and abroad may award their employees:
post-employment benefits, such as pension plans or retirement benefits;
long-term benefits such as deferred variable remuneration, long-service awards or the Compte Epargne Temps (CET) flexible working provisions;
termination benefits.
DETAIL OF PROVISIONS FOR EMPLOYEE BENEFITS
(In EUR m) Provisions at
31.12.2016 Allocations
Write-backs
available Net
allocation
Write-backs used
Actuarial gains and
losses
Currency and scope
effects Provisions at
31.12.2017
Provisions for employee benefits 1,8850 468 (243) 2225 - (21) 46 2,100
As part of its 2020 strategic and financial plan, Societe Generale announced an acceleration of the adaptation of the French Retail Banking network. Consequently, provisions for restructuring were enhanced, with an allocation of EUR 230 million recorded under Personnel expense in the income statement for 2017. In addition, an allocation to Other provisions (see Note 3.8) has been recorded for the social supports related to this restructuring; its amount of EUR 72 million has been recognised under Other operating expenses.
1. POST-EMPLOYMENT BENEFITS
ACCOUNTING PRINCIPLES
Post-employment benefits can be broken down into two categories: defined contribution pension plans or defined benefit pension plans.
DEFINED CONTRIBUTION PLANS
Defined contribution plans limit the Group’s liability to the subscriptions paid into the plan but do not commit the Group to a specific level of future benefits. Contributions paid are recorded as an expense for the current year.
DEFINED BENEFIT PLANS
Defined benefit plans commit the Group, either formally or constructively, to pay a certain amount or level of future benefits and therefore bear the associated medium or long-term risk.
Provisions are recognised on the liabilities side of the balance sheet under Provisions, to cover the whole of these retirement obligations. These provisions are assessed regularly by independent actuaries using the projected unit credit method. This valuation technique incorporates assumptions about demographics, early retirement, salary rises and discount and inflation rates.
When these plans are financed from external funds classified as plan assets, the fair value of these funds is subtracted from the provision to cover the obligations.
Differences arising from changes in calculation assumptions (early retirements, discount rates, etc.) and differences between actuarial assumptions and real performance are recognised as actuarial gains and losses. Actuarial gains and losses, as well as the return on plan assets excluding amounts expensed as net interest on the net defined benefit liability (or asset) and any change in the effect of the asset ceiling are components used to remeasure the net defined benefit liability (or asset). These components are immediately and fully recognised in shareholders’ equity among Unrealised or deferred gains and losses and they cannot be subsequently reclassified as income.
In the Group consolidated financial statements, these items that cannot be subsequently reclassified as income are displayed separately in the Statement of net income and unrealised or deferred gain and losses, but are transferred immediately to retained earnings in the Statement of changes in shareholders’ equity so that they are presented directly under Retained earnings on the liabilities side of the balance sheet.
Where a new or amended plan comes into force, past service cost is immediately recognised in profit or loss.
An annual charge is recorded under Personnel expenses for defined benefit plans consisting of:
the additional entitlements vested by each employee (current service cost);
past service cost resulting from a plan amendment or a curtailment;
the financial expense resulting from the discount rate and the interest income on plan assets (net interest on the net defined benefit liability or asset);
plan settlements.
1.1. Reconciliation of assets and liabilities recorded in the balance sheet
1.2. Components of the cost of defined benefits

6
NOTES TO THE CONSOLIDATED FINANCIAL STATEMENTS
2 I 6FF I N A N C I A L I N F O R M A T I O NN
S O C I E T E G E N E R AL E G R O U P I 2018 REGISTRATION DOCUMENT I 393
DEFINED CONTRIBUTION PLANS
The main defined contribution plans provided to employees of the Group are located in France, in the United Kingdom and in the United States.
In France, they include state pension plans and other national pension plans such as ARRCO and AGIRC, as well as pension schemes put in place by certain Group entities whose only commitment is to pay annual contributions (PERCO).
In the United Kingdom, the employer pays contributions according to the age of the employees (from 2.5 to 10% of the salary) and can make extra contributions up to 4.5% for the voluntary additional employee contributions.
In the United States, employers fully match the first 8% of employee contributions, within the limit of USD 10,000.
POST-EMPLOYMENT DEFINED BENEFIT PLANS
Post-employment pension plans include schemes offering annuities, plans offering retirement bonuses and mixed plans (cash balance). Benefits paid out in annuities supplement the pensions paid by the mandatory basic plans.
The main defined benefit plans are located in France, Switzerland, the United Kingdom and the United States.
In France, the supplementary pension plan for executive managers, set up in 1991, allocates an annual allowance to
beneficiaries covered by Societe Generale, as described in Chapter 3 “Corporate Governance” of the Registration Document. This allowance depends in particular on the beneficiary’s seniority within Societe Generale and the portion of fixed compensation exceeding “Tranche B” of AGIRC.
In Switzerland, the plan is managed by a personal protection insurance institution (the Foundation), comprised of employer and employee representatives. The employer and its employees pay contributions to the Foundation. Pension benefits are revalued at a guaranteed rate of return and converted to annuities (or lump-sum payment) also at a guaranteed conversion rate (cash balance scheme). Because of this minimum guaranteed return, the plan is considered similar to a defined benefit plan.
In recent years, the Societe Generale Group has actively implemented a policy of converting defined benefit plans to defined contribution plans.
In the United Kingdom the defined benefit plan has been closed to new employees for nearly 20 years, and the benefits of the last beneficiaries were frozen in 2015. The plan is managed by an independent institution (Trustee).
Similarly, in the United States, defined benefit plans were closed to new employees in 2015 and the vesting of new benefits was frozen.
11.1. RReconciliation of assets and liabilities recorded in the balance sheet
(In EUR m) 31.12.2017 31.12.2016
A - Present value of funded defined benefit obligations 2,953 3,041
B - Fair value of plan assets and separate assets (2,610) (2,695)
C = A + B Deficit (surplus)) 343 346
D - Present value of unfunded defined benefit obligations 428 427
E - Change in asset ceiling 8 2
C + D + E = Net bbalance recorded in the balance sheet 779 775
1.2.. CComponents of the cost of defined benefits
(In EUR m) 2017 2016
Current service cost including social security contributions 104 110
Employee contributions (5) (6)
Past service cost/curtailments (5) (39)
Settlements - (4)
Net interest 10 19
Transfer of unrecognised assets 6 3
A -- CComponents recognised in income statement 110 83
Expected return on plan assets(1) (70) (180)
Actuarial gains and losses due to changes in demographic assumptions (38) 7
Actuarial gains and losses due to changes in economic and financial assumptions 57 301
Actuarial gains and losses due to experience 12 (31)
Change in asset ceiling - 1
B -- CComponents recognised in unrealised or deferred gains and losses (39) 98
C = A + B Total components of the cost of defined benefits 71 181
(1) Return on plan assets from which the expected return on plan assets included in the net interest cost is deducted.

6 I 2
NOTES TO THE CONSOLIDATED FINANCIAL STATEMENTS FF I N A N C I A L I N F O R M A T I O NN
394 I 2018 REGISTRATION DOCUMENT I S O C I E T E G E N E R AL E G R O U P
11.3.. CChhanges in net liabilities of post--eemployment bbenefit planss recorded in the balance sheet
1.3.1 Changes in the present value of defined benefit obligations
(In EUR m) 2017 2016
Balance at 11st January 3,468 3,380
Current service cost including social security contributions 104 110
Past service cost/curtailments (5) (39)
Settlements (23) (29)
Net interest 63 81
Actuarial gains and losses due to changes in demographic assumptions (38) 7
Actuarial gains and losses due to changes in economic and financial assumptions 57 301
Actuarial gains and losses due to experience 12 (31)
Foreign exchange adjustment (92) (120)
Benefit payments (167) (177)
Change in consolidation scope 1 4
Transfers and others 1 (19)
Balance at 31sst DDecember 3,381 3,468
1.3.2 Changes in the fair value of plan assets and separate assets
(In EUR m) 2017 2016
Balance at 11st January 2,695 2,385
Expected return on plan assets 47 59
Expected return on separate assets 6 3
Actuarial gains and losses due to assets 70 180
Foreign exchange adjustment (81) (129)
Employee contributions 5 6
Employer contributions to plan assets 26 350
Benefit payments (141) (134)
Change in consolidation scope - (1)
Transfers and others (17) (24)
Balance at 31sst DDecember(1) 2,610 2,695
(1) Including EUR 398 million in separate assets at 31st December 2017 (EUR 399 million at 31st December 2016).
1.4. Innformation regarding funding assets
1.4.1 General information regarding funding assets (for all benefits and future contributions)
Funding assets represent around 75% of Group obligations, with different rates depending on the country.
Accordingly, defined benefit plan obligations in the United Kingdom are fully hedged, those in the United States hedged 87%, while they are only 75% hedged in France and are not funded in Germany.
The breakdown of the fair value of plan assets is as follows: 56% bonds, 24% equities and 20% other investments. Directly held Societe Generale shares are not significant.
For pension plans with a fair value of plan assets in excess of defined benefit obligations, the aggregate of plan assets is EUR 86 million.
Employer contributions to be paid to post-employment defined benefit plans for 2018 are estimated at EUR 16 million.
Plan hedging strategies are defined locally in connection with the Finance and Human Resources departments of the entities, by ad hoc structures (Trustees, Foundations, Joint structures etc.) if necessary. Besides, liability investment or financing strategies are monitored at Group level through a global governance system. Committee meetings, with the participation of representatives of the Human Resources Department, the Finance Department and the Risk Division, are organised in order to define Group guidelines for employee benefits investment and management, to validate decisions and to follow up the associated risks for the Group.
Depending on the duration of each plan and local regulations, funding assets are invested in equities and/or in fixed income products, whether guaranteed or not.
1.5. Main assumptions detailed by geographic area

6
1.3. Changes in net liabilities of post-employment benefit plans recorded in the balance sheet
1.4. Information regarding funding assets
NOTES TO THE CONSOLIDATED FINANCIAL STATEMENTS
2 I 6FF I N A N C I A L I N F O R M A T I O NN
S O C I E T E G E N E R AL E G R O U P I 2018 REGISTRATION DOCUMENT I 395
1.4.2 Actual returns on funding assets
The actual returns on plan and separate assets can be broken down as follows:
(In EUR m) 2017 2016
Plan assets 112 232
Separate assets 11 9
1.5.. MMain assumptions detailed by geographic area
31.12.2017 31.12.2016
Discount rate
Europe 1.66% 1.73%
Americas 3.50% 4.04%
Asia-Oceania-Africa 2.11% 1.81%
Long-term inflation
Europe 2.07% 2.05%
Asia-Oceania-Africa 1.77% 1.48%
Future salary increase
Europe 0.68% 0.75%
Asia-Oceania-Africa 2.49% 2.37%
Average remaining working lifetime of employees (in years)
Europe 9.46 9.59
Americas 8.25 8.38
Asia-Oceania-Africa 14.39 14.43
Duration (in years)
Europe 15.76 15.94
Americas 17.53 17.75
Asia-Oceania-Africa 11.09 11.11
Assumptions by geographic area are weighted average by the defined benefit obligations (DBO).
The discount yield curves used are AA corporate bonds yield curves (source: Merrill Lynch) observed at the end of October for USD, GBP and EUR, and corrected at the end of December if the change in discount rates had a significant impact.
Inflation rates used for EUR and GBP monetary areas are market rates observed at the end of October, and corrected at the end of December if the change had a significant impact. Inflation
rates used for the other monetary areas are the long-term targets of the central banks.
The average remaining working lifetime of employees is calculated taking into account turnover assumptions.
The assumptions described above have been applied to post-employment benefit plans.

6 I 2
NOTES TO THE CONSOLIDATED FINANCIAL STATEMENTS FF I N A N C I A L I N F O R M A T I O NN
396 I 2018 REGISTRATION DOCUMENT I S O C I E T E G E N E R AL E G R O U P
11.6.. SSensitivities of defined benefit obligations to main assumption ranges
(Percentage of item measured) 31.12.2017 31.12.2016
Variation in discount rate +0.5% +1.0%
Impact on the present value of defined benefit obligations at 31st December N -7% -14%
Variation in long-term inflation +0.5% +1.0%
Impact on the present value of defined benefit obligations at 31st December N 5% 11%
Variation in future salary increase +0.5% +1.0%
Impact on the present value of defined benefit obligations at 31st December N 2% 5%
Disclosed sensitivities are averages of the variations weighted by the present value of the defined benefit obligations.
2. LONG-TERM BENEFITS
ACCOUNTING PRINCIPLES
Long-term employee benefits are benefits other than post-employment and termination benefits, which are paid to employees more than twelve months after the end of the annual period in which they provided the related services.
Long-term benefits are measured and recognised in the same way as post-employment benefits, with the exception of actuarial gains and losses, which are immediately recognised as profit or loss.
These benefits include deferred compensation programmes settled in cash and not indexed to the Societe Generale share, such as long-term deferred variable remuneration, CET (Comptes Epargne Temps) flexible working provisions, or long-service awards.
At 31st December 2017, the net balance of long-term benefits was EUR 475 million.
The total cost of long-term benefits was EUR 113 million for 2017.

6
1.6. Sensitivities of defined benefit obligations to main assumption ranges
NOTES TO THE CONSOLIDATED FINANCIAL STATEMENTS
2 I 6FF I N A N C I A L I N F O R M A T I O NN
S O C I E T E G E N E R AL E G R O U P I 2018 REGISTRATION DOCUMENT I 397
NOTE 5.3 - SHARE-BASED PAYMENT PLANS
ACCOUNTING PRINCIPLES
Share-based payments include:
payments in equity instruments;
cash payments whose amount depends on the performance of equity instruments.
Share-based payments systematically give rise to an operating expense recognised as Personnel expenses in the amount of the fair value of the share-based payments granted to employees and according to their terms of settlement.
For equity-settled share-based payments (free shares, stock purchase or subscription options), the fair value of these instruments, measured at the vesting date, is spread over the vesting period and recorded in shareholders’ equity under Issuing premium and capital reserves. At each accounting date, the number of these instruments is revised in order to take into account performance and service conditions and adjust the overall cost of the plan as originally determined. Expenses recognised under Personnel expenses from the start of the plan are then adjusted accordingly.
For cash-settled share-based payments (stock-options granted by unlisted companies or compensation indexed on Societe Generale shares), the fair value of the amounts payable is recorded under Personnel expenses as an expense over the vesting period against a corresponding liabilities entry recognised in the balance sheet under Other liabilities – Expenses payable on employee benefits. This payables item is then remeasured to take into account performance and presence conditions as well as changes in the value of the underlying shares. When the expense is hedged by an equity derivative instrument, the effective portion of the change in the fair value of the hedging derivative is recorded in profit or loss under Personnel expense as well.
The Group may award some of its employees stock purchase or subscription options, free shares or rights to a future cash payment indexed to the Societe Generale share price.
The options are measured at their fair value when the employees are first notified, without waiting for the conditions that trigger the award to be met, or for the beneficiaries to exercise their options.
Group stock-option plans are measured using a binomial formula when the Group has adequate statistics to take into account the behaviour of the option beneficiaries. When such data are not available, the Black & Scholes model or Monte Carlo model is used. Valuations are performed by independent actuaries.
EXPENSES RECORDED IN THE INCOME STATEMENT
2017 2016
(In EUR m) Cash
settled plans
Equity settled plans
Total plans Cash
settled plans
Equity settled plans
Total plans
Net expenses from purchase plans, stock option and free share plans 71 58 129 124 65 1189
The description of Societe Generale stock-options plans and free share plans, which supplements this note, is presented in Chapter 3 of the present Registration Document on page 123 (Table 8) and 125 (Table 10).

6 I 2
NOTES TO THE CONSOLIDATED FINANCIAL STATEMENTS FF I N A N C I A L I N F O R M A T I O NN
398 I 2018 REGISTRATION DOCUMENT I S O C I E T E G E N E R AL E G R O U P
NOTE 6 - INCOME TAX
MAKING
IT SIMPLE
Income tax expenses are presented separately from other taxes which are classified among Other operating expenses. They are calculated according to the rates and tax regulations applicable in the countries where each consolidated entity is located.
Income tax presented in the income statement includes current taxes and deferred taxes:
– current taxes correspond to the amount of taxes due (or refundable) as calculated according to the taxable profit base for the reporting period.
– deferred taxes correspond to the amount of taxes resulting from past transactions and that will be payable (or refundable) in a future reporting period.
ACCOUNTING PRINCIPLES
CURRENT TAXES
Current tax is based on the taxable profits of each consolidated taxable entity and determined in accordance with the rules established by the local taxation authorities, upon which income taxes are payable. This tax expense also includes net allowances for tax adjustments pertaining to income tax.
Tax credits arising in respect of interest from loans and income from securities are recorded in the relevant interest account as they are applied in settlement of income taxes for the year. The related tax charge is included under Income tax in the consolidated income statement.
DEFERRED TAXES
Deferred taxes are recognised whenever the Group identifies a temporary difference between the book value and tax value of balance sheet assets and liabilities that will affect future tax payments.
Deferred tax assets and liabilities are measured in each consolidated taxable entity and in accordance with the rules established by the local taxation authorities, upon which their income taxes are payable. This amount is based on the tax rate enacted or substantively enacted which is expected to apply when the asset is realised or the liability settled. These deferred taxes are adjusted in the event of changes to tax rates. This amount is not discounted to present value.
Deferred tax assets can result from deductible temporary differences or from tax loss carryforwards. These deferred tax assets are recorded only if the entity concerned is likely to recover these assets within a set time. These temporary differences or tax loss carryforwards can also be used against future taxable profit.
Tax loss carryforwards are subject to an annual review taking into account the tax system applicable to each relevant tax entity and a realistic projection of their tax income or expense: any previously unrecognised deferred tax assets are recorded in the balance sheet to the extent it has become probable that future taxable profit will allow the deferred tax asset to be recovered; however, the carrying value of deferred tax assets already recognised in the balance sheet is reduced where a risk of total or partial non-recovery occurs.
Current and deferred taxes are recognised in the consolidated income statement under Income tax. However, deferred taxes related to gains and losses recorded under Unrealised or deferred gains and losses are also recognised under the same heading in shareholders’ equity.
1. INCOME TAX
(In EUR m) 2017 2016
Current taxes (1,035) (1,313)
Deferred taxes(1) (673) (656)
Total((2) (1,708) (1,969)
(1) At 31st December 2017, the deferred taxes include the change in the US tax rate and the appreciation of deferred tax assets of the US tax group for EUR -253 million.
(2) At 31st December 2017, the income tax (current and deferred) includes an impact of EUR -163 million relative to the French taxes changes: - refund of the additional 3% contribution on dividends, which was rejected by the Constitutional Council; - exceptional tax on corporate income introduced in the 2017 French Rectified Finance Act; - progressive reduction in the corporate tax rate included in the 2018 French Finance Act.

6
NOTES TO THE CONSOLIDATED FINANCIAL STATEMENTS
2 I 6FF I N A N C I A L I N F O R M A T I O NN
S O C I E T E G E N E R AL E G R O U P I 2018 REGISTRATION DOCUMENT I 399
RECONCILIATION OF THE DIFFERENCE BETWEEN THE GROUP’S STANDARD TAX RATE AND ITS EFFECTIVE TAX RATE
(In EUR m) 2017 2016
Income before tax, excluding net income from companies accounted for using the eequity method and impairment losses on goodwill
5,045 6,178
Normal tax rate applicable to French companies (including 3.3% national contribution) 34.43% 34.43%
Permanent differences(1) 12.87% 7.15%
Differential on securities with tax exemption or taxed at reduced rate -2.23% -1.93%
Tax rate differential on profits taxed outside France -10.48% -6.83%
Impact of non-deductible losses and use of tax losses carried forward -0.69% -0.96%
Group effective tax rate 33.90% 31.86%
(1) At 31st December 2017, the main impact is related to the change in the US tax rate and the appreciation of deferred tax assets of the US tax group for +5.01%, and the change in the French tax rate for +3.23%.
In France, the standard corporate income tax rate is 33.33%. A national contribution payment based on pre-tax earnings (contribution sociale) was introduced in 2000 equal to 3.3% (after a deduction of EUR 0.76 million from basic taxable income).
Long-term capital gains on equity investments are exempt, subject to taxation of a portion of fees and expenses at the full statutory tax rate. In accordance with the 2013 French Finance Act, this portion of fees and expenses is 12% of gross capital gains.
Furthermore, under the parent-subsidiary regime, dividends from companies in which Societe Generale’s equity interest is at least 5% are tax exempt, subject to taxation of a portion of fees and expenses at the full statutory tax rate.
The 2018 French Finance Act, adopted on 21st December 2017, includes a gradual reduction in the French tax rate. Between now and 2022, the standard Corporate Income Tax of 33.33% will be
brought down to 25%, plus the existing national contribution of 3.3%.
Deferred taxes on French companies are determined by applying the tax rate in effect upon the reversal of the temporary difference. Regarding the gradual reduction in the French tax rate until 2022:
for income taxed at the ordinary tax rate, the rate is between 34.43% in 2018 and 25.83% from 2022;
for income taxed at the reduced rate, the rate is between 4.13% in 2018 and 3.10% from 2022.
The US tax reform enacted end of December 2017 introduced a new tax on services and interest payments to non-US related parties (“Base Erosion Anti-abuse Tax”). Societe Generale is currently reviewing the potential impact of these new US tax rules, while remaining attentive to guidance that is still expected from US authorities.
2. PROVISIONS FOR TAX ADJUSTMENTS
ACCOUNTING PRINCIPLES
Provisions represent liabilities whose timing or amount cannot be precisely determined.
Provisions may be recorded:
where, by virtue of a commitment to a third-party, the Group will probably or certainly incur an outflow of resources to this third-party without receiving at least the equivalent value in exchange;
and when the amount of probable outflow of resources can be reliably estimated.
The expected outflows are then discounted to present value to determine the amount of the provision, where this discounting has a significant impact. Allocations to and reversals of provisions for tax adjustments are booked to Current taxes in the income statement under Income tax.
Information on the nature and the amount of the associated risks is not disclosed when the Group considers that such disclosure could seriously undermine its position in a dispute with other parties on the object of the provision.
(In EUR m)
Provisions at 31.12.2016
Allowances Available
Write-backs
Net Used Write-backs
Changes in translation and consolidation
scope
Provisions at 31.12.2017
Tax adjustments 2248 23 (77) ((54) (15) (17) 162

6 I 2
NOTES TO THE CONSOLIDATED FINANCIAL STATEMENTS FF I N A N C I A L I N F O R M A T I O NN
400 I 2018 REGISTRATION DOCUMENT I S O C I E T E G E N E R AL E G R O U P
3. TAX ASSETS AND LIABILITIES
TTAX ASSETS
(In EUR m) 31.12.2017 31.12.2016
Current tax assets 1,236 1,091
Deferred tax assets 4,765 5,330
o.w. deferred tax assets on tax loss carryforwards 2,970 3,083
o.w. deferred tax assets on temporary differences 1,795 2,247
Total 6,001 6,421
TAX LLIABILITIES
(In EUR m) 31.12.2017 31.12.2016
Current tax liabilities 995 984
Deferred tax liabilities 667 460
Total 1,662 1,444
Each year, the Group performs a review of tax loss carryforwards, according to the tax system applicable for each relevant tax entity and a realistic forecast of its tax results. For this purpose, tax results are determined based on the forecast of the performance of each business line entering in the Group budgetary path and/or on the strategic review of countries, after being approved by empowered management bodies. In addition, they include accounting and tax adjustments (of which the reversal of deferred tax assets and liabilities on temporary differences) applicable to concerned entities and jurisdictions. These adjustments are determined based on historical tax results and on the Group’s tax expertise. Beyond the Group budgetary path and/or the strategic review, extrapolations are performed particularly from macro-economic assumptions (for example, the evolution of interest rates).
By nature, the appreciation of the chosen macro-economic factors and the internal estimations used to determine the tax results contain risks and uncertainties on their realisation over the estimated horizon of the losses absorption. These risks and uncertainties concern the possibilities of change in the applicable tax rules (tax result computation as well as rules of imputation of tax losses carried forward) or the achievement of the strategic assumptions.
To ensure the robustness of the tax result projections, the Group performs sensitivity tests on the achievement of budgetary and strategic assumptions.
At 31st December 2017, these analyses confirm the probability for the Group to use tax loss carryforwards subject to deferred tax assets against future taxable profit.
4. DEFERRED TAX ON UNREALISED OR DEFERRED GAINS AND LOSSES
(In EUR m) 31.12.2017 31.12.2016
Tax impact on items that will be subsequently reclassified into income (237) (292)
Available-for-sale financial assets (243) (265)
Hedging derivatives 7 (19)
Unrealised or deferred gains and losses accounted for using the equity method and that will be subsequently reclassified into income
(1) (8)
Tax impact on items that will not be subsequently reclassified into income 192 215
Actuarial gain / (loss) on post-employment benefits 192 215
Total (45) (77)

6
TAX ASSETS
TAX LIABILITIES
NOTES TO THE CONSOLIDATED FINANCIAL STATEMENTS
2 I 6FF I N A N C I A L I N F O R M AA T I O N
S O C I E T E G E N E R AL E G R O U P I 2018 REGISTRATION DOCUMENT I 401
5. DEFERRED TAX ASSETS RECOGNISED ON TAX LOSS CARRYFORWARDS
At 31st December 2017, based on the tax system of each entity and a realistic projection of their tax income, the projected period for deferred tax asset recovery is indicated in the table below:
(In EUR m) 31.12.2017
Statutory time limit on carryforwards
Expected recovery period
Total deferred tax assets relating to tax loss carryforwards 2,9770 - -
o.w. French tax group 2,457 unlimited(1) 9 years
o.w. US tax group 399 20 years 7 years
others 114 - -
(1) In accordance with the 2013 French Finance Act, the deduction of previous losses is limited to EUR 1 million plus 50% of the fraction of the taxable income for the fiscal year exceeding this limit. The non-deductible portion of losses may be carried forward to the following fiscal years with no time limit and under the same conditions.
At 31st December 2017, the main unrecognised deferred tax assets represent a total of EUR 327 million (compared to EUR 739 million at 31st December 2016). They are mostly related to the US tax group, with EUR 269 million (compared to EUR 702 million at 31st December 2016).
With regard to the tax treatment of the loss caused by the actions of Jérôme Kerviel, Societe Generale considers that the judgment of the Versailles Court of Appeal of 23rd September 2016 is not likely to call into question its validity in light of the 2011 opinion of the French Supreme Administrative Court (Conseil d’État) and its established case law which was recently confirmed again in this regard. Consequently, Societe Generale considers there is no need to provision the corresponding deferred tax assets.
However, as indicated by the Minister of the Economy and Finance in September 2016, the tax authorities have examined the tax consequences of this book loss and recently confirmed that they intended to call into question the deductibility of the loss caused by the actions of Jérôme Kerviel, amounting to EUR 4.9 billion. This proposed tax rectification has no immediate effect and will possibly have to be confirmed by a tax adjustment notice sent by the tax authorities when Societe Generale is in a position to deduct the tax loss carryforwards arising from the loss from its taxable income. Such a situation will not occur for several years according to the bank’s forecasts. In the event that the authorities decide, in due course, to confirm their current position, the Societe Generale Group will not fail to assert its rights before the competent courts.

6 I 2
NOTES TO THE CONSOLIDATED FINANCIAL STATEMENTS FF I N A N C I A L I N F O R M A T I O NN
402 I 2018 REGISTRATION DOCUMENT I S O C I E T E G E N E R AL E G R O U P
NOTE 7 - SHAREHOLDERS’ EQUITY
MAKING
IT SIMPLE
Equity is the resources contributed to the Group by external shareholders as capital, as well as the cumulative and undistributed results (retained earnings). It also includes resources received when financial instruments are issued and for which the issuer has no contractual obligation to deliver cash to the holders of these instruments (such as certain perpetual subordinated notes).
Equity has no contractual maturity, and when compensation is awarded to shareholders or holders of other equity instruments, it does not affect the income statement but directly reduces the retained earnings in the equity.
The statement “Changes in Shareholders’ Equity” presents the various changes that affect the components of equity over the reporting period.
NOTE 7.1 - TREASURY SHARES AND SHAREHOLDERS’ EQUITY ISSUED BY THE GROUP
ACCOUNTING PRINCIPLES
TREASURY SHARES
Societe Generale shares held by the Group are deducted from consolidated equity irrespective of the purpose for which they are held. Income on these shares is eliminated from the consolidated income statement.
Recognition of shares issued by Group subsidiaries, which are bought and sold by the Group, is described in Note 2.
SHAREHOLDERS’ EQUITY ISSUED BY THE GROUP
Financial instruments issued by the Group are booked in whole or in part to debt or to equity depending on whether or not they contractually oblige the issuer to deliver cash to the holders of the securities.
When they are classified as equity, securities issued by Societe Generale are recorded under Other equity instruments. If they are issued by Group subsidiaries, these securities are recognised under Non-controlling interests. External costs associated with issuing equity instruments are deducted directly from equity at their after-tax amount.
When they are classified as debt instruments, securities issued by the Group are recorded under Debt securities issued or Subordinated debt depending on their characteristics. They are accounted for in the same way as other financial liabilities measured at amortised cost (see Note 3.6).
1. ORDINARY SHARES ISSUED BY SOCIETE GENERALE S.A.
(Number of shares) 31.12.2017 31.12.2016
Ordinary shares 807,917,739 807,713,534
Including treasury stock with voting rights(1) 6,850,304 8,251,751
Including shares held by employees 49,830,060 55,769,100
(1) Excluding Societe Generale shares held for trading purposes or in respect of the liquidity contract.
At 31st December 2017, Societe Generale S.A.’s capital amounted to EUR 1,009,897,173.75 and was made up of 807,917,739 shares with a nominal value of EUR 1.25.
During the second half of 2017, Societe Generale S.A. carried out a capital increase totalling EUR 0.3 million with additional paid-in capital of EUR 8 million through the issuance of 204,205 shares, resulting from the exercise of stock-options granted in 2010.
2. TREASURY STOCK
At 31st December 2017, the Group held 12,227,289 of its own shares as treasury stock, for trading purposes or for the active management of shareholders’ equity, representing 1.51% of the capital of Societe Generale S.A.
The amount deducted by the Group from its equity for treasury shares (and related derivatives) came to EUR 493 million, including EUR 222 million in shares held for trading purposes.

6
NOTES TO THE CONSOLIDATED FINANCIAL STATEMENTS
2 I 6FF I N A N C I A L I N F O R M A T I O NN
S O C I E T E G E N E R AL E G R O U P I 2018 REGISTRATION DOCUMENT I 403
The change in treasury stock over 2017 breaks down as follows:
(In EUR m) Liquidity contract Trading activities
Treasury stock and active management of
shareholders’ equity Total
Disposals net of purchases - (147) 25 ((122)
Capital gains net of tax on treasury stock and treasury share derivatives, booked under shareholders’ equity
- (7) (22) ((29)
3. EQUITY INSTRUMENTS ISSUED
PERPETUAL SUBORDINATED NOTES Perpetual subordinated notes issued by the Group, with some discretionary features governing the payment of interest, are classified as equity.
At 31st December 2017, perpetual subordinated notes issued by the Group and recognised under Group shareholders’ equity in Other equity instruments totalled EUR 244 million, valued at historical rate.
Issuance Date
Amount in local currency at 31.12.2016
Repurchases and
redemptions in 2017
Amount in local
currency at 31.12.2017
Amount in EUR millions at historical
rate Remuneration
1st July 1985 EUR 62m - EUR 62m 62 BAR (Bond Average Rate) of -0.25% for
the period from 1st June to 31st May before each due date
24th November 1986 USD 248m - USD 248m 182 Average 6-month Euro/Dollar deposit rates
communicated by reference banks +0.075%
PERPETUAL DEEPLY SUBORDINATED NOTES
Given the discretionary nature of the decision to pay dividends to shareholders, perpetual deeply subordinated notes have been classified as equity and recognised under Other equity instruments.
At 31st December 2017, perpetual deeply subordinated notes issued by the Group and recognised under Group shareholders’ equity in Other equity instruments totalled EUR 8,322 million, valued at historical rate.
The variation of the amount of perpetual deeply subordinated notes reflects the redemptions of three notes during the year.
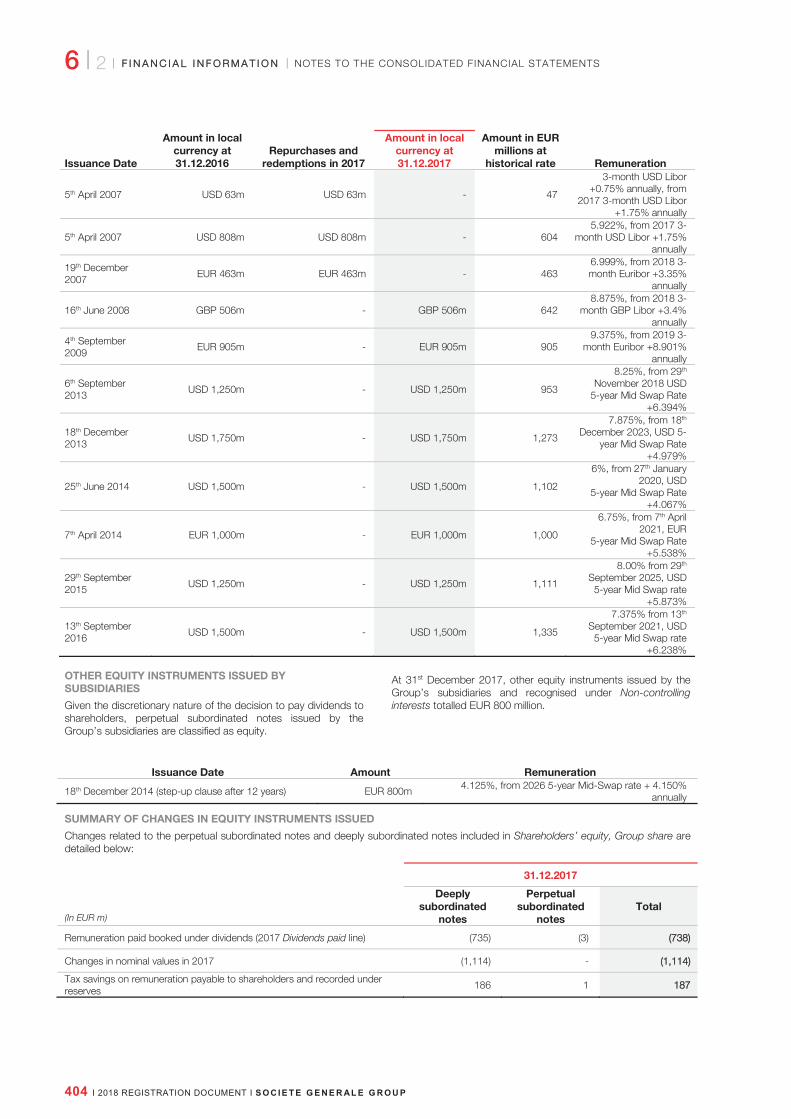
6 I 2
NOTES TO THE CONSOLIDATED FINANCIAL STATEMENTS FF I N A N C I A L I N F O R M A T I O NN
404 I 2018 REGISTRATION DOCUMENT I S O C I E T E G E N E R AL E G R O U P
Issuance Date
Amount in local currency at 31.12.2016
Repurchases and redemptions in 2017
Amount in local currency at 31.12.2017
Amount in EUR millions at
historical rate Remuneration
5th April 2007 USD 63m USD 63m - 47
3-month USD Libor +0.75% annually, from
2017 3-month USD Libor +1.75% annually
5th April 2007 USD 808m USD 808m - 604 5.922%, from 2017 3-
month USD Libor +1.75% annually
19th December 2007 EUR 463m EUR 463m - 463
6.999%, from 2018 3-month Euribor +3.35%
annually
16th June 2008 GBP 506m - GBP 506m 642 8.875%, from 2018 3-
month GBP Libor +3.4% annually
4th September 2009
EUR 905m - EUR 905m 905 9.375%, from 2019 3-
month Euribor +8.901% annually
6th September 2013 USD 1,250m - USD 1,250m 953
8.25%, from 29th November 2018 USD
5-year Mid Swap Rate +6.394%
18th December 2013
USD 1,750m - USD 1,750m 1,273
7.875%, from 18th December 2023, USD 5-
year Mid Swap Rate +4.979%
25th June 2014 USD 1,500m - USD 1,500m 1,102
6%, from 27th January 2020, USD
5-year Mid Swap Rate +4.067%
7th April 2014 EUR 1,000m - EUR 1,000m 1,000
6.75%, from 7th April 2021, EUR
5-year Mid Swap Rate +5.538%
29th September 2015 USD 1,250m - USD 1,250m 1,111
8.00% from 29th September 2025, USD 5-year Mid Swap rate
+5.873%
13th September 2016 USD 1,500m - USD 1,500m 1,335
7.375% from 13th September 2021, USD 5-year Mid Swap rate
+6.238%
OTHER EQUITY INSTRUMENTS ISSUED BY SUBSIDIARIES
Given the discretionary nature of the decision to pay dividends to shareholders, perpetual subordinated notes issued by the Group’s subsidiaries are classified as equity.
At 31st December 2017, other equity instruments issued by the Group’s subsidiaries and recognised under Non-controlling interests totalled EUR 800 million.
Issuance Date Amount Remuneration
18th December 2014 (step-up clause after 12 years) EUR 800m 4.125%, from 2026 5-year Mid-Swap rate + 4.150% annually
SUMMARY OF CHANGES IN EQUITY INSTRUMENTS ISSUED
Changes related to the perpetual subordinated notes and deeply subordinated notes included in Shareholders’ equity, Group share are detailed below:
31.12.2017
(In EUR m)
Deeply subordinated
notes
Perpetual subordinated
notes Total
Remuneration paid booked under dividends (2017 Dividends paid line) (735) (3) (738)
Changes in nominal values in 2017 (1,114) - (1,114)
Tax savings on remuneration payable to shareholders and recorded under reserves 186 1 187

6
NOTES TO THE CONSOLIDATED FINANCIAL STATEMENTS
2 I 6FF I N A N C I A L I N F O R M A T I O NN
S O C I E T E G E N E R AL E G R O U P I 2018 REGISTRATION DOCUMENT I 405
NOTE 7.2 - EARNINGS PER SHARE AND DIVIDENDS
ACCOUNTING PRINCIPLES
Earnings per share are measured by dividing net income attributable to ordinary shareholders by the weighted average number of shares outstanding over the period, excluding treasury shares. Net income attributable to ordinary shareholders takes account of dividend rights of preferred shareholders, such as holders of preferred shares, subordinated securities or deeply subordinated notes classified in equity. Diluted earnings per share take into account the potential dilution of shareholders’ interests in the event dilutive instruments (stock options or free share plans) are converted into ordinary shares. This dilutive effect is determined using the share buyback method.
1. EARNINGS PER SHARE
(In EUR m) 2017 2016
Net income, Group share 2,806 3,874
Net income attributable to deeply subordinated notes (466) (465)
Issuance fees relating to subordinated notes - (7)
Net iincome attributable to ordinary shareholders 2,340 3,402
Weighted average number of ordinary shares outstanding(1) 800,596,132 798,767,809
Earnings per ordinary share (in EEUR) 2.92 4..26
Average number of ordinary shares used in the dilution calculation(2) 50 19,154
Weighted average number of ordinary shares used in the calculation of diluted net earnings per share 800,596,182 798,786,963
Diluted earnings per ordinary share (in EEUR) 2.92 4..26
(1) Excluding treasury shares. (2) The number of shares used in the dilution calculation is computed using the “share buyback” method and takes into account free shares and stock-
option plans. The dilutive effect of stock-option plans depends on the average Societe Generale share price, which at 31st December 2017 was EUR 46.79. Accordingly, at 31st December 2017, there are neither free shares nor stock option plans, granted without any performance condition, which are considered as dilutive.
2. DIVIDENDS PAID
Dividends paid by the Group in 2017 amounted to EUR 2,776 million and are detailed in the following table:
2017 2016
(In EUR m) Group Share
Non-controlling interests
Total Group Share Non-controlling
interests Total
Ordinary shares (1,762) (243) (2,005) (1,596) (258) (1,854)
o.w. paid in shares - - - - - -
o.w. paid in cash (1,762) (243) (2,005) (1,596) (258) (1,854)
Other equity instruments (738) (33) (771) (693) (33) (726)
Total (2,500) (276) (2,776) (2,289) (291) (2,580)

6 I 2
NOTES TO THE CONSOLIDATED FINANCIAL STATEMENTS FF I N A N C I A L I N F O R M A T I O NN
406 I 2018 REGISTRATION DOCUMENT I S O C I E T E G E N E R AL E G R O U P
NOTE 8 - ADDITIONAL DISCLOSURES
NOTE 8.1 - SEGMENT REPORTING
1. DEFINITION OF SEGMENT REPORTING
The Group is managed on a matrix basis that takes into account its different business lines and the geographical breakdown of its activities. Segment reporting information is therefore presented under both criteria.
The Group includes in the results of each sub-division all operating income and expenses directly related to its activity. Income for each sub-division, except for the Corporate Centre, also includes the return on equity allocated to it, based on the estimated rate of return on Group equity. The return on the sub-division’s book equity is then reallocated to the Corporate Centre. Transactions between sub-divisions are carried out under the same terms and conditions as those applying to non-Group customers.
The Group’s core businesses are managed through three strategic pillars:
French Retail Banking, which includes the domestic networks Societe Generale, Crédit du Nord and Boursorama;
International Retail Banking & Financial Services, which consists of:
– International Retail Banking, including consumer finance activities,
– Financial Services to Corporates (operational vehicle leasing and fleet management, equipment and vendor finance),
– Insurance activities;
Global Banking and Investor Solutions, which comprises:
– Global Markets and Investors Services,
– Financing and Advisory,
– Asset and Wealth Management. In addition to these strategic pillars, the Corporate Centre acts as the Group’s central funding department. As such, it recognises the carrying cost of equity investments in subsidiaries and related dividend payments, as well as income and expenses stemming from the Group’s Asset and Liability Management (ALM) and income from the Group’s management of its assets (management of its industrial and bank equity portfolio and of its real estate assets). Income or expenses that do not relate directly to the activity of the core businesses are also allocated to the Corporate Centre.
Segment income takes intra-Group transactions into account, while these transactions are eliminated from segment assets and liabilities. The tax rate levied on each business line is based on the standard tax rate applicable in each country where the division makes profits. Any difference with respect to the Group’s tax rate is allocated to the Corporate Centre.
For the purpose of segment reporting by geographic region, segment profit or loss and assets and liabilities are presented based on the location of the booking entities.
2. SEGMENT REPORTING BY DIVISION AND SUB-DIVISION
Societe Generale Group French Retail Banking Corporate Centre(2)
(In EUR m) 2017 2016 2017 2016 2017 2016
Net banking income 23,954 25,298 8,131 8,403 (1,134) 14
Operating expenses(1) (17,838) (16,817) (6,108) (5,522) (361) (135)
Gross operating income 6,116 8,481 2,023 2,881 (1,495) (121)
Cost of risk (1,349) (2,091) (567) (704) (400) (340)
Operating income 4,767 6,390 1,456 2,177 (1,895) (461)
Net income from companies accounted for by the equity method
92 129 32 51 17 11
Net income / expense from other assets 278 (212) 7 (12) 236 (282)
Value adjustments on goodwill 1 - - - - -
Earnings before tax 5,138 6,307 1,495 2,216 (1,642) (732)
Income tax (1,708) (1,969) (485) (730) 54 (156)
Net income before non--controlling interests
3,430 4,338 1,010 1,486 (1,588) (888)
Non-controlling interests 624 464 - - 157 158
Net income, Group share 2,806 3,874 1,010 1,486 (1,745) (1,046)

6
NOTES TO THE CONSOLIDATED FINANCIAL STATEMENTS
2 I 6FF I N A N C I A L I N F O R M A T II O N
S O C I E T E G E N E R AL E G R O U P I 2018 REGISTRATION DOCUMENT I 407
International Retail Banking & Financial Services
International Retail
Banking Financial Services to
Corporates Insurance Total
(In EUR m) 2017 2016 2017 2016 2017 2016 2017 2016
Net banking income 5,279 5,012 1,802 1,677 989 883 8,070 7,572
Operating expenses(1) (3,198) (3,109) (905) (825) (371) (339) (4,474) (4,273)
Gross operating income 2,081 1,903 897 852 618 544 3,596 3,299
Cost of risk (349) (721) (51) (58) - - (400) (779)
Operating income 1,732 1,182 846 794 618 544 3,196 2,520 Net income from companies accounted for by the equity method
24 18 17 19 - - 41 37
Net income / expense from other assets 36 58 - - - - 36 58
Value adjustments on goodwill
1 - - - - - 1 -
Earnings before tax 1,793 1,258 863 813 618 544 3,274 2,615
Income tax (421) (293) (227) (230) (210) (174) (858) (697) Net income before non--controlling interests 1,372 965 636 583 408 370 2,416 1,918
Non-controlling interests 382 280 57 5 2 2 441 287 Net income, Group sshare 990 685 579 578 406 368 1,975 1,631
Global Banking and Investor Solutions
Global Markets and Investor Services
Financing and Advisory Asset and Wealth
Management Total
(In EUR m) 2017 2016 2017 2016 2017 2016 2017 2016
Net banking income 5,679 5,936 2,220 2,372 988 1,001 8,887 9,309
Operating expenses(1) (4,436) (4,390) (1,546) (1,539) (913) (958) (6,895) (6,887)
Gross operating income 1,243 1,546 674 833 75 43 1,992 2,422
Cost of risk (34) (4) 50 (247) 2 (17) 18 (268)
Operating income 1,209 1,542 724 586 77 26 2,010 2,154
Net income from companies accounted for by the equity method
5 4 (3) (2) - 28 2 30
Net income / expense from other assets
- - (1) 28 - (4) (1) 24
Value adjustments on goodwill
- - - - - - - -
Earnings before tax 1,214 1,546 720 612 77 50 2,011 2,208
Income tax (322) (327) (76) (53) (21) (6) (419) (386)
Net income before non--controlling interests 892 1,219 644 559 56 44 1,592 1,822
Non-controlling interests 20 14 4 3 2 2 26 19
Net income, Group sshare 872 1,205 640 556 54 42 1,566 1,803
(1) These amounts include Personnel expenses, Other operating expenses and Amortisation, depreciation and impairment of tangible and intangible fixed assets.
(2) Income and expenses not directly related to the business line activities are recorded in the Corporate Centre’s income. Thus, the Net Banking Income includes the revaluation differences for debts related to own credit risk (EUR - 53 million at 31st December 2017) and compensation of EUR 963 million for the settlement agreement between Societe Generale and the Libyan Investment Authority.
The Net Banking Income for the year 2016 includes EUR 725 million in capital gain on the sale of Visa Europe shares. In addition, Net income from other assets for the year 2016 registered a depreciation of EUR -235 million in unrealised losses on non-current assets
held for sale on the retail bank in Croatia. In 2017, Net income from other assets included EUR 203 million related to the acquisition of the remaining 50% in Antarius and EUR 73 million in capital gains on the disposal of Fortune SG Fund Management Co Ltd.

6 I 2
NOTES TO THE CONSOLIDATED FINANCIAL STATEMENTS FFINANCIAL INFORMATIONN
408 I 2018 REGISTRATION DOCUMENT I S O C I E T E G E N E R AL E G R O U P
Societe Generale Group French Retail Banking Corporate Centre(2)
(In EUR m) 31.12.2017 31.12.2016 31.12.2017 31.12.2016 31.12.2017 31.12.2016
Segment assets* 1,275,128 1,354,422 226,346 217,971 116,737 129,635
Segment liabilities(1)* 1,211,091 1,288,716 230,110 224,222 92,515 97,495
International Retail Banking & Financial Services
International Retail Banking
Financial Services to Corporates
Insurance Total
(In EUR m) 31.12.2017 31.12.2016 31.12.2017 31.12.2016 31.12.2017 31.12.2016 31.12.2017 31.12.2016
Segment assets 116,749 115,844 39,645 35,455 149,785 126,271 306,179 277,570
Segment liabilities(1) 91,853 88,616 12,106 11,057 141,676 119,311 245,635 218,984
Global Banking and Investor Solutions
Global Markets and Investor Services
Financing and Advisory
Asset and Wealth Management
Total
(In EUR m) 31.12.2017 31.12.2016 31.12.2017 31.12.2016 31.12.2017 31.12.2016 31.12.2017 31.12.2016
Segment assets* 494,111 586,409 97,179 102,613 34,576 40,224 625,866 729,246
Segment liabilities(1)* 593,419 686,995 24,063 29,898 25,349 31,122 642,831 748,015
* Amounts restated compared to the 31st December 2016 consolidated financial statements, following a change in the balance sheet presentation of premiums to be received / to be paid on options (see Note 3).
(1) Segment liabilities correspond to debts (i.e. total liabilities excluding equity). (2) Assets and liabilities not directly related to the business line activities are recorded on the Corporate Centre’s balance sheet. Thus the debt revaluation
differences linked to own credit risk and the revaluation differences of the credit derivative instruments hedging the loans and receivables portfolios are allocated to the Corporate Centre.

6
NOTES TO THE CONSOLIDATED FINANCIAL STATEMENTS
2 I 6FF I NA NC I A L I NF O RMA T I O NN
S O C I E T E G E N E R AL E G R O U P I 2018 REGISTRATION DOCUMENT I 409
3. SEGMENT REPORTING BY GEOGRAPHIC REGION
GEOGRAPHIC BREAKDOWN OF NET BANKING INCOME (IN EUR M)
At 31st December 2017, the amount of Net Banking Income was EUR 23,954 million compared to EUR 25,298 million at 31st December 2016.
GEOGRAPHIC BREAKDOWN OF BALANCE SHEET ITEMS (IN EUR M)
ASSETS
At 31st December 2017, the amount of assets was EUR 1,275,128 million compared to EUR 1,354,424* million at 31st December 2016.
LIABILITIES
At 31st December 2017, the amount of liabilities (except shareholder equity) was EUR 1,211,091 million compared to EUR 1,288,716* million at 31st December 2016.
Segment liabilities correspond to debts (i.e. total liabilities excluding equity).
* Amounts restated compared to the 31st December 2016 consolidated financial statements, following a change in the balance sheet presentation of premiumsto be received / to be paid on options (see Note 3).
France10,772 45%
Europe8,858 37%
Americas1,474 6%
Asia/Oceania1,473 6%
Africa1,377 6%
2017 France12,068 48%
Europe8,717 34%
Americas1,780 7%
Asia/Oceania1,482 6%
Africa1,251 5%
2016
France929,152
73%
Europe241,468
19%
Americas61,584
5%
Asia/Oceania21,086
1%
Africa21,838
2%
2017 France949,746
70%
Europe259,510
19%
Americas90,548
7%
Asia/Oceania33,663
2%
Africa20,955
2%
2016
France872,675
72%
Europe234,802
19%
Americas63,217
5%
Asia/Oceania20,281
2%
Africa20,116
2%
2017 France
890,880 69%
Europe254,616
20%
Americas91,146
7%
Asia/Oceania32,779
3%
Africa19,295
1%
2016

6 I 2
NOTES TO THE CONSOLIDATED FINANCIAL STATEMENTS FFINANCIAL INFORMATIONN
410 I 2018 REGISTRATION DOCUMENT I S O C I E T E G E N E R AL E G R O U P
NOTE 8.2 - OTHER OPERATING EXPENSES
ACCOUNTING PRINCIPLES
The Group records operating expenses under expenses, according to the type of services to which they refer and the rate of use of said services.
Lease payments include real estate and equipment leasing expenses (mainly computer-related), which are booked over the lease period using the straight-line method.
Taxes and levies are only booked when the triggering event provided for by law occurs. If the obligation to pay the tax arises from the gradual operation of an activity, the expense must be spread out over the same period. Finally, if the obligation to pay is generated when a threshold is reached, the expense is only recorded once the threshold is reached.
Taxes and levies cover all contributions levied by a public authority and include the contributions paid to the Single Resolution Fund and the Deposit Insurance and Resolution Fund, the systemic risk tax, and contributions for ACPR control costs, which are recognised on the income statement at the start of the financial year. The company social solidarity contribution (C3S), based on income generated in the previous financial year, is fully recognised on the income statement at 1st January of the current financial year.
Other mainly includes building maintenance and other costs, travel and business expenses, and advertising expenses.
(In EUR m) 2017 2016
Rentals* (839) (912)
Taxes and levies (919) (802)
Data & telecom (excluding rentals) (2,265) (2,126)
Consulting fees (excluding data & telecom) (1,340) (1,294)
Other*(1) (1,720) (1,289)
Total (7,083) (6,423)
* Amounts restated compared to the financial statements published in 2016. (1) In 2016, the European Commission reduced the fine imposed on Societe Generale in 2013, in connection with Euribor. It was recorded, for the first half of
2016 and at 31st December 2016, as a decrease in Other operating expenses (under “Other”) for a total of EUR 218 million.
CONTRIBUTION TO BANK RESOLUTION MECHANISMS
The European regulatory framework designed to enhance financial stability was updated by Directive 2014/49/EU of 16th April 2014 on deposit guarantee schemes and the Directive 2014/59/EU of 15th May 2014 establishing a framework for the recovery and resolution of credit institutions and investment firms (Bank Recovery and Resolution Directive).
The European Regulation (EU) No. 806/2014 of 15th July 2014 then determined the financing means of resolution mechanisms within the European Banking Union through the establishment of a Single Resolution Fund (SRF). In addition to this instrument, the National Resolution Fund (NRF) exists for institutions subject to this resolution mechanism, but that have no SRF.
The Single Resolution Fund, established in January 2016, shall receive annual contributions from the participating European financial institutions. By the end of 2023, the available financial means of the Fund shall reach at least 1% of the amount of
covered deposits of all these participating financial institutions. A share of the annual contributions can be provided through irrevocable payment commitments.
For the year 2017, the Group’s contributions to the SRF and the NRF were as follows:
cash contributions (85%) for a total of EUR 366 million, of which EUR 319 million for the SRF and EUR 47 million for the NRF (EUR 245 million for the SRF and EUR 47 million for the NRF in 2016). These contributions are non tax-deductible in France and have been recorded in the income statement in Other administrative expenses, among Taxes and levies;
irrevocable payment commitments (15%) backed by a cash collateral for EUR 64 million related to the SRF (EUR 35 million in 2016), recorded as an asset in the balance sheet, among Other assets.
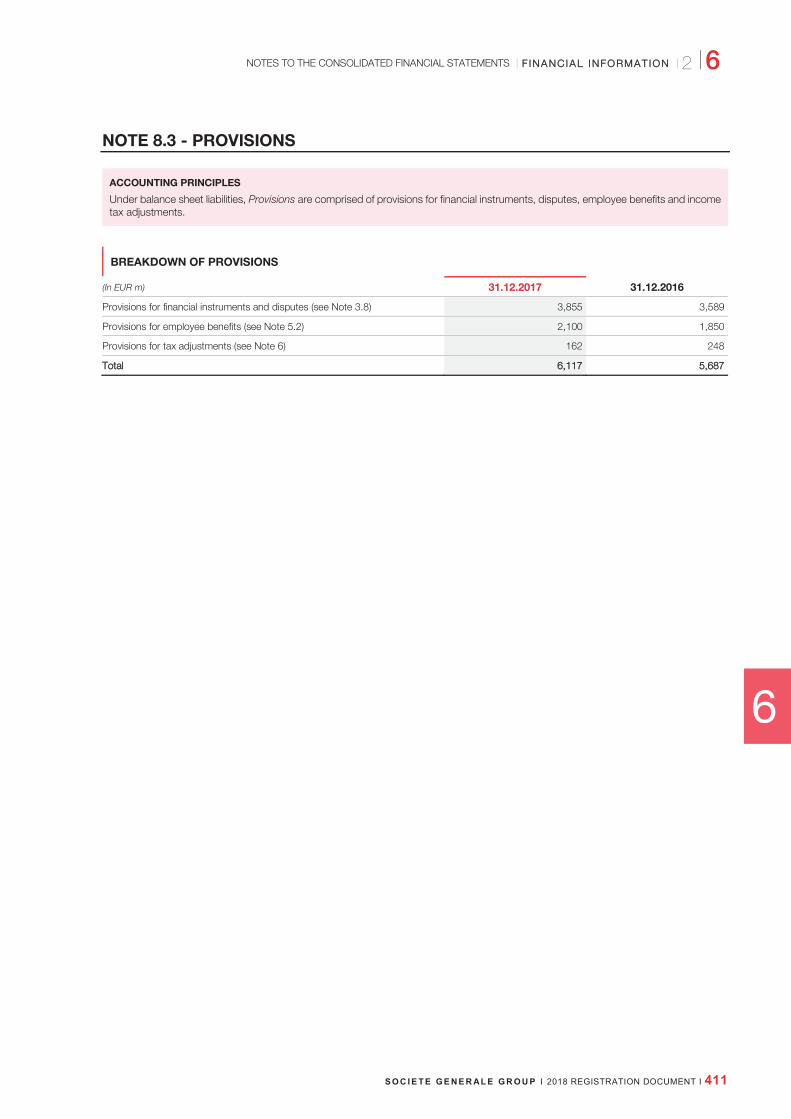
6
NOTES TO THE CONSOLIDATED FINANCIAL STATEMENTS
2 I 6 FF I NA NC I A L I NF O RMA T I O NN
S O C I E T E G E N E R AL E G R O U P I 2018 REGISTRATION DOCUMENT I 411
NOTE 8.3 - PROVISIONS
ACCOUNTING PRINCIPLES
Under balance sheet liabilities, Provisions are comprised of provisions for financial instruments, disputes, employee benefits and income tax adjustments.
BREAKDOWN OF PROVISIONS
(In EUR m) 31.12.2017 31.12.2016
Provisions for financial instruments and disputes (see Note 3.8) 3,855 3,589
Provisions for employee benefits (see Note 5.2) 2,100 1,850
Provisions for tax adjustments (see Note 6) 162 248
Total 6,117 5,687

6 I 2
NOTES TO THE CONSOLIDATED FINANCIAL STATEMENTS FFINANCIAL INFORMATIONN
412 I 2018 REGISTRATION DOCUMENT I S O C I E T E G E N E R AL E G R O U P
NOTE 8.4 - TANGIBLE AND INTANGIBLE FIXED ASSETS
ACCOUNTING PRINCIPLES
Tangible and intangible fixed assets include operating and investment fixed assets. Equipment assets held for operating leases are included in operating tangible assets, while buildings held for leasing purposes are included in investment property.
Tangible and intangible fixed assets are carried at their purchase price on the asset side of the balance sheet, less depreciation, amortisation and impairment.
The purchase price of fixed assets includes borrowing costs incurred to fund a lengthy construction period for the fixed assets, along with all other directly attributable expenses. Investment subsidies received are deducted from the cost of the relevant assets. Software developed internally is recorded on the asset side of the balance sheet in the amount of the direct cost of development.
As soon as they are fit for use, fixed assets are depreciated or amortised using the component-based approach. Each component is depreciated or amortised over its own useful life. The Group has applied this approach to its operating properties, breaking down its assets into components with depreciation periods of 10 to 50 years. Depreciation periods for fixed assets other than buildings depend on their useful life, which is usually estimated at 3 to 20 years.
Any residual value of the asset is deducted from its depreciable amount. If there is a subsequent decrease or increase in this initial residual value, the depreciable amount of the asset is adjusted, leading to a prospective modification of the depreciation schedule.
Depreciation and amortisation are recorded in the income statement under Amortisation, depreciation and impairment of tangible and intangible fixed assets.
Fixed assets grouped into Cash Generating Units are tested for impairment whenever there is any indication that their value may have diminished. Allocations and reversals of provisions for impairment are recorded in the income statement under Amortisation, depreciation and impairment of tangible and intangible fixed assets.
Realised capital gains and losses on operating fixed assets are recognised under Net income from other assets.
Investment properties are depreciated using the component based-method. Each component is depreciated over its own useful life, ranging from 10 to 50 years.
Profits or losses on operating lease assets and on investment property, including amortisation and depreciation, are recognised under Income from other activities and Expense from other activities (see Note 4.2).
CHANGES IN TANGIBLE AND INTANGIBLE FIXED ASSETS
(In EUR m)
Gross book value at
31.12.2016 Acquisitions Disposals
Changes in translation,
consolidation scope and
reclassifications
Gross value at 31.12.2017
Depreciation and
amortisation of assets at 31.12.2016
Allocations to amortisation
and depreciation
in 2017
Impairment of assets in
2017
Write-backs from amortisation and depreciation in
2017
Changes in translation,
consolidation scope and
reclassifications
Net book value at
31.12.2017
Net book value at
31.12.2016
Intangible assets 5,674 696 (47) (86) 6,237 (3,957) (437) (2) 32 67 1,940 1,717
Operating tangible assets
10,704 675 (273) (90) 11,016 (5,685) (551) (19) 188 103 5,052 5,019
Lease assets of specialised financing companies
20,230 9,488 (6,968) 949 23,699 (5,813) (3,276) 15 2,787 (224) 17,188 14,417
Investment property
771 61 (12) (43) 777 (141) (19) - 6 15 638 630
Total tangible aand intangible fixed assets
37,379 10,920 (7,300) 730 41,729 (15,596) (4,283) (6) 3,013 (39) 24,818 21,783
BREAKDOWN OF MINIMUM PAYMENTS RECEIVABLE ON OPERATING LEASE ASSETS
(In EUR m) 31.12.2017 31.12.2016
Breakdown of minimum payments receivable
due in less than one year 3,400 3,374
due in 1-5 years 12,392 7,557
due in more than five years 328 40
Total minimum future payments receivable 16,120 10,971

6
NOTES TO THE CONSOLIDATED FINANCIAL STATEMENTS
2 I 6 FF I NA NC I A L I NF O RMA T I O NN
S O C I E T E G E N E R AL E G R O U P I 2018 REGISTRATION DOCUMENT I 413
NOTE 8.5 - FOREIGN EXCHANGE TRANSACTIONS
ACCOUNTING PRINCIPLES
At the balance sheet date, monetary assets and liabilities denominated in foreign currencies are translated into the entity’s functional currency at the prevailing spot exchange rate. Realised or unrealised foreign exchange losses or gains are recognised in the income statement under Net gains and losses on financial instruments at fair value through profit or loss (see Note 3.1).
Forward foreign exchange transactions are recognised at fair value based on the forward exchange rate for the remaining maturity. Spot foreign exchange positions are valued using the official spot rates prevailing at the end of the period. Unrealised gains and losses are recognised in the income statement under Net gains and losses on financial instruments at fair value through profit or loss (see Note 3.1), except when hedge accounting is applied to a cash-flow hedge transaction or to a hedge of a net investment in a foreign operation (see Note 3.2).
Non-monetary financial assets denominated in foreign currencies, including shares and other equity instruments that are not measured at fair value through profit or loss, are translated into the entity’s functional currency at the exchange rate prevailing at the end of the period. Foreign exchange differences arising on these financial assets are booked in equity among Unrealised or deferred gains and losses and are only recorded in the income statement when sold or impaired or where the currency risk is fair value-hedged. In particular, if a non-monetary asset is funded by a liability denominated in the same currency and if a fair value hedge relationship has been documented between these two financial instruments to hedge the foreign currency risk, the asset is translated at the spot rate prevailing at the end of the period while booking the impact of exchange rate fluctuations to income.
31.12.2017 31.12.2016*
(In EUR m)
Assets Liabilities
Currencies bought, not yet
received
Currencies sold, not
yet delivered
Assets Liabilities
Currencies bought, not yet
received
Currencies sold, not
yet delivered
EUR 813,117 790,479 27,723 31,949 779,465 769,239 28,389 24,501
USD 242,646 229,177 51,273 41,661 340,616 317,153 40,313 48,248
GBP 53,717 37,804 15,021 10,321 54,739 36,134 10,664 7,388
JPY 24,058 54,176 17,753 24,588 34,354 79,722 21,104 17,180
AUD 5,981 7,035 4,830 5,910 8,122 8,043 3,700 5,730
CZK 33,753 36,175 572 766 29,456 31,296 502 575
RUB 13,537 10,590 37 88 11,780 9,126 91 111
RON 7,630 7,967 168 132 7,453 7,690 124 235
Other currencies 80,689 101,725 32,740 27,191 88,437 96,019 24,162 17,287
Total 1,275,128 1,275,128 150,117 142,606 1,354,422 1,354,422 129,049 121,255
* Amounts restated compared to the 31st December 2016 consolidated financial statements, following a change in the balance sheet presentation of premiums to be received / to be paid on options (see Note 3).

6 I 2
NOTES TO THE CONSOLIDATED FINANCIAL STATEMENTS FFINANCIAL INFORMATIONN
414 I 2018 REGISTRATION DOCUMENT I S O C I E T E G E N E R AL E G R O U P
NOTE 8.6 - COMPANIES INCLUDED IN THE CONSOLIDATION SCOPE
Group ownership interest Group voting
interest
CCountry Activity Method*
At 31.12.2017
At 31.12.2016
At 31.12.2017
At 31.12.2016
SSouth Africa
(1) SG JOHANNESBURG Bank FULL 100 100 100 100
AAlbania
BANKA SOCIETE GENERALE ALBANIA SH.A. Bank FULL 88.89 88.64 88.89 88.64
AAlgeria
ALD AUTOMOTIVE ALGERIE SPA Specialist Financing FULL 79.81 99.99 99.99 99.99
SOCIETE GENERALE ALGERIE Bank FULL 100 100 100 100
GGermany
AKRUN EINS GRUNDSTUCKS-VERMIETUNGSGESELLSCHAFT MBH & CO. OBJEKT SEREN 1 KG
Real Estate and Real Estate Financing
FULL 100 100 100 100
ALD AUTOLEASING D GMBH Specialist Financing FULL 79.82 100 100 100
ALD INTERNATIONAL GROUP HOLDINGS GMBH
Specialist Financing FULL 79.82 100 100 100
ALD INTERNATIONAL SAS & CO. KG Specialist Financing FULL 79.82 100 100 100
ALD LEASE FINANZ GMBH Specialist Financing FULL 100 100 100 100
BANK DEUTSCHES KRAFTFAHRZEUGGEWERBE GMBH
Specialist Financing FULL 99.91 99.9 51 51
BDK LEASING UND SERVICE GMBH Specialist Financing FULL 100 100 100 100
CAR PROFESSIONAL FUHRPARKMANAGEMENT UND BERATUNGSGESELLSCHAFT MBH & CO. KG
Specialist Financing FULL 79.82 100 100 100
CARPOOL GMBH Broker FULL 79.82 100 100 100
EUROPARC DREILINDEN GMBH Group Real Estate Management Company
FULL 100 100 100 100
EUROPARC GMBH Real Estate and Real Estate Financing
FULL 100 100 100 100
EUROPARC KERPEN GMBH Group Real Estate Management Company
FULL 100 100 100 100
GEFA BANK GMBH Specialist Financing FULL 100 100 100 100
GEFA VERSICHERUNGSDIENST GMBH Specialist Financing EFS 100 100 100 100
HANSEATIC BANK GMBH & CO KG Specialist Financing FULL 75 75 75 75
HANSEATIC GESELLSCHAFT FUR BANKBETEILIGUNGEN MBH
Portfolio Management FULL 75 75 100 100
HSCE HANSEATIC SERVICE CENTER GMBH Services FULL 75 75 100 100
INTERLEASING DELLO HAMBURG GMBH Specialist Financing FULL 79.82 100 100 100
(4) ONVISTA Services FULL 100 100
(4) ONVISTA BANK Broker FULL 100 100
(4) ONVISTA MEDIA GMBH Services FULL 100 100
PEMA GMBH Specialist Financing FULL 100 100 100 100
PODES DREI GRUNDSTUCKS-VERMIETUNGSGESELLSCHAFT MBH &CO OBJEKTE WEL 4 KG
Real Estate and Real Estate Financing
FULL 100 100 100 100
PODES GRUNDSTUCKS - VERMIETUNGSGESELLSCHAFT MBH & CO OBJEKTE WEL 3 KG
Real Estate and Real Estate Financing
FULL 100 100 100 100
PODES ZWEI GRUNDSTUCKS-VERMIETUNGSGESELLSCHAFT MBH &CO OBJEKTE WEL 3 KG
Real Estate and Real Estate Financing
FULL 100 100 100 100

6
NOTES TO THE CONSOLIDATED FINANCIAL STATEMENTS
2 I 6 FF I NA NC I A L I NF O RMA T I O NN
S O C I E T E G E N E R AL E G R O U P I 2018 REGISTRATION DOCUMENT I 415
Group ownership interest Group voting
interest
CCountry Activity Method*
At 31.12.2017
At 31.12.2016
At 31.12.2017
At 31.12.2016
RED & BLACK AUTO GERMANY 2 UG (HAFTUNGSBESCHRANKT)
Financial Company FULL 99.91 99.9 100 100
RED & BLACK AUTO GERMANY 3 UG (HAFTUNGSBESCHRANKT)
Financial Company FULL 99.91 99.9 100 100
RED & BLACK AUTO GERMANY 4 UG (HAFTUNGSBESCHRANKT)
Financial Company FULL 100 100 100 100
RED & BLACK CAR SALES 1UG Financial Company FULL 79.82 100 100 100
(2) RED & BLACK TME GERMANY 1 UG Financial Company FULL 100 100
SG EQUIPMENT FINANCE INTERNATIONAL GMBH
Specialist Financing FULL 100 100 100 100
SG EQUIPMENT FINANCE SA & CO KG Specialist Financing FULL 100 100 100 100
(1) SG FRANCFORT Bank FULL 100 100 100 100
SOCIETE GENERALE EFFEKTEN GMBH Financial Company FULL 100 100 100 100
SOCIETE GENERALE SECURITIES SERVICES GMBH
Specialist Financing FULL 100 100 100 100
(1) SOGECAP DEUTSCHE NIEDERLASSUNG Insurance FULL 100 100 100 100
(1) SOGECAP RISQUES DIVERS DEUTSCHE NIEDERLASSUNG
Insurance FULL 100 100 100 100
AAustralia
SOCIETE GENERALE SECURITIES AUSTRALIA PTY LTD
Broker FULL 100 100 100 100
AAustria
ALD AUTOMOTIVE FUHRPARKMANAGEMENT UND LEASING GMBH
Specialist Financing FULL 79.82 100 100 100
SG EQUIPMENT LEASING AUSTRIA GMBH Specialist Financing EFS 100 100 100 100
(1) SG VIENNE Bank FULL 100 100 100 100
BBelgium
AXUS FINANCE SPRL Specialist Financing FULL 79.82 100 100 100
AXUS SA/NV Specialist Financing FULL 79.82 100 100 100
BASTION EUROPEAN INVESTMENTS S.A. Financial Company FULL 60.74 60.74 100 100
(2) MILFORD Specialist Financing FULL 100 100
PARCOURS BELGIUM Specialist Financing FULL 79.82 100 100 100
PEMA TRUCK TRAILER VERHUUR Specialist Financing FULL 100 100 100 100
(1) SG BRUXELLES Bank FULL 100 100 100 100
(1) SG EQUIPMENT FINANCE BENELUX B.V. BELGIAN BRANCH
Specialist Financing FULL 100 100 100 100
(6) SOCIETE GENERALE DE FINANCEMENT Financial Company FULL 100 100
SOCIETE GENERALE IMMOBEL Financial Company FULL 100 100 100 100
SOCIETE GENERALE PRIVATE BANKING NV/SA Bank FULL 100 100 100 100
BBenin
SOCIETE GENERALE BENIN Bank FULL 89.64 88.34 90.3 89.01
BBermuda
CATALYST RE INTERNATIONAL LTD. Insurance FULL 100 100 100 100
BBrazil
ALD AUTOMOTIVE S.A. Specialist Financing FULL 79.82 100 100 100

6 I 2
NOTES TO THE CONSOLIDATED FINANCIAL STATEMENTS FFINANCIAL INFORMATIONN
416 I 2018 REGISTRATION DOCUMENT I S O C I E T E G E N E R AL E G R O U P
Group ownership interest Group voting
interest
CCountry Activity Method*
At 31.12.2017
At 31.12.2016
At 31.12.2017
At 31.12.2016
(5) BANCO CACIQUE S.A. Bank FULL 100 100
(4) BANCO PECUNIA S.A. Bank FULL 100 100
BANCO SOCIETE GENERALE BRASIL S.A. Bank FULL 100 100 100 100
(5) CACIQUE PROMOTORA DE VENDAS LTDA Specialist Financing FULL 100 100
(5) COBRACRED COBRANCA ESPECIALIZADA LTDA
Financial Company FULL 100 100
(5) CREDIAL EMPREENDIMENTOS E SERVICOS LTDA
Specialist Financing FULL 100 100
MORDENO SOCIEDADES ANONIMAS Financial Company FULL 100 100 100 100
(2) NEWEDGE REPRESENTACOES LTDA (NEWEDGE BRAZIL)
Broker FULL 100 100
SG EQUIPMENT FINANCE S.A. ARRENDAMENTO MERCANTIL
Specialist Financing FULL 100 100 100 100
SOCIETE GENERALE S.A. CORRETORA DE CAMBIO, TITULOS E VALORES MOBILIARIOS
Broker FULL 100 100 100 100
BBulgaria
REGIONAL URBAN DEVELOPMENT FUND Specialist Financing FULL 51.86 51.86 52 52
SG EXPRESS BANK Bank FULL 99.74 99.74 99.74 99.74
SOCIETE GENERALE FACTORING Specialist Financing FULL 99.74 99.74 100 100
SOGELEASE BULGARIA Specialist Financing FULL 99.74 99.74 100 100
BBurkina Faso
SOCIETE GENERALE BURKINA FASO Bank FULL 51.27 51.27 52.61 52.61
CCameroon
SOCIETE GENERALE CAMEROUN Bank FULL 58.08 58.08 58.08 58.08
CCanada
KLEINWORT BENSON INTERNATIONAL TRUSTEES LIMITED
Bank FULL 100 100 100 100
SG CONSTELLATION CANADA LTD. Specialist Financing FULL 100 100 100 100
(8) SG HAMBROS TRUST COMPANY (CANADA) INC
Financial Company FULL 100 100 100 100
(1) SOCIETE GENERALE (CANADA BRANCH) Bank FULL 100 100 100 100
SOCIETE GENERALE (CANADA) Bank FULL 100 100 100 100
SOCIETE GENERALE CAPITAL CANADA INC Broker FULL 100 100 100 100
CChina
ALD FORTUNE AUTO LEASING & RENTING SHANGHAI CO. LTD
Specialist Financing EFS 39.91 50 50 50
(4) FORTUNE SG FUND MANAGEMENT CO, LTD. Financial Company EJV 49 49
SOCIETE GENERALE (CHINA) LIMITED Bank FULL 100 100 100 100
SOCIETE GENERALE LEASING AND RENTING CO. LTD
Specialist Financing FULL 100 100 100 100
SSouth Korea
SG SECURITIES KOREA CO, LTD Broker FULL 100 100 100 100
(1) SG SEOUL Bank FULL 100 100 100 100
CCôte d’’IIvoire
SOCIETE GENERALE DE BANQUES EN COTE D’IVOIRE
Bank FULL 73.25 73.25 73.25 73.25

6
NOTES TO THE CONSOLIDATED FINANCIAL STATEMENTS
2 I 6 FF I NA NC I A L I NF O RMA T I O NN
S O C I E T E G E N E R AL E G R O U P I 2018 REGISTRATION DOCUMENT I 417
Group ownership interest Group voting
interest
CCountry Activity Method*
At 31.12.2017
At 31.12.2016
At 31.12.2017
At 31.12.2016
SOGEBOURSE EN COTE D’IVOIRE Portfolio Management FULL 71.27 71.27 100 100
CCroatia
ALD AUTOMOTIVE D.O.O. ZA. OPERATIVNI I FINANCIJSKI LEASING
Specialist Financing FULL 79.82 100 100 100
(4) S.B.ZGRADA Group Real Estate Management Company
FULL 100 100
(4) SG LEASING D.O.O. Specialist Financing FULL 100 100
(4) SOCIETE GENERALE-SPLITSKA BANKA D.D. Bank FULL 100 100
CCuraçao
SGA SOCIETE GENERALE ACCEPTANCE N.V Financial Company FULL 100 100 100 100
DDenmark
ALD AUTOMOTIVE A/S Specialist Financing FULL 79.82 100 100 100
NF FLEET A/S Specialist Financing FULL 63.85 80 80 80
PEMA LAST OG- TRAILERUDLEJNING A/S Specialist Financing FULL 100 100 100 100
(1) SG FINANS AS DANISH BRANCH Specialist Financing FULL 100 100 100 100
UUnited Arab Emirates
(1) SOCIETE GENERALE DUBAI Bank FULL 100 100 100 100
SSpain
ALD AUTOMOTIVE S.A.U Specialist Financing FULL 79.82 100 100 100
(6) ALD AUTORENTING S.A.U. Specialist Financing FULL 79.82 100
ALTURA MARKETS, SOCIEDAD DE VALORES, SA
Broker EJV 50 50 50 50
(1) GENEFIM SUCURSAL EN ESPANA Real Estate and Real Estate Financing
FULL 100 100 100 100
PARCOURS IBERIA SA Specialist Financing FULL 79.82 100 100 100
SELF TRADE BANK SA Broker FULL 100 100 100 100
SG EQUIPMENT FINANCE IBERIA, E.F.C, S.A. Specialist Financing FULL 100 100 100 100
SOCGEN INVERSIONES FINANCIERAS SA Financial Company FULL 100 100 100 100
(1) SOCIETE GENERALE SUCCURSAL EN ESPANA Bank FULL 100 100 100 100
SODEPROM Real Estate and Real Estate Financing
FULL 100 100 100 100
EEstonia
ALD AUTOMOTIVE EESTI AS Specialist Financing EFS 59.87 75.01 75.01 75.01
UUnited States
AEGIS HOLDINGS (ONSHORE) INC. Financial Company FULL 100 100 100 100
(8) CGI FINANCE INC Financial Company FULL 99.89 99.89 100 100
(8) CGI NORTH AMERICA INC. Specialist Financing FULL 99.89 99.89 100 100
(8) CLASSIC YACHT DOCUMENTATION, INC. Services FULL 99.89 99.89 100 100
LYXOR ASSET MANAGEMENT HOLDING CORP. Portfolio Management FULL 100 100 100 100
LYXOR ASSET MANAGEMENT INC. Financial Company FULL 100 100 100 100
SG AMERICAS EQUITIES CORP. Financial Company FULL 100 100 100 100

6 I 2
NOTES TO THE CONSOLIDATED FINANCIAL STATEMENTS FFINANCIAL INFORMATIONN
418 I 2018 REGISTRATION DOCUMENT I S O C I E T E G E N E R AL E G R O U P
Group ownership interest Group voting
interest
CCountry Activity Method*
At 31.12.2017
At 31.12.2016
At 31.12.2017
At 31.12.2016
SG AMERICAS OPERATIONAL SERVICES, INC. Services FULL 100 100 100 100
SG AMERICAS SECURITIES HOLDINGS, LLC Bank FULL 100 100 100 100
SG AMERICAS SECURITIES, LLC Broker FULL 100 100 100 100
SG AMERICAS, INC. Financial Company FULL 100 100 100 100
SG CONSTELLATION, INC. Financial Company FULL 100 100 100 100
SG EQUIPMENT FINANCE USA CORP. Specialist Financing FULL 100 100 100 100
SG MORTGAGE FINANCE CORP. Financial Company FULL 100 100 100 100
SG MORTGAGE SECURITIES, LLC Portfolio Management FULL 100 100 100 100
SG REINSURANCE INTERMEDIARY BROKERAGE, LLC
Insurance FULL 100 100 100 100
SG STRUCTURED PRODUCTS, INC. Specialist Financing FULL 100 100 100 100
SGAIF, LLC Financial Company FULL 100 100 100 100
SGAIH, INC. Financial Company FULL 100 100 100 100
(8) SGB FINANCE NORTH AMERICA INC. Specialist Financing FULL 50.94 50.94 100 100
(1) SOCIETE GENERALE (NEW YORK) Bank FULL 100 100 100 100
SOCIETE GENERALE ENERGY LLC Financial Company FULL 100 100 100 100
SOCIETE GENERALE FINANCIAL CORPORATION
Financial Company FULL 100 100 100 100
SOCIETE GENERALE INVESTMENT CORPORATION
Financial Company FULL 100 100 100 100
SOCIETE GENERALE LIQUIDITY FUNDING, LLC Financial Company FULL 100 100 100 100
TENDER OPTION BOND PROGRAM Financial Company FULL 100 100 100 100
FFinland
AXUS FINLAND OY Specialist Financing FULL 79.82 100 100 100
(2) EASY KM OY Specialist Financing FULL 100 100
NF FLEET OY Specialist Financing FULL 63.85 80 80 80
FFrance
(6) 29 HAUSSMANN EQUILIBRE Portfolio Management FULL 87.1 87.1
(6) 29 HAUSSMANN EURO RDT Portfolio Management FULL 58.1 58.1
(6) 29 HAUSSMANN SELECTION MONDE Portfolio Management FULL 68.7 68.7
9 RUE DES BIENVENUS Real Estate and Real Estate Financing
FULL 95.5 95.5 100 100
(4) ADILOTZ Real Estate and Real Estate Financing
ESI 61 100
AIR BAIL Specialist Financing FULL 100 100 100 100
AIX - BORD DU LAC - 3 Real Estate and Real Estate Financing
EJV 50 50 50 50
AIX - BORD DU LAC - 4 Real Estate and Real Estate Financing
EJV 50 50 50 50
(3) ALBIGNY AVORAUX Real Estate and Real Estate Financing
FULL 95.5 100
ALD Specialist Financing FULL 79.82 100 79.82 100
ALD AUTOMOTIVE RUSSIE SAS Specialist Financing FULL 79.82 100 100 100
ALPRIM Real Estate and Real Estate Financing
FULL 100 100 100 100

6
NOTES TO THE CONSOLIDATED FINANCIAL STATEMENTS
2 I 6 FF I NA NC I A L I NF O RMA T I O NN
S O C I E T E G E N E R AL E G R O U P I 2018 REGISTRATION DOCUMENT I 419
Group ownership interest Group voting
interest
CCountry Activity Method*
At 31.12.2017
At 31.12.2016
At 31.12.2017
At 31.12.2016
ANTALIS SA Financial Company FULL 100 100 100 100
(6) ANTARES Real Estate and Real Estate Financing
ESI 45 45
ANTARIUS Insurance FULL 100 50 100 50
(3) ANTARIUS FONDS ACTIONS PLUS Financial Company EJV 50 100
(3) ANTARIUS FONDS OBLIGATAIRE Financial Company EJV 49.75 99.5
(3) ANTARIUS OBLI 1-3 ANS Financial Company EJV 50 100
(3) ANTARIUS ROTATION SECTORIELLE Financial Company EJV 48.63 97.27
(4) AQPRIM Real Estate and Real Estate Financing
FULL 55 55
(4) ATLANTIQUE DEVELOPPEMENT IMMOBILIER Real Estate and Real Estate Financing
ESI 40 40
AVIVA INVESTORS RESERVE EUROPE Financial Company FULL 69.35 31.44 69.35 62.89
(6) AXA SOGECAP LOAN Portfolio Management FULL 100 100
BANQUE COURTOIS Bank FULL 100 100 100 100
BANQUE FRANCAISE COMMERCIALE OCEAN INDIEN
Bank FULL 50 50 50 50
BANQUE KOLB Bank FULL 99.97 99.87 99.97 99.87
BANQUE LAYDERNIER Bank FULL 100 100 100 100
BANQUE NUGER Bank FULL 100 100 100 100
BANQUE POUYANNE Bank ESI 35 35 35 35
BANQUE RHONE ALPES Bank FULL 99.99 99.99 99.99 99.99
BANQUE TARNEAUD Bank FULL 100 100 100 100
BOURSORAMA INVESTISSEMENT Services FULL 100 100 100 100
BOURSORAMA SA Broker FULL 100 100 100 100
BREMANY LEASE SAS Specialist Financing FULL 79.82 100 100 100
CAEN - RUE BASSE Real Estate and Real Estate Financing
FULL 100 80.18 100 100
CAEN - RUE DU GENERAL MOULIN Real Estate and Real Estate Financing
FULL 100 80.18 100 100
CARBURAUTO Group Real Estate Management Company
EJV 50 50 50 50
CARRERA Group Real Estate Management Company
EJV 50 50 50 50
CENTRE IMMO PROMOTION Real Estate and Real Estate Financing
FULL 60 60 60 60
CHARTREUX LOT A1 Real Estate and Real Estate Financing
FULL 100 80.18 100 100
CHEMIN DES COMBES Real Estate and Real Estate Financing
FULL 95.5 95.5 100 100
(3) COEUR DE LEZ Real Estate and Real Estate Financing
ESI 30 30
(2) COEUR EUROPE Real Estate and Real Estate Financing
EJV 50 50
COMPAGNIE FINANCIERE DE BOURBON Specialist Financing FULL 99.99 99.99 100 100
COMPAGNIE FONCIERE DE LA MEDITERRANEE (CFM)
Group Real Estate Management Company
FULL 100 100 100 100
COMPAGNIE GENERALE D’AFFACTURAGE Services FULL 100 100 100 100
COMPAGNIE GENERALE DE LOCATION D’EQUIPEMENTS
Specialist Financing FULL 99.89 99.89 99.89 99.89
CONTE Group Real Estate Management Company
EJV 50 50 50 50
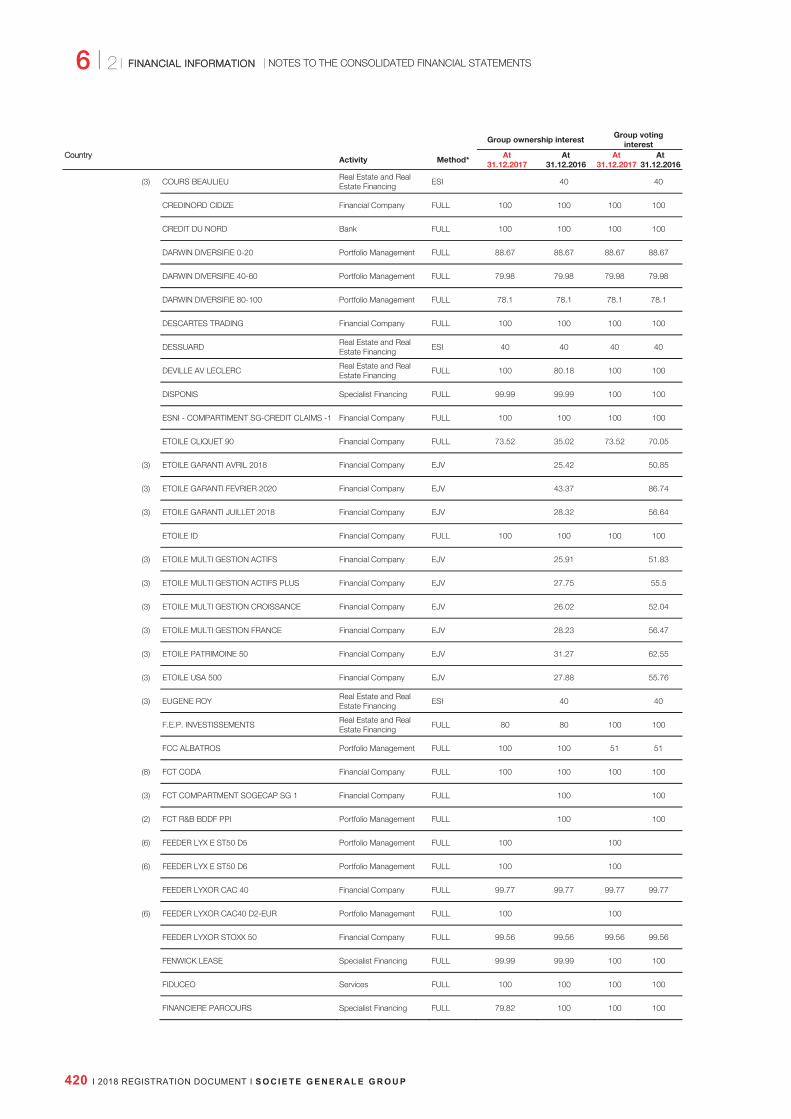
6 I 2
NOTES TO THE CONSOLIDATED FINANCIAL STATEMENTS FFINANCIAL INFORMATIONN
420 I 2018 REGISTRATION DOCUMENT I S O C I E T E G E N E R AL E G R O U P
Group ownership interest Group voting
interest
CCountry Activity Method*
At 31.12.2017
At 31.12.2016
At 31.12.2017
At 31.12.2016
(3) COURS BEAULIEU Real Estate and Real Estate Financing
ESI 40 40
CREDINORD CIDIZE Financial Company FULL 100 100 100 100
CREDIT DU NORD Bank FULL 100 100 100 100
DARWIN DIVERSIFIE 0-20 Portfolio Management FULL 88.67 88.67 88.67 88.67
DARWIN DIVERSIFIE 40-60 Portfolio Management FULL 79.98 79.98 79.98 79.98
DARWIN DIVERSIFIE 80-100 Portfolio Management FULL 78.1 78.1 78.1 78.1
DESCARTES TRADING Financial Company FULL 100 100 100 100
DESSUARD Real Estate and Real Estate Financing
ESI 40 40 40 40
DEVILLE AV LECLERC Real Estate and Real Estate Financing
FULL 100 80.18 100 100
DISPONIS Specialist Financing FULL 99.99 99.99 100 100
ESNI - COMPARTIMENT SG-CREDIT CLAIMS -1 Financial Company FULL 100 100 100 100
ETOILE CLIQUET 90 Financial Company FULL 73.52 35.02 73.52 70.05
(3) ETOILE GARANTI AVRIL 2018 Financial Company EJV 25.42 50.85
(3) ETOILE GARANTI FEVRIER 2020 Financial Company EJV 43.37 86.74
(3) ETOILE GARANTI JUILLET 2018 Financial Company EJV 28.32 56.64
ETOILE ID Financial Company FULL 100 100 100 100
(3) ETOILE MULTI GESTION ACTIFS Financial Company EJV 25.91 51.83
(3) ETOILE MULTI GESTION ACTIFS PLUS Financial Company EJV 27.75 55.5
(3) ETOILE MULTI GESTION CROISSANCE Financial Company EJV 26.02 52.04
(3) ETOILE MULTI GESTION FRANCE Financial Company EJV 28.23 56.47
(3) ETOILE PATRIMOINE 50 Financial Company EJV 31.27 62.55
(3) ETOILE USA 500 Financial Company EJV 27.88 55.76
(3) EUGENE ROY Real Estate and Real Estate Financing
ESI 40 40
F.E.P. INVESTISSEMENTS Real Estate and Real Estate Financing
FULL 80 80 100 100
FCC ALBATROS Portfolio Management FULL 100 100 51 51
(8) FCT CODA Financial Company FULL 100 100 100 100
(3) FCT COMPARTMENT SOGECAP SG 1 Financial Company FULL 100 100
(2) FCT R&B BDDF PPI Portfolio Management FULL 100 100
(6) FEEDER LYX E ST50 D5 Portfolio Management FULL 100 100
(6) FEEDER LYX E ST50 D6 Portfolio Management FULL 100 100
FEEDER LYXOR CAC 40 Financial Company FULL 99.77 99.77 99.77 99.77
(6) FEEDER LYXOR CAC40 D2-EUR Portfolio Management FULL 100 100
FEEDER LYXOR STOXX 50 Financial Company FULL 99.56 99.56 99.56 99.56
FENWICK LEASE Specialist Financing FULL 99.99 99.99 100 100
FIDUCEO Services FULL 100 100 100 100
FINANCIERE PARCOURS Specialist Financing FULL 79.82 100 100 100

6
NOTES TO THE CONSOLIDATED FINANCIAL STATEMENTS
2 I 6 FF I NA NC I A L I NF O RMA T I O NN
S O C I E T E G E N E R AL E G R O U P I 2018 REGISTRATION DOCUMENT I 421
Group ownership interest Group voting
interest
CCountry Activity Method*
At 31.12.2017
At 31.12.2016
At 31.12.2017
At 31.12.2016
FINANCIERE UC Real Estate and Real Estate Financing
FULL 100 100 100 100
FINASSURANCE SNC Broker FULL 98.89 98.89 99 99
FRANFINANCE Specialist Financing FULL 99.99 99.99 99.99 99.99
FRANFINANCE LOCATION Specialist Financing FULL 99.99 99.99 100 100
GALYBET Real Estate and Real Estate Financing
FULL 100 100 100 100
(3) GARDEN PARK Real Estate and Real Estate Financing
ESI 40 40
GENEBANQUE Bank FULL 100 100 100 100
GENECAL FRANCE Specialist Financing FULL 100 100 100 100
GENECAR - SOCIETE GENERALE DE COURTAGE D’ASSURANCE ET DE REASSURANCE
Insurance FULL 100 100 100 100
GENECOMI Specialist Financing FULL 99.64 99.64 99.64 99.64
GENEFIM Real Estate and Real Estate Financing
FULL 100 100 100 100
GENEFINANCE Portfolio Management FULL 100 100 100 100
GENEGIS I Group Real Estate Management Company
FULL 100 100 100 100
GENEGIS II Group Real Estate Management Company
FULL 100 100 100 100
GENEVALMY Group Real Estate Management Company
FULL 100 100 100 100
IMAPRIM AMENAGEMENT Real Estate and Real Estate Financing
FULL 70 70 70 70
IMMOBILIER BORDEAUX Specialist Financing FULL 79.82 100 100 100
IMMOBILIERE PROMEX Real Estate and Real Estate Financing
ESI 35 35 35 35
(1) INORA LIFE FRANCE Insurance FULL 100 100 100 100
INTER EUROPE CONSEIL Financial Company FULL 100 100 100 100
INVESTIR IMMOBILIER - MAROMME Real Estate and Real Estate Financing
FULL 100 80.18 100 100
INVESTIR IMMOBILIER NORMANDIE Real Estate and Real Estate Financing
FULL 100 80 100 80
INVESTISSEMENT 81 Financial Company FULL 100 100 100 100
KOLB INVESTISSEMENT Financial Company FULL 100 100 100 100
LA BANQUE POSTALE FINANCEMENT Specialist Financing ESI 35 35 35 35
LA CORBEILLERIE Real Estate and Real Estate Financing
ESI 24 24 40 40
LA COURTINE Real Estate and Real Estate Financing
ESI 30 30 30 30
LA CROIX BOISEE Real Estate and Real Estate Financing
FULL 100 80.18 100 100
LA FONCIERE DE LA DEFENSE Real Estate and Real Estate Financing
FULL 99.99 99.99 100 100
(4) LAGUNAK Real Estate and Real Estate Financing
ESI 40 40
(3) LE HAMEAU DE DONAMARTIA Real Estate and Real Estate Financing
ESI 40 40
LES ALLEES DE L’EUROPE Real Estate and Real Estate Financing
ESI 34 34 34 34
LES CEDRES BLEUS Real Estate and Real Estate Financing
ESI 40 40 40 40
(3) LES DEUX POMMES D’OR Real Estate and Real Estate Financing
ESI 30 30
(4) LES HAUTS DE LA HAIE VIGNE Real Estate and Real Estate Financing
EJV 49 50
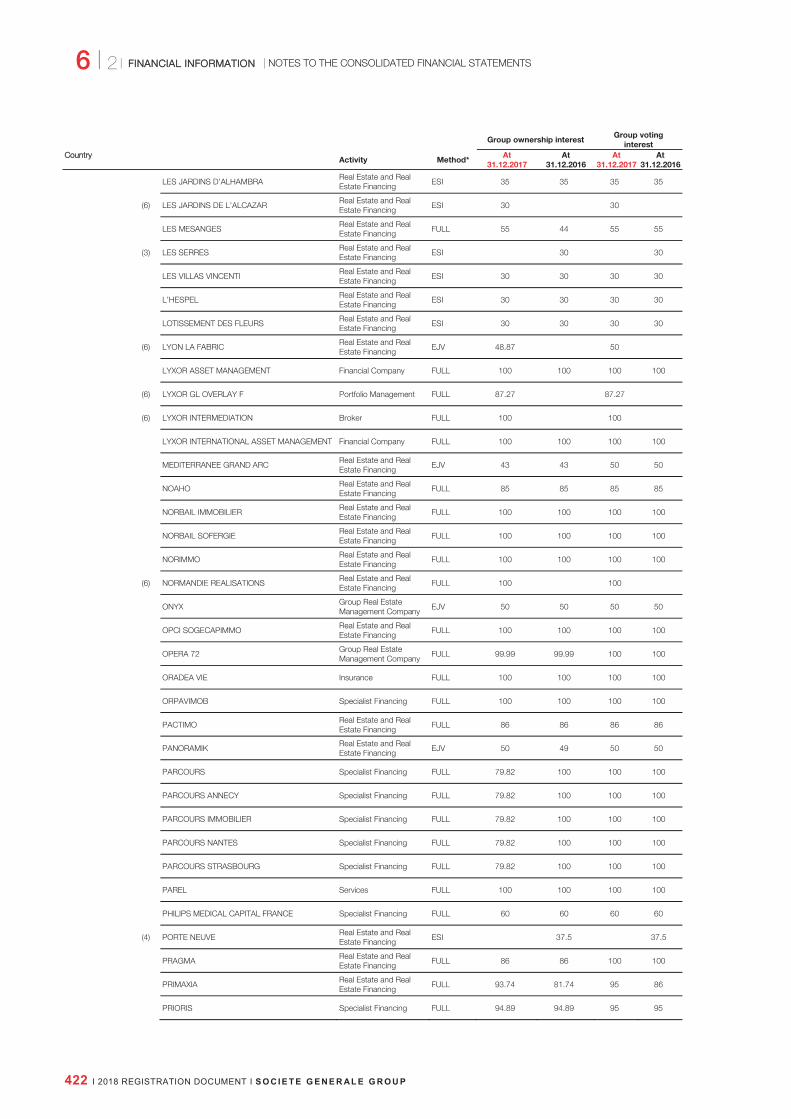
6 I 2
NOTES TO THE CONSOLIDATED FINANCIAL STATEMENTS FFINANCIAL INFORMATIONN
422 I 2018 REGISTRATION DOCUMENT I S O C I E T E G E N E R AL E G R O U P
Group ownership interest Group voting
interest
CCountry Activity Method*
At 31.12.2017
At 31.12.2016
At 31.12.2017
At 31.12.2016
LES JARDINS D’ALHAMBRA
Real Estate and Real Estate Financing
ESI 35 35 35 35
(6) LES JARDINS DE L’ALCAZAR
Real Estate and Real Estate Financing
ESI 30 30
LES MESANGES
Real Estate and Real Estate Financing
FULL 55 44 55 55
(3) LES SERRES
Real Estate and Real Estate Financing
ESI 30 30
LES VILLAS VINCENTI
Real Estate and Real Estate Financing
ESI 30 30 30 30
L’HESPEL
Real Estate and Real Estate Financing
ESI 30 30 30 30
LOTISSEMENT DES FLEURS
Real Estate and Real Estate Financing
ESI 30 30 30 30
(6) LYON LA FABRIC
Real Estate and Real Estate Financing
EJV 48.87 50
LYXOR ASSET MANAGEMENT Financial Company FULL 100 100 100 100
(6) LYXOR GL OVERLAY F Portfolio Management FULL 87.27 87.27
(6) LYXOR INTERMEDIATION Broker FULL 100 100
LYXOR INTERNATIONAL ASSET MANAGEMENT Financial Company FULL 100 100 100 100
MEDITERRANEE GRAND ARC
Real Estate and Real Estate Financing
EJV 43 43 50 50
NOAHO
Real Estate and Real Estate Financing
FULL 85 85 85 85
NORBAIL IMMOBILIER
Real Estate and Real Estate Financing
FULL 100 100 100 100
NORBAIL SOFERGIE
Real Estate and Real Estate Financing
FULL 100 100 100 100
NORIMMO
Real Estate and Real Estate Financing
FULL 100 100 100 100
(6) NORMANDIE REALISATIONS
Real Estate and Real Estate Financing
FULL 100 100
ONYX
Group Real Estate Management Company
EJV 50 50 50 50
OPCI SOGECAPIMMO
Real Estate and Real Estate Financing
FULL 100 100 100 100
OPERA 72
Group Real Estate Management Company
FULL 99.99 99.99 100 100
ORADEA VIE Insurance FULL 100 100 100 100
ORPAVIMOB Specialist Financing FULL 100 100 100 100
PACTIMO
Real Estate and Real Estate Financing
FULL 86 86 86 86
PANORAMIK
Real Estate and Real Estate Financing
EJV 50 49 50 50
PARCOURS Specialist Financing FULL 79.82 100 100 100
PARCOURS ANNECY Specialist Financing FULL 79.82 100 100 100
PARCOURS IMMOBILIER Specialist Financing FULL 79.82 100 100 100
PARCOURS NANTES Specialist Financing FULL 79.82 100 100 100
PARCOURS STRASBOURG Specialist Financing FULL 79.82 100 100 100
PAREL Services FULL 100 100 100 100
PHILIPS MEDICAL CAPITAL FRANCE Specialist Financing FULL 60 60 60 60
(4) PORTE NEUVE
Real Estate and Real Estate Financing
ESI 37.5 37.5
PRAGMA
Real Estate and Real Estate Financing
FULL 86 86 100 100
PRIMAXIA
Real Estate and Real Estate Financing
FULL 93.74 81.74 95 86
PRIORIS Specialist Financing FULL 94.89 94.89 95 95

6
NOTES TO THE CONSOLIDATED FINANCIAL STATEMENTS
2 I 6 FF I NA NC I A L I NF O RMA T I O NN
S O C I E T E G E N E R AL E G R O U P I 2018 REGISTRATION DOCUMENT I 423
Group ownership interest Group voting
interest
CCountry Activity Method*
At 31.12.2017
At 31.12.2016
At 31.12.2017
At 31.12.2016
PROGEREAL SA
Real Estate and Real Estate Financing
ESI 25.01 25.01 25.01 25.01
PROJECTIM
Real Estate and Real Estate Financing
FULL 60 60 60 60
RED & BLACK CONSUMER FRANCE 2013 Financial Company FULL 100 100 100 100
(6) RED & BLACK HOME LOANS FRANCE 1 Financial Company FULL 100 100
RIVAPRIM
Real Estate and Real Estate Financing
FULL 80 80 80 80
S.C.I. DU DOMAINE DE STONEHAM
Real Estate and Real Estate Financing
EJV 50 50 50 50
(2) S.C.I. LES JARDINS DE XANA
Real Estate and Real Estate Financing
ESI 40 40
SAGEMCOM LEASE Specialist Financing FULL 99.99 99.99 100 100
SAINT CLAIR
Real Estate and Real Estate Financing
EJV 50 40 50 50
SAINT-MARTIN 3
Real Estate and Real Estate Financing
EJV 50 50 50 50
(2) SARL ALPRIM HABITAT
Real Estate and Real Estate Financing
FULL 100 100
SARL CS 72 - KERIADENN
Real Estate and Real Estate Financing
ESI 32.5 57.5 32.5 95
SARL D’AMENAGEMENT DU MARTINET
Real Estate and Real Estate Financing
EJV 43 43 50 50
(6) SARL DE LA COTE D’OPALE
Real Estate and Real Estate Financing
ESI 35 35
SARL DE LA VECQUERIE
Real Estate and Real Estate Financing
ESI 32.5 57.5 32.5 95
(4) SARL DT 6 NANTES
Real Estate and Real Estate Financing
EJV 70 100
SARL EKO BOUAYE
Real Estate and Real Estate Financing
ESI 35 61 35 100
(4) SARL ORIO
Real Estate and Real Estate Financing
ESI 40 40
SARL SEINE CLICHY
Real Estate and Real Estate Financing
FULL 100 100 100 100
SAS AMIENS - AVENUE DU GENERAL FOY
Real Estate and Real Estate Financing
FULL 80 80 100 100
SAS COPRIM RESIDENCES
Real Estate and Real Estate Financing
FULL 100 100 100 100
SAS ECULLY SO’IN
Real Estate and Real Estate Financing
FULL 71.62 52.5 75 52.5
SAS LOIRE ATLANTIQUE TERTIAIRE
Real Estate and Real Estate Financing
EJV 50 70 50 100
SAS MS FRANCE
Real Estate and Real Estate Financing
ESI 40 40 40 40
SAS NOAHO AMENAGEMENT
Real Estate and Real Estate Financing
FULL 95.5 95.5 100 100
SAS NORMANDIE HABITAT
Real Estate and Real Estate Financing
FULL 100 86 100 100
SAS NORMANDIE RESIDENCES
Real Estate and Real Estate Financing
FULL 100 98 100 100
(6) SAS NOYALIS
Real Estate and Real Estate Financing
ESI 28 28
SAS PARNASSE
Real Estate and Real Estate Financing
FULL 100 100 100 100
(6) SAS PROJECTIM IMMOBILIER
Real Estate and Real Estate Financing
FULL 80 100
(6) SAS RESIDENCIAL
Real Estate and Real Estate Financing
FULL 68.4 68.4
(6) SAS SOGEBROWN POISSY
Real Estate and Real Estate Financing
EJV 50 50
(6) SAS SOGEMYSJ
Real Estate and Real Estate Financing
FULL 51 51
SAS SOGEPROM TERTIAIRE
Real Estate and Real Estate Financing
FULL 100 100 100 100
SAS TOUR D2
Real Estate and Real Estate Financing
JO 50 50 50 50
(6) SAS ZAC DU TRIANGLE
Real Estate and Real Estate Financing
FULL 48.7 51
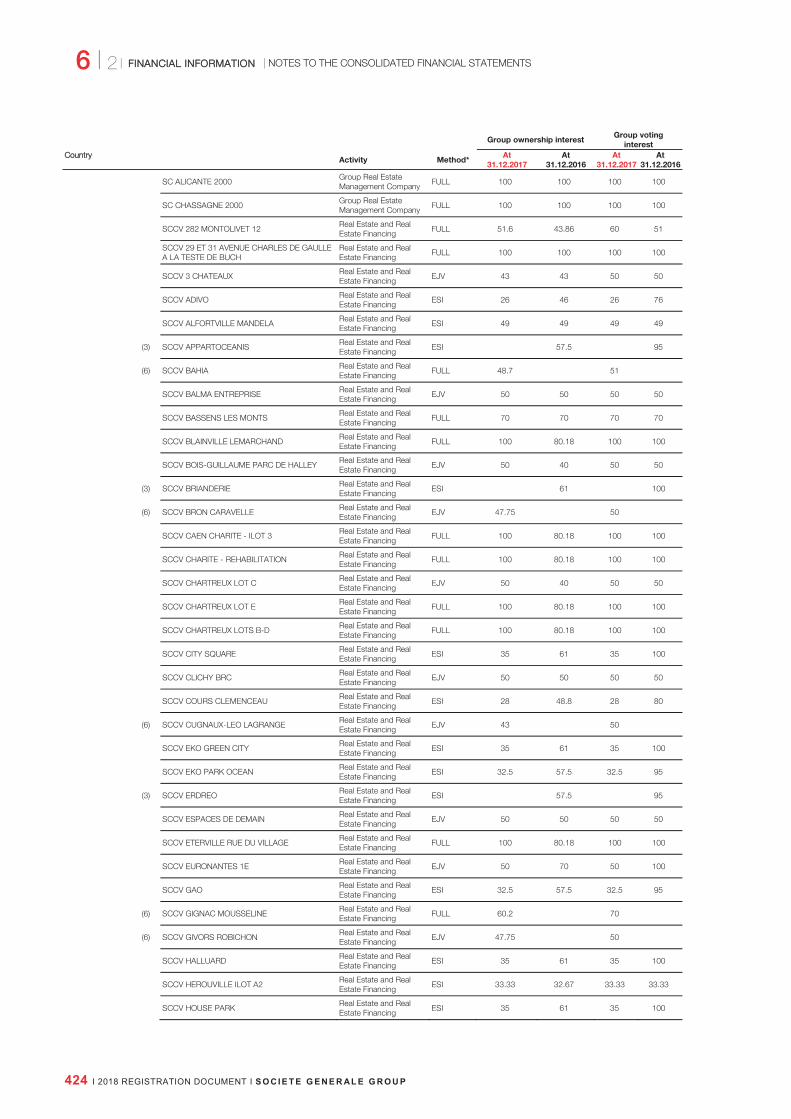
6 I 2
NOTES TO THE CONSOLIDATED FINANCIAL STATEMENTS FFINANCIAL INFORMATIONN
424 I 2018 REGISTRATION DOCUMENT I S O C I E T E G E N E R AL E G R O U P
Group ownership interest Group voting
interest
CCountry Activity Method*
At 31.12.2017
At 31.12.2016
At 31.12.2017
At 31.12.2016
SC ALICANTE 2000
Group Real Estate Management Company
FULL 100 100 100 100
SC CHASSAGNE 2000
Group Real Estate Management Company
FULL 100 100 100 100
SCCV 282 MONTOLIVET 12
Real Estate and Real Estate Financing
FULL 51.6 43.86 60 51
SCCV 29 ET 31 AVENUE CHARLES DE GAULLE A LA TESTE DE BUCH
Real Estate and Real Estate Financing
FULL 100 100 100 100
SCCV 3 CHATEAUX
Real Estate and Real Estate Financing
EJV 43 43 50 50
SCCV ADIVO
Real Estate and Real Estate Financing
ESI 26 46 26 76
SCCV ALFORTVILLE MANDELA
Real Estate and Real Estate Financing
ESI 49 49 49 49
(3) SCCV APPARTOCEANIS
Real Estate and Real Estate Financing
ESI 57.5 95
(6) SCCV BAHIA
Real Estate and Real Estate Financing
FULL 48.7 51
SCCV BALMA ENTREPRISE
Real Estate and Real Estate Financing
EJV 50 50 50 50
SCCV BASSENS LES MONTS
Real Estate and Real Estate Financing
FULL 70 70 70 70
SCCV BLAINVILLE LEMARCHAND
Real Estate and Real Estate Financing
FULL 100 80.18 100 100
SCCV BOIS-GUILLAUME PARC DE HALLEY
Real Estate and Real Estate Financing
EJV 50 40 50 50
(3) SCCV BRIANDERIE
Real Estate and Real Estate Financing
ESI 61 100
(6) SCCV BRON CARAVELLE
Real Estate and Real Estate Financing
EJV 47.75 50
SCCV CAEN CHARITE - ILOT 3
Real Estate and Real Estate Financing
FULL 100 80.18 100 100
SCCV CHARITE - REHABILITATION
Real Estate and Real Estate Financing
FULL 100 80.18 100 100
SCCV CHARTREUX LOT C
Real Estate and Real Estate Financing
EJV 50 40 50 50
SCCV CHARTREUX LOT E
Real Estate and Real Estate Financing
FULL 100 80.18 100 100
SCCV CHARTREUX LOTS B-D
Real Estate and Real Estate Financing
FULL 100 80.18 100 100
SCCV CITY SQUARE
Real Estate and Real Estate Financing
ESI 35 61 35 100
SCCV CLICHY BRC
Real Estate and Real Estate Financing
EJV 50 50 50 50
SCCV COURS CLEMENCEAU
Real Estate and Real Estate Financing
ESI 28 48.8 28 80
(6) SCCV CUGNAUX-LEO LAGRANGE
Real Estate and Real Estate Financing
EJV 43 50
SCCV EKO GREEN CITY
Real Estate and Real Estate Financing
ESI 35 61 35 100
SCCV EKO PARK OCEAN
Real Estate and Real Estate Financing
ESI 32.5 57.5 32.5 95
(3) SCCV ERDREO
Real Estate and Real Estate Financing
ESI 57.5 95
SCCV ESPACES DE DEMAIN
Real Estate and Real Estate Financing
EJV 50 50 50 50
SCCV ETERVILLE RUE DU VILLAGE
Real Estate and Real Estate Financing
FULL 100 80.18 100 100
SCCV EURONANTES 1E
Real Estate and Real Estate Financing
EJV 50 70 50 100
SCCV GAO
Real Estate and Real Estate Financing
ESI 32.5 57.5 32.5 95
(6) SCCV GIGNAC MOUSSELINE
Real Estate and Real Estate Financing
FULL 60.2 70
(6) SCCV GIVORS ROBICHON
Real Estate and Real Estate Financing
EJV 47.75 50
SCCV HALLUARD
Real Estate and Real Estate Financing
ESI 35 61 35 100
SCCV HEROUVILLE ILOT A2
Real Estate and Real Estate Financing
ESI 33.33 32.67 33.33 33.33
SCCV HOUSE PARK
Real Estate and Real Estate Financing
ESI 35 61 35 100

6
NOTES TO THE CONSOLIDATED FINANCIAL STATEMENTS
2 I 6 FF I NA NC I A L I NF O RMA T I O NN
S O C I E T E G E N E R AL E G R O U P I 2018 REGISTRATION DOCUMENT I 425
Group ownership interest Group voting
interest
CCountry Activity Method*
At 31.12.2017
At 31.12.2016
At 31.12.2017
At 31.12.2016
(6) SCCV JA LE HAVRE 22 COTY
Real Estate and Real Estate Financing
ESI 40 40
SCCV JDA OUISTREHAM
Real Estate and Real Estate Financing
EJV 50 49 50 50
(6) SCCV KYMA MERIGNAC
Real Estate and Real Estate Financing
ESI 30 30
SCCV LA PORTE DU CANAL
Real Estate and Real Estate Financing
EJV 50 50 50 50
SCCV LACASSAGNE BRICKS
Real Estate and Real Estate Financing
ESI 49 49 49 49
(6) SCCV LE COURTIL
Real Estate and Real Estate Financing
ESI 35 35
SCCV LE SIX
Real Estate and Real Estate Financing
ESI 24.5 42.7 24.5 70
SCCV LE TEICH COEUR DE VILLE
Real Estate and Real Estate Financing
ESI 30 68.5 30 100
SCCV LES ECRIVAINS
Real Estate and Real Estate Financing
FULL 70 86.5 70 100
SCCV LES PATIOS D’OR DE FLEURY LES AUBRAIS
Real Estate and Real Estate Financing
FULL 64 64 80 80
SCCV LES SUCRES
Real Estate and Real Estate Financing
EJV 47.75 47.75 50 50
SCCV MARCQ PROJECTIM
Real Estate and Real Estate Financing
FULL 64 64 80 80
(2) SCCV MARQUET PROJECTIM
Real Estate and Real Estate Financing
FULL 68 85
SCCV MASSON BEAU
Real Estate and Real Estate Financing
ESI 30 30 30 30
(6) SCCV MONROC - LOT 3
Real Estate and Real Estate Financing
EJV 43 50
SCCV MONTREUIL ACACIA
Real Estate and Real Estate Financing
FULL 80 80 80 80
SCCV NATUREO
Real Estate and Real Estate Financing
ESI 30 30 30 30
(6) SCCV NOAHO HABITAT
Real Estate and Real Estate Financing
FULL 97.75 100
SCCV PARIS ALBERT
Real Estate and Real Estate Financing
EJV 50 50 50 50
(6) SCCV PARK OCEAN II
Real Estate and Real Estate Financing
ESI 35 35
SCCV PRADES BLEU HORIZON
Real Estate and Real Estate Financing
EJV 43 43 50 50
SCCV QUAI DE SEINE A ALFORTVILLE
Real Estate and Real Estate Financing
EJV 51 50 51 50
(2) SCCV RIVER GREEN
Real Estate and Real Estate Financing
FULL 99.6 100
SCCV ROUEN 27 ANGLAIS
Real Estate and Real Estate Financing
FULL 100 97.82 100 100
(6) SCCV ROUSSET - LOT 03
Real Estate and Real Estate Financing
FULL 60.2 70
SCCV SAY
Real Estate and Real Estate Financing
ESI 35 61 35 100
SCCV SENGHOR
Real Estate and Real Estate Financing
ESI 35 61 35 100
(6) SCCV SOGAB ROMAINVILLE
Real Estate and Real Estate Financing
FULL 80 80
SCCV SWING RIVE GAUCHE
Real Estate and Real Estate Financing
EJV 43 43 50 50
SCCV TALENCE PUR
Real Estate and Real Estate Financing
FULL 95 97.75 95 100
SCCV VAULX PABLO PICASSO
Real Estate and Real Estate Financing
EJV 47.75 47.75 50 50
SCCV VERNAISON - RAZAT
Real Estate and Real Estate Financing
EJV 47.75 47.75 50 50
SCCV VILLA CHANZY
Real Estate and Real Estate Financing
ESI 40 40 40 40
(3) SCI 11 AVENUE DU NORD TASSIN
Real Estate and Real Estate Financing
ESI 30 30
SCI 1134, AVENUE DE L’EUROPE A CASTELNAU LE LEZ
Real Estate and Real Estate Financing
EJV 43 43 50 50
SCI 637 ROUTE DE FRANS
Real Estate and Real Estate Financing
ESI 30 30 30 30
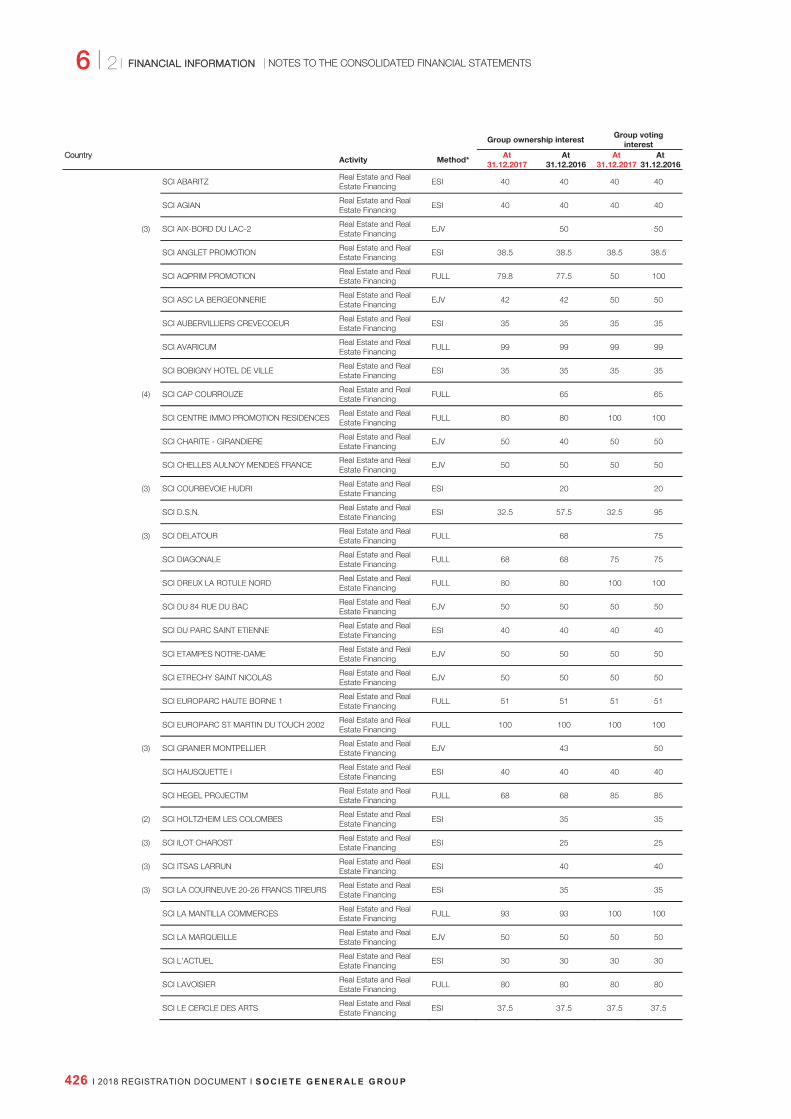
6 I 2
NOTES TO THE CONSOLIDATED FINANCIAL STATEMENTS FFINANCIAL INFORMATIONN
426 I 2018 REGISTRATION DOCUMENT I S O C I E T E G E N E R AL E G R O U P
Group ownership interest Group voting
interest
CCountry Activity Method*
At 31.12.2017
At 31.12.2016
At 31.12.2017
At 31.12.2016
SCI ABARITZ
Real Estate and Real Estate Financing
ESI 40 40 40 40
SCI AGIAN
Real Estate and Real Estate Financing
ESI 40 40 40 40
(3) SCI AIX-BORD DU LAC-2
Real Estate and Real Estate Financing
EJV 50 50
SCI ANGLET PROMOTION
Real Estate and Real Estate Financing
ESI 38.5 38.5 38.5 38.5
SCI AQPRIM PROMOTION
Real Estate and Real Estate Financing
FULL 79.8 77.5 50 100
SCI ASC LA BERGEONNERIE
Real Estate and Real Estate Financing
EJV 42 42 50 50
SCI AUBERVILLIERS CREVECOEUR
Real Estate and Real Estate Financing
ESI 35 35 35 35
SCI AVARICUM
Real Estate and Real Estate Financing
FULL 99 99 99 99
SCI BOBIGNY HOTEL DE VILLE
Real Estate and Real Estate Financing
ESI 35 35 35 35
(4) SCI CAP COURROUZE
Real Estate and Real Estate Financing
FULL 65 65
SCI CENTRE IMMO PROMOTION RESIDENCES
Real Estate and Real Estate Financing
FULL 80 80 100 100
SCI CHARITE - GIRANDIERE
Real Estate and Real Estate Financing
EJV 50 40 50 50
SCI CHELLES AULNOY MENDES FRANCE
Real Estate and Real Estate Financing
EJV 50 50 50 50
(3) SCI COURBEVOIE HUDRI
Real Estate and Real Estate Financing
ESI 20 20
SCI D.S.N.
Real Estate and Real Estate Financing
ESI 32.5 57.5 32.5 95
(3) SCI DELATOUR
Real Estate and Real Estate Financing
FULL 68 75
SCI DIAGONALE
Real Estate and Real Estate Financing
FULL 68 68 75 75
SCI DREUX LA ROTULE NORD
Real Estate and Real Estate Financing
FULL 80 80 100 100
SCI DU 84 RUE DU BAC
Real Estate and Real Estate Financing
EJV 50 50 50 50
SCI DU PARC SAINT ETIENNE
Real Estate and Real Estate Financing
ESI 40 40 40 40
SCI ETAMPES NOTRE-DAME
Real Estate and Real Estate Financing
EJV 50 50 50 50
SCI ETRECHY SAINT NICOLAS
Real Estate and Real Estate Financing
EJV 50 50 50 50
SCI EUROPARC HAUTE BORNE 1
Real Estate and Real Estate Financing
FULL 51 51 51 51
SCI EUROPARC ST MARTIN DU TOUCH 2002
Real Estate and Real Estate Financing
FULL 100 100 100 100
(3) SCI GRANIER MONTPELLIER
Real Estate and Real Estate Financing
EJV 43 50
SCI HAUSQUETTE I
Real Estate and Real Estate Financing
ESI 40 40 40 40
SCI HEGEL PROJECTIM
Real Estate and Real Estate Financing
FULL 68 68 85 85
(2) SCI HOLTZHEIM LES COLOMBES
Real Estate and Real Estate Financing
ESI 35 35
(3) SCI ILOT CHAROST
Real Estate and Real Estate Financing
ESI 25 25
(3) SCI ITSAS LARRUN
Real Estate and Real Estate Financing
ESI 40 40
(3) SCI LA COURNEUVE 20-26 FRANCS TIREURS
Real Estate and Real Estate Financing
ESI 35 35
SCI LA MANTILLA COMMERCES
Real Estate and Real Estate Financing
FULL 93 93 100 100
SCI LA MARQUEILLE
Real Estate and Real Estate Financing
EJV 50 50 50 50
SCI L’ACTUEL
Real Estate and Real Estate Financing
ESI 30 30 30 30
SCI LAVOISIER
Real Estate and Real Estate Financing
FULL 80 80 80 80
SCI LE CERCLE DES ARTS
Real Estate and Real Estate Financing
ESI 37.5 37.5 37.5 37.5

6
NOTES TO THE CONSOLIDATED FINANCIAL STATEMENTS
2 I 6 FF I NA NC I A L I NF O RMA T I O NN
S O C I E T E G E N E R AL E G R O U P I 2018 REGISTRATION DOCUMENT I 427
Group ownership interest Group voting
interest
CCountry Activity Method*
At 31.12.2017
At 31.12.2016
At 31.12.2017
At 31.12.2016
SCI LE DOMAINE DU PLESSIS
Real Estate and Real Estate Financing
ESI 20 20 20 20
SCI LE HAMEAU DES GRANDS PRES
Real Estate and Real Estate Financing
EJV 40 47 40 40
SCI LE MANOIR DE JEREMY
Real Estate and Real Estate Financing
ESI 40 40 40 40
(8) SCI LE PARC DE BORDEROUGE
Real Estate and Real Estate Financing
FULL 60 60 60 60
(3) SCI LE PARC ILGORA
Real Estate and Real Estate Financing
ESI 40 40
SCI LES BAIGNOTS
Real Estate and Real Estate Financing
ESI 40 40 40 40
SCI LES CASTELLINES
Real Estate and Real Estate Financing
ESI 30 30 30 30
SCI LES JARDINS DE LA BOURBRE
Real Estate and Real Estate Financing
ESI 40 40 40 40
SCI LES JARDINS D’IRIS
Real Estate and Real Estate Financing
FULL 60 60 60 60
SCI LES JARDINS DU BLAVET
Real Estate and Real Estate Financing
ESI 40 40 40 40
SCI LES PORTES DU LEMAN
Real Estate and Real Estate Financing
FULL 70 80 70 80
SCI LES RESIDENCES GENEVOISES
Real Estate and Real Estate Financing
FULL 90 90 90 90
SCI LES TERRASSES DE BEL AIR
Real Estate and Real Estate Financing
ESI 40 40 40 40
SCI LIEUSAINT RUE DE PARIS
Real Estate and Real Estate Financing
EJV 50 50 50 50
SCI LINAS COEUR DE VILLE 1
Real Estate and Real Estate Financing
FULL 70 70 70 70
SCI LOCMINE- LAMENNAIS
Real Estate and Real Estate Financing
ESI 30 30 30 30
SCI L’OREE DES LACS
Real Estate and Real Estate Financing
FULL 70 70 70 70
(3) SCI LYON 8 ALOUETTES
Real Estate and Real Estate Financing
ESI 25 25
(3) SCI LYON 8 NIEUPORT
Real Estate and Real Estate Financing
ESI 25 25
SCI LYON BON LAIT
Real Estate and Real Estate Financing
ESI 35 35 35 35
SCI LYON JOANNES
Real Estate and Real Estate Financing
EJV 47.8 47.8 50 50
SCI MARSEILLE LE ZEPHYR
Real Estate and Real Estate Financing
FULL 55.9 55.9 65 65
(3) SCI MASSY AMPERE
Real Estate and Real Estate Financing
ESI 40 40
(3) SCI MEAUX FOCH
Real Estate and Real Estate Financing
ESI 35 35
SCI MONTPELLIER JACQUES COEUR
Real Estate and Real Estate Financing
EJV 43 43 50 50
SCI NOAHO RESIDENCES
Real Estate and Real Estate Financing
FULL 95.5 95.5 100 100
(3) SCI NYMPHEAS BATIMENT C
Real Estate and Real Estate Financing
EJV 43 50
SCI PARCOURS TOURS Specialist Financing FULL 79.82 100 100 100
(3) SCI PARIS 182 CHATEAU DES RENTIERS
Real Estate and Real Estate Financing
FULL 63.5 60
(8) SCI PATRIS
Real Estate and Real Estate Financing
EJV 25.8 25.8 30 30
SCI PORTU ONDOAN
Real Estate and Real Estate Financing
ESI 40 40 40 40
SCI PROJECTIM HABITAT
Real Estate and Real Estate Financing
FULL 80 80 100 100
(3) SCI PROJECTIM HELLEMMES SEGUIN
Real Estate and Real Estate Financing
FULL 64 80
SCI PROJECTIM MARCQ COEUR DE VILLE
Real Estate and Real Estate Financing
EJV 48 48 60 60
SCI PRONY
Real Estate and Real Estate Financing
EJV 50 33.33 50 33.33
SCI QUINTEFEUILLE
Real Estate and Real Estate Financing
ESI 30 30 30 30

6 I 2
NOTES TO THE CONSOLIDATED FINANCIAL STATEMENTS FFINANCIAL INFORMATIONN
428 I 2018 REGISTRATION DOCUMENT I S O C I E T E G E N E R AL E G R O U P
Group ownership interest Group voting
interest
CCountry Activity Method*
At 31.12.2017
At 31.12.2016
At 31.12.2017
At 31.12.2016
SCI QUINTESSENCE-VALESCURE
Real Estate and Real Estate Financing
EJV 48 48 50 50
SCI REIMS GARE
Real Estate and Real Estate Financing
FULL 100 100 100 100
SCI RESIDENCE DU DONJON
Real Estate and Real Estate Financing
EJV 40 47 40 40
SCI RHIN ET MOSELLE 1
Real Estate and Real Estate Financing
FULL 100 100 100 100
SCI RHIN ET MOSELLE 2
Real Estate and Real Estate Financing
FULL 100 100 100 100
SCI RIVAPRIM HABITAT
Real Estate and Real Estate Financing
FULL 92 92 100 100
SCI RIVAPRIM RESIDENCES
Real Estate and Real Estate Financing
FULL 96 96 100 100
SCI ROUBAIX FOCH-LECLERC
Real Estate and Real Estate Financing
ESI 30 30 30 30
(6) SCI RSS INVESTIMMO COTE BASQUE
Real Estate and Real Estate Financing
ESI 20 20
(2) SCI RUE DE LA FRATERNITE
Real Estate and Real Estate Financing
ESI 25 25
(8) SCI SAINT JEAN
Real Estate and Real Estate Financing
ESI 40 40 40 40
SCI SAINT OUEN L’AUMONE - L’OISE
Real Estate and Real Estate Financing
EJV 38 46.75 38 38
SCI SAINT-DENIS WILSON
Real Estate and Real Estate Financing
FULL 60 67 60 60
(2) SCI SAINT-PIERRE-DES-CORPS/CAP 55
Real Estate and Real Estate Financing
FULL 80 100
SCI SCS IMMOBILIER D’ENTREPRISES
Real Estate and Real Estate Financing
FULL 52.8 52.8 66 66
SCI SOGECIP
Real Estate and Real Estate Financing
FULL 80 80 100 100
SCI SOGECTIM
Real Estate and Real Estate Financing
FULL 80 80 100 100
SCI SOGEPROM ATLANTIQUE
Real Estate and Real Estate Financing
FULL 80 88 80 100
(3) SCI SOGEPROM CIP CENTRE
Real Estate and Real Estate Financing
FULL 92 100
SCI STRASBOURG ETOILE THUMENAU
Real Estate and Real Estate Financing
ESI 35 35 35 35
SCI STRASBOURG ROUTE DE WASSELONNE
Real Estate and Real Estate Financing
ESI 35 35 35 35
SCI TERRES NOUVELLES FRANCILIENNES
Real Estate and Real Estate Financing
FULL 80 87 80 80
SCI TOULOUSE CENTREDA 3
Real Estate and Real Estate Financing
FULL 100 100 100 100
SCI VAILLANT COUTURIER
Real Estate and Real Estate Financing
ESI 25 25 25 25
SCI VALENCE-CHAMPS DE MARS
Real Estate and Real Estate Financing
EJV 50 50 50 50
(2) SCI VANNES AR PINEG
Real Estate and Real Estate Financing
ESI 40 40
SCI VELRI
Group Real Estate Management Company
EJV 50 50 50 50
SCI VILLA EMILIE
Real Estate and Real Estate Financing
ESI 35 35 35 35
SCI VITAL BOUHOT 16-22 NEUILLY SUR SEINE
Real Estate and Real Estate Financing
ESI 40 40 40 40
(3) SCI-LUCE-LE CARRE D’ OR-LOT E
Real Estate and Real Estate Financing
FULL 92 100
(6) SCPI GENEPIERRE
Real Estate and Real Estate Financing
FULL 45.08 45.08
SEFIA Specialist Financing FULL 99.89 50.94 100 51
SERVIPAR Specialist Financing FULL 79.82 100 100 100
SG 29 HAUSSMANN Financial Company FULL 100 100 100 100
(3) SG ACTIONS EURO SELECTION Financial Company FULL 58.24 58.24
(6) SG ACTIONS FRANCE Portfolio Management FULL 38.14 38.14
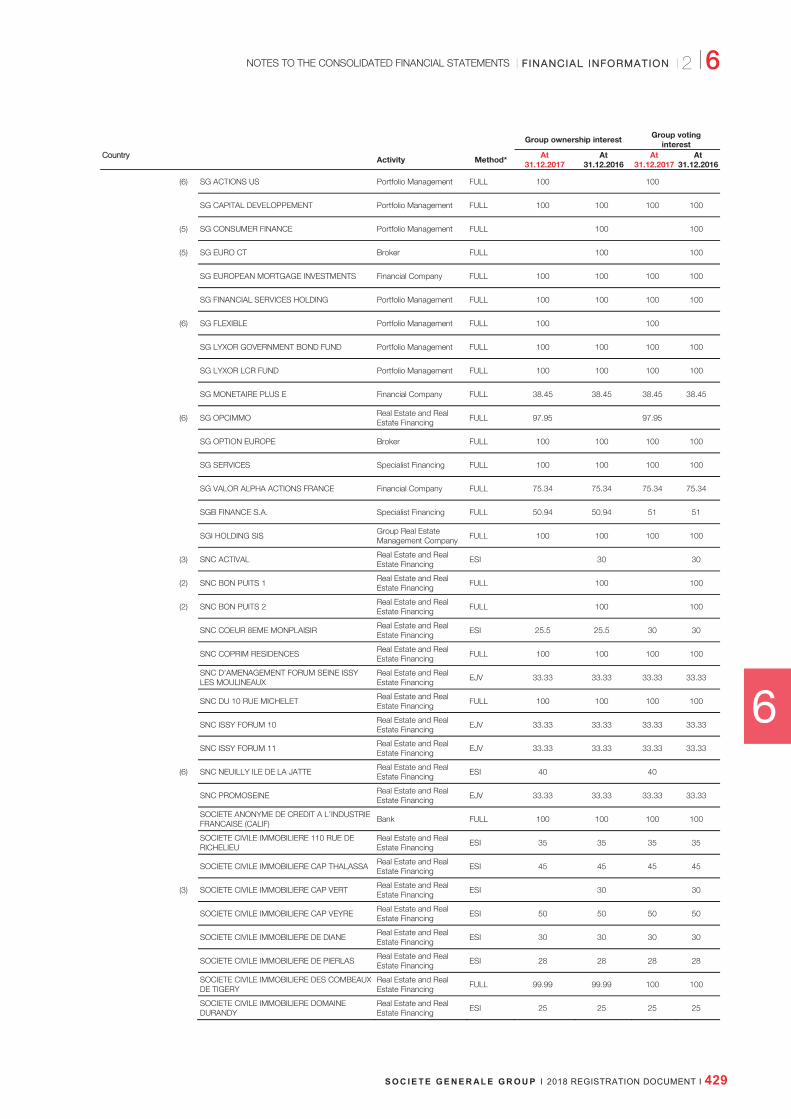
6
NOTES TO THE CONSOLIDATED FINANCIAL STATEMENTS
2 I 6 FF I NA NC I A L I NF O RMA T I O NN
S O C I E T E G E N E R AL E G R O U P I 2018 REGISTRATION DOCUMENT I 429
Group ownership interest Group voting
interest
CCountry Activity Method*
At 31.12.2017
At 31.12.2016
At 31.12.2017
At 31.12.2016
(6) SG ACTIONS US Portfolio Management FULL 100 100
SG CAPITAL DEVELOPPEMENT Portfolio Management FULL 100 100 100 100
(5) SG CONSUMER FINANCE Portfolio Management FULL 100 100
(5) SG EURO CT Broker FULL 100 100
SG EUROPEAN MORTGAGE INVESTMENTS Financial Company FULL 100 100 100 100
SG FINANCIAL SERVICES HOLDING Portfolio Management FULL 100 100 100 100
(6) SG FLEXIBLE Portfolio Management FULL 100 100
SG LYXOR GOVERNMENT BOND FUND Portfolio Management FULL 100 100 100 100
SG LYXOR LCR FUND Portfolio Management FULL 100 100 100 100
SG MONETAIRE PLUS E Financial Company FULL 38.45 38.45 38.45 38.45
(6) SG OPCIMMO
Real Estate and Real Estate Financing
FULL 97.95 97.95
SG OPTION EUROPE Broker FULL 100 100 100 100
SG SERVICES Specialist Financing FULL 100 100 100 100
SG VALOR ALPHA ACTIONS FRANCE Financial Company FULL 75.34 75.34 75.34 75.34
SGB FINANCE S.A. Specialist Financing FULL 50.94 50.94 51 51
SGI HOLDING SIS
Group Real Estate Management Company
FULL 100 100 100 100
(3) SNC ACTIVAL
Real Estate and Real Estate Financing
ESI 30 30
(2) SNC BON PUITS 1
Real Estate and Real Estate Financing
FULL 100 100
(2) SNC BON PUITS 2
Real Estate and Real Estate Financing
FULL 100 100
SNC COEUR 8EME MONPLAISIR
Real Estate and Real Estate Financing
ESI 25.5 25.5 30 30
SNC COPRIM RESIDENCES
Real Estate and Real Estate Financing
FULL 100 100 100 100
SNC D’AMENAGEMENT FORUM SEINE ISSY LES MOULINEAUX
Real Estate and Real Estate Financing
EJV 33.33 33.33 33.33 33.33
SNC DU 10 RUE MICHELET
Real Estate and Real Estate Financing
FULL 100 100 100 100
SNC ISSY FORUM 10
Real Estate and Real Estate Financing
EJV 33.33 33.33 33.33 33.33
SNC ISSY FORUM 11
Real Estate and Real Estate Financing
EJV 33.33 33.33 33.33 33.33
(6) SNC NEUILLY ILE DE LA JATTE
Real Estate and Real Estate Financing
ESI 40 40
SNC PROMOSEINE
Real Estate and Real Estate Financing
EJV 33.33 33.33 33.33 33.33
SOCIETE ANONYME DE CREDIT A L’INDUSTRIE FRANCAISE (CALIF)
Bank FULL 100 100 100 100
SOCIETE CIVILE IMMOBILIERE 110 RUE DE RICHELIEU
Real Estate and Real Estate Financing
ESI 35 35 35 35
SOCIETE CIVILE IMMOBILIERE CAP THALASSA
Real Estate and Real Estate Financing
ESI 45 45 45 45
(3) SOCIETE CIVILE IMMOBILIERE CAP VERT
Real Estate and Real Estate Financing
ESI 30 30
SOCIETE CIVILE IMMOBILIERE CAP VEYRE
Real Estate and Real Estate Financing
ESI 50 50 50 50
SOCIETE CIVILE IMMOBILIERE DE DIANE
Real Estate and Real Estate Financing
ESI 30 30 30 30
SOCIETE CIVILE IMMOBILIERE DE PIERLAS
Real Estate and Real Estate Financing
ESI 28 28 28 28
SOCIETE CIVILE IMMOBILIERE DES COMBEAUX DE TIGERY
Real Estate and Real Estate Financing
FULL 99.99 99.99 100 100
SOCIETE CIVILE IMMOBILIERE DOMAINE DURANDY
Real Estate and Real Estate Financing
ESI 25 25 25 25

6 I 2
NOTES TO THE CONSOLIDATED FINANCIAL STATEMENTS FFINANCIAL INFORMATIONN
430 I 2018 REGISTRATION DOCUMENT I S O C I E T E G E N E R AL E G R O U P
Group ownership interest Group voting
interest
CCountry Activity Method*
At 31.12.2017
At 31.12.2016
At 31.12.2017
At 31.12.2016
SOCIETE CIVILE IMMOBILIERE ERICA
Real Estate and Real Estate Financing
ESI 30 30 30 30
SOCIETE CIVILE IMMOBILIERE ESTEREL TANNERON
Real Estate and Real Estate Financing
ESI 30 30 30 30
SOCIETE CIVILE IMMOBILIERE FONTENAY - ESTIENNES D’ORVES
Real Estate and Real Estate Financing
EJV 50 50 50 50
SOCIETE CIVILE IMMOBILIERE GAMBETTA DEFENSE V
Real Estate and Real Estate Financing
ESI 20 20 20 20
SOCIETE CIVILE IMMOBILIERE LE BOTERO
Real Estate and Real Estate Financing
ESI 30 30 30 30
(3)
SOCIETE CIVILE IMMOBILIERE LE DOMAINE DES PALMIERS
Real Estate and Real Estate Financing
ESI 45 45
SOCIETE CIVILE IMMOBILIERE LES HAUTS DE L’ESTAQUE
Real Estate and Real Estate Financing
ESI 35 35 35 35
SOCIETE CIVILE IMMOBILIERE LES HAUTS DE SEPTEMES
Real Estate and Real Estate Financing
ESI 25 25 25 25
SOCIETE CIVILE IMMOBILIERE MIRECRAU
Real Estate and Real Estate Financing
ESI 35 35 35 35
SOCIETE CIVILE IMMOBILIERE NAXOU
Real Estate and Real Estate Financing
FULL 100 100 100 100
(3)
SOCIETE CIVILE IMMOBILIERE RESIDENCE MARVEYRE
Real Estate and Real Estate Financing
ESI 30 30
SOCIETE CIVILE IMMOBILIERE TOULDI
Real Estate and Real Estate Financing
FULL 100 100 100 100
SOCIETE CIVILE IMMOBILIERE VERT COTEAU
Real Estate and Real Estate Financing
ESI 35 35 35 35
(5) SOCIETE CIVILE IMMOBILIERE VOGRE
Real Estate and Real Estate Financing
FULL 99.9 99.9
SOCIETE DE BOURSE GILBERT DUPONT Financial Company FULL 100 100 100 100
SOCIETE DE LA RUE EDOUARD VII Portfolio Management FULL 99.91 99.91 99.91 99.91
SOCIETE DE REALISATION DU PARC D’ACTIVITES DE TOULOUSE S O P A T
Real Estate and Real Estate Financing
ESI 100 100 100 100
SOCIETE DES TERRAINS ET IMMEUBLES PARISIENS (STIP)
Group Real Estate Management Company
FULL 99.98 99.98 100 100
SOCIETE DU PARC D ACTIVITE DE LA VALENTINE
Real Estate and Real Estate Financing
ESI 30 30 30 30
SOCIETE EN NOM COLLECTIF PARNASSE
Real Estate and Real Estate Financing
FULL 100 100 100 100
SOCIETE FINANCIERE D’ ANALYSE ET DE GESTION
Financial Company FULL 100 100 100 100
SOCIETE GENERALE Bank FULL 100 100 100 100
(6) SOCIETE GENERALE CAPITAL FINANCE Portfolio Management FULL 100 100
SOCIETE GENERALE CAPITAL PARTENAIRES Portfolio Management FULL 100 100 100 100
SOCIETE GENERALE DE BANQUE AUX ANTILLES
Bank FULL 100 100 100 100
SOCIETE GENERALE EQUIPMENT FINANCE S.A.
Specialist Financing FULL 100 100 100 100
SOCIETE GENERALE PARTICIPATIONS INDUSTRIELLES
Portfolio Management FULL 100 100 100 100
SOCIETE GENERALE POUR LE DEVELOPPEMENT DES OPERATIONS DE CREDIT-BAIL IMMOBILIER "SOGEBAIL"
Real Estate and Real Estate Financing
FULL 100 100 100 100
SOCIETE GENERALE REAL ESTATE
Real Estate and Real Estate Financing
FULL 100 100 100 100
SOCIETE GENERALE SCF Financial Company FULL 100 100 100 100
SOCIETE GENERALE SECURITIES SERVICES HOLDING
Portfolio Management FULL 100 100 100 100
SOCIETE GENERALE SFH Specialist Financing FULL 100 100 100 100
SOCIETE IMMOBILIERE DU 29 BOULEVARD HAUSSMANN
Group Real Estate Management Company
FULL 100 100 100 100
SOCIETE IMMOBILIERE URBI ET ORBI
Real Estate and Real Estate Financing
FULL 100 100 100 100
SOCIETE LES "PINSONS"
Real Estate and Real Estate Financing
EJV 50 50 50 50
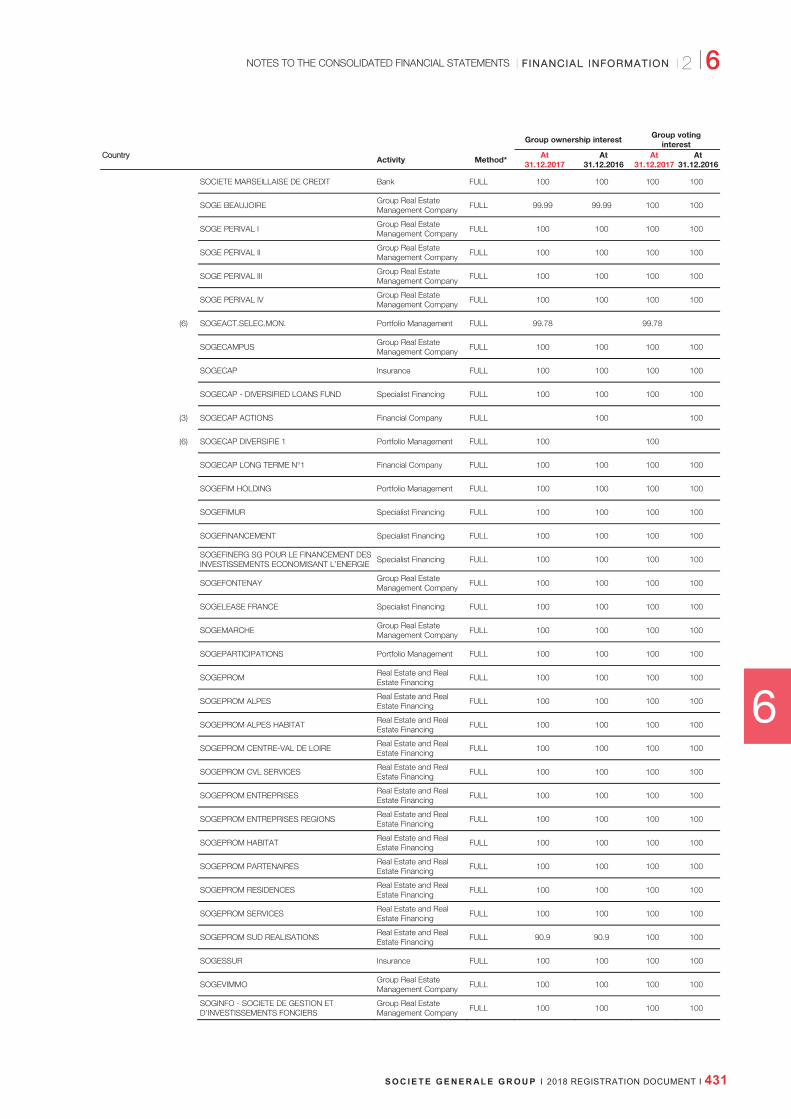
6
NOTES TO THE CONSOLIDATED FINANCIAL STATEMENTS
2 I 6 FF I NA NC I A L I NF O RMA T I O NN
S O C I E T E G E N E R AL E G R O U P I 2018 REGISTRATION DOCUMENT I 431
Group ownership interest Group voting
interest
CCountry Activity Method*
At 31.12.2017
At 31.12.2016
At 31.12.2017
At 31.12.2016
SOCIETE MARSEILLAISE DE CREDIT Bank FULL 100 100 100 100
SOGE BEAUJOIRE
Group Real Estate Management Company
FULL 99.99 99.99 100 100
SOGE PERIVAL I
Group Real Estate Management Company
FULL 100 100 100 100
SOGE PERIVAL II
Group Real Estate Management Company
FULL 100 100 100 100
SOGE PERIVAL III
Group Real Estate Management Company
FULL 100 100 100 100
SOGE PERIVAL IV
Group Real Estate Management Company
FULL 100 100 100 100
(6) SOGEACT.SELEC.MON. Portfolio Management FULL 99.78 99.78
SOGECAMPUS
Group Real Estate Management Company
FULL 100 100 100 100
SOGECAP Insurance FULL 100 100 100 100
SOGECAP - DIVERSIFIED LOANS FUND Specialist Financing FULL 100 100 100 100
(3) SOGECAP ACTIONS Financial Company FULL 100 100
(6) SOGECAP DIVERSIFIE 1 Portfolio Management FULL 100 100
SOGECAP LONG TERME N°1 Financial Company FULL 100 100 100 100
SOGEFIM HOLDING Portfolio Management FULL 100 100 100 100
SOGEFIMUR Specialist Financing FULL 100 100 100 100
SOGEFINANCEMENT Specialist Financing FULL 100 100 100 100
SOGEFINERG SG POUR LE FINANCEMENT DES INVESTISSEMENTS ECONOMISANT L’ENERGIE
Specialist Financing FULL 100 100 100 100
SOGEFONTENAY
Group Real Estate Management Company
FULL 100 100 100 100
SOGELEASE FRANCE Specialist Financing FULL 100 100 100 100
SOGEMARCHE
Group Real Estate Management Company
FULL 100 100 100 100
SOGEPARTICIPATIONS Portfolio Management FULL 100 100 100 100
SOGEPROM
Real Estate and Real Estate Financing
FULL 100 100 100 100
SOGEPROM ALPES
Real Estate and Real Estate Financing
FULL 100 100 100 100
SOGEPROM ALPES HABITAT
Real Estate and Real Estate Financing
FULL 100 100 100 100
SOGEPROM CENTRE-VAL DE LOIRE
Real Estate and Real Estate Financing
FULL 100 100 100 100
SOGEPROM CVL SERVICES
Real Estate and Real Estate Financing
FULL 100 100 100 100
SOGEPROM ENTREPRISES
Real Estate and Real Estate Financing
FULL 100 100 100 100
SOGEPROM ENTREPRISES REGIONS
Real Estate and Real Estate Financing
FULL 100 100 100 100
SOGEPROM HABITAT
Real Estate and Real Estate Financing
FULL 100 100 100 100
SOGEPROM PARTENAIRES
Real Estate and Real Estate Financing
FULL 100 100 100 100
SOGEPROM RESIDENCES
Real Estate and Real Estate Financing
FULL 100 100 100 100
SOGEPROM SERVICES
Real Estate and Real Estate Financing
FULL 100 100 100 100
SOGEPROM SUD REALISATIONS
Real Estate and Real Estate Financing
FULL 90.9 90.9 100 100
SOGESSUR Insurance FULL 100 100 100 100
SOGEVIMMO
Group Real Estate Management Company
FULL 100 100 100 100
SOGINFO - SOCIETE DE GESTION ET D’INVESTISSEMENTS FONCIERS
Group Real Estate Management Company
FULL 100 100 100 100

6 I 2
NOTES TO THE CONSOLIDATED FINANCIAL STATEMENTS FFINANCIAL INFORMATIONN
432 I 2018 REGISTRATION DOCUMENT I S O C I E T E G E N E R AL E G R O U P
Group ownership interest Group voting
interest
CCountry Activity Method*
At 31.12.2017
At 31.12.2016
At 31.12.2017
At 31.12.2016
(3) SOLVEO
Real Estate and Real Estate Financing
ESI 57.5 95
(6) ST BARNABE 13004
Real Estate and Real Estate Financing
EJV 43 50
STAR LEASE Specialist Financing FULL 100 100 100 100
STRACE
Real Estate and Real Estate Financing
ESI 20 20 20 20
TEMSYS Specialist Financing FULL 79.82 100 100 100
URBANISME ET COMMERCE
Real Estate and Real Estate Financing
FULL 99.88 99.96 99.88 99.96
URBANISME ET COMMERCE PROMOTION
Real Estate and Real Estate Financing
FULL 100 100 100 100
UTEI FEYZIN
Real Estate and Real Estate Financing
ESI 30 30 30 30
(2) UTEI LE CLOS FLEURI
Real Estate and Real Estate Financing
ESI 30 30
VALMINVEST
Group Real Estate Management Company
FULL 100 100 100 100
VILLA D’ARMONT
Real Estate and Real Estate Financing
ESI 40 40 40 40
GGhana
SOCIETE GENERALE GHANA LIMITED Bank FULL 56.67 56.67 56.67 56.67
GGibraltar
HAMBROS (GIBRALTAR NOMINEES) LIMITED Services FULL 100 100 100 100
SG KLEINWORT HAMBROS BANK (GIBRALTAR) LIMITED
Bank FULL 100 100 100 100
GGreece
ALD AUTOMOTIVE S.A. LEASE OF CARS Specialist Financing FULL 79.82 100 100 100
(1)(2) SOGECAP GREECE Insurance FULL 100 100
GGuernsey
ARAMIS II SECURITIES CO, LTD Financial Company FULL 100 100 100 100
CDS INTERNATIONAL LIMITED Services FULL 100 100 100 100
GRANGE NOMINEES LIMITED Bank FULL 100 100 100 100
GUERNSEY FINANCIAL ADVISORY SERVICES LIMITED
Bank FULL 100 100 100 100
GUERNSEY NOMINEES LIMITED Bank FULL 100 100 100 100
HAMBROS (GUERNSEY NOMINEES) LTD Services FULL 100 100 100 100
HTG LIMITED Services FULL 100 100 100 100
K.B. (C.I.) NOMINEES LIMITED Bank FULL 100 100 100 100
(8) KBII PCC LIMITED Bank FULL 100 100 100 100
(5) KLEINWORT BENSON (CHANNEL ISLANDS) INVESTMENT MANAGEMENT LIMITED
Bank FULL 100 100
(5) KLEINWORT BENSON (CHANNEL ISLANDS) LIMITED
Bank FULL 100 100
(5) KLEINWORT BENSON (GUERNSEY) LIMITED Bank FULL 100 100
(5) KLEINWORT BENSON (GUERNSEY) SERVICES LIMITED
Bank FULL 100 100
(5) KLEINWORT BENSON CHANNEL ISLANDS HOLDINGS LIMITED
Bank FULL 100 100
MISON NOMINEES LIMITED Bank FULL 100 100 100 100
(1) SG HAMBROS BANK (CHANNEL ISLANDS) LTD GUERNSEY BRANCH
Bank FULL 100 100 100 100
GGuinea
SG DE BANQUES EN GUINEE Bank FULL 57.94 57.94 57.94 57.94
EEquatorial Guinea

6
NOTES TO THE CONSOLIDATED FINANCIAL STATEMENTS
2 I 6 FF I NA NC I A L I NF O RMA T I O NN
S O C I E T E G E N E R AL E G R O U P I 2018 REGISTRATION DOCUMENT I 433
Group ownership interest Group voting
interest
CCountry Activity Method*
at 31.12.2017
at 31.12.2016
at 31.12.2017
at 31.12.2016
SOCIETE GENERALE DE BANQUES EN GUINEE EQUATORIALE
Bank FULL 52.44 52.44 57.23 57.23
HHong Kong
(1) DESCARTES TRADING HONG KONG BRANCH Financial Company FULL 100 100 100 100
(2) NEWEDGE BROKER HONG KONG LTD Broker FULL 100 100
SG ASSET FINANCE (HONG KONG) LIMITED Broker FULL 100 100 100 100
SG FINANCE (ASIA PACIFIC) LIMITED Financial Company FULL 100 100 100 100
SG FINANCE (HONG KONG) LIMITED Financial Company FULL 100 100 100 100
(1) SG HONG KONG Bank FULL 100 100 100 100
SG SECURITIES (HK) NOMINEES LTD Broker FULL 100 100 100 100
SG SECURITIES (HONG-KONG) LTD Broker FULL 100 100 100 100
SG SECURITIES ASIA INTERNATIONAL HOLDINGS LTD (HONG-KONG)
Broker FULL 100 100 100 100
SOCIETE GENERALE ASIA LTD Financial Company FULL 100 100 100 100
TH INVESTMENTS (HONG KONG) 1 LIMITED Financial Company FULL 100 100 100 100
TH INVESTMENTS (HONG KONG) 2 LIMITED Financial Company FULL 100 100 100 100
TH INVESTMENTS (HONG KONG) 5 LIMITED Financial Company FULL 100 100 100 100
HHungary
ALD AUTOMOTIVE MAGYARORSZAG KFT Specialist Financing FULL 79.82 100 100 100
(6) MKB-EUROLEASING AUTOPARK KERESKEDELMI ES SZOLGALTATO ZARTKORUEN MUKODO RESZVENYTARSASAG
Specialist Financing FULL 79.82 100
SG EQUIPMENT FINANCE HUNGARY ZRT Specialist Financing EFS 100 100 100 100
SG EQUIPMENT LEASING HUNGARY LTD Specialist Financing EFS 100 100 100 100
IIsle of Man
KBBIOM LIMITED Bank FULL 50 100 50 100
KBTIOM LIMITED Bank FULL 100 100 100 100
CCayman Islands
AEGIS HOLDINGS (OFFSHORE) LTD. Financial Company FULL 100 100 100 100
BRIDGEVIEW II LIMITED Specialist Financing FULL 100 100 100 100
(8) SOCIETE GENERALE (NORTH PACIFIC) LTD Bank FULL 100 100 100 100
BBritish Virgin IIslands
TSG HOLDINGS LTD Services FULL 100 100 100 100
TSG MANAGEMENT LTD Services FULL 100 100 100 100
TSG SERVICES LTD Services FULL 100 100 100 100
IIndia
ALD AUTOMOTIVE PRIVATE LIMITED Specialist Financing EFS 79.82 100 100 100
(3) NEWEDGE BROKER INDIA PTE LTD Broker FULL 100 100
(1) SG MUMBAI Bank FULL 100 100 100 100
SOCIETE GENERALE GLOBAL SOLUTION CENTRE PRIVATE
Services FULL 100 100 100 100
SOCIETE GENERALE SECURITIES INDIA PRIVATE LIMITED
Broker FULL 100 100 100 100

6 I 2
NOTES TO THE CONSOLIDATED FINANCIAL STATEMENTS FFINANCIAL INFORMATIONN
434 I 2018 REGISTRATION DOCUMENT I S O C I E T E G E N E R AL E G R O U P
Group ownership interest Group voting
interest
CCountry Activity Method*
at 31.12.2017
at 31.12.2016
at 31.12.2017
at 31.12.2016
IIrreland
ALD RE DESIGNATED ACTIVITY COMPANY Insurance FULL 79.82 100 100 100
INORA LIFE LTD Insurance FULL 100 100 100 100
IRIS II SPV DESIGNATED ACTIVITY COMPANY Financial Company FULL 100 100 100 100
(6) MERRION FLEET FINANCE LIMITED Financial Company FULL 79.82 100
(6) MERRION FLEET MANAGEMENT LIMITED Specialist Financing FULL 79.82 100
(1) SG DUBLIN Bank FULL 100 100 100 100
SG KLEINWORT HAMBROS PRIVATE INVESTMENT OFFICE SERVICES LIMITED
Bank FULL 100 100 100 100
SGBT FINANCE IRELAND DESIGNATED ACTIVITY COMPANY
Specialist Financing FULL 100 100 100 100
SGSS (IRELAND) LIMITED Financial Company FULL 100 100 100 100
SOCIETE GENERALE HEDGING DESIGNATED ACTIVITY COMPANY
Financial Company FULL 100 100 100 100
IItaly
ALD AUTOMOTIVE ITALIA S.R.L Specialist Financing FULL 79.82 100 100 100
FIDITALIA S.P.A Specialist Financing FULL 100 100 100 100
FRAER LEASING SPA Specialist Financing FULL 73.85 73.85 73.85 73.85
SG EQUIPMENT FINANCE ITALY S.P.A. Specialist Financing FULL 100 100 100 100
SG FACTORING SPA Specialist Financing FULL 100 100 100 100
SG LEASING SPA Specialist Financing FULL 100 100 100 100
(1) SG MILAN Bank FULL 100 100 100 100
(1) SOCECAP SA RAPPRESENTANZA GENERALE PER L’ITALIA
Insurance FULL 100 100 100 100
SOCIETE GENERALE SECURITIES SERVICES S.P.A.
Bank FULL 100 100 100 100
(1) SOGESSUR SA Insurance FULL 100 100 100 100
JJapan
LYXOR ASSET MANAGEMENT JAPAN CO LTD Portfolio Management FULL 100 100 100 100
(1) SG TOKYO Bank FULL 100 100 100 100
(1) SOCIETE GENERALE (NORTH PACIFIC) LTD, TOKYO BRANCH
Bank FULL 100 100 100 100
SOCIETE GENERALE SECURITIES JAPAN LIMITED
Broker FULL 100 100 100 100
JJersey
ELMFORD LIMITED Services FULL 100 100 100 100
HANOM I LIMITED Financial Company FULL 100 100 100 100
HANOM II LIMITED Financial Company FULL 100 100 100 100
HANOM III LIMITED Financial Company FULL 100 100 100 100
JD CORPORATE SERVICES LIMITED Services FULL 100 100 100 100
(5) KLEINWORT BENSON (JERSEY) SERVICES LIMITED
Bank FULL 100 100
KLEINWORT BENSON CUSTODIAN SERVICES LIMITED
Bank FULL 100 100 100 100

6
NOTES TO THE CONSOLIDATED FINANCIAL STATEMENTS
2 I 6 FF I NA NC I A L I NF O RMA T I O NN
S O C I E T E G E N E R AL E G R O U P I 2018 REGISTRATION DOCUMENT I 435
Group ownership interest Group voting
interest
CCountry Activity Method*
at 31.12.2017
at 31.12.2016
at 31.12.2017
at 31.12.2016
(7) LYXOR MASTER FUND Financial Company FULL 100 100 100 100
NEWMEAD TRUSTEES LIMITED Financial Company FULL 100 100 100 100
SG HAMBROS (FOUNDATIONS) LTD Financial Company FULL 100 100 100 100
SG HAMBROS NOMINEES (JERSEY) LTD Financial Company FULL 100 100 100 100
(5) SG HAMBROS PROPERTIES (JERSEY) LTD Financial Company FULL 100 100
SG KLEINWORT HAMBROS BANK (CI) LIMITED Bank FULL 100 100 100 100
SG KLEINWORT HAMBROS CORPORATE SERVICES (CI) LIMITED
Portfolio Management FULL 100 100 100 100
SG KLEINWORT HAMBROS TRUST COMPANY (CI) LIMITED
Financial Company FULL 100 100 100 100
SGKH TRUSTEES (CI) LIMITED Services FULL 100 100 100 100
SOLENTIS INVESTMENT SOLUTIONS PCC Financial Company FULL 100 100 100 100
LLatvia
ALD AUTOMOTIVE SIA Specialist Financing EFS 59.86 75 75 75
LLebanon
SG DE BANQUE AU LIBAN Bank ESI 16.79 16.8 16.85 22.73
LLithuania
UAB ALD AUTOMOTIVE Specialist Financing EFS 59.86 75 75 75
LLuxembourg
ALD INTERNATIONAL SERVICES S.A. Specialist Financing FULL 79.82 100 100 100
AXA IM FIIS US SH.DUR.HIGH YIELD A DIS H Specialist Financing ESI 38 38 38 38
AXUS LUXEMBOURG SA Specialist Financing FULL 79.82 100 100 100
BARTON CAPITAL SA Financial Company FULL 100 100 100 100
CHABON SA Financial Company FULL 100 100 100 100
(6) CODEIS COMPARTIMENT A0076 Financial Company FULL 100 100
CODEIS SECURITIES S.A. Financial Company FULL 100 100 100 100
COVALBA Financial Company FULL 100 100 100 100
(6) G FINANCE LUXEMBOURG SA Financial Company FULL 100 100
IVEFI S.A. Financial Company FULL 100 100 100 100
LX FINANZ S.A.R.L. Financial Company FULL 100 100 100 100
PIONEER INVESTMENTS DIVERSIFIED LOANS FUND Specialist Financing FULL 100 100 100 100
RED & BLACK AUTO LEASE GERMANY 2 S.A. Financial Company FULL 79.82 100 100 100
SG ISSUER Financial Company FULL 100 100 100 100
SGBT ASSET BASED FUNDING SA Financial Company FULL 100 100 100 100
SGBTCI Financial Company FULL 100 100 100 100
SOCIETE GENERALE BANK & TRUST Bank FULL 100 100 100 100
SOCIETE GENERALE CAPITAL MARKET FINANCE Financial Company FULL 100 100 100 100

6 I 2
NOTES TO THE CONSOLIDATED FINANCIAL STATEMENTS FFINANCIAL INFORMATIONN
436 I 2018 REGISTRATION DOCUMENT I S O C I E T E G E N E R AL E G R O U P
Group ownership interest Group voting
interest
CCountry Activity Method*
at 31.12.2017
at 31.12.2016
at 31.12.2017
at 31.12.2016
SOCIETE GENERALE FINANCING AND DISTRIBUTION Financial Company FULL 100 100 100 100
SOCIETE GENERALE LDG Bank FULL 100 100 100 100
SOCIETE GENERALE LIFE INSURANCE BROKER SA Financial Company FULL 100 100 100 100
SOCIETE GENERALE PRIVATE WEALTH MANAGEMENT S.A.
Financial Company FULL 100 100 100 100
SOCIETE GENERALE RE SA Insurance FULL 100 100 100 100
(6) SOCIETE IMMOBILIERE DE L’ARSENAL
Group Real Estate Management Company
FULL 100 100
SOGELIFE Insurance FULL 100 100 100 100
MMacedonia
OHRIDSKA BANKA AD SKOPJE Bank FULL 70.02 70.02 70.96 71.33
MMadagascar
BANKY FAMPANDROSOANA VAROTRA SG Bank FULL 70 70 70 70
MMalta
LNG MALTA INVESTMENT 1 LIMITED Financial Company FULL 100 100 100 100
LNG MALTA INVESTMENT 2 LIMITED Financial Company FULL 100 100 100 100
MMorocco
ALD AUTOMOTIVE SA MAROC Specialist Financing FULL 36.56 43.62 50 50
ATHENA COURTAGE Insurance FULL 58.41 58.35 99.93 99.93
FONCIMMO Group Real Estate Management Company
FULL 57.53 57.46 100 100
LA MAROCAINE VIE Insurance FULL 89.02 89 99.98 99.98
SG MAROCAINE DE BANQUES Bank FULL 57.53 57.46 57.53 57.46
SOCIETE D’ EQUIPEMENT DOMESTIQUE ET MENAGER "EQDOM"
Specialist Financing FULL 45.75 45.73 53.72 53.72
SOCIETE GENERALE DE LEASING AU MAROC Specialist Financing FULL 57.53 57.46 100 100
SOCIETE GENERALE TANGER OFFSHORE Financial Company FULL 57.46 57.39 99.88 99.88
SOGECAPITAL GESTION Financial Company FULL 57.49 57.43 99.94 99.94
(6) SOGECAPITAL PLACEMENT Portfolio Management FULL 57.5 99.96
SOGEFINANCEMENT MAROC Specialist Financing FULL 57.53 57.46 100 100
MMauritius
SG SECURITIES BROKING (M) LIMITED Broker FULL 100 100 100 100
MMexico
ALD AUTOMOTIVE S.A. DE C.V. Specialist Financing FULL 79.82 100 100 100
ALD FLEET SA DE CV SOFOM ENR Specialist Financing FULL 79.82 100 100 100
SGFP MEXICO, S.A. DE C.V. Financial Company FULL 100 100 100 100
MMoldova
MOBIASBANCA GROUPE SOCIETE GENERALE Bank FULL 79.93 79.93 87.9 87.9
MMonaco

6
NOTES TO THE CONSOLIDATED FINANCIAL STATEMENTS
2 I 6 FF I NA NC I A L I NF O RMA T I O NN
S O C I E T E G E N E R AL E G R O U P I 2018 REGISTRATION DOCUMENT I 437
Group ownership interest Group voting
interest
CCountry Activity Method*
at 31.12.2017
at 31.12.2016
at 31.12.2017
at 31.12.2016
(1) CREDIT DU NORD - MONACO Bank FULL 100 100 100 100
(1) SMC MONACO Bank FULL 100 100 100 100
(1) SOCIETE GENERALE (SUCCURSALE MONACO) Bank FULL 100 100 100 100
SOCIETE GENERALE PRIVATE BANKING (MONACO) Bank FULL 100 100 100 100
MMontenegro
SOCIETE GENERALE BANKA MONTENEGRO A.D. Bank FULL 90.56 90.56 90.56 90.56
NNorway
ALD AUTOMOTIVE AS Specialist Financing FULL 79.82 100 100 100
NF FLEET AS Specialist Financing FULL 63.85 80 80 80
SG FINANS AS Specialist Financing FULL 100 100 100 100
NNew Caledonia
CREDICAL Specialist Financing FULL 87.07 87.07 96.64 96.64
SOCIETE GENERALE CALEDONIENNE DE BANQUE Bank FULL 90.1 90.1 90.1 90.1
NNetherlands
ALVARENGA INVESTMENTS B.V. Specialist Financing FULL 100 100 100 100
(6) ASTEROLD B.V. Financial Company FULL 100 100
AXUS FINANCE NL B.V. Specialist Financing FULL 79.82 100 100 100
AXUS NEDERLAND BV Specialist Financing FULL 79.82 100 100 100
BRIGANTIA INVESTMENTS B.V. Financial Company FULL 100 100 100 100
(6) COPARER HOLDING Group Real Estate Management Company
FULL 100 100
HERFSTTAFEL INVESTMENTS B.V. Specialist Financing FULL 100 100 100 100
HORDLE FINANCE B.V. Financial Company FULL 100 100 100 100
MONTALIS INVESTMENT BV Specialist Financing FULL 100 100 100 100
(1) SG AMSTERDAM Bank FULL 100 100 100 100
SG EQUIPMENT FINANCE BENELUX BV Specialist Financing FULL 100 100 100 100
SOGELEASE B.V. Specialist Financing FULL 100 100 100 100
SOGELEASE FILMS Specialist Financing FULL 100 100 100 100
TYNEVOR B.V. Financial Company FULL 100 100 100 100
TThe Philippines
(1) (8) SOCIETE GENERALE MANILA OFFSHORE BRANCH Bank FULL 100 100 100 100
PPoland
ALD AUTOMOTIVE POLSKA SP Z O.O. Specialist Financing FULL 79.82 100 100 100
EURO BANK S.A. Bank FULL 99.99 99.97 99.99 99.97
PEMA POLSKA SP.Z O.O. Services FULL 100 100 100 100
SG EQUIPMENT LEASING POLSKA SP Z.O.O. Specialist Financing FULL 100 100 100 100
(1) SOCIETE GENERALE S.A. ODDZIAL W POLSCE Bank FULL 100 100 100 100

6 I 2
NOTES TO THE CONSOLIDATED FINANCIAL STATEMENTS FFINANCIAL INFORMATIONN
438 I 2018 REGISTRATION DOCUMENT I S O C I E T E G E N E R AL E G R O U P
Group ownership interest Group voting
interest
CCountry Activity Method*
at 31.12.2017
at 31.12.2016
at 31.12.2017
at 31.12.2016
(1) SOGECAP RISQUES DIVERS SPOLKA AKCYJNA ODDZIAL W POLSCE
Insurance FULL 100 100 100 100
(1) SOGECAP SPOLKA AKCYJNA ODDZIAL W POLSCE Insurance FULL 100 100 100 100
FFrench PPolynesia
BANQUE DE POLYNESIE Bank FULL 72.1 72.1 72.1 72.1
SOGELEASE BDP "SAS" Specialist Financing FULL 72.1 72.1 100 100
PPortugal
(5) PARCOURS PORTUGAL SA Specialist Financing FULL 100 100
SGALD AUTOMOTIVE SOCIEDADE GERAL DE COMERCIO E ALUGUER DE BENZ SA
Specialist Financing FULL 79.82 100 100 100
CCzech Republic
ALD AUTOMOTIVE SRO Specialist Financing FULL 79.82 100 100 100
CATAPS Services ESI 12.15 12.15 20 20
ESSOX SRO Specialist Financing FULL 80 80 100 100
FACTORING KB Financial Company FULL 60.73 60.73 100 100
KB PENZIJNI SPOLECNOST, A.S. Financial Company FULL 60.73 60.73 100 100
KB REAL ESTATE
Real Estate and Real Estate Financing
FULL 60.73 60.73 100 100
BANKA A.S Bank FULL 60.73 60.73 60.73 60.73
POJISTOVNA A.S Insurance FULL 80.76 80.76 100 100
MODRA PYRAMIDA STAVEBNI SPORITELNA AS Financial Company FULL 60.73 60.73 100 100
(4) NP 33
Real Estate and Real Estate Financing
FULL 60.73 100
PEMA PRAHA SPOL. S.R.O. Specialist Financing FULL 100 100 100 100
PROTOS Financial Company FULL 60.73 60.73 100 100
(6) PSA FINANCE CESKA REPUBLIKA SRO Specialist Financing FULL 80 100
SG EQUIPMENT FINANCE CZECH REPUBLIC S.R.O. Specialist Financing FULL 80.33 80.33 100 100
SOGEPROM CESKA REPUBLIKA S.R.O.
Real Estate and Real Estate Financing
FULL 100 100 100 100
SOGEPROM MICHLE S.R.O.
Real Estate and Real Estate Financing
FULL 100 100 100 100
(6) STD2, A.S.
Group Real Estate Management Company
FULL 60.73 100
VN 42
Real Estate and Real Estate Financing
FULL 60.73 60.73 100 100
RRomania
ALD AUTOMOTIVE SRL Specialist Financing FULL 75.89 92.03 100 100
BRD - GROUPE SOCIETE GENERALE SA Bank FULL 60.17 60.17 60.17 60.17
BRD ASSET MANAGEMENT SAI SA Portfolio Management FULL 60.15 60.15 99.97 99.97
BRD FINANCE IFN S.A. Financial Company FULL 80.48 80.48 100 100
S.C. BRD SOGELEASE IFN S.A. Specialist Financing FULL 60.17 60.17 100 100
S.C. ROGARIU IMOBILIARE S.R.L. Real Estate and Real Estate Financing
FULL 75 75 75 75
SOCIETE GENERALE EUROPEAN BUSINESS SERVICES S.A.
Services FULL 100 99.99 100 100
SOGEPROM ROMANIA SRL Real Estate and Real Estate Financing
FULL 100 100 100 100

6
NOTES TO THE CONSOLIDATED FINANCIAL STATEMENTS
2 I 6 FF I NA NC I A L I NF O RMA T I O NN
S O C I E T E G E N E R AL E G R O U P I 2018 REGISTRATION DOCUMENT I 439
Group ownership interest Group voting
interest
CCountry Activity Method*
at 31.12.2017
at 31.12.2016
at 31.12.2017
at 31.12.2016
UUnited KKingdom
ACR Financial Company FULL 100 100 100 100
ALD AUTOMOTIVE GROUP PLC Specialist Financing FULL 79.82 100 100 100
ALD AUTOMOTIVE LIMITED Specialist Financing FULL 79.82 100 100 100
ALD FUNDING LIMITED Specialist Financing FULL 79.82 100 100 100
(1) BRIDGEVIEW II LIMITED (UK BRANCH) Specialist Financing FULL 100 100 100 100
(1) BRIGANTIA INVESTMENTS B.V. (UK BRANCH) Financial Company FULL 100 100 100 100
(1) DESCARTES TRADING LONDON BRANCH Financial Company FULL 100 100 100 100
FENCHURCH NOMINEES LIMITED Bank FULL 100 100 100 100
FRANK NOMINEES LIMITED Bank FULL 100 100 100 100
(2) HOLMES DROLLED LIMITED Bank FULL 100 100
(1) HORDLE FINANCE B.V. (UK BRANCH) Financial Company FULL 100 100 100 100
(8) JWB LEASE HOLDINGS LIMITED Specialist Financing FULL 100 100 100 100
JWB LEASING LIMITED PARTNERSHIP Specialist Financing FULL 100 100 100 100
KBIM STANDBY NOMINEES LIMITED Bank FULL 100 100 100 100
KBPB NOMINEES LIMITED Bank FULL 100 100 100 100
(5) KLEINWORT BENSON BANK LIMITED Bank FULL 100 100
KLEINWORT BENSON FARMLAND TRUST (MANAGERS) LIMITED
Bank FULL 75 100 75 100
KLEINWORT BENSON UNIT TRUSTS LIMITED Bank FULL 100 100 100 100
LANGBOURN NOMINEES LIMITED Bank FULL 100 100 100 100
(2) LNG INVESTMENT 1 LTD Financial Company FULL 100 100
(2) LNG INVESTMENT 2 LTD Financial Company FULL 100 100
LYXOR ASSET MANAGEMENT UK LLP Financial Company FULL 100 100 100 100
MAGPIE ROSE LIMITED Bank FULL 100 100 100 100
(2) PARCOURS UK LIMITED Specialist Financing FULL 100 100
PICO WESTWOOD LIMITED Bank FULL 100 100 100 100
ROBERT BENSON, LONSDALE & CO (CANADA) LIMITED Bank FULL 100 100 100 100
SAINT MELROSE LIMITED Bank FULL 100 100 100 100
(6) SG (MARITIME) LEASING LIMITED Specialist Financing FULL 100 100
SG EQUIPMENT FINANCE (DECEMBER) LIMITED Specialist Financing FULL 100 100 100 100
SG EQUIPMENT FINANCE LEASING LIMITED Specialist Financing FULL 100 100 100 100
SG EQUIPMENT FINANCE OPERATING LEASING LIMITED Specialist Financing FULL 100 100 100 100
SG EQUIPMENT FINANCE RENTAL LIMITED Specialist Financing FULL 100 100 100 100
SG FINANCIAL SERVICES LIMITED Financial Company FULL 100 100 100 100
SG HAMBROS (LONDON) NOMINEES LIMITED Financial Company FULL 100 100 100 100
SG HAMBROS TRUST COMPANY LTD Financial Company FULL 100 100 100 100

6 I 2
NOTES TO THE CONSOLIDATED FINANCIAL STATEMENTS FFINANCIAL INFORMATIONN
440 I 2018 REGISTRATION DOCUMENT I S O C I E T E G E N E R AL E G R O U P
Group ownership interest Group voting
interest
CCountry Activity Method*
at 31.12.2017
at 31.12.2016
at 31.12.2017
at 31.12.2016
SG HEALTHCARE BENEFITS TRUSTEE COMPANY LIMITED Financial Company FULL 100 100 100 100
SG INVESTMENT LIMITED Financial Company FULL 100 100 100 100
SG KLEINWORT HAMBROS BANK LIMITED Bank FULL 100 100 100 100
SG KLEINWORT HAMBROS LIMITED Bank FULL 100 100 100 100
SG KLEINWORT HAMBROS TRUST COMPANY (UK) LIMITED
Bank FULL 100 100 100 100
SG LEASING (ASSETS) LIMITED Specialist Financing FULL 100 100 100 100
SG LEASING (CENTRAL 1) LIMITED Specialist Financing FULL 100 100 100 100
SG LEASING (CENTRAL 3) LIMITED Specialist Financing FULL 100 100 100 100
(8) SG LEASING (DECEMBER) LIMITED Specialist Financing FULL 100 100 100 100
SG LEASING (GEMS) LIMITED Specialist Financing FULL 100 100 100 100
SG LEASING (JUNE) LIMITED Specialist Financing FULL 100 100 100 100
SG LEASING (MARCH) LIMITED Specialist Financing FULL 100 100 100 100
SG LEASING (USD) LIMITED Specialist Financing FULL 100 100 100 100
SG LEASING (UTILITIES) LIMITED Specialist Financing FULL 100 100 100 100
SG LEASING IX Specialist Financing FULL 100 100 100 100
(8) SG LEASING XII Specialist Financing FULL 100 100 100 100
(1) SG LONDRES Bank FULL 100 100 100 100
SGFLD LIMITED Financial Company FULL 100 100 100 100
SOCGEN NOMINEES (UK) LIMITED Financial Company FULL 100 100 100 100
SOCIETE GENERALE EQUIPMENT FINANCE LIMITED Specialist Financing FULL 100 100 100 100
SOCIETE GENERALE INTERNATIONAL LIMITED Broker FULL 100 100 100 100
SOCIETE GENERALE INVESTMENTS (U.K.) LIMITED Financial Company FULL 100 100 100 100
(8) SOCIETE GENERALE SECURITIES SERVICES UK LIMITED Broker FULL 100 100 100 100
STRABUL NOMINEES LIMITED Financial Company FULL 100 100 100 100
(8) TALOS HOLDING LTD Financial Company FULL 100 100 100 100
(8) TALOS SECURITIES LTD Broker FULL 100 100 100 100
(1) TH INVESTMENTS (HONG KONG) 2 LIMITED Financial Company FULL 100 100 100 100
(2) TH LEASING (JUNE) LIMITED Specialist Financing FULL 100 100
(2) TH STRUCTURED ASSET FINANCE LIMITED Financial Company FULL 100 100
THE EIFFEL LIMITED PARTNERSHIP Specialist Financing FULL 100 100 100 100
THE FENCHURCH PARTNERSHIP Financial Company FULL 100 100 100 100
(1) TYNEVOR B.V. (UK BRANCH) Financial Company FULL 100 100 100 100
RRussian FFederation
ALD AUTOMOTIVE OOO Specialist Financing FULL 79.82 100 100 100
CLOSED JOINT STOCK COMPANY SG FINANCE Specialist Financing EFS 99.95 100 100 100
COMMERCIAL BANK DELTACREDIT JOINT STOCK COMPANY
Bank FULL 99.95 99.95 100 100

6
NOTES TO THE CONSOLIDATED FINANCIAL STATEMENTS
2 I 6 FF I NA NC I A L I NF O RMA T I O NN
S O C I E T E G E N E R AL E G R O U P I 2018 REGISTRATION DOCUMENT I 441
Group ownership interest Group voting
interest
CCountry Activity Method*
at 31.12.2017
at 31.12.2016
at 31.12.2017
at 31.12.2016
CREDIT INSTITUTION OBYEDINYONNAYA RASCHOTNAYA SISTEMA
Financial Company FULL 99.95 99.95 100 100
JSC TELSICOM Services FULL 99.95 99.95 100 100
LLC RUSFINANCE Bank FULL 99.95 99.95 100 100
LLC RUSFINANCE BANK Bank FULL 99.95 99.95 100 100
PJSC ROSBANK Bank FULL 99.95 99.95 99.95 99.95
(2) PROEKTINVEST LLC
Group Real Estate Management Company
FULL 99.95 100
RB FACTORING LLC Specialist Financing FULL 99.95 99.95 100 100
RB LEASING LLC Specialist Financing FULL 99.95 99.95 100 100
RB SERVICE LLC
Group Real Estate Management Company
FULL 99.95 99.95 100 100
RB SPECIALIZED DEPOSITARY LLC Financial Company FULL 99.95 99.95 100 100
SG STRAKHOVANIE LLC Insurance FULL 99.99 99.99 100 100
SOCIETE GENERALE STRAKHOVANIE ZHIZNI LLC Insurance FULL 99.99 99.99 100 100
SOSNOVKA LLC
Group Real Estate Management Company
FULL 99.95 99.95 100 100
(2) VALMONT LLC
Group Real Estate Management Company
FULL 99.95 100
SSenegal
SOCIETE GENERALE DE BANQUES AU SENEGAL Bank FULL 64.45 64.45 64.87 64.87
SSerbia
ALD AUTOMOTIVE D.O.O BEOGRAD Specialist Financing FULL 79.82 100 100 100
SOCIETE GENERALE BANKA SRBIJA Bank FULL 100 100 100 100
SOGELEASE SRBIJA D.O.O. Specialist Financing FULL 100 100 100 100
SSingapore
SG MARKETS (SEA) PTE. LTD. Broker FULL 100 100 100 100
SG SECURITIES (SINGAPORE) PTE. LTD. Broker FULL 100 100 100 100
(1) SG SINGAPOUR Bank FULL 100 100 100 100
SG TRUST (ASIA) LTD Financial Company FULL 100 100 100 100
SSlovakia
ALD AUTOMOTIVE SLOVAKIA S.R.O. Specialist Financing FULL 79.82 100 100 100
(1) BANKA BRATISLAVA Bank FULL 60.73 60.73 100 100
PEMA SLOVAKIA SPOL.S.R.O. Specialist Financing FULL 100 100 100 100
(6) PSA FINANCE SLOVAKIA SRO Specialist Financing FULL 80 100
(1) SG EQUIPMENT FINANCE CZECH REPUBLIC S.R.O. ORGANIZACNA ZLOZKA (SLOVAKIA)
Specialist Financing FULL 80.33 80.33 100 100
SSlovenia
ALD AUTOMOTIVE OPERATIONAL LEASING DOO Specialist Financing FULL 79.82 100 100 100
SKB LEASING D.O.O. Specialist Financing FULL 99.73 99.73 100 100
SKB BANKA D.D. LJUBLJANA Bank FULL 99.73 99.73 99.73 99.73
SKB LEASING SELECT D.O.O. Specialist Financing FULL 99.73 99.73 100 100

6 I 2 NOTES TO THE CONSOLIDATED FINANCIAL STATEMENTS FFINANCIAL INFORMATIONN
442 I 2018 REGISTRATION DOCUMENT I S O C I E T E G E N E R AL E G R O U P
Group ownership interest Group voting
interest
CCountry Activity Method*
at 31.12.2017
at 31.12.2016
at 31.12.2017
at 31.12.2016
SSweden
ALD AUTOMOTIVE AB Specialist Financing FULL 79.82 100 100 100
NF FLEET AB Specialist Financing FULL 63.85 80 80 80
PEMA TRUCK- OCH TRAILERUTHYRNING AB Specialist Financing FULL 100 100 100 100
(1) SG FINANS AS SWEDISH BRANCH Specialist Financing FULL 100 100 100 100
(1)(6) SOCIETE GENERALE SA BANKFILIAL SVERIGE Bank FULL 100 100
SSwitzerland
ALD AUTOMOTIVE AG Specialist Financing FULL 79.82 100 100 100
PEMA TRUCK- UND TRAILERVERMIETUNG GMBH Specialist Financing FULL 100 100 100 100
(8) ROSBANK (SWITZERLAND) Bank FULL 99.95 99.95 100 100
SG EQUIPMENT FINANCE SCHWEIZ AG Specialist Financing FULL 100 100 100 100
(1) SG ZURICH Bank FULL 100 100 100 100
SOCIETE GENERALE PRIVATE BANKING (SUISSE) S.A. Bank FULL 100 100 100 100
TTaiwan
(1) SG SECURITIES (HONG KONG) LIMITED TAIPEI BRANCH
Broker FULL 100 100 100 100
(1) SG TAIPEI Bank FULL 100 100 100 100
CChad
SOCIETE GENERALE TCHAD Bank FULL 56.86 55.19 67.83 66.16
TThailand
(6) SOCIETE GENERALE SECURITIES (THAILAND) LTD. Broker FULL 100 100
TTogo
(1) SOCIETE GENERALE TOGO Bank FULL 89.64 88.34 100 100
TTunisia
UNION INTERNATIONALE DE BANQUES Bank FULL 55.1 55.1 52.34 52.34
TTurkey
ALD AUTOMOTIVE TURIZM TICARET ANONIM SIRKETI Specialist Financing FULL 79.82 100 100 100
(1) SG ISTANBUL Bank FULL 100 100 100 100
UUkraine
ALD AUTOMOTIVE UKRAINE LIMITED LIABILITY COMPANY
Specialist Financing EFS 79.82 100 100 100
* FULL: Full consolidation - JO: Joint Operation - EJV: Equity (Joint Venture) - ESI: Equity (significant influence) - EFS: Equity For Simplification (Entities controlledby the Group that are consolidated using the equity method for simplification due to their limited materiality).
(1) Branches (2) Entities wound up in 2017 (3) Removal from the scope in 2017 (4) Entities sold in 2017 (5) Merged in 2017 (6) Newly consolidated in 2017 (7) Including 96 funds (8) Wind up in process
Additional information related to the consolidation scope and equity investments as required by Regulation 2016-09 of the “Autorité des Normes Comptables” (ANC, the French Accounting standard setter), dated 2nd December 2016 is available on the Societe Generale Group website at: https://www.societegenerale.com/en/measuring-our-performance/information-and-publications/registration-documents
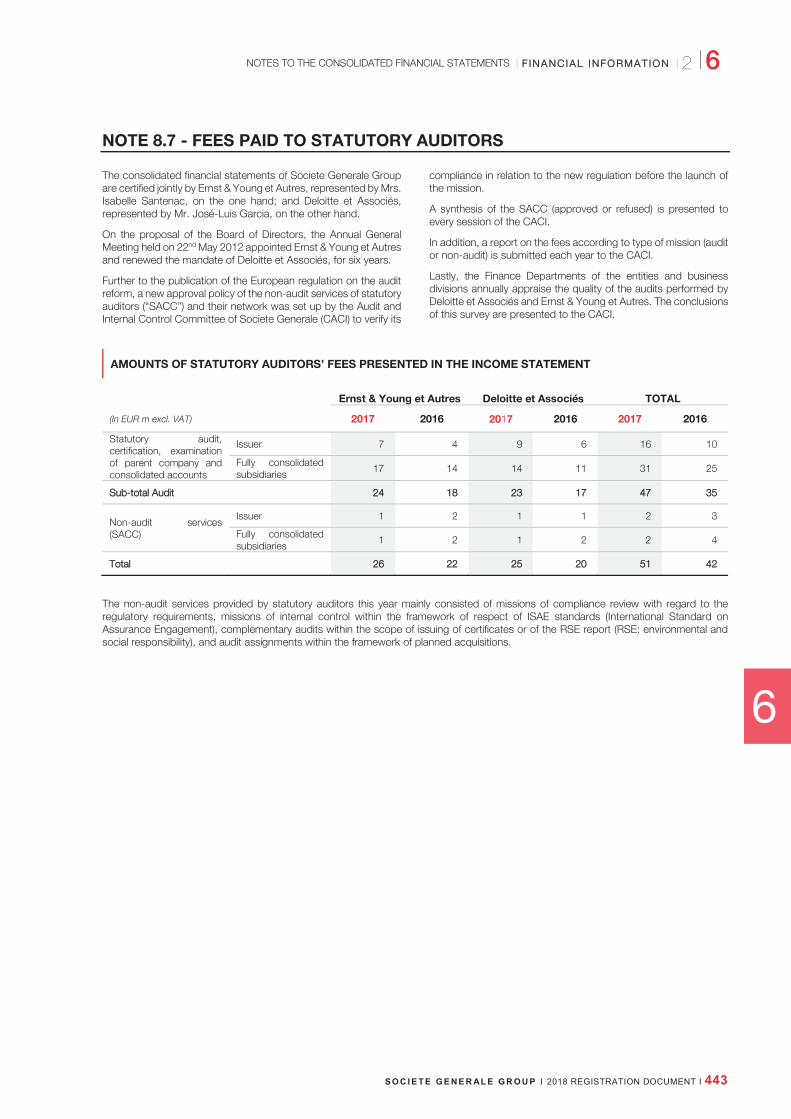
6
NOTES TO THE CONSOLIDATED FINANCIAL STATEMENTS
2 I 6FF I NA NC I A L I NF O RMA T I O NN
S O C I E T E G E N E R AL E G R O U P I 2018 REGISTRATION DOCUMENT I 443
NOTE 8.7 - FEES PAID TO STATUTORY AUDITORS
The consolidated financial statements of Societe Generale Group are certified jointly by Ernst & Young et Autres, represented by Mrs. Isabelle Santenac, on the one hand; and Deloitte et Associés, represented by Mr. José-Luis Garcia, on the other hand.
On the proposal of the Board of Directors, the Annual General Meeting held on 22nd May 2012 appointed Ernst & Young et Autres and renewed the mandate of Deloitte et Associés, for six years.
Further to the publication of the European regulation on the audit reform, a new approval policy of the non-audit services of statutory auditors (“SACC”) and their network was set up by the Audit and Internal Control Committee of Societe Generale (CACI) to verify its
compliance in relation to the new regulation before the launch of the mission.
A synthesis of the SACC (approved or refused) is presented to every session of the CACI.
In addition, a report on the fees according to type of mission (audit or non-audit) is submitted each year to the CACI.
Lastly, the Finance Departments of the entities and business divisions annually appraise the quality of the audits performed by Deloitte et Associés and Ernst & Young et Autres. The conclusions of this survey are presented to the CACI.
AMOUNTS OF STATUTORY AUDITORS’ FEES PRESENTED IN THE INCOME STATEMENT
Ernst & Young et Autres Deloitte et Associés TOTAL
(In EUR m excl. VAT) 2017 2016 2017 2016 2017 2016
Statutory audit, certification, examination of parent company and consolidated accounts
Issuer 7 4 9 6 16 10
Fully consolidated subsidiaries
17 14 14 11 31 25
Sub--total Audit 24 18 23 17 47 35
Non-audit services (SACC)
Issuer 1 2 1 1 2 3
Fully consolidated subsidiaries
1 2 1 2 2 4
Total 26 22 25 20 51 42
The non-audit services provided by statutory auditors this year mainly consisted of missions of compliance review with regard to the regulatory requirements, missions of internal control within the framework of respect of ISAE standards (International Standard on Assurance Engagement), complementary audits within the scope of issuing of certificates or of the RSE report (RSE: environmental and social responsibility), and audit assignments within the framework of planned acquisitions.

6 I 2
NOTES TO THE CONSOLIDATED FINANCIAL STATEMENTS FFINANCIAL INFORMATIONN
444 I 2018 REGISTRATION DOCUMENT I S O C I E T E G E N E R AL E G R O U P
NOTE 9 - INFORMATION ON RISKS AND LITIGATION Every quarter, the Group reviews in detail the disputes presenting a significant risk. These disputes may lead to the recording of a provision if it becomes probable or certain that the Group will incur an outflow of resources for the benefit of a third party without receiving at least the equivalent value in exchange.
For each of the disputes described in the present Chapter, no detailed information can be disclosed on either the recording or the amount of a specific provision given that such disclosure would likely seriously prejudice the outcome of the disputes in question.
Additionally, to take into account the development of a global risk of outflows regarding some ongoing judicial investigations and proceedings in the US (such as the Office of Foreign Assets Control) and with European authorities, as well as the dispute on the French “précompte”, the Group has recorded a provision for disputes among its liabilities which is disclosed in Note 3.8 to the consolidated financial statements.
Beginning in 2006, Societe Generale, along with numerous other banks, financial institutions, and brokers, received requests for information from the US Internal Revenue Service, the Securities and Exchange Commission (“SEC”) and the Antitrust Division of the U.S. Department of Justice (“DOJ”), focused on alleged noncompliance with various laws and regulations relating to the provision to governmental entities of Guaranteed Investment Contracts (“GICs”) and related products in connection with the issuance of tax-exempt municipal bonds. Societe Generale has cooperated with the US authorities.
On 24th October 2012, the Court of Appeal of Paris confirmed the first judgment delivered on 5th October 2010, finding J. Kerviel guilty of breach of trust, fraudulent insertion of data into a computer system, forgery and use of forged documents. J. Kerviel was sentenced to serve a prison sentence of five years, two years of which are suspended, and was ordered to pay EUR 4.9 billion as damages to the Bank. On 19th March 2014, the Supreme Court confirmed the criminal liability of J. Kerviel. This decision puts an end to the criminal proceedings. On the civil front, the Supreme Court has departed from its traditional line of case law regarding the compensation of victims of criminal offences against property and remanded the case to the Versailles Court of Appeal for it to rule on the amount of damages. On 23rd September 2016, the Versailles Court of Appeal rejected J. Kerviel’s request for an expert determination of the damage suffered by Societe Generale, and therefore confirmed that the accounting losses suffered by the Bank as a result of his criminal conduct amount to EUR 4.9 billion. It also declared J. Kerviel partially responsible for the damage caused to Societe Generale and sentenced him to pay EUR 1 million to Societe Generale. Societe Generale and J. Kerviel did not appeal before the Supreme Court. Societe Generale considers that this decision has no impact on its tax situation. However, as indicated by the Minister of the Economy and Finance in September 2016, the tax authorities have examined the tax consequences of this book loss and recently confirmed that they intended to call into question the deductibility of the loss caused by the actions of J. Kerviel, amounting to EUR 4.9 billion. This proposed tax rectification has no immediate effect and will possibly have to be confirmed by an adjustment notice sent by the tax authorities when Societe Generale is in a position to deduct the tax loss carryforwards arising from the loss from its taxable income. Such a situation will not occur for several years according to the Bank’s forecasts. In view of the 2011 opinion of the French Supreme Administrative Court (Conseil d’État) and its established case law which was recently confirmed
again in this regard, Societe Generale considers that there is no need to provision the corresponding deferred tax assets. In the event that the authorities decide, in due course, to confirm their current position, the Societe Generale Group will not fail to assert its rights before the competent courts.
Between 2003 and 2008, Societe Generale set up gold consignment lines with the Turkish group Goldas. In February 2008, Societe Generale was alerted to a risk of fraud and embezzlement of gold stocks held by Goldas. These suspicions were rapidly confirmed following the failure by Goldas to pay or refund gold worth EUR 466.4 million. Societe Generale brought civil proceedings against its insurers and various Goldas Group entities. Goldas launched various proceedings in Turkey and in the UK against Societe Generale. In the action brought by Societe Generale against Goldas in the UK, Goldas applied to have the action of SG struck-out and applied to the UK court for damages. On 3rd April 2017, the UK court granted both applications and will, after an inquiry into damages, rule on the amount due to Goldas, if any. On 14th September 2017, Societe Generale was granted leave to appeal by the Court of Appeal. A stay of the inquiry into damages was agreed upon by consent between Societe Generale and Goldas. The stay will be lifted upon determination of the appeal. On 16th February 2017, the Paris Commercial Court dismissed Societe Generale’s claims against its insurers. Societe Generale filed an appeal against this decision.
Societe Generale Algeria (“SGA”) and several of its branch managers are being prosecuted for breach of Algerian laws on exchange rates and capital transfers with other countries. The defendants are accused of having failed to make complete or accurate statements to the Bank of Algeria on capital transfers in connection with exports or imports made by clients of SGA. The events were discovered during investigations by the Bank of Algeria, which subsequently filed civil claims before the criminal court. Sentences were delivered by the court of appeal against SGA and its employees in some proceedings, while charges were dropped in other ones. To date, fourteen cases have ended in favour of SGA and nine remain pending, seven of which before the Supreme Court.
In the early 2000s, the French banking industry decided to transition to a new digital system in order to streamline cheque clearing. To support this reform (known as EIC – Echange d’Images Chèques), which has contributed to the improvement of cheque payments’ security and to the fight against fraud, the banks established several interbank fees (including the CEIC which was abolished in 2007). These fees were implemented under the aegis of the banking sector supervisory authorities, and to the knowledge of the public authorities.
On 20th September 2010, after several years of investigation, the French competition authority ruled that the joint implementation and the setting of the amount of the CEIC and of two additional fees for related services were in breach of competition law. The authority fined all the participants to the agreement (including the Banque de France) a total of approximately EUR 385 million. Societe Generale was ordered to pay a fine of EUR 53.5 million and Crédit du Nord, its subsidiary, a fine of EUR 7 million. However, in its 23rd February 2012 order, the French Court of Appeal, to which

6
NOTES TO THE CONSOLIDATED FINANCIAL STATEMENTS
2 I 6 FF I NA NC I A L I NF O RMA T I O NN
S O C I E T E G E N E R AL E G R O U P I 2018 REGISTRATION DOCUMENT I 445
the matter was referred by all the banks involved except Banque de France, held that there was no competition law infringement, allowing the banks to recoup the fines paid. On 14th April 2015, the Supreme Court quashed and annulled the Court of Appeal decision on the grounds that the latter did not examine the arguments of two third parties who voluntarily intervened in the proceedings. The case was heard again on 3rd and 4th November 2016 by the Paris Court of Appeal before which the case was remanded. On 21st December 2017, the Court of Appeal confirmed the fines imposed on Societe Generale and Crédit du Nord by the French competition authority. Societe Generale and Crédit du Nord have decided to file an appeal before the Supreme court against this decision.
Societe Generale Private Banking (Suisse), along with several other financial institutions, has been named as a defendant in a putative class action that is pending in the US District Court for the Northern District of Texas. The plaintiffs seek to represent a class of individuals who were customers of Stanford International Bank Ltd. (“SIBL”), with money on deposit at SIBL and/or holding Certificates of Deposit issued by SIBL as of 16th February 2009. The plaintiffs allege that they suffered losses as a result of fraudulent activity at SIBL and the Stanford Financial Group or related entities, and that the defendants are responsible for those alleged losses. The plaintiffs further seek to recoup payments made through or to the defendants on behalf of SIBL or related entities on the basis that they are alleged to have been fraudulent transfers. The Official Stanford Investors Committee (“OSIC”) was permitted to intervene and filed a complaint against Societe Generale Private Banking (Suisse) and the other defendants seeking similar relief.
The motion by Societe Generale Private Banking (Suisse) to dismiss these claims on grounds of lack of jurisdiction was denied by the court by order filed 5th June 2014. Societe Generale Private Banking (Suisse) sought reconsideration of the Court’s jurisdictional ruling, which the Court ultimately denied. On 21st April 2015, the Court permitted the substantial majority of the claims brought by the plaintiffs and the OSIC to proceed.
On 7th November 2017, the District Court denied the plaintiffs motion for class certification. The plaintiffs are seeking leave to appeal this decision.
On 22nd December 2015, the OSIC filed a motion for partial summary judgment seeking return of a transfer of USD 95 million to Societe Generale Private Banking (Suisse) made in December 2008 (prior to the Stanford insolvency) on the grounds that it is voidable under Texas state law as a fraudulent transfer. Societe Generale Private Banking (Suisse) has opposed this motion.
Societe Generale, along with other financial institutions, has received formal requests from the U.S. Department of Justice (“DOJ”) and the U.S. Commodity Futures Trading Commission (“CFTC”) (collectively, the “U.S. Authorities”), in connection with investigations regarding submissions to the British Bankers Association for setting certain London Interbank Offered Rates (“Libor”) and submissions to the European Banking Federation (now the EBF-FBE) for setting the Euro Interbank Offered Rate (“Euribor”), as well as trading in derivatives indexed to various benchmark rates.
Societe Generale is cooperating with the U.S. Authorities and is in discussions with them in order to reach an agreement to resolve this matter. Any such agreement would include a requirement that Societe Generale pay a monetary fine and may in addition impose other sanctions. It is possible, without it being certain, that the pending discussions lead to an
agreement in the next weeks or months. It is furthermore impossible to determine with certainty the amount of the fine or the other sanctions that may be imposed on Societe Generale.
In the United States, Societe Generale, along with other financial institutions, has been named as a defendant in putative class actions involving the setting of US Dollar Libor, Japanese Yen Libor, and Euribor rates and trading in instruments indexed to those rates. Societe Generale has also been named in several individual (non-class) actions concerning the US Dollar Libor rate. All of these actions are pending in the US District Court in Manhattan (the “District Court”).
As to US Dollar Libor, the District Court has dismissed all claims against Societe Generale in two of the putative class actions and in all of the individual actions. The class plaintiffs and a number of individual plaintiffs have appealed the dismissal of their antitrust claims to the United States Court of Appeals for the Second Circuit. Two other putative class actions are effectively stayed pending resolution of these appeals. Societe Generale was voluntarily dismissed from a fifth putative class action.
As to Japanese Yen Libor, the District Court dismissed the complaint brought by purchasers of Euroyen over-the-counter derivative products and the plaintiffs have appealed that ruling to the United States Court of Appeals for the Second Circuit. In the other action, brought by purchasers or sellers of Euroyen derivative contracts on the Chicago Mercantile Exchange (“CME”), the District Court has allowed certain Commodity Exchange Act claims to proceed to discovery. The plaintiff’s deadline to move for class certification in that action is 17th October 2018.
As to Euribor, the District Court dismissed all claims against Societe Generale in the putative class action and denied the plaintiffs’ motion to file a proposed amended complaint.
In Argentina, Societe Generale, along with other financial institutions, has been named as a defendant in litigation brought by a consumer association on behalf of Argentine consumers who held government bonds or other specified instruments that paid interest tied to US Dollar Libor. The allegations concern violations of Argentine consumer protection law in connection with alleged manipulation of the US Dollar Libor rate. Societe Generale has not yet been served with the complaint in this matter.
On 10th December 2012, the French Supreme Administrative Court (Conseil d’État) rendered two decisions confirming that the “précompte tax” which used to be levied on corporations in France does not comply with EU law and defined a methodology for the reimbursement of the amounts levied by the tax authorities. However, such methodology considerably reduces the amount to be reimbursed. Societe Generale purchased in 2005 the “précompte tax” claims of two companies (Rhodia and Suez, now ENGIE) with a limited recourse on the selling companies. One of the above decisions of the French Supreme Administrative Court relates to Rhodia. Societe Generale has brought proceedings before the French administrative courts. The latest court decision rendered is a rejection, on 1st February 2016 by the French Administrative Supreme Court, of an appeal lodged by ENGIE and Societe Generale.

6 I 2 NOTES TO THE CONSOLIDATED FINANCIAL STATEMENTS FFINANCIAL INFORMATIONN
446 I 2018 REGISTRATION DOCUMENT I S O C I E T E G E N E R AL E G R O U P
Several French companies applied to the European Commission, who considered that the decisions handed down by the French Supreme Administrative Court on 10th December 2012, which were supposed to implement the decision rendered by the Court of Justice of the European Union C-310/09 on 15th September 2011, infringed a number of principles of European law. The European Commission subsequently brought infringement proceedings against the French Republic in November 2014, and since then confirmed its position by publishing a reasoned opinion on 29th April 2016 and by referring the matter to the Court of Justice of the European Union on 8th December 2016.
Societe Generale is cooperating with the Office of ForeignAssets Control of the U.S. Department of the Treasury, theU.S. Attorney’s Office for the Southern District of New York,the New York County District Attorney’s Office, the Board ofGovernors of the Federal Reserve System, the FederalReserve Bank of New York, and the New York StateDepartment of Financial Services (collectively, the "USAuthorities") in the context of an investigation into certain U.S.dollar transactions processed by Societe Generale involvingcountries that are the subject of U.S. economic sanctions.
Societe Generale is engaged in discussions with the USAuthorities in order to reach an agreement to resolve thismatter. Any such agreement would include a requirement that Societe Generale pay a monetary fine and may in additionimpose other sanctions. It is possible, without it being certain, that the pending discussions lead to an agreement in the nextweeks or months. It is furthermore impossible to determinewith certainty the amount of the fine or the other sanctions that may be imposed on Societe Generale.
On 7th March 2014, the Libyan Investment Authority (“LIA”)brought proceedings against Societe Generale before theHigh Court of England regarding the conditions pursuant towhich LIA entered into certain investments with the SocieteGenerale Group. LIA alleges that Societe Generale and otherparties who participated in the conclusion of the investmentsnotably committed acts amounting to corruption. On 3rd May2017, Societe Generale and the Libyan Investment Authorityreached a settlement agreement with a GBP 813.26 millionpayment, putting an end to the dispute.
On 8th April 2014, the DOJ served a subpoena requesting that Societe Generale produce documents relating to potential violations of the Foreign Corrupt Practices Act in connection with certain transactions involving Libyan counterparties, including the LIA. In October 2016, the SEC (together with the DOJ, the “US Authorities”) issued a subpoena to Societe Generale and its U.S. broker-dealer requesting substantially the same information. Societe Generale is cooperating with the US Authorities in connection with this matter.
Societe Generale is in discussions with the DOJ in order to reach an agreement to resolve this matter. Any such agreement would include a requirement that Societe Generale pay a monetary fine and may in addition impose other sanctions. It is possible, without it being certain, that the pending discussions lead to an agreement in the next weeks or months. It is furthermore impossible to determine with certainty the amount of the fine or the other sanctions that may be imposed on Societe Generale.
In September and October 2017, Societe Generale also received two judicial requests to produce documents regarding its relations with the LIA in the scope of a preliminary investigation opened by the French National Financial Prosecutor’s office regarding possible violations of French anti-corruption laws. The requested documents have been communicated to the French authorities.
Societe Generale, along with other financial institutions, hasbeen named as a defendant in a putative class action allegingviolations of US antitrust laws and the Commodity ExchangeAct (“CEA”) in connection with its involvement in the LondonGold Market Fixing. The action is brought on behalf of persons or entities that sold physical gold, sold gold futures contractstraded on the CME, sold shares in gold ETFs, sold gold calloptions traded on CME, bought gold put options traded onCME, sold over-the-counter gold spot or forward contracts or gold call options, or bought over-the-counter gold put options. The action is pending in the US District Court in Manhattan.Motions to dismiss the action were denied by an order dated4th October 2016. Discovery is currently stayed by courtorders. Societe Generale and certain subsidiaries, along withother financial institutions, have also been named asdefendants in two putative class actions in Canada (in theOntario Superior Court in Toronto and Quebec Superior Court in Quebec City) involving similar claims.
On 30th January 2015, the CFTC served Societe Generalewith a subpoena requesting the production of information and documents concerning trading in precious metals done since1st January 2009. Societe Generale is cooperating with theauthorities.
SG Americas Securities, LLC (“SGAS”), along with otherfinancial institutions, was named as a defendant in severalputative class actions alleging violations of US antitrust lawsand the CEA in connection with its activities as a US PrimaryDealer, buying and selling US Treasury securities. The caseswere consolidated in the US District Court in Manhattan, andlead plaintiffs’ counsel appointed. An amended consolidatedcomplaint was filed on 15th November 2017, and SGAS wasnot named as a defendant. An individual “opt out” action filedon behalf of three entities electing not to participate in theclass action remains pending against SGAS.
Societe Generale, along with several other financialinstitutions, has been named as a defendant in a putative class action alleging violations of US antitrust laws and the CEA inconnection with foreign exchange spot and derivativestrading. The action is brought by persons or entities thattransacted in certain over-the-counter and exchange-tradedforeign exchange instruments. Societe Generale has reacheda settlement of USD 18 million, which was preliminarilyapproved by the Court. Notice to the class has begun, and afinal approval hearing is scheduled for 23rd May 2018.Separate putative class actions on behalf of putative classesof indirect purchasers are also pending. A motion to dismissthose cases is pending.

6
NOTES TO THE CONSOLIDATED FINANCIAL STATEMENTS
2 I 6FF I NA NC I A L I NF O RMA T I O NN
S O C I E T E G E N E R AL E G R O U P I 2018 REGISTRATION DOCUMENT I 447
Societe Generale and certain subsidiaries, along with other financial institutions, have also been named as defendants in two putative class actions in Canada (in the Ontario Superior Court in Toronto and Quebec Superior Court in Quebec City) involving similar claims. The Societe Generale defendants have reached a settlement covering both actions for a total amount of CAD 1.8 million. Both Canadian courts have approved the settlement, and the matters are concluded.
Further to an inspection conducted from 8th September to 1st
December 2015 within the Societe Generale Group in order to review the Group’s suspicious transaction reporting
policies and procedures, the ACPR gave Societe Generale notice on 26th July 2016 of the opening of enforcement proceedings against it. On 19th July 2017, the ACPR enforcement commission issued a reprimand against Societe Generale and ordered it to pay a fine of EUR 5 million.
Societe Generale was informed on 28th July 2017 of theopening of enforcement proceedings by the ACPRenforcement division related to the adequacy of SocieteGenerale’s level of vigilance on some cash withdrawals in retail banking, and of staff training in this field.

6 I 3 STATUTORY AUDITORS’ REPORT ON THE CONSOLIDATED FINANCIAL STATEMENTS FF I N A N C I A L I N F O R M A T I O N
448 I 2018 REGISTRATION DOCUMENT I S O C I E T E G E N E R AL E G R O U P
3 . S TAT U T O R Y A U D I T O R S ’ R E P O R T O NT H E C O N S O L I D AT E D F I N A N C I A LS TAT E M E N T S
DELOITTE & ASSOCIÉS ERNST & YOUNG et Autres
185, avenue Charles de Gaulle
92524 Neuilly-sur-Seine Cedex
S.A. au capital de € 1.723.040
Commissaire aux Comptes
Membre de la compagnie
régionale de Versailles
Tour First
TSA 14444
92037 Paris-La Défense Cedex
S.A.S. à capital variable
Commissaire aux Comptes
Membre de la compagnie
régionale de Versailles
SSOCIEETTE GEENNERALE
Société Anonyme
17, cours Valmy
92972 Paris-La Défense
This is a translation into English of the Statutory Auditors’ report on the consolidated financial statements of the Company issued in French and it is provided solely for the convenience of English-speaking users. This Statutory Auditors’ report includes information required by European regulation and French law, such as information about the appointment of the Statutory Auditors or verification of the information concerning the Group presented in the management report. This report should be read in conjunction with, and construed in accordance with, French law and professional auditing standards applicable in France.
To the Annual General Meeting of Societe Generale,
Opinion In compliance with the engagement entrusted to us by your Annual General Meeting, we have audited the accompanying consolidated financial statements of Societe Generale for the year ended 31st December 2017.
In our opinion, the consolidated financial statements give a true and fair view of the assets and liabilities and of the financial position of the Group as at 31st December 2017 and of the results of its operations for the year then ended in accordance with International Financial Reporting Standards as adopted by the European Union.
The audit opinion expressed above is consistent with our report to the Audit and Internal Control Committee.
Basis for Opinion AUDIT FRAMEWORK
We conducted our audit in accordance with professional standards applicable in France. We believe that the audit evidence we have obtained is sufficient and appropriate to provide a basis for our opinion.
Our responsibilities under those standards are further described in the Statutory Auditors’ Responsibilities for the Audit of the Consolidated Financial Statements section of our report.
INDEPENDENCE
We conducted our audit engagement in compliance with independence rules applicable to us, for the period from 1st January 2017 to the date of our report and specifically we did not provide any prohibited non-audit services referred to in Article 5(1) of Regulation (EU) No 537/2014 or in the French Code of Ethics (Code de déontologie) for Statutory Auditors.
Emphasis of Matter We draw attention to Note 3 “Financial instruments” to the consolidated financial statements which sets out the change in accounting policies related to the change in the presentation on the balance sheet of premiums to be received and premiums to be paid on options. Our opinion is not modified in respect of this matter.
Justification of Assessments - Key Audit Matters In accordance with the requirements of Articles L.823-9 and R.823-7 of the French Commercial Code (Code de commerce) relating to the justification of our assessments, we inform you of the key audit matters relating to risks of material misstatement that, in our professional judgement, were of most significance in our audit of the consolidated financial statements of the current period, as well as how we addressed those risks.
These matters were addressed in the context of our audit of the consolidated financial statements as a whole, and in forming our opinion thereon, and we do not provide a separate opinion on specific items of the consolidated financial statements.
F I N A N C I A L
Our response

6
F I N A N C I A L I N F O R M A T I O N
SOCIETE GENERALE
STATUTORY AUDITORS’ REPORT ON THE CONSOLIDATED FINANCIAL STATEMENTS FF I N A N C I A L
3 I 6
S O C I E T E G E N E R AL E G R O U P I 2018 REGISTRATION DOCUMENT I 449
MEASUREMENT OF THE PROVISION FOR DISPUTES
Risk identified
A provision for disputes in the amount of €2,318m (hereafter “the provision for disputes”) is recognised under liabilities in the balance sheet to cover the risks of future outflows of resources relating to several cases in which the Societe Generale Group is involved, as stated in Note 3.8 “Impairment and provisions – 2. Provisions” to the consolidated financial statements.
Societe Generale is subject to several investigations and requests for information of a regulatory nature from various authorities and regulators. These ongoing proceedings notably concern:
the investigations of American authorities on certain US dollartransfers on behalf of entities based in countries that are thesubject of economic sanctions ordered by the Americanauthorities;
transactions with Libyan counterparties including the LibyanInvestment Authority;
submissions made to market regulators to determine certainLIBOR rates;
as well as the dispute with the French tax authoritiesconcerning “précompte” (equalisation tax on dividends)receivables.
The ongoing investigations and requests for information are set out in Note 9 “Information on risks and litigation” to the consolidated financial statements. For the investigations by American authorities, the estimate of this provision results from Management’s assessment, taking into account the information in its possession on the progress of these proceedings, benchmarks with fines paid by other companies, and information obtained from the Group’s external legal advisers.
Given the uncertainty of the outcome of these investigations and the inherent difficulty in estimating the amount of potential fines, the measurement of the provision for disputes, which is based on the exercise of Management’s judgement, is a key audit matter.
Our response
Our work notably consisted in:
monitoring the main legal proceedings and the ongoinginvestigations undertaken by the judicial authorities and theregulators with the Group’s legal department;
familiarising ourselves with the process for the measurementof the provision for disputes, notably through quarterlydiscussions with the Societe Generale Group’s Management;
assessing the assumptions used to determine the provisionfor disputes on the basis of the information that we obtained,in particular from the Group’s external legal advisers,specialised in these cases;
examining the disclosures on these disputes in the notes tothe consolidated financial statements.
RECOVERABILITY OF DEFERRED TAX ASSETS OF THE FRENCH TAX GROUP AND AMERICAN ENTITIES
Risk identified
As at 31st December 2017, an amount of €4,765m has been recorded under deferred tax assets.
As stated in Note 6 “Income tax” to the consolidated financial statements, Societe Generale Group calculates deferred taxes at the level of each tax entity and recognises deferred tax assets at the closing date when it is considered probable that future taxable profits will be available against which the tax entity concerned will be able to charge timing differences and tax loss carryforwards, over a determined period of time.
Furthermore, as stated in Notes 6 “Income tax” and 9 “Information on risks and litigation” to the consolidated financial statements, certain tax loss carryforwards are challenged by the French tax authorities and consequently may be called into question.
Given the assumptions used to assess the recoverability of the deferred tax assets and the judgement exercised by Management in this respect, we identified this issue as a key audit matter for the French tax group and the American entities, which represent the most significant part of these assets.
Our response
Our audit approach consisted in assessing the probability that the Group will be able to make future use of the tax loss carryforwards generated to date, notably based on the ability of the tax entities (in France and the United States) to make future taxable profits that can absorb past losses.
With the support of our tax specialists, we:
compared the projected results for past years with the actualresults for the years concerned;
obtained an understanding of the three-year business plandrawn up by Management and approved by the Board ofDirectors;
assessed the assumptions used by Management beyond thethree-year period to establish projected results;
assessed the sensitivity of these assumptions in the event ofunfavourable scenarios defined by Societe Generale Group;
performed tests on the calculation of the deferred tax assetbases and examined the consistency of the tax rates used. Inparticular, we considered whether the legislative changesmade during the year ended 31st December 2017 concerningthe taxation rate in France and in the United States had beentaken into account;
analysed Societe Generale’s situation, and familiarisedourselves with the opinion from its external tax advisersregarding its tax loss carryforwards in France, partiallychallenged by the tax authorities;
examined the disclosures on deferred tax assets in Notes 6and 9 to the consolidated financial statements.

450 I 2018 REGISTRATION DOCUMENT I S O C I E T E G E N E R AL E G R O U P
VALUATION OF COMPLEX FINANCIAL INSTRUMENTS CLASSIFIED AS LEVEL 3 IN THE FAIR VALUE HIERARCHY
RRisk identified
Within the scope of its market activities, Societe Generale holds financial instruments for trading purposes.
To calculate the fair value of the instruments classified as level 3, the Group uses techniques or internal models based on data that are not observable in the market, as stated in Note 3.4 “Fair value of financial instruments measured at fair value”. The models and
data used to value these instruments are based on Management’s estimates.
Due to the use of judgement to determine the instruments’ fair value, the complexity of the modelling of the latter and the multiplicity of models used, we consider the valuation of the complex financial instruments classified as level 3 to be a key audit matter.
OOur response
Our audit approach is focused on certain key internal control processes related to the valuation of the financial instruments classified as level 3. With the support of our specialists in the valuation of financial instruments, we developed an approach including the following main stages:
we familiarised ourselves with the procedure for theauthorisation and validation of new products and theirvaluation models, including the process for the entry of thesemodels into the information systems;
we assessed the governance relating to the RiskDepartment’s control of the valuation models used;
more specifically, based on tests, we considered the valuation formulae for certain categories of complex instruments;
we analysed certain market parameters used to provide inputfor the valuation models;
as regards the daily profit and loss explanation process, wefamiliarised ourselves with the analysis principles used by thebank and performed tests of controls. We also performed“analytical” IT procedures on the database for the controlsperformed on the daily profit and loss explanation process;
at each quarterly closing, we obtained the results of theprocess for the independent price verification, and weanalysed any differences in parameters compared to themarket data in the event of a significant impact, as well as theaccounting treatment of such differences;
we performed counter-valuations of a selection of derivativefinancial instruments classified as level 3, using our tools;
we considered the compliance of the documented methodsunderlying the estimates with the principles described in Note3.4 “Fair value of financial instruments measured at fair value”to the consolidated financial statements, and we analysed thecriteria used to determine the levels of the fair value hierarchy.
INFORMATION TECHNOLOGY RISK ON DERIVATIVE FINANCIAL INSTRUMENTS AND STRUCTURED PRODUCTS
RRisk identified
Societe Generale’s derivative financial instruments and structured products constitute, for the Group, an important activity within its market activities, as illustrated by the significance of the net positions of derivative financial instruments in the transaction portfolio in Note 3.2 “Financial derivatives”.
This activity is highly complex due to the nature of the financial instruments processed, the volume of transactions, and the use of numerous information systems interfacing with each other.
The risk of an IT incident could entail the risk of an anomaly in the accounts as a result of an incident in the data processing chains used, or the recording of transactions until they are transferred into the accounting system. Such a risk may notably take the form of:
changes made to management and financial information byunauthorised personnel via the information systems orunderlying databases;
a failure in processing or in the transfer of data betweensystems;
a service interruption or operating incident, possiblyassociated with internal or external fraud.
In this context, the monitoring by the Societe Generale Group of controls linked to information systems management relating to the above-mentioned activity is essential for the reliability of the accounts and is a key audit matter.
6 I 3 STATUTORY AUDITORS’ REPORT ON THE CONSOLIDATED FINANCIAL STATEMENTS FF I N A N C I A L I N F O R M A T I O N F I N A N C I A L

6
F I N A N C I A L I N F O R M A T I O N
S O C I E T E G E N E R AL E G R O U P I 2018 REGISTRATION DOCUMENT I 451
OOur response
Our audit approach to this activity is based on the controls related to the information systems management set up by the Group. With the support of our experts in financial systems, we tested the IT general controls on the applications that we considered to be significant for these activities. Our work concerned the following in particular:
the controls set up by Societe Generale on access rights,notably at sensitive times in a professional career (recruitment, transfer, resignation, end of contract) with, when necessary,extended audit procedures in the event of ineffective controlidentified during the year 31st December 2017;
potential privileged access to applications and infrastructure;
change management and, more specifically, the separation
between development and business environments;
security policies in general and their deployment in ITapplications (for example, those related to passwords);
handling of IT incidents during the audit period;
governance and the control environment in a sample of “enduser” applications.
For these same applications, in order to assess the transfer of information flows, we tested the application controls related to the automated interfaces between the systems.
Our tests on the IT general controls and application controls were supplemented by data analytics work on certain IT applications.
MEASUREMENT OF IMPAIRMENT ON LOANS AND OTHER COMMITMENTS GRANTED TO CORPORATE CLIENTS IN CERTAIN SECTORS SENSITIVE TO THE ECONOMIC SITUATION
RRisk identified
Loans and receivables to corporate clients carry a credit risk that exposes Societe Generale Group to a potential loss if its client or counterparty is unable to meet its financial commitments. The existence of a credit risk is assessed for each financial asset individually, or on the basis of homogeneous portfolios of financial instruments if there is no objective indication of impairment for a financial asset considered individually.
The Societe Generale Group recognises impairment losses to cover the credit risks inherent to its activities and makes accounting estimates to measure the level of impairment of individual receivables and homogeneous groups of assets.
Impairment on individually impaired loans and on homogeneous groups of receivables amount to €11,214m and €1,311m respectively as at 31st December 2017, as stated in Note 3.5
“Loans and receivables – 2. Customer loans” to the consolidated financial statements.
The Group’s Risk Department uses its judgement to determine the assumptions and parameters used to calculate these impairment losses. The main assumptions taken into account by Management for the measurement of impairment losses are probability of default for performing loans and loss given default for performing and doubtful loans.
Given the Group’s activities, we consider the measurement of impairment losses on loans and commitments to corporate clients in certain sectors sensitive to the economic situation to be a key audit matter.
OOur response
We familiarised ourselves with the impairment loss measurement process adopted by the Societe Generale Group. We tested the key controls set up by Management for determining the assumptions and parameters used as a basis for this measurement. Our work consisted in assessing:
the procedure for the detection of corporate counterpartiesthat are in a weak financial situation or in default;
the provisioning methods used for homogeneous groups ofassets in the sectors selected;
the assumptions and parameters used for a selection ofindividual files and for homogeneous groups of assets in thesectors selected;
the compliance of the documented methods underlying theestimates with the principles described in Note 3.8“Impairment and provisions” to the consolidated financialstatements.
STATUTORY AUDITORS’ REPORT ON THE CONSOLIDATED FINANCIAL STATEMENTS FF I N A N C I A L
3 I 6

452 I 2018 REGISTRATION DOCUMENT I S O C I E T E G E N E R AL E G R O U P
Verification of the Information Pertaining to the Group Presented in the Management Report As required by law we have also verified in accordance with professional standards applicable in France the information pertaining to the Group presented in the Board of Directors’ management report.
We have no matters to report as to its fair presentation and its consistency with the consolidated financial statements.
Report on Other Legal and Regulatory Requirements APPOINTMENT OF THE STATUTORY AUDITORS
We were appointed as Statutory Auditors of Societe Generale by your Annual General Meeting held on 18th April 2003 for DELOITTE & ASSOCIES and on 22nd May 2012 for ERNST & YOUNG et Autres.
As at 31st December 2017, DELOITTE & ASSOCIES was in the fifteenth year and of total uninterrupted engagement and ERNST & YOUNG et Autres in the sixth.
Previously, ERNST & YOUNG Audit was the statutory auditor of Societe Generale from 2000 to 2011.
Responsibilities of Management and Those Charged with Governance for the Consolidated Financial Statements Management is responsible for the preparation and fair presentation of the consolidated financial statements in accordance with International Financial Reporting Standards as adopted by the European Union and for such internal control as management determines is necessary to enable the preparation of consolidated financial statements that are free from material misstatement, whether due to fraud or error.
In preparing the consolidated financial statements, management is responsible for assessing the Company’s ability to continue as a going concern, disclosing, as applicable, matters related to going concern and using the going concern basis of accounting unless it is expected to liquidate the Company or to cease operations.
The Audit and Internal Control Committee is responsible for monitoring the financial reporting process and the effectiveness of internal control and risk management systems and where applicable, its internal audit, regarding the accounting and financial reporting procedures.
The consolidated financial statements were approved by the Board of Directors.
Statutory Auditors’ Responsibilities for the Audit of the Consolidated Financial Statements OBJECTIVES AND AUDIT APPROACH
Our role is to issue a report on the consolidated financial statements. Our objective is to obtain reasonable assurance about whether the consolidated financial statements as a whole are free from material misstatement. Reasonable assurance is a high level of assurance, but is not a guarantee that an audit conducted in accordance with professional standards will always detect a material misstatement when it exists. Misstatements can arise from fraud or error and are considered material if, individually or in the aggregate, they could reasonably be expected to influence the economic decisions of users taken on the basis of these consolidated financial statements.
As specified in Article L.823-10-1 of the French Commercial Code (Code de commerce), our statutory audit does not include assurance on the viability of the Company or the quality of management of the affairs of the Company.
As part of an audit conducted in accordance with professional standards applicable in France, the statutory auditor exercises professional judgement throughout the audit and furthermore:
Identifies and assesses the risks of material misstatement ofthe consolidated financial statements, whether due to fraud or error, designs and performs audit procedures responsive tothose risks, and obtains audit evidence considered to besufficient and appropriate to provide a basis for his opinion.The risk of not detecting a material misstatement resultingfrom fraud is higher than for one resulting from error, as fraudmay involve collusion, forgery, intentional omissions,misrepresentations, or the override of internal control;
Obtains an understanding of internal control relevant to theaudit in order to design audit procedures that are appropriatein the circumstances, but not for the purpose of expressing an opinion on the effectiveness of the internal control;
Evaluates the appropriateness of accounting policies usedand the reasonableness of accounting estimates and relateddisclosures made by management in the consolidatedfinancial statements;
Assesses the appropriateness of management’s use of thegoing concern basis of accounting and, based on the auditevidence obtained, whether a material uncertainty existsrelated to events or conditions that may cast significant doubton the Company’s ability to continue as a going concern. Thisassessment is based on the audit evidence obtained up to the date of his audit report. However, future events or conditionsmay cause the Company to cease to continue as a goingconcern. If the statutory auditor concludes that a materialuncertainty exists, there is a requirement to draw attention inthe audit report to the related disclosures in the consolidatedfinancial statements or, if such disclosures are not provided or inadequate, to modify the opinion expressed therein;
6 I 3 STATUTORY AUDITORS’ REPORT ON THE CONSOLIDATED FINANCIAL STATEMENTS FF I N A N C I A L I N F O R M A T I O N F I N A N C I A L

6
F I N A N C I A L I N F O R M A T I O N
S O C I E T E G E N E R AL E G R O U P I 2018 REGISTRATION DOCUMENT I 453
Evaluates the overall presentation of the consolidated financial statements and assesses whether these statements represent the underlying transactions and events in a manner thatachieves fair presentation;
Obtains sufficient appropriate audit evidence regarding thefinancial information of the entities or business activities withinthe Group to express an opinion on the consolidated financialstatements. The statutory auditor is responsible for thedirection, supervision and performance of the audit of theconsolidated financial statements and for the opinionexpressed on these consolidated financial statements.
REPORT TO THE AUDIT AND INTERNAL CONTROL COMMITTEE
We submit a report to the Audit and Internal Control Committee which includes in particular a description of the scope of the audit and the audit programme implemented, as well as the results of our audit. We also report significant deficiencies, if any, in internal
control regarding the accounting and financial reporting procedures that we have identified.
Our report to the Audit and Internal Control Committee includes the risks of material misstatement that, in our professional judgement, were of most significance in the audit of the consolidated financial statements of the current period and which are therefore the key audit matters that we are required to describe in this report.
We also provide the Audit and Internal Control Committee with the declaration provided for in Article 6 of Regulation (EU) No. 537/2014, confirming our independence within the meaning of the rules applicable in France such as they are set in particular by Articles L.822-10 to L.822-14 of the French Commercial Code (Code de commerce) and in the French Code of Ethics (code de déontologie) for Statutory Auditors. Where appropriate, we discuss with the Audit and Internal Control Committee the risks that may reasonably be thought to bear on our independence, and the related safeguards.
Neuilly-sur-Seine et Paris-La Défense, 8th March 2018
The Statutory Auditors French original signed by
DELOITTE & ASSOCIES ERNST & YOUNG et Autres
José-Luis Garcia Isabelle Santenac
STATUTORY AUDITORS’ REPORT ON THE CONSOLIDATED FINANCIAL STATEMENTS FF I N A N C I A L
3 I 6

6 I 4 SOCIETE GENERALE MANAGEMENT REPORT FF I N A N C I A L I N F O R M A T I O NN
454 I 2018 REGISTRATION DOCUMENT I S O C I E T E G E N E R AL E G R O U P
4 . S O C I E T E G E N E R A L E M A N A G E M E N TR E P O R T
SUMMARY BALANCE SHEET OF SOCIETE GENERALE
(In EUR bn at 31st December) 31.12.2017 31.12.2016 Change
Interbank and money market assets 208 182 26
Customer loans 264 265 (1)
Securities 570 535 35
o.w. securities purchased under resale agreements 201 215 (14)
Other assets 139 210 (71)
o.w. option premiums 57 93 (36)
Tangible and intangible fixed assets 2 2 (0)
Total assets 1,183 1,194 (11)
(In EUR bn at 31st December) 31.12.2017 31.12.2016 Change
Interbank and money liabilities(1) 254 229 25
Customer deposits 340 353 (13)
Bonds and subordinated debt(2) 31 32 (1)
Securities 381 338 43
o.w. securities sold under repurchase agreements 189 180 9
Other liabilities and provisions 142 205 (63)
o.w. option premiums 61 98 (37)
Equity 35 36 (1)
Total lliabilities and shareholders’ equity 1,183 1,194 (11)
(1) Including negotiable debt instruments. (2) Including undated subordinated capital notes.
Societe Generale’s balance sheet totalled EUR 1,183 billion, down EUR 11 billion compared with 31st December 2016.
There were many causes for concern at the beginning of 2017: rising oil prices, stagnant low interest rates and elections in Europe in the wake of Brexit. However, as the year progressed, these concerns evaporated, and the pace of growth in the global economy (estimated at 3.6% in 2017) exceeded both that seen in 2016 and the long-term trend. Against this backdrop, Societe Generale confirmed the strength of its financial structure, with capital ratios that went further than (already strict) regulatory requirements.
The EUR +26 billion increase in Interbank and money market assets was partially the result of loans to subsidiaries and increased deposits, reflecting the readily available abundance of cash assets at particularly low interest rates from central banks in order to satisfy both regulatory requirements – in particular future NSFR (Net Stable Funding Ratio) requirements – and the need to strengthen the Group’s financing structure.
2017 saw strong momentum in the production of mortgage loans, but without any corresponding increase in customer loan
outstandings, which remained stable year-on-year, with the substantial wave of Prepayments and Renegotiations now dropping off. Housing loans were down by EUR 8 billion further to a mortgage loan securitisation transaction, offset by an increase in loans to Group subsidiaries.
In a competitive environment, Retail Banking posted sustained growth in its sight deposits in 2017. Balance sheet outstandings on regulated savings accounts increased again, by EUR 2.7 billion (EUR +2.6 billion in 2016). Conversely, those of individuals and corporates were down by EUR 16 billion.
The equity portfolio, which posted a EUR 23 billion increase, benefited from the rebound in certain stock market indices, thus reflecting economic growth. The outstanding treasury notes portfolio was also up, by EUR 19.3 billion, due to a new securities lending activity that resulted in an increase in the amounts payable on securities borrowed, on the liabilities side. In the context of the abovementioned securitisation transaction, the Group Treasury function subscribed to bonds issued by the securitisation fund for EUR 9 billion.

6
SOCIETE GENERALE MANAGEMENT REPORT
4 I 6FF INANCIAL INFORMAT IONN
S O C I E T E G E N E R AL E G R O U P I 2018 REGISTRATION DOCUMENT I 455
As regards other financial accounts, which are by nature volatile on both sides of the balance sheet and which follow stock market indices that enjoyed significant growth over 2017, the Group endeavoured to maintain a relevant product range and improve the clarity of its financial statements. This resulted in a lower valuation of derivatives and a reduction in guarantee deposits pledged and received on market transactions, as well as in premiums on options.
Societe Generale boasts a diversified range of funding sources and channels:
stable resources consisting of equity and subordinated debt(EUR 66 billion);
customer deposits, which make up a significant share (29%)of total balance sheet resources;
resources in the form of interbank deposits and borrowings(EUR 172 billion);
capital raised on the market through a proactive diversification policy, making use of various types of debt (secured andunsecured bonds, etc.), issuance vehicles (EMTNs,Certificates of Deposit), currencies and investor pools (EUR 76 billion);
resources from securities sold under repurchase agreementsto customers and banks (EUR 189 billion).
The Group’s financing structure is based on substantial deposit inflows across all of its business lines and on the extension of its funding sources, which reflects Societe Generale’s efforts to strengthen the structure of its balance sheet in recent years.
SUMMARY INCOME STATEMENT OF SOCIETE GENERALE
2017 2016 CHANGE 17/16 (%)
(In EUR m) France International Societe
Generale France International
Societe Generale
France International Societe
Generale
Net Banking Income 7,220 2,719 9,939 10,6617 3,6607 14,224 (32) (255) (30)
Total operating expenses (7,804) (1,803) (9,607) (6,789) (2,428) (9,217) 15 (26) 4
Gross operating income (584) 916 332 3,8828 1,1179 5,007 (115) (22) (93)
Cost of risk (542) (122) (664) (731) (253) (984) (26) (52) (33)
Operating income (1,126) 794 (332) 3,0097 926 4,023 (136) (144) (108)
Net income from long-term investments
1,092 (68) 1,024 444 2 446 146 N/A 130
Operating income before income tax (34) 726 692 3,5541 928 4,469 (101) (222) (85)
Income tax 490 (382) 108 (332) 86 (246) (248) (544) (144)
Net income 456 344 800 3,2209 1,0014 4,223 (86) (66) (81)
In 2017, Societe Generale generated gross operating income of EUR 0.3 billion, down by EUR 4.7 billion compared with 2016, mainly due to a EUR 4.2 billion decrease in net banking income.
The following exceptional events took place in 2017:
Net banking income for 2017 absorbed EUR -963 million in relation to the settlement with the Libyan Investment Authority (LIA), ending the dispute between the two parties;
The disposal of 20% of the shares in ALD, the Group’s operational vehicle leasing and fleet management subsidiary, by means of a floatation on the Euronext Paris regulated market, generated a gain of EUR 960 million in income from long-term investments;
Societe Generale continued the optimisation of its business portfolio, involving in particular the disposal of Societe Generale Splitska Banka, which resulted in a loss of EUR 51 million;
Societe Generale launched a new phase in the adaptation of its French network, aimed at accelerating expertise and agility improvements in its organisation, with a view to better serving its customers. The proposed reorganisation will involve approximately 900 job cuts in addition to the 2,550 already announced at the beginning of 2016, taking the total number to
around 3,450 by 2020. This reorganisation, together with the accelerated overhaul of certain compliance systems, resulted in Societe Generale booking an exceptional expense of EUR 380 million in the 2017 accounts;
The tax reforms implemented in France, entailing adjustments to deferred taxes further to the progressive reduction in the corporate income tax rate (from 33% to 25% by 2022) included in the French Finance Act for 2018 and the refund of the 3% additional contribution on dividends, deemed unlawful by the French Constitutional Court, had an impact of EUR -146 million on the 2017 tax expenses. In addition, further to a reassessment proposal received following an audit by the French tax authorities covering various operating taxes, Societe Generale booked a provision of EUR 142 million in operating expenses.
Under the US Tax Cuts and Jobs Act, promulgated on 22nd December 2017, the federal corporate income tax rate was reduced to 21%, effective as from January 2018. In view of the short-term accounting impact of this change and the valuation of deferred tax assets of the US tax group, Societe Generale booked a charge of EUR 253 million.

6 I 4
SOCIETE GENERALE MANAGEMENT REPORT FF I N A N C I A L I N F O R M A T I O NN
456 I 2018 REGISTRATION DOCUMENT I S O C I E T E G E N E R AL E G R O U P
Operating expenses included an exceptional item relating to the booking of a charge following the judgment of the Paris Court of Appeal of 21st December 2017 confirming the fine in the litigation related to the dematerialisation of cheque processing, amounting to EUR 53 million.
Net Banking Income (NBI) amounted to EUR 9,939 million in 2017, down 30% as compared to 2016. NBI suffered from the decline in dividends received (EUR -2,418 million), and also includes the exceptional impact of the LIA settlement (EUR -963 million).
French Retail Banking’s net banking income was lower than in 2016 (EUR -0.4 billion). Fees were up by +3%, whereas the net interest margin was down by -12% compared with 2016. In a low interest rate environment, French Retail Banking focused on developing its growth drivers and fee-generating activities.
The results from Global Banking and Investor Solutions were slightly lower than in 2016. Its businesses demonstrated resilience over the year, despite volatility remaining historically low. Income from Global Finance was lower than in 2016, but was offset by improved income from Coverage and Investment Banking. Income from Equity and from Securities Services increased in 2017 on the back of strong commercial performance derived from a return to growth in the European economy and healthy equity markets.
The Corporate Centre, which includes the management of the Group’s equity portfolio, recorded a decline in dividends received (EUR -2.4 billion compared with 2016). This was the result of exceptional interim dividends paid by holding subsidiaries at end-2016 (EUR -1.1 billion). In addition, certain banking subsidiaries reduced their dividend base so as to strengthen their regulatory capital.
The employment competitiveness tax (CICE) amounted to EUR 44 million in 2017 (vs. EUR 38 million in 2016) and was used in accordance with regulations. In 2017, this tax made it possible to continue technological investments, thereby supporting Societe Generale’s digital transition process. It was allocated to the following items:
Strengthening of the positioning of Retail Banking by ensuring the digital transition of our businesses (websites, mobile applications and tablets for customers and advisers, digitalised processing);
Ongoing transformation of the investment bank’s historic IT systems to a more digital, strongly customer-oriented and more flexible interface;
Ongoing continuous delivery of IT services and gradual roll-out of the Agile at scale methodology;
Ongoing technological monitoring through partnerships with start-ups on innovative projects, coordination of cross-business
communities with a view to fostering strategic inspiration;
Launch of the Internal Start-up Call programme, an ‘intrapreneurial’ initiative open to all Societe Generale employees that aims to encourage the creation of new internal start-ups focused on high-potential groundbreaking businesses;
Improvement of tools and usages (Cloud, Big Data, Open Source, API, collaborative tools, etc.);
Ongoing investments, following on from the technological innovations implemented at the Dunes building, which equipped 3,900 more employees with collaborative, connected and mobile solutions.
Operating expenses increased by EUR 0.4 billion. Societe Generale continued to invest in its digital transformation and the growth of its businesses, whilst pursuing strict cost control.
Operating expenses for 2017 included the abovementioned exceptional items in respect of the retail banking network’s transformation, the consequences of the judgment of 21st December in respect of the dematerialisation of cheque processing and the French tax authorities’ reassessment proposal (EUR -0.6 billion in total).
Net cost of risk was EUR 0.7 billion at end-2017, down EUR 0.3 billion year-on-year. The reduction in net cost of risk seen since 2016 continued, proving the quality of Societe Generale’s loan approval policy.
In 2017, the net cost of the provision for disputes remained unchanged from the previous year, at EUR -0.4 billion, thus resulting in a balance sheet total of EUR 2.3 billion.
The combination of all these items led to a sharp decline in operating income (EUR -4.4 billion).
In 2017, Societe Generale recorded a gain from long-term investments of EUR 1 billion, primarily from the capital gain upon the disposal of part of its stake in ALD further to the latter’s stock market floatation. As a reminder, the gain from long-term investments in 2016, which amounted to EUR 0.4 billion, derived primarily from the capital gain generated through the disposal of the Group’s stake in Visa Europe for EUR 0.5 billion.
Income tax represented a positive balance of EUR +0.1 billion (compared to a charge of EUR -0.2 billion in 2016). This change is mainly due to the decline in income before tax (EUR -3.7 billion) and takes into account exceptional items related to the French and US tax reforms (EUR -0.4 billion).
Net income after tax thus amounted to EUR 0.8 billion at end-2017 versus EUR 4.2 billion at end-2016.

6
SOCIETE GENERALE MANAGEMENT REPORT
4 I 6FF INANCIAL INFORMAT IONN
S O C I E T E G E N E R AL E G R O U P I 2018 REGISTRATION DOCUMENT I 457
TRADE PAYABLES PAYMENT SCHEDULE
31.12.2017 31.12.2016
Payables not yet due Payables not yet due
(In EUR m) 1 to 30 days
31 to 60
days
More than 60
days
More than 90
days
Payables due
Total 1 à 30 days
31 to 60
days
More than 60
days
More than 90
days
Payables due
Total
Trade payables 42 29 0 0 27 98 36 42 0 0 44 122
Due dates are based on the condition that invoices must be paid within 60 days of issue.
The processing of Societe Generale France’s supplier invoices is largely centralised. The department responsible for this processing books and settles invoices for services requested by all of Societe Generale France’s corporate and business divisions. The branches of the French network, however, have dedicated teams to process and pay their own invoices.
In accordance with the Group’s internal control procedures, invoices are only paid after they have been validated by the departments that signed for the services. The average time for the payment of invoices after validation is between three and seven days.
In accordance with Article D. 441-4 of the French Commercial Code, as worded pursuant to French Decree No. 2015-1553 of 27th November 2015 and implemented pursuant to the Order of 6th April 2016, the information on supplier payment times is as follows:
31.12.2017
Payables due
0 days (indication)
1 to 30 days
31 to 60 days
61 to 90 days
91 days and over
Total (1 day and over)
(A) PPayment delay
Number of invoices concerned - 834 450 287 3,046 4,617 Total amount (excl. tax) of invoices concerned (In EUR m) - 10 7 4 6 27 Percentage of total purchases (excl. tax) for the year - - - - - -
(B) IInvoices excluded from (A) ppertaining to disputed payables and receivables,, nnot recorded
Number of invoices excluded - - - - - -
Total amount (excl. tax) of invoices excluded - - - - - -
(C) RReference payment times used when calculating delay ((Article LL.441-66 or L.443--1 oof the French Commercial Code))
Contractual payment terms Statutory payment terms (60 days from invoice date or 45 days end of month)
PAYMENT TIMES ON ACCOUNTS RECEIVABLE.
Payment times on Accounts Receivable in Respect of Financing Granted or Services Invoiced are fixed by contract. The initial payment terms set for loan repayments may be amended by means of contractual options (such as prepayment options, or options to defer payments). Compliance with contractual payment terms is monitored as part of the bank’s risk management process (see Chapter 4 of this Registration Document, “Risks and Capital Adequacy”), particularly in respect of credit risk, structural interest rate risk, and liquidity risk. The residual maturities of accounts receivable are indicated in Note 7.3 to the parent company financial statements.

6 I 4
SOCIETE GENERALE MANAGEMENT REPORT FF I N A N C I A L I N F O R M A T I O NN
458 I 2018 REGISTRATION DOCUMENT I S O C I E T E G E N E R AL E G R O U P
FIVE-YEAR FINANCIAL SUMMARY OF SOCIETE GENERALE
(In EUR m) 2017 2016 2015 2014 2013
Financial position at year--end
Capital stock (in EUR m) (1) 1,010 1,010 1,008 1,007 998
Number of shares issued (2) 807,917,739 807,713,534 806,239,713 805,207,646 798,716,162
Results of operations (in EUR m) -
Revenue excluding tax (3) 27,207 27,174 28,365 25,119 25,887
Earnings before tax, depreciation, amortisation, provisions, employee profit sharing and general reserve for banking risks
1,678 5,884 5,809 2,823 3,901
Employee profit sharing 11 13 15 12 10
Income tax (109) 246 (214) 99 (221)
Net income 800 4,223 1,065 996 2,714
Total dividends paid 1,777 1,777 1,612 966 799
Earnings per share (in EUR) -
Earnings after tax but before depreciation, amortisation and provisions 2.20 6.96 7.45 3.37 5.15
Net income 0.99 5.23 1.32 1.24 3.40
Dividend paid per share 2.20 2.20 2.00 1.20 1.00
Employees -
Headcount 46,804 46,445 46,390 45,450 45,606
Total payroll (in EUR m) 3,560 3,696 3,653 3,472 3,459
Employee benefits (Social Security and other) (in EUR m) 1,475 1,468 1,452 1,423 1,407
(1) In 2017, Societe Generale carried out a capital increase for a total of EUR 0.26 million, further to employees exercising the options granted to them by the Board of Directors, with additional paid-in capital of EUR 8.16 million.
(2) At 31st December 2017, Societe Generale’s fully paid-up capital amounted to EUR 1,009,897,173.75 and comprised 807,917,739 shares with a nominal value of EUR 1.25.
(3) Revenue consists of interest income, dividend income, fee income, income from financial transactions and other operating income.
MAIN CHANGES IN THE INVESTMENT PORTFOLIO IN 2017
In 2017, the following transactions affected Societe Generale’s investment portfolio:
Outside France In France
Creation of Creation of
Acquisition of interest in Acquisition of interest iin
Acquisition Acquisition
SG Thailand SGEFSA
Increase of interest in Increase of interest in
Subscription to capital increase Subscription to capital increase
SG Congo, SG Mozambique SGEF SA
Disposal of total interest in Disposal of total iinterest in
SG Splitska Banka, Seabank, TBC Bank Group Plc Reduction of interest in((1) Reduction of interest in((1)
Euronext, SG Immobel, SG Asia Ltd, SG Asset Finance HK ALD International SA, SG Euro CT, Eleaparts, SG Real Estate
(1) Including capital reductions, dissolution by transfer of assets, mergers and liquidations.

6
SOCIETE GENERALE MANAGEMENT REPORT
4 I 6FF INANCIAL INFORMAT IONN
S O C I E T E G E N E R AL E G R O U P I 2018 REGISTRATION DOCUMENT I 459
The table below summarises the significant changes in Societe Generale’s investment portfolio in 2017:
Increase(1) Decrease(1)
Declaration threshold Companies % of capital
31.12.2017
% of capital
31.12.2017
Declaration threshold
Companies % of capital
31.12.2017
% of capital 31.12.2016
5% 5% TBC Bank Group Plc 0% 5.383%
10% 10% Novespace 0% 11.15%
20% 20% Seabank 0% 20%
33.33% 33.33%
50% 50%
66.66% SGEF(2) 100% 0% 66.66% SG Splitska Banka 0% 100%
SG Thailand 99.88% 0% SG Euro CT(2) 0% 100%
Eléaparts(2) 0% 100%
(1) Threshold crossings by percentage of direct ownership by Societe Generale SA. (2) Stakes held in accordance with article L. 233.6 of the French Commercial Code (Code de commerce).

6 I 4 SOCIETE GENERALE MANAGEMENT REPORT FF I N A N C I A L I N F O R M A T I O NN
460 I 2018 REGISTRATION DOCUMENT I S O C I E T E G E N E R AL E G R O U P
INFORMATION REQUIRED PURSUANT TO ARTICLE L. 511-4-2 OF THE FRENCH MONETARY AND FINANCIAL CODE RELATED TO SOCIETE GENERALE SA As part of its long-standing presence in the commodity markets, Societe Generale proposes agricultural commodity derivatives to meet the various needs of its customers, including the risk management needs of business customers (producers, consumers) and exposure to the commodity markets for investors (asset managers, funds, insurance companies).
Societe Generale’s offer includes soft commodity derivatives (sugar, cocoa, coffee, cotton, orange juice), field crops (corn, wheat, rapeseed, soybean, oats) and other agricultural listed commodities (lean hogs, live cattle, feeder cattle, dairy milk, rough rice). Societe Generale makes markets in vanilla products (e.g. forward contracts), options and option strategies, and structured products with additional complexity. Exposure to agricultural commodities can be provided through a single-commodity product or through multi-commodity products, which are mostly used by investors.
Societe Generale manages risks associated with the related positions either on the OTC market by executing transactions with commodity dealers, commodity traders, banks and brokers, or on organised markets:
NYSE LIFFE (including Euronext Paris) for cocoa, corn, wheat,rapeseed oil, sugar and coffee;
ICE FUTURES US for cocoa, coffee, cotton, orange juice,sugar and wheat;
ICE FUTURES Canada for canola;
CME Group for corn, soybean, soybean oil, soybean meal,wheat, oats, live cattle, lean hogs, feeder cattle, milk and rice;
Minneapolis Grain Exchange for wheat;
SGX for rubber;
TOCOM for rubber.
The list above is not fixed and may evolve in the future.
A number of measures are in place to prevent or detect any material impact on the price of agricultural commodities as a result of Societe Generale activities described above on the derivatives markets:
the trading activity is in particular governed by the regulatoryframework promulgated in Europe under MiFID II, as in forcesince 3rd January. It sets limits for positions on certainagricultural commodities, imposes reporting on positions tothe trading platform, as well as systematic reporting of alltransactions performed to the appropriate regulatory body;
the trading activity is also governed by internal limits set by the risk monitoring teams, which are independent of theoperators;
these teams constantly monitor compliance with these various limits;
moreover, Societe Generale’s trading activity in exchangecontracts follows limits set by the Societe Generale clearingbroker;
to prevent behaviour that could be considered disruptive,Societe Generale traders are provided with trading rules andmandates, and receive regular training on business standardsand market conduct;
daily controls are run in order to detect any inappropriatetrading. These controls include the monitoring of the CFTC(U.S. Commodity Futures Trading Commission) and exchange requirements on position limits;
all of these measures contribute to the supervision of tradingactivity by underlying, product type and maturity, and imposereporting obligations for large positions.
PUBLICATION ON DORMANT ACCOUNTS Articles L. 312-19 and L. 312-20 of the French Monetary and Financial Code, as introduced by French Act No. 2014-617 of 13th June 2014 on dormant bank accounts and unclaimed life insurance accounts, also known as the “Eckert Act”, which entered into effect on 1st January 2016, require all credit institutions to publish information on dormant bank accounts on an annual basis.
Over 2017, 19,384 dormant bank accounts were closed, and the total sums deposited with the Caisse des Dépôts et Consignations amounted to EUR 60,173,658.
At end-December 2017, 373,207 bank accounts were identified as dormant, representing an estimated total of EUR 1,353,368,280.

6
FINANCIAL STATEMENTS
5 I 6FF I N A N C I A L I N F O R M A T I O NN
S O C I E T E G E N E R AL E G R O U P I 2018 REGISTRATION DOCUMENT I 461
5 . F I N A N C I A L S TAT E M E N T S
PARENT COMPANY BALANCE SHEET - ASSETS ASSETS
(In EUR m) 31.12.2017 31.12.2016
Cash, due from central banks and post office accounts 90,424 74,991
Treasury notes and similar securities Note 2.1 127,216 107,886
Due from banks Note 2.3 191,942 197,211
Customer loans (1) Note 2.3 390,312 389,587
Bonds and other debt securities Note 2.1 93,288 86,633
Shares and other equity securities Note 2.1 120,720 97,666
Affiliates and other long-term securities Note 2.1 592 685
Investments in subsidiaries Note 2.1 26,478 27,033
Tangible and intangible fixed assets Note 7.2 2,050 1,918
Treasury stock Note 2.1 281 296
Accruals, other accounts receivable and other assets Note 3.2 139,355 209,647
Total Assetss 1,182,658 1,193,553
(1) The customer loans include the lease financing and similar agreements initially presented on a specific line of the balance sheet in the 2017 registration document. For the purpose of a better comparability, the figures published in the financial statements for 31.12.2016 have been amended accordingly.
OFF-BALANCE SHEET ITEMS
(In EUR m) 31.12.2017 31.12.2016
Loan commitments granted Note 2.3 197,307 170,724
Guarantee commitments granted Note 2.3 187,617 195,433
Commitments made on securities 21,883 21,481

6 I
F I N A N C I A L I N F O R M A T I O N
FINANCIAL STATEMENTS
462 I 2018 REGISTRATION DOCUMENT I S O C I E T E G E N E R AL E G R O U P
LIABILITIES AND SHAREHOLDERS’ EQUITY
(In EUR m) 31.12.2017 31.12.2016
Due to central banks and post office accounts 5,554 5,235
Due to banks Note 2.4 241,786 244,522
Customer deposits Note 2.4 459,690 443,271
Liabilities in the form of securities issued Note 2.4 83,111 75,251
Accruals, other accounts payable and other liabilities Note 3.2 318,493 339,635
Provisions Note 7.3 15,588 23,707
Long-term subordinated debt and notes Note 6.4 23,508 26,056
SShareholders’’ eequity
Common stock Note 6.1 1,010 1,010
Additional paid-in capital Note 6.1 20,444 20,429
Retained earnings Note 6.1 12,674 10,214
Net income Note 6.1 800 4,223
SSub--ttotal Liabilities 334,928 335,876
TTotal Liabilities 11,182,658 11,193,553
OFF-BALANCE SHEET ITEMS
(In EUR m) 31.12.2017 31.12.2016
Loan commitments received Note 2.4 51,377 69,720
Guarantee commitments received Note 2.4 47,127 54,039

6
F I N A N C I A L I N F O R M A T I O N FINANCIAL STATEMENTS
5 I 6FF I N A N C I A L I N F O R M A T I O NN
S O C I E T E G E N E R AL E G R O U P I 2018 REGISTRATION DOCUMENT I 463
INCOME STATEMENT
(In EUR m) 2017 2016
Interest and similar income Note 2.5 14,879 14,926
Interest and similar expense Note 2.5 (15,249) (11,890)
Dividend income Note 2.1 2,105 4,524
Fee income Note 3.1 4,165 4,058
Fee expenses Note 3.1 (1,359) (1,220)
Net income from the trading portfolio Note 2.1 5,955 3,220
Net income from short-term investment securities Note 2.1 404 561
Income from other activities (1) 22,558 22,774
Expenses from other activities (1) (2) (23,519) (22,729)
Net banking income 9,939 14,224
Personnel expenses Note 4.1 (5,307) (5,132)
Other operating expenses (3) (4) (3,855) (3,686)
Depreciation and amortisation (445) (399)
Gross operating income 332 5,007
Cost of risk Note 2.6 (665) (984)
Operating income (333) 4,023
Net income from long-term investments Note 2 1,024 446
Operating income before tax 691 4,469
Income tax Note 5 109 (246)
Net income 800 4,223
Earnings per ordinary share Note 6.3 1.00 5.29
Diluted earnings per ordinary share Note 6.3 1.00 5.29
Information about fees paid to statutory auditors is disclosed in the notes to the consolidated financial statements of the Societe Generale Group; consequently, this information is not provided in the notes to the parent company financial statements of Societe Generale. (1) In the course of its market making activities on commodities derivatives, Societe Generale may hold physical commodities stocks. Related income and
expenses are included in Other banking income and expense for other activities. For the year 2017, income amounts to EUR 22,459 million and expense to EUR 22,368 million.
(2) During 2017, other operating expenses include a EUR 963 million (GBP 813.26 million in original currency) payment related to the transactional agreement concluded between Societe Generale and the Libyan Investment Authority.
(3) The decrease in 2016 of the fine issued to Societe Generale in 2013 by the European Commission in the course of the Euribor case has been recorded as a diminution of Other operating expenses for EUR 218 million.
(4) o.w. EUR 296 million related to the 2017 contribution to the Single Resolution Fund (SRF) (EUR 224 million in 2016).

6 I 6
F I N A N C I A L I N F O R M A T I O N
464 I 2018 REGISTRATION DOCUMENT I S O C I E T E G E N E R AL E G R O U P
6 . N O T E S T O T H E PA R E N T C O M PA N YF I N A N C I A L S TAT E M E N T S
The parent company financial statements were approved by the Board of Directors on 7th February 2018.
NOTE 1- SIGNIFICANT ACCOUNTING PRINCIPLES
Introduction The preparation and presentation of the parent company financial statements for Societe Generale comply with the provisions of Regulation 2014-07 of the French Accounting Standards Board, the ANC, related to the annual accounts for the banking sector.
As the financial statements of foreign branches were prepared using accounting principles generally accepted in their respective countries, they were subsequently adjusted to comply with the accounting principles applicable in France.
The disclosures provided in the notes to the parent company financial statements focus on information that is both relevant and material to the financial statements of Societe Generale, its activities and the circumstances in which it conducted its operations over the period.
Accounting policies and valuation methods In accordance with the accounting principles applicable to French banks, the majority of transactions are recorded using valuation methods that take into account the purpose for which they were made.
In financial intermediation transactions, assets and liabilities are generally carried at historical cost and depreciation is recognised where counterparty risk arises. Revenues and expenses arising from these transactions are recorded over the life of the transaction in accordance with the time period concept. Transactions on forward financial instruments carried out for hedging purposes or to manage the bank’s overall interest rate risk are accounted for using the same principles.
Trading transactions are generally marked to market at year-end, except for loans, borrowings and short-term investment securities which are recorded at nominal value (see below). When financial instruments are not quoted in an active market, the market value used is reduced for reasons of prudence. Moreover, a reserve is recorded to cover valuations established on the basis of in-house models (Reserve Policy), which is determined according to the complexity of the model used and the life of the financial instrument.
Translation of foreign occurrence financial statement The on- and off-balance sheet items of branches reporting in foreign currencies are translated at the official exchange rate prevailing at year-end. Income statement items of these branches are translated at the average month-end exchange rates. Gains and losses arising from the translation of reserves, retained earnings and net income are included in shareholders’ equity under Other accounts payable or Other accounts
receivable. Gains and losses arising from the translation of the capital contribution of foreign branches are also included in changes in shareholders’ equity under the same heading.
Gains and losses arising from the translation of the capital contribution of foreign branches are included under Other accounts payable or Other accounts receivable. Translation differences relating to branches in the Eurozone (since the euro implementation) are retained in shareholders’ equity and are only recognised in the income statement when these entities are sold.
Use of estimates and judgementWhen applying the accounting principles disclosed in the following notes for the purpose of preparing Societe Generale’s parent company financial statements, the Management makes assumptions and estimates that may have an impact on figures recorded in the income statement, on the valuation of assets and liabilities in the balance sheet, and on information disclosed in the notes to the parent company financial statements.
In order to make these assumptions and estimates, the Management uses information available at the date of preparation of the notes to the parent company financial statements and can exercise its judgement. By nature, valuations based on estimates include risks and uncertainties relating to their occurrence in the future. Consequently, actual future results may differ from these estimates and may then have a significant impact on the financial statements.
The use of estimates mainly concerns the following valuations:
fair value in the balance sheet of financial instruments(securities portfolio and forward financial instruments) andholding for trading activities (described in Notes 2.1, 2.2 and 3.2);
the amount of impairment of financial assets (see Note 2.6),tangible and intangible fixed assets (see Note 7.2);
provisions recognised under liabilities including provisionsfor employee benefits and for disputes in a complex legalenvironment (see Notes 2.6, 4.2 and 7.3);
the amount of deferred tax assets recognised in the balance sheet (see Note 5).
The United Kingdom organised on 23rd June 2016 a referendum following which a majority of British citizens voted to leave the European Union (Brexit). After this decision, a long period of negotiations has begun to redefine the economic relationships between the United Kingdom and the European Union. Societe Generale closely follows the progress of the discussions and their consequences in the short, medium and long term. If needed, Societe Generale takes these consequences into account when making assumptions and estimates for preparing its parent company financial statements.

6
F I N A N C I A L I N F O R M A T I O N NOTES TO THE PARENT COMPANY FINANCIAL STATEMENTS
6 I 6FF I N A N C I A L I N F O R M A T I O NN
S O C I E T E G E N E R AL E G R O U P I 2018 REGISTRATION DOCUMENT I 465
NOTE 2 - FINANCIAL INSTRUMENTS
NOTE 2.1 - SECURITIES PORTFOLIO
ACCOUNTING PRINCIPLES
Securities are classified according to:
their type: public notes (Treasury notes and similar securities), bonds and other debt securities (negotiable debt instruments,interbank securities), shares and other equity securities;
the purpose for which they were acquired: trading, short-term and long-term investment, shares intended for portfolio activity,investments in non-consolidated subsidiaries and affiliates, and other long-term equity investments.
Purchases and sales of securities are recorded in the balance sheet at the date of settlement-delivery.
The classification and valuation rules applied for each portfolio category are as follows and the impairment rules applied by the Group are described in Note 2.6.
TRADING SECURITIES
Trading securities are securities acquired or incurred principally for the purpose of selling or repurchasing them in the near-term, or held for the purpose of market-making activities. These securities are traded in active markets, and the available market price reflects frequent buying and selling under normal conditions of competition. Trading securities also include securities linked to a sale commitment in the context of an arbitrage operation done on an organised or assimilated market and securities purchased or sold in the specialised management of a trading portfolio containing forward financial instruments, securities or other financial instruments that are managed together and for which there is evidence of a recent pattern of short-term profit-taking.
Trading securities are recognised in the balance sheet at cost, excluding acquisition expenses.
They are marked to market at the end of the financial period.
Net unrealised gains or losses, together with net gains or losses on disposals, are recognised in the income statement under Net income from the trading portfolio and short-term investment securities. Coupon payments received on fixed-income securities in the trading portfolio are recorded in the income statement under Net interest income from bonds and other debt securities.
Trading securities that are no longer held for the purpose of selling them in the near-term, or no longer held for the purpose of market-making activities, or held in the specialised management of a trading portfolio for which there is no longer evidence of a recent pattern of short-term profit-taking, may be reclassified into the Short-term investment securities category or into the Long-term investment securities category if:
exceptional market situations generate a change of holding strategy; or
if, after their acquisition, debt securities are no longer negotiable in an active market and Societe Generale has the intention and the ability to hold them for the foreseeable future or until maturity.
Securities which are then reclassified are recorded in their new category at their fair market value on the date of reclassification.
LONG-TERM INVESTMENT SECURITIES
Long-term investment securities are acquired debt securities or reclassified short-term investment securities which Societe Generale intends to hold until maturity, where it has the financial capacity to do so and is not subject to any legal or other form of constraint that might call into question its intention to do so. Long-term investment securities also include trading and short-term investment securities which have been reclassified by Societe Generale following the particular conditions described here before (facing exceptional market situations or when debt securities are no longer negotiable in an active market).
These instruments may be designated as hedged items in hedging transactions using forward financial instruments used to hedge the interest rate risk on identifiable items or groups of similar items.
Long-term investments are recorded according to the same principles as short-term investment securities.
SECURITIES, INVESTMENTS IN SUBSIDIARIES, AFFILIATES AND OTHER LONG-TERM SECURITIES
This category of securities covers shares Held in consolidated subsidiaries and Affiliates, when it is deemed useful to Societe Generale’s business to hold the said shares in the long term. This notably covers investments that meet the following criteria:
shares in companies that share Directors or senior managers with Societe Generale and where influence can be exercised over thecompany in which the shares are held;
shares in companies that belong to the same group controlled by individuals or legal entities, where the said persons or entitiesexercise control over the group and ensure that decisions are taken in unison;
shares representing more than 10% of the voting rights in the capital issued by a bank or a company whose business is directlylinked to that of Societe Generale.

6 I 6
F I N A N C I A L I N F O R M A T I O N
466 I 2018 REGISTRATION DOCUMENT I S O C I E T E G E N E R AL E G R O U P
This category also includes Other long-term equity investments. These are equity investments made by Societe Generale with the aim of developing special professional relations with a company over the long term, but without exercising any influence on its management due to the low proportion of attached voting rights.
Investments in consolidated subsidiaries, Affiliates and Other long-term equity investments are recorded at their purchase price net of acquisition costs. Dividend income earned on these securities is recognised in the income statement under Dividend income.
SHORT-TERM INVESTMENT SECURITIES
Short-term investment securities are all those that are not classified as trading securities, long-term investment securities, or investments in consolidated subsidiaries and affiliates.
SShares and other equity securities
Equity securities are carried on the balance sheet at cost excluding acquisition expenses, or at contribution value. At year-end, cost is compared to realisable value. For listed securities, realisable value is defined as the most recent market price. Unrealised capital gains are not recognised in the accounts, but a depreciation of portfolio securities is recorded to cover unrealised capital losses, without the said depreciation being offset against any unrealised capital gains. Income from these securities is recorded in Dividend income.
BBonds and other debt securities
These securities are carried at cost excluding acquisition expenses and, in the case of bonds, excluding interest accrued and not yet due at the date of purchase. The positive or negative difference between cost and redemption value is amortised to income over the life of the relevant securities and using the actuarial method. Accrued interest on bonds and other short-term investment securities is recorded as Related receivables and under Net interest income from bonds and other debt securities in the income statement.
Short-term investment securities may be reclassified into the Long-term investment securities category provided that:
exceptional market situations generate a change of holding strategy, or;
if after their acquisition debt securities are no longer negotiable in an active market and Societe Generale has the intention and theability to hold them for the foreseeable future or until maturity.
1. TREASURY NOTES, BONDS AND OTHER DEBT SECURITIES, SHARES AND OTHER EQUITYSECURITIES
31.12.2017 31.12.2016
(In EUR m)
Treasury notes and
similar securities
Shares and other equity
securities
Bonds and other debt securities Total
Treasury notes and
similar securities
Shares and other equity securities
Bonds and other debt securities Total
TTrading securities 1107,0005 1120,062 448,828 2275,895 882,989 997,226 553,976 2234,191
SShort--tterm iinvestment ssecurities
Gross book value 20,139 600 10,322 31,061 24,831 412 11,536 36,779
Depreciations (76) (18) (60) (154) (66) (22) (44) (132)
Net book value 20,063 582 10,262 30,907 24,765 390 11,492 36,647
LLong--tterm iinvestment ssecurities::
Gross book value(1) 68 - 34,177 34,245 23 21,135 21,158
Depreciations - (7) (7)
Net book value 68 - 34,177 34,245 23 - 21,127 21,150
Related receivables 80 76 21 177 109 50 38 197
TTotal 1127,216 1120,720 993,288 3341,224 1107,886 997,666 886,633 2292,185
(1) Including EUR 8,727 million related to the amount of bonds subscribed within the securitisation stated in Note 2.3 Loans and borrowings.

6
F I N A N C I A L I N F O R M A T I O N NOTES TO THE PARENT COMPANY FINANCIAL STATEMENTS
6 I 6FF I N A N C I A L I N F O R M A T I O NN
S O C I E T E G E N E R AL E G R O U P I 2018 REGISTRATION DOCUMENT I 467
ADDITIONAL INFORMATION ON SECURITIES
(In EUR m) 31.12.2017 31.12.2016 Estimated market value of short-term investment securities:
Unrealised capital gains(1) 677 1,047
Estimated value of long-term investment securities: - -
Premiums and discounts relating to short-term and long-term investment securities 135 134
Investments in mutual funds:
- French mutual funds 2,163 2,521
- Foreign mutual funds 8,660 5,093
o.w. mutual funds which reinvest all their income 52 51
Listed securities(2) 298,034 251,318
Subordinated securities 113 -
Securities lent 45,923 42,384
(1) Not including unrealised gains or losses on forward financial instruments, if any, used to hedge short-term investment securities. (2) The listed trading securities amounted to EUR 232,955 million at 31st December 2017 against EUR 193,571 million at 31st December 2016.
2. SECURITIES, INVESTMENTS IN SUBSIDIARIES, AFFILIATES AND OTHER LONG-TERM SECURITIES
AFFILIATES AND OTHER LONG-TERM SECURITIES
(In EUR m) 31.12.2017 31.12.2016
Banks(1) 371 445
Others(2) 265 341
Gross book value 636 786
Depreciations(3) (44) (101)
Net book value 592 685
(1) The main changes involve:
– the full disposal of Seabank: EUR -92 million;
– the capital increase of SG Congo: EUR + 9 million;
– the capital increase of SG Mozambique: EUR +9 million.
(2) The main changes involve:
– the full disposal of TBC Bank Group PLC: EUR -41 million;
– the partial disposal of Euronext: EUR -20 million.
(3) The main changes involve:
– the depreciation of SG Congo: EUR -7 million;
– the depreciation of SG Mozambique: EUR -10 million;
– the recovery following the full disposal of Seabank: EUR +75 million.

6 I 6
F I N A N C I A L I N F O R M A T I O N
468 I 2018 REGISTRATION DOCUMENT I S O C I E T E G E N E R AL E G R O U P
INVESTMENTS IN SUBSIDIARIES
(In EUR m) 31.12.2017 331.12.2016 BBanks 228,539 330,089
Listed 5,618 5,635
Unlisted 22,921 24,454
OOthers 55,423 55,090
Listed 1,156 -
Unlisted 4,267 5,090
GGross book value((1) 333,962 335,179
Depreciation(2) (7,484) (8,146)
NNet book value 226,478 227,033
All transactions with the related parties were concluded under normal market conditions. (1) The main changes involve:
– the acquisition of SGEF shares for EUR +4 million and the subscription of the capital increase for EUR 750 million;
– the full disposal of SG Splitska Banka: EUR -1,059 million;
– the partial disposal of ALD International (EUR -179 million) and its switch from "unlisted" to "listed” category as a consequence of its IPO (EUR + 1,156 million).
– the capital decrease of SG Immobel: EUR -350 million;
– the capital decrease of SG Asia Ltd: EUR -28 million;
– the capital decrease of SG Real Estate: EUR -20 million;
– the capital reduction of SG Asset Finance HK for EUR -133 million;
– the full disposal of Eléaparts for EUR -38 million;
(2) The main changes in the depreciation are as follows:
– the depreciation of Inter Europe Conseil: EUR -121 million;
– the depreciation of SG SNP: EUR -48 million;
– the depreciation of SG Americas: EUR -55 million;
– the recovery following the disposal of SG Splitska Banka: EUR +591 million;
– the SG Securities Japan recovery: EUR +74 million;
– the Rosbank recovery: EUR +236 million.

6
F I N A N C I A L I N F O R M A T I O N NOTES TO THE PARENT COMPANY FINANCIAL STATEMENTS
6 I 6FF I N A N C I A L I N F O R M A T I O NN
S O C I E T E G E N E R AL E G R O U P I 2018 REGISTRATION DOCUMENT I 469
3. TREASURY SHARES
ACCOUNTING PRINCIPLES
Societe Generale shares acquired for allocation to employees are recorded as Short-term investment securities – Treasury shares on the assets side of the balance sheet.
Societe Generale shares held with a view to underpinning the share price or as part of arbitrage transactions on the CAC 40 index are recorded under Trading securities.
31.12.2017 31.12.2016
(In EUR m) Quantity Book
value(2) Market value
Quantity Book value
Market value
Trading securities(1) 232,399 11 11 - - -
Short-term investment securities 6,850,304 270 295 8,251,751 296 386
Long-term equity investments - - - - - -
Total 7,0082,703 281 306 8,251,751 296 386
Nominal value: EUR 1.25. Market value per share: EUR 43.05 at 31st December 2017. (1) Societe Generale set up on 22nd August 2011 a liquidity contract which was endowed with EUR 170 million for carrying out transactions on the Societe
Generale share. At 31st December 2017, no Societe Generale shares were held under the liquidity contract, which contained EUR 52 million for the purpose of carrying out transactions in Societe Generale shares.
(2) The accounting value is assessed according to the notice of the CNC N 2008-17 approved on 6th November 2008 concerning stock-options and bonus issues of shares.
4. DIVIDEND INCOME
(In EUR m) 31.12.2017 31.12.2016
Dividends from shares and other equity securities 37 11
Dividends from investments in non-consolidated subsidiaries and affiliates and other long-term securities 2,068 4,513
Total((1) 2,105 4,524
(1) Dividends received from investments in the trading portfolio have been classified under Net income from the trading portfolio and short-term investment securities.
5. NET INCOME FROM THE TRADING PORTFOLIO AND SHORT-TERM INVESTMENT SECURITIES
(In EUR m) 2017 2016
Net income from the trading portfolio::
Net income from operations on trading securities 11,629 (2,674)
Net income from forward financial instruments (6,224) 4,910
Net income from foreign exchange transactions 550 984
Sub--total 5,955 3,220
Net income from short--term investment securities::
Gains on sale 485 581
Losses on sale (52) (74)
Allocation of depreciations (58) (192)
Reversal of depreciations 29 246
Sub--total 404 561
Net total 6,359 3,781

6 I 6
F I N A N C I A L I N F O R M A T I O N
470 I 2018 REGISTRATION DOCUMENT I S O C I E T E G E N E R AL E G R O U P
6. NET INCOME FROM LONG-TERM INVESTMENTS
ACCOUNTING PRINCIPLES
This item covers capital gains or losses realised on disposals, as well as the net allocation to depreciation for investments in consolidated subsidiaries and affiliates, long-term investment securities and offices and other premises.
(In EUR m) 2017 2016
LLong--tterm investment securities::
Net capital gains (or losses) on sale - -
Net allocations to depreciation 7 5
SSub--ttotal 77 55
Investments in subsidiaries and affiliates:
Gains on sale(1) 1,000 579
Losses on sale(2) (711) (225)
Allocations to depreciation(3) (340) (641)
Reversals of depreciation(3) 1,060 688
Subsidies granted to affiliates (subsidiaries)
SSub--ttotal 11,009 4401
NNet income from long--tterm investmentss ((see Note 7.2) 88 440
NNet Total 11,024 4446
(1) o.w. EUR +960 million concerning the partial sale of ALD International SA and EUR +27 million from the sale of Euronext. (2) o.w. EUR -642 million concerning the full sale of SG Splitska Banka and EUR -68 million concerning the full sale of Seabank. (3) o.w. EUR -324 million of allocations and EUR +986 million of reversals at 31st December 2017 for subsidiaries (Cf. Note 2.1 - Investments in subsidiaries).

6
F I N A N C I A L I N F O R M A T I O N NOTES TO THE PARENT COMPANY FINANCIAL STATEMENTS
6 I 6 FF I N A N C I A L I N F O R M A T I O NN
S O C I E T E G E N E R AL E G R O U P I 2018 REGISTRATION DOCUMENT I 471
NOTE 2.2 - OPERATIONS ON FORWARD FINANCIAL INSTRUMENTS
ACCOUNTING PRINCIPLES
Operations on Forward financial instruments relating to interest rates, foreign exchange or equities are used for trading or hedging purposes.
Nominal commitments on forward financial instruments are recorded as a separate off-balance sheet item. This amount represents the volume of outstanding transactions and does not represent the potential gain or loss associated with the market or counterparty risk on these transactions. Credit derivatives purchased to hedge credit risks on financial assets which are not valued at market value are classified and treated as guarantee commitments received.
The accounting treatment of income or expenses on these forward financial instruments depends on the purpose for which the transaction was concluded, as follows:
HEDGING TRANSACTIONS
Income and expenses on forward financial instruments used as a hedge and assigned from the beginning to an identifiable item or group of similar items, are recognised in the income statement in the same manner as income and expenses on the hedged items. Income and expenses on interest rate instruments are recorded as net interest income in the same interest income or expense account as the items hedged. Income and expenses on other instruments such as equity instruments, stock market indexes or currencies are recognised as Net income from the trading portfolio and short-term investment securities, under Net income from forward financial instruments.
Income and expenses on forward financial instruments used to hedge or manage an overall interest rate risk are recognised in the income statement over the life of the instrument under Net income from the trading portfolio and short-term investment securities, in the caption Net income from forward financial instruments.
TRADING TRANSACTIONS
Trading transactions include instruments traded on organised or similar markets and other instruments, such as credit derivatives and composite option products, which are included in the trading portfolio although they are traded over-the-counter on less liquid markets, together with debt securities with a forward financial instrument component for which this classification in the accounts most appropriately reflects the results and associated risks. These transactions are measured at their market value at the balance sheet date. When financial instruments are not quoted in an active market, this value is generally determined on the basis of in-house models. Where necessary, these valuations are adjusted for reasons of prudence by applying a discount (Reserve Policy). This discount is determined on the basis of the instruments concerned and the associated risks, and takes into account:
a conservative valuation of all the instruments, regardless of the liquidity of the corresponding market;
a reserve calculated according to the size of the position and intended to cover the risk that Societe Generale will be unable to liquidate the investment in one go due to the size of the holding;
an adjustment for the reduced liquidity of instruments and modelling risks in the case of complex products as well as transactions on less liquid markets (less liquid since they have been developed recently or are more specialised).
Furthermore, for over-the-counter transactions on forward interest rate instruments, the market value takes into account counterparty risks and the discounted value of future management costs.
The corresponding gains or losses are directly recognised as income for the period, regardless of whether they are realised or unrealised. They are recognised in the income statement as Net income from the trading portfolio and short-term investment securities.
Gains or losses corresponding to contracts concluded within the scope of cash management activities managed by the trading room, in order to benefit from any interest rate fluctuations, are recorded when liquidated or over the life of the contract, depending on the type of instrument. Unrealised losses are provisioned at year-end and the corresponding amount is recorded under Net income from the trading portfolio and short-term investment securities.

6 I 6
F I N A N C I A L I N F O R M A T I O N
472 I 2018 REGISTRATION DOCUMENT I S O C I E T E G E N E R AL E G R O U P
1. FORWARD FINANCIAL INSTRUMENTS COMMITMENTS
Total
(In EUR m)
Fair Value Trading
transactions
Hedging transactions
31.12.2017 31.12.2016
OOutright ttransactions
TTransactions on organiiseed markets
Interest rate futures 552,460 - 552,460 556,987
Foreign exchange futures 138,306 - 138,306 126,091
Other futures contracts 561,774 160 561,934 701,638
OOTC agreements
Interest rate swaps 8,512,474 13,720 8,526,194 8,229,908
Currency financing swaps 804,717 548 805,265 877,798
Forward Rate Agreements (FRA) 1,491,975 - 1,491,975 1,070,387
Other 38,313 - 38,313 31,034
OOptional transactions
Interest rate options 2,038,182 - 2,038,182 2,425,201
Foreign exchange options 359,238 - 359,238 410,151
Options on stock exchange indexes and equities 1,000,006 - 1,000,006 2,135,723
Other options 66,230 - 66,230 92,559
TTotal 115,563,675 114,428 115,578,103 116,657,477
2. FAIR VALUE OF THE TRANSACTIONS QUALIFIED AS HEDGING
(In EUR m) 331.12.2017 OOutright ttransactions
TTransactions on organiiseed markets
- Interest rate futures -
- Foreign exchange futures (19)
- Other forward contracts 7
OOTC agreements
- Interest rate swaps 5,068
- Currency financing swaps 104
- Forward Rate Agreements (FRA) -
- Other -
OOptional transactions
- Interest rate options (6)
- Foreign exchange options -
- Options on stock exchange indexes and equities -
- Other options -
TTotal 5,154
3. MATURITIES OF FINANCIAL DERIVATIVES (NOTIONAL AMOUNTS)
(In EUR m) Less than3 months 3 months to one
year 1 to 5 years More than 5 years 31.12.2017
OOutright ttransactions
Transactions on organised markets 387,394 318,458 288,103 258,745 1,252,700
OTC agreements 1,449,106 2,635,783 3,472,537 3,304,321 10,861,747
OOptional transactions 11,053,516 6632,054 11,019,495 7758,591 33,463,656
TTotal 22,890,016 33,586,295 44,780,135 44,321,657 115,578,103

6
F I N A N C I A L I N F O R M A T I O N NOTES TO THE PARENT COMPANY FINANCIAL STATEMENTS
6 I 6 FF I N A N C I A L I N F O R M A T I O NN
S O C I E T E G E N E R AL E G R O U P I 2018 REGISTRATION DOCUMENT I 473
NOTE 2.3 - LOANS AND BORROWINGS
ACCOUNTING PRINCIPLES
Amounts due from banks and customer loans are classified according to their initial duration and type: demand deposits (current accounts and overnight transactions) and term deposits in the case of banks, and commercial loans, overdrafts and other loans to customers. They also include securities purchased from banks and customers under resale agreements, and loans secured by notes and securities.
Only amounts due and customer loans which meet the following criteria are offset on the balance sheet: those with the same counterparty, maturity, currency and accounting entity, and those for which an agreement exists with the counterparty allowing the company to combine the accounts and exercise the right of offset.
Interest accrued on these receivables is recorded as Related receivables and recognised in the income statement under Interest income and expenses.
Fees received and incremental transaction costs related to the granting of a loan are comparable to interest and spread over the effective life of the loan.
Guarantees and endorsements recorded off-balance sheet represent transactions which have not yet given rise to cash movements, such as irrevocable commitments for the undrawn portion of facilities made available to banks and customers or guarantees given on their behalf.
If a commitment carries an incurred credit risk which makes it probable that Societe Generale will not recover all or part of the amounts due under the counterparty’s commitment in accordance with the original terms of the contract, despite the existence of a guarantee, the corresponding outstanding loan is classified as a doubtful loan. Moreover, any loan will be classified as doubtful if one or more repayments are more than three months overdue (six months for mortgage loans and nine months for loans to local authorities), or, regardless of whether any payments have been missed, if it can be assumed that there is an identified risk, or if legal proceedings have been started.
If a loan to a given borrower is classified as doubtful, all outstanding loans or commitments to that borrower are reclassified as doubtful, regardless of whether or not they are backed by a guarantee.
Depreciation for unrealised losses and for doubtful loans is recorded in the amount of the probable loss (see Note 2.6)
RESTRUCTURING OF LOANS AND RECEIVABLES
When an asset recorded under Loans and receivables is restructured, contractual changes are made to the amount, term or financial conditions of the initial transaction approved by the Group, due to the financial difficulties or insolvency of the borrower (whether insolvency has already occurred or will definitely occur unless the debt is restructured), and these changes would not have been considered in other circumstances. Restructured financial assets are classified as impaired and the borrowers are considered to be in default.
These classifications are maintained for at least one year and for as long as any uncertainty remains for the Group as to whether or not the borrowers can meet their commitments. At the restructuring date, the carrying amount of the restructured financial asset is decreased to the present amount of the estimated new future recoverable cash flows discounted using the initial effective interest rate. This loss is booked to profit or loss under Cost of risk. Restructured financial assets do not include loans and receivables subject to commercial renegotiations and involving customers whose debt the Group has agreed to renegotiate in the interest of maintaining or developing a commercial relationship, in accordance with the credit approval procedures in force and without relinquishing any principal or accrued interest. Loans and receivables may be subject to commercial renegotiations provided that the borrowing customer is not experiencing financial difficulties and is not insolvent. Such transactions involve customers whose debt the Group is willing to renegotiate in the interest of maintaining or developing a commercial relationship, in accordance with the credit approval procedures in force, and without relinquishing any principal or accrued interest. Renegotiated loans and receivables are derecognised at the renegotiation date and replaced with the new loans, taken out under renegotiated conditions, which are recorded on the balance sheet at the same date. These new loans are subsequently measured at amortised cost, based on the effective interest rate arising from the new contractual conditions and taking into account the renegotiation fees billed to the customer.
TRANSACTIONS WITH SOCIETE GENERALE INTERNATIONAL LIMITED: CHANGE OF PRESENTATION In 2016, the transactions with Societe Generale International Limited were recorded in the notes related to the transactions with Banks. In 2017, these transactions are now recorded in Customer loans.

6 I 6
F I N A N C I A L I N F O R M A T I O N
474 I 2018 REGISTRATION DOCUMENT I S O C I E T E G E N E R AL E G R O U P
1. DUE FROM BANKS
(In EUR m) 31.12.2017 31.12.2016
Deposits and loans
DDemand
Current accounts 13,176 13,293
Overnight deposits and loans 500 134
Loans secured by notes-overnight - -
TTerm
Term deposits and loans(1) 99,465 88,596
Subordinated and participating loans(2) 4,104 4,765
Loans secured by notes and securities - -
Related receivables 254 198
GGross amount 1117,499 1106,986
Depreciations (24) (34)
NNet amount 1117,475 1106,952
Securities purchased under resale agreements(3) 74,467 90,259
TTotal((4) (5) 1191,942 1197,211
(1) o.w. EUR 511 million transactions with Societe Generale International Limited in 2016. (2) o.w. EUR 372 million transactions with Societe Generale International Limited in 2016. (3) o.w. EUR 6,594 million transactions with Societe Generale International Limited in 2016. (4) At 31st December 2017 doubtful loans amounted to EUR 94 million (of which EUR 17 million were non-performing loans) against EUR 96 million (of which
EUR 33 million were non-performing loans at 31st December 2016). (5) Including amounts receivable from subsidiaries: EUR 94,433 million at 31st December 2017 against EUR 91,306 million at 31st December 2016.
2. CUSTOMER LOANS
(In EUR m) 31.12.2017 31.12.2016
Discount of trade notes 1,814 1,933
Other loans:
Short-term loans 60,816 63,451
Export loans 9,493 10,843
Equipment loans 40,705 38,886
Mortgage loans(1) 60,622 68,848
Other loans 76,236 68,402
SSub--ttotal((2) (3) (4) 2247,872 2250,430
Overdrafts 15,986 14,973
Related receivables 996 973
GGross amount 2266,668 2268,309
Depreciations (3,287) (3,893)
NNet amount 2263,381 2264,416
Loans secured by notes and securities 89 139
Securities purchased under resale agreements 126,842 125,032
TTotal((5)(6) 3390,312 3389,587
(1) The fluctuation is related to the securitisation stated in the below section 4. Securitisation. (2) Including pledged loan: EUR 58,689 million of which amounts eligible for refinancing with Bank of France: EUR 9,006 million at 31st December 2017 (EUR
13,579 million at 31st December 2016). (3) o.w. participating loans: EUR 2,605 million at 31st December 2017 (EUR 2,390 million at 31st December 2016). (4) At 31st December 2017 doubtful loans amounted to EUR 7,839 million (of which EUR 4,494 million were non-performing loans) against EUR 8,654 million
(of which EUR 5,155 million were non-performing loans) at 31st December 2016. (5) o.w. amounts receivable from subsidiaries: EUR 104,837 million at 31st December 2017 (EUR 99,314 million at 31st December 2016). (6) Including restructured loans: EUR 2,865 million at 31st December 2017 against EUR 3,022 million at 31st December 2016.

6
F I N A N C I A L I N F O R M A T I O N NOTES TO THE PARENT COMPANY FINANCIAL STATEMENTS
6 I 6FF I N A N C I A L I N F O R M A T I O NN
S O C I E T E G E N E R AL E G R O U P I 2018 REGISTRATION DOCUMENT I 475
3. COMMITMENTS GRANTED
(In EUR m) 31.12.2017 31.12.2016
Commitments ggranted(1)
Loan commitments
- To banks(2) 23,487 24,635
- To customers(2) 173,820 146,089
Total 197,307 170,724
Guarantee commitments
- On behalf of banks 116,941 128,036
- On behalf of customers 70,676 67,397
Total 187,617 195,433
(1) o.w. commitments granted to subsidiaries: EUR 70,171 million at 31st December 2017 (EUR 52,745 million at 31st December 2016). (2) o.w. EUR 4,925 million transactions with Societe Generale International Limited in 2016.
4. SECURITISATION
ACCOUNTING PRINCIPLES
Loans and receivables transferred by Societe Generale to a securitisation undertaking (securitisation fund, securitisation vehicle or equivalent foreign undertaking) are derecognised and the gain or loss on sale calculated as the difference between the selling price and the carrying amount of transferred loans or receivables is recognised in profit or loss.
If the transfer agreement contains an overcollateralisation clause, Societe Generale records on the assets side of its balance sheet, among the loans and receivables, a receivable for the part of the amount of transferred loans and receivables exceeding the sale price.
Ordinary units issued by a gaining securitisation undertaking and acquired or subscribed by Societe Generale are recorded as trading securities or as short-term investment securities according to their purpose.
Specific units, subordinated units and other financial instruments issued by the gaining securitisation undertaking and acquired or subscribed by Societe Generale as collateral at the benefit of the undertaking are recorded as short-term investment securities (see Note 2.1).
If Societe Generale lodges a cash security deposit with the gaining securitisation undertaking to bear the losses resulting from the failure of debtors of loans and receivables transferred, it records such deposit on the assets side of its balance sheet in the section Accruals, other accounts receivable and other assets as a receivable from securitisation undertaking, provided that the possible balance of the deposit will be attributed to it in the course of liquidation of the securitisation undertaking.
If the guarantee granted by Societe Generale takes the form of a commitment granted, it is recorded in the off-balance sheet as a guarantee commitment granted to customers or to banks, as the case may be.
During this accounting period, Societe Generale proceeded to a securitisation in order to substitute, in the assets, eligible bonds as the eurosystem refinancing guaranty for mortgage loans. For this purpose, Societe Generale has transferred EUR 9,242 million in mortgage loans to a securitisation mutual fund. To capitalise the acquisition, the fund has issued bonds which were fully subscribed by Societe Generale, which bears the risks and the profits.
The bonds are presented in the assets on the balance sheet as at 31st December 2017 within the investment portfolio for an amount of EUR 8,727 million.

6 I 6
F I N A N C I A L I N F O R M A T I O N
476 I 2018 REGISTRATION DOCUMENT I S O C I E T E G E N E R AL E G R O U P
NOTE 2.4 - DEBTS
ACCOUNTING PRINCIPLES
Amounts due to banks and customer deposits are classified according to their initial duration and type: demand (demand deposits and current accounts) and time deposits and borrowings in the case of banks, and regulated savings accounts and other deposits in the case of customers. They also include securities sold to banks and customers under repurchase agreements.
Interest accrued on these deposits is recorded as Related payables and as an expense in the income statement.
1. DUE TO BANKS
(In EUR m) 31.12.2017 31.12.2016
Demand deposits
Demand deposits and current accounts(1) 13,858 13,700
Borrowings secured by notes - overnight -
SSub--ttotal 113,858 113,700
Term deposits
Term deposits and borrowings(2) 158,040 140,869
Borrowings secured by notes and securities -
SSub--ttotal 1158,040 1140,869
Related payables 529 473
TTotal deposits 1172,427 1155,042
Securities sold under repurchase agreements(3) 69,359 89,480
TTotal((44)) 2241,786 2244,522
(1) Including EUR 885 million with Societe Generale International Limited in 2016 (see note 2.3). (2) Including EUR 1,688 million with Societe Generale International Limited in 2016. (3) Including EUR 12,563 million with Societe Generale International Limited in 2016. (4) Including amounts due to subsidiaries: EUR 77,314 million at 31st December 2017 (EUR 79,158 million at 31st December 2016).

6
F I N A N C I A L I N F O R M A T I O N NOTES TO THE PARENT COMPANY FINANCIAL STATEMENTS
6 I 6 FF I N A N C I A L I N F O R M A T I O NN
S O C I E T E G E N E R AL E G R O U P I 2018 REGISTRATION DOCUMENT I 477
2. CUSTOMER DEPOSITS
(In EUR m) 31.12.2017 31.12.2016
Regulated savings accounts
Demand 42,093 39,308
Term 18,086 18,139
Sub--total 60,179 57,447
Other demand deposits
Businesses and sole proprietors 49,458 46,368
Individual customers 31,206 28,482
Financial customers 24,686 24,925
Others 5,445 7,154
Sub--total 110,795 106,929
Other term deposits
Businesses and sole proprietors 53,731 58,036
Individual customers 352 484
Financial customers 107,264 116,298
Others 6,850 12,868
Sub--total 168,197 187,686
Related payables 548 499
Total customer deposits 339,719 352,561
Securities sold to customers under repurchase agreements 119,971 90,710
Total((1) 459,690 443,271
(1) Including deposits of subsidiaries: EUR 132,447 million at 31st December 2017 (EUR 120,634 million at 31st December 2016).
3. DEBT SECURITIES ISSUED
ACCOUNTING PRINCIPLES
These liabilities are classified by type of security: loan notes, interbank market certificates, negotiable debt instruments, bonds and other debt securities, but exclude subordinated notes which are classified under subordinated debt.
Interest accrued is recorded as Related payables and as an expense in the income statement. Bond issuance and redemption premiums are amortised using the straight-line or actuarial method over the life of the related borrowings. The resulting expense is recorded in the income statement under Net income from bonds and other debt securities.
Bond issuance costs accrued over the period are recorded as expenses for the period, under Net income from bonds and other debt securities in the income statement.
(In EUR m) 31.12.2017 31.12.2016
Term savings certificates - - Bond borrowings 1,668 -
Related payables 19 22
Sub--total 1,687 22
Interbank certificates and negotiable debt instruments 80,900 74,689
Related payables 525 540
Total((1) 83,111 75,251
(1) Including commissions related to subsidiaries: EUR 2,144 million at 31st December 2017.

6 I 6
F I N A N C I A L I N F O R M A T I O N
478 I 2018 REGISTRATION DOCUMENT I S O C I E T E G E N E R AL E G R O U P
4. COMMITMENTS RECEIVED
(In EUR m) 31.12.2017 31.12.2016
CCommitments received((1)
Loan commitments received from banks(2) 51,377 69,720
Guarantee commitments received from banks 47,127 54,039
TTotal 998,504 1123,759
(1) Including commitments received from subsidiaries: EUR 11,871 million at 31st December 2017 (EUR 11,623 million at 31st December 2016). (2) Including transactions in the amount of EUR 8,596 million with Societe Generale International Limited (see Note 2.3).
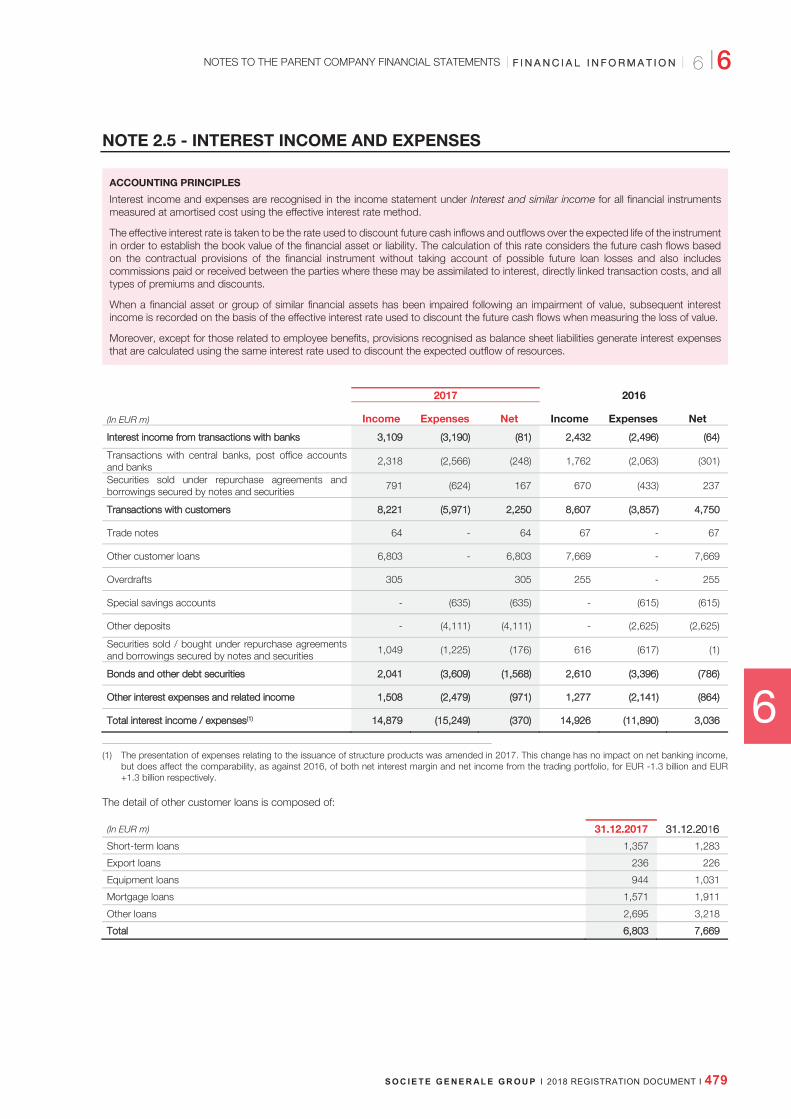
6
F I N A N C I A L I N F O R M A T I O N NOTES TO THE PARENT COMPANY FINANCIAL STATEMENTS
6 I 6 FF I N A N C I A L I N F O R M A T I O NN
S O C I E T E G E N E R AL E G R O U P I 2018 REGISTRATION DOCUMENT I 479
NOTE 2.5 - INTEREST INCOME AND EXPENSES
ACCOUNTING PRINCIPLES
Interest income and expenses are recognised in the income statement under Interest and similar income for all financial instruments measured at amortised cost using the effective interest rate method.
The effective interest rate is taken to be the rate used to discount future cash inflows and outflows over the expected life of the instrument in order to establish the book value of the financial asset or liability. The calculation of this rate considers the future cash flows based on the contractual provisions of the financial instrument without taking account of possible future loan losses and also includes commissions paid or received between the parties where these may be assimilated to interest, directly linked transaction costs, and all types of premiums and discounts.
When a financial asset or group of similar financial assets has been impaired following an impairment of value, subsequent interest income is recorded on the basis of the effective interest rate used to discount the future cash flows when measuring the loss of value.
Moreover, except for those related to employee benefits, provisions recognised as balance sheet liabilities generate interest expenses that are calculated using the same interest rate used to discount the expected outflow of resources.
2017 2016
(In EUR m) Income Expenses Net Income Expenses Net
Interest income from transactions with banks 3,109 (3,190) (81) 2,432 (2,496) (64)
Transactions with central banks, post office accounts and banks
2,318 (2,566) (248) 1,762 (2,063) (301)
Securities sold under repurchase agreements and borrowings secured by notes and securities
791 (624) 167 670 (433) 237
Transactions with customers 8,221 (5,971) 2,250 8,607 (3,857) 4,750
Trade notes 64 - 64 67 - 67
Other customer loans 6,803 - 6,803 7,669 - 7,669
Overdrafts 305 305 255 - 255
Special savings accounts - (635) (635) - (615) (615)
Other deposits - (4,111) (4,111) - (2,625) (2,625)
Securities sold / bought under repurchase agreements and borrowings secured by notes and securities
1,049 (1,225) (176) 616 (617) (1)
Bonds and other debt securities 2,041 (3,609) (1,568) 2,610 (3,396) (786)
Other interest expenses and related income 1,508 (2,479) (971) 1,277 (2,141) (864)
Total interest income / expenses((1) 14,879 (15,249) (370) 14,926 (11,890) 3,036
(1) The presentation of expenses relating to the issuance of structure products was amended in 2017. This change has no impact on net banking income, but does affect the comparability, as against 2016, of both net interest margin and net income from the trading portfolio, for EUR -1.3 billion and EUR +1.3 billion respectively.
The detail of other customer loans is composed of:
(In EUR m) 31.12.2017 31.12.20166 Short-term loans 1,357 1,283
Export loans 236 226
Equipment loans 944 1,031
Mortgage loans 1,571 1,911
Other loans 2,695 3,218
Total 6,803 7,669

6 I 6
F I N A N C I A L I N F O R M A T I O N
480 I 2018 REGISTRATION DOCUMENT I S O C I E T E G E N E R AL E G R O U P
NOTE 2.6 - DEPRECIATIONS AND PROVISIONS
1. DEPRECIATIONS
AACCOUNTING PRINCIPLES
Depreciations include asset depreciations and depreciations on securities.
AASSET DDEPRECIATIONS
Depreciation for unrealised losses is equal to the difference between the carrying amount of the asset and the present value of estimated future recoverable cash flows, taking into account any guarantees, discounted at the financial assets’ original effective interest rate. Furthermore, this depreciation may not be less than the full amount of the accrued interest on the doubtful loan. Depreciation, reversals of depreciation, losses on bad debts and recovery of impaired debts are recognised under Cost of risk, along with write-backs of depreciation linked to the passage of time.
In a homogeneous portfolio, as soon as a credit risk is incurred on a group of financial instruments, a depreciation is recognised without waiting for the risk to individually affect one or more receivables. The amount of depreciation is notably determined on the basis of historical data on default rates and incurred losses on assets with credit risk characteristics that are similar to those in the portfolio, adjusted to reflect any relevant current economic conditions and, where necessary, the opinion of an expert. Changes in depreciation calculated as such are recognised under Cost of risk.
Doubtful loans can be reclassified as performing loans when the credit risk has been definitively eliminated and regular repayments have resumed according to the original terms of the contract. Similarly, doubtful loans which have been restructured can be reclassified as performing loans. When a loan is restructured, a discount is applied to any differences between the cash flows expected to be received under the initial terms of the contract and the present value of the future flows of capital and interest expected to be received under the new terms, discounted at the original effective interest rate.
The amount deducted is recognised under Cost of risk. If the restructured loan is subsequently reclassified as a performing loan, it is reincorporated into net interest income over the remaining term of the loan.
When a borrower’s solvency is such that after the loan has been classified as doubtful for a reasonable period, it is not foreseeable that it will be reclassified as a performing loan, the loan is identified as a non-performing loan. A loan is classified as non-performing once the bank asks for an early termination, when the contract is terminated and in any case one year after it was classified as doubtful, except where the original terms of the contract have been respected or where the loan is covered by guarantees which ensure its recovery. Loans which have been restructured and for which the borrower has not respected the new conditions are also classified as non-performing.
DEPRECIATIONS ON SECURITIES
SShort--tterm investment securities
Shares and other equity securities
At year-end, cost is compared to realisable value. For listed securities, realisable value is defined as the most recent market price. Unrealised capital gains are not recognised in the accounts, but a depreciation of portfolio securities is recorded to cover unrealised capital losses, without the said depreciation being offset against any unrealised capital gains.
Bonds and other debt securities
At year-end, cost is compared to realisable value or, in the case of listed securities, to their most recent market price. Unrealised capital gains are not recognised in the accounts, but a depreciation of portfolio securities is recorded to cover unrealised capital losses, after consideration of any gains made on any related hedging transactions.
Allocations to and reversals of depreciation for losses on short-term investment securities together with gains and losses on sales of these securities are recorded under Net income from the trading portfolio and short-term investment securities in the income statement.
LLong--tterm investment securities
Long-term investments are recorded according to the same principles as short-term investment securities, except that no depreciation is made for unrealised losses, unless there is a strong probability that the securities will be sold in the short term, or unless there is a risk that the issuer will be unable to redeem them.
Allocations to and reversals of depreciation for losses on long-term investment securities, together with gains and losses on sales of these securities, are recorded in the income statement under Net income from long-term investments.
AAffiliates and investment in subsidiaries
At year-end, investments in consolidated subsidiaries and affiliates are valued at their value in use, namely the price the company would accept to pay to obtain the said securities if it had to acquire them in view of its investment objective. This value is estimated on the basis of various criteria, such as shareholders’ equity, profitability, and the average share price over the last three months. Unrealised capital gains are not recognised in the accounts, but a depreciation on portfolio securities is recorded to cover unrealised capital losses.
Allocations to and reversals of depreciation as well as any capital gains or losses realised on the disposal of these securities, including any profit or loss generated when tendering these securities to public share exchange offers, are recognised under Net income from long-term investments.

6
F I N A N C I A L I N F O R M A T I O N NOTES TO THE PARENT COMPANY FINANCIAL STATEMENTS
6 I 6 FF I N A N C I A L I N F O R M A T I O NN
S O C I E T E G E N E R AL E G R O U P I 2018 REGISTRATION DOCUMENT I 481
(In EUR m) 31.12.2017 31.12.2016
Asset depreciations:: Banks 24 34
Customer loans 3,287 3,893
Other assets 82 81
Sub--total ((1) 3,393 4,008
Depreciation on securities (2) 7,682 8,386
Total depreciations 11,075 12,394
(1) o.w. depreciation for non-performing loans: EUR 2,538 million. (2) Except Treasury stock.
The change in depreciations (excluding securities) breaks down as follows:
Net allowances
(In EUR m)
Amount at 31.12.2016
Net cost
of risk
Other income
statement Used
provisions
Change in scope and
reclassifying Amount at 31.12.2017
Asset depreciations 4,008 214 (17) (779) (33) 3,393
2. PROVISIONS
ACCOUNTING PRINCIPLES
Provisions include:
provisions for commitments;
provisions for contingencies and disputes.
A description of contingencies and disputes is provided in the Risk Management report.
Provisions for contingencies and disputes are defined as liabilities with no precisely defined amount or due date.
They are only recorded if the company has an obligation to a third party that will probably or necessarily lead to a transfer of funds to the third party, without compensation for at least an equivalent amount being expected from this third party.
Information on the nature and the amount of the risks is not disclosed when the Group estimates that such disclosure could seriously prejudice its position in a dispute with other parties on the subject matter of the provision.
Net allocations to provisions are classified by type of risk in the corresponding accounts in the income statement.

6 I 6
F I N A N C I A L I N F O R M A T I O N
482 I 2018 REGISTRATION DOCUMENT I S O C I E T E G E N E R AL E G R O U P
(In EUR m) Amount at 31.12.2016
Net allowances
Used provisions
Change in scope and
reclassifying Amount at 31.12.2017
Net cost of risk
Other income
statement
Provisions for off-balance sheet commitments to banks 2 - - - - 2
Provisions for off-balance sheet commitments to customers 201 12 - - (8) 205
Sectoral provisions and other 1,029 (179) - - (25) 825
Provisions for forward financial instruments 18,273 - (1,239) - (7,349) 9,685
Other provisions(1) 2,454 1,153 (77) (766) (126) 2,638
Total 21,959 986 (1,316) (766) (7,508) 13, 355
(1) Including a EUR 29 million net allocation for PEL/CEL provisions at 31st December 2017 (EUR 39 million at 31st December 2016) (see Note 2.6.3).
PROVISIONS FOR OFF-BALANCE SHEET COMMITMENTS
Provisions for off-balance sheet commitments represent the Group’s probable losses incurred following the identification of a proven credit risk on an off-balance sheet financing or guarantee commitment that would not be considered as a derivative instrument or designated as financial asset through profit or loss.
OTHER PROVISIONS FOR RISKS AND COMMITMENTS
Provisions for disputes
Societe Generale is subject to an extensive legal and regulatory framework in the countries where it operates. In this complex legal context, Societe Generale and some of its former and current representatives may be involved in various legal actions, including civil, administrative and criminal proceedings. The vast majority of these proceedings are part of Societe Generale’s current business. In recent years, litigation with investors and the number of disputes involving financial intermediaries such as banks and investment advisors has increased, partly due to a difficult financial environment.
It is by nature difficult to foresee the outcome of disputes, regulatory proceedings and acts involving Societe Generale entities, particularly if they are initiated by various categories of complainants, if the amount of claims for damages is not specified or is indeterminate or if the proceedings have no precedent.
In preparing its financial statements, Societe Generale assesses the consequences of the legal, regulatory or arbitration proceedings in which it is involved. A provision is booked when
losses from these proceedings become probable and the amount can be estimated reliably.
To assess the probability of losses and the amount of these losses, and thus to determine the amount of provisions to book, estimations are important. Management makes these estimates by exercising its judgement and taking into account all information available when financial statements are prepared. In particular, Societe Generale takes into account the nature of the dispute, the underlying facts, ongoing proceedings and court rulings already handed down, as well as its experience and the experiences of other companies dealing with similar cases (assuming that Societe Generale has knowledge thereof) and, where appropriate, the opinion and reports of experts and independent legal advisers.
Each quarter, Societe Generale carries out a detailed examination of pending disputes that present a significant risk. To take into account changes in legal risks related to public law litigation for which investigations and proceedings are under way with US authorities (such as the Office of Foreign Assets Control) and European authorities, as well as the dispute on the “précompte”, Societe Generale has recognised a provision among its liabilities, under Provisions for disputes; this provision was adjusted in 2017 by an additional allowance of EUR 1,150 million recorded under Cost of risk, and a use of EUR 750 million, bringing it to a total of EUR 2,318 million.
Other proviisions
Other provisions include provisions for restructuring, provisions for commercial litigation, provisions for future repayment of funds in connection with customer financing transactions and provisions for commitments linked to PEL/CEL accounts (see Note 2.6.3).

6
F I N A N C I A L I N F O R M A T I O N
Provisions for disputes
Other provisions
NOTES TO THE PARENT COMPANY FINANCIAL STATEMENTS
6 I 6FF I N A N C I A L I N F O R M A T I O NN
S O C I E T E G E N E R AL E G R O U P I 2018 REGISTRATION DOCUMENT I 483
3. MORTGAGE SAVINGS AGREEMENTS (PEL / CEL)
ACCOUNTING PRINCIPLES
Comptes d’épargne-logement (CEL or mortgage savings accounts) and plans d’épargne-logement (PEL or mortgage savings plans) are special savings schemes for individual customers which are governed by Act 65-554 of 10th July 1965. These products combine an initial deposits phase in the form of an interest-earning savings account, followed by a lending phase where the deposits are used to provide mortgage loans. Under the current regulation, this last phase is subject to the prior existence of the savings phase and is therefore inseparable from it. The savings deposits collected and loans granted are recognised at amortised cost.
These instruments create two types of commitments for Societe Generale: the obligation to remunerate customer savings for an indeterminate future period at an interest rate established at the inception of the mortgage savings agreement, and the obligation to subsequently lend to the customer at an interest rate also established at the inception of the savings agreement.
If it is clear that commitments under the PEL/CEL agreements will have negative consequences for the company, a provision is recorded on the liabilities side of the balance sheet. Any changes in these provisions are recognised as net banking income under Net interest income. These provisions only relate to commitments arising from PEL/CEL that are outstanding at the date of calculation.
Provisions are calculated for each generation of mortgage savings plans (PEL), with no netting between different PEL generations, and for all mortgage saving accounts (CEL) which constitute a single generation.
During the deposits phase, the underlying commitment used to determine the amount to be provisioned is calculated as the difference between the average expected amount of deposits and the minimum expected amount. These two amounts are determined statistically on the basis of the historical observed past behaviour of customers.
During the lending phase, the underlying commitment to be provisioned includes loans already granted but not yet drawn at the date of calculation, and future loans that are considered statistically probable on the basis of the amount of balance sheet deposits at the date of calculation and the historical observed past behaviour of customers.
A provision is recorded if the discounted value of expected future earnings for a given generation of PEL/CEL is negative. Earnings are estimated on the basis of interest rates available to individual customers for equivalent savings and loan products (with a similar estimated life and date of inception).
OUTSTANDING DEPOSITS IN MORTGAGE SAVINGS AGREEMENTS (PEL / CEL)
(In EUR m) 31.12.2017 31.12.2016
Mortgage savings plans (PEL)
less than 4 years old 4,818 6,648
between 4 and 10 years old 7,237 5,699
more than 10 years old 4,485 4,363
Sub--total 16,540 16,710
Mortgage savings accounts (CEL) 1,119 1,140
Total 17,659 17,850
OUTSTANDING HOUSING LOANS GRANTED WITH RESPECT TO MORTGAGE SAVINGS AGREEMENTS (PEL / CEL)
(In EUR m) 31.12.2017 31.12.2016
less than 4 years old 3 7
between 4 and 10 years old 40 60
more than 10 years old 6 6
Total 49 73

6 I 6
F I N A N C I A L I N F O R M A T I O N
484 I 2018 REGISTRATION DOCUMENT I S O C I E T E G E N E R AL E G R O U P
PROVISIONS FOR COMMITMENTS LINKED TO MORTGAGE SAVINGS AGREEMENTS (PEL / CEL)
(In EUR m) 31.12.2016 Allocations Reversals 31.12.2017
Mortgage savings plans (PEL)
less than 4 years old 16 - (1) 15
between 4 and 10 years old 19 9 - 28
more than 10 years old 160 - (38) 122
SSub--ttotal 1195 99 ((39) 1165
Mortgage savings accounts (CEL) 3 1 - 4
TTotal 1198 110 ((39) 1169
The level of provisions is sensitive to the long-term interest rates. Since the long-term rates were low during 2017, the provisions for PEL and CEL mortgage saving accounts are linked to the risks attached to the commitment to remunerate the deposits. Provisioning for PEL/CEL savings amounted to 0.96% of total outstandings as at 31st December 2017.
METHODS USED TO ESTABLISH THE PARAMETERS FOR VALUING PROVISIONS
The parameters used for estimating the future behaviour of customers are derived from historical observations of customer behaviour patterns over a long period (more than 10 years). The values of these parameters can be adjusted whenever changes are made to regulations that may undermine the effectiveness of past data as an indicator of future customer behaviour.
The values of the various market parameters used, notably interest rates and margins, are calculated on the basis of observable data
and constitute a best estimate, at the date of valuation, of the future value of these items for the periods in question, in line with the Retail Banking division’s policy of interest rate risk management.
The discount rates used are derived from the zero coupon swaps vs. Euribor yield curve on valuation date, averaged over a 12-month period.
4. COST OF RISK
ACCOUNTING PRINCIPLES
Cost of risk includes allocations, net of reversals, to provisions and to impairments for credit risk, the amount of the loan considered uncollectible and the amount of recoveries on loans written off, as well as allocations and reversals of provisions for other risks.
(In EUR m) 2017 2016
NNet allocation to depreciations and provisions for identified risks
Identified risks (177) (540)
Losses not covered by depreciations and amounts recovered on write-offs (84) (111)
Other risks and commitments (404) (333)
SSub--ttotal ((665) ((984)
Net allocation to general country risk reserves - -
NNet allocation to depreciations and provisions for receivables and off--bbalance ssheet ccommitments ((665) ((984)
Including gain (loss) on revaluation of currency hedge of provisions: - -
Counterparty risk (63) (62)

6
F I N A N C I A L I N F O R M A T I O N NOTES TO THE PARENT COMPANY FINANCIAL STATEMENTS
6 I 6FF I N A N C I A L I N F O R M A T I O NN
S O C I E T E G E N E R AL E G R O U P I 2018 REGISTRATION DOCUMENT I 485
NOTE 3 - OTHER ACTIVITIES
NOTE 3.1 - NET FEES FOR SERVICES
ACCOUNTING PRINCIPLES
Societe Generale recognises fee income and expense for services provided and received in different ways depending on the type of service.
Fees for ongoing services, such as some payment services, custody fees, or web-service subscriptions are recorded as income over the lifetime of the service. Fees for one-off services, such as fund activity, finder’s fees received, arbitrage fees, or penalties following payment incidents are recognised in income when the service is provided.
In syndication deals, the effective interest rate for the share of the issue retained on Societe Generale’s balance sheet is comparable to that applying to the other members of the syndicate including, when needed, a share of the underwriting fees and participation fees; the balance of these fees is recorded in the income statement at the end of the syndication period. Arrangement fees are recorded in income when the placement is legally complete.
2017 2016
(In EUR m) Income Expenses Net Income Expenses Net
Transactions with banks 74 (92) (18) 99 (63) 36
Transactions with customers 1,359 - 1,359 1,079 - 1,079
Securities transactions 507 (771) (264) 478 (656) (178)
Primary market transactions 112 - 112 143 - 143
Foreign exchange transactions and forward financial instruments
68 (269) (201) (2) (307) (309)
Loan and guarantee commitments 662 (71) 591 639 (59) 580
Services 1,383 - 1,383 1,622 - 1,622
Other providing activities - (156) (156) - (135) (135)
Net Total 4,165 (1,359) 2,806 4,058 (1,220) 2,838

6 I 6
F I N A N C I A L I N F O R M A T I O N
486 I 2018 REGISTRATION DOCUMENT I S O C I E T E G E N E R AL E G R O U P
NOTE 3.2 - ACCRUALS, OTHER ASSETS AND LIABILITIES
CHANGE IN THE PRESENTATION OF PREMIUMS RELATED TO OPTIONS
Conditional financial derivatives (options and assimilated instruments) purchased or sold include in some cases forward settled premiums.
The amounts of premiums to be received and premiums to be paid were previously recorded in the balance sheet under Other assets and Other liabilities, separately from the items of the balance sheet in which value of purchased and sold conditional instruments were presented.
As those premiums are inseparable from the related derivative instruments, their presentation in the balance sheet has been modified to make the financial statements more understandable. The amount of premiums to be paid and premiums to be received are included in the book value of the related conditional derivatives instruments purchased or sold (under Premium on options purchased and sold. This change does not impact the related income and expenses in the income statement).
At 31st December 2016, the effects of the new presentation of premiums on options were as follows:
(In EUR m)31.12.2016 Published Restatement
31.12.2016 Proforma
Other assets
Miscellaneous receivables 15,836 (13,457) 2,379
Premium on options purchased 92,691 (14,514) 78,177
Other liabilities
Miscellaneous payables 13,125 (12,297) 828
Premiums on options sold 98,252 (15,674) 82,578
1. ACCRUALS, OTHER ACCOUNTS RECEIVABLE AND OTHER ASSETS
(In EUR m) 31.12.2017 31.12.2016
OOther assets
Guarantee deposits paid (1) 27,560 44,553
Miscellaneous receivables (3) 2,253 15,836
Premiums on options purchased (3) 57,497 92,691
Settlement accounts on securities transactions 3,195 3,434
Other 461 389
SSub--ttotal 990,966 1156,903
AAccruals and similar
Prepaid expenses 359 333
Deferred taxes 4,032 4,367
Accrued income 1,761 2,076
Other (2) 42,319 46,049
SSub--ttotal 448,471 552,825
GGross amount 1139,437 2209,728
Depreciations (82) (81)
NNet total 1139,355 2209,647
(1) Mainly concerns guarantee deposits paid on financial instruments. (2) Including derivative instruments valuation for EUR 34,709 million (EUR 38,994 million at 31st December 2016). (3) Changes in the presentation of premiums on options described above.

6
F I N A N C I A L I N F O R M A T I O N NOTES TO THE PARENT COMPANY FINANCIAL STATEMENTS
6 I 6 FF I N A N C I A L I N F O R M A T I O NN
S O C I E T E G E N E R AL E G R O U P I 2018 REGISTRATION DOCUMENT I 487
2. ACCRUALS, OTHER ACCOUNTS PAYABLE AND OTHER LIABILITIES
(In EUR m) 31.12.2017 31.12.2016
Securities transactions Amounts payable for securities borrowed 149,444 112,989
Other amounts due for securities 42,387 44,931
Sub--total 191,831 157,920
Other liabilities
Guarantee deposits received(1) 21,550 30,212
Miscellaneous payables(2) 444 13,125
Premiums on options sold(2) 61,352 98,252
Settlement accounts on securities transactions 3,856 4,036
Other securities transactions 530 -
Related payables 192 209
Sub--total 87,924 145,834
Accruals and similar
Accrued expenses 3,054 3,363
Deferred taxes 6 2
Deferred income 1,465 2,339
Other(3) 34,213 30,176
Sub--total 38,738 35,880
Total 318,493 339,635
(1) Mainly concerns guarantee deposits received on financial instruments. (2) Changes in the presentation of premiums on options described above. (3) Including derivative instruments valuation for EUR 22,033 million (EUR 18,525 million at 31st December 2016).
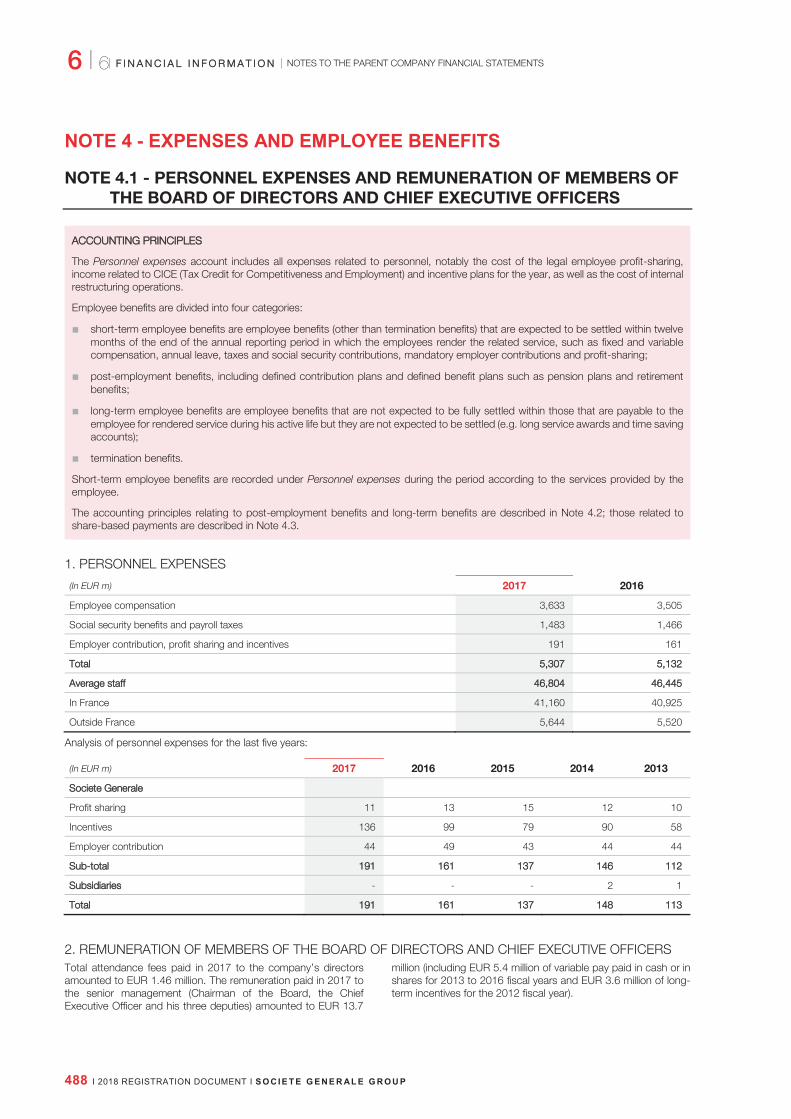
6 I 6
F I N A N C I A L I N F O R M A T I O N
488 I 2018 REGISTRATION DOCUMENT I S O C I E T E G E N E R AL E G R O U P
NOTE 4 - EXPENSES AND EMPLOYEE BENEFITS
NOTE 4.1 - PERSONNEL EXPENSES AND REMUNERATION OF MEMBERS OF THE BOARD OF DIRECTORS AND CHIEF EXECUTIVE OFFICERS
AACCOUNTING PRINCIPLES
The Personnel expenses account includes all expenses related to personnel, notably the cost of the legal employee profit-sharing, income related to CICE (Tax Credit for Competitiveness and Employment) and incentive plans for the year, as well as the cost of internal restructuring operations.
Employee benefits are divided into four categories:
short-term employee benefits are employee benefits (other than termination benefits) that are expected to be settled within twelvemonths of the end of the annual reporting period in which the employees render the related service, such as fixed and variablecompensation, annual leave, taxes and social security contributions, mandatory employer contributions and profit-sharing;
post-employment benefits, including defined contribution plans and defined benefit plans such as pension plans and retirementbenefits;
long-term employee benefits are employee benefits that are not expected to be fully settled within those that are payable to theemployee for rendered service during his active life but they are not expected to be settled (e.g. long service awards and time saving accounts);
termination benefits.
Short-term employee benefits are recorded under Personnel expenses during the period according to the services provided by the employee.
The accounting principles relating to post-employment benefits and long-term benefits are described in Note 4.2; those related to share-based payments are described in Note 4.3.
1. PERSONNEL EXPENSES
(In EUR m) 2017 2016
Employee compensation 3,633 3,505
Social security benefits and payroll taxes 1,483 1,466
Employer contribution, profit sharing and incentives 191 161
TTotal 55,307 55,132
AAverage staff 446,804 446,445
In France 41,160 40,925
Outside France 5,644 5,520
Analysis of personnel expenses for the last five years:
(In EUR m) 2017 2016 2015 2014 2013
SSociete Generale
Profit sharing 11 13 15 12 10
Incentives 136 99 79 90 58
Employer contribution 44 49 43 44 44
SSub--ttotal 1191 1161 1137 1146 1112
SSubsidiaries - - - 2 1
TTotal 1191 1161 1137 1148 1113
2. REMUNERATION OF MEMBERS OF THE BOARD OF DIRECTORS AND CHIEF EXECUTIVE OFFICERSTotal attendance fees paid in 2017 to the company’s directors amounted to EUR 1.46 million. The remuneration paid in 2017 to the senior management (Chairman of the Board, the Chief Executive Officer and his three deputies) amounted to EUR 13.7
million (including EUR 5.4 million of variable pay paid in cash or in shares for 2013 to 2016 fiscal years and EUR 3.6 million of long-term incentives for the 2012 fiscal year).

6
F I N A N C I A L I N F O R M A T I O N NOTES TO THE PARENT COMPANY FINANCIAL STATEMENTS
6 I 6FF I N A N C I A L I N F O R M A T I O NN
S O C I E T E G E N E R AL E G R O U P I 2018 REGISTRATION DOCUMENT I 489
NOTE 4.2 - EMPLOYEE BENEFITS
Societe Generale, in France and in its branches in foreign countries, may award their employees:
post-employment benefits, such as pension plans or retirement benefits;
long-term benefits such as deferred variable remuneration, long service awards or the Compte Epargne Temps (CET) flexible workingprovisions;
termination benefits.
DETAIL OF PROVISIONS FOR EMPLOYEE BENEFITS
In the framework of its strategic plan, Societe Generale has announced the upgrading of its French Retail Banking network. Accordingly, Societe Generale has proceeded to an adjustment of the restructuring provisions with an allotment of EUR 230 million recorded in personnel expenses on the 2017 closing accounts.
Moreover, a provision of EUR 72 million presented under Other provisions (see note 2.6) has been recorded in Other administrative expenses to support this plan.
1. POST-EMPLOYMENT BENEFITS
ACCOUNTING PRINCIPLES
Pension plans may be defined contribution or defined benefit plans.
DEFINED CONTRIBUTION PLANS
Defined contribution plans limit Societe Generale’s liability to the subscriptions paid into the plan, but do not commit the company to a specific level of future benefits. Contributions paid are recorded as an expense for the current year.
DEFINED BENEFIT PLANSS
Defined benefit plans commit Societe Generale, either formally or constructively, to pay a certain amount or level of future benefits and therefore bear the medium- or long-term risk. The present value of defined benefit obligations is valued by independent qualified actuaries.
Provisions are recognised on the liabilities side of the balance sheet under Provisions, to cover the whole of these retirement obligations. This is assessed regularly by independent actuaries using the projected unit credit method. This valuation technique incorporates assumptions about demographics, early retirement, salary rises and discount and inflation rates.
When these plans are financed from external funds classed as plan assets, the fair value of these funds is subtracted from the provision to cover the obligations.
Differences arising from changes in calculation assumptions (early retirements, discount rates, etc.) or differences between actuarial assumptions and real performance (return on plan assets) are recognised as actuarial gains or losses. They are recorded immediately and in full in the income statement.
Where a new or amended plan comes into force, the cost of past services is recorded immediately and in full in the income statement. An annual charge is recorded under Personnel expenses for defined benefit plans, consisting of:
the additional entitlements vested by each employee (current service cost);
the financial expense resulting from the discount rate;
the expected return on plan assets (gross return);
the actuarial gains and losses and past service cost;
the settlement or curtailment of plans.
Net allowances
(In EUR m)
Amount at 31st December 2016
Net cost of risk
Other income
statement Used
provisions Change in scope and reclassifying
Amount at 31st
December 2017
Provisions for employee benefits 1,532 - 220 - 7 1,759

6 I 6
F I N A N C I A L I N F O R M A T I O N
490 I 2018 REGISTRATION DOCUMENT I S O C I E T E G E N E R AL E G R O U P
DEFINED CONTRIBUTION PLANS
The main defined contribution plans provided to employees of the Group are located in France. They include state pension plans and other national pension plans such as ARRCO and AGIRC, as well as pension schemes put in place by some branches of the Societe Generale for which the only commitment is to pay annual contributions (PERCO).
POST-EMPLOYMENT BENEFIT PLANS (DEFINED BENEFIT PLANS)
Pension plans include pension benefits paid as annuities and end-of-career payments. Pension benefit annuities are paid in addition to state pension plans.
1.1. RECONCILIATION OF ASSETS AND LIABILITIES RECORDED IN THE BALANCE SHEET
(In EUR m) 31.12.2017 31.12.2016
Net liabilities recorded in the balance sheet 874 828
Assets recorded in the balance sheet (72) (59)
NNet balance 8802 7769
BBreakdown of the net balance
Present value of funded defined benefit obligations 2,459 2,383
Fair value of plan assets (2,182) (2,148)
AA -- AActuarial deficit (net balance) 2277 2235
BB -- PPresent vvalue of unfunded defined benefit obligations 1120 1135
Unrecognised items
Separate assets (397) (399)
Plan assets impacted by change in asset ceiling (8) -
CC -- TTotal unrecognised items ((405) ((399)
AA + B -- CC Net balance 8802 7769
Note: Pension plans include pension benefits paid as annuities and end-of-career payments. Pension benefit annuities are paid in addition to state pension plans.
1.2. INFORMATION REGARDING PLAN ASSETSThe breakdown of the fair value of plan assets is as follows: 56% bonds, 25% equities and 19% other investments. Societe Generale’s own financial instruments directly held are not significant.
For pension plans with a fair value of plan assets in excess of defined benefit obligations, the aggregate of plan assets is EUR 72 million.
Employer contributions to be paid to post-employment defined benefit plans for 2018 are estimated at EUR 3 million.

6
F I N A N C I A L I N F O R M A T I O N NOTES TO THE PARENT COMPANY FINANCIAL STATEMENTS
6 I 6FF I N A N C I A L I N F O R M A T I O NN
S O C I E T E G E N E R AL E G R O U P I 2018 REGISTRATION DOCUMENT I 491
1.3. MAIN ASSUMPTIONS DETAILED BY GEOGRAPHIC AREA
(In EUR m) 31.12.2017 31.12.2016
Discount rate
Europe 1.77% 1.88%
Americas 3.50% 3.90%
Asia-Oceania-Africa 3.36% 2.98%
Long-term inflation
Europe 2.17% 2.12%
Asia-Oceania-Africa 2.00% 2.00%
Future salary increase net of inflation
Europe 0.54% 0.57%
Asia-Oceania-Africa 3.06% 2.93%
Average remaining working lifetime of employees (in years)
Europe 8.83 8.90
Americas 8.25 8.40
Asia-Oceania-Africa 12.77 13.30
Duration (in years)
Europe 16.10 13.20
Americas 17.53 22.00
Asia-Oceania-Africa 10.81 11.10
The assumptions by geographic area are averages weighted by the present value of the Defined Benefit Obligation (DBO) with the exception of the expected returns on plan assets, which are averages weighted by the fair value of assets.
The yield curves used to discount the liabilities are corporate AA yield curves (source: Merrill Lynch) observed at the end of October for USD, GBP and EUR, and corrected at the end of December if the variation in discount rates had a significant impact.
Inflation rates used for EUR and GBP monetary areas are market rates observed at the end of October and corrected at the end of December if the variation had a significant impact. Inflation rates used for the other monetary areas are the long-term targets of the central banks.
The average remaining working lifetime of employees is calculated taking into account turn-over assumptions.
The assumptions described above have been applied on post-employment benefit plans.
2. OTHER LONG-TERM BENEFITS
ACCOUNTING PRINCIPLES
Long-term employee benefits are those that are payable to employees for services rendered during their employment, but which are not expected to be settled wholly before twelve months after the end of the annual reporting period in which the employees render the related service. Long-term benefits are measured in the same way as post-employment benefits.
Societe Generale may award their employees long-term benefits, such as long-term deferred variable remunerations, time saving accounts (Compte Epargne Temps) or long service awards. They are different from post-employment benefits and termination benefits, which are not fully due within twelve months following the financial year during which the services are rendered by the employees.
The net balance of long-term benefits stands at EUR 588 million.
The total cost for long-term benefits is EUR 218 million.

6 I 6
F I N A N C I A L I N F O R M A T I O N
492 I 2018 REGISTRATION DOCUMENT I S O C I E T E G E N E R AL E G R O U P
NOTE 4.3 - FREE SHARE PLANS
ACCOUNTING PRINCIPLES
In the case of share purchase options and free share plans granted to employees, a provision must be recorded for the loss that the entity will incur when it delivers treasury shares to the employees.
This provision is recorded under Personnel expenses for an amount equal to the difference:
between the quoted price of the treasury shares at the balance sheet closing date and the exercise price (zero in the case of freeshares) if the entity has not already purchased its treasury shares in order to give them to the employees;
between the acquisition price of treasury shares held and the exercise price (zero in case of free shares) if the entity has alreadypurchased its treasury shares in order to deliver them to the employees.
If vesting conditions such as service or performance conditions must be satisfied for the employees to become entitled to receive shares, the provision expense shall be accounted for the services as they are rendered by the employees during the vesting period.
In the case of share subscription plans, no expense shall be recorded concerning treasury shares that have yet to be issued.
1. MAIN CHARACTERISTICS OF THE FREE SHARE PLANS OF THE YEARThe plans for employees for the year ended 31st December 2017 are briefly described below:
IIssuer SSociete Generale
YYear of grant 22017
TType of plan PPerformance shares
Number of free shares granted 1,308,280
Shares delivered -
Shares forfeited as at 31.12.17 25,997
Shares outstanding as at 31.12.17 1,282,283
Number of shares reserved as at 31.12.17 1,282,283
The performance conditions are described in the “Corporate Governance” section of the present document.
2. AMOUNT OF THE DEBT RECORDED IN THE BALANCE SHEET FOR 2017 PLANSThe amount of the debt recorded in the balance sheet for the 2017 plans is EUR 17 million.
3. INFORMATION RELATIVE TO TREASURY SHARES FOR 2017 PLANSThe number of treasury shares acquired in relation to the 2017 plans is 1,282,283 for a cost of EUR 42 million.

6
F I N A N C I A L I N F O R M A T I O N NOTES TO THE PARENT COMPANY FINANCIAL STATEMENTS
6 I 6FF I N A N C I A L I N F O R M A T I O NN
S O C I E T E G E N E R AL E G R O U P I 2018 REGISTRATION DOCUMENT I 493
NOTE 5 - TAXES
ACCOUNTING PRINCIPLES
CURRENT TAXES
In the 1989 financial year, Societe Generale opted to apply a tax consolidation regime. At 31st December 2017, 253 subsidiaries had signed a tax consolidation agreement with Societe Generale. Accordingly, all of the consolidated companies must record in their financial statements the tax expense they would have paid if they had not been consolidated with Societe Generale for tax purposes.
DEFERRED TAX
Societe Generale applies the option allowing it to recognise deferred taxes in its annual financial statements.
Deferred taxes are recognised whenever Societe Generale identifies a temporary difference between the book value and tax value of balance sheet assets and liabilities. They are calculated using the liability method, whereby deferred taxes from previous years are adjusted to account for changes in tax rates. The impact of changes to tax rates is recorded in the income statement under deferred taxes. Net deferred tax assets are recorded only if the entity concerned is likely to recover these assets within a set timeframe.
Deferred taxes are determined separately for each taxable entity and are never discounted to present value.
1. INCOME TAX
(In EUR m) 2017 2016
Current taxes 336 239
Deferred taxes (227) (485)
Total((1) (2) ((3) 109 (246)
(1) 2017 income tax includes a loss of EUR 7.4 million (against a gain of EUR 26.9 million for 2016) due primarily to the recapture stemming from the exit of ALD entities from the fiscal group.
(2) At 31st December 2017, the deferred tax includes the change in the US tax rate and the appreciation of deferred tax assets of the US tax group for EUR -253 million.
(3) At 31st December 2017, the income tax (current and deferred) includes an impact of EUR -146 million relative to the French tax reforms, namely the refund of the additional 3% contribution on dividends, which was rejected by the Constitutional Council, and the progressive reduction in the corporate tax rate included in the 2018 French Finance Act.
In France, the standard corporate income tax rate is 33.33%. A national contribution payment based on pre-tax earnings (contribution sociale) was introduced in 2000 equal to 3.3% (after a deduction of EUR 0.76 million from basic taxable income).
Long-term capital gains on equity investments are exempt, subject to taxation of a portion of fees and expenses at the full statutory tax rate only if the company realises a net long-term capital gain. This portion of fees and expenses is 12% of gross capital gains.
Furthermore, under the parent-subsidiary regime, dividends from companies in which Societe Generale’s equity interest is at least 5% are tax exempt, subject to the taxation of a portion of fees and expenses at the full statutory tax rate.
The 2018 French Finance Act, published on 31st December 2017, includes a gradual reduction in the French tax rate. Between now and 2022, the standard Corporate Income Tax of 33.33% will be brought down to 25%, plus the existing national contribution of 3.3%.
Deferred taxes in French companies are determined by applying the tax rate in effect upon the reversal of the temporary difference. Regarding the gradual reduction in the French tax rate until 2022:
For income taxed at the ordinary tax rate, the rate is between34.43% in 2018 and 25.83% from 2022;
For income taxed at the reduced rate, the rate is between4.13% in 2018 and 3.10% from 2022.
The US tax reform enacted at the end of December 2017 introduced a new tax on services and interest payments to non-US related parties (“Base Erosion Anti-abuse Tax”). Societe Generale is currently reviewing the potential impact of these new US tax rules, while remaining attentive to guidance that is still expected from US authorities.

6 I 6
F I N A N C I A L I N F O R M A T I O N
494 I 2018 REGISTRATION DOCUMENT I S O C I E T E G E N E R AL E G R O U P
2. PROVISIONS FOR TAX ADJUSTMENTS
ACCOUNTING PRINCIPLES
Provisions represent liabilities whose timing or amount cannot be precisely determined. Provisions may be recorded where, by virtue of a commitment to a third party, the Group will probably or certainly incur an outflow of resources to this third party without receiving at least the equivalent value in exchange.
The expected outflows are then discounted to present value to determine the amount of the provision, where this discounting has a significant impact. Allocations to and reversals of provisions for tax adjustments are booked to Current taxes in the income statement under Income tax. Information on the nature and the amount of the associated risks is not disclosed when the Group considers that such disclosure could seriously undermine its position in a dispute with other parties on the object of the provision.
Net allowances
(In EUR m)
Amount at 31.12.2016
Net cost of risk
Other income
statement Used
provisions
Change in scope and
reclassifying Amount at 31.12.2017
Provisions for tax adjustments 139 - (26) - (3) 110
3. DEFERRED TAXES
Each year, the Group performs a review of tax loss carryforwards, according to the tax system applicable for each relevant tax entity and a realistic forecast of its tax results. For this purpose, tax results are determined based on the forecast of the performance of each business line entering in the Group budgetary path and/or on the strategic review of countries, after being approved by empowered management bodies. In addition, they include accounting and tax adjustments (of which the reversal of deferred tax assets and liabilities on temporary differences) applicable to concerned entities and jurisdictions. These adjustments are determined based on historical tax results and on the Group’s tax expertise. Beyond the Group budgetary path and/or the strategic review, extrapolations are performed particularly from macro-economic assumptions (for example, the evolution of interest rates).
By nature, the appreciation of the chosen macro-economic factors and the internal estimations used to determine the tax results contain risks and uncertainties on their realisation over the estimated horizon of the losses absorption. These risks and uncertainties concern the possibilities of change in the applicable tax rules (tax result computation as well as rules of imputation of tax losses carried forward) or the achievement of the strategic assumptions.
To ensure the robustness of the tax result projections, the Group performs sensitivity tests on the achievement of budgetary and strategic assumptions.
At 31st December 2017, these analyses confirm the probability for the Group to use tax loss carryforwards subject to deferred tax assets against future taxable profit.
4. DEFERRED TAX ASSETS RECOGNISED ON TAX LOSS CARRYFORWARDSAt 31st December 2017, based on the tax system of each franchise and a realistic projection of their tax income or expense, the projected period for deferred tax asset recovery is indicated in the table below:
(In EUR m) 31.12.2017 31.12.2016
Tax loss carryforwards 2,889 2,951
Gains on sales of assets to companies included in the tax consolidation, in France (155) (171)
Other (primarily relating to other reserves) 1,299 1,587
TTotal 44,033 44,367

6
F I N A N C I A L I N F O R M A T I O N
NOTES TO THE PARENT COMPANY FINANCIAL STATEMENTS
6 I 6FF I N A N C I A L I N F O R M A T I O NN
S O C I E T E G E N E R AL E G R O U P I 2018 REGISTRATION DOCUMENT I 495
(In EUR m)
31.12.2017 Statutory time
limit on carryforwards
Expected recovery period
Total deferred tax assets relating to tax loss carryforwards 2,889 - -
o.w. French tax group 2,457 unlimited(1) 9 years
o.w. US tax group 397 20 years 7 years
others 35 - -
(1) In accordance with the 2013 Finance Act, the deduction of previous losses is limited to EUR 1 million plus 50% of the fraction of the taxable income for the fiscal year exceeding this limit. The non-deductible portion of losses may be carried forward to the following fiscal years with no time limit and under the same conditions.
Furthermore, at 31st December 2017, deferred tax assets and liabilities not recognised on the asset side of the balance sheet concerned mainly our franchise in the United States of America, for EUR 266 million (versus EUR 696 million at 31st December 2016).
With regard to the tax treatment of the loss caused by the actions of Jérôme Kerviel, Societe Generale considers that the judgment of the Versailles Court of Appeal of 23rd September 2016 is not likely to call into question its validity in view of the 2011 opinion of the French Supreme Administrative Court (Conseil d’État) and its established case law which was recently confirmed again in this regard. Consequently, Societe Generale considers there is no need to provision the corresponding deferred tax assets.
However, as indicated by the Minister of the Economy and Finance in September 2016, the tax authorities have examined the tax consequences of this book loss and recently confirmed that they intended to call into question the deductibility of the loss caused by the actions of Jérôme Kerviel, amounting to EUR 4.9 billion. This proposed tax rectification has no immediate effect and will possibly have to be confirmed by a tax adjustment notice sent by the tax authorities when Societe Generale is in a position to deduct the tax loss carryforwards arising from the loss from its taxable income. Such a situation will not occur for several years according to the bank’s forecasts. In the event that the authorities decide, in due course, to confirm their current position, Societe Generale will not fail to assert its rights before the competent courts.

6 I 6
F I N A N C I A L I N F O R M A T I O N
496 I 2018 REGISTRATION DOCUMENT I S O C I E T E G E N E R AL E G R O U P
NOTE 6 - SHAREHOLDERS’ EQUITY
NOTE 6.1 - CHANGES IN SHAREHOLDERS’ EQUITY
(In EUR m)
Capital stock
Additional paid-in capital
Reserves, unappropriated
retained earnings Shareholders’
equity
AAt 31sst DDecember 2015 11,008 220,420 112,130 333,558
Increase/Decrease in capital stock(1) 2 6 (2) 6
Net income for the period - - 4,223 4,223
Dividends paid(2) - - (1,596) (1,596)
Other movements(3) - 3 (318) (315)
AAt 31sst DDecember 2016((4) 11,010 220,429 114,437 335,876
Increase/Decrease in capital stock(5) - 8 - 8
Net income for the period - - 800 800
Dividends paid(6) - - (1,763) (1,763)
Other movements(7) - 7 - 7
AAt 31sst DDecember 2017((8) 11,010 220,444 113,474 334,928
(1) In 2016, Societe Generale proceeded with the following capital increases, representing a total amount of EUR 1.84 million, with an issuing premium of EUR 5.73 million:
- EUR 1.58 million in free and conditional Societe Generale shares to employees taken from the reserves;
- EUR 0.26 million resulting from stock options granted by the Board of Directors, that were exercised by employees with EUR 5.73 million of issuing premiums.
(2) The dividend distribution performed by Societe Generale in 2016 amounted to EUR 1,596.2 million after elimination of treasury stock dividends for EUR 16.6 million.
(3) Including:
- EUR 318 million related to the application of the recommendation 2013-02 of the Authority of the Accounting standards.
- EUR 3.73 million corresponding to profit on the SGSS merger.(4) At 31st December 2016, Societe Generale’s fully paid-up capital amounted to EUR 1,009,641,917.50 and comprised 807,713,534 shares with a nominal
value of EUR 1.25. At 31st December 2016, the amount of Societe Generale’s reserves was EUR 3,632,721,445.25, with:
- EUR 100.78 million for the legal reserve;
- EUR 2,097.25 million for the long-term capital gain reserve;
- EUR 1,434.69 million for other reserves.(5) In 2017, Societe Generale proceeded with the following capital increases, representing EUR 0.26 million resulting from stock options granted by the
Board of Directors, that were exercised by employees with EUR 8.16 million of issuing premiums. (6) The dividend distribution performed by Societe Generale in 2017 amounted to EUR 1,763 million after elimination of treasury stock dividend for EUR 15.1
million. (7) EUR 6.35 million related to the merger profit further to the takeover of Eléaparts. (8) At 31st December 2017, Societe Generale’s fully paid-up capital amounted to EUR 1,009,897,173.75 and comprised 807,917,739 shares with a nominal
value of EUR 1.25. At 31st December 2017, the amount of Societe Generale’s reserves was EUR 3,632,905,672.87, with:
- EUR 100.96 million for the legal reserve;
- EUR 2,097.25 million for the long-term capital gain reserve;
- EUR 1,434.69 million for other reserves.

6
F I N A N C I A L I N F O R M A T I O N NOTES TO THE PARENT COMPANY FINANCIAL STATEMENTS
6 I 6FF I N A N C I A L I N F O R M A T I O NN
S O C I E T E G E N E R AL E G R O U P I 2018 REGISTRATION DOCUMENT I 497
NOTE 6.2 – PROPOSAL OF INCOME ASSIGNMENT
At the Annual General Meeting of 23rd May 2018, the Board of Directors will propose an allocation of income for the year ended 31st December 2017 and dividend distribution under the following terms:
(In EUR m)
Net income 800
Unappropriated retained earnings 9,041
TTotal income to be aappropriated 99,841
Dividend 1,777
Retained earnings 8,064
TTotal appropriated income 99,841
The dividend corresponds to EUR 2.20 per share with a par value of EUR 1.25.
The dividend amount of EUR 1,777 million to be paid to shareholders is calculated on the basis of an existing number of shares on 31st December 2017.

6 I 6
F I N A N C I A L I N F O R M A T I O N
498 I 2018 REGISTRATION DOCUMENT I S O C I E T E G E N E R AL E G R O U P
NOTE 6.3 – NET EARNINGS PER SHARES
1. EARNINGS PE R SHARES
(In EUR m) 31.12.2017 31.12.20166 NNet Income attributable to oordinary shareholders 8800 44,223
Weighted average number of ordinary shares outstanding 800,596,132 798,767,869
EEarnings per ordinary share (in EEUR)) 11.00 55.29
Average number of ordinary shares used in the dilution calculation(1) 50 19,154
Weighted average number of ordinary shares used in the calculation of diluted net earnings per share 800,596,182 798,787,023
DDiluted earnings per ordinary share (in EEUR)) 11.00 55.29
(1) The number of shares used in the dilution calculation is computed using the "share buyback" method and takes into account free shares in stock-option plans.

6
F I N A N C I A L I N F O R M A T I O N
1. EARNINGS PE R SHARES
NOTES TO THE PARENT COMPANY FINANCIAL STATEMENTS
6 I 6FF I N A N C I A L I N F O R M A T I O NN
S O C I E T E G E N E R AL E G R O U P I 2018 REGISTRATION DOCUMENT I 499
NOTE 6.4 - SUBORDINATED DEBT
ACCOUNTING PRINCIPLES
This item includes all dated or undated borrowings, whether or not in the form of securitised debt, which in the event of the liquidation of the borrowing company may only be redeemed after all other creditors have been paid.
Interest accrued and payable in respect of long-term subordinated debt, if any, is recorded as related payables and as an expense in the income statement.
(In EUR m)
Amount issued Issuance date Currency Maturity date 31.12.2017 31.12.2016
Undated subordinated capital notes
1st July 1985 EUR 348 Undated 62 62
24th November 1986 USD 500 Undated 207 235
19th December 2007 EUR 600 Undated - 468
5th April 2007 USD 1,100 Undated - 766
5th April 2007 USD 200 Undated - 60
16th June 2008 GBP 700 Undated 570 590
7th July 2008 EUR 100 Undated 100 100
4th September 2009 EUR 1,000 Undated 1,000 1,000
6th September 2013 USD 1,250 Undated 1,042 1,186
18th December 2013 USD 1,750 Undated 1,459 1,660
7th April 2014 EUR 1,000 Undated 1,000 1,000
25th June 2014 USD 1,500 Undated 1,251 1,423
29th September 2015 USD 1,250 Undated 1,042 1,186
13th September 2016 USD 1,500 Undated 1,251 1,423
Sub--total((1) 8,984 11,159
Subordinated long--term debts and notes
21st July 2000 EUR 78 31st July 2030 14 17
30th January 2003 GBP 450 30th January 2018 142 148
29th December 2003 GBP 150 30th January 2018 169 175
3rd February 2005 EUR 120 3rd February 2017 - 112
13th May 2005 EUR 100 13th May 2017 - 90
16th August 2005 EUR 226 18th August 2025 216 216
15th May 2006 EUR 135 15th May 2018 125 125
26th October 2006 EUR 120 26th October 2018 111 111
9th February 2007 EUR 124 11th February 2019 116 116
16th July 2007 EUR 135 16th July 2019 130 130
30th October 2007 EUR 134 30th October 2019 129 129
14th February 2008 EUR 225 14th February 2018 225 225
26th March 2008 EUR 550 26th March 2018 331 331
7th April 2008 EUR 250 6th April 2023 155 155
15th April 2008 EUR 321 15th April 2023 321 321
28th April 2008 EUR 50 6th April 2023 50 50
14th May 2008 EUR 150 6th April 2023 150 150
14th May 2008 EUR 50 6th April 2023 50 50
14th May 2008 EUR 90 6th April 2023 90 90
30th May 2008 EUR 79 15th April 2023 79 79
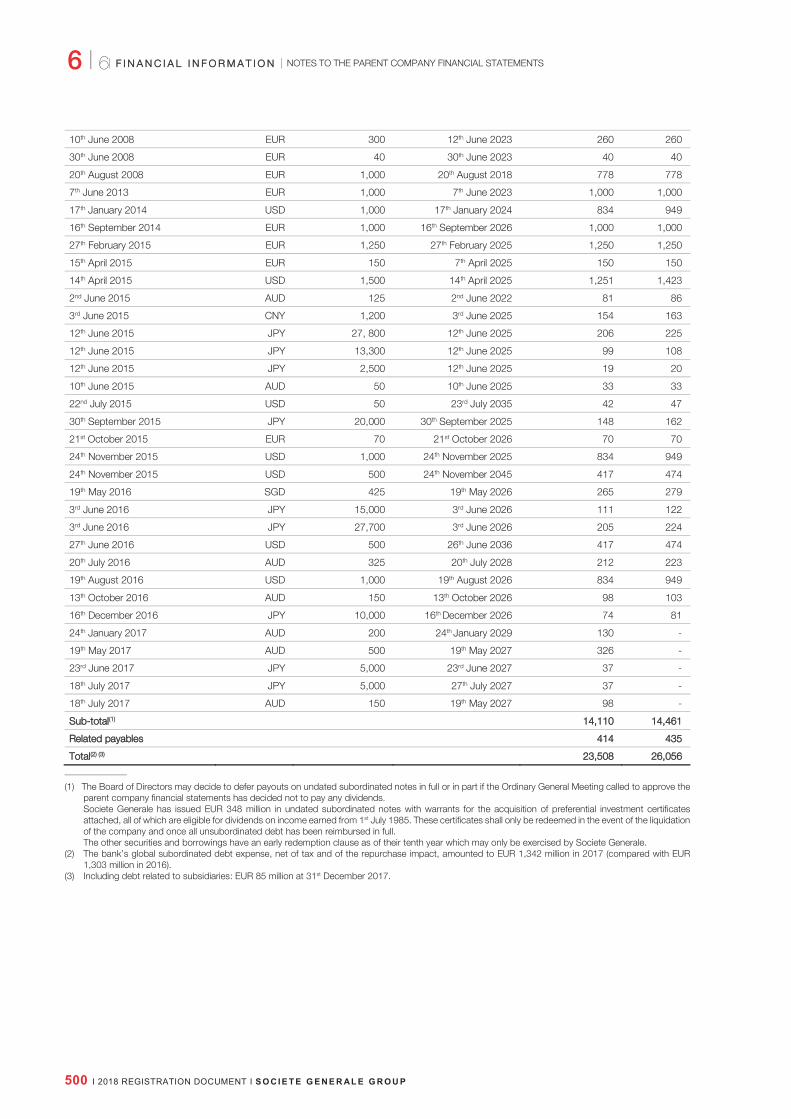
6 I 6
F I N A N C I A L I N F O R M A T I O N
500 I 2018 REGISTRATION DOCUMENT I S O C I E T E G E N E R AL E G R O U P
10th June 2008 EUR 300 12th June 2023 260 260
30th June 2008 EUR 40 30th June 2023 40 40
20th August 2008 EUR 1,000 20th August 2018 778 778
7th June 2013 EUR 1,000 7th June 2023 1,000 1,000
17th January 2014 USD 1,000 17th January 2024 834 949
16th September 2014 EUR 1,000 16th September 2026 1,000 1,000
27th February 2015 EUR 1,250 27th February 2025 1,250 1,250
15th April 2015 EUR 150 7th April 2025 150 150
14th April 2015 USD 1,500 14th April 2025 1,251 1,423
2nd June 2015 AUD 125 2nd June 2022 81 86
3rd June 2015 CNY 1,200 3rd June 2025 154 163
12th June 2015 JPY 27, 800 12th June 2025 206 225
12th June 2015 JPY 13,300 12th June 2025 99 108
12th June 2015 JPY 2,500 12th June 2025 19 20
10th June 2015 AUD 50 10th June 2025 33 33
22nd July 2015 USD 50 23rd July 2035 42 47
30th September 2015 JPY 20,000 30th September 2025 148 162
21st October 2015 EUR 70 21st October 2026 70 70
24th November 2015 USD 1,000 24th November 2025 834 949
24th November 2015 USD 500 24th November 2045 417 474
19th May 2016 SGD 425 19th May 2026 265 279
3rd June 2016 JPY 15,000 3rd June 2026 111 122
3rd June 2016 JPY 27,700 3rd June 2026 205 224
27th June 2016 USD 500 26th June 2036 417 474
20th July 2016 AUD 325 20th July 2028 212 223
19th August 2016 USD 1,000 19th August 2026 834 949
13th October 2016 AUD 150 13th October 2026 98 103
16th December 2016 JPY 10,000 16th December 2026 74 81
24th January 2017 AUD 200 24th January 2029 130 -
19th May 2017 AUD 500 19th May 2027 326 -
23rd June 2017 JPY 5,000 23rd June 2027 37 -
18th July 2017 JPY 5,000 27th July 2027 37 -
18th July 2017 AUD 150 19th May 2027 98 -
Sub--total((1) 14,110 14,461
Related payables 414 435
Total((2) (3) 23,508 26,056
(1) The Board of Directors may decide to defer payouts on undated subordinated notes in full or in part if the Ordinary General Meeting called to approve the parent company financial statements has decided not to pay any dividends. Societe Generale has issued EUR 348 million in undated subordinated notes with warrants for the acquisition of preferential investment certificates attached, all of which are eligible for dividends on income earned from 1st July 1985. These certificates shall only be redeemed in the event of the liquidation of the company and once all unsubordinated debt has been reimbursed in full. The other securities and borrowings have an early redemption clause as of their tenth year which may only be exercised by Societe Generale.
(2) The bank’s global subordinated debt expense, net of tax and of the repurchase impact, amounted to EUR 1,342 million in 2017 (compared with EUR 1,303 million in 2016).
(3) Including debt related to subsidiaries: EUR 85 million at 31st December 2017.

6
F I N A N C I A L I N F O R M A T I O N NOTES TO THE PARENT COMPANY FINANCIAL STATEMENTS
6 I 6FF I N A N C I A L I N F O R M A T I O NN
S O C I E T E G E N E R AL E G R O U P I 2018 REGISTRATION DOCUMENT I 501
NOTE 7 - OTHER INFORMATION
NOTE 7.1 - GEOGRAPHIC BREAKDOWN OF NET BANKING INCOME(1)
France Europe Americas
(In EUR m) 2017 2016 2017 2016 2017 2016
Net interest and similar income(2) 1,135 6,688 480 289 24 461
Net fee income 2,241 2,262 398 391 117 134
Net income from financial transactions 4,821 1,645 1,005 1,173 188 636
Other net operating income (977) 32 22 18 (5) (4)
Net banking income 7,220 10,627 1,905 1,871 324 1,227
Asia Africa Total
(In EUR m) 2017 2016 2017 2016 2017 2016
Net interest and similar income(2) 88 113 8 9 1,735 7,560
Net fee income 45 47 5 4 2,806 2,838
Net income from financial transactions 345 328 - (1) 6,359 3,781
Other net operating income (1) (1) - (961) 45
Net banking income 477 487 13 12 9,939 14,224
(1) Geographic regions in which NBI is booked. (2) Including dividend income and net income from lease financing and similar agreements.
6 I 6
F I N A N C I A L I N F O R M A T I O N
502 I 2018 REGISTRATION DOCUMENT I S O C I E T E G E N E R AL E G R O U P
NOTE 7.2 - TANGIBLE AND INTANGIBLE FIXED ASSETS
ACCOUNTING PRINCIPLES
Premises, equipment and other fixed assets are carried at their purchase price on the assets side of the balance sheet. Borrowing expenses incurred to fund a lengthy construction period for fixed assets are included in the acquisition cost, along with other directly attributable expenses. Investment subsidies received are deducted from the cost of the relevant assets.
Software developed internally is recorded on the assets side of the balance sheet at the amount of the direct cost of development, which includes external expenditure on hardware and services and personnel expenses which can be attributed directly to its production and preparation for use.
As soon as they are fit for use, fixed assets are depreciated over their useful life. Any residual value of the asset is deducted from its depreciable amount.
Depreciation and amortisation are recorded in the income statement under Depreciation and amortisation.
Where one or several components of a fixed asset are used for different purposes or to generate economic benefits over a different time period from the asset considered as a whole, these components are depreciated over their own useful life.
Societe Generale has applied this approach to its operating property, breaking down its assets into the following minimum components with their corresponding depreciation periods:
Infrastructure
Major structures 50 years
Doors and windows, roofing 20 years
Façades 30 years
Technical installations
Elevators
10-30 years
Electrical installations
Electricity generators
Air conditioning, extractors
Technical wiring
Security and surveillance installations
Plumbing
Fire safety equipment
Fixtures and fittings Finishings, surroundings 10 years
Depreciation periods for fixed assets other than buildings depend on their useful life, usually estimated in the following ranges:
Plant and equipment 5 years
Transport 4 years
Furniture 10-20 years
Office equipment 5-10 years
IT equipment 3-5 years
Software, developed or acquired 3-5 years
Concessions, patents, licenses, etc. 5-20 years

6
F I N A N C I A L I N F O R M A T I O N NOTES TO THE PARENT COMPANY FINANCIAL STATEMENTS
6 I 6FF I N A N C I A L I N F O R M A T I O NN
S O C I E T E G E N E R AL E G R O U P I 2018 REGISTRATION DOCUMENT I 503
1. CHANGES IN TANGIBLE AND INTANGIBLE FIXED ASSETS
(In EUR m)
Gross book value 31.12.2016 Acquisitions Disposals
Scope variation and
other movements
Gross book value 31.12.2017
Accumulated depreciation
and amortisation
2017.12
Net book value
31.12.2017
Operating assets
Intangible assets 3,113 344 (22) (44) 3,391 (2,253) 1,137
Tangible assets 2,550 237 (116) 6 2,677 (1,768) 909
Non--operating assets
Tangible assets 10 - - - 10 (7) 3
Total 5,673 581 (138) (38) 6,078 (4,028) 2,050
2. INCOME FROM LONG-TERM INVESTMENTS
ACCOUNTING PRINCIPLES
This item covers capital gains or losses realised on disposals, as well as the net allocation to depreciation for investments in operating fixed assets. Income from real-estate holdings excluding offices is recorded under Net banking income.
(In EUR m) 31.12.2017 31.12.2016
Operating fixed assets::
Gains on disposals 8 40
Losses on disposals - -
Total 8 40

6 I 6
F I N A N C I A L I N F O R M A T I O N
504 I 2018 REGISTRATION DOCUMENT I S O C I E T E G E N E R AL E G R O U P
NOTE 7.3 - PROVISIONS
ACCOUNTING PRINCIPLES
Under balance sheet liabilities, Provisions are comprised of provisions for financial instruments, disputes, employee benefits and income tax adjustments.
(In EUR m) 31.12.2017 31.12.2016
Provisions on financial instruments (See Note 2.6) 13,355 21,959
Provisions on employee benefits (See Note 4.2) 1,759 1,532
Provisions for tax adjustments (See Note 5) 110 139
Other provisions 364 77
TTotal 115,588 223,707

6
F I N A N C I A L I N F O R M A T I O N NOTES TO THE PARENT COMPANY FINANCIAL STATEMENTS
6 I 6FF I N A N C I A L I N F O R M A T I O NN
S O C I E T E G E N E R AL E G R O U P I 2018 REGISTRATION DOCUMENT I 505
NOTE 7.4 - BREAKDOWN OF ASSETS AND LIABILITIES BY TERM TO MATURITY
Outstanding on 31.12.2017
(In EUR m)
Less than 3 months
3 months to one year
1 to 5 years
More than 5 years
Intercompany eliminations: Societe Generale Paris/branches Total
Assets
Due from banks 186,820 50,698 59,485 24,053 (129,114) 191,942
Customer loans((1) 144,583 60,998 112,062 72,856 (187) 390,312
Bonds and other debt securities:
Trading securities 5,241 37,691 4,847 1,049 - 48,828
Short-term investment securities 5,558 4,541 47 101 - 10,247
Long-term investment securities 6 2,506 4,223 27,478 34,213
Total 342,208 156,434 180,664 125,537 (129,301) 675,542
Liabilities
Due to banks 187,229 57,254 93,851 33,526 (130,074) 241,786
Customer deposits 300,139 34,954 48,264 77,500 (1,167) 459,690
Liabilities in the form of securities issued
32,965 16,107 20,960 13,079 - 83,111
Total 520,333 108,315 163,075 124,105 (131,241) 784,587
(1) Including lease financing and similar agreements.

6 I 6
F I N A N C I A L I N F O R M A T I O N
506 I 2018 REGISTRATION DOCUMENT I S O C I E T E G E N E R AL E G R O U P
NOTE 7.5 - TRANSACTIONS IN FOREIGN CURRENCIES
ACCOUNTING PRINCIPLES
Gains and losses arising from ordinary activities in foreign currencies are recognised in the income statement. Outright forward foreign exchange transactions and those used to hedge other forward foreign exchange transactions are valued on the basis of the forward foreign exchange rate of the relevant currency for the remaining maturity. Spot and other forward foreign exchange positions are revalued on a monthly basis using official month-end spot rates. Unrealised gains and losses are recognised in the income statement. Premiums and discounts resulting from hedged forward foreign exchange transactions are amortised to income on a straight-line basis over the remaining term to maturity of these transactions.
31.12.2017 31.12.2016
(In EUR m)
Assets Liabilities
Foreign exchange bought, not yet received
Foreign exchange
sold, not yet
delivered
Assets Liabilities
Foreign exchange
bought, not yet received
Foreign exchange
sold, not yet
delivered
EUR 533,292 560,212 328,709 330,098 661,050 679,273 309,054 328,178
USD 400,419 374,414 629,816 587,358 319,802 301,708 638,757 560,706
GBP 59,935 60,098 136,767 125,222 51,516 52,310 107,168 100,271
JPY 80,826 78,435 88,130 111,884 83,850 82,549 80,448 117,392
Other currencies
108,186 109,499 280,683 302,420 77,335 77,713 254,628 271,725
TTotal 11,182,658 11,182,658 11,464,105 11,456,982 11,193,553 11,193,553 11,390,055 11,378,272
F I N A N C I A L
6
F I N A N C I A L I N F O R M A T I O N
S O C I E T E G E N E R AL E G R O U P I 2018 REGISTRATION DOCUMENT I 507
NOTE 7.6 - OPERATIONS IN UNCOOPERATIVE STATES OR TERRITORIES
Since 2003, Societe Generale has defined strict internal rules to prevent the development of operations in countries qualified as uncooperative tax heavens by the OECD. Any operation, or development of new activities as part of existing operations, may only be authorised by decision of the General Management after approval of the Corporate Secretariat and the Risk Division.
Since 2010, Societe Generale has decided to close and therefore took the necessary steps to close all the Group’s operations in
Countries and Territories deemed non-cooperative by France, the list of which was updated by the Ministerial act of 8th April 2016 (published on 10th April 2016).
In 2017, Societe Generale neither directly nor indirectly held any active sites in these countries. On 11th October 2017, Societe Generale obtained the termination of its unused licence in Brunei.
NOTES TO THE PARENT COMPANY FINANCIAL STATEMENTS FF I N A N C I A L 6 I 6

6 I 6 NOTES TO THE PARENT COMPANY FINANCIAL STATEMENTS FFINANCIAL INFORMATIONN
508I 2018 REGISTRATION DOCUMENT I S O C I E T E G E N E R AL E G R O U P
NOTE 7.7 - TABLE OF SUBSIDIARIES AND AFFILIATES
22017 22017 22017 22017
(In thousands of euros or local currency)
BBook value of sshares held
CCompany/Head Office or Establishment AActivity/Division
RRegistered ccapital (local
ccurrency)((1)
SShareholders’ eequity other tthan capital
((local ccurrency)((1)
SShare of ccapital held
((%) GGross ((EUR) NNet (EUR)
II -- IINFORMATION ON INVESTMENTS WWITH A BOOK VALUE IN EXCESS OF 1% OF SOCIETE GENERALE’S SHARE CAPITAL
AA) Subsidiaries (more than 50% owned by Societe Generale) SSG FINANCIAL SERVICES HOLDING PPortfolio management
29, boulevard Haussmann - 75009 Paris - France Corporate Centre
EUR 2,662,976 179,887 100.00 3,157,285 3,157,285
SSG AMERICAS SECURITIES HOLDINGS, LLC BBrokerage
C/O The Corporation Trust Company 1209 Orange Street 19801 Wilmington - Delaware - USA
Global Banking and Investor Solutions
USD 1,430,976 1,126,965 100.00 2,986,495 2,986,495
IINTER EUROPE CONSEIL CCredit institution
29, boulevard Haussmann - 75009 Paris - France Global Banking and Investor Solutions
EUR 764,983 42,141 100.00 3,852,866 1,166,704
GGENEFINANCE PPortfolio management
29, boulevard Haussmann - 75009 Paris - France Corporate Centre
EUR 1,000,000 236,621 100.00 1,076,025 1,076,025
SSOCIETE GENERALE EQUIPMENT FINANCE SA PPortfolio management
17, cours Valmy - 92800 Puteaux - France International Retail Banking and Financial Services
EUR 750,355 533,682 100.00 754,201 754,201
SSOCIETE GENERALE SECURITIES SERVICES SPA CCredit institution
Via Benigno Crespi, 19 A - 20159 Milan - Italy Global Banking and Investor Solutions
EUR 111,309 200,430 100.00 745,062 657,685
SSG KKLEINWORT HAMBROS LIMITED AAsset management
St James’ Square, SW1Y 4JU - London – United Kingdom
Global Banking and Investor Solutions
GBP 518,710 157,820 100.00 650,639 650,639
SSOCIETE GENERALE REAL ESTATE RReal estate and real estate ffinancing
29, boulevard Haussmann - 75009 Paris - France French Retail Banking
EUR 327,112 37,854 100.00 586,505 586,505
SSociete Generale Securities Japan Limited BBrokerage
1-1, Marunouchi 1-chome, Chiyoda-ku, Tokyo, Japan Global Banking and Investor Solutions JPY 35,765,000 41,315,000 100.00 576,194 576,194
SSOGEMARCHE Real estate
17, cours Valmy - 92800 Puteaux - France Corporate Centre
EUR 500,000 (24,802) 100.00 500,000 500,000

6
NOTES TO THE PARENT COMPANY FINANCIAL STATEMENTS 6 I 6 FFINANCIAL INFORMATIONN
S O C I E T E G E N E R AL E G R O U P I 2018 REGISTRATION DOCUMENT I 509
2017 2017 2017 2017 2017 2017
Unreimbursed loans and advances granted
by the company (in EUR)
Guarantees given by the Company (in
EUR)
Revenue excluding tax for the
last financial year (local currency)(1) (2) (3)
Net income (loss) for the last
financial year (local currency)(1) (3)
Dividends received by the
Company during the year in (EUR)
Remarks / Revaluation differences
2,558,134 - 975,476 874,279 94,105
533,645 - 528,643 (44,381) - 1 EUR = 1.1993 USD
3,369,685 - 632,531 346,120 205,589
- - 838,397 66,822 305,000
156,526 - 29,502 196 -
40,000 150,000 160,001 29,075 26,798
922 8,850 193,342 2,720 - 1 EUR = 0.8872 GBP
4,300 - 20,619 25,622 26,947
780,683 - 24,317,000 6,685,000 - 1 EUR = 135.01 JPY
35,000 - 24,200 (246) -

6 I 6 NOTES TO THE PARENT COMPANY FINANCIAL STATEMENTS FFINANCIAL INFORMATIONN
5 I 2018 REGISTRATION DOCUMENT I S O C I E T E G E N E R A L E G R O U P
22017 22017 22017 22017
(In thousands of euros or local currency)
RRegisteredd ccapital (local
ccurrency)((1)
SShareholders’’ eequity other thann
ccapital (local ccurrency)((1)
SShare of capital hheld (%)
BBook vvalue of shares held
GGross ((EUR) NNet (EUR)
CCompany/Head Office or Establishment AActivity/Division SSOCIETE GENERALE (CHINA) LIMITED IInternational Retail banking
Taikang International Tower 18th floor,2, Wudinghou Street, Xicheng District - 100033 Beijing - China
Global Banking and Investor Solutions
CNY 4,000,000 (372,392) 100.00 421,720 399,621
BBANCO SOCIETE GENERALE BRASIL S/A IInvestment banking
Avenida Paulista, 2300 - Cerqueira Cesar - Sao Paulo - SP CEP 01310-300 - Brazil Global Banking and Investor
Solutions BRL 2,956,929 88,088 100.00 971,063 292,942
SSOCIETE GENERALE BANKA SRBIJA IInternational Retail bbanking
Bulevar Zorana Djindjica 50 a/b, 11070 Novi Beograd - Serbia
International Retail Banking and Financial Services RSD 23,724,274 14,491,176 100.00 258,370 258,370
VVALMINVEST OOffice space
29, boulevard Haussmann - 75009 Paris - France Corporate Centre EUR 248,877 13,833 100.00 249,427 249,427
SSOGECAMPUS RReal estate
17, cours Valmy - 92800 Puteaux - France Corporate Centre EUR 241,284 (1,916) 100.00 241,284 241,284
LLYXOR ASSET MANAGEMENT AAlternative asset mmanagement
17, cours Valmy - 92800 Puteaux - France Global Banking and Investor Solutions
EUR 161,106 57,995 100.00 217,348 217,348
FFIDITALIA SPA CConsumer finance
Via G. Ciardi, 9 - 20149 Milan - Italy International Retail Banking and Financial Services
EUR 130,000 116,690 100.00 335,169 206,591
GGENEGIS I OOffice space
29, boulevard Haussmann - 75009 Paris - France Corporate Centre EUR 192,900 16,159 100.00 196,061 196,061
SSG SECURITIES KOREA CO, LTD BBusiness consulting
(1-ga, Shinmun-ro),14F 82, Saemunan-ro, Jongno-gu - Seoul – South Korea
Global Banking and Investor Solutions
KRW 205,500,000 26,605,470 100.00 160,907 160,907
CCOMPAGNIE FONCIERE DE LA MEDITERRANEE ((CFM)
OOffice space
29, boulevard Haussmann - 75009 Paris - France Corporate Centre EUR 76,627 3,744 100.00 155,837 154,152
SSOGINFO -- SSOCIETE DE GESTION ET DD’INVESTISSEMENTS
OOffice space
29, boulevard Haussmann - 75009 Paris - France French Retail Banking EUR 123,411 191,165 100.00 148,720 148,720
SSOCIETE GENERALE ALGERIE IInternational retail banking
Résidence EL KERMA - 16105 Gué de Constantine - Wilaya d’Alger – Algeria
International Retail Banking and Financial Services
DZD 10,000,000 26,234,674 100.00 110,524 110,524

6
NOTES TO THE PARENT COMPANY FINANCIAL STATEMENTS 6 I 6 FFINANCIAL INFORMATIONN
S O C I E T E G E N E R A L E G R O U P I 2018 REGISTRATION DOCUMENT I
22017 22017 22017 22017 22017 22017
UUnreimbursed loans and aadvances granted by the
ccompany ((in EUR)
GGuarantees given bby tthe Company (in
EEUR)
RRevenue excluding ttax for the
llast financial year ((local currency)((1) (2) (3)
NNet income (loss) ffor the last
ffinancial year ((local currency)((1) (3)
DDividends rreceived by the
CCompany during tthe year in (EUR)
RRemarks / RRevaluation ddifferences
52,188 833,820 343,031 52,593 - 1 EUR = 7.8044 CNY
1,282,357 5,496 231,453 (1,657,829) - 1 EUR = 3.9729 BRL
276,392 29,832 13,463,993 4,657,863 45,809 1 EUR = 118.2191 RSD
- - 651 3,036 2,770
157,699 - 22,738 3,458 -
- - 122,757 (1,770) 44,698
3,473,404 - 179,220 41,435 -
40,335 - 198,589 (61) 4,160
- - 104,033,673 49,717,053 37,700 1 EUR = 1279.61 KRW
- - 744 1,400 1,906
20,000 - 31,477 8,508 -
- - 20,319,865 8,064,015 24,020 1 EUR = 137.7155 DZD

6 I 6 NOTES TO THE PARENT COMPANY FINANCIAL STATEMENTS FFINANCIAL INFORMATIONN
5 I 2018 REGISTRATION DOCUMENT I S O C I E T E G E N E R A L E G R O U P
2017 2017 2017 2017
(In thousands of euros or local currency) Registered capital (local
currency)(1)
Shareholders’ equity other than
capital (local
currency)(1)
Share of capital held(%)
Book value of shares held
Gross (EUR)
Net(EUR) CCompany/Head Office or Establishment AActivity/Division
OORPAVIMOB RReal estate and real eestate financing
117, cours Valmy -- 992800 Puteaux -- FFrance Global Banking and Investor Solutions
EUR 100,253 5,391 100.00 100,253 100,253
SSOCIETE GENERALE CAPITAL CANADA Inc BBrokerage
11501 Avenue McGill College -- SSuite 1800 HH3A 3M8 -- MMontréal --CCanada
Global Banking and Investor Solutions
CAD 150,000 58,443 100.00 98,719 98,719
SSOCIETE IMMOBILIERE DU 29 BBOULEVARD HAUSSMANN
OOffice space
229, boulevard Haussmann -- 775009 Paris -- FFrance
Corporate Centre EUR 90,030 2,778 100.00 89,992 89,992
SSG SECURITIES (SINGAPORE) PTE. LTD. BBrokerage
88 Marina Boulevard -- ##12--001 -- MMarina Bay ffinancial Centre Tower 1 -- 0018981 -- SSingapore
Global Banking and Investor Solutions SGD 99,156 9,394 100.00 93,970 64,400
SSG AMERICAS, INC. Investment banking
C/O The Corporation Trust Company 1209 Orange Street 19801 Wilmington - Delaware - USA
Global Banking and Investor Solutions USD 0 443,962 100.00 1,612,723 63,601
SSG FACTORING SPA Factoring
Via Trivulzio, 7 - 20146 Milan - Italy Global Banking and Investor Solutions
EUR 11,801 29,963 100.00 46,100 46,100
SSOCIETE GGENERALE SECURITIES AAUSTRALIA PTY LTD
Brokerage on equity markets
Level 23 - 400 George Street - Sydney - NSW 2000 - Australia
Global Banking and Investor Solutions
AUD 100,000 (28,625) 100.00 62,745 41,035
IINORA LIFE LTD Life insurance IFSC House International Financial Services Center - Dublin 1 - Ireland
Global Banking and Investor Solutions
EUR 36,500 (16,004) 100.00 36,500 20,373
SSOCIETE GENERALE ASIA LTD Merchant bank Level 38 - Three Pacific Place 1 Queen’s Road - East Hong-Kong - Hong Kong
Global Banking and Investor Solutions
HKD 150,000 315 100.00 17,068 17,068
SSG AUSTRALIA HOLDINGS LTD Portfolio management Level 25, 1-7 Bligh Street - Sydney, NSW 2000 - Australia
Global Banking and Investor Solutions
AUD 19,500 2,338 100.00 12,551 12,551
SSG SECURITIES ASIA INTERNATIONAL HHOLDINGS LTD (HONG--KKONG) Investment banking Level 38 - Three Pacific Place 1 Queen’s Road - East Hong-Kong - Hong Kong
Global Banking and Investor Solutions
USD 154,991 137,088 100.00 146,513 146,513
SSOCIETE GENERALE IMMOBEL Real estate 11 Rue des Colonies - 1000 Brussels - Belgium
Global Banking and Investor Solutions
EUR 50,062 82,239 100.00 50,061 50,061
DDESCARTES TRADING Proprietary trading
17, cours Valmy - 92800 Puteaux - France Global Banking and Investor Solutions
EUR 377,000 (16,696) 100.00 376,987 376,987

6
NOTES TO THE PARENT COMPANY FINANCIAL STATEMENTS 6 I 6 FFINANCIAL INFORMATIONN
S O C I E T E G E N E R A L E G R O U P I 2018 REGISTRATION DOCUMENT I 5
2017 2017 2017 2017 2017 2017
Unreimbursed loans and advances
granted by the company (in EUR)
Guarantees given by the Company
(in EUR)
Revenue excluding tax for the
last financial year (local currency)(1) (2) (3)
Net income (loss) for the last
financial year (local currency)(1) (3)
Dividends received by the
Company during the year in (EUR)
Remarks / Revaluation differences
- - 18,156 3,377 13,300
9,131 226,344 40,271 5,378 - 1 EUR = 1.5039 CAD
- - 7,364 4,409 2,918
12,507 45,860 32,407 20,132 - 1 EUR = 1.6024 SGD
capital = 1 USD
- - 890 (6,147) - 1 EUR = 1.1993 USD
677,078 899,400 10,229 3,236 2,712
104,262 104,262 20,526 (3,333) - 1 EUR = 1.5346 AUD
- - 3 ,205 323 -
24,753 - 25,379 30,136 4,317 1 EUR = 9.3720 HKD
- - 4,724 (439) 2,851 1 EUR = 1.5346 AUD
166,008 - 557,649 270,592 138,185 1 EUR = 1.1993 USD
- - 4,325 2,888 -
62,000 - 2,341,371 14,345 -

6 I 6 NOTES TO THE PARENT COMPANY FINANCIAL STATEMENTS FFINANCIAL INFORMATIONN
5 I 2018 REGISTRATION DOCUMENT I S O C I E T E G E N E R A L E G R O U P
2017 2017 2017 2017
(In thousands of euros or local currency)
Registered capital
(local currency)(1)
Shareholders’ equity otherthan capital (local
currency)(1)
Share ofcapital held
(%)
Book value of shares held
Gross (EUR) Net (EUR)
CCompany/Head Office or EEstablishment AActivity/Division SSOCIETE GENERALE SFH Credit institution
17, cours Valmy - 92800 Puteaux - France
Global Banking and Investor Solutions
EUR 375,000 125,141 100.00 375,000 375,000
BBOURSORAMA SA Online brokerage
18, Quai du Point du Jour - 92100 Boulogne-Billancourt - France French Retail Banking
EUR 35,548 500,468 100.00 783,843 783,843
SSOCIETE GENERALE SCF Mortgages 17, cours Valmy - 92800 Puteaux - France
Global Banking and Investor Solutions
EUR 150,000 80,527 100.00 150,000 150,000
SSociete Generale International Limited Brokerage and clearing 10 Bishops Square - London E1 6EG – United Kingdom
Global Banking and Investor Solutions
GBP 1,000,000 49,735 100.00 1,416,486 1,416,486
CCREDIT DU NORD French retail banking 28, place Rihour - 59800 Lille - France French Retail Banking
EUR 890,263 1,878,414 100.00 1,410,255 1,410,255
SSOCIETE GENERALE SECURITIES SSERVICES HOLDING Portfolio management 17, cours Valmy - 92800 Puteaux - France
Global Banking and Investor Solutions
EUR 12,487 0 100.00 237,555 18,659
SSG EUROPEAN MORTGAGE IINVESTMENTS Portfolio management 17, cours Valmy - 92800 Puteaux - France
Global Banking and Investor Solutions
EUR 1,000 (718) 99.99 25,604 25,604
RROSBANK International retail banking
34, Masha Poryvaeva Street 107078 - Moscow - Russia
International Retail Banking and Financial Services
RUB 17,586,914 99,063,762 99.95 3,789,027 2,201,907
SSOCIETE DE LA RUE EDOUARD VII Office space 29, boulevard Haussmann - 75009 Paris - France Corporate Centre
EUR 11,396 860 99.91 59,612 22,227
SSG EXPRESS BANK International retail banking
92, Bld VI Varnentchik - 9000 Varna - Bulgaria
International Retail Banking and Financial Services
BGN 33,674 652,137 99.74 62,357 62,357
SSOCIETE GENERALE INVESTMENTS ((U.K.) LIMITED Investment banking SG House, 41 Tower Hill, EC3N 4SG - London – United Kingdom
Global Banking and Investor Solutions
GBP 157,820 101,434 98.96 191,316 191,316
SSKB BANKA D.D. LJUBLJANA International retail banking
Adjovscina,4 - 1513 Ljubljana - Slovenia
International Retail Banking and Financial Services
EUR 52,785 286,633 97.58 220,226 220,226
SSOCIETE GENERALE MAURITANIE International retail banking
Ilot A, n°652 Nouakchott - Mauritania
International Retail Banking and Financial Services
MRO 6,000,000 5,741,432 95.50 20,361 20,361
SSOCIETE GENERALE BANKA MMONTENEGRO A.D. International retail banking
Bulevar Revolucije 17 - 81000 Podgorica - Montenegro
International Retail Banking and Financial Services
EUR 24,731 37,494 90.56 28,819 28,819
BBANKA SOCIETE GENERALE AALBANIA SH.A International retail banking
BLV Deshmoret e Kombit Blu Towers - Tower1, 9th floor -Tirana - Albania
International Retail Banking and Financial Services
ALL 6,740,900 2,303,944 88.89 70,149 59,675
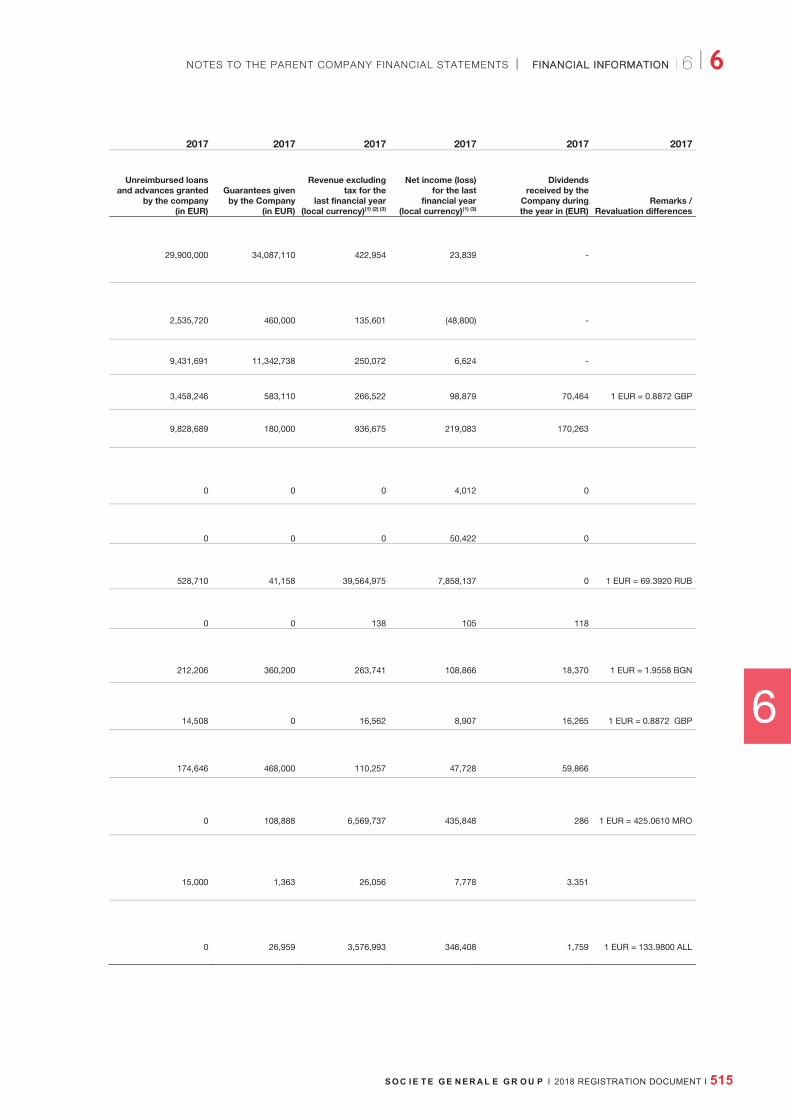
6
NOTES TO THE PARENT COMPANY FINANCIAL STATEMENTS 6 I 6 FFINANCIAL INFORMATIONN
S O C I E T E G E N E R A L E G R O U P I 2018 REGISTRATION DOCUMENT I 5
2017 2017 2017 2017 2017 2017
Unreimbursed loans and advances granted
by the company (in EUR)
Guarantees given by the Company
(in EUR)
Revenue excluding tax for the
last financial year (local currency)(1) (2) (3)
Net income (loss) for the last
financial year (local currency)(1) (3)
Dividends received by the
Company during the year in (EUR)
Remarks / Revaluation differences
29,900,000 34,087,110 422,954 23,839 -
2,535,720 460,000 135,601 (48,800) -
9,431,691 11,342,738 250,072 6,624 -
3,458,246 583,110 266,522 98,879 70,464 1 EUR = 0.8872 GBP
9,828,689 180,000 936,675 219,083 170,263
0 0 0 4,012 0
0 0 0 50,422 0
528,710 41,158 39,564,975 7,858,137 0 1 EUR = 69.3920 RUB
0 0 138 105 118
212,206 360,200 263,741 108,866 18,370 1 EUR = 1.9558 BGN
14,508 0 16,562 8,907 16,265 1 EUR = 0.8872 GBP
174,646 468,000 110,257 47,728 59,866
0 108,888 6,569,737 435,848 286 1 EUR = 425.0610 MRO
15,000 1,363 26,056 7,778 3,351
0 26,959 3,576,993 346,408 1,759 1 EUR = 133.9800 ALL

6 I 6 NOTES TO THE PARENT COMPANY FINANCIAL STATEMENTS FFINANCIAL INFORMATIONN
5 I 2018 REGISTRATION DOCUMENT I S O C I E T E G E N E R A L E G R O U P
2017 2017 2017 2017
(In thousands of euros or local currency) Registered capital (local
currency)(1)
Shareholders’ equity other
than capital (local
currency)(1)
Share ofcapital held
(%)
Book value of shares held
Gross (EUR) Net (EUR)CCompany/Head Office or Establishment AActivity/Division
AALD AAutomobile leasing aand financing
15, allée de l’Europe - 92110 Clichy sur Seine - France
International Retail Banking and Financial Services
EUR 606,155 581,761 79.82 1,156,422 1,156,422
BBANQUE DE POLYNESIE RRetail banking
355 Bd Pomaré, BP 530, 98713 Papeete - Tahiti – French Polynesia
International Retail Banking and Financial Services
XPF 1,380,000 7,800,136 72.10 12,397 12,397
SSOCIETE GENERALE DE BANQUES EN COTE DD’IVOIRE
IInternational retail bbanking
5 & 7, avenue J. Anoma, 01 BP 1355 - Abidjan 01 - Côte d’Ivoire
International Retail Banking and Financial Services
XOF 15,555,555 99,785,111 71.84 30,504 30,504
OOHRIDSKA BANKA AD SKOPJE IInternational retail bbanking
Orce Nikolov Str. No.54, Skopje-Centar - Centar - Macedonia
International Retail Banking and Financial Services
MKD 1,162,253 2,084,285 71.33 30,371 30,371
MMOBIASBANCA -- SSOCIETE GENERALE GGROUP
IInternational retail bbanking
Bd. Stefan cel Mare 81A, MD-2012 mun.-Chisinau – Republic of Moldova
International Retail Banking and Financial Services
MDL 99,944 1,111,991 67.85 24,960 24,960
BBANCO SOCIETE GENERALE MOÇAMBIQUE SSA
IInternational retail bbanking
Av. Julius Nyerere no. 140 , 1568 - Maputo - Mozambique
International Retail Banking and Financial Services
MZN 1,897,200 1,266,813 65.00 25,711 15,707
BBANKA A.S IInternational retail bbanking
Na Prikope 33 - Building Register number 969 - 114 07 Praha 1 – Czech Republic
International Retail Banking and Financial Services
CZK 19,004,926 61,547,786 60.35 1,365,563 1,365,563
BBRD -- SSOCIETE GENERALE GROUP IInternational retail bbanking
B-dul Ion Mihalache nr. 1-7 Sector 1 - Bucharest - Romania
International Retail Banking and Financial Services
RON 696,902 5,343,997 60.17 223,947 223,947
SSOCIETE GENERALE CAMEROUN IInternational retail bbanking
78 Avenue Joss, BP 4042 - Douala - Cameroon International Retail Banking and Financial Services
XAF 12,500,000 40,033,437 58.08 16,940 16,940
GGENEFIM RReal estate lease ffinance
29, boulevard Haussmann - 75009 Paris - France
French Retail Banking EUR 72,779 29,130 57.62 89,846 89,846
SSG MMAROCAINE DE BANQUES IInternational retail bbanking
55, boulevard Abdelmoumen - Casablanca - Morocco
International Retail Banking and Financial Services
MAD 2,050,000 7,796,530 57.53 138,231 138,231
UUNION INTERNATIONALE DE BANQUES IInternational rretail bbanking
65, avenue Habib Bourguiba - 1000A Tunis - Tunisia
International Retail Banking and Financial Services
TND 172,800 165,867 52.34 153,211 153,211

6
NOTES TO THE PARENT COMPANY FINANCIAL STATEMENTS 6 I 6 FFINANCIAL INFORMATIONN
S O C I E T E G E N E R A L E G R O U P I 2018 REGISTRATION DOCUMENT I
2017 2017 2017 2017 2017 2017
Unreimbursed loans and advances granted by the
company (in EUR)
Guarantees given by the Company
(in EUR)
Revenue excluding tax for the
last financial year (local currency)(1) (2) (3)
Net income (loss) for the last
financial year (local currency)(1) (3)
Dividends received by the
Company during the year in (EUR)
Remarks / Revaluation differences
1,922,000 305 87,802 41,399 155,580
7,600 99,519 5,785,454 1,236,472 4,797 1 EUR = 119.3317 XPF
129,106 40,808 105,713,812 40,216,435 19,889 1 EUR = 655.9570 XAF
29,000 2,816 1,645,731 164,068 492 1 EUR = 61.5164 MKD
0 2,370 620,385 227,195 4,979 1 EUR = 20.5328 MDL
0 1,764 420,637 (339,886) 0 1 EUR = 71.0462 MZN
1,123,824 308,091 29,961,499 14,920,630 173,566 1 EUR = 25.5350 CZK
225,022 184,732 2,675,706 1,416,926 67,039 1 EUR = 4.6585 RON
0 2,142,287 59,663,272 15,141,870 7,317 1 EUR = 655.9570 XAF
2,266,529 450,377 44,673 22,292 8,047
721,122 3,915,975 4,224,683 985,633 9,111 1 EUR = 11.2063 MAD
26,924 140,836 288,914 88,788 3,808 1 EUR = 2.9714 TND

6 I 6 NOTES TO THE PARENT COMPANY FINANCIAL STATEMENTS FFINANCIAL INFORMATIONN
5 8I 2018 REGISTRATION DOCUMENT I S O C I E T E G E N E R A L E G R O U P
2017 2017 2017 2017
(In thousands of euros or local currency) Registered
capital (local currency)(1)
Shareholders’ equity other than capital
(local currency)(1)
Share of capital held
(%)
Book value of shares held
Gross(EUR) Net (EUR) CCompany/Head OOffice or Establishment AActivity/Division
BB) Affiliates (10% to 50% owned by Societe Generale) SSA SOGEPARTICIPATIONS PPortfolio management
29, boulevard Haussmann - 75009 Paris - France
Corporate Centre EUR 411,267 306,565 24.58 234,000 234,000
SSOCIETE GENERALE CALÉDONIENNE DE BBANQUE
RRetail banking
44, rue de l’Alma BP G2 98848 Nouméa cedex – New Caledonia
International Retail Banking and Financial Services
XPF 1,068,375 14,172,065 20.60 16,266 16,266
CCAISSE DDE REFINANCEMENT DE L’HABITAT HHousing loan rrefinancing
35, rue de la Boetie - 75008 Paris - France Corporate Centre EUR 539,995 22,580 14.82 83,288 83,288
CCREDIT LOGEMENT CCredit institution
50, boulevard Sébastopol - 75003 Paris - France
Corporate Centre EUR 1,259,850 490,799 13.50 171,037 171,037
(1) For foreign subsidiaries and affiliates, shareholders’ equity is booked in the Group consolidated financial statements in their consolidated reporting currency.
(2) For banking and finance subsidiaries, revenue refers to net banking income. (3) Financial statements not yet audited for French companies.

6
NOTES TO THE PARENT COMPANY FINANCIAL STATEMENTS 6 I 6 FFINANCIAL INFORMATIONN
S O C I E T E G E N E R A L E G R O U P I 2018 REGISTRATION DOCUMENT I 9
2017 2017 2017 2017 2017 2017
Unreimbursed loans and advances granted
by the company (in EUR)
Guarantees given by the Company
(in EUR)
Revenue excluding tax for the
last financial year (local currency)(1) (2) (3)
Net income (loss) for the last
financial year (local currency)(1) (3)
Dividends received by the
Company during the year in (EUR)
Remarks / Revaluation differences
300,000 0 341,535 333,831 12,382
59,745 77,036 9,152,388 2,780,177 4,195 1 EUR = 119.3317 XPF
0 0 1,323,841 6 0
398,606 0 345,467 120,607 13,825

6 I 6 NOTES TO THE PARENT COMPANY FINANCIAL STATEMENTS FFINANCIAL INFORMATIONN
5 I 2018 REGISTRATION DOCUMENT I S O C I E T E G E N E R A L E G R O U P
TABLE OF SUBSIDIARIES AND AFFILIATES (CONT.)
Book value of shares held
Unreimbursed loans and advances made
by the Company Guarantee given by
the Company Dividends received
during the year Remarks Gross Net (In thousands of euros)
II - INFORMATION CONCERNING OTHER SUBSIDIARIES AND AFFILIATES
AA) Subsidiaries not included in paragraph 1:
1) French subsidiaries 56,179 52,323 6,273,334 56,530 109,482 Revaluation difference:
2) Foreign subsidiaries 511,623 80,558 227,118 9,760 99,502 Revaluation difference: 1,447
BB) Affiliates not included in paragraph 1:
1) French companies 6,420 5,561 75,000 - 583 Revaluation difference:
2) Foreign companies 9,797 9,797 14,921 - 4,814 Revaluation difference:
584,019 148,239 6,590,373 66,290 214,381

6
NOTES TO THE PARENT COMPANY FINANCIAL STATEMENTS 6 I 6 FFINANCIAL INFORMATIONN
S O C I E T E G E N E R AL E G R O U P I 2018 REGISTRATION DOCUMENT I 521
NOTE 8 - INFORMATION ON RISKS AND LITIGATION Every quarter, Societe Generale reviews in detail the disputes presenting a significant risk. These disputes may lead to the recording of a provision if it becomes probable or certain that the Group will incur an outflow of resources for the benefit of a third party without receiving at least the equivalent value in exchange.
For each of the disputes described in the present Chapter, no detailed information can be disclosed on either the recording or the amount of a specific provision given that such disclosure would likely seriously prejudice the outcome of the disputes in question.
Additionally, to take into account the development of a global risk of outflows regarding some ongoing judicial investigations and proceedings in the US (such as the Office of Foreign Assets Control) and with European authorities, as well as the dispute on the French “précompte”, the Group has recorded a provision for disputes among its liabilities which is disclosed in Note 2.6 to the annual financial statements.
Beginning in 2006, Societe Generale, along with numerousother banks, financial institutions, and brokers, receivedrequests for information from the US Internal Revenue Service, the Securities and Exchange Commission (“SEC”) and theAntitrust Division of the U.S. Department of Justice (“DOJ”),focused on alleged noncompliance with various laws andregulations relating to the provision to governmental entities ofGuaranteed Investment Contracts (“GICs”) and relatedproducts in connection with the issuance of tax-exemptmunicipal bonds. Societe Generale has cooperated with theUS authorities.
On 24th October 2012, the Court of Appeal of Paris confirmed the first judgment delivered on 5th October 2010, finding J.Kerviel guilty of breach of trust, fraudulent insertion of data into a computer system, forgery and use of forged documents. J.Kerviel was sentenced to serve a prison sentence of five years, two years of which are suspended, and was ordered to payEUR 4.9 billion as damages to the bank. On 19th March 2014,the Supreme Court confirmed the criminal liability of J. Kerviel. This decision puts an end to the criminal proceedings. On thecivil front, the Supreme Court has departed from its traditional line of case law regarding the compensation of victims ofcriminal offences against property and remanded the case tothe Versailles Court of Appeal for it to rule on the amount ofdamages. On 23rd September 2016, the Versailles Court ofAppeal rejected J. Kerviel’s request for an expertdetermination of the damage suffered by Societe Generale,and therefore confirmed that the accounting losses sufferedby the Bank as a result of his criminal conduct amount to EUR 4.9 billion. It also declared J. Kerviel partially responsible forthe damage caused to Societe Generale and sentenced himto pay to Societe Generale EUR 1 million. Societe Generaleand J. Kerviel did not appeal before the Supreme Court.Societe Generale considers that this decision has no impacton its tax situation. However, as indicated by the Minister ofthe Economy and Finance in September 2016, the taxauthorities have examined the tax consequences of this bookloss and recently confirmed that they intended to call intoquestion the deductibility of the loss caused by the actions ofJ. Kerviel, amounting to EUR 4.9 billion. This proposed taxrectification has no immediate effect and will possibly have tobe confirmed by an adjustment notice sent by the taxauthorities when Societe Generale is in a position to deductthe tax loss carryforwards arising from the loss from its taxable income. Such a situation will not occur for several yearsaccording to the bank’s forecasts. In view of the 2011 opinion
of the French Supreme Administrative Court (Conseil d’Etat) and its established case law which was recently confirmed again in this regard, Societe Generale considers that there is no need to provision the corresponding deferred tax assets. In the event that the authorities decide, in due course, to confirm their current position, the Societe Generale Group will not fail to assert its rights before the competent courts.
Between 2003 and 2008, Societe Generale set up goldconsignment lines with the Turkish group Goldas. In February2008, Societe Generale was alerted to a risk of fraud andembezzlement of gold stocks held by Goldas. Thesesuspicions were rapidly confirmed following the failure byGoldas to pay or refund gold worth EUR 466.4 million. Societe Generale brought civil proceedings against its insurers andvarious Goldas Group entities. Goldas launched variousproceedings in Turkey and in the UK againstSociete Generale. In the action brought by Societe Generaleagainst Goldas in the UK, Goldas applied to have the actionof SG struck-out and applied to the UK court for damages. On 3rd April 2017, the UK court granted both applications and will, after an inquiry into damages, rule on the amount due toGoldas, if any. On 14th September 2017, Societe Generale has been granted leave to appeal by the Court of Appeal. A stayof the inquiry into damages was agreed upon by consentbetween Societe Generale and Goldas. The stay will be liftedupon determination of the appeal. On 16th February 2017, the Paris Commercial Court dismissed Societe Generale’s claimsagainst its insurers. Societe Generale filed an appeal againstthis decision.
In the early 2000s, the French banking industry decided totransition to a new digital system in order to streamline cheque clearing. To support this reform (known as EIC – Echanged’Images Chèques), which has contributed to theimprovement of cheque payments’ security and to the fightagainst fraud, the banks established several interbank fees(including the CEIC which was abolished in 2007). These feeswere implemented under the aegis of the banking sectorsupervisory authorities, and to the knowledge of the publicauthorities.
On 20th September 2010, after several years of investigation,the French competition authority ruled that the jointimplementation and the setting of the amount of the CEIC and of two additional fees for related services were in breach ofcompetition law. The authority fined all the participants to theagreement (including the Banque de France) a total ofapproximately EUR 385 million. Societe Generale wasordered to pay a fine of EUR 53.5 million and Crédit du Nord,its subsidiary, a fine of EUR 7 million.
However, in its 23rd February 2012 order, the French Court ofAppeal, to which the matter was referred by all the banksinvolved except Banque de France, held that there was nocompetition law infringement, allowing the banks to recoupthe fines paid. On 14th April 2015, the Supreme Court quashed and annulled the Court of Appeal decision on the grounds that the latter did not examine the arguments of two third partieswho voluntarily intervened in the proceedings. The case washeard again on 3rd and 4th November 2016 by the Paris Courtof Appeal before which the case was remanded. On 21st
December 2017, the Court of Appeal confirmed the finesimposed on Societe Generale and Crédit du Nord by theFrench competition authority. Societe Generale and Crédit duNord have decided to file an appeal before the Supreme court against this decision.

6 I 6 NOTES TO THE PARENT COMPANY FINANCIAL STATEMENTS FFINANCIAL INFORMATIONN
522 I 2018 REGISTRATION DOCUMENT I S O C I E T E G E N E R AL E G R O U P
Societe Generale, along with other financial institutions, hasreceived formal requests from the U.S. Department of Justice(“DOJ”) and the U.S. Commodity Futures Trading Commission (“CFTC”) (collectively, the “U.S. Authorities”), in connectionwith investigations regarding submissions to the BritishBankers Association for setting certain London InterbankOffered Rates (“Libor”) and submissions to the EuropeanBanking Federation (now the EBF-FBE) for setting the EuroInterbank Offered Rate (“Euribor”), as well as trading inderivatives indexed to various benchmark rates.
Societe Generale is cooperating with the U.S. Authorities andis in discussions with them in order to reach an agreement toresolve this matter. Any such agreement would include arequirement that Societe Generale pay a monetary fine andmay in addition impose other sanctions. It is possible, withoutit being certain, that the pending discussions lead to anagreement in the next weeks or months. It is furthermoreimpossible to determine with certainty the amount of the fineor the other sanctions that may be imposed on SocieteGenerale.In the United States, Societe Generale, along with otherfinancial institutions, has been named as a defendant inputative class actions involving the setting of US Dollar Libor,Japanese Yen Libor, and Euribor rates and trading ininstruments indexed to those rates. Societe Generale has also been named in several individual (non-class) actionsconcerning the US Dollar Libor rate. All of these actions arepending in the US District Court in Manhattan (the “DistrictCourt”).As to US Dollar Libor, the District Court has dismissed allclaims against Societe Generale in two of the putative classactions and in all of the individual actions. The class plaintiffsand a number of individual plaintiffs have appealed thedismissal of their antitrust claims to the United States Court ofAppeals for the Second Circuit. Two other putative classactions are effectively stayed pending resolution of theseappeals. Societe Generale was voluntarily dismissed from afifth putative class action.As to Japanese Yen Libor, the District Court dismissed thecomplaint brought by purchasers of Euroyen over-the-counterderivative products and the plaintiffs have appealed that ruling to the United States Court of Appeals for the Second Circuit.In the other action, brought by purchasers or sellers ofEuroyen derivative contracts on the Chicago MercantileExchange (“CME”), the District Court has allowed certainCommodity Exchange Act claims to proceed to discovery.The plaintiff’s deadline to move for class certification in thataction is 17th October 2018.As to Euribor, the District Court dismissed all claims againstSociete Generale in the putative class action and denied theplaintiffs’ motion to file a proposed amended complaint.In Argentina, Societe Generale, along with other financialinstitutions, has been named as a defendant in litigationbrought by a consumer association on behalf of Argentineconsumers who held government bonds or other specifiedinstruments that paid interest tied to US Dollar Libor. Theallegations concern violations of Argentine consumerprotection law in connection with alleged manipulation of theUS Dollar Libor rate. Societe Generale has not yet been served with the complaint in this matter.
On 10th December 2012, the French Supreme AdministrativeCourt (Conseil d’État) rendered two decisions confirming thatthe “précompte tax” which used to be levied on corporationsin France does not comply with EU law and defined amethodology for the reimbursement of the amounts levied bythe tax authorities. However, such methodology considerablyreduces the amount to be reimbursed. Societe Generalepurchased in 2005 the “précompte tax” claims of twocompanies (Rhodia and Suez, now ENGIE) with a limitedrecourse on the selling companies. One of the abovedecisions of the French Supreme Administrative Court relatesto Rhodia. Societe Generale has brought proceedings beforethe French administrative courts. The latest court decisionrendered is a rejection, on 1st February 2016 by the FrenchAdministrative Supreme Court, of an appeal lodged by ENGIEand Societe Generale.
Several French companies applied to the EuropeanCommission, who considered that the decisions handeddown by the French Supreme Administrative Court on 10th
December 2012, which were supposed to implement thedecision rendered by the Court of Justice of the EuropeanUnion C-310/09 on 15th September 2011, infringed a numberof principles of European law. The European Commissionsubsequently brought infringement proceedings against theFrench Republic in November 2014, and since then confirmed its position by publishing a reasoned opinion on 29th April2016 and by referring the matter to the Court of Justice of theEuropean Union on 8th December 2016.
Societe Generale is cooperating with the Office of ForeignAssets Control of the U.S. Department of the Treasury, theU.S. Attorney’s Office for the Southern District of New York,the New York County District Attorney’s Office, the Board ofGovernors of the Federal Reserve System, the FederalReserve Bank of New York, and the New York StateDepartment of Financial Services (collectively, the "USAuthorities") in relation to U.S. dollar transactions processedby Societe Generale involving countries that are the subject ofU.S. economic sanctions.
Societe Generale is engaged in discussions with the USAuthorities in order to reach an agreement to resolve thismatter. Any such agreement would include a requirement that Societe Generale pay a monetary fine and may in additionimpose other sanctions. It is possible, without it being certain,that the pending discussions lead to an agreement in the nextweeks or months. It is furthermore impossible to determinewith certainty the amount of the fine or the other sanctions that may be imposed on Societe Generale.
On 7th March 2014, the Libyan Investment Authority (“LIA”)brought proceedings against Societe Generale before theHigh Court of England regarding the conditions pursuant towhich LIA entered into certain investments with the SocieteGenerale Group. LIA alleges that Societe Generale and otherparties who participated in the conclusion of the investmentsnotably committed acts amounting to corruption. On 3rd May2017, Societe Generale and the Libyan Investment Authorityreached a settlement agreement with a GBP 813.26 millionpayment, putting an end to the dispute.
On 8th April 2014, the DOJ served a subpoena requesting that Societe Generale produce documents relating to potentialviolations of the Foreign Corrupt Practices Act in connectionwith certain transactions involving Libyan counterparties,including the LIA. In October 2016, the SEC (together with theDOJ, the “US Authorities”) issued a subpoena to SocieteGenerale and its U.S. broker-dealer requesting substantiallythe same information. Societe Generale is cooperating withthe US Authorities in connection with this matter.

6
NOTES TO THE PARENT COMPANY FINANCIAL STATEMENTS 6 I 6 FFINANCIAL INFORMATIONN
S O C I E T E G E N E R AL E G R O U P I 2018 REGISTRATION DOCUMENT I 523
Societe Generale is in discussions with the DOJ in order to reach an agreement to resolve this matter. Any such agreement would include a requirement that Societe Generale pay a monetary fine and may in addition impose other sanctions. It is possible, without it being certain, that the pending discussions lead to an agreement in the next weeks or months. It is furthermore impossible to determine with certainty the amount of the fine or the other sanctions that may be imposed on Societe Generale.
In September and October 2017, Societe Generale also received two judicial requests to produce documents regarding its relations with the LIA in the scope of a preliminary investigation opened by the French National Financial Prosecutor’s office regarding possible violations of French anti-corruption laws. The requested documents have been communicated to the French authorities.
Societe Generale, along with other financial institutions, hasbeen named as a defendant in a putative class action allegingviolations of US antitrust laws and the Commodity ExchangeAct (“CEA”) in connection with its involvement in the LondonGold Market Fixing. The action is brought on behalf of persons or entities that sold physical gold, sold gold futures contractstraded on the CME, sold shares in gold ETFs, sold gold calloptions traded on CME, bought gold put options traded onCME, sold over-the-counter gold spot or forward contracts or gold call options, or bought over-the-counter gold put options. The action is pending in the US District Court in Manhattan.Motions to dismiss the action were denied by an order dated4th October 2016. Discovery is currently stayed by courtorders. Societe Generale and certain subsidiaries, along withother financial institutions, have also been named asdefendants in two putative class actions in Canada (in theOntario Superior Court in Toronto and Quebec Superior Court in Quebec City) involving similar claims.
On 30th January 2015, the CFTC served Societe Generalewith a subpoena requesting the production of information and documents concerning trading in precious metals done since1st January 2009. Societe Generale is cooperating with theauthorities.
Societe Generale, along with several other financialinstitutions, has been named as a defendant in a putative class action alleging violations of US antitrust laws and the CEA inconnection with foreign exchange spot and derivativestrading. The action is brought by persons or entities thattransacted in certain over-the-counter and exchange-tradedforeign exchange instruments. Societe Generale has reacheda settlement of USD 18 million, which was preliminarilyapproved by the Court. Notice to the class has begun, and afinal approval hearing is scheduled for 23rd May 2018.Separate putative class actions on behalf of putative classesof indirect purchasers are also pending. A motion to dismissthose cases is pending.
Societe Generale and certain subsidiaries, along with otherfinancial institutions, have also been named as defendants intwo putative class actions in Canada (in the Ontario SuperiorCourt in Toronto and Quebec Superior Court in Quebec City)involving similar claims. The Societe Generale defendantshave reached a settlement covering both actions for a totalamount of CAD 1.8 million. Both Canadian courts haveapproved the settlement, and the matters are concluded.
Further to an inspection conducted from 8th September to 1st
December 2015 within the Societe Generale Group in order to review the Group’s suspicious transaction reporting policiesand procedures, the ACPR gave Societe Generale notice on26th July 2016 of the opening of enforcement proceedingsagainst it. On 19th July 2017, the ACPR enforcementcommission issued a reprimand against Societe Generale and ordered it to pay a fine of EUR 5 million.
Societe Generale has been informed on 28th July 2017 of theopening of enforcement proceedings by the ACPRenforcement division related to the adequacy of SocieteGenerale’s level of vigilance on some cash withdrawals in retail banking, and of staff training in this field.

6 I 7 STATUTORY AUDITORS’ REPORT ON THE FINANCIAL STATEMENTS FF I N A N C I A L I N F O R M A T I O N
524 I 2018 REGISTRATION DOCUMENT I S O C I E T E G E N E R AL E G R O U P
7 . S TAT U T O R Y A U D I T O R S ’ R E P O R T O NT H E F I N A N C I A L S TAT E M E N T S
DELOITTE & ASSOCIÉS ERNST & YOUNG et Autres
185, avenue Charles de Gaulle
92524 Neuilly-sur-Seine Cedex
S.A. au capital de € 1.723.040
Commissaire aux Comptes
Membre de la compagnie
régionale de Versailles
Tour First
TSA 14444
92037 Paris-La Défense Cedex
S.A.S. à capital variable
Commissaire aux Comptes
Membre de la compagnie
régionale de Versailles
SSOCIETE GENNERALE
Société Anonyme
17, cours Valmy
92972 Paris-La Défense
This is a translation into English of the Statutory Auditors’ report on the financial statements of the Company issued in French and it is provided solely for the convenience of English-speaking users. This Statutory Auditors’ report includes information required by European regulation and French law, such as information about the appointment of the Statutory Auditors or verification of the management report and other documents provided to the shareholders. This report should be read in conjunction with, and construed in accordance with, French law and professional auditing standards applicable in France.
To the Annual General Meeting of Societe Generale,
Opinion In compliance with the engagement entrusted to us by your Annual General Meeting, we have audited the accompanying financial statements of Societe Generale for the year ended 31st December 2017.
In our opinion, the financial statements give a true and fair view of the assets and liabilities and of the financial position of the Company as at 31st December 2017 and of the results of its operations for the year then ended in accordance with French accounting principles.
The audit opinion expressed above is consistent with our report to the Audit and Internal Control Committee.
Basis for Opinion AUDIT FRAMEWORK
We conducted our audit in accordance with professional standards applicable in France. We believe that the audit evidence we have obtained is sufficient and appropriate to provide a basis for our opinion.
Our responsibilities under those standards are further described in the Statutory Auditors’ Responsibilities for the Audit of the Financial Statements section of our report.
INDEPENDENCE
We conducted our audit engagement in compliance with independence rules applicable to us, for the period from January 1, 2017 to the date of our report and specifically we did not provide any prohibited non-audit services referred to in Article 5(1) of Regulation (EU) No. 537/2014 or in the French Code of Ethics (Code de déontologie) for Statutory Auditors.
Emphasis of Matter We draw attention to Note 3.2 “Accruals, other assets and liabilities” to the financial statements which sets out the change in accounting policies related to the change in the presentation on the balance sheet of premiums to be received and premiums to be paid on options. Our opinion is not modified in respect of thismatter.
Justification of Assessments - Key Audit Matters In accordance with the requirements of Articles L.823-9 and R.823-7 of the French Commercial Code (Code de commerce) relating to the justification of our assessments, we inform you of the key audit matters relating to risks of material misstatement that, in our professional judgement, were of most significance in our audit of the financial statements of the current period, as well as how we addressed those risks.
These matters were addressed in the context of our audit of the financial statements as a whole, and in forming our opinion thereon, and we do not provide a separate opinion on specific items of the financial statements.

6
F I N A N C I A L I N F O R M A T I O N
SOCIETE GENERALE
STATUTORY AUDITORS’ REPORT ON THE FINANCIAL STATEMENTS 7 I 6 FFINANCIAL INFORMATIONN
S O C I E T E G E N E R A L E G R O U P I 2018 REGISTRATION DOCUMENT I 5
MEASUREMENT OF THE PROVISION FOR DISPUTES
RRisk identified
A provision for disputes in the amount of €2,318m (hereafter “the provision for disputes”) is recognised under liabilities in the balance sheet to cover the risks of future outflows of resources relating to several cases in which the Company is involved, as stated in Note 2.6 “Impairment and provisions – 2. Provisions” to the financial statements.
Societe Generale is subject to several investigations and requests for information of a regulatory nature from various authorities and regulators. These ongoing proceedings notably concern:
the investigations of American authorities on certain US dollartransfers on behalf of entities based in countries that are thesubject of economic sanctions ordered by the Americanauthorities;
transactions with Libyan counterparties including the LibyanInvestment Authority;
submissions made to market regulators to determine certainLIBOR rates;
as well as the dispute with the French tax authoritiesconcerning “précompte” (equalisation tax on dividends)receivables.
The ongoing investigations and requests for information are set out in Note 8 “Information on risks and litigation” to the financial statements. For the investigations by American authorities, the estimate of this provision results from Management’s assessment, taking into account the information in its possession on the progress of these proceedings, benchmarks with fines paid by other companies, and information obtained from Societe Generale’s external legal advisers.
Given the uncertainty of the outcome of these investigations and the inherent difficulty in estimating the amount of potential fines, the measurement of the provision for disputes, which is based on the exercise of Management’s judgement, is a key audit matter.
OOur response
Our work notably consisted in:
monitoring the main legal proceedings and the ongoinginvestigations undertaken by the judicial authorities and theregulators with Societe Generale’s legal department;
familiarising ourselves with the process for the measurementof the provision for disputes, notably through quarterlydiscussions with Societe Generale’s Management;
assessing the assumptions used to determine the provisionfor disputes on the basis of the information that we obtained,in particular from Societe Generale’s external legal advisers,specialised in these cases;
examining the disclosures on these disputes in the notes tothe financial statements.
RECOVERABILITY OF DEFERRED TAX ASSETS OF THE FRENCH TAX GROUP AND AMERICAN ENTITIES
RRisk identified
As at 31st December 2017, an amount of €4,032m has been recorded under deferred tax assets.
As stated in Note 5 “Taxes” to the financial statements, Societe Generale calculates deferred taxes at the level of each tax entity and recognises deferred tax assets at the closing date when it is considered probable that future taxable profits will be available against which the tax entity concerned will be able to charge timing differences and tax loss carryforwards, over a determined period of time.
Furthermore, as stated in Notes 5 “Taxes” and 8 “Information on risks and litigation” to the financial statements, certain tax loss carryforwards are challenged by the French tax authorities and consequently may be called into question.
Given the assumptions used to assess the recoverability of the deferred tax assets and the judgement exercised by Management in this respect, we identified this issue as a key audit matter for the French tax group and the American entities, which represent the most significant part of these assets.
OOur response
Our audit approach consisted in assessing the probability that Societe Generale will be able to make future use of the tax loss carryforwards generated to date, notably based on the ability of the tax entities (in France and the United States) to make future taxable profits that can absorb past losses.
With the support of our tax specialists, we:
compared the projected results for past years with the actualresults for the years concerned;
obtained an understanding of the three-year business plan drawn up by Management and approved by the Board of Directors;
assessed the assumptions used by Management beyond thethree-year period to establish projected results;
assessed the sensitivity of these assumptions in the event ofunfavourable scenarios defined by Societe Generale;
6 I 7 STATUTORY AUDITORS’ REPORT ON THE FINANCIAL STATEMENTS FF I N A N C I A L I N F O R M A T I O N
52 I 2018 REGISTRATION DOCUMENT I S O C I E T E G E N E R A L E G R O U P
performed tests on the calculation of the deferred tax assetbases and examined the consistency of the tax rates used. Inparticular, we considered whether the legislative changesmade during the year ended 31st December 2017 concerningthe taxation rate in France and in the United States had beentaken into account;
analysed Societe Generale’s situation, and familiarisedourselves with the opinion from its external tax advisersregarding its tax loss carryforwards in France, partiallychallenged by the tax authorities;
examined the disclosures on deferred tax assets in Notes 5and 8 to the financial statements.
VALUATION OF COMPLEX FINANCIAL INSTRUMENTS NOT QUOTED IN ACTIVE MARKETS
Risk identified
Within the scope of its market activities, Societe Generale holds complex financial instruments not quoted in active markets.
To calculate the market value of these instruments, Societe Generale uses techniques or internal models based on data that are not observable in the market, as stated in Note 2.2 “Operations on forward financial instruments” to the financial statements. The models and data used to value these instruments are based on Management’s estimates.
Due to the use of judgement to determine the instruments’ market value, the complexity of the modelling of the latter and the multiplicity of models used, we consider the valuation of the complex financial instruments not quoted in active markets to be a key audit matter.
Our response
Our audit approach is focused on certain key internal control processes related to the valuation of the complex financial instruments not quoted in active markets. With the support of our specialists in the valuation of financial instruments, we developed an approach including the following main stages:
we familiarised ourselves with the procedure for theauthorisation and validation of new products and theirvaluation models, including the process for the entry of thesemodels into the information systems;
we assessed the governance relating to the RiskDepartment’s control of the valuation models used;
more specifically, based on tests, we considered the valuation formulae for certain categories of complex instruments;
we analysed certain market parameters used to provide inputfor the valuation models;
as regards the daily profit and loss explanation process, wefamiliarised ourselves with the analysis principles used by
Societe Generale and performed tests of controls. We also performed “analytical” IT procedures on the database for the controls performed on the daily profit and loss explanation process;
at each quarterly closing, we obtained the results of theprocess for the independent price verification, and weanalysed any differences in parameters compared to themarket data in the event of a significant impact, as well as theaccounting treatment of such differences;
we performed counter-valuations of a selection of complexderivative financial instruments not quoted in active markets,using our tools;
we considered the compliance of the documented methodsunderlying the estimates with the principles described in Note2.2 “Operations on forward financial instruments” to thefinancial statements.
INFORMATION TECHNOLOGY RISK ON DERIVATIVE FINANCIAL INSTRUMENTS AND STRUCTURED PRODUCTS
Risk identified
Societe Generale’s derivative financial instruments and structured products constitute an important activity within its market activities, as illustrated by the significance of the net positions of derivative financial instruments in the transaction portfolio in Note 2.2 “Operations on forward financial instruments” to the financial statements.
This activity is highly complex due to the nature of the financial instruments processed, the volume of the transactions, and the use of numerous information systems interfacing with each other.
The risk of an IT incident could entail the risk of an anomaly in the accounts as a result of an incident in the data processing chains used, or the recording of transactions until they are transferred into the accounting system. Such a risk may notably take the form of:
changes made to management and financial information byunauthorised personnel via the information systems orunderlying databases;
a failure in processing or in the transfer of data betweensystems;
a service interruption or operating incident, possiblyassociated with internal or external fraud.
In this context, the monitoring by the Company of controls linked to information systems management relating to the above-mentioned activity is essential for the reliability of the accounts and is a key audit matter.

6
F I N A N C I A L I N F O R M A T I O N STATUTORY AUDITORS’ REPORT ON THE FINANCIAL STATEMENTS 7 I 6 FFINANCIAL INFORMATIONN
S O C I E T E G E N E R A L E G R O U P I 2018 REGISTRATION DOCUMENT I 5
OOur response
Our audit approach to this activity is based on the controls related to the information systems management set up by Societe Generale. With the support of our experts in financial systems, we tested the IT general controls on the applications that we considered to be significant for these activities. Our work concerned the following in particular:
the controls set up by Societe Generale on access rights,notably at sensitive times in a professional career (recruitment, transfer, resignation, end of contract) with, when necessary,extended audit procedures in the event of ineffective controlidentified during the year ended 31st December 2017;
potential privileged access to applications and infrastructure;
change management and, more specifically, the separation
between development and business environments;
security policies in general and their deployment in ITapplications (for example, those related to passwords);
handling of IT incidents during the audit period;
governance and the control environment in a sample of “enduser” applications.
For these same applications, in order to assess the transfer of information flows, we tested the application controls related to the automated interfaces between the systems.
Our tests on the IT general controls and application controls were supplemented by data analytics work on certain IT applications.
MEASUREMENT OF IMPAIRMENT ON LOANS AND OTHER COMMITMENTS GRANTED TO CORPORATE CLIENTS IN CERTAIN SECTORS SENSITIVE TO THE ECONOMIC SITUATION
RRisk identified
Loans and receivables to corporate clients carry a credit risk that exposes Societe Generale to a potential loss if its client or counterparty is unable to meet its financial commitments. The existence of a credit risk is assessed for each financial asset individually, or on the basis of homogeneous portfolios of financial instruments if there is no objective indication of impairment for a financial asset considered individually.
Societe Generale recognises impairment losses to cover the credit risks inherent to its activities and makes accounting estimates to measure the level of impairment of individual receivables and homogeneous groups of assets.
Impairment on individually impaired loans and on homogeneous groups of receivables amount to €3,287m and €1,030m
respectively as at 31st December 2017, as stated in Note 2.6 “Depreciations and provisions” to the financial statements.
Societe Generale’s Risk Department uses its judgement to determine the assumptions and parameters used to calculate these impairment losses. The main assumptions taken into account by Management for the measurement of impairment losses are probability of default for performing loans and loss given default for performing and doubtful loans.
Given Societe Generale’s activities, we consider the measurement of impairment losses on loans and commitments to corporate clients in certain sectors sensitive to the economic situation to be a key audit matter.
OOur response
We familiarised ourselves with the impairment loss measurement process adopted by Societe Generale. We tested the key controls set up by Management for determining the assumptions and parameters used as a basis for this measurement. Our work consisted in assessing:
the procedure for the detection of corporate counterpartiesthat are in a weak financial situation or in default;
the provisioning methods used for homogeneous groups of
assets in the sectors selected;
the assumptions and parameters used for a selection ofindividual files and for homogeneous groups of assets in thesectors selected;
the compliance of the documented methods underlying theestimates with the principles described in Note 2.6“Depreciations and provisions” to the financial statements.

6 I 7 STATUTORY AUDITORS’ REPORT ON THE FINANCIAL STATEMENTS FF I N A N C I A L I N F O R M A T I O N
52 I 2018 REGISTRATION DOCUMENT I S O C I E T E G E N E R A L E G R O U P
Verification of the Management Report and of the Other Documents Provided to the Shareholders We have also performed, in accordance with professional standards applicable in France, the specific verifications required by French law.
INFORMATION PROVIDED IN THE MANAGEMENT REPORT AND IN THE OTHER DOCUMENTS PROVIDED TO THE SHAREHOLDERS WITH RESPECT TO THE FINANCIAL POSITION AND THE FINANCIAL STATEMENTS
We have no matters to report as to the fair presentation and the consistency with the financial statements of the information given in the Board of Directors’ management report and in the other documents provided to the Shareholders with respect to the financial position and the financial statements.
REPORT ON CORPORATE GOVERNANCE
We attest that the Board of Director’s Report on Corporate Governance sets out the information required by Articles L. 225-37-3 and L. 225-37-4 of the French Commercial Code (Code de commerce).
Concerning the information given in accordance with the requirements of Article L. 225-37-3 of the French Commercial Code (Code de commerce) relating to remunerations and benefits received by the directors and any other commitments made in their favour, we have verified its consistency with the financial statements, or with the underlying information used to prepare these financial statements and, where applicable, with the information obtained by your Company from controlling and controlled companies. Based on these procedures, we attest the accuracy and fair presentation of this information.
With respect to the information relating to items that your Company considered likely to have an impact in the event of a public purchase offer or exchange, provided pursuant to Article L. 225-37-5 of the French Commercial Code (Code de commerce), we have verified that it is in accordance with the underlying documentation provided to us. Based on our work, we have no observations to make on this information.
OTHER INFORMATION
In accordance with French law, we have verified that the required information concerning the purchase of investments and controlling interests and the identity of the shareholders and holders of the voting rights and cross-shareholdings has been properly disclosed in the management report.
Report on Other Legal and Regulatory Requirements APPOINTMENT OF THE STATUTORY AUDITORS
We were appointed as Statutory Auditors of Societe Generale by your Annual General Meeting held on 18th April 2003 for DELOITTE & ASSOCIES and on 22nd May 2012 for ERNST & YOUNG et Autres.
As at 31st December 2017, DELOITTE & ASSOCIES was in the fifteenth year of total uninterrupted engagement and ERNST & YOUNG et Autres in the sixth.
Previously, ERNST & YOUNG Audit was the statutory auditor of Societe Generale from 2000 to 2011.
Responsibilities of Management and Those Charged with Governance for the Financial Statements Management is responsible for the preparation and fair presentation of the financial statements in accordance with French accounting principles and for such internal control as management determines is necessary to enable the preparation of financial statements that are free from material misstatement, whether due to fraud or error.
In preparing the financial statements, management is responsible for assessing the Company’s ability to continue as a going concern, disclosing, as applicable, matters related to going concern and using the going concern basis of accounting unless it is expected to liquidate the Company or to cease operations.
The Audit and Internal Control Committee is responsible for monitoring the financial reporting process and the effectiveness of internal control and risk management systems and where applicable, its internal audit, regarding the accounting and financial reporting procedures.
The financial statements were approved by the Board of Directors.
Statutory Auditors’ Responsibilities for the Audit of the Financial Statements OBJECTIVES AND AUDIT APPROACH
Our role is to issue a report on the financial statements. Our objective is to obtain reasonable assurance about whether the financial statements as a whole are free from material misstatement. Reasonable assurance is a high level of assurance, but is not a guarantee that an audit conducted in accordance with professional standards will always detect a material misstatement when it exists. Misstatements can arise from fraud or error and are considered material if, individually or in the aggregate, they could reasonably be expected to influence the economic decisions of users taken on the basis of these financial statements.
As specified in Article L.823-10-1 of the French Commercial Code (Code de commerce), our statutory audit does not include assurance on the viability of the Company or the quality of management of the affairs of the Company.
As part of an audit conducted in accordance with professional standards applicable in France, the statutory auditor exercises professional judgement throughout the audit and furthermore:
Identifies and assesses the risks of material misstatement ofthe financial statements, whether due to fraud or error,designs and performs audit procedures responsive to thoserisks, and obtains audit evidence considered to be sufficientand appropriate to provide a basis for his opinion. The risk ofnot detecting a material misstatement resulting from fraud ishigher than for one resulting from error, as fraud may involvecollusion, forgery, intentional omissions, misrepresentations,or the override of internal control.

6
F I N A N C I A L I N F O R M A T I O N STATUTORY AUDITORS’ REPORT ON THE FINANCIAL STATEMENTS 7 I 6 FFINANCIAL INFORMATIONN
S O C I E T E G E N E R A L E G R O U P I 2018 REGISTRATION DOCUMENT I 5
Obtains an understanding of internal control relevant to theaudit in order to design audit procedures that are appropriatein the circumstances, but not for the purpose of expressing an opinion on the effectiveness of the internal control.
Evaluates the appropriateness of accounting policies usedand the reasonableness of accounting estimates and relateddisclosures made by management in the financial statements.
Assesses the appropriateness of management’s use of thegoing concern basis of accounting and, based on the auditevidence obtained, whether a material uncertainty existsrelated to events or conditions that may cast significant doubton the Company’s ability to continue as a going concern. Thisassessment is based on the audit evidence obtained up to the date of his audit report. However, future events or conditionsmay cause the Company to cease to continue as a goingconcern. If the statutory auditor concludes that a materialuncertainty exists, there is a requirement to draw attention inthe audit report to the related disclosures in the financialstatements or, if such disclosures are not provided orinadequate, to modify the opinion expressed therein.
Evaluates the overall presentation of the financial statementsand assesses whether these statements represent theunderlying transactions and events in a manner that achievesfair presentation.
REPORT TO THE AUDIT AND INTERNAL CONTROL COMMITTEE
We submit a report to the Audit and Internal Control Committee which includes in particular a description of the scope of the audit and the audit programme implemented, as well as the results of our audit. We also report significant deficiencies, if any, in internal control regarding the accounting and financial reporting procedures that we have identified.
Our report to the Audit and Internal Control Committee includes the risks of material misstatement that, in our professional judgement, were of most significance in the audit of the financial statements of the current period and which are therefore the key audit matters that we are required to describe in this report.
We also provide the Audit and Internal Control Committee with the declaration provided for in Article 6 of Regulation (EU) No 537/2014, confirming our independence within the meaning of the rules applicable in France such as they are set out in particular in Articles L.822-10 to L.822-14 of the French Commercial Code (Code de commerce) and in the French code of ethics (code de déontologie) for Statutory Auditors. Where appropriate, we discuss with the Audit and Internal Control Committee the risks that may reasonably be thought to bear on our independence, and the related safeguards.
Neuilly-sur-Seine and Paris-La Défense, 8th March 2018
The Statutory Auditors French original signed by
DELOITTE & ASSOCIES ERNST & YOUNG et Autres
José-Luis Garcia Isabelle Santenac

6 I 7 STATUTORY AUDITORS’ REPORT ON THE FINANCIAL STATEMENTS FF I N A N C I A L I N F O R M A T I O N
530 I 2018 REGISTRATION DOCUMENT I S O C I E T E G E N E R AL E G R O U P
SHARE, SHARE CAPITAL ANDLEGAL INFORMATION

F I N A N C I A L I N F O R M A T I O N
S O C I E T E G E N E R AL E G R O U P I 2018 REGISTRATION DOCUMENT I 531
7 SHARE, SHARE CAPITAL AND
LLEGAL INFORMATION
1. The Societe Generale share .......... 532Stock market performance ........................................ 532
Total return for the shareholder .................................. 533
Stock exchange listing ............................................... 533
Stock market indices ................................................. 533
2017 dividend ........................................................... 534
Dividend history ......................................................... 534
2. Information on share capital .......... 535Share capital ............................................................. 535
Share buybacks and treasury shares ......................... 535
Breakdown of capital and voting rights over 3 years ... 535
Share buybacks ........................................................ 536
Changes in share capital ........................................... 537
Transactions carried out by Chief Executive Officers and Directors in Societe Generale shares ................... 538
Existing agreements between Societe Generale and its shareholders ......................................................... 538
3. Additional information ................... 539General information ................................................... 539
Publicly available documents ..................................... 540
4. By-laws ........................................ 541
5. Internal Rules of the Board ofDirectors ...................................... 546
6. List of regulated informationpublished in the last 12 months .... 553

7 I 1 THE SOCIETE GENERALE SHARE SSHARE, SHARE CAPITAL AAND LEEGAL INFORMATION
532 I 2018 REGISTRATION DOCUMENT I S O C I E T E G E N E R AL E G R O U P
1 . T H E S O C I E T E G E N E R A L E S H A R E
STOCK MARKET PERFORMANCE Societe Generale’s share price decreased by 7.9% in 2017, closing at EUR 43.05 at 31st December. This performance can be compared over the same period to an increase of 10.9% for the Eurozone bank index (DJ EURO STOXX BANK) and to an increase of 9.3% for the CAC 40 index.
As at 31st December 2017, the Societe Generale Group’s market capitalisation stood at EUR 34.8 billion, ranking it 18th among CAC 40 stocks (13th as at 31st December 2016), 13th in terms of
free float (12th as at 31st December 2016) and 7th among Eurozone banks (6th as at 31st December 2016).
The market for the Group’s shares remained highly liquid in 2017, with an average daily trading volume of EUR 180 million, representing a daily capital rotation ratio of 0.48% (versus 0.60% in 2016). In value terms, Societe Generale’s shares were the 4th most actively traded on the CAC 40 index.
SHARE PERFORMANCE (BASE: SOCIETE GENERALE SHARE PRICE AS AT 31ST DECEMBER 2015)
Source: Thomson Reuters Eikon
MONTHLY CHANGE IN SHARE PRICE (AVERAGE MONTHLY PRICE IN EURO)
Source: Thomson Reuters Eikon
15
20
25
30
35
40
45
50
55
Dec. Jan. Feb. Mar. Apr. May. Jun. Jul. Aug. Sep. Oct. Nov. Dec. Jan. Feb. Mar. Apr. May. Jun. Jul. Aug. Sep. Oct. Nov. Dec.
SocieteGeneraleDJ Euro StoxxBanks
2016 2017
42.57
34.7936.79
35.8237.3136.26
30.5632.6533.34
36.47
40.59
47.5048.67
46.0347.75
50.91 51.88
48.5250.29 50.27
49.5449.84
47.8044.54
34.19
27.47
32.48
30.0832.60
26.39 26.4028.52
30.63 30.47
34.19
40.21
44.84
41.43
43.97 43.02
46.6746.09
47.6046.23
45.9047.32
42.3141.96
15
20
25
30
35
40
45
50
55
60
Jan. Feb. Mar. Apr. May. Jun. Jul. Aug. Sep. Oct. Nov. Dec. Jan. Feb. Mar. Apr. May. Jun. Jul. Aug. Sep. Oct. Nov. Dec.
2016 2017
SHARE, SHARE CAPITAL AND LEGAL INFORMATION

7
SHARE SSHARE, SHARE CAPITAL AND LEGAL INFORMATION I 7
S O C I E T E G E N E R AL E G R O U P I 2018 REGISTRATION DOCUMENT I 533
TRADING VOLUMES (AVERAGE DAILY TRADING VOLUMES AS PERCENTAGE OF CAPITAL)
Source: Thomson Reuters Eikon.
TOTAL RETURN* FOR THE SHAREHOLDER The following table shows the cumulative and annualised average total return on investment over different Societe Generale shareholding periods ending 31st December 2017.
Duration of shareholding Date Cumulative total
return* Annualised average
total return*
Since privatisation 8th July 1987 822.4% 7.6%
15 years 31st December 2002 42.4% 2.4%
10 years 31st December 2007 -36.6% -4.5%
5 years 31st December 2012 79.0% 12.3%
4 years 31st December 2013 18.4% 4.3%
3 years 31st December 2014 39.6% 11.8%
2 years 31st December 2015 11.7% 5.7%
1 year 31st December 2016 -3.6% -3.6%
Source: Thomson Reuters Eikon * Total return = capital gain + net dividend reinvested in shares.
STOCK EXCHANGE LISTING The Societe Generale share is listed on the Paris Stock Exchange (deferred settlement market, continuous trading group A, ISIN code FR0000130809) and is also traded in the United States under an American Depository Receipt (ADR) programme.
STOCK MARKET INDICES The Societe Generale share is a component stock of the CAC 40, STOXX All Europe 100, EURO STOXX 50, Euronext 100, MSCI PAN EURO, FTSE4Good Global and ASPI Eurozone indices.
0.62 0.84 0.69 0.50 0.51 0.85 0.54 0.47 0.57 0.51 0.60 0.54 0.42 0.49 0.49 0.68 0.55 0.52 0.41 0.41 0.39 0.40 0.54 0.48
Jan. Feb. Mar. Apr. May. Jun. Jul. Aug. Sep. Oct. Nov. Dec. Jan. Feb. Mar. Apr. May. Jun. Jul. Aug. Sep. Oct. Nov. Dec.
2017 2016

7 I 1 THE SOCIETE GENERALE SHARE SSHARE, SHARE CAPITAL AAND LEEGAL INFORMATION
534 I 2018 REGISTRATION DOCUMENT I S O C I E T E G E N E R AL E G R O U P
2017 DIVIDEND The Board of Directors of Societe Generale, which met on 7th February 2018, decided to propose the distribution of a dividend of EUR 2.20 per share to the General Meeting of 23rd May 2018:
dividend detachment will take place on 30th May 2018;
the dividend will be paid as from 1st June 2018.
DIVIDEND HISTORY
2017* 2016 2015 2014 2013
Net dividend (in EUR) 2.20 2.20 2.00 1.20 1.00
Payout ratio (%)(1) 75.3 51.6 44.5 41.2 41.7
Net yield (%)(2) 5.1 4.7 4.7 3.4 2.4
* Dividend proposed by the Board of Directors to the General Meeting to be held on 23rd May 2018.
(1) Net dividend/diluted earnings per ordinary share (see Chapter 6, p. 405, note 7.2 to the consolidated financial statements). In 2017, the dividend payout ratio was 73.9% of net income excluding revaluation of own financial liabilities and DVA (Debit Valuation Adjustment).
(2) Net dividend/closing price at end-December.
Stock market data 31.12.2017 31.12.2016 31.12.2015 31.12.2014 31.12.2013
Share capital (number of outstanding shares) 807,917,739 807,713,534 806,239,713 805,207,646 798,716,162
Market capitalisation (in EUR bn) 34.8 37.8 34.3 28.2 33.7
Earnings per share (in EUR) 2.92 4.26 4.49 2.90(2) 2.23(1)
Book value per share at year-end (in EUR) 63.2 63.7 61.6 58.0(2) 56.5(1)
Share price (in EUR) high 51.9 47.5 48.3 48.4 42.5
low 41.4 26.4 32.8 33.9 24.3
closing 43.1 46.8 42.6 35.0 42.2
(1) The amount for the 2013 financial year has been restated due to the implementation of the IFRS 11 standard, resulting in the publication of adjusted data for the previous financial year.
(2) The amount for the 2014 financial year has been restated due to the implementation of the IFRIC 21 standard, resulting in the publication of adjusted data for the previous financial year.

7
INFORMATION ON SHARE CAPITAL
2 I 7 SSHARE, SHARE CAPITAL AAND LEEGAL INFORMATION
S O C I E T E G E N E R AL E G R O U P I 2018 REGISTRATION DOCUMENT I 535
2 . I N F O R M AT I O N O N S H A R E C A P I TA L
SHARE CAPITALAs at 31st December 2017, Societe Generale’s paid-up share capital amounted to EUR 1,009,897,173.75 and comprised 807,917,739 shares with a nominal value of EUR 1.25 per share, all eligible for dividends paid out of income earned from 1st January 2017.
As part of the Group’s capital market activities, transactions involving indices or underlying assets with a Societe Generale share component may be carried out. These transactions do not have any impact on the Group’s future capital.
The increase by 204,205 shares in 2017 reflects the creation of new shares further to the exercise between 1st January and 8th March 2017 of stock options granted in March 2010.
SHARE BUYBACKS AND TREASURY SHARESAs at 31st December 2017, Societe Generale held 6,850,304 shares under its share buyback programme, representing 0.85% of its capital. The Group disposed of all its treasury shares during the first half of 2015.
BREAKDOWN OF CAPITAL AND VOTING RIGHTS OVER 3 YEARS 31.12.2017(1) 31.12.2016(2) 31.12.2015(3)
Number of shares
% ofcapital
% ofvoting
rights(4)
% of votingrights
exercisable at GM(4)
Number ofshares
% ofcapital
% ofvoting
rights(4)
Number of shares
% ofcapital
% of votingrights(4)
Group Employee Share Ownership Plan
47,914,654 5.93% 10.85% 10.94% 53,380,553 6.61% 11.98% 55,092,330 6.83% 11.52%
Shareholders with more than 1.5% of the capital or voting rights(5)
113,334,627 14.03% 13.52% 13.63% 110,008,696 13.62% 12.98% 104,950,065 13.02% 12.56%
BlackRock, Inc. 50,129,600 6.20% 5.69% 5.74% 44,601,311 5.52% 5.00% 41,959,112 5.20% 4.76%
The Capital Group
Companies, Inc. 42,605,400 5.27% 4.84% 4.88% 44,370,496 5.49% 4.98% 42,145,768 5.23% 4.78%
CDC 20,599,627 2.55% 2.99% 3.01% 21,036,889 2.60% 3.00% 20,845,185 2.59% 3.01%
Free float 639,818,154 79.19% 74.85% 75.44% 636,072,534 78.75% 74.12% 636,683,750 78.97% 74.85% Share buybacks 6,850,304 0.85% 0.78% 0.00% 8,251,751 1.02% 0.93% 9,513,568 1.18% 1.08%
Treasury stock 0 0.00% 0.00% 0.00% 0 0.00% 0.00% 0 0.00% 0.00% Total 100% 100% 100% 100% 100% 100% 100%
Number of outstanding shares
807,917,739 880,459,245 873,608,941 807,713,534 891,445,181 806,239,713 881,251,888
(1) As at 31st December 2017, the share of EU institutional shareholders in the capital is estimated at 46%. (2) As at 31st December 2016, the share of EU institutional shareholders in the capital is estimated at 45%. (3) As at 31st December 2015, the share of EU institutional shareholders in the capital is estimated at 44%. (4) In accordance with Article 223-11 of the AMF’s General Regulation, the calculation of the total voting rights includes voting rights associated with share
buybacks and treasury shares; however, these shares do not give the right to vote at General Meetings. (5) Societe Generale’s By-laws stipulate that shareholders are obliged to notify the Company whenever their holding of share capital or voting rights
exceeds an additional 0.5% beyond an initial notification threshold of 1.5%. As at end-December 2017, no other shareholder declared a holding in excess of 1.5% of the share capital or voting rights, with the exception of mutual funds and trading activities of financial institutions.

7 I 2 INFORMATION ON SHARE CAPITAL SHARE, SHARE CAPITAL AND LEGAL INFORMATION
536 I 2018 REGISTRATION DOCUMENT I S O C I E T E G E N E R AL E G R O U P
During the 2017 financial year:
BlackRock, Inc., acting on behalf of customers and funds under its management, reported to the AMF (French Financial Markets Authority) that it had crossed (upwards and downwards) the 5% threshold of Societe Generale's voting rights. In its last declaration, BlackRock, Inc. stated that, on 2nd June 2017, it had exceeded 5% of Societe Generale's voting rights and held 45,245,174 Societe Generale shares, representing the same number of voting rights, i.e. 5.60% of the share capital and 5.12% of Societe Generale's voting rights;
The Capital Group Companies, Inc., acting as investment adviser on behalf of funds, reported to the AMF (French Financial Markets Authority) that it had crossed (upwards or downwards) the 5% threshold of Societe Generale’s share capital and voting rights. In its last declaration, the Capital Group Companies, Inc. stated that, on 12th December 2017, it had exceeded the 5% threshold of Societe Generale’s share capital and held 40,673,202 Societe Generale shares, representing the same number of many voting rights, i.e. 5.03% of the share capital and 4.62% of the voting rights of Societe Generale.
(1) As of 2006 and in accordance with Article 223-11 of the AMF’s General Regulation, the calculation of the total voting rights includes voting rights associated with share buybacks and treasury shares; however, these shares do not give the right to vote at General Meetings.
Note: Societe Generale’s by-laws stipulate that shareholders are obliged to notify the Company whenever their holding of share capital or voting rights exceeds an additional 0.5% beyond an initial notification threshold of 1.5%. As at end-December 2017, no other shareholder declared a holding in excess of 1.5% of the share capital or voting rights, with the exception of mutual funds and trading activities of financial institutions.
SHARE BUYBACKS The General Meeting of 23rd May 2017 authorised the Company to buy or sell its own shares with a view to (i) cancelling bought-back shares, (ii) granting, honouring or covering stock options, other share allocations and making any other form of allocations to Group employees and executive officers, (iii) granting shares when rights attached to convertible securities are exercised, (iv) holding and subsequently delivering shares in exchange or as payment for shares as part of possible external growth transactions, and (v) executing a liquidity contract.
Societe Generale did not buy back any of its own shares in 2017, excluding the liquidity contract.
Under the liquidity contract implemented on 22nd August 2011, Societe Generale acquired 5,335,160 shares in 2017, with a value of EUR 251,733,425, and sold 5,335,160 shares with a value of EUR 252,042,481.
As at 31st December 2017, the liquidity contract held no shares.
From 1st January 2018 to 7th February 2018, excluding the liquidity contract, Societe Generale did not buy back any of its own shares on the market. As at 7th February 2018, no share was recorded in the liquidity contract account.
74.85%
0.78%
10.85%
13.52%
Free float
Share buybacks
Group Employee Share Ownership
Shareholders with more than 1.5% of the capital or voting rights
79.19%
0.85% 5.93%
14.03%
Free float
Share buybacks
Group Employee Share Ownership
Shareholders with more than 1.5% of the capital or voting rights
As % of voting rights (1)
As % of share capital

7
INFORMATION ON SHARE CAPITAL
2 I 7 SSHARE, SHARE CAPITAL AAND LEEGAL INFORMATION
S O C I E T E G E N E R AL E G R O U P I 2018 REGISTRATION DOCUMENT I 537
FFrom 1sst JJanuary 2017 to 31sst DDecember 2017
Purchases Transfers/Disposals
Number Purchase
price Number Purchase priceDisposal/
transfer price
Cancellation 0 - 0.00
External growth 0 - 0.00
Allocation to employees 0 - 0.00 1,401,447 17.83 24,984,169 0.00 0
Liquidity contract 5,335,160 47.18 251,733,425 5,335,160 47.18 251,733,425 47.24 252,042,481
TTotal 55,335,160 447.18 2251,733,425 66,736,607 441.08 2276,717,594 447.24 2252,042,481
VALUE OF TREASURY SHARES AND BUYBACKS AS AT 31ST DECEMBER 2017
Percentage of capital held directly or indirectly 0.85%
Number of shares cancelled over the last 24 months 0
Number of shares held directly 6,850,304
Book value of shares held directly EUR 271,053,312
Market value of shares held directly(1) EUR 297,234,691
(1) The current value is equal to the average share price of the last month for available-for-sale listed securities.
As at 31.12.2017 Number of shares Nominal value (in EUR) Book value (in EUR)
Societe Generale* 6,850,304 8,562,880 271,053,312
Total 6,850,304 8,562,880 271,053,312
* Of which liquidity contract (0 share).
CHANGES IN SHARE CAPITAL
Operation Date (of record or completion) Change
Numberof shares
Share capital
(in EUR)
Change in share capital
resulting from operation (%)
Exercise of stock options in 2012 recorded on 08.01.2013 +1,879 780,273,227 975,341,533.75 NS
Free grant of shares to employees recorded on 02.04.2013 +884,912 781,158,139 976,447,673.75 +0.11 Increase through the exercise of the option for the payment of dividends in shares
recorded on 19.06.2013 +8,835,256 789,993,395 987,491,743.75 +1.13
Increase through 2013 Company Savings Plan and exercise of stock options until 10th July 2013
recorded on 12.07.2013 +8,662,904(1) 798,656,299 998,320,373.75 +1.10
Exercise of stock options from 11th July 2013 to 31st December 2013
recorded on 08.01.2014 +59,863 798,716,162 998,395,202.50 NS
Free grant of shares to employees recorded on 31.03.2014 +1,303,272 800,019,434 1,000,024,292.50 +0.16 Increase through 2014 Company Savings Plan and exercise of stock options until 30th June 2014
recorded on 11.07.2014 +5,172,260(2) 805,191,694 1,006,489,617.50 +0.65
Exercise of stock options from 1st July 2014 to 31st December 2014 recorded on 08.01.2015 +15,952 805,207,646 1,006,509,557.50 NS
Free grant of shares to employees recorded on 31.03.2015 +892,416 806,100,062 1,007,625,077.50 +0.11 Exercise of stock options from 1st January 2015 to 31st December 2015
recorded on 08.01.2016 +139,651 806,239,713 1,007,799,641.25 +0.01
Free grant of shares to employees recorded on 31.03.2016 +1,264,296 807,504,009 1,009,380,011.25 +0.15 Exercise of stock options from 1st January 2016 to 31st December 2016
recorded on 09.01.2017 +209,525 807,713,534 1,009,641,917.50 +0.02
Exercise of stock options from 1st January 2017 to 8th March 2017 recorded on 11.12.2017 +204,205 807,917,739 1,009,897,173.75 +0.02
(1) Including 15,137 shares resulting from the exercise of stock options in 2013. (2) Including 55,292 shares resulting from the exercise of stock options in 2014.

7 I 2 INFORMATION ON SHARE CAPITAL SSHARE, SHARE CAPITAL AAND LEEGAL INFORMATION
538 I 2018 REGISTRATION DOCUMENT I S O C I E T E G E N E R AL E G R O U P
TRANSACTIONS CARRIED OUT BY CHIEF EXECUTIVE OFFICERS AND DIRECTORS IN SOCIETE GENERALE SHARES Summary statement published in compliance with Article 223-26 of the AMF General Regulation.
(In EUR) Type of transaction Date Amount
DDidier VALET Deputy Chief Executive Officer, performed 2 transactions
Acquisition of 649 Societe Generale shares 15.02.17 28,553
Acquisition of 10,180 Societe Generale shares 21.02.17 419,416
SSéverin CABANNES Deputy Chief Executive Officer, performed 3 transactions Disposal of 9,505 Societe Generale shares 20.06.17 447,855
Buyback of 2,654 Societe Generale fund units 21.06.17 69,087
Acquisition of 2,996 Societe Generale shares 02.10.17 -
FFrédéric OUDÉA Chief Executive Officer, performed 1 transaction Acquisition of 5,975 Societe Generale shares 02.10.17 -
BBernardo SANCHEZ INCERA Deputy Chief Executive Officer, performed 1 transaction Acquisition of 2,633 Societe Generale shares 02.10.17 -
WWilliam CONNELLY Director, performed 1 transaction Acquisition of 2,000 Societe Generale shares 02.08.17 95,784
LLubomira ROCHET Director, performed 1 transaction Acquisition of 600 Societe Generale shares 29.11.17 25,788
EXISTING AGREEMENTS BETWEEN SOCIETE GENERALE AND ITS SHAREHOLDERS On 24th July 2000, Societe Generale entered into an agreement with Santander Central Hispano (which became “Banco Santander”) relating to the management of their cross-holdings. According to this agreement, Societe Generale and Santander Central Hispano each grant the other party a pre-emptive right to the shares held, directly or through a subsidiary, by each of the parties in the share capital of the other, although this right does not apply in the event of a public tender offer initiated by a third party for the shares of either party.
The agreement was concluded for an initial period of three years from the date of its signature and is subsequently renewable for two-year periods.
This pre-emptive clause was published by the French Financial Markets Council (Conseil des Marchés Financiers) in Decision No. 201C1417 dated 30th November 2001. This agreement was still in force on 31st December 2017. However, as at 31st December 2017, Banco Santander no longer held any shares in Societe Generale and Societe Generale no longer held any shares in Banco Santander.

7
ADDITIONAL INFORMATION
3 I 7 SSHARE, SHARE CAPITAL AAND LEEGAL INFORMATION
S O C I E T E G E N E R AL E G R O U P I 2018 REGISTRATION DOCUMENT I 539
3 . A D D I T I O N A L I N F O R M AT I O N
GENERAL INFORMATION
Name Societe Generale
Registered office 29 boulevard Haussmann, 75009 Paris (France)
Administrative office 17 cours Valmy, 92972 Paris-La Défense (France)
Postal address: Société Générale, Tours Société Générale, 75886 Paris cedex 18 (France)
Telephone number: +33 (0)1 42 14 20 00
Website: www.societegenerale.com
Legal form Societe Generale is a public limited company (société anonyme) established under French law and having the status of a bank.
Governing law Subject to the legislative and regulatory provisions relating to credit institutions, in particular the articles of the French Monetary and Financial Code that apply to them, Societe Generale is governed by French commercial legislation, in particular by Articles L. 210-1 et seq. of the French Commercial Code, as well as by its By-laws.
Societe Generale is a credit institution licensed as a bank. As such, it may carry out all banking transactions. It may also in particular perform all investment services or related services referred to by Articles L. 321-1 and L. 321-2 of the French Monetary and Financial Code, except for operating a multilateral trading facility (MTF) or an organised trading facility (OTF). As an investment services provider, Societe Generale is subject to the regulations applicable to the same. It must in particular comply with a number of prudential rules and is subject to the controls carried out by the European Central Bank (ECB) and the French Prudential Supervisory and Resolution Authority (Autorité de Contrôle Prudentiel et de Résolution – ACPR). Its management and all its employees are bound by professional secrecy, the breach of which is punishable by criminal law. Societe Generale also acts as an insurance broker.
Date of incorporation and duration Societe Generale was incorporated following a deed approved by decree dated 4th May 1864. The duration of Societe Generale will expire on 31st December 2047, unless it is extended or the Company is wound up before that date.
Corporate purpose Article 3 of the Company’s By-laws describes the corporate purpose. The purpose of Societe Generale is, under the conditions determined by the laws and regulations applicable to credit institutions, to carry out with individuals or legal entities, in France and abroad:
all banking transactions;
all transactions related to banking operations, including in particular investment services or related services referred to in Articles L. 321-1 and L. 321-2 of the French Monetary and Financial Code;
all acquisitions of interests in other companies.
Societe Generale may also, on a regular basis, as defined in the conditions set by the French Banking and Financial Regulation Committee (Comité de la réglementation bancaire et financière), engage in all transactions other than those mentioned above, in particular insurance brokerage.
Generally, Societe Generale may carry out, on its own behalf, on behalf of a third party or jointly, all financial, commercial, industrial or agricultural, security or property transactions, directly or indirectly related to the abovementioned activities or likely to facilitate their accomplishment.
Identification 552 120 222 RCS PARIS
ISIN code (International Securities Identification Number): FR 0000130809
NAF (trade sector) code: 6419Z
LEI (Legal Entity Identifier): O2RNE8IBXP4R0TD8PU41
Corporate documents Documents relating to the Company and in particular its By-laws, its accounts, the reports submitted to its General Meetings by the Board of Directors or the Statutory Auditors, are available at Tours Société Générale, 17 cours Valmy, 92972 Paris-La Défense Cedex (France).
The By-laws of Societe Generale are filed with the notarial firm of “Thibierge, Pône, Fremeaux, Palud, Sarazin, Sagaut et Chaput” in Paris (France).
Financial year From 1st January to 31st December of each year.
Categories of shares and attached rights Under Article 4 of the Company’s By-laws, the share capital is divided into 807,917,739 fully paid-up shares with a nominal value of EUR 1.25.

7 I 3
ADDITIONAL INFORMATION SSHARE, SHARE CAPITAL AAND LEEGAL INFORMATION
540 I 2018 REGISTRATION DOCUMENT I S O C I E T E G E N E R AL E G R O U P
Double voting rights
In accordance with Article 14 of the Company’s By-laws, double voting rights are allocated, in relation to the amount of share capital represented by the shares in question, to all shares which are fully paid-up and which have been registered in the name of the same shareholder for at least two years as from 1st January 1993, as well as to any new registered shares that may be freely allocated to a shareholder, in the event of a capital increase by incorporation of reserves, profits or premiums, on the basis of shares benefiting from this right.
According to the law, double voting rights cease for shares which have been converted into bearer form or if ownership of the shares is transferred. Nevertheless, transfer through inheritance, liquidation of marital assets, donation inter vivos to a spouse or a direct relative entitled to inherit, does not result in the loss of rights and does not affect the minimum two-year vesting period. The same applies, unless otherwise stated in the Company’s By-laws, in case of transfer following a merger or a spin-off of a shareholder company.
Restriction on voting rights In accordance with Article 14 of the Company’s By-laws, the number of votes at General Meetings to be used by one shareholder, either personally or through a proxy, may not exceed 15% of the total voting rights existing at the date of the Meeting. This 15% limit does not apply to the Chairman or any other proxy with respect to the total number of voting rights they hold on a personal basis and in their capacity as proxy, provided that each proxy complies with the 15% rule. For the purposes of applying this 15% limit, shares held by a single shareholder include shares held indirectly or jointly in accordance with the conditions described in Articles L. 233-7 et seq. of the French Commercial Code. This limit ceases to apply when a shareholder comes to hold, following a public tender offer, either directly or indirectly or jointly with another shareholder, more than 50.01% of the Company’s voting rights.
Disclosure of statutory threshold crossings In accordance with the provisions of Article 6.2 of the Company’s By-laws, any shareholder acting alone or jointly, who comes to hold directly or indirectly at least 1.5% of the share capital or of the voting rights in the Company, must inform the latter within fifteen days following the crossing of this threshold, and must also indicate in this statement the number of securities giving access to the share capital it holds. Mutual fund management companies must provide this information for all shares in the Company held by the funds they manage. Beyond 1.5%, the Company must be notified of each crossing of an additional 0.50% threshold of the share capital or voting rights, as provided by Article 6.2 of the Company’s By-laws.
Failure to comply with this requirement will be punished in accordance with legal provisions, at the request, duly recorded in the minutes of the General Meeting, of one or more shareholders holding at least 5% of the share capital or of the voting rights in the Company.
Any shareholder, acting alone or jointly, is also required to inform the Company within fifteen days when the percentage of share capital or voting rights it holds falls below each of the thresholds mentioned in Article 6.2 of the Company’s By-laws.
Convening and rules for attending General Meetings of Shareholders Under Article 14 of the Company’s By-laws, General Meetings are convened and deliberate in accordance with the conditions set forth by the laws and regulations in force. They meet at the registered office or in any other place in mainland France indicated in the convening notice. Such meetings are chaired by the Chairman of the Board of Directors or, failing this, by a Director appointed for this purpose by the Chairman of the Board of Directors.
Regardless of the number of shares held, any shareholder whose shares are registered under the terms and at a date set by decree, has the right, upon proof of their identity and status as a shareholder, to participate in the General Meetings. A shareholder may, in accordance with the laws and regulations in force, personally attend the General Meetings, vote remotely or appoint a proxy. The intermediary registered on behalf of shareholders may participate in the General Meetings, under the conditions set forth by the provisions of the laws and regulations in force.
In order for the ballots to be counted, they must be received by the Company at least two days before the General Meeting is held, unless a shorter period is specified in the convening notice or required by the regulations in force.
Shareholders may participate in General Meetings by videoconference or any other means of telecommunication, when provided for in the convening notice and subject to the conditions defined therein.
The General Meeting may be publicly broadcast by means of electronic communication subject to the approval of and under the terms set by the Board of Directors. Notice will be given in the notice of meeting and/or the convening notice.
In all General Meetings, the voting right attached to shares with a right of usufruct is exercised by the usufructuary.
Identifiable bearer securities Article 6.3 of the Company’s By-laws provides that Societe Generale may at any time, in accordance with the provisions of the laws and regulations in force, ask the organisation responsible for securities clearing to provide information relating to the securities granting the right to vote in its General Meetings, either immediately or in the future, as well as information about the holders of these securities.
PUBLICLY AVAILABLE DOCUMENTS The Company’s By-laws are included in this Registration Document. All reports, letters and other documents, historical financial data, assessments and statements prepared by any expert at the request of the issuer and included in part or referred to in the present document, as well as all financial information, including on subsidiaries, for each of the two financial years preceding the publication of this document, are available either on the Societe Generale Group website or at its administrative office.
(Updated on 11th December 2017)

7
BY-LAWS
4 I 7 SSHARE, SHARE CCAPITAL AND LEEGAL INFORMATION
S O C I E T E G E N E R AL E G R O U P I 2018 REGISTRATION DOCUMENT I 541
4 . B Y- L AW S(Updated on 11tth DDecember 22017)
TYPE OF COMPANY – NAME – REGISTERED OFFICE – PURPOSE
Article 1 The Company, named Societe Generale, is a public limited company incorporated by deed approved by the Decree of 4th May 1864, and is approved as a bank.
The duration of Societe Generale, previously fixed at 50 years with effect from 1st January 1899, was then extended by 99 years with effect from 1st January 1949.
Under the legislative and regulatory provisions relating to credit institutions, notably the articles of the French Monetary and Financial Code that apply to them, the Company is subject to commercial laws, in particular Articles L. 210-1 et seq. of the French Commercial Code, as well as these By-laws.
Article 2 Societe Generale’s registered office is at 29, boulevard Haussmann, Paris (9th arrondissement).
In accordance with current legislative and regulatory provisions it may be transferred to any other location.
Article 3 The purpose of Societe Generale is, under the conditions determined by the laws and regulations applicable to credit institutions, to carry out with individuals and corporate entities, in France or abroad:
all banking transactions;
all transactions related to banking operations, including inparticular investment services or allied services as listed byArticles L. 321-1 and L. 321-2 of the Monetary and FinancialCode;
all acquisitions of interests in other companies.
Societe Generale may also, on a regular basis, as defined in the conditions set by the French Financial and Banking Regulation Committee, engage in all transactions other than those mentioned above, including in particular insurance brokerage.
Generally, Societe Generale may carry out, on its own behalf, on behalf of a third party or jointly, all financial, commercial, industrial, agricultural, security or property transactions, directly or indirectly related to the abovementioned activities or likely to facilitate the accomplishment of such activities.
CAPITAL – SHARES
Article 4
4.1 SHARE CAPITAL The share capital amounts to EUR 1,009,897,173.75. This is divided into 807,917,739 fully paid-up shares, each with a nominal value of EUR 1.25.
4.2 CAPITAL INCREASE AND REDUCTION The capital may be increased or reduced on the decision of the competent General Meeting or Meetings.
Any capital reduction motivated by losses shall be divided between shareholders in proportion to their share of the capital.
Article 5 Unless otherwise provided by legislative and regulatory provisions, all shares have the same rights.
All shares which make up or which will make up the share capital will be given equal rank as regards taxes. Consequently, all taxes which, for whatever reason, may become payable on certain shares following capital reimbursement, either during the life of the Company or during its liquidation, shall be divided between all the shares making up the capital on such reimbursement(s) so that, while allowing for the nominal and non-amortised value of the shares and for their respective rights, all present or future shares shall entitle their owners to the same effective advantages and to the right to receive the same net sum.
Whenever it is necessary to possess a certain number of shares in order to exercise a right, it is incumbent on shareholders who own fewer shares than the total number required to assemble the necessary number of shares.
Article 6
6.1. FORM AND TRANSFER OF SHARES The shares may, in accordance with the holder’s wishes, be registered or bearer shares and shall be freely negotiable, unless otherwise stipulated by law.

7 I 4
BY-LAWS SSHARE, SHARE CAPITAL AAND LEEGAL INFORMATION
542 I 2018 REGISTRATION DOCUMENT I S O C I E T E G E N E R AL E G R O U P
6.2. STATUTORY THRESHOLDS Any shareholder acting on his own or jointly, who comes to hold directly or indirectly at least 1.5% of the capital or voting rights, must inform the Company within fifteen days of the time at which he exceeds this threshold, and must also indicate in his declaration the number of shares he holds in the share capital. Mutual fund management companies must provide this information based on the total number of shares held in the Company by the funds they manage. Beyond the initial 1.5%, shareholders are obliged to notify the Company, under the aforementioned conditions, whenever their holding of capital or voting rights exceeds an additional 0.50%.
Failure to comply with this requirement will be penalised in accordance with legal provisions on this matter, at the request of one or more shareholders with at least a 5% holding in the Company’s capital or voting rights. Said request will be duly recorded in the minutes of the General Meeting.
Any shareholder acting on his own or jointly, is also required to inform the Company within fifteen days if the percentage of his capital or voting rights falls below each of the thresholds described in this article.
6.3. IDENTIFICATION OF SHAREHOLDERS The Company can at any time, in accordance with current legislative and regulatory provisions, request that the organisation responsible for securities clearing provide information relating to the shares granting the right to vote in its General Meetings, either immediately or in the long term, as well as information about the holders of these shares.
6.4. SHAREHOLDERS’ RIGHTS The rights of shareholders shall comply with applicable legislative and regulatory provisions, subject to the specific provisions of the current by-laws.
BOARD OF DIRECTORS
Article 7
I – DIRECTORS The Company is managed by a Board of Directors made up of two categories of Directors:
1. DIRECTORS APPOINTED BY THE ORDINARY GENERAL MEETING OF SHAREHOLDERS
There are at least nine of these Directors, and thirteen at the most.
The term of office of Directors appointed by the Ordinary General Meeting shall expire four years after the approval of the current article. This provision does not apply to Directors in office at the time of this approval.
When, in application of current legislative and regulatory provisions, a Director is appointed to replace another, then his term of office shall not exceed the term of office remaining to be served by his predecessor.
Each Director must hold at least six hundred shares.
2. DIRECTORS ELECTED BY EMPLOYEES
The status and methods of electing these Directors are laid down by Articles L. 225-27 to L. 225-34 of the French Commercial Code, as well as by these By-laws.
There are two Directors, one to represent the executives and one to represent all other Company employees.
In any event, their number may not exceed one-third of the Directors appointed by the General Meeting.
Their term of office is three years.
Regardless of the appointment procedure, the duties of a Director cease at the end of the Ordinary General Meeting called to approve the financial statements of the previous fiscal year and held during the year in which his term of office expires.
Directors may be re-elected, as long as they meet the legal provisions, particularly with regard to age.
II – METHODS OF ELECTING DIRECTORS ELECTED BY EMPLOYEES For each seat to be filled, the voting procedure is that set forth by law.
The first Directors elected by employees will begin their term of office during the Board of Directors’ meeting held after publication of the full results of the first elections.
Subsequent Directors shall take up office upon expiry of the outgoing Directors’ terms of office.
If, under any circumstances and for any reason whatsoever, there shall remain in office less than the statutory number of Directors before the normal end of the term of office of such Directors, vacant seats shall remain vacant until the end of the term of office and the Board shall continue to meet and take decisions validly until that date.
Elections shall be organised every three years so that a second vote may take place at the latest fifteen days before the normal end of the term of office of outgoing Directors.
For both the first and second ballot, the following deadlines should be adhered to:
posting of the date of the election at least eight weeks before the polling date;
posting of the lists of the electors at least six weeks before the polling date;
registration of candidates at least five weeks before the polling date;
posting of lists of candidates at least four weeks before the polling date;
sending of documents required for postal voting at least three weeks before the polling date.
The candidatures or lists of candidates other than those entered by a representative trade union should be accompanied by a document including the names and signatures of the one hundred employees presenting the candidates.

7
BY-LAWS
4 I 7 SSHARE, SHARE CCAPITAL AND LEEGAL INFORMATION
S O C I E T E G E N E R AL E G R O U P I 2018 REGISTRATION DOCUMENT I 543
Polling takes place the same day, at the work place, and during working hours. Nevertheless, the following may vote by post:
employees not present on the day of polling;
employees working abroad;
employees of a department or office or seconded to a subsidiary in France not having a polling station, or who cannot vote in another office.
Each polling station consists of three elective members, the Chairman being the oldest one among them. The Chairman is responsible for seeing that voting operations proceed correctly.
Votes are counted in each polling station, and immediately after the closing of the polls; the report is drawn up as soon as the counting has been completed.
Results are immediately sent to the Head Office of Societe Generale, where a centralised results station will be set up with a view to drafting the summary report and announcing the results.
Methods of polling not specified by Articles L. 225-27 to L. 225-34 of the French Commercial Code or these By-laws are decreed by the General Management after consulting with the representative trade unions.
These methods may include electronic voting, whose organisation may deviate from the practical organisation of the election described herein.
III – NON-VOTING DIRECTORS On the proposal of the Chairman, the Board of Directors may appoint one or two Non-Voting Directors.
Non-Voting Directors are convened and attend Board of Directors’ meetings in a consultative capacity.
They are appointed for a period not exceeding four years and the Board can renew their terms of office or terminate them at any time.
They may be selected from among shareholders or non-shareholders, and receive an annual remuneration determined by the Board of Directors.
Article 8 The Board of Directors determines the Company’s strategy and ensures its implementation. Subject to the powers expressly attributed to the General Meeting and within the scope provided for in the corporate purpose, it considers all matters that affect the Company’s operations and settles by its decisions matters that concern it.
It carries out all the controls and verifications it deems appropriate. The Chairman or Chief Executive Officer is required to furnish each Director with all documents required to carry out their function.
Article 9 The Board of Directors elects a Chairman from among its natural person members, determines his remuneration and sets the duration of his term of office, which may not exceed that of his term of office as Director.
No member of 70 years of age or more shall be appointed Chairman. If the Chairman in office reaches the age of 70, his duties shall cease after the next Ordinary General Meeting called to approve the financial statements of the preceding fiscal year.
The Chairman organises and manages the work of the Board of Directors and reports on its activities to the General Meeting. He ensures that the Company’s bodies operate correctly and in particular ensures that the Directors are able to fulfil their functions.
Article 10 The Board of Directors meets as often as is required by the interests of the Company, upon convocation by the Chairman, either at the registered office or in any other place indicated in the Notice of Meeting. The Board examines the items placed on the agenda.
It shall meet when at least one-third of Board members or the Chief Executive Officer submits a request for a meeting with a specific agenda to the Chairman.
If the Chairman is unable to attend, the Board of Directors can be convened either by one-third of its members, or by the Chief Executive Officer or a Deputy Chief Executive Officer, provided they are members of the Board.
Unless specifically provided for, Directors are called to meetings by letter or by any other means. In any event, the Board may always deliberate validly if all its members are present or represented.
Article 11 Board meetings are chaired by the Chairman of the Board of Directors or, in his absence, by a Director designated for this purpose at the beginning of the meeting.
Every Director may give his proxy to another Director, but a Director may act as proxy for only one other Director and a proxy can only be given for one specific meeting of the Board.
In all cases, deliberations of the Board are valid only if at least half the members are present.
The Chief Executive Officer attends meetings of the Board.
One or several delegates of the Central Works Council attend Board meetings, under the conditions laid down by the legislation in force.
At the request of the Chairman of the Board of Directors, members of the General Management, the Statutory Auditors or other persons outside the Company with specific expertise relating to the items on the agenda may attend all or part of a Board meeting.
Resolutions are adopted by a majority vote of the Directors present or represented. In the event of a tie, the Chairman holds a casting vote.
A member of the Management appointed by the Chairman serves as Secretary of the Board.
Minutes are prepared and copies or extracts certified and delivered in accordance with the law.
Article 12 Members of the Board may receive Director’s fees in the form of a global sum set by the General Meeting distributed by the Board among its members as it sees fit.

7 I 4
BY-LAWS SSHARE, SHARE CAPITAL AAND LEEGAL INFORMATION
544 I 2018 REGISTRATION DOCUMENT I S O C I E T E G E N E R AL E G R O U P
GENERAL MANAGEMENT
Article 13 The General Management of the Company is the responsibility of either the Chairman of the Board of Directors or any other individual appointed by the Board of Directors to act as Chief Executive Officer.
The Board of Directors may choose between the two general management structures, and its decision is only valid if:
the agenda with respect to this choice is sent to members at least 15 days before the date of the Board meeting;
at least two-thirds of Directors are present or represented.
Shareholders and third parties shall be informed of this decision in accordance with the regulations in force.
When the Chairman of the Board of Directors assumes responsibility for the general management of the Company, the following provisions relating to the Chief Executive Officer shall be applicable to him.
The Chief Executive Officer shall be granted exhaustive powers to act on behalf of the Company in all matters. He shall exercise these powers within the scope of the Company’s purpose and subject to those powers expressly assigned by law to meetings of shareholders and the Board of Directors. He shall represent the Company vis-à-vis third parties.
The Board of Directors sets the remuneration and the duration of the Chief Executive Officer’s term, which may not exceed that of the dissociation of the functions of Chairman and Chief Executive Officer nor, where applicable, the term of his Directorship.
No person aged 70 or more may be appointed Chief Executive Officer. If the Chief Executive Officer in office reaches 70 years of age, his functions shall end at the end of the next Ordinary General Meeting called to approve the financial statements of the preceding fiscal year.
On recommendation by the Chief Executive Officer, the Board of Directors can appoint up to five persons to assist the Chief Executive Officer, who shall have the title Deputy Chief Executive Officer.
In agreement with the Chief Executive Officer, the Board of Directors determines the extent and duration of the powers granted to Deputy Chief Executive Officers. The Board of Directors sets their remuneration. With respect to third parties, Deputy Chief Executive Officers have the same powers as the Chief Executive Officer.
SHAREHOLDERS’ MEETING
Article 14 General Meetings are comprised of all shareholders.
The General Meeting is called and deliberates as provided for by the legal and regulatory provisions in force.
It meets at the Company’s head office or in any other place in mainland France indicated in the Notice to attend the General Meeting.
Such meetings are chaired by the Chairman of the Board or, in his absence, by a Director appointed for this purpose by the Chairman of the Board.
Regardless of the number of shares held, all shareholders whose shares are registered under the terms and at a date set forth by decree have the right, upon proof of their identity and status as a shareholder, to participate in the General Meetings. They may, as provided for by the legal and regulatory provisions in force, personally attend the General Meetings, vote remotely or appoint a proxy.
The intermediary registered on behalf of shareholders may participate in the General Meetings as provided for by the legal and regulatory provisions in force.
In order for the ballots to be counted, they must be received by the Company at least two days before the General Meeting is held, unless otherwise specified in the Notice of Meeting or required by the regulations in force.
Shareholders may participate in General Meetings by videoconference or any other means of telecommunication, when stipulated in the Notice of Meeting and subject to the conditions provided therein.
The General Meeting may be publicly broadcast by means of electronic communication subject to the approval and under the terms set by the Board of Directors. Notice will be given in the preliminary Notice of Meeting and/or Notice to attend the Meeting.
Double voting rights, in relation to the share of capital stock they represent, are allocated to all those shares which are fully paid up and which have been registered in the name of the same shareholder for at least two years as from 1st January 1993. Double voting rights are also allocated to new registered shares that may be allocated free of charge to a shareholder in respect of the shares with double voting rights already held by him, in the case of a capital increase by incorporation of reserves, earnings, or additional paid-in capital.
The number of votes at General Meetings to be used by one shareholder, either personally or by a proxy, may not exceed 15% of total voting rights at the date of the Meeting.
This 15% limit does not apply to the Chairman or any other proxy with respect to the total number of voting rights they hold on a personal basis and in their capacity as proxy, provided each shareholder for whom they act as proxy complies with the rule stipulated in the previous paragraph.
For the purposes of applying this limit, shares held by a single shareholder include shares held indirectly or jointly in accordance with the conditions described in Articles L. 233-7 et seq. of the French Commercial Code.
This limit ceases to apply when a shareholder acquires – either directly or indirectly or jointly with another shareholder – more than 50.01% of the Company’s voting rights following a public offering.
In all General Meetings, the voting right attached to shares that include a usufructuary right is exercised by the usufructuary.

7
BY-LAWS
4 I 7 SSHARE, SHARE CCAPITAL AND LEEGAL INFORMATION
S O C I E T E G E N E R AL E G R O U P I 2018 REGISTRATION DOCUMENT I 545
SPECIAL MEETINGS
Article 15 When different categories of shares exist, the Special Meetings of the shareholders of such categories of shares deliberate as provided by applicable legislative and regulatory provisions and Article 14 herein.
AUDITORS
Article 16 The Statutory Auditors are appointed and carry out their duties according to the applicable statutory and regulatory provisions.
ANNUAL FINANCIAL STATEMENTS
Article 17 The financial year starts on 1st January and ends on 31st December.
The Board of Directors prepares the financial statements for the year under the conditions set by the applicable laws and regulations.
All other documents prescribed by the applicable laws and regulations are also drawn up.
Article 18 The results for the year are determined in accordance with the applicable legal and regulatory provisions.
At least 5% of the profits for the year, less any previous losses, must be set aside by law to form a reserve fund until said fund reaches 10% of the capital.
The net income available after this deduction, increased by any net income brought forward, constitutes the profits available for distribution, to be successively allocated to ordinary, extraordinary or special reserves or to be carried forward in those
amounts which the General Meeting may deem useful, upon the recommendation of the Board of Directors.
The balance is then allocated to the shareholders in proportion to their stake in the share capital.
The General Meeting may also resolve to distribute amounts from available reserves.
The General Meeting approving the annual financial statements may, with regard to the whole or part of the dividend or interim dividend, grant each shareholder the option to choose between payment of the dividend or interim dividend in cash or in shares in accordance with the conditions set by the laws in force. A shareholder who exercises this option must do so for all of the dividends or interim dividends attached to their shares.
Except in cases of a reduction in capital, no distribution may be made to shareholders if the shareholders’ equity of the Company is or may subsequently become less than the minimum capital and reserves that may not be distributed by law or under the Company’s By-laws.
FORUM SELECTION CLAUSE
Article 19 Any dispute arising during the life of the Company or during its liquidation, between the Company and its shareholders or among the shareholders themselves, related to Company matters shall be brought before the courts under the proper jurisdiction effective at the Company’s registered office.
DISSOLUTION
Article 20 In the event that Societe Generale is wound up and unless otherwise provided for by law, the General Meeting determines the method of liquidation, appoints the liquidators on the proposal of the Board of Directors and continues to exercise its assigned powers during said liquidation until completion thereof.
The net assets remaining after repayment of the nominal value of the shares are distributed among the shareholders, in proportion to their share of the capital.

7 I 5
INTERNAL RULES OF THE BOARD OF DIRECTORS SSHARE, SHARE CAPITAL AAND LEEGAL INFORMATION
546 I 2018 REGISTRATION DOCUMENT I S O C I E T E G E N E R AL E G R O U P
5 . I N T E R N A L R U L E S O F T H E B O A R D O F D I R E C T O R S ( 1 )
(Updated on 12tth JJanuary 2018)
Preamble The Board of Directors collectively represents all shareholders and acts in the Company’s interest. Each Director, regardless of the manner in which he/she was appointed, must act in all circumstances in the Company’s corporate interest.
Societe Generale applies the AFEP-MEDEF Corporate Governance Code for listed companies. As a credit institution, Societe Generale is subject to the provisions of the French Commercial Code, the French Monetary and Financial Code and more generally the regulatory texts applicable to the banking sector.
The purpose of these Internal Rules is to define the Board of Directors’ organisation and operating procedures and to specify the rights and obligations of its members.
The Board of Directors ensures that Societe Generale has a solid governance system including, in particular, a clear organisation ensuring a well-defined, transparent and coherent sharing of responsibilities, effective procedures for the detection, management, monitoring and reporting of risks to which the Company is or could be exposed, an adequate internal control system, sound administrative and accounting procedures and compensation policies and practices enabling and promoting sound and effective risk management.
Article 1: Powers of the Board of Directors 1.1 - The Board of Directors shall deliberate on any issue falling within its legal or regulatory powers and devote sufficient time to perform its missions.
1.2 - The Board of Directors is competent, the enumeration is not to be regarded as exhaustive, in the following areas:
a) Strategic directions and operations
The Board of Directors:
approves the Group’s strategic directions, ensures their implementation and reviews them at least once a year; these directions include the values and the code of conduct of the Group as well as the main thrusts of the policy followed with respect to social and environmental responsibility, human resources, information systems and organisation;
approves the plans for strategic operations, in particular acquisitions or disposals, which may have a significant impact on the Group’s earnings, its balance sheet structure or its risk profile.
This prior approval process concerns:
organic growth transactions of a unit amount higher than EUR 250 million and not already approved as part of the annual budget or the strategic plan;
external growth transactions of a unit amount higher than 3% of the Group’s consolidated shareholders’ equity or higher than 1.50% of the Group’s consolidated shareholders’ equity if these transactions do not fall within the development priorities approved in the strategic plan;
disposal transactions of a unit amount higher than 1.50% of the Group’s consolidated shareholders’ equity;
partnership transactions with a compensation (soulte) of an amount higher than 1.50% of the Group’s consolidated shareholders’ equity;
transactions substantially degrading the Group’s risk profile.
The Chairman shall assess, on a case-by-case basis, the appropriateness of a referral to the Board of Directors to deliberate on a transaction that does not fall under the aforementioned circumstances.
During each Board of Directors’ meeting, an update is made on the transactions concluded since the previous meeting as well as on the main projects in progress and likely to be concluded before the next Board of Directors’ meeting.
b) Financial statements and communication
The Board of Directors:
ensures the accuracy and truthfulness of the annual and consolidated annual accounts and the quality of the information provided to the shareholders and the market;
approves the management report;
controls the publication and communication process, the quality and reliability of the information to be published and communicated.
c) Risk management
The Board of Directors:
approves the global strategy and the appetite in terms of risks of any kind and controls the related implementation. To this end, it approves and regularly reviews the strategies and policies governing the taking, management, monitoring and reduction of the risks to which the Company is or could be exposed, including the risks created by the economic environment; ensures, in particular, the adequacy and effectiveness of the risk management systems, controls the risk exposure from its activities and approves the overall risk limits; ensures the effectiveness of the corrective measures taken in the event of a default.
(1) This document does not form part of Societe Generale’s By-laws.
2.1 -
2.2 -
3.1 -
3.2 -
3.3 -
3.4 -
3.5 -
3.6 -

7
(Updated on 12th January 2018)
1.1 -
1.2 -
INTERNAL RULES OF THE BOARD OF DIRECTORS
5 I 7 SSHARE, SHARE CAPITAL AAND LEEGAL INFORMATION
S O C I E T E G E N E R AL E G R O U P I 2018 REGISTRATION DOCUMENT I 547
d) Governance
The Board of Directors:
appoints the Chairman, the Chief Executive Officer and, upon the latter’s proposal, the Deputy Chief Executive Officer(s); it determines any possible limitations on the powers of the Chief Executive Officer and the Deputy Chief Executive Officer(s);
reviews the governance system, periodically assesses its effectiveness and ensures that corrective measures to remedy potential shortcomings have been taken;
ensures, in particular, compliance with the banking regulations with respect to internal control;
determines the orientations and controls the implementation by the Effective Senior Managers(1) of the oversight systems in order to ensure effective and prudent management of the institution, in particular the avoidance of conflicts of interest;
deliberates on changes to the Group’s management structures prior to their implementation and is informed of the main changes to its organisation;
deliberates at least once a year, on its operation and that of its Committees, on the skills, aptitudes and availability of its members (see Articles 2 and 3) as well as on the conclusions of the periodic assessment thereof;
reviews once a year the succession plan for the chief executive officers (dirigeants mandataires sociaux);
gives, where appropriate, its prior consent to the dismissal of the Chief Risk Officer, after the Risk Committee and the Nomination and Corporate Governance Committee have been consulted;
prepares the Report on corporate governance submitted to the General Meeting of Shareholders.
e) Compensation and wage policy
The Board of Directors:
distributes the attendance fees in accordance with Article 15 of these Internal Rules;
establishes the compensation policy principles applicable in the Group, in particular regarding the categories of staff whose activities have a significant impact on the Group’s risk profile, and ensures that the internal control systems enable to verify that these principles comply with the regulations and professional standards and are consistent with the objectives for risk control;
sets the compensation of the chief executive officers (dirigeants mandataires sociaux), in particular their fixed and variable compensation, including benefits in kind, allocations of performance shares or any compensation instruments, as well as post-employment benefits;
deliberates once a year on the Company’s policy regarding professional and wage equality between men and women.
f) Preventive recovery plan
The Board of Directors:
establishes the preventive recovery plan that is communicated to the European Central Bank and deliberates on any similar plan requested by foreign supervisory authorities.
Article 2: Skills/Aptitudes of the members of the Board of Directors 22.1 -- The members of the Board of Directors shall have at all times the good repute, knowledge, skills and experience necessary for the performance of their duties and, collectively, the knowledge, skills and experience necessary to understand the Company’s activities, including the main risks to which it is exposed.
22.2 -- Each Director continually ensures to improve his/her knowledge of the Company and its sector of activity.
Article 3: Availability of the members of the Board of Directors 33.1 -- The members of the Board of Directors shall devote sufficient time to the performance of their functions.
Under the conditions defined by the legislation in force, they may hold, within any legal entity, only one executive directorship and two non-executive directorships or only four non-executive directorships. For the purpose of this rule, directorships held within the same group are considered to be a single directorship. The European Central Bank may authorise a member of the Board of Directors to hold an additional non-executive directorship.
33.2 -- Any Director holding an executive directorship in the Group must obtain the opinion of the Board of Directors before accepting a mandate in a listed company; the Director must comply with the procedure set out in Article 14 "Conflicts of interest."
33.3 -- The Director shall promptly inform the Chairman of any change in the number of directorships held, including his/her participation in a committee of a Board, as well as any change in professional responsibility.
He/she undertakes to let the Board of Directors decide whether he/she should continue to serve as a Director in the event of a significant change in his/her professional responsibilities or mandates.
He/she undertakes to resign from his/her directorship when he/she no longer considers himself/herself able to perform his/her duties within the Board of Directors and the Committees of which he/she is a member.
33.4 -- The Directors, under the conditions defined by the By-laws, may participate in meetings of the Board or of the Committees by videoconference or telecommunication means enabling their identification and guaranteeing their effective participation.
33.5 -- The Registration Document reports on the attendance of Directors at meetings of the Board of Directors and the Committees.
33.6 -- The Directors shall attend the General Meetings of Shareholders.
(1) Persons designated as such with the European Central Bank (ECB) and the French Prudential Supervisory and Resolution Authority (ACPR) pursuant to banking regulations. For Societe Generale, these are the Chief Executive Officer and the Deputy Chief Executive Officers.

7 I 5
INTERNAL RULES OF THE BOARD OF DIRECTORS SSHARE, SHARE CAPITAL AAND LEEGAL INFORMATION
548 I 2018 REGISTRATION DOCUMENT I S O C I E T E G E N E R AL E G R O U P
Article 4: Ethics of the members of the Board of Directors 44.1 -- The Director keeps, in all circumstances, his/her independence of analysis, judgement, decision and action.
He/she undertakes not to seek or accept any benefit likely to compromise his/her independence.
44.2 -- Each Director must comply with the provisions of the rules on market abuse (regulation (EU) n° 596/2014 dated 16 April 2014 and its delegated and implementing regulations supplementing it and defining technical standards; French Monetary and Financial Code; General Regulations, position-recommendation and instruction of the French Financial Markets Authority) in particular the ones relating to the communication and the use of inside information with regard to Societe Generale shares, debt securities and derivatives instruments or other financial instruments related to the Societe Generale share (hereinafter, Financial instruments). He/she must also comply with these same rules for Financial instruments of his/her subsidiaries or listed investments or companies on which he/she may hold inside information received as a result of his/her participation in the Board of Directors of Societe Generale.
44.3 -- Directors shall abstain from intervening on the market of Societe Generale Financial instruments during the 30 calendar days preceding the publication of Societe Generale’s quarterly, half-yearly and annual results as well as on the day of the said publication.
They shall refrain from carrying out speculative or leveraged transactions on Societe Generale Financial instruments or those of a listed company controlled directly or indirectly by Societe Generale within the meaning of Article L. 233-3 of the French Commercial Code.
They shall inform the Secretary of the Board of Directors of any difficulty they may encounter in enforcing the above.
44.44 -- In accordance with the regulations in force, Directors and persons closely associated with them must report to the French Financial Markets Authority (AMF) the transactions carried out on Societe Generale Financial instruments.
A copy of this statement is also sent to the Secretary of the Board of Directors.
44.5 -- Directors must hold in registered form all Societe Generale shares they have under the obligation provided for in Article 16 of these Internal Rules.
Article 5: The Chairman of the Board of Directors 55.1 -- The Chairman convenes and chairs the Board of Directors meetings. He/she sets the timetable and agenda of the meetings. He/she organises and manages the work of the Board of Directors and reports on its activities to the General Meeting. He/she chairs the General Meetings of Shareholders.
55.2 -- The Chairman ensures the proper functioning of the Company’s bodies and the implementation of the best corporate governance practices, in particular as regards the Committees set up within the Board of Directors, which he/she may attend without the right to vote. He/she may submit questions for the consideration of these Committees.
55.3 -- He/she receives all information relevant to his/her missions. He/she is regularly informed by the Chief Executive Officer and, where applicable, the Deputy Chief Executive Officers, of
significant events relating to the life of the Group. He/she may request the disclosure of any information or document that may inform the Board of Directors. For the same purpose, he/she may hear the Statutory Auditors and, after having informed the Chief Executive Officer, any Group senior manager.
55.4 -- He/she ensures that the Directors are in a position to fulfil their missions and ensures that they are properly informed.
55.5 -- He/she is the only person authorised to speak on behalf of the Board of Directors, except in exceptional circumstances or with a specific mandate entrusted to another Director.
55.6 -- He/she devotes his/her best efforts to promote in all circumstances the values and the image of the Company. In consultation with the General Management, he/she may represent the Group in its high-level relations, in particular with major clients, regulators, major shareholders and public authorities, both domestically and internationally.
55.7 -- He/she has the material resources necessary for the performance of his/her missions.
55.8 -- The Chairman has no executive responsibilities, these responsibilities being exercised by the General Management which proposes and applies the Company’s strategy, within the limits defined by law and in compliance with the corporate governance rules and directions set by the Board of Directors.
Article 6: Meetings of the Board of Directors 66.1 -- The Board of Directors shall hold at least eight meetings per year.
66.2 -- The Directors who participate in the meeting of the Board of Directors by means of videoconference or telecommunication enabling their identification and guaranteeing their effective participation shall be deemed present for the calculation of the quorum and the majority. To this end, the means chosen shall transmit at least the voice of the participants and comply with technical characteristics enabling the continuous and simultaneous transmission of the deliberations.
This provision does not apply when the Board of Directors is convened to carry out the work for establishing and adopting the annual and consolidated annual accounts and the Management Report.
66.3 -- Convening notices, which may be transmitted by the Secretary of the Board of Directors, are sent by letter, fax, e-mail or by any other means, including verbally.
66.4 -- Upon decision of the Chairman, the Deputy Chief Executive Officers or other Group senior managers or, where relevant, external persons whose attendance is useful to the deliberations may attend all or part of the meetings of the Board of Directors.
Article 7: Information provided to the Board of Directors 77.1 -- The Chairman or the Chief Executive Officer shall provide each Director with all information and documents necessary for the performance of his/her missions; he/she is provided with computer equipment enabling easy access to them.
77.2 -- Effective Senior Managers shall inform the Board of Directors of all significant risks, risk management policies and changes made to them.
7.3 -
7.4 -
8.1 -
8.2 -
8.3 -
9.1 -
9.2 -
9.3 -
9.4 -
9.5 -
9.6 -
9.7 -
9.8 -
9.9 -
9.10 -
9.11 -
10.1 -
10.2 -
7
4.1 -
4.2 -
4.3 -
4.4 -
4.5 -
5.1 -
5.2 -
5.3 -
5.4 -
5.5 -
5.6 -
5.7 -
5.8 -
6.1 -
6.2 -
6.3 -
6.4 -
7.1 -
7.2 -
INTERNAL RULES OF THE BOARD OF DIRECTORS
5 I 7 SSHARE, SHARE CAPITAL AAND LEEGAL INFORMATION
S O C I E T E G E N E R AL E G R O U P I 2018 REGISTRATION DOCUMENT I 549
77.3 -- If necessary, in the event of changes in the risks affecting or likely to affect the Company, the Chief Risk Officer may report directly to the Board of Directors.
77.4 -- Meetings of the Board of Directors and the Committees are preceded by the on-line publication or availability in due course of a file on the agenda items that require special analysis and prior reflection whenever the respect of confidentiality so permits.
Moreover, between meetings, Directors shall receive all useful information, including critical information, about events or transactions significant for the Company. In particular, they shall receive press releases issued by the Company.
Article 8: Training of Directors 88.1 -- The Company devotes the necessary human and financial resources to the training of the Directors and, especially, the Directors representing the employees.
88.2 -- Training sessions on the specificities of the banking activity are organised each year.
Each Director may, on his/her appointment or throughout his/her term of office, benefit from any training that he/she deems necessary for the performance of the mandate.
88.3 -- These training sessions shall be organised by the Company which shall bear their costs.
Article 9: Committees of the Board of Directors 99.1 -- In certain areas, the Board of Directors’ deliberations are prepared by specialised Committees composed of Directors appointed by the Board of Directors, which examine matters within their remit and submit their opinions and proposals to the Board of Directors.
99.2 -- These Committees are composed of members of the Board of Directors who do not hold any executive function within the Company and who have suitable knowledge for the performance of the missions of the Committee in which they participate.
These Committees may decide, as necessary, to involve other Directors, without the right to vote, in their meetings.
99.3 -- They shall have the necessary means to perform their missions and act under the responsibility of the Board of Directors.
99.44 -- In the performance of their respective duties, they may request the communication of any relevant information, hear the Chief Executive Officer, the Deputy Chief Executive Officers as well as the Group’s senior managers and, after having informed the Chairman, request the carrying out of external technical studies, at the Company’s expense. They shall report on the information obtained and the opinions collected.
99.5 -- There are four standing Committees:
the Audit and Internal Control Committee;
the Risk Committee;
the Compensation Committee; and
the Nomination and Corporate Governance Committee.
99.6 -- Upon decision of the Chairmen of the relevant Committees, joint meetings between Committees may be arranged on topics of common interest. These meetings are co-chaired by the Chairmen of the Committees.
99.7 -- The Board of Directors may create one or more “ad hoc” Committees.
99.8 -- The Risk Committee, the Compensation Committee and the Nomination and Corporate Governance Committee may perform their missions for Group companies on a consolidated or sub-consolidated basis.
99.9 -- Each Committee shall be chaired by a Chairman appointed by the Board of Directors based on a proposal from the Nomination and Corporate Governance Committee.
The Secretariat of each Committee is provided by a person designated by the Secretary of the Board of Directors.
99.10 -- The Chairman of each Committee shall report to the Board of Directors on the Committee’s work. A written report of the Committees’ work shall be regularly circulated to the Board of Directors.
Each Committee shall submit its annual work programme to the Board of Directors.
99.11 -- Each Committee shall give an opinion to the Board of Directors on the part of the Registration Document dealing with the issues falling within its scope of activity and prepare an annual activity report, submitted to the Board of Directors’ approval, to be inserted in the Registration Document.
Article 10: The Audit and Internal Control Committee 110.1 -- The Audit and Internal Control Committee’s mission is to monitor issues concerning the preparation and control of accounting and financial information as well as the monitoring of the effectiveness of internal control, measurement, monitoring and risk control systems.
110.2 -- In particular, it is responsible for:
a) ensuring the monitoring of the process for the production of the financial information, particularly reviewing the quality and reliability of existing systems, making proposals for their improvement and ensuring that corrective actions have been implemented in the event of a malfunction in the process; where appropriate, it makes recommendations to ensure their integrity;
b) analysing the draft accounts to be submitted to the Board of Directors in order to, in particular, verify the clarity of the information provided and assess the relevance and consistency of the accounting methods adopted for drawing up annual accounts and consolidated annual accounts;
c) conducting the procedure for selecting the Statutory Auditors and issuing a recommendation to the Board of Directors, developed in accordance with the provisions of Article 16 of the regulation (EU) n° 537/2014 dated 16 April 2014, concerning their appointment or renewal as well as their remuneration;
d) ensuring the independence of the Statutory Auditors in accordance with the regulations in force;
7 I 5
INTERNAL RULES OF THE BOARD OF DIRECTORS SSHARE, SHARE CAPITAL AAND LEEGAL INFORMATION
550 I 2018 REGISTRATION DOCUMENT I S O C I E T E G E N E R AL E G R O U P
e) approving, in accordance with Article L. 823-19 of the French Commercial Code and the policy adopted by the Board of Directors, the provision of services other than the certification of accounts referred to in Article L. 822-11-2 of the said Code after analysing the risks to the Statutory Auditor’s independence and the safeguard measures applied by the latter;
f) reviewing the work programme of the Statutory Auditors and, more generally, monitoring the control of the accounts by the Statutory Auditors in accordance with the regulations in force;
g) ensuring the monitoring of the effectiveness of internal control, risk management and internal audit systems, with regard to the procedures for the preparation and processing of the accounting and financial information. To this end, the Committee is responsible in particular for:
– reviewing the internal control and risk control of the business segments, divisions and main subsidiaries;
– reviewing the Group’s periodic monitoring programme and giving its opinion on the organisation and functioning of the internal control departments;
– reviewing the follow-up letters from the banking and markets supervisors and issuing an opinion on draft replies to these letters;
h) reviewing the reports prepared in order to comply with the regulations in terms of internal control.
110.3 -- It regularly reports to the Board of Directors on the performance of its missions, including the outcomes of the mission of certification of the accounts, how this mission contributed to the integrity of the financial information and the role it played in this process. It informs the Board of Directors without delay of any difficulty encountered.
110.4 -- The Statutory Auditors shall be invited to the meetings of the Audit and Internal Control Committee, unless the Committee decides otherwise. They may also be consulted outside these meetings.
110.5 -- The Audit and Internal Control Committee or its Chairman also hear the heads of the internal control functions (risk, compliance, internal audit) as well as the Chief Financial Officer and, as necessary, the managers in charge of drawing up the accounts, internal control, risk control, compliance control and periodic control.
110.6 -- The Audit and Internal Control Committee is composed of at least three Directors appointed by the Board of Directors, who have the appropriate financial, accounting, or statutory audit skills. At least two thirds of the Committee’s members are independent within the meaning of the AFEP-MEDEF Corporate Governance Code.
Article 11: The Risk Committee 111.1 -- The Risk Committee advises the Board of Directors on the overall strategy and the appetite regarding all kinds of risks, both current and future, and assists it when it controls the implementation of this strategy.
111.2 -- In particular, it is responsible for:
a) preparing the debates of the Board of Directors on documents relating to risk appetite;
b) reviewing the risk control procedures and is consulted for the setting of overall risk limits;
c) undertaking a regular review of the strategies, policies, procedures and systems used to detect, manage and monitor the liquidity risk and communicating its conclusions to the Board of Directors;
d) issuing an opinion on the Group’s global provisioning policy, as well as on specific provisions for significant amounts;
e) reviewing the reports prepared to comply with the banking regulations on risks;
f) reviewing the policy concerning risk control and the monitoring of off-balance sheet commitments, especially in the light of the memoranda prepared to this end by the Finance Division, the Risk Division and the Statutory Auditors;
g) reviewing, as part of its mission, whether the prices for the products and services mentioned in books II and III of the French Monetary and Financial Code and offered to clients are consistent with the Company’s risk strategy. When these prices do not correctly reflect the risks, it informs the Board of Directors accordingly and gives its opinion on the action plan to remedy the situation;
h) without prejudice to the Compensation Committee’s missions, reviewing whether the incentives provided for by the compensation policy and practices are consistent with the Company’s situation with regard to the risks to which it is exposed, its capital and its liquidity, as well as the probability and timing of expected benefits;
i) reviewing the risks associated with the Group’s implementation of the guidelines on social and environmental responsibility and the indicators relating to the Conduct as part of the "Culture and Conduct" programme;
j) reviewing the enterprise risk management related to the Company’s operations in the United States. When acting as US Risk Committee, the Risk Committee is composed of its members and those of the Audit and Internal Control Committee(1).
111.3 -- It has all information on the Company’s risk situation. It may use the services of the Chief Risk Officer or external experts.
(1) In accordance with the requirements of the U.S. Federal Reserve’s Enhanced Prudential Standards Rules, the Risk Committee will hold quarterly meetings to review the Company’s operations in the United States. The Risk Committee’s obligations in this regard include the review of the enterprise risk management related to the Company’s operations in the United States. As such, the Risk Committee must:
a) receive regular reports from the US-based Chief Risk Officer of the Company; b) review the risk management system for the Company’s combined operations in the United States; and c) review the Company’s liquidity risk in the United States.
11.4 -
11.5 -
12.1 -
12.2 -
12.3 -
12.4 -
12.5 -
12.6 -
12.7 -
13.1 -
13.2 -

7
10.3 -
10.4 -
10.5 -
10.6 -
11.1 -
11.2 -
11.3 -
INTERNAL RULES OF THE BOARD OF DIRECTORS
5 I 7 SSHARE, SHARE CAPITAL AAND LEEGAL INFORMATION
S O C I E T E G E N E R AL E G R O U P I 2018 REGISTRATION DOCUMENT I 551
111.4 -- The Statutory Auditors are invited to the meetings of the Risk Committee, unless the Committee decides otherwise. They may also be consulted outside these meetings.
The Risk Committee or its Chairman hear the heads of the internal control functions (risk, compliance, internal audit) as well as the Chief Financial Officer and, as necessary, the managers responsible for drawing up the accounts, internal control, risk control, compliance control and periodic control.
111.5 -- The Risk Committee is composed of at least three Directors appointed by the Board of Directors who have knowledge, skills and expertise concerning risks. At least two thirds of the Committee’s members are independent within the meaning of the AFEP-MEDEF Corporate Governance Code.
Article 12: The Compensation Committee 112.1 -- The Compensation Committee prepares the decisions that the Board of Directors adopts concerning compensation, especially those related to the chief executive officers (dirigeants mandataires sociaux) as well as those that have an impact on the risk and the management of risks in the Company.
112.2 -- It conducts an annual review of:
a) the principles of the Company’s compensation policy;
b) the compensation, allowances and benefits of any kind granted to the Company’s executive officers (mandataires sociaux) as well as the Effective Senior Managers, if they are different;
c) the compensation policy for regulated employees within the meaning of the banking regulations.
112.3 -- It controls the compensation of the Chief Risk Officer and the Chief Compliance Officer.
112.4 -- It receives all information necessary for its mission and in particular the annual report sent to the European Central Bank.
112.5 -- It may be assisted by the internal control services or by external experts.
112.6 -- In particular, the Committee:
a) proposes to the Board of Directors, in compliance with the regulations applicable to credit institutions, the principles given by the AFEP-MEDEF Corporate Governance Code and professional standards, the principles of the compensation policy for the chief executive officers (dirigeants mandataires sociaux), and especially the criteria for the determination, the structure and the amount of this compensation, including allowances and benefits in kind, insurance or pension benefits, and compensation of any kind received from all the Group companies; it ensures their application;
b) prepares the annual performance assessment of the chief executive officers (dirigeants mandataires sociaux);
c) proposes to the Board of Directors the policy for performance shares;
d) prepares the decisions of the Board of Directors concerning the employee savings plan.
112.7 -- It is composed of at least three Directors and includes a Director elected by the employees. At least two thirds of the Committee’s members are independent within the meaning of the AFEP-MEDEF Code(1). Its composition enables it to exercise a competent and independent judgement on the compensation policies and practices with regard to the management of risks, the equity and the liquidities of the Company.
Article 13: The Nomination and Corporate Governance Committee 113.1 -- The Nomination and Corporate Governance Committee:
a) is responsible for making proposals to the Board of Directors for the appointment of Directors and Committees members as well as on the succession of the executive officers (mandataires sociaux), especially in the event of an unforeseeable vacancy, after having carried out necessary studies. To this end, it prepares the selection criteria to be submitted to the Board of Directors, proposes to the Board of Directors an objective to be achieved concerning the balanced representation of women and men on the Board of Directors and develops a policy designed to achieve this objective(2);
b) periodically reviews the structure, size, composition and effectiveness of the Board of Directors’ work and submits to the Board of Directors any recommendation relevant to the carrying out of the annual assessment of the Board of Directors and its members;
c) periodically reviews the Board of Directors’ policies concerning the selection and appointment of the Effective Senior Managers, the Deputy Chief Executive Officers and the Heads of risk, compliance, audit and finance functions; it makes recommendations in this area;
d) is informed in advance of the appointment of the Heads of risk, compliance, audit and finance functions. It is also informed of the appointment of the Heads of Business Units or of Service Units. It is informed of the succession plan for these senior officers (dirigeants);
e) prepares the review by the Board of Directors of corporate governance issues as well as the Board of Directors’ work on matters relating to Corporate culture. It proposes to the Board of Directors the presentation of the Board of Directors in the Registration Document and in particular the list of independent Directors.
113.2 -- It is composed of at least three Directors. At least two thirds of the Committee’s members are independent within the meaning of the AFEP-MEDEF Corporate Governance Code. The Chief Executive Officer is involved, as necessary, in the Committee’s work.
(1) For the calculation of the rate of independents within the committees, the AFEP-MEDEF Code does not take employees into account. (2) The objective and policy of the credit institutions, as well as the terms of implementation, are made public in accordance with paragraph 2 (c) of
Article 435 of regulation (EU) n° 575/2013 dated 26 June 2013.

7 I 5
INTERNAL RULES OF THE BOARD OF DIRECTORS SSHARE, SHARE CAPITAL AAND LEEGAL INFORMATION
552 I 2018 REGISTRATION DOCUMENT I S O C I E T E G E N E R AL E G R O U P
Article 14: Conflicts of interest 114.1 -- The Director shall inform the Secretary of the Board of Directors of any conflict of interest, including potential ones, in which he/she may be directly or indirectly involved. He/she shall refrain from taking part in the debates and decision-making on related matters.
114.2 -- The Chairman is in charge of managing conflict of interest situations of the members of the Board of Directors. Where appropriate, he/she refers the matter to the Nomination and Corporate Governance Committee. Regarding conflicts which could affect him/her personally, he/she refers to the Chairman of the Nomination and Corporate Governance Committee.
If necessary, the Chairman may invite a Director having a conflict of interest not to attend the deliberation.
114.3 -- The Director shall inform the Chairman and the Chairman of the Nomination and Corporate Governance Committee of his/her intention to accept a new mandate, including his/her participation in a committee, in a listed company that does not belong to a group of which he/she is an executive officer, in order to enable the Board of Directors, based on the Committee’s proposal, to decide where appropriate that such an appointment would be inconsistent with the directorship in Societe Generale.
114.4 -- The Director shall inform the Chairman of the Board of Directors of any conviction for fraud, of any incrimination and/or public sanction, and of any prohibition to manage or administer that may have been pronounced against him/her, as well as any bankruptcy, sequestration or liquidation proceedings to which he/she may have been associated.
114.5 -- Each Director shall make a sworn statement as to the existence or otherwise of the situations referred to in 14.1 and 14.3: i) upon taking up his/her office, ii) each year in response to the request made by the Secretary of the Board of Directors upon the preparation of the Registration Document, iii) at any time if the Secretary of the Board of Directors requests it and iv) within 10 working days following the occurrence of any event that renders the previous statement made by him/her in whole or in part inaccurate.
Article 15: Attendance fees 115.1 -- The overall amount of attendance fees is set by the General Meeting. The Board of Directors may decide to only partially use it. It may decide to allocate a budget for specific tasks or temporary workload increases for some members of the Board of Directors or of Committees.
115.2 -- The Chairman and the Chief Executive Officer, when he/she is also a Director, do not receive attendance fees.
115.3 -- As from 1 January 2016, the amount of allocated attendance fees is reduced by a lump sum of EUR 130,000 distributed between the Chairman of the Audit and Internal Control Committee and the Chairman of the Risk Committee.
115.4 -- The balance is divided into 50% fixed, 50% variable. The number of fixed portions per Director is 6. Additional fixed portions are allocated:
Chairman of the Audit and Internal Control Committee or of the Risk Committee: 4 portions;
Chairman of the Nomination and Corporate Governance Committee or of the Compensation Committee: 3 portions;
Member of the Nomination and Corporate Governance Committee or of the Compensation Committee: 0.5 portion;
Member of the Audit and Internal Control Committee or of the Risk Committee: 1 portion.
The additional fixed portions may be reduced in proportion to the actual attendance when the attendance over the year is below 80%.
115.5 -- The variable portion of attendance fees is divided up at the end of the year, in proportion to the number of meetings or working meetings of the Board of Directors and of each of the Committees which each Director has attended.
Article 16: Shares held in a personal capacity 116.1 -- Each Director appointed by the General Meeting (whether in his/her own name or as a permanent representative of a legal entity) must hold the equivalent of at least 1,000 shares. Each Director has a six-month time frame to hold the 600 shares provided for by the By-laws and an additional six-month time frame to increase his/her holding to 1,000 shares.
116.2 -- Each Director shall refrain from hedging his/her shares.
Article 17: Reimbursement of expenses 117.1 -- Directors’ travel, accommodation, meals and mission expenses pertaining to the meetings of the Board of Directors or of the Committees of the Board of Directors, the General Meeting of Shareholders or any other meetings related to the work of the Board of Directors or the Committees, are paid for or reimbursed by Societe Generale, upon submission of receipts.
At least once a year, the Nomination and Corporate Governance Committee considers these and, as necessary, makes proposals or recommendations.
117.2 -- As to the Chairman, the Company also pays the expenses necessary for the performance of his/her duties.
117.3 -- The Secretary of the Board of Directors receives and verifies the relevant supportive documents and ensures that the sums due are paid or reimbursed.
Article 18: Secret 118.1 -- Each Director is bound by a strict professional secrecy with regard to the confidential information he/she receives, the discussions in which he/she participates, the decisions taken as long as they are not made public as well as with regard to the views expressed by each of them.
118.2 -- He/she obliges himself/herself to a duty of care and a duty to alert.

7
14.1 -
14.2 -
14.3 -
14.4 -
14.5 -
15.1 -
15.2 -
15.3 -
15.4 -
15.5 -
16.1 -
16.2 -
17.1 -
17.2 -
17.3 -
18.1 -
18.2 -
LIST OF REGULATED INFORMATION PUBLISHED IN THE LAST 12 MONTHS
6 I 7 SSHARE, SHARE CAPITAL AAND LEEGAL INFORMATION
S O C I E T E G E N E R AL E G R O U P I 2018 REGISTRATION DOCUMENT I 553
6 . L I S T O F R E G U L AT E D I N F O R M AT I O N P U B L I S H E D I N T H E L A S T 1 2 M O N T H S *
PRESS RELEASES PUBLISHED UNDER REGULATED INFORMATION
- 18.04.2017 – Societe Generale Remuneration Policies and Practices Report 2016
- 23.05.2017 – Annual General Meeting and Board of Directors dated 23 May 2017
- 27.11.2017 – Acceleration of the adaptation of the French Retail Banking network: Exceptional charge in Q4 17
- 27.11.2017 – 2020 Strategic and Financial Plan “Transform to Grow”
- 22.12.2017 – Disclosure of new regulatory capital requirements as from 1st January 2018
- 11.01.2018 – Impacts of tax items in Q4 17
ANNUAL FINANCIAL REPORT
- 08.03.2017 – 2017 Registration Document
- 08.03.2017 – Availability of the 2017 Registration Document
- 08.03.2017 – Availability of the annual financial report
- 04.05.2017 – Availability of the first update to the 2017 Registration Document filed on 4 May 2017
- 05.05.2017 – First update to the 2017 Registration Document filed on 4 May 2017
- 03.08.2017 – Availability of the second update to the 2017 Registration Document filed on 3 August 2017
- 03.08.2017 – Second update to the 2017 Registration Document filed on 3 August 2017
- 06.11.2017 – Availability of the third update to the 2017 Registration Document filed on 6 November 2017
- 06.11.2017 – Third update to the 2017 Registration Document filed on 6 November 2017
HALF-YEARLY FINANCIAL REPORT
- 03.08.2017 – Availability of the half yearly financial report for 2017
- 03.08.2017 – Half yearly financial report for 2017
FINANCIAL INFORMATION
04.05.2017 – 1st quarter 2017 Results
02.08.2017 – 2nd quarter 2017 Results
03.11.2017 – 3rd quarter 2017 Results
08.02.2018 – 4th quarter and full-year 2017 results
MONTHLY REPORTS ON TOTAL AMOUNT OF VOTING RIGHTS AND SHARES
12 report forms
DESCRIPTION OF THE BUYBACK PROGRAMMES AND STATEMENT ON THE LIQUIDITY AGREEMENT
12.05.2017 – Description of share buyback program
05.07.2017 – Half-year statement on the liquidity agreement
02.01.2018 – Half-year statement on the liquidity agreement
REPORTS ON CORPORATE GOVERNANCE
08.03.2017 – Availability of the report on corporate governance, internal control and risk management
STATUTORY AUDITORS’ FEES
08.03.2017 – Statutory auditors’ fees
COMMUNIQUES FOR ACCESS TO OR CONSULTATION OF THE INFORMATION RELATIVE TO SHAREHOLDERS’ GENERAL MEETINGS
21.04.2017 – Availability or consultation of the information relating to the Ordinary General Meeting of shareholders dated 23 May 2017
* Full information available at www.societegenerale.com under “Regulated information”.

7 I 6 L IST OF REGULATED INFORMATION
PUBLISHED IN THE LAST 12 MONTHS SSHARE, SHARE CAPITAL AAND LEEGAL INFORMATION
554 I 2018 REGISTRATION DOCUMENT I S O C I E T E G E N E R AL E G R O U P
PERSON RESPONS IBLE FOR THE REG ISTRAT ION
DOCUMENT

S O C I E T E G E N E R AL E G R O U P I 2018 REGISTRATION DOCUMENT I 555
8
PERSON RESPONS IBLE FOOR THE REG ISTRAT ION
DDOCUMENT
1. Person responsible for the registration document ............................................. 556
2. Statement of the person responsible for the Registration Document and the annual financial report ................................................................................................. 556
3. Persons responsible for the audit of the accounts ............................................ 557

8 I 1
PERSON RESPONSIBLE FOR THE REGISTRATION DOCUMENT PPERSON RESPONSIBLE FOOR THE REGISTRATION DDOCUMENT
556 I 2018 REGISTRATION DOCUMENT I S O C I E T E G E N E R AL E G R O U P
1 . P E R S O N R E S P O N S I B L E F O R T H E R E G I S T R AT I O N D O C U M E N T
Mr. Frédéric Oudéa
Chief Executive Officer of Societe Generale
2 . S TAT E M E N T O F T H E P E R S O N R E S P O N S I B L E F O R T H E R E G I S T R AT I O N D O C U M E N T A N D T H E A N N U A L F I N A N C I A L R E P O R T
I hereby certify, after taking all reasonable measures for this purpose, that the information contained in this Registration Document is, to my knowledge, in accordance with the facts and contains no omission likely to affect its meaning.
I certify, to the best of my knowledge, that the accounts have been prepared in accordance with applicable accounting standards and are a fair reflection of the assets, liabilities, financial position and profit or loss of the Company and all the undertakings included in the consolidation scope, and that the Management Report (the cross-reference table of the annual financial report in Chapter 9 indicates the contents of said report) presents a fair view of the Company’s business, performance and financial position and that of all the undertakings included in the consolidation scope, as well as a description of the main risks and uncertainties to which they are exposed.
I have received a completion letter from the Statutory Auditors, stating that they have audited the information contained in this Registration Document about the financial position and accounts contained herein, and that they have read this Registration Document in its entirety
Paris, 8th March 2018
Chief Executive Officer
Frédéric Oudéa
Name
Address
Date of appointment
Term of office
End of current term of office
Name
Address
Date of first appointment
Date of renewal
Term of office
End of current term of office
Name
Address
Date of appointment
Term of office
Name
Address
Date of appointment
Term of office

8
Mr. Frédéric Oudéa
Chief Executive Officer
Frédéric Oudéa
PERSONS RESPONSIBLE FOR THE AUDIT OF THE ACCOUNTS
3 I 8 PPERSON RESPONSIBLE FOOR THE RREGISTRATION DOCUMENTT
S O C I E T E G E N E R AL E G R O U P I 2018 REGISTRATION DOCUMENT I 557
3 . P E R S O N S R E S P O N S I B L E F O R T H E A U D I T O F T H E A C C O U N T S
STATUTORY AUDITORS Name: Ernst & Young et Autres
represented by Ms. Isabelle Santenac
Adddress: 1/2 place des Saisons,
92400 Courbevoie – Paris-La Défense 1 (France)
Date of appointment: 22nd May 2012
Term of office: six financial years
End of current term of office: at the close of the Ordinary General Meeting called to approve the accounts for the year ended 31st December 2017
Name: Deloitte & Associés
represented by Mr. José-Luis Garcia
Address: 185 avenue Charles-de-Gaulle,
92524 Neuilly-sur-Seine Cedex (France)
Date of first appointment: 18th April 2003
Date of renewal: 22nd May 2012
Term of office: six financial years
End of current term of office: at the close of the Ordinary General Meeting called to approve the accounts for the year ended 31st December 2017
SUBSTITUTE STATUTORY AUDITORS Name: Société Picarle et Associés
Address: 1/2 place des Saisons,
92400 Courbevoie – Paris-La Défense 1 (France)
Date of appointment: 22nd May 2012
Term of office: six financial years
Name: Société BEAS
Address: 195 avenue Charles-de-Gaulle,
92524 Neuilly-sur-Seine Cedex (France)
Date of appointment: 22nd May 2012
Term of office: six financial years
Ernst & Young et Autres and Deloitte & Associés are registered as Statutory Auditors with the Compagnie régionale des Commissaires aux comptes de Versailles.

8 I 3
PERSONS RESPONSIBLE FOR THE AUDIT OF THE ACCOUNTS PPERSON RESPONSIBLE FOOR THE RREGISTRATION DOCUMENTT
558 I 2018 REGISTRATION DOCUMENT I S O C I E T E G E N E R AL E G R O U P
CROSS-REFERENCE TABLES

S O C I E T E G E N E R AL E G R O U P I 2018 REGISTRATION DOCUMENT I 559
9 CROSS--REFERENCE TABLEES
Registration document cross-reference table .......................................................... 560 Annual financial report cross-reference table .......................................................... 562 Cross-reference table for the registry of the court ................................................... 562

560 I 2018 REGISTRATION DOCUMENT I S O C I E T E G E N E R AL E G R O U P
REGISTRATION DOCUMENT CROSS-REFERENCE TABLE
Subject Page numbers in the
Registration Document
1. PERSONS RESPONSIBLE 556
2. STATUTORY AUDITORS 557
3. SELECTED FINANCIAL INFORMATION
3.1. Selected historical financial information on the issuer for each financial year Key figures, p. 9
3.2. Selected financial information for interim periods NA
4. RISK FACTORS 138-235
5. INFORMATION ABOUT THE ISSUER
5.1. History and development of the Company 8; 539
5.2. Investments 66-67
6. OVERVIEW OF ACTIVITIES 28-29
6.1. Principal activities 9; 50-58
6.2. Principal markets 9-12; 14-26; 28-29; 406-409
6.3. Exceptional events NA
6.4. Dependence of the issuer on patents or licences, industrial, commercial or financial contracts or new manufacturing processes NA
6.5. The basis for statements made by the issuer regarding its competitive position Summary
7. ORGANISATIONAL STRUCTURE
7.1. Brief description of the Group 9; 28-29
7.2. List of major subsidiaries 32-49; 414-442; 508-520
8. REAL ESTATE PROPERTIES, PLANT AND EQUIPMENT
8.1. Material tangible fixed assets (existing or planned) 67; 412
8.2. Environmental issues that may affect the issuer’s use of the tangible fixed assets
238-298
9. OPERATING AND FINANCIAL REVIEW
9.1. Financial condition 59-65
9.2. Operating results 30-49
10. CAPITAL RESOURCES
10.1. Information on the issuer’s capital resources 302-307; 402-404
10.2. Sources and amounts of the issuer’s cash flow 308
10.3. Information on the issuer’s borrowing requirements and funding structure 62-65
10.4. Information regarding any restrictions for the use of capital resources that have materially affected, or could materially affect, the issuer’s operations
540
10.5. Information regarding the anticipated sources of funds needed to fulfil commitments referred to in items 5.2.3 and 8.1
63-65; 67
11. RESEARCH AND DEVELOPMENT, PATENTS AND LICENSES NA
12. TREND INFORMATION 13
13. PROFIT FORECASTS OR ESTIMATES NA
14. ADMINISTRATIVE, MANAGEMENT AND SUPERVISORY BODIES ANDGENERAL MANAGEMENT
14.1. Board of Directors and General Management 72-98; 132
14.2. Conflicts of interest involving administrative, management and supervisory bodies and General Management
132
15. REMUNERATION AND BENEFITS
15.1. Amount of remuneration paid and benefits in kind 99-128
15.2. Total amounts set aside or accrued by the issuer to provide pension, retirement or similar benefits
391
9 I CCROSS-REFERENCE TABLES CROSS-REFERENCE TABLES

9
CROSS-REFERENCE TABLES I 9CCROSS-REFERENCE TABLES
S O C I E T E G E N E R AL E G R O U P I 2018 REGISTRATION DOCUMENT I 561
Subject Page numbers in the
Registration Document
16. BOARD AND MANAGEMENT PRACTICES
16.1. Date of expiration of the current term of office 77-83; 93-95
16.2. Members of the administrative bodies’ service contracts with the issuer NA
16.3. Information about the issuer’s Audit Committee and Remuneration Committee 86-88; 90
16.4. Statement as to whether or not the issuer complies with the corporate governance regime 73
17. EMPLOYEES
17.1. Headcount 14; 242-249
17.2. Shareholdings and stock options awarded to executive officers 77-83; 93-95; 99-128
17.3. Any arrangements for involving employees in the issuer’s capital 250
18. MAJOR SHAREHOLDERS
18.1. Shareholders owning more than 5% of capital or voting rights 535-536
18.2. Different voting rights held by the major shareholders 535-536; 540
18.3. Control of the issuer 535-536; 538
18.4. Any arrangements, known to the issuer, the operation of which may at a subsequent date result in a change in control of the issuer
NA
19. RELATED-PARTY TRANSACTIONS 133-135; 391; 508-520
20. FINANCIAL INFORMATION CONCERNING THE ISSUER’S ASSETSAND LIABILITIES, FINANCIAL POSITION AND PROFITS AND LOSSES
20.1. Historical financial information 123; 125; 147; 151-154; 166-167; 176; 179-183; 191-194; 198-202; 204-206;
217-218; 220-222; 301-447; 454-523; 561
20.2. Pro-forma financial information NA
20.3. Financial statements 123; 125; 147; 151-154; 166-167; 176; 179-183; 191-194; 198-202; 204-206; 217-218; 220-222; 301-447; 454-523
20.4. Verification of annual historical financial information 448-453; 524-529
20.5. Date of the most recent financial information 302; 454
20.6. Interim financial information NA
20.7. Dividend policy 533-534
20.8. Legal and arbitration proceedings 232; 444-447; 521-523
20.9. Significant change in the financial or commercial situation 66
21. ADDITIONAL INFORMATION
21.1. Share capital 130-131; 535-540
21.2. Memorandum and Articles of Association 541-545
22. MATERIAL CONTRACTS 67
23. THIRD-PARTY INFORMATION AND STATEMENTS BY EXPERTS ANDDECLARATIONS OF ANY INTEREST
NA
24. DOCUMENTS AVAILABLE TO THE PUBLIC 540
25. INFORMATION ON EQUITY INTERESTS 28-29; 414-442; 508-520
In accordance with Article 28 of EC Regulation No. 809/2004 dated 29th April 2004, the following information is included by reference in this Registration Document:
the parent company and consolidated accounts for the yearended 31st December 2016, the related Statutory Auditors’reports and the Group Management Report presentedrespectively on pages 429 to 487 and 116-117, 158-159,169, 179, 181, 183 to 187, 195 to 198, 201 to 206, 208 to210, 221-222, 224 to 226, 301 to 426, on pages 488-489and 427-428, and on pages 25 to 63 of the RegistrationDocument D. 17-0139 filed with the AMF on 8th March 2017;
the parent company and consolidated accounts for the yearended 31st December 2015, the related Statutory Auditors’reports and the Group Management Report presentedrespectively on pages 390 to 449 and 138-139, 148, 156,
158 to 164, 169 to 176, 178-179, 188 to 194, 268 to 385, and on pages 450-451 and 386-387, and on pages 21 to 59 of the Registration Document D. 16-0115 filed with the AMF on 7th March 2016.
The chapters of the Registration Documents D. 16-0115 and D. 17-0139 not mentioned above do not apply to investors or are covered in another part of this Registration Document.
Both of the aforementioned Registration Documents are available at the Company’s website www.societegenerale.com and at the AMF’s (French Financial Markets Authority) website www.amf-france.org.

9 I CCROSS-REFERENCE TABLES
562 I 2018 REGISTRATION DOCUMENT I S O C I E T E G E N E R AL E G R O U P
ANNUAL FINANCIAL REPORT CROSS-REFERENCE TABLE Pursuant to Article 222-3 of the French Financial Markets Authority’s General Regulation, the annual financial report referred to in section I of Article L. 451-1-2 of the French Monetary and Financial Code includes the items described in the following pages of the Registration Document:
Annual financial report Page No.
Statement of the person responsible for the Registration Document 556
Management report
Analysis of results, financial position, risks and main characteristics of internal control and risk management procedures for the preparation and processing of accounting and financial information of the parent company and consolidated Group (Article L. 225-100-1 of the French Commercial Code)
9-26; 30-49; 59-67; 138-294; 345-348;
454-460
Information about share buybacks (Article L. 225-211, paragraph 2 of the French Commercial Code) 536-537
Information about geographic locations and activities (Article L. 511-45 of the French Monetary and Financial Code)
68-70
Financial statements
Annual accounts 454-523
Statutory Auditors’ report on the annual accounts 524-529
Consolidated accounts
123; 125; 147; 151-154; 166-167; 176; 179-183; 191-194;
198-202; 204-206; 217-218; 220-222; 301-447
Statutory Auditors’ report on the consolidated accounts 448-453
CROSS-REFERENCE TABLE FOR THE REGISTRY OF THE COURT Pursuant to Article L. 232-23 of the French Commercial Code, it is specified that the Registration Document includes the items described in the following pages and/or chapters of the Registration Document:
Financial statements Page No.
Annual accounts 454-523
Statutory Auditors’ report on the annual accounts 524-529
Consolidated accounts123; 125; 147; 151-154; 166-167; 176; 179-183; 191-194; 198-202;
204-206; 217-218; 220-222; 301-447
Statutory Auditors’ report on the consolidated accounts 448-453
Management report (Article L. 225-100 of the French Commercial Code) Chapter No. or page No.
Activities of the Company and of the Group / Others chap. 1-2; p. 128; chap. 4-5;
p. 345-348; p. 406-409; p. 414-442;p. 454-460; p. 533-538
Appendices to the management report
Report on corporate governance and related Statutory Auditor’s conclusions p. 72-132; p. 528
Results over the last 5 years p. 458
Asset Backed Securities (ABS):
Basel 1 (Accords):
Basel 2 (Accords):
Basel 3 (Accords):
Bond:
Cash Generating Unit (CGU):

CROSS-REFERENCE TABLES
GGLOSSARY
S O C I E T E G E N E R AL E G R O U P I 2018 REGISTRATION DOCUMENT I 563
G L O S S A R Y O F M A I N T E C H N I C A L T E R M S
ACRONYM TABLE
Acronym Definition Glossary
ABS Asset-Backed Securities See: Securitisation
CDS Credit Default Swap See: Securitisation
CDO Collateralised Debt Obligation See: Securitisation
CLO Collateralised Loan Obligation See: Securitisation
CMBS Commercial Mortgage Backed Securities See: Securitisation
CRD Capital Requirement Directive
CVaR Credit Value at Risk
EAD Exposure at default
EL Expected Loss
G-SIB Global Systemically Important Banks See: SIFI
LCR Liquidity Coverage Ratio
LGD Loss Given Default
NSFR Net Stable Funding Ratio
PD Probability of Default
RMBS Residential Mortgage Backed Securities See: Securitisation
RWA Risk Weighted Assets
SVaR Stressed Value at Risk
VaR Value at Risk
Asset Backed Securities (ABS): see securitisation.
Basel 1 (Accords): prudential framework established in 1988 by the Basel Committee to ensure solvency and stability in the international banking system by setting an international minimum and standardised limit on banks’ capital bases. It notably establishes a minimum capital ratio – as a proportion of the total risks taken on by banks – of 8% (Source: Bank of France Glossary - Documents et Débats - No. 4 - May 2012).
Basel 2 (Accords): prudential framework used to better assess and limit banks’ risks. It is focused on banks’ credit, market and operational risks (Source: Bank of France Glossary - Documents et Débats - No. 4 - May 2012).
Basel 3 (Accords): changes to prudential banking standards that supplement the Basel 2 accords by improving the quality and quantity of banks’ required capital. They also implement minimum requirements in terms of liquidity risk management (quantitative ratios), define measures to limit the financial system’s procyclicality (capital buffers that vary according to the economic cycle) and strengthen requirements related to systemically significant banks (Source: Bank of France Glossary -
Documents et Débats - No. 4 - May 2012). The Basel 3 Accords are implemented in Europe under Directive 2013/36/EU (“CRD4”) and Regulation 575/2013 (“CRR”), which have been in force since 1st January 2014.
Bond: a bond is a fraction of a loan, issued in the form of a security, which is tradable and – in a given issue – grants a receivable over the issuer according to the issue’s nominal value (the issuer being a company, public sector entity or government).
Cash Generating Unit (CGU): the smallest identifiable set of assets which generates incoming cash flow that is generally independent from the incoming cash flow generated by other assets or sets of assets in accordance with the IAS 36 accounting standard. “In accordance with IFRS standards, a company must determine the largest number of cash generating units (CGU) which make it up; these CGU should be generally independent in terms of operations and the company must allocate assets to each of these CGU. Impairment testing must be conducted at the CGU level periodically (if there are reasons to believe that their value has dropped) or annually (if they include goodwill).” (Source: Les Echos.fr, quoting Vernimmen).

GGLOSSAARY
564 I 2018 REGISTRATION DOCUMENT I S O C I E T E G E N E R AL E G R O U P
CCollateral: transferable asset or guarantee used as a pledge for the repayment of a loan in the event that the borrower cannot meet its payment obligations (Source: Bank of France Glossary - Documents et Débats - No. 4 - May 2012).
CCollateralised Debt Obligation ((CDO): see securitisation.
CCollateralised Loan Obligation ((CLO): see securitisation.
CCommercial Mortgage Backed Securities ((CMBS): see securitisation.
CCommon Equity Tier 1 capital: includes principally share capital, associated share premiums and reserves, less prudential deductions.
CCommon Equity Tier 1 ratio: ratio between CCommon Equity Tier 11 capital and risk-weighted assets, according to CRD4/CRR rules. CCommon Equity Tier 1 capital has a more restrictive definition than in the earlier CRD3 Directive (Basel 2).
CComprehensive Risk Measurement (CRM): capital charge in addition to Incremental Risk Charge (IRC) for the credit activities correlation portfolio which accounts for specific price risks (spread, correlation, collection, etc.). The CRM is a 99.9% risk factor, meaning the highest risk obtained after eliminating the 0.1% most unfavourable incidents.
CCore Tier 1 ratio: ratio between Core Tier 1 capital and risk-weighted assets, according to Basel 2 rules and their changes known as Basel 2.5.
CCost--tto--iincome ratio: ratio indicating the share of Net Banking Income (NBI) used to cover the company’s operating costs. It is determined by dividing management fees by the NBI.
CCost of risk in basis points: the cost of risk in basis points is calculated using the ratio of the net cost of commercial risk to loan outstandings at the start of the period.
Net cost of risk corresponds to the cost of risk calculated for on- and off-balance sheet exposures, i.e. Depreciation and reversals (used or not used) + Losses on unrecoverable receivables - Recovery of impaired debts. Provisions and reversals of provisions for litigation issues are excluded from this calculation.
CCRD3: European Directive on capital requirements, incorporating the provisions known as Basel 2 and 2.5, notably in respect of market risk: improvement in the incorporation of the risk of default or rating migration for assets in the trading book (tranched and untranched assets), and reduction in the procyclicality of Value at Risk (see definition).
CCRD4/CRR (Capital Requirement Regulation): Directive 2013/36/ EU (“CRD4”) and Regulation (EU) No. 575/2013 (“CRR”) constitute the corpus of the texts transposing Basel 3 in Europe. They therefore define the European regulations relating to the solvency ratio, large exposures, leverage and liquidity ratios, and are supplemented by the European Banking Authority’s (“EBA”) technical standards.
CCredit and counterparty risk: risk of losses arising from the inability of the Group’s customers, issuers or other counterparties to meet their financial commitments. Credit risk also includes the counterparty risk linked to market transactions, as well as that stemming from securitisation activities.
CCredit Default Swaps (CDS): insurance mechanism against credit risk in the form of a bilateral financial contract, in which the protection buyer periodically pays the seller in return for a guarantee to compensate the buyer for losses on reference assets (government, bank or corporate bonds) if a credit event occurs (bankruptcy, payment default, moratorium, restructuring) (Source: Bank of France Glossary - Documents et Débats - No. 4 - May 2012).
CCredit Value at Risk (CVaR): the largest loss that would be incurred after eliminating the top 1% of the most adverse occurrences, used to set the risk limits for individual counterparties.
DDerivative: a financial asset or financial contract, the value of which changes based on the value of an underlying asset, which may be financial (equities, bonds, currencies, etc.) or non-financial (agricultural or other commodities, etc.). Depending on the circumstances, this change may be accompanied by a leverage effect. Derivatives can take the form of securities (warrants, certificates, structured EMTNs, etc.) or contracts (forwards, options, swaps, etc.). Listed derivative contracts are called Futures.
DDoubtful lloan coverage rate: ratio between portfolio provision and depreciation and doubtful outstandings (customer loans and receivables, loans and receivables with credit institutions, finance leases and basic leases).
EExpected Loss (EL): losses that may occur given the quality of a transaction’s structuring and all measures taken to reduce risk, such as collateral.
EExposure at default (EAD): Group exposure to default by a counterparty. The EAD includes both balance sheet and off-balance sheet exposures. Off-balance sheet exposures are converted to their balance sheet equivalent using internal or regulatory conversion factors (drawdown assumption).
FFair value: the amount for which an asset could be exchanged or a liability settled, between informed and consenting parties under normal market conditions.
GGross rate of doubtful outstandings: the ratio between doubtful outstandings and gross book loan outstandings (customer loans and receivables, loans and receivables with credit institutions, finance leases and basic leases).
HHaircut: percentage by which the market value of securities is reduced to reflect their value in the context of stress (counterparty or market stress risk). The extent of the reduction reflects the perceived risk.
IImpairment: recording of probable loss on an asset (Source: Bank of France Glossary - Documents et Débats - No. 4 - May 2012).
IIncremental Risk Charge (IRC): capital cost incurred due to rating migration risk and risk of issuers’ default within a one-year horizon for trading book debt instruments (bonds and CDS). The IRC is a 99.9% risk factor, meaning the highest risk obtained after eliminating the 0.1% most unfavourable incidents.
IInsurance risk: beyond asset/liability risk management (interest-rate, valuation, counterparty and currency risk), insurance risk includes underwriting risk, mortality risk and structural risk of life and non-life insurance activities, including pandemics, accidents and catastrophic events (such as earthquakes, hurricanes, industrial disasters, or acts of terrorism or war).
IInternal Capital Adequacy Assessment Process (ICAAP): process outlined in Pillar 2 of the Basel Accord, by which the Group verifies its capital adequacy with regard to all risks incurred. Investment grade: long-term rating provided by an external ratings agency, ranging from AAA/Aaa to BBB-/Baa3 for a counterparty or underlying issue. A rating of BB+/Ba1 or lower indicates a Non-Investment Grade instrument.
LLeverage ratio: the leverage ratio is intended to be a simple ratio developed with a view to limiting the size of banks’ balance sheets. The leverage ratio compares the Tier 1 capital with the accounting balance sheet/off-balance sheet, after restatements of certain items. A new definition of leverage ratio has been implemented in accordance with the application of the CRR.
Liquidity:
Liquidity Coverage Ratio (LCR):
Loss Given Default (LGD):
Market risk:
Market stress tests:
Mezzanine:
Minimum requirement of own funds and eligible liabilities (MREL):
Monoline insurer:
Net earnings per share:
Net Stable Funding Ratio (NSFR):
Netting agreement:
Operational risk (including accounting and environmental risk):
Own shares:
Personal commitment:
Physical collateral:
Prime Brokerage:
Probability of Default (PD):
Rating:
Resecuritisation:
Residential Mortgage Backed Securities (RMBS):
Return On Equity (ROE):
Risk appetite:
Risk weight:
Risk-Weighted Assets (RWA):
Securitisation:

Collateral:
Collateralised Debt Obligation (CDO):
Collateralised Loan Obligation (CLO):
Commercial Mortgage Backed Securities (CMBS):
Common Equity Tier 1 capital:
Common Equity Tier 1 ratio: Common Equity Tier 1
Common Equity Tier 1
Comprehensive Risk Measurement (CRM):
Core Tier 1 ratio:
Cost-to-income ratio:
Cost of risk in basis points:
CRD3:
CRD4/CRR (Capital Requirement Regulation):
Credit and counterparty risk:
Credit Default Swaps (CDS):
Credit Value at Risk (CVaR):
Derivative:
Doubtful loan coverage rate:
Expected Loss (EL):
Exposure at default (EAD):
Fair value:
Gross rate of doubtful outstandings:
Haircut:
Impairment:
Incremental Risk Charge (IRC):
Insurance risk:
Internal Capital Adequacy Assessment Process (ICAAP):
Leverage ratio:
GGLOSSARY
S O C I E T E G E N E R AL E G R O U P I 2018 REGISTRATION DOCUMENT I 565
LLiquidity: for a bank, the capacity to cover its short-term maturities. For an asset, this term indicates the potential to purchase or sell it quickly on the market, with a limited discount (Source: Bank of France Glossary - Documents et Débats - No. 4 - May 2012).
LLiquidity Coverage Ratio (LCR): this ratio is intended to promote the short-term resilience of a bank’s liquidity risk profile. The LCR requires banks to hold risk-free assets that may be easily liquidated on markets in order to meet required payments for outflows net of inflows during a thirty-day crisis period without central bank support (Source: December 2010 Basel document).
LLoss Given Default (LGD): ratio between the loss incurred from exposure to default by a counterparty and the amount of the exposure at the time of default.
MMarket risk: risk of decline in the value of financial instruments arising from changes in market parameters, the volatility of these parameters and correlations between them. These parameters include but are not limited to exchange rates, interest rates, and the price of securities (equity, bonds), commodities, derivatives and other assets, including real estate.
MMarket stress ttests: to assess market risks, alongside the internal VaR and SVaR model, the Group monitors its exposure using market stress test simulations to take into account exceptional market occurrences, based on 26 historical scenarios and eight hypothetical scenarios.
MMezzanine: form of financing between equity and debt. In terms of ranking, mezzanine debt is subordinate to senior debt, but it is still above equity.
MMinimum requirement of own funds and eligible liabilities ((MREL): the EU Bank Recovery and Resolution Directive (BRRD) requires compliance with a minimum ratio of “bail-inable” debt (i.e. debt that can be used in the event of the bank’s resolution). The MREL requirement is determined on a case-by-case basis for each bank.
MMonoline insurer: insurance company participating in a credit enhancement transaction and which guarantees bond issues (for example, a securitisation transaction), in order to improve the issue’s credit rating.
NNet earnings per share: net earnings of the company (adjusted for hybrid securities recorded under equity instruments) divided by the weighted average number of shares outstanding.
NNet Stable Funding Ratio (NSFR): this ratio aims to promote resilience over a longer time horizon by creating additional incentives for banks to fund their activities with more stable sources of funding. This structural ratio has a time horizon of one year and has been developed to provide a sustainable maturity structure of assets and liabilities (Source: December 2010 Basel document).
NNetting agreemennt: a contract in which two parties to a forward financial instrument, securities lending or resale contract agree to offset reciprocal claims arising from these contracts, with the settlement of these claims based only on the net balance, especially in the event of default or termination. A master netting agreement enables this mechanism to be extended to different kinds of transactions, subject to various framework agreements under a master agreement.
OOperational risk ((including accounting and environmentaal risk): risk of losses or sanctions, notably due to failures in procedures and internal systems, human error or external events, etc.
OOwn shares: shares held by the company, especially as part of the Share Buyback programme. Own shares are excluded from voting rights and are not included in the calculation of earnings per share, with the exception of shares held as part of a liquidity contract.
PPersonal commitment: represented by a deposit, autonomous guarantee or letter of intent. Whoever makes themselves guarantor for an obligation binds themselves to the creditor to honour that obligation, if the debtor does not honour it themselves. An independent guarantee is an undertaking by which the guarantor binds himself, in consideration of a debt subscribed by a third party, to pay a sum either on first demand or subject to terms agreed upon. A letter of intent is an undertaking to do or not to do, the purpose of which is the support provided to a debtor in honouring their obligation.
PPhysical collateral: guarantees consisting of assets including tangible and intangible property and securities, including commodities, precious metals, cash, financial instruments and insurance contracts.
PPrime Brokerage: a bundled package of services dedicated to hedge funds to facilitate and improve their activities. In addition to performing standard brokerage transactions on financial markets (buying and selling on the customer’s behalf), the prime broker offers securities lending and borrowing services and financing services specifically suited to hedge funds.
PProbability of Default (PD): likelihood that a counterparty of the bank will default within one year.
RRating: assessment by a ratings agency (Moody’s, Fitch Ratings, Standard & Poor’s) of the financial solvency risk of an issuer (company, government or other public institution) or of a given transaction (bond loan, securitisation, covered bond). The rating has a direct impact on the cost of raising capital (Source: Bank of France Glossary - Documents et Débats - No. 4 - May 2012).
RResecuritisation: securitisation of an already securitised exposure where the risk associated with underlyings is divided into tranches and, therefore, at least one of the underlying exposures is a securitised exposure.
RResidential Mortgage Backed Securities ((RMBS): see securitisation.
RReturn On Equity (ROE): ratio between the net income restated for interest on hybrid securities recorded under equity instruments and restated book equity (especially hybrid securities), which enables return on capital to be measured.
RRisk appetite: level of risk, by type and by business line, that the Group is prepared to take on with regard to its strategic objectives. Risk appetite is derived using both quantitative and qualitative criteria. The Risk Appetite exercise is one of the strategic steering tools available to the Group’s decision-making bodies.
RRisk weight: percentage of weighting of exposures which is applied to a particular exposure in order to determine the related risk-weighted asset.
RRisk--WWeighted Assets (RWA): value of a bank’s assets or exposures, weighted according to risk.
SSecuritisation: transaction that transfers a credit risk (loan outstandings) to an organisation that issues, for this purpose, tradable securities to which investors subscribe. This transaction may involve a transfer of outstandings (physical securitisation) or a transfer of risk only (credit derivatives). Securitisation transactions may, if applicable, enable securities subordination (tranches).

GGLOSSAARY
566 I 2018 REGISTRATION DOCUMENT I S O C I E T E G E N E R AL E G R O U P
The following products are considered securitisations:
AABS: Asset Backed Securities.
CCDO: Collateralised Debt Obligation, a debt security backed by an asset portfolio (bank loans (residential) or corporate bonds). Interest and principal payments may be subordinated (tranche creation).
CCLO: Collateralised Loan Obligation, a CDO backed by an asset portfolio of bank loans.
CCMBS: Commercial Mortgage Backed Securities, a debt security backed by an asset portfolio of corporate real estate loans leading to a mortgage.
.. RRMBS: Residential Mortgage Backed Securities, a debt security backed by an asset portfolio of residential mortgage loans.
SShare: equity stake issued by a company in the form of shares, representing a share of ownership and granting its holder (shareholder) the right to a proportional share in any distribution of profits or net assets as well as a right to vote in a General Meeting of Shareholders.
SStressed Value at Risk (SVaR): identical to the VaR approach, the calculation method consists of a “historical simulation” with “one-day” shocks and a 99% confidence interval. Unlike the VaR, which uses 260 scenarios of daily variation year-on-year, the stressed VaR uses a fixed one-year window that corresponds to a historical period of significant financial tensions.
SStructural interest rate and currency risk: risk of loss or of write-downs in the Group’s assets arising from variations in interest or exchange rates. Structural interest rate and exchange rate risks are incurred in commercial activities and proprietary transactions.
SStructured issue or structured product: a financial instrument combining a bond product and an instrument (an option for example) providing exposure to all types of asset (equities, currencies, interest rates, commodities). Instruments can include a total or partial guarantee in respect of the invested capital. The term “structured product” or “structured issue” also refers to securities resulting from securitisation transactions, where holders are subject to a ranking hierarchy.
SSystemically Important Financial Institution (SIFI): the Financial Stability Board (FSB) coordinates all of the measures to reduce moral hazard and risks to the global financial system posed by Globally Systemically Important Financial Institutions (G-SIFI). These banks meet criteria defined in the Basel Committee rules included in the document titled “Global Systemically Important
Banks: Assessment methodology and the additional loss absorbency requirement” and published as a list in November 2011. This list is updated by the FSB each November. Banks classified as G-SIBs are subject to increasingly strict capital requirements.
TTier 1 capital: comprises Common Equity Tier 1 capital and Additional Tier 1 capital. The latter corresponds to perpetual debt instruments, with no incentive to redeem, less prudential deductions.
TTier 2 capital: supplementary capital consisting mainly of subordinated notes less prudential deductions.
TTier 1 ratio: ratio between Tier 1 capital and risk-weighted assets.
TTotal capital ratio or Solvency ratio: ratio between total (Tier 1 and Tier 2) capital and risk-weighted assets.
TTotal Loss Absorbing Capacity (TLAC): on 10th November 2014, the Financial Stability Board (FSB) published for public consultation a term sheet proposing a “pillar 1” type requirement regarding loss-absorbing capacity in the event of resolution. This new requirement only applies to G-SIBs (Global Systemically Important Banks). It is a ratio of liabilities considered to be “bail-inable” in the event of resolution and calculated with respect to weighted risks or the leverage ratio denominator (Source: Revue de l’ACPR, No. 25).
TTransformation risk: appears as soon as assets are financed through resources with a different maturity. Due to their traditional activity of transforming resources with a short maturity into longer-term maturities, banks are naturally faced with transformation risk which itself leads to liquidity and interest-rate risk. Transformation occurs when assets have a longer maturity than liabilities; anti-transformation occurs when assets are financed through longer-maturity resources.
TTreasury shares: shares held by a company in its own equity through one or several intermediary companies in which it holds a controlling share either directly or indirectly. Treasury shares are excluded from voting rights and are not included in the calculation of earnings per share.
VValue at Risk (VaR): composite indicator used to monitor the Group’s daily market risk exposure, notably for its trading activities (99% VaR in accordance with the internal regulatory model). It corresponds to the greatest risk calculated after eliminating the top 1% of most unfavourable occurrences observed over a one-year period. Within the framework described above, it corresponds to the average of the second and third largest losses computed.

WEBSITE: WWW.SOCIETEGENERALE.COM INVESTOR RELATIONS AND FINANCIAL INFORMATION
Tel: 33 (0) 1 42 14 47 72
PRESS RELATIONS Tel: 33 (0) 1 42 14 67 02
COMMUNICATION DEPARTMENT
Postal address:
Tours Société Générale
75886 – Paris Cedex 18
SOCIETE GENERALE
Head office: 29, Bd Haussmann – 75009 Paris
Tel: 33 (0) 1 42 14 20 00
A French limited company founded in 1864
Share capital: EUR 1,009,897,173.75
552 120 222 RCS Paris
This document is printed in France on paper sourced from certified sustainable forests
Creation and production Societe Generale
Labrador
Translation
This label recognises the mosttransparent Registration Documentsaccording to the criteria of the AnnualTransparency Ranking.
TABLE OF CONTENTS
1
EDITORIAL 4
1
KEY FIGURES AND PROFILE OF SOCIETE GENERALE 7
1. History 8
2. Profile of Societe Generale 9
3. A strategy of stronger, profitable and sustainable growth, based on a diversified and integrated banking model 10
4. The Group’s core businesses 16
2
GROUP MANAGEMENT REPORT 27
1. Societe Generale Group main activities 28
2. Group activity and results 30
3. Activity and results of the core businesses 32
4. Significant new products or services 50
5. Analysis of the consolidated balance sheet 59
6. Financial policy 62
7. Major investments and disposals 66
8. Pending acquisitions and major contracts 67
9. Property and equipment 67
10. Post-closing events 67
11. Information about geographic locations and activities as at 31st December 2017 68
3
CORPORATE GOVERNANCE 71
1. Board of Directors’ report on corporate governance 72
2. Statutory Auditors’ special report on related-party agreements and commitments 133
4
RISK FACTORS AND CAPITAL ADEQUACY 137
1. Risk factors 138
2. Risk management and internal control mechanism 148
3. Capital management and adequacy 166
4. Credit risks 178
5. Market risks 201
6. Operational risks 211
7. Structural interest rate and exchange rate risks 217
8. Liquidity risk 221
9. Compliance and reputational risk, litigation 228
10. Other risks 233
Abbreviations used: Millions of euros: EUR m Billions of euros: EUR bn FTE: Headcount in Full-Time Equivalents
55
CORPORATE SOCIAL RESPONSIBILITY 237
1. Societe Generale – CSR at a glance 238
2. Societe Generale is a responsible bank 239
3. Societe Generale is implementing its CSR ambition 262
4. Appendices 291
5. Cross-reference table 297
6
FINANCIAL INFORMATION 299
1. Consolidated financial statements 302
2. Notes to the consolidated financial statements 309
3. Statutory Auditors’ report on the consolidated financial
statements 448
4. Societe Generale management report 454
5. Financial statements 461 6. Notes to the parent company financial statements 464
7. Statutory auditors’ report on the financial statements 524
7
SHARE, SHARE CAPITAL AND LEGAL INFORMATION 531
1. The Societe Generale share 532 2. Information on share capital 535
3. Additional information 539
4. By-laws 541
5. Internal Rules of the Board of Directors 546
6 List of regulated information published in the last 12
months 553
8
PERSON RESPONSIBLE FOR THE REGISTRATION DOCUMENT 555
1. Person responsible for the Registration Document 556
2. Statement of the person responsible for the Registration
Document 556
3. Person responsible for the audit of the financial
statements 557
9
CROSS-REFERENCE TABLES 559
Registration Document cross-reference table 560
Annual financial report cross-reference table 562 Cross-reference table for the registry of the Court 562
GLOSSARY OF MAIN TECHNICAL TERMS 563
Rankings: the source for all references to rankings is given explicitly. Where it is not, rankings are based on internal sources.

20
18
20
17
2018 REGISTRAT ION DOCUMENT
A N N U A L F I N A N C I A L R E P O R T 2 0 1 7