
BUILDING A 3D REFERENCE MODEL FOR CANAL TUNNEL SURVEYING USING SONAR AND LASER SCANNING
7
BUILDING A 3D REFERENCE MODEL FOR CANAL TUNNEL SURVEYING USING SONAR AND LASER SCANNING E. Moisan a , P. Charbonnier a , P. Foucher a , P. Grussenmeyer b , S. Guillemin b , M. Koehl b a Cerema Dter Est, ERA27 IFSTTAR, 11 rue Jean Mentelin, B.P. 9, 67035 Strasbourg, France (Emmanuel.Moisan, Pierre.Charbonnier, Philippe.Foucher)@cerema.fr b ICube Laboratory UMR 7357, Photogrammetry and Geomatics Group, INSA Strasbourg, 24 Boulevard de la Victoire, 67084 Strasbourg, France - (pierre.grussenmeyer, samuel.guillemin, mathieu.koehl)@insa-strasbourg.fr Commission V KEY WORDS: 3D Bathymetry, Data processing and 3D Modeling, Reference control and accuracy assessment ABSTRACT: Maintaining canal tunnels is not only a matter of cultural and historical preservation, but also a commercial necessity and a security is- sue. This contribution adresses the problem of building a full 3D reference model of a canal tunnel by merging SONAR (for underwater data recording) and LASER data (for the above-water parts). Although both scanning devices produce point clouds, their properties are rather different. In particular, SONAR data are very noisy and their processing raises several issues related to the device capacities, the acquisition setup and the tubular shape of the tunnel. The proposed methodology relies on a denoising step by meshing, followed by the registration of SONAR data with the geo-referenced LASER data. Since there is no overlap between point clouds, a 3-step procedure is proposed to robustly estimate the registration parameters. In this paper, we report a first experimental survey, which concerned the entrance of a canal tunnel. The obtained results are promising and the analysis of the method raises several improvement directions that will help obtaining more accurate models, in a more automated fashion, in the limits of the involved technology. 1. INTRODUCTION In France, there are 33 canal tunnels still in service for commer- cial navigation and boating, representing 42 km of underground waterway. The preservation of those structures, mostly bored dur- ing the 19 th and 20 th centuries, aims at conserving a heritage and at protecting goods and persons. Hence, periodical inspec- tions are necessary. However, on-site visual investigations are time-consuming and difficult to put into practice. In this context, Voies Navigables de France (VNF, the French operator of water- ways), the Centre d’ ´ Etude des tunnels (CETU) and the Cerema, in collaboration with the Photogrammetry and Geomatics Group (INSA) are devising an automatic inspection system based on image and SONAR recording. A photogrammetric acquisition prototype was initially developed for dynamically surveying the above-water part of tunnels (Charbonnier et al., 2014), see Fig. 1. In the future, an underwater recording device will complement the system. To assess the accuracy of such a mobile recording system, it is necessary to build a reference model of the whole tunnel (i.e. including its under and above-water parts). For the purpose of building an accurate reference model, we pro- ceed to static acquisitions along the tunnel. For the above-water parts, a 3D Terrestrial LASER Scanner (TLS) was selected for its ability to get accurate and easily geo-referenced data (Char- bonnier et al., 2014). For the underwater part, a 3D Mechanical Scanning SONAR (MSS) was chosen because the turbidity of the canal water excludes optical solutions. It enables scanning the environment from stations in the same manner as a TLS, see e.g. (Drap et al., 2011, Sohnlein et al., 2011). Both devices automatically provide point clouds through a me- chanical scanning system. However, while processing and geo- referencing TLS data to obtain a 3D model is rather straightfor- ward, handling MSS data is more complicated. In particular, MSS data are very noisy, which requires robust reconstruction and registration methods to obtain a 3D model of the underwater Figure 1: Modular on-board mobile image recording system on the experimental site. part of the structure. Moreover, in practice, the absolute loca- tion and orientation of the SONAR is not available, so a direct geo-referencing of MSS data is impossible. Hence, we proceed in an indirect manner, by co-registering the above and underwa- ter models, which provides a geo-referenced full 3D model of the canal tunnel. Another difficulty arises from the fact that the above and under- water point clouds do not overlap. This makes the co-registration task more complex. Fortunately, we can exploit some geomet- ric primitives (planes, lines) which are common to its above and underwater parts of the structure. Moreover, we immersed two wooden ladders, that we robustly fitted in both models to provide additional constraints to the registration algorithm. The rest of the paper is organized as follows. We first propose a The International Archives of the Photogrammetry, Remote Sensing and Spatial Information Sciences, Volume XL-5/W5, 2015 Underwater 3D Recording and Modeling, 16–17 April 2015, Piano di Sorrento, Italy This contribution has been peer-reviewed. doi:10.5194/isprsarchives-XL-5-W5-153-2015 153
Transcript of BUILDING A 3D REFERENCE MODEL FOR CANAL TUNNEL SURVEYING USING SONAR AND LASER SCANNING
BUILDING A 3D REFERENCE MODEL FOR CANAL TUNNEL SURVEYING USINGSONAR AND LASER SCANNING
E. Moisana, P. Charbonniera, P. Fouchera, P. Grussenmeyerb, S. Guilleminb, M. Koehlb
a Cerema Dter Est, ERA27 IFSTTAR, 11 rue Jean Mentelin, B.P. 9, 67035 Strasbourg, France(Emmanuel.Moisan, Pierre.Charbonnier, Philippe.Foucher)@cerema.fr
b ICube Laboratory UMR 7357, Photogrammetry and Geomatics Group, INSA Strasbourg, 24 Boulevard de la Victoire,67084 Strasbourg, France - (pierre.grussenmeyer, samuel.guillemin, mathieu.koehl)@insa-strasbourg.fr
Commission V
KEY WORDS: 3D Bathymetry, Data processing and 3D Modeling, Reference control and accuracy assessment
ABSTRACT:
Maintaining canal tunnels is not only a matter of cultural and historical preservation, but also a commercial necessity and a security is-sue. This contribution adresses the problem of building a full 3D reference model of a canal tunnel by merging SONAR (for underwaterdata recording) and LASER data (for the above-water parts). Although both scanning devices produce point clouds, their properties arerather different. In particular, SONAR data are very noisy and their processing raises several issues related to the device capacities, theacquisition setup and the tubular shape of the tunnel. The proposed methodology relies on a denoising step by meshing, followed by theregistration of SONAR data with the geo-referenced LASER data. Since there is no overlap between point clouds, a 3-step procedureis proposed to robustly estimate the registration parameters. In this paper, we report a first experimental survey, which concerned theentrance of a canal tunnel. The obtained results are promising and the analysis of the method raises several improvement directionsthat will help obtaining more accurate models, in a more automated fashion, in the limits of the involved technology.
1. INTRODUCTION
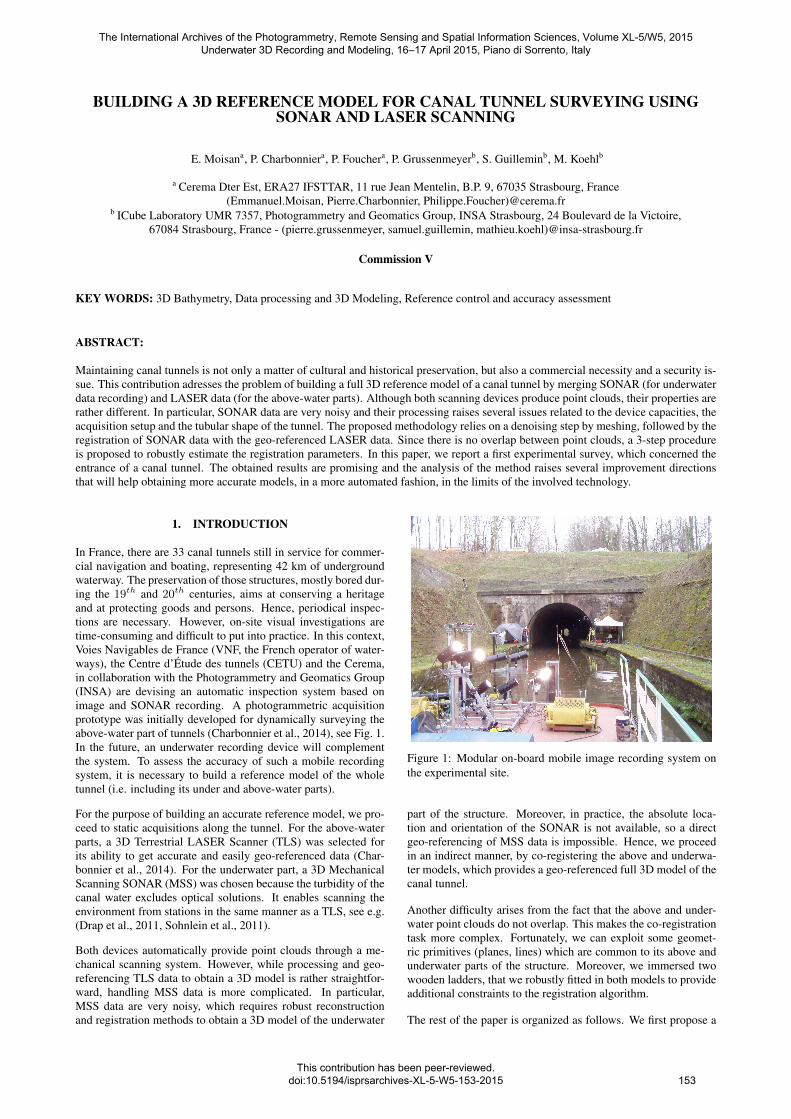
In France, there are 33 canal tunnels still in service for commer-cial navigation and boating, representing 42 km of undergroundwaterway. The preservation of those structures, mostly bored dur-ing the 19th and 20th centuries, aims at conserving a heritageand at protecting goods and persons. Hence, periodical inspec-tions are necessary. However, on-site visual investigations aretime-consuming and difficult to put into practice. In this context,Voies Navigables de France (VNF, the French operator of water-ways), the Centre d’Etude des tunnels (CETU) and the Cerema,in collaboration with the Photogrammetry and Geomatics Group(INSA) are devising an automatic inspection system based onimage and SONAR recording. A photogrammetric acquisitionprototype was initially developed for dynamically surveying theabove-water part of tunnels (Charbonnier et al., 2014), see Fig. 1.In the future, an underwater recording device will complementthe system. To assess the accuracy of such a mobile recordingsystem, it is necessary to build a reference model of the wholetunnel (i.e. including its under and above-water parts).
For the purpose of building an accurate reference model, we pro-ceed to static acquisitions along the tunnel. For the above-waterparts, a 3D Terrestrial LASER Scanner (TLS) was selected forits ability to get accurate and easily geo-referenced data (Char-bonnier et al., 2014). For the underwater part, a 3D MechanicalScanning SONAR (MSS) was chosen because the turbidity of thecanal water excludes optical solutions. It enables scanning theenvironment from stations in the same manner as a TLS, see e.g.(Drap et al., 2011, Sohnlein et al., 2011).
Both devices automatically provide point clouds through a me-chanical scanning system. However, while processing and geo-referencing TLS data to obtain a 3D model is rather straightfor-ward, handling MSS data is more complicated. In particular,MSS data are very noisy, which requires robust reconstructionand registration methods to obtain a 3D model of the underwater
Figure 1: Modular on-board mobile image recording system onthe experimental site.
part of the structure. Moreover, in practice, the absolute loca-tion and orientation of the SONAR is not available, so a directgeo-referencing of MSS data is impossible. Hence, we proceedin an indirect manner, by co-registering the above and underwa-ter models, which provides a geo-referenced full 3D model of thecanal tunnel.
Another difficulty arises from the fact that the above and under-water point clouds do not overlap. This makes the co-registrationtask more complex. Fortunately, we can exploit some geomet-ric primitives (planes, lines) which are common to its above andunderwater parts of the structure. Moreover, we immersed twowooden ladders, that we robustly fitted in both models to provideadditional constraints to the registration algorithm.
The rest of the paper is organized as follows. We first propose a
The International Archives of the Photogrammetry, Remote Sensing and Spatial Information Sciences, Volume XL-5/W5, 2015 Underwater 3D Recording and Modeling, 16–17 April 2015, Piano di Sorrento, Italy
This contribution has been peer-reviewed. doi:10.5194/isprsarchives-XL-5-W5-153-2015
153
brief overview of related works in Sect. 2. Then, in Sect. 3, weshow how we use TLS and MSS for data recording. In Sect. 4, wefocus on the meshing of MSS data to filter noise and obtain a 3Dmodel of the underwater part of the tunnel. Sect. 5 is dedicated tothe construction of the full 3D model by co-registering the aboveand underwater models. In Sect. 6, we comment the experimentalresults and propose future directions for this work.
2. RELATED WORK
Partly immersed structures are exposed to water conditions in ad-dition to classical degradations. Therefore, surveying systemswere recently developed to detect anomalies, both under and abovethe surface. In some works, typically for dams or harbors in-spection, LASER and SONAR acquisitions are combined. Suchtechniques are based on dynamic acquisitions and involve InertialNavigation Systems and Global Positioning Systems (INS+GPS)to monitor the attitude and localization parameters of the plat-form. This approach is for instance used in (Mitchell et al., 2011)and (Rondeau et al., 2012). Of course, GPS signals are not avail-able in tunnels, so other solutions must be sought. In (Papadopou-los et al., 2014), the authors propose a Simultaneous LocalisationAnd Mapping (SLAM) technique that relies on the registration ofTLS point clouds, thanks to the Iterative Closest Point (ICP) algo-rithm. However, the tubular shape of the tunnel is a disadvantagefor this method.
In the previously mentioned works, both TLS and MSS sensorsare embedded on a common, mobile platform, which is not thecase in our application: we are faced with the problem of lo-cating individual MSS acquisitions. Such problem is similar toRemotely Operated Vehicle (ROV) and Autonomous UnderwaterVehicule (AUV) localisation. In (Ridao et al., 2010) a triangula-tion system based on acoustic is proposed. The apparatus is com-posed of surface buoys equipped with ultra-short baseline trans-ducers (USBL) tied up with GPS receivers. Another frequentlyemployed method is visual odometry (Scaramuzza and Fraundor-fer, 2011, Scaramuzza and Fraundorfer, 2012), from optical oracoustic imaging in addition to SLAM algorithms see (Guth et al.,2014) and references therein, but it is not suited to static acquisi-tions. A simpler problem is the relative positioning of MSS data,for which the more commonly used algorithm is ICP (Dobke etal., 2013, Drap et al., 2011) or its robust version.
3. DATA RECORDING
The experimental acquisitions have been carried out in a canaltunnel located in Niderviller, Lorraine region, France. The tun-nel (see Fig. 1), was constructed between 1839 and 1845. It isstraight and lined with stonework. It is 475 m long and, for prac-tical reasons, the acquisitions were focused on its entrances, inthis first experimental campaign.
3.1. Laser scanning
The above-water acquisitions were performed using a Faror Fo-cus 3D TLS. To survey the environment in 3D, a laser beamsweeps the visible surface, vertically and horizontally. Severalsolutions are possible to get the distance between the TLS andthe object. The one implement in the Focus involves measuringthe phase difference between the emitted and received pulse.
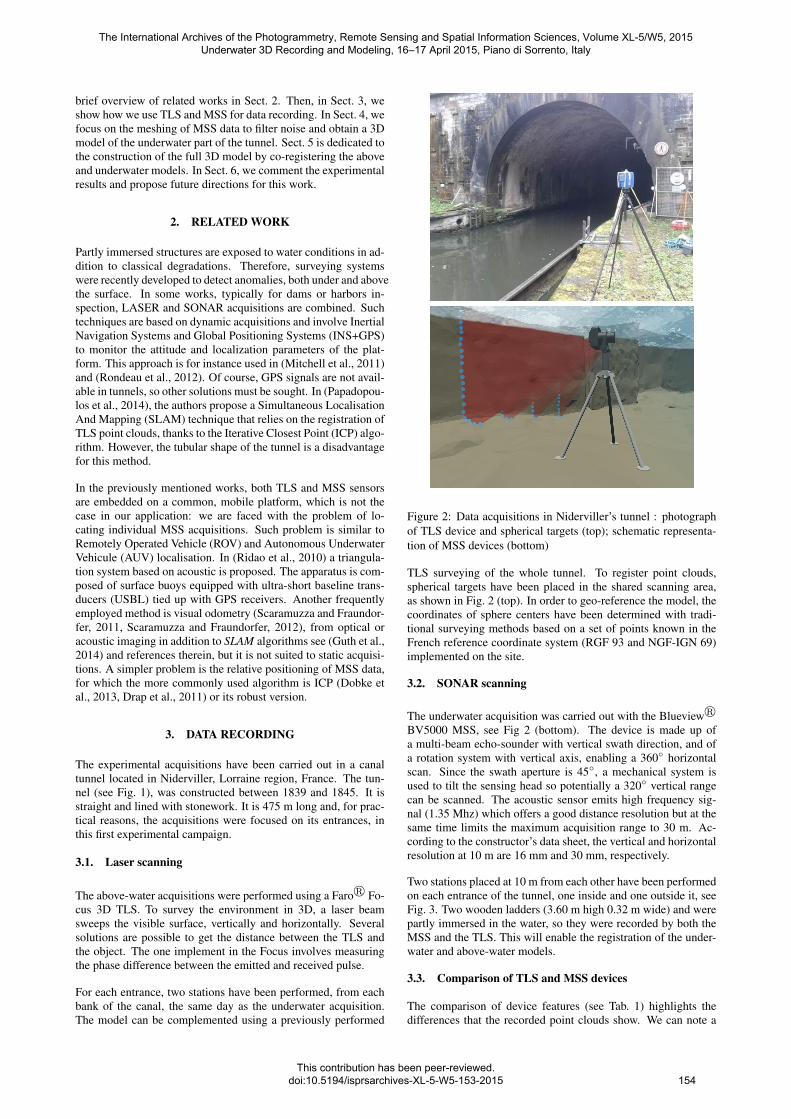
For each entrance, two stations have been performed, from eachbank of the canal, the same day as the underwater acquisition.The model can be complemented using a previously performed
Figure 2: Data acquisitions in Niderviller’s tunnel : photographof TLS device and spherical targets (top); schematic representa-tion of MSS devices (bottom)
TLS surveying of the whole tunnel. To register point clouds,spherical targets have been placed in the shared scanning area,as shown in Fig. 2 (top). In order to geo-reference the model, thecoordinates of sphere centers have been determined with tradi-tional surveying methods based on a set of points known in theFrench reference coordinate system (RGF 93 and NGF-IGN 69)implemented on the site.
3.2. SONAR scanning
The underwater acquisition was carried out with the Blueviewr
BV5000 MSS, see Fig 2 (bottom). The device is made up ofa multi-beam echo-sounder with vertical swath direction, and ofa rotation system with vertical axis, enabling a 360◦ horizontalscan. Since the swath aperture is 45◦, a mechanical system isused to tilt the sensing head so potentially a 320◦ vertical rangecan be scanned. The acoustic sensor emits high frequency sig-nal (1.35 Mhz) which offers a good distance resolution but at thesame time limits the maximum acquisition range to 30 m. Ac-cording to the constructor’s data sheet, the vertical and horizontalresolution at 10 m are 16 mm and 30 mm, respectively.
Two stations placed at 10 m from each other have been performedon each entrance of the tunnel, one inside and one outside it, seeFig. 3. Two wooden ladders (3.60 m high 0.32 m wide) and werepartly immersed in the water, so they were recorded by both theMSS and the TLS. This will enable the registration of the under-water and above-water models.
3.3. Comparison of TLS and MSS devices
The comparison of device features (see Tab. 1) highlights thedifferences that the recorded point clouds show. We can note a
The International Archives of the Photogrammetry, Remote Sensing and Spatial Information Sciences, Volume XL-5/W5, 2015 Underwater 3D Recording and Modeling, 16–17 April 2015, Piano di Sorrento, Italy
This contribution has been peer-reviewed. doi:10.5194/isprsarchives-XL-5-W5-153-2015
154

Figure 3: Illustration of the acquisition setup seen from above,featuring TLS and MSS stations, as well as the location of ladders(LD)
large difference in spatial resolution, i.e. the distance betweena recorded point and its closest neighbor. But the main contrastconcerns the beam width which has a direct impact on the im-agery resolution, i.e. the ability to distinguish two echoes comingfrom two different targets. For exemple, the signal footprint ona plane perpendicular to the signal direction 10 m away from thedevice is a circle of 6 mm diameter for the Focus 3D and a squareof 175 mm side length for the BV5000. In addition, the more theincident angle of the beam, the more these dimensions increase.In the case of canal tunnels, which are elongated structures, theincidence angle quickly becomes unfavorable. This influence isvisible on the acoustic images, shown on Fig. 4. One can see thatthe vertical line, which corresponds to the footprint of the swathon the canal’s wall is much wider for a small grazing angle of ac-quisition than for an almost perpendicular acquisition. Accordingto a theoretical model of the acquisition setup and to the datasheetof the BV5000, we estimate horizontal width of the beam foot-print (see Fig. 5). We see that, in the case of canal tunnels, thislength can easily reach more than 0.5 m.
8,416,41
4,412,41
0,41
8,416,41
4,412,41
0,41
Figure 4: Multi-beam echo-sounder swaths under two differentincidence angles. Left: almost perpendicular incidence (see redline in Fig. 5); Right: small grazing angle (see green line inFig. 5)). The swath is wider in the second case. Distances aregiven in meters
Another important difference between terrestrial and underwaterimaging is that in the latter case, no visual control can be made inpractice. Hence, if the MSS moves during the acquisition, there isno way of knowing it. This might lead to artifacts or inconsistentmeasurements.
4. 3D SURFACE RECONSTRUCTION
Most of the time in surveying applications, surface reconstruc-tion is performed by post-processing to obtain a simplified dig-
3m
1m 2m 3m 4m 5m 6m 7m 8m 9m 10m
MSSX
Y
Figure 5: Top-view of the theoretical acquisition setup (top); Es-timation of the SONAR horizontal resolution as a function thedistance from the orthogonal projection (bottom)
ital model of structures. The surface can be reconstructed fromthe point cloud, by detecting geometric primitives or by meshing,which is better suited to complex geometries. In our case, weare faced with very noisy data. Hence, we use meshing as a pre-processing, mainly for denoising the underwater model. Thereare two main ways of processing surface reconstruction by mesh-ing. The first one uses cloud points as vertices for triangulation.Such method is obviously sensitive to noise, so it cannot be di-rectly applied to MSS data. A first solution to this problem is tofilter the point cloud before meshing, for example by selectingevenly spaced points. A second one is to compute the nearestsurface to points using robust estimators, at the risk of obtainingan over-smooth model. In fact, with both cases, there is a riskof loosing details. The choice of the method heavily relies onthe properties of the point cloud. As noticed in the previous part,the above and underwater recorded data present many character-
Table 1: TLS and MSS acquisition parameters
Faro Focus 3DX330
Blue View BV5000
horizontal reso-lution
0.036◦ ∼0.09◦
(16 mm/10 m)vertical resolu-tion
0.036◦ 0.18◦
(30 mm/10 m)beam width 2.25 mm + 2 ×
0.011◦1◦/1◦
ranging error 2 mm (10-25 m) 15 mmmaximumrange
330 m 30 m
field-of-view 300◦/360◦ 45◦/360◦
(320◦/360◦)
The International Archives of the Photogrammetry, Remote Sensing and Spatial Information Sciences, Volume XL-5/W5, 2015 Underwater 3D Recording and Modeling, 16–17 April 2015, Piano di Sorrento, Italy
This contribution has been peer-reviewed. doi:10.5194/isprsarchives-XL-5-W5-153-2015
155
istic differences, so the suitable reconstruction methods are alsodifferent.
The meshing of both the MSS and TLS data has been made using3DReshaperr. Both previously mentioned meshing techniquesare implemented in the software. The advantage of this programis to allow surface reconstruction by successive refinements usingthe point cloud.
As previously mentioned, MSS data are very noisy, so the un-derwater model reconstruction was performed in a coarse-to-finemanner. A first large-scale mesh is made by selecting points inthe mesh according to a distance criterion. Then, the resolutionof the mesh is progressively increased by picking points again inthe cloud or by interpolating new points. Point selection involveseither a distance-to-mesh or a maximum surface deviation crite-rion. These parameters must be carefully chosen. In this firstexperiment, they are manually tuned by an operator.
Unlike MSS point clouds, TLS point clouds have a negligiblenoise for points located at a certain distance from the device aswell as for certain target material properties. Thus, to use maxi-mum of point cloud informations, all points (except outliers) havebeen employed as triangle vertices to reconstruct the surface.
We note that this step of the process requires many manual oper-ations like outlier removal or the correction of mesh reconstruc-tion mistakes. While such interventions can be supported by pho-tographs or other physical measurements for TLS data, this is ofcourse not the case for underwater data. Hence, the constructionof the underwater model from MSS data involves an importantpart of interpretation.
5. REGISTRATION AND GEO-REFERENCING
Both the TLS and the MSS provide point clouds that must beregistered in order to obtain a geo-referenced 3D model.
In general, there are two ways of registering and geo-referencingpoint clouds. The first one is direct: it requires the knowledgeof the position of the scanner. This can be obtained a priori, byplacing the device at a point of known coordinates, or a posteri-ori, by surveying its position using conventional techniques. Thesecond one is indirect: the point clouds are first co-registered andthen, the geo-referencing is made using elements of the cloudwith known coordinates. The registration of point clouds can bebased either on targets or on clouds.
Target-based registration requires to anticipate and place targetsin the field of view. Their geometry and scale depend on the spa-tial resolution and precision of the scanner. Spheres are usuallyused for TLS recording because the determination of their centerscan be made very accurately. Of course, the quality of the reg-istration also depends on the distribution and number of targets.This method is very usual in lasergrammetry and is the one thatwe chose for our application.
Cloud-based registration involves to automatically find homol-ogous points between scans, and then, to compute the geomet-ric transformation (rotations, translations) between sets of points.The most popular algorithm is the ICP (Iterative Closest Point)method, introduced by (Besl and McKay, 1992), which itera-tively minimizes the difference between the first set of pointsand the geometric transformation of the second set of points.This method requires a certain overlap between point clouds andalso, a first estimation of the transformation. An alternative tech-nique is based on finding homologous geometrical entities be-tween scans. These entities can be planes, spheres, cylinders orlines and to find the best way to align them.
5.1. Underwater registration
Registration and geo-referencing are more complicated for theBV5000 scans than for TLS data. Since, in our setup, the posi-tion and orientation of the underwater scanner cannot be directlydetermined, we have to resort to the indirect method. Cloud-to-cloud registration seems to be the easiest technique to implementbut it also raises several issues. Some are due to the nature ofthe technology itself: MSS data are very noisy and the resolu-tion is rather coarse, so finding correspondences is difficult. Asecond issue is related to the elongated shape of the canal and toour experimental setup, that produce small grazing angles: thefarther the point, the less the accuracy, which also influences thequality of registration. In these conditions, it is very difficult toresolve the longitudinal ambiguity, i.e. to accurately estimate thetranslation along the tunnel axis. Immersing geometric referenceobjects (e.g. ladders) or decreasing the distance between stationsto increase the overlap quality are possible solutions to alleviatethis problem. In our case, we found it more practical to registerMSS data with TLS data as explained in more details in the abovesub-section.
5.2. Underwater geo-referencing
As the geo-referencing of TLS data is straightforward, we choseto register MSS point clouds on TLS acquisitions to get a geo-referenced global model. The main issue is the lack of overlapbetween TLS and MSS acquisition, which prevents from usingcloud-to-cloud registration directly, hence we split up the prob-lem into three steps that are described below.
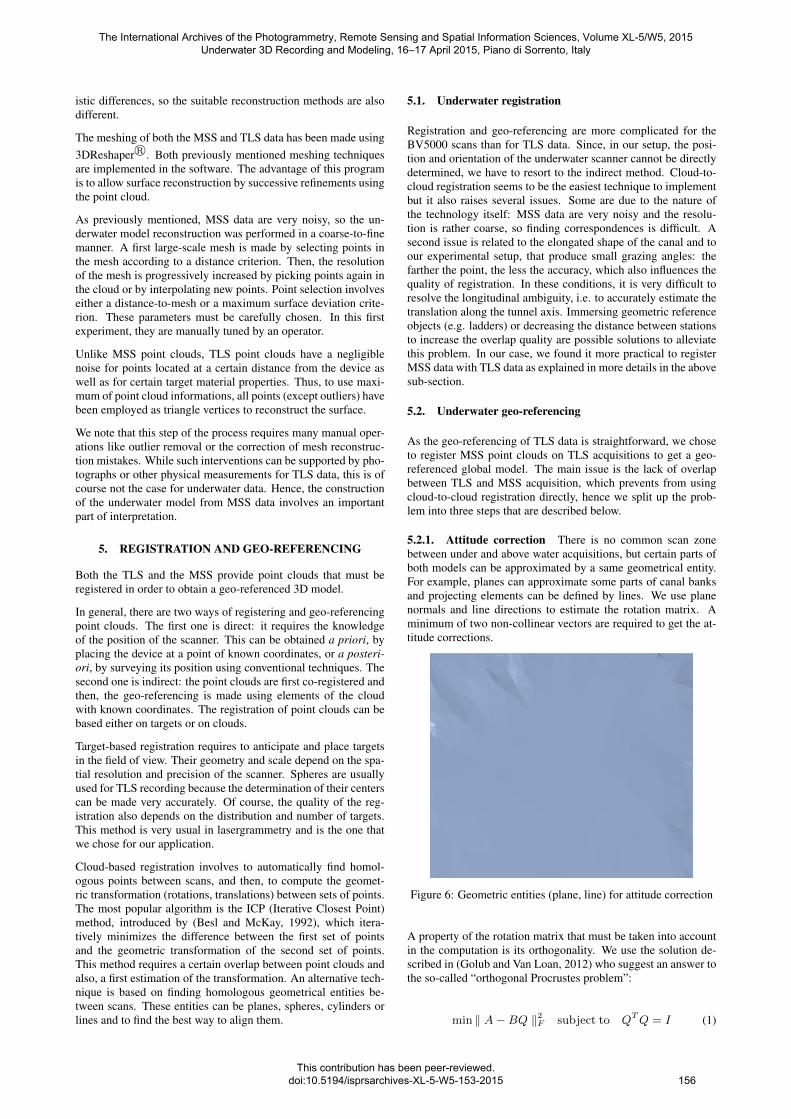
5.2.1. Attitude correction There is no common scan zonebetween under and above water acquisitions, but certain parts ofboth models can be approximated by a same geometrical entity.For example, planes can approximate some parts of canal banksand projecting elements can be defined by lines. We use planenormals and line directions to estimate the rotation matrix. Aminimum of two non-collinear vectors are required to get the at-titude corrections.
Figure 6: Geometric entities (plane, line) for attitude correction
A property of the rotation matrix that must be taken into accountin the computation is its orthogonality. We use the solution de-scribed in (Golub and Van Loan, 2012) who suggest an answer tothe so-called “orthogonal Procrustes problem”:
min ‖ A−BQ ‖2F subject to QTQ = I (1)
The International Archives of the Photogrammetry, Remote Sensing and Spatial Information Sciences, Volume XL-5/W5, 2015 Underwater 3D Recording and Modeling, 16–17 April 2015, Piano di Sorrento, Italy
This contribution has been peer-reviewed. doi:10.5194/isprsarchives-XL-5-W5-153-2015
156

were ‖ . ‖F denotes the Frobenius norm, and where A and Bare respectively the direction vectors of the elements extractedfrom the TLS and the MSS models and Q is the 3x3 rotation ma-trix. The algorithm computes the Singular Value Decomposition(SVD) of the BTA product, UT (BTA)V = Σ, to get the rota-tion matrix Q, as:
Q = UV T (2)
5.2.2. Vertical translation During this step, we compute thevertical translation using the ladders, whose dimensions are known.More specifically, we use the positions of the ladder rungs in bothmodels to estimate the difference in altitude. But the underwateracquisition provides noisy point clouds, so the information can-not be directly extracted from the point cloud. Hence, to get anaccurate result we developed a robust estimation method to modelthe ladder.
The first step of the method is the segmentation of the underwateracquisition to extract the ladder points from the MSS point cloud.Then, the ladder plane is computed using a robust version of Prin-cipal Component Analysis, based on a M-estimator. Finally thepoints of the ladder cloud are projected onto the plane, so the restof the process is performed in two dimensions.
The second step is the automatic segmentation of ladder’s compo-nents (vertical bars and rungs) thanks to histogram analysis. Theprevious step provides a 2D point cloud in a coordinate systemwith abscissa axis parallel to the vertical bars and ordinate axisparallel to the rungs. The statistical distributions of point coordi-nates along both axes show peaks that allow an easy segmentationof the cloud. Hence, points are split into clusters, that correspondeither to vertical bars or to rungs.
Then, the third step is the robust adjustment of straight lines onthe data, to model the bars and rungs. For this purpose, we usea linear regression and we simultaneously fit all the lines, tak-ing into account that rungs are parallel, that the two vertical barsare also parallel, and that vertical bars are perpendicular to rungs.Such constraints are very useful in our context, where data arevery noisy. In this experiment, we use an orthogonal fit, i.e.the residual is the orthogonal distance between the point and themodel. One may note that affine fitting could also be used be-cause the components of the ladder are almost parallel to axes. Inboth cases, we use a M-estimator, i.e. we replace the usual sumof squared residuals by a function of the form:
J(θ) =∑i
ρ(ri) (3)
where θ is the vector of model parameters, ρ is a non-quadraticpotential or penalty function and ri is the residual, i.e. the differ-ence between the observation and its prediction according to themodel. In the half-quadratic setup, see e.g. (Charbonnier et al.,1997), it is shown that minimizing J is equivalent to minimizing
J?(θ, b) =∑i
bir2i + Ψ(bi) (4)
where Ψ is a convex the cost function whose expression can berelated to ρ and bi is an auxiliary variable, whose role is bothto mark outliers and to linearize the problem. Indeed, J? isquadratic with respect to r (hence, w.r.t. θ in linear regression)when b is fixed, and convex w.r.t. b when r is fixed. Moreover, inthe latter case, the minimum is obtained for b = ρ′(r)/2r. Suchproperties suggest a deterministic algorithmic strategy that con-sists in alternately fixing each variable and minimizing w.r.t. theother.
In the affine regression setup, this leads to the well-known Iter-ated Reweighted Least-squares (IRLS) algorithm. This strategymay be extended to the simultaneous fit of several curves, seee.g. (Tarel et al., 2007, Tarel et al., 2008). However, the algorithmwe obtain here is slightly different because of the additional par-allelism and orthogonality constraints related to the geometry ofladders. In the orthogonal setup, the resulting algorithm simul-taneously estimates the centroids of bars and rungs in an IRLSfashion, and their direction using a reweighted version of PCA.
Finally, the intersection points between rungs and vertical barsare calculated and transformed back in 3D coordinates.
0.5 m
27.6 cme = 4mm
26.6 cme = 14mm
28.7 cme = -7mm
27.5 cme = 5mm
28.7 cme = -7mm
23.4 cme = 46mm
Figure 7: Ladder fitting. Left: front view with inter-rung dis-tances and errors (e) with respect to ground truth. Right: sectionalview showing the adjustment of the ladder plane.
Fig. 7 shows an example of robust ladder fitting. One may seethat, despite the strong noise level, the ladder is well approxi-mated (the maximum error with respect to ground truth measure-ments of inter-rung distances is 46 mm and most errors are lessthan 10 mm).
5.2.3. Horizontal translation Once the attitude and verticaltranslation have been correctly estimated, the last operation con-sists in estimating the horizontal translation vector. The 2D sil-houette of the waterline along the structure can be extracted onboth the TLS ans MSS model by intersecting the correspondingpoint clouds with the plane that corresponds to the water surface.Finally, we apply a 2D ICP algorithm to estimate the translationvector between the two models.
5.2.4. Final result The estimated transformation can be ap-plied to the underwater meshed model as well as to the originalpoint cloud. Indeed, the underwater point cloud provides visualinformation that may disappear in the mesh view. For example,projected shadow highlights certain elements of the scene. Fig. 8shows the result that we obtain. Overall, the obtained model isvisually satisfying, even if some imperfections may be observedin regions far from the station. One may see e.g. at the bottomleft of the topmost image, that the underwater model has a verygranular aspect and that the adjustment of both models becomesless perfect. These defects are probably due to the fact that thefootprint of the beam is very large at such a distance from thesource.
The International Archives of the Photogrammetry, Remote Sensing and Spatial Information Sciences, Volume XL-5/W5, 2015 Underwater 3D Recording and Modeling, 16–17 April 2015, Piano di Sorrento, Italy
This contribution has been peer-reviewed. doi:10.5194/isprsarchives-XL-5-W5-153-2015
157

Figure 8: Resulting full 3D geo-referenced model of Niderviller’s canal tunnel entrance. Top: point cloud visualization; bottom: meshvisualisation (the blue mesh is the underwater model and the red line defines the waterline).
6. DISCUSSION
In this paper, we have introduced a method to record and processTLS and MSS data with the purpose of building a 3D referencemodel of a canal tunnel. A comparison between the SONAR andLASER device characteristics highlights differences that impactthe quality of the data. In particular, it appears that MSS datahave a much lower resolution than TLS data, and that the angularloss of resolution can be rather strong. Since the elongated shapeof the tunnel generates unfavorable incidence angles, the qualityof SONAR acquisitions becomes rather coarse at large distancesfrom the scanner. Moreover, this technology tends to providenoisy data.
To limit the effect of perturbations on the processing, we first per-form a data denoising by meshing. More specifically, a coarse-to-fine method, which gradually increases the resolution of themesh, has been used. Of course, this step removes noise, but atthe same time some details can be lost. In this experiment, thetrade-off between noise and details was made empirically, whichis difficult. Contrary to TLS data, there is no direct visual or phys-ical reference that could guide the process: MSS acquisitions are
actually the only visual information available. It might be envi-sioned to infer the underwater texture by assuming that there isa continuity with the above-water part, but this is not satisfac-tory. We believe that acoustic and image processing techniquesshould be explored to devise a more automatic and data-drivendenoising technique. In particular, moving least squares, bilat-eral filtering (Tomasi and Manduchi, 1998), non-local means fil-tering (Buades et al., 2005, Deschaud and Goulette, 2010, Digne,2012) or structure+texture decompositions (Aujol et al., 2006)seem appealing for this task.
A second important issue is related to the co-registration of thepoint clouds provided by the scanners. While processing TLSdata to obtain the above-water geo-reference 3D model is ratherstraightforward, this task is much more difficult for MSS data.Due to the low resolution of the data and to the angular loss ofresolution, classical techniques such as ICP did not provide sat-isfactory results in our experiments. To alleviate this problem,its is possible to improve the experimental setup by reducing thedistance between MMS stations: an interval of about 5 m wouldbe recommended. Moreover, it is possible to immerse more tar-
The International Archives of the Photogrammetry, Remote Sensing and Spatial Information Sciences, Volume XL-5/W5, 2015 Underwater 3D Recording and Modeling, 16–17 April 2015, Piano di Sorrento, Italy
This contribution has been peer-reviewed. doi:10.5194/isprsarchives-XL-5-W5-153-2015
158
gets, such as the ladders that we used here, to provide additionalreferences to help the registration. Our experiments show that thetargets must be carefully chosen and placed on-site: for example,the ladders should be separated from the canal walls, unless theirsegmentation becomes problematic.
To obtain a geo-referenced global model of the canal-tunnel, reg-istering MSS and TSS data is a crucial point. The main difficultywe are faced with in this application is that there is no overlap be-tween the above and underwater models. We therefore proposeda 3-step procedure in which, first, geometrical entities are usedto fix the attitude parameters. The second step uses the laddersto estimate the vertical correction: we proposed a robust methodbased on M-estimation to fit lines on the bars and rungs of theladder using the noisy point cloud. We assessed the method bycomparing the results of the fit with direct measurement of dis-tances. In most cases, the error is less than 10 mm (with a max-imum of 46 mm). Third, after having extracted the intersectionlines between the water surface and the MSS and TLS models,we apply a 2D ICP algorithm limited to estimate the remaining2D translations.
This experimentation provides an initial overview of underwateracquisition in canal tunnel and yields promising results. Improve-ments of the model’s quality may be expected from a better ex-perimental setup (closer stations, more numerous targets). Moreautomatic, data-driven filtering technique should help enhancingthe quality of the data and limit manual interventions. Manyproblems we are faced with result from intrinsic limitations ofthe acquisition techniques, but one may foresee that the technol-ogy will progress, so we may expect increasingly accurate resultsusing the proposed methodology. The obtained models will be areference for future acquisitions, in static (to get the tunnel de-formation) or with dynamic underwater acquisitions systems (forassessing mobile mapping solutions).
REFERENCES
Aujol, J.-F., Gilboa, G., Chan, T. and Osher, S., 2006. Structure-texture image decomposition–modeling, algorithms, and param-eter selection. International Journal of Computer Vision 67(1),pp. 111–136.
Besl, P. and McKay, N. D., 1992. A method for registration of3-D shapes. Pattern Analysis and Machine Intelligence, IEEETransactions on 14(2), pp. 239–256.
Buades, A., Coll, B. and Morel, J.-M., 2005. A non-local algo-rithm for image denoising. In: Proceedings of the 2005 IEEEComputer Society Conference on Computer Vision and PatternRecognition (CVPR’05) - Volume 02, CVPR ’05, pp. 60–65.
Charbonnier, P., Blanc-Feraud, L., Aubert, G. and Barlaud, M.,1997. Deterministic edge-preserving regularization in computedimaging. IEEE Transactions on Image Processing 6(2), pp. 298–311.
Charbonnier, P., Foucher, P., Chavant, P., Muzet, V., Prybyla, D.,Perrin, T., Albert, J., Grussenmeyer, P., Guillemin, S. and Koehl,M., 2014. An image-based inspection system for canal-tunnelheritage. International Journal of Heritage in the Digital Era 3(1),pp. 197–214.
Deschaud, J.-E. and Goulette, F., 2010. Point cloud non localdenoising using local surface descriptor similarity. In: N. Papar-oditis, M. Pierrot-Deseilligny, C. Mallet and O. Tournaire (eds),IAPRS, Vol. XXXVIII, Part 3A, Saint Mand, France, pp. 109–114.
Digne, J., 2012. Similarity based filtering of point clouds. In:Computer Vision and Pattern Recognition Workshops (CVPRW),2012 IEEE Computer Society Conference on, pp. 73–79.
Dobke, A., Vasquez, J., Lieu, L., Chasnov, B., Clark, C.,Dunn, I., Wood, Z. J. and Gambin, T., 2013. Towards three-dimensional underwater mapping without odometry. In: Proceed-ings of Unmanned Untethered Submersible Technology Confer-ence, Portsmouth, New Hampshire, USA.
Drap, P., Merad, D., Boı, J.-M., Boubguira, W., Mahiddine, A.,Chemisky, B., Seguin, E., Alcala, F. and Bianchimani, O., 2011.ROV-3D: 3D underwater survey combining optical and acousticsensor. In: Proceedings of the 12th International Conference onVirtual Reality, Archaeology and Cultural Heritage, VAST’11,Eurographics Association, Aire-la-Ville, Switzerland, pp. 177–184.
Golub, G. H. and Van Loan, C. F., 2012. Matrix computations.Johns Hopkins Studies in the Mathematical Sciences, Vol. 3,Johns Hopkins University Press; 4th edition.
Guth, F., Silevira, L., Botelho, S., Drews, P. and Ballester, P.,2014. underwater SLAM: Challenges, state of the art, algorithmsand a new biologically-inspired approach. In: 5th IEEE RAS& EMBS International Conference on Biomedical Robotics andBiomechatronics (BioRob), Sao Paulo, Brasil, pp. 981–986.
Mitchell, T., Miller, C. and Lee, T., 2011. Multibeam surveysextended above the waterline. In: Proceedings of WEDA tech-nical conference and Texas A&M dredging seminar, Nashville,Tennessee, USA, pp. 414–422.
Papadopoulos, G., Kurniawati, H., Shariff, A. S. B. M., Wong,L. J. and Patrikalakis, N. M., 2014. Experiments on surface re-construction for partially submerged marine structures. Journalof Field Robotics 31(2), pp. 225–244.
Ridao, P., Carreras, M., Ribas, D. and Garcia, R., 2010. Visual in-spection of hydroelectric dams using an autonomous underwatervehicle. Journal of Field Robotics 27(6), pp. 759–778.
Rondeau, M., Leblanc, E. and Garant, L., 2012. Dam in-frastructure first inspection supported by an integrated multi-beam echosounder MBES)/LiDAR system. In: Proceedings ofthe Canadian Dam Association annual conference, Saskatoon,Canada.
Scaramuzza, D. and Fraundorfer, F., 2011. Visual odometry - partI: The first 30 years and fundamentals. Robotics & AutomationMagazine, IEEE 18(4), pp. 80–92.
Scaramuzza, D. and Fraundorfer, F., 2012. Visual odometry- part II: Matching, robustness, optimization, and applications.Robotics & Automation Magazine, IEEE 19(2), pp. 78–90.
Sohnlein, G., Rush, S. and Thompson, L., 2011. Using mannedsubmersibles to create 3D sonar scans of shipwrecks. In: Pro-ceedings of IEEE OCEANS conference, Santander, Spain, pp. 1–10.
Tarel, J., Charbonnier, P. and Ieng, S., 2007. Simultaneous ro-bust fitting of multiple curves. In: International Conference onComputer Vision Theory and Applications (VISAPP), Barcelone,Spain, pp. 175–182.
Tarel, J., Ieng, S. and Charbonnier, P., 2008. A constrained-optimization based half-quadratic algorithm for robustly fittingsets of linearly parametrized curves. Advances in Data Analysisand Classification 2(3), pp. 227–239.
Tomasi, C. and Manduchi, R., 1998. Bilateral filtering for grayand color images. In: ICCV, pp. 839–846.
The International Archives of the Photogrammetry, Remote Sensing and Spatial Information Sciences, Volume XL-5/W5, 2015 Underwater 3D Recording and Modeling, 16–17 April 2015, Piano di Sorrento, Italy
This contribution has been peer-reviewed. doi:10.5194/isprsarchives-XL-5-W5-153-2015
159