Dynamic mechanical properties of deformed rubber-modified acrylics

doi:10.1144/SP332.6 2010; v. 332; p. 79-98 Geological Society, London, Special Publications
M. Zucali, V. Barberini, D. Chateigner, B. Ouladdiaf and L. Lutterotti
datamicrostructural and texture analysis from optical and diffractionexperimentally deformed in torsion to high strains: quantitative
plastic deformation of gypsum aggregatesplusBrittle
Geological Society, London, Special Publications
serviceEmail alerting
article to receive free email alerts when new articles cite thisclick here
requestPermission to seek permission to re-use all or part of this article click here
SubscribePublications or the Lyell Collection
to subscribe to Geological Society, London, Specialclick here
Notes
Downloaded by on 16 April 2010
London © 2010 Geological Society of

Brittle plus plastic deformation of gypsum aggregates experimentally
deformed in torsion to high strains: quantitative microstructural and
texture analysis from optical and diffraction data
M. ZUCALI1*, V. BARBERINI2, D. CHATEIGNER3, B. OULADDIAF4 & L. LUTTEROTTI5
1Dipartimento di Scienze della Terra ‘Ardito Desio’, Universita degli Studi di Milano,
Via Mangiagalli 34, 20133 Milano, Italy2Dipartimento di Scienze Geologiche e Geotecnologie, Universita degli Studi di Milano-Bicocca,
Piazza della Scienza 4, 20126 Milano, Italy3Laboratoire de Cristallographie et Sciences des Materiaux (CRISMAT), Ecole Nationale
Superieure d’Ingenieurs de Caen (ENSICAEN), Universite de Caen Basse-Normandie,
6 Bd M. Juin, 14050 Caen, France4Institut Laue-Langevin, BP 156, 6 rue Jules Horowitz, 38042 Grenoble Cedex 9, France
5Department of Materials Engineering, Engineering Faculty, University of Trento, Via Mesiano,
77, I-38100 Povo-Trento, Italy
*Corresponding author (e-mail: [email protected])
Dedicated to the memory of Luigi Burlini
Abstract: This contribution presents a quantitative microstructural analysis of a polycrystallineaggregate of gypsum, deformed in torsion (T ¼ 70–90 8C) at g (shear strain) ranging from 0 to4.82. Quantitative microstructural analysis is used to compare the evolution of microstructuresobserved by optical microscope with those obtained from analysis of X-ray and neutron diffractiondata. This analysis shows that during experimental deformation, gypsum accommodated strain bybrittle and plastic deformation mechanisms, developing Riedel-like microfaults with plastic foli-ations and crystallographic preferred orientation (CPO). The relations of microstructures showthat with increasing strain, the Riedel systems start from R planes with an angle of �308 to theImposed Shear Plane. This angle decreases (58–158) when strain increases, and Y planesdevelop. Quantitative texture analysis (QTA) shows that S-foliations start developing at low gand maintain their orientation up to high g, and that the most active slip system is the (010)along normal to (100) and the [001]-axis. Shape preferred orientation (SPO) of gypsum does notcoincide with the theoretical orientation as it does not decrease with increasing strain. This discre-pancy is explained by the role of the brittle shear planes that impose a back rotation to gypsum. Nobrittle to plastic transition occurs. But both plastic and brittle structures contemporaneously accom-modate and localize strain.
Many rocks (metamorphic, igneous and sedimen-tary) show non-random orientation distributions oftheir crystallites that results in anisotropies ofmacroscopic physical properties (Turner & Weiss1963; Wenk 1985; Randle & Engler 2000; Karato2008). The crystallographic/lattice or shape pre-ferred orientation (SPO) of crystals with respectto macroscopic fabric axes may be attained inresponse to deformation processes. The interpret-ation of textures (i.e. crystallographic preferredorientation) in materials (e.g. rocks or rock ana-logues) relies on a quantitative description of theorientation features. Together with several othertexture analysis methods, quantitative texture analy-sis (QTA) using neutron and X-ray diffraction has
been successfully used in recent years to completelydescribe the crystallographic preferred orientation(CPO) of naturally deformed rocks (e.g. Kockset al. 1998; Leiss et al. 2000; Zucali et al. 2002;Zucali & Chateigner 2006; Wenk 2006 and refer-ences therein).
In this work we present, together with a detailedand complete microstructural analysis, the results ofQTA measurements from neutron and X-ray experi-ments carried out on samples of natural gypsumthat were experimentally deformed in torsion athigh shear strains and confining pressure, and atvarious temperatures and strain rates (Barberiniet al. 2005). The QTA measurements were per-formed at the ILL neutron facility (Grenoble,
From: SPALLA, M. I., MAROTTA, A. M. & GOSSO, G. (eds) Advances in Interpretation of Geological Processes:Refinement of Multi-scale Data and Integration in Numerical Modelling. Geological Society, London, SpecialPublications, 332, 79–98. DOI: 10.1144/SP332.6 0305-8719/10/$15.00 # The Geological Society of London 2010.

France) and at the Laboratoire de Cristallographie etSciences des Materiaux (CRISMAT), Ecole Natio-nale Superieure d’Ingenieurs de Caen (ENSICAEN,France).
The study of the deformation behaviour of min-erals that form evaporitic rocks is of great impor-tance because these rocks can easily localizedeformation. Several studies have described thestructures and behaviour of gypsum deformedunder various conditions (Craker & Schiller 1962;Baumann 1984; Panozzo Heilbronner & Olgaard1987; Harland et al. 1988; Ko et al. 1995; Stretton1996; Barberini et al. 2005) and the tectonicimplications of gypsum dehydration (Heard &Rubey 1966), but only a few have described themicrostructural and textural evolution (Levykin &Parfenov 1983; Kern & Richter 1985; PanozzoHeilbronner & Dell’Angelo 1990; PanozzoHeilbronner 1993). Such studies describe the evol-ution of a preferred orientation of poles to planes(010), perfect cleavage planes, which is parallelto s1 (main axial stress). (010) , 001. is con-sidered the most common slip plane but othershave also been recognized (Muegge 1898; DeMeer 1995). The deformation of gypsum has alsobeen studied under various conditions in order toinvestigate the behaviour under transient drainedconditions (Olgaard et al. 1995). Moreover, theinstantaneous and long-term behaviour of naturalgypsum has been studied to understand the tracesof dissolution observed in pillars of undergroundgypsum quarries (Hoxha et al. 2006; Castellanzaet al. 2008) and to model its long-term behaviour(Hoxha et al. 2005). Finally, some authors havestudied the creep of wet gypsum aggregates, andthe relationships with the mechanics of thrustfaults and other large-scale structures, associatedwith oil and gas accumulations (De Meer &Spiers 1995).
Sample description
The studied gypsum samples are cores about 9 mmthick and 7–15 mm long obtained from naturalgypsum (gypsum .99%). The specimens (Table 1and Fig. 1a) were deformed in torsion experiments(Paterson & Olgaard 2000) up to high shear strainvalues (up to g ¼ 5) at a confining pressure of300 MPa and at various temperatures (from 70 to90 8C) and strain rates (between 1023 and1025 s21) (Barberini et al. 2005). Within cylindricalsamples deformed in torsion the deformation variesradially from no deformation at the centre of thecore to maximum deformation at the outer surface.Therefore, thin sections for microstructural obser-vations were cut as close as possible to the outercylinder surface (Fig. 1b). T
ab
le1.
Exp
erim
enta
ldet
ail
sof
the
studie
dsa
mple
s
Sam
ple
Shea
rst
rain
( g)
Shea
rst
rain
rate
(s2
1)
Tem
per
ature
(8C
)D
rain
ed/u
ndra
ined
Gypsu
m/b
assa
nit
eA
nal
yti
cal
tech
niq
ues
*
VG
O–
––
–G
OM
–N
T–
XT
V4
0.3
65�
10
25
127
DBþ
GO
MV
70.4
95�
10
25
70
UG
OM
–N
T–
XT
V6
1.1
2up
to1�
10
24
90
UGþ
BO
MV
81.1
91�
10
24
90
UGþ
BO
M–
NT
–X
TV
13
1.7
81�
10
24
90
DGþ
BO
MV
15
1.8
01�
10
24
70
DG
OM
V9
2.4
91�
10
24
90
UGþ
BO
MV
18
2.5
9up
to6�
10
24
70
DG
OM
–N
T–
XT
V14
2.6
12�
10
24
90
DG
OM
–N
T–
XT
V11
2.8
96�
10
24
90
DG
OM
V10
4.0
72�
10
24
90
DG
OM
–N
T–
XT
V16
4.1
11�
10
24
70
DG
OM
–X
TV
20
4.8
21�
10
24
70
DG
OM
–N
T
*O
M,
opti
cal
mic
rosc
opy;
NT
,neu
tron
textu
re;
XT
,X
-ray
textu
re.
M. ZUCALI ET AL.80
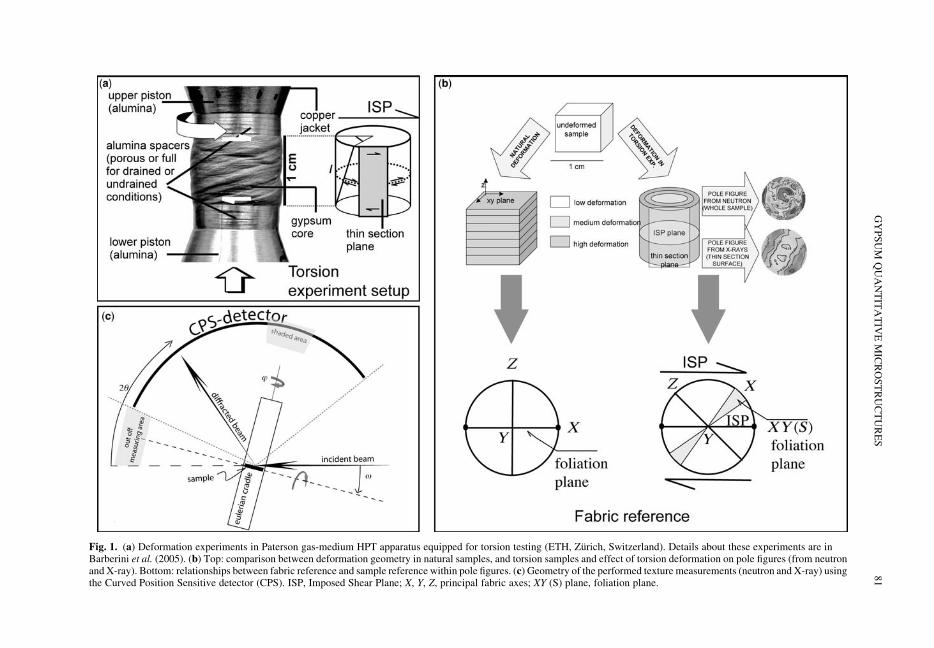
Fig. 1. (a) Deformation experiments in Paterson gas-medium HPT apparatus equipped for torsion testing (ETH, Zurich, Switzerland). Details about these experiments are inBarberini et al. (2005). (b) Top: comparison between deformation geometry in natural samples, and torsion samples and effect of torsion deformation on pole figures (from neutronand X-ray). Bottom: relationships between fabric reference and sample reference within pole figures. (c) Geometry of the performed texture measurements (neutron and X-ray) usingthe Curved Position Sensitive detector (CPS). ISP, Imposed Shear Plane; X, Y, Z, principal fabric axes; XY (S) plane, foliation plane.
GY
PS
UM
QU
AN
TIT
AT
IVE
MIC
RO
ST
RU
CT
UR
ES
81

Fig. 2. Description of (a) brittle and (b) plastic deformational systems affecting the deformed samples. (c)–(f)Microphotographs (left) and microstructural analysis (right) of gypsum samples deformed in torsion up to g ¼ 2.59. Thestarting material (c) shows an heterogeneous grain size distribution (20–250 mm) and a polygonal fabric with onlyoccasional SPO. At g ¼ 1–2, (d) and (e), undulose extinction and kink bands affect an increasing number of grains of
M. ZUCALI ET AL.82

Microstructural analysis
ThesamplereferenceframeisdefinedbytheImposedShear Plane (ISP) (Fig. 1), which is the plane perpen-dicular to the optical images and parallel to the longedge of the images, with the rotation axis of thetorsion experiments being the vertical axis of theimages (Figs 2 & 3). The three fabric axes X–Y–Zdefine the fabric reference frame (Figs 1b & 2c),with the SPO (S foliation) being close to the XYplane (Passchier & Trouw 1996). Grain-size analysis(Fig. 4a) has been performed using digital micro-photographs analysed with the software ImageJ(Rasband 1997–2008; Abramoff et al. 2004).
The deformed samples show different micro-structures related to their different shear strainstates. Here the microstructural features of mainstrain steps are reported (Figs 2 & 3).
† The starting material (sample VGO, Fig. 2c) ischaracterized by a heterogeneous grain-sizedistribution from 20 to 250 mm, with meanvalues at about 80 mm (Fig. 4a). It generallyshows a polygonal fabric with few exceptions.Undulose extinction occurs within a few smallgrains, while larger grains display homogeneousextinction or subgrains with straight boundaries.Large grains are also characterized by twins, anda slight SPO sometimes occurs within smallvolumes.
† At low levels of shear strain (g , 1.00), undu-lose extinction is visible within the largestgrains where kink bands also formed; withinsmall grains, undulose extinction starts andseveral grain boundaries show lobate shapes.Grains size does not change, ranging from20 to 250 mm, with mean values at about70–80 mm (Fig. 4a).
† At g ¼ 1.00–2.00 (Fig. 2d, e), the developmentof undulose extinction and kink bands affects anincreasing number of grains of different sizes.The grain size still ranges between 20 and200 mm, but mean values decrease at 60 mm(Fig. 4a). Kink bands are mainly developedwithin larger grains, associated with the SPO,mechanical twinning and undulose extinction.The SPO of flattened grains starts to develop atan angle of about 308–458 (bottom left – topright) with respect to the ISP; it becomes stron-ger with increasing strain and is also associatedwith the lattice preferred orientation (LPO).Small grains are characterized by undulose
extinction and subgrains’ preferred orientation.Narrow disjunctive dark planes occur at a small(,108) angle to the ISP; these planes are gener-ally discontinuous and enclose single grains oraggregates of grains that show undulose extinc-tion and subgrains, and may show an SPOmarked by elongated gypsum grains (bottomleft–top right).
† At g ¼ 2.00–3.00 (Figs 2f & 3a, b) shear bandsbecome more penetrative and continuous,forming two distinct systems of brittle shearplanes at angles of about 108–208 to the ISP.Gypsum aggregates display a strong SPO (Sfoliation) at a high angle (.458) to the shearbands parallel to the ISP (i.e. bottom left–topright) and the grain-size ranges decrease,ranging from 10 to 150 mm with mean valuesof less than 50 mm (Fig. 4a). Gypsum aggregatesare characterized by strong undulose extinction,subgrain development, and a LPO of oldelongated grains and newly formed crystals.Kink bands and mechanical twinning occurwithin large grains (.100 mm). Grain-sizereduction processes are active as the grain sizeranges from 10 to 50 mm.
† At g . 4.00 (Fig. 3c–e) the grain-sizereduction increases and the mean grain size isgenerally ,50 mm (Fig. 4a). The LPO andSPO of the grain aggregates become moredefined and marks a well-defined S foliation,which has an angle of about 458 with respect tothe ISP. The shear planes define two sets ofplanes mostly parallel to the ISP that produceshear lenses; the S foliation, marked by theSPO and LPO of gypsum, is cut by these shearplanes. Single gypsum crystals occur aselongated strips parallel to the S foliation andappear slightly curved, showing ‘S’-type sym-metry and giving rise to two main SPO orien-tations: one at a low angle with the ISP,occurring near the shear planes; and the secondat a higher angle, far from the shear planes.Very few large grains (30–120 mm) maypreserve kink bands and twinning.
Deformational systems
All samples show two sets of microstructures thatcorrespond to two different deformational regimes:(I) brittle (Fig. 2a) and (II) plastic (Fig. 2b)regimes (Passchier & Trouw 1996).
Fig. 2. (Continued) different size. Grain size ranges between 20 and 100 mm. SPO (with associated LPO) offlattened grains develops at an angle of about 308–458 (bottom left–top right) with respect to the ISP. At g ¼ 2–3(f) gypsum aggregates, characterized by strong undulose extinction and subgrains development, show strong SPOat high angles (.458) with respect to ISP. Old elongated grains and newly formed crystals both show LPO. Grainsize is now reduced to 10–50 mm. Shear bands become more penetrative and form two systems of brittle shear planesat an angle of 108–208 with respect to ISP.
GYPSUM QUANTITATIVE MICROSTRUCTURES 83
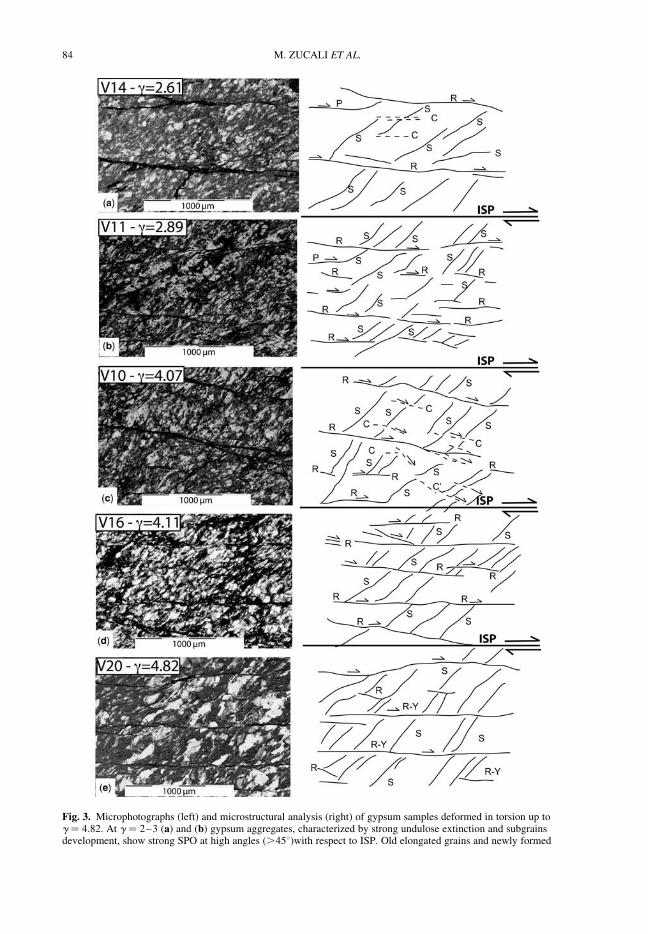
Fig. 3. Microphotographs (left) and microstructural analysis (right) of gypsum samples deformed in torsion up tog ¼ 4.82. At g ¼ 2–3 (a) and (b) gypsum aggregates, characterized by strong undulose extinction and subgrainsdevelopment, show strong SPO at high angles (.458)with respect to ISP. Old elongated grains and newly formed
M. ZUCALI ET AL.84

The first system of microstructures is defined bynarrow and localized shear planes marked by dis-junctive planes (dark planes in Figs 2 & 3). Theseshear planes evolve from low to high shear strainvalues constituting an evolving Riedel-like shearsystem (Fig. 2a) similar to those described by Tcha-lenko (1970) at various scales.
The second system is defined by a set of two foli-ations marked by an SPO and LPO of gypsum grainsthat follow the scheme of development within mylo-nitic shear zones (Fig. 2b). The schematic drawingscombined with microphotographs in Figures 2 and 3summarize the evolution of both the brittle (Fig. 2a)and the plastic (Fig. 2b) shear systems with increas-ing shear strain.
Brittle (Riedel-like) and plastic
(mylonitic-like) structures
In this section we will compare the classical modelsof structure development within localized shearzones (Snoke et al. 1998), either brittle (Riedel–Tchalenko-like, Fig. 2a) or plastic (Fig. 2b)systems, with the observed microstructures corre-sponding to increasing shear strain (g). The shearstrain is measured, for an isotropic homogeneouscylindrical specimen of diameter, d, length, l, andangular displacement (u) (Fig. 1a), as g ¼ du=2l,(Paterson & Olgaard 2000). The angular relationshipbetween planar structures and the ISP are shown [a(angle between ISP and R plane) and x (anglebetween ISP and S foliation) angles] in Figure 2a, b.In the Riedel scheme (Fig. 2a) the different planesform different angles with the ISP and are alsocharacterized by a specific shear sense (kinematic).In Figure 2b, the angular relations between the foli-ations and the ISP are shown. Figure 4 shows theevolution of a and x with respect to shear strain.
† At g ¼ 0–1.00 (Fig. 2c) no distinctive structuredevelops.
† At g ¼ 1.00–1.50 (Fig. 2d) both R and S planes(Fig. 2a, b) develop. S planes are characterizedby an SPO and LPO, and occur at a x angle ofabout 458 (Fig. 4a). The R planes cut the Splanes with a dextral shear sense as shown bysmall displacements along the R planes and aoccurring at high values with the ISP.
† At g ¼ 1.50–2.00 (Fig. 2e) S planes develop atx angles of less than 458 (Figs 2e & 4a), and aremarked by an SPO and LPO of strained gypsumgrains. The R planes show dextral shear sense
outlined by the displacement of gypsum grainsmarking the S planes, and dissolution occuralong the R planes, as shown by sharp trunca-tions of such gypsum grains. A few R splaysalso occur, and the a angles are generallylower than at lower g values (Fig. 4a).
† At g ¼ 2.00–2.50 (Fig. 2f) the S planes aremarked by well-developed SPO and LPO ofgypsum grains, and x angles ranging from 208to 408. The R planes are more penetrative andoccur at smaller a angles. Towards the R planes,the S planes are gently deflected, showing a moreplastic behaviour and allowing the interpretationof a dextral shear sense. Several smaller R planesoccur, organized in an en-echelon-type geome-try. a angles become smaller and few fracturesoccur parallel to both the R and S planes.
† At g ¼ 2.50–3.00 (Fig. 3a, b) the S planes arestill well developed and are at high angles(�458) to the ISP, but they are also highlydeflected by small C-type (Fig. 2b) shearplanes that occur at very low angles with theISP (Fig. 3a, b). These features correspond tothe S–C geometry of mylonitic shear zones.Along the C planes small undeformed (no undu-lose extinction) and equigranular gypsum grainsoccur. R planes develop at very low angles withthe ISP as the a angles approach 0 (Fig. 4b),becoming Y-type planes of the Riedel scheme(Fig. 2b). Along these sets of R–Y planes,diffuse dissolution occurs. A few R–Y splaysand P planes also occur.
† At g . 4.00 (Fig. 3c–e) S planes marked by theSPO and LPO of gypsum are penetrative, anddescribe an angular relation with the ISP ofabout 308–458 (Figs 3c–e & 4). C planes alsodevelop with a dextral shear sense, and seem tobe associated with the development of layers ofsmall strain-free grains of gypsum probablydue to dynamic recrystallization. The R–Yplanes are characterized by very low a valuesand the development of shear lenses. Along afew small planes oriented within a C0-type geo-metry, a strong LPO of gypsum occurs; severalR planes also occur with the same orientation,suggesting a plastic precursor to this second gen-eration of R planes.
Figure 4b shows the evolution of a (left) and x(right) with increasing g with respect to the ISP. Thetheoretical evolution of the R planes with respect toISP should correspond to a decreasing of a as g
Fig. 3. (Continued) crystals both show LPO. Grain size is now reduced to 10–50 mm. Shear bands become morepenetrative and form two systems of brittle shear planes at an angle of 108–208 with respect to ISP. At g . 4, (c)–(e),the LPO and SPO of the grain aggregates is more defined and marks a well-defined S foliation, forming an angle of about458 to the ISP. Shear planes define two sets of planes mostly parallel to the ISP.
GYPSUM QUANTITATIVE MICROSTRUCTURES 85
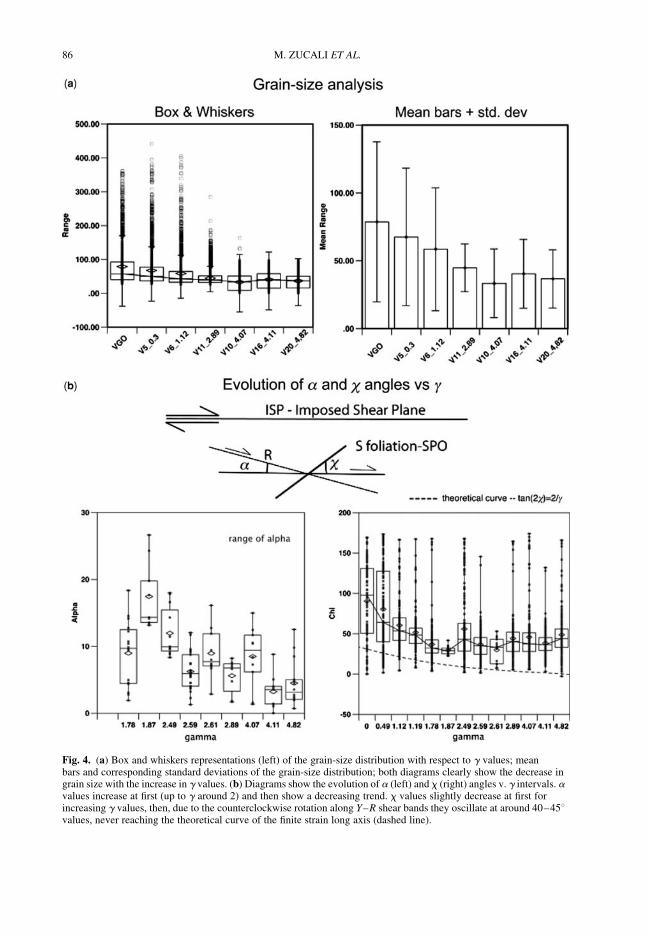
Fig. 4. (a) Box and whiskers representations (left) of the grain-size distribution with respect to g values; meanbars and corresponding standard deviations of the grain-size distribution; both diagrams clearly show the decrease ingrain size with the increase in g values. (b) Diagrams show the evolution of a (left) and x (right) angles v. g intervals. avalues increase at first (up to g around 2) and then show a decreasing trend. x values slightly decrease at first forincreasing g values, then, due to the counterclockwise rotation along Y–R shear bands they oscillate at around 40–458values, never reaching the theoretical curve of the finite strain long axis (dashed line).
M. ZUCALI ET AL.86

increases, as supported by analogue modelling andfield observations (Snoke et al. 1998). Such adecrease in a corresponds to the transition from Rto Y planes that lie parallel to the ISP. This theoreti-cal evolution is in agreement with the developmentand evolution of R planes within gypsum aggregatesdeformed in torsion from low to high g (Fig. 4b,left). The evolution of the x angles, which corre-spond to the angle between the S foliation or SPOof grains and the ISP, should follow the theoreticalcurve of the finite strain long axis as expected fora shear zone (Fig. 4b right). Whereas the theoreticalcurve shows a continuing decrease of x withincreasing g, the actual x values measured for thestudied samples from g values from 0 to 4.82 donot follow this function, and stabilize at values of408–458. Such discrepancies from the theoreticalcurve may be related to the concurrence of thedeformation mechanisms that were accommodatingstrain. Microstructural analysis showed that theshear bands were active from the beginning ofdeformation (g , 0.5) and controlled the orien-tation of grains by imposing shear along thebands. In fact, grains close to the shear bands (Ror Y ) are deflected towards the shear band line,and the corresponding x values are generallylower than those measured on grains far fromshear bands. The grains that occupy the regionsbetween two shear bands record a back rotation(i.e. counterclockwise) as imposed by sinistralshear, leading to grains characterized by high xvalues. Meanwhile, simple shear deformationinvolves various deformation mechanisms actingduring the evolution from low to high g; kinking,twinning and passive rotation dominate at lowstrains, while at higher strains dynamic recrystalli-zation and grain-size reduction (Fig. 4a) becomemore important and overprint pre-existing micro-structures (Barberini et al. 2005). Such progressivechange to plastic flow does not dominate the entiredeformed volume, as shown by the discrepanciesbetween the theoretical and practical finite straincurves (Fig. 4b), with frictional flow along shearbands making up the majority of the overall defor-mation. Kinking occurs in large grains oriented atabout 308–608 to the ISP.
Quantitative neutron and X-ray diffraction
texture analyses
In order to use QTA to compare different samplesindependently of the grain size, phase ratio and por-osity, normalization of the pole figures is needed(Bunge & Esling 1982). This normalization can beobtained via the refinement of the orientation distri-bution function (ODF), which holds informationabout the texture intensity and all components of
the texture. The measurement of a single polefigure allows only a limited quantitative analysisas it only shows the orientation distribution andthe intensity of the preferred orientation from thecorresponding crystallographic planes. The crystal-lographic recalculation of several pole figures fromdifferent crystallographic planes according to theircrystal structure in the ODF allows a completequantitative texture analysis of the specific mineralphase. Measuring single pole figures does notallow a quantitative texture analysis because asingle pole figure can be obtained by many differentODFs, meaning that the interpretation of the texturefrom a single pole figure is doubtful. In this study weperformed QTA using neutron and X-ray diffractiondata. Neutron diffraction data and refined texturehold information about the whole sample (i.e.volumes of about 1 cm3), while X-rays, due totheir low penetration capabilities, are suitable toinvestigate the marginal domains of the samples.QTA was used to reconstruct the LPO of preferredplanes of slip within gypsum grains involved intorsion experiments.
Direct numerical integration is not suitable for areliable ODF determination because the relativelylow 2u resolution gives rise to peak overlaps,which we resolved using a combination of Rietveldand texture analyses. The Rietveld texture analysis(Matthies et al. 1997) has the capacity to separateexact and/or strong overlaps. A Rietveld textureanalysis (Lutterotti et al. 1997) was performed forall patterns using the software package MAUD(Lutterotti et al. 1999). MAUD uses a Rietveldcore routine to compute spectra and a so-called LeBail algorithm (Matthies et al. 1997) to extract thedifferences between random and textured intensitiesfor each computed peak. These spectra are the basisof computing the ODF using the eWIMV algorithm(Morales et al. 2002; Lutterotti et al. 2004). Theobtained ODF was then introduced into the cyclicRietveld refinement. The new refined parameterswere used for a new eWIMV cycle to correct theODF. Several cycles of refinement were performedto converge towards a final characterization of thematerial. The refinement quality was assessed bycomparison of the experimental and recalculateddiagrams, and by the reliability factors as exhaus-tively described by Chateigner (2005): RP for theODF refinement (Lutterotti et al. 1997), and RBand Rw for the Rietveld refinement (Young &Wiles 1982). As a starting model for the gypsumstructure, we used the A2/a space group and cellparameters a ¼ 6.28, b ¼ 15.20, c ¼ 6.52 andb ¼ 127.414 (Pedersen & Semmingsen 1982;Schofield & Knight 1996; Boeyens & Ichharam2002; Grazulis et al. 2009). This model allowedcomplete indexing of the diffracted lines, implyingthat no extra phase was present in the specimens.
GYPSUM QUANTITATIVE MICROSTRUCTURES 87

The cell parameters were refined during combinedanalysis (Table 2), but the atomic positions werenot, and the crystallite sizes were kept fixed at1000 A. No peak shifts were observed during xrotation of the samples, indicating that only verylow levels of residual stresses, if any, were incorpor-ated in the material.
Neutron diffraction
Neutron diffraction experiments were carried out atthe Institut Laue Langevin (ILL, Grenoble, France)high flux reactor using the Position Sensitive Detec-tor of the D20 beamline. The detector spans a 2urange of 153.68 with a resolution of 0.18, and theneutron wavelength is monochromatized tol ¼ 2.41 A. An Eulerian cradle allows the x and fangles’ rotations (Fig. 1c). Scans were operatedfrom x ¼ 08 to 908 at steps of 58 using a fixed inci-dence angle, v, of 108 [corresponding to the (020)Bragg position] and from f ¼ 08 to 3558 (steps of58) (Fig. 5). Diffraction data were collected for4 s. The samples used were the cylindrical speci-mens deformed in torsion.
X-ray diffraction
X-ray diffraction texture measurements werecarried out at the Laboratoire de Cristallographieet Sciences des Materiaux (CRISMAT), EcoleNationale Superieure d’Ingenieurs de Caen
(ENSICAEN, France), using a Huber four-circlegoniometer (closed eulerian cradle þu–2u move-ments) mounted on an INEL X-ray generator, andCu Kawavelength monochromatized by an incidentflat graphite monochromator. A curved position sen-sitive detector with a 2u resolution of 0.038 (INELCPS-120) was used to acquire complete diffractionpatterns at different sample orientations in the 2urange of 08–1208 (Fig. 5). The flat samples weremeasured in reflection geometry. The incidentangle on the sample, v, and the CPS position werechosen in order to get the maximum coverage ofthe orientation space. The spectra were measuredusing w values from 08 to 3558, and x values from08 to 608, at incremental steps of 58 for bothangles. Each pattern was acquired for 120 s. Theirradiated surface, which was the surface of thecylindrical specimens deformed in torsion fromwhere the thin section was cut (Fig. 1a), wasincreased by oscillations of the sample perpendicu-lar to the lineation direction (+3 mm of amplitude).
Assessment of refinement reliability. Table 2 showsthe reliability factors for the refinement of thestudied samples. Using X-ray diffraction data, allR-factors (reliability factors) of Rietveld and ODFrefinement show tendencies toward lower valuesfor g values above 1.00, while neutron analyses donot show this evolution. This can be attributed tothe largest grain sizes for lower g values, whichgive rise to grain statistic effects when using
Table 2. Samples and corresponding g values with reference to reliability factors, goodness of fit, x2, texturestrength (F2 in mrd2) and texture calculation type
Sample g RW (%) RB (%) Rwpb (%) Rpb (%) Rexp x2 F2 (mrd2) ewimv
X-rayVGO 0 46.88 36.61 76 49.6 21.78 4.62 1.45 yV7 0.49V8 1.19 20.55 16.16 23.77 18.55 10.64 3.72 1.42 yV18 2.59 21.13 16.55 21.94 17.24 15.6 ? 1.4 yV14 2.61V10 4.07 20.36 15.96 21.61 17.03 15.55 1.482 yV16 4.11 20.53 15.87 22.41 16.51 14.82 1.9 1.63 yV20 4.82
NeutronVGO 0 11.78 8.95 27.49 15.05 6.41 3.09 0.54 yV7 0.49 13.23 10.37 26.11 15.8 9.36 1.96 1.37 yV8 1.19 9.36 7.39 15.39 10.16 6.09 3.38 1.29 yV18 2.59 14.83 11.68 29.35 18.12 9.51 2.25 1.83 yV14 2.61 13.04 10.21 26.41 15.93 8.86 2.16 1.39 yV10 4.07 10.11 8.08 15.09 11.15 5.39 3.49 1.62 yV16 4.11V20 4.82 7.98 6.37 13.3 9.5 3.04 6.86 1.46 y
ODF refinement estimators: RW, Intensity weighted factor; RB, R-Bragg factor. Profile refinement estimators: Rwpb, R-weighted patternfactor; Rpb, R-pattern factor; Rexp, R expected (¼1 optimal). ewimv, entropy-WIMV texture model.
M. ZUCALI ET AL.88

X-rays, while neutron measurements still probeenough grains (Zucali et al. 2001). Overall, thereliability factors indicate a reasonably good refine-ment both of diagrams and ODFs for comparabletexture strength levels (Chateigner 2005) rangingup to F2 ¼ 1.9 mrd2 (multiple of random distri-bution), which represent moderate textures. Thegoodness-of-fit values range from around 1.9 formost of the samples to 4.6 for the worst case, withaverage values also in favour of neutron analysis.The average values obtained in this work are com-parable to values reported in the literature.
Before discussing the QTA data it is important toemphasize that neutron data reflect the LPO of thewhole sample, meaning that any PF representsorientations related to the entire sample that corre-sponds to the complete g range from the core(minimum) to the edges (maximum). Consideringthe distribution of shear deformation within a coresample deformed in torsion (Fig. 1b), which is at amaximum at the outer surface and almost zero atthe cylinder axis, the obtained textures are theaverage texture (Fig. 6) and the maximum texturein the external deformed area is probably underesti-mated. Neither a one-to-one nor a linear relationshipbetween the deformation ratio and the deformedvolume fraction from the core to the edge wasrevealed in the diffracted intensities. Moreover,the surface of the shear zone is not planar, as it
would be in a 1 cm edge cube of a naturallydeformed rock, but rather corresponds to the cylin-der’s outer surface. Some of the artefacts (smallcircles) observed in the pole figures might be dueto this rather complex geometry (Fig. 6). Even withsuch strong limitations the pole figures obtainedfrom neutron data (Fig. 6, left) reproduce well theLPO of gypsum aggregates if compared with polefigures from X-ray data (Fig. 6, right). In addition,at extreme conditions (e.g. very low or zero strainvalues; high strain values) the pole figures obtainedfrom neutron data due to larger irradiated volumesbetter characterize the sample textures.
QTA results: X-ray diffraction data
The starting material shows an unexpected LPOwith its maximum parallel to the Y-axis. Atg , 1.50, X-ray pole figures show a preferred distri-bution of the (010) close to the Z-axis, and the cor-responding (001) and (100) poles roughly alignedalong the XY plane. At higher g (.2.5) values, the(010) poles become stronger and are close to theZ-axis, with progressive localization of the (100)and (001) poles on a circle perpendicular to (010)(Fig. 7). Starting from these g values, recalculatedpole figures show a stronger (001) pole densitymaximum with (001) poles aligning at 908 fromthe Z fabric axis and dispersed within about 308
Fig. 5. Theoretical diffraction pattern for gypsum structure (Boeyens & Ichharam 2002) for (a) X-ray and (b) neutron.In (c) the structure of gypsum is represented also showing the main slip plane and direction (Muegge 1898).
GYPSUM QUANTITATIVE MICROSTRUCTURES 89

Fig. 6. (a) and (b) Comparison of the recalculated experimental pole figures for X-ray (041), (221), (200) diffracted planes (left column) and for neutron (020), (021), (240)diffracted planes (right column).
M.
ZU
CA
LI
ET
AL
.90

Fig
.6.
(Conti
nued
).
GYPSUM QUANTITATIVE MICROSTRUCTURES 91

Fig. 7. (a) and (b) Recalculated pole figures of the main crystallographic planes for X-ray and neutron (left column). Right column shows the inverse pole figures shown in the threemain sample directions (Y, N, ISP). Y, Y sample direction; N, normal to ISP direction; and ISP, Imposed shear plane direction.
M.
ZU
CA
LI
ET
AL
.92

Fig
.7.
(Conti
nued
).
GYPSUM QUANTITATIVE MICROSTRUCTURES 93

from Y. Such preferred orientations increase, attain-ing higher values of g. The well-defined (010) and(001) maxima correspond to an incipient girdle dis-tribution of (100) poles at an angle of about 808 withthe ISP and mainly parallel to the X fabric axis(Fig. 7). Meanwhile the (001) poles show a weakpreferred orientation that corresponds to amaximum density within the XY plane, close to theY fabric axis. Such a preferred orientation is betterdeveloped only at g . 4.00, where it becomescloser to a girdle distribution mostly parallel to theXY(S) plane but still preserving a maximum closeto the Y-axis. The angular relations given by thepole figures with respect to the ISP and the XY(S)foliation plane do not change much aboveg ¼ 2.50. These show (010) pole maxima to theISP angles mainly around 308 in the XZ plane, andthe corresponding (001) and (100) girdles are per-pendicular to the average (010) poles. Conse-quently, the two latter girdles roughly contain thefoliation plane XY(S). Without deformation, (010)poles are located in the ISP plane parallel to theY-axis, and start deviating from the ISP atg . 1.00, reaching its final orientation at 308 fromthe ISP at larger g values.
QTA results: neutron diffraction data
A strong maximum of the poles to the (010) planes,which were perfect cleavage planes for gypsum, canbe observed at low g (Fig. 7). This orientation isalmost absent within the starting material, whereasit becomes stronger for shear strains of g . 2.00.At g . 1.00, the (010) poles start moving towardsthe Z-axis at about 308 from the ISP, and corre-spondingly the (100) and (001) poles distribute pro-gressively on a girdle characterized by maxima thatare parallel to the Y fabric direction for the (00l)poles or close to the XY(S) planes for the (h00)poles. The (010) pole figure shows two distributioncomponents characterized by two maxima. Suchdistributions also occur as asymmetrical poles thatare stronger for the (001) and (100) pole figures,in which a characteristic small-circle distributiondevelops from low g values (e.g. 1.19). At larger g(e.g. V10 g ¼ 4.11) the (010) maximum becomesmore defined, together with the correspondinggirdle distribution of (001) and (100) poles, eventhough they still preserve their small-circle distri-bution. For these neutron pole figures it becomesmore complicated to interpret the angles betweenthe pole distribution maxima or girdle axes orien-tation and the ISP plane or XY(S) fabric planes.Indeed, as the whole volume of the material isprobed by neutrons, the total deformation regimesare seen in the pole figures, with weights that arenot determined a priori. As the torsion deformationincreases, a more and more important volume
fraction of deformed rock develops, resulting, formost deformed specimens, in pole figures thatresemble the X-ray figures. However, in thesefigures undeformed or slightly deformed contri-butions can be observed making the small-circleorientation distribution of the pole figures by inte-gration over the deformation regimes. Inverse polefigures in Figure 7 (right) confirm the relationsbetween ISP and the crystallographic axes observedin direct pole figures. The orientation of the ISPdirection is distributed at an angle of about 308from the [010]-axis (i.e. normal to the pole figureplane) from g values above 2.00.
Discussion
Evolutionary model
If we consider the experiments and related micro-structures, from g ¼ 0.49 to g ¼ 4.82, as possiblesteps of a progressive deformational event, we can‘observe’ some interesting features during progress-ive deformation of gypsum within a shear zone atshear strain rates up to 1025 s21 and T ¼ 70–90 8C at P ¼ 300 MPa (Fig. 8).
This microstructural evolution shows that brittleand plastic deformation mechanisms are both activefrom the beginning of the deformation of gypsumunder dextral shear strain (Fig. 8). The progressiveevolution of brittle and plastic microstructures,which are well described by geometrical relation-ships (Figs 2 & 3), describes a coherent evolutionfrom low to high strain. The brittle, Riedel–Tchalenko-like, evolution is characterized by theprogressive decrease of a, which describes therelation of R planes (Fig. 2a) with the shear plane(i.e. the ISP). At g . 4.00 the R planes approachthe ISP plane and coincide with the Y planes ofthe Riedel-scheme (R–Y planes in Fig. 2a). Such anegative correlation is broadly shown by a v. g cor-relation diagrams (Fig. 4b). The R–Y planes resultmore from the progressive evolution of R towardsthe ISP plane than from the development of asecond group of planes different from R. This isalso corroborated by the disappearance of R planesat high strains.
However, plastic microstructural features do notchange their geometry during the deformation, asshown by the evolution of x with respect to g(Fig. 4b). Rather, after an initial decrease, theykeep more or less the same orientation or do notshow any tendency to reduce the angle betweenthe foliation and the ISP plane, as is generallyexpected in a monoclinic shear zone (Passchier &Trouw 1996), where the range of x (from 208 to458, Fig. 4) is not related to g intervals.
At g . 2.60 and T ¼ 90 8C (stages 5 and 6 inFig. 8) plastic planes occur at low angles with the
M. ZUCALI ET AL.94

ISP (i.e. C planes), developing the classical S–Cfeatures of mylonitic systems. Similar planes donot develop during stages 4, 7 and 8 at similar oreven higher g values at T ¼ 70 8C. These differ-ences can only imply that 70–90 8C is an importanttemperature interval for the plastic behaviour ofgypsum, which most probably starts deforming fol-lowing the mylonitic scheme (e.g. S–C system),probably reflecting the activation of new defor-mation mechanisms and/or slip systems. In con-trast, this temperature interval does not seem to beof particular interest for brittle behaviour, as wedo not notice any difference in microstructures atthis scale of observation. This also implies thatacross these g intervals of deforming gypsum, weobserve microstructures related to a brittle plusplastic deformational system rather than brittlev. plastic deformational system or a brittle–plastictransition.
Texture analysis (i.e. direct and inverse polefigures) shows a well-developed CPO of (010)planes (Fig. 7) starting at the initial deformational
stages (e.g. stage 2 in Fig. 8). This texturebecomes stronger during the evolution of the shearzones, but the orientations of the (010) poles doesnot change substantially above g ¼ 2, confirmingthe similar observations at the microscale. Thetexture analysis also confirms (Figs 7 & 8) that thepreferred slip system is parallel to the (010)planes, although a principal direction of slip (e.g.classical [001] slip direction) cannot be clearlyrecognized, as shown by the tendency towardsgirdle distributions of the (100) and (001) poles toplanes (Fig. 7).
Conclusions
† We have conducted a quantitative microstruc-tural study on natural gypsum samples thatwere experimentally deformed in torsion. Inthis study we compared information derivedfrom optical microstructural analysis andtexture analysis obtained by means of diffraction(neutron and X-ray) techniques. With these
Fig. 8. Schematic representation of the evolution of the modelled shear zone. U, undrained; D, drained; N, neutron;X, X-ray; G, gypsum; B, bassanite; T70, 70 8C; T90, 90 8C. The microstructural evolution shows that brittle and plasticdeformation mechanisms are both active from the beginning of the deformation of gypsum under dextral shear strain.However, although plastic microstructural features do not change their geometry during the deformation, brittle featuresdo change their appearance and orientation. Texture analysis shows a well-developed crystallographic preferredorientation of (010) planes starting at the initial deformational stages (e.g. stage 2). This texture becomes stronger duringthe evolution of the shear zones, but the orientations of the (010) poles does not change substantially above g ¼ 2,confirming the similar observations at the microscale.
GYPSUM QUANTITATIVE MICROSTRUCTURES 95

techniques we studied samples deformed attemperatures of 70–90 8C and strains (g) from0 to 4.82.
† In the microstructural study we could observe,with increasing g values, the development of anSPO of gypsum aggregates (the S foliation)associated with the development and progressiveevolution of a Riedel-like brittle deformationalscheme. Such brittle microstructures evolvefrom a relatively early scheme to a substantiallycompleted stage as suggested by the evolution ofthe angular relationships between the fault planes.
† The brittle evolution is only slightly sensitive totemperature; brittle systems are present insamples deformed at temperatures of 70 and90 8C, with the difference that in the samplesdeformed at 90 8C few C-like planes occurtogether with Y-like brittle planes. However,the main brittle structure is preserved, suggestingan incipient transition to a plastic deformationalregime.
† A plastic deformational regime is also suggestedby deformation mechanisms that start to operateat g . 4.00 as dynamic recrystallization andgrain-size reduction; at greater g values thesedeformation mechanisms become more efficientover kinking, passive rotation and mechanicaltwinning, but still have to compete/collaboratewith frictional flow along shear bands. This isalso supported by the large difference betweenthe theoretical and actual curves of the finitestrain long axis, which implies the counterclock-wise rotation due to the sense of shear along theR planes.
† From the textural study performed with X-rayand neutron diffraction, we observed that plasticdeformation is recorded by gypsum from theinitial g values to highest ones.
† Optical microstructural analysis does notshow important differences in the microstruc-tural behaviour of gypsum marking the Sfoliation, while QTA by means of either X-rayand neutron diffraction clearly shows a tendencyto reinforce these textures as can be appreciatedeither from the distribution of maxima andgirdles in pole figures or from texture factors.
† There is a general agreement between the X-rayand neutron data, as both show an increasinglystrong (010) preferred orientation for increasingg values. Nevertheless, the results from theX-ray data are much more coherent with theobservations from the optical microstructuralanalysis. The neutron data are controlled by thevolume fraction of deformed gypsum. Astorsion increases, the deformed volume fractionincreases; giving rise, for most deformed speci-mens, to pole figures that resemble the X-rayfigures and that produce the small-circle
orientation distribution geometry of the polefigures due to the integration over the deforma-tional regimes.
† Microstructural and textural analyses showedthat at the investigated conditions the behaviourof gypsum is completely characterized by abrittle plus plastic deformation, while a brittleto plastic transition may be induced, keepingother constraints constant, by increasing thetemperature above 90 8C.
† The QTA shows a monoclinic symmetry of thepole figures of gypsum with respect to the ISP(i.e. direct and inverse pole figures). In contrast,the (010) maximum is generally close to theZ-axis of the fabric. These symmetries may beused, in the first case, to evaluate the kinematicsof the deformation (i.e. sense of shear indicators),while little may be said with respect to the shearsense with respect to the S foliation. Where brittleand plastic microstructures coexist, a generalsense of shear may be assessed, as shown in thiscontribution. However, if only plastic micro-structures occur, as generally occurs in naturalrocks, it is not possible to use texture polefigures (LPO) to assess the sense of shears.
We thank all the technical staff at ILL and CRISMAT.We thank G. Gosso for helpful and extensive discussion.We are truly grateful to E. Rutter and J. Walter, whosereviews helped us to improve the manuscript.
References
ABRAMOFF, M. D., MAGELHAES, P. J. & RAM, S. J. 2004.Image processing with ImageJ. Biophotonics Inter-national, 11(7), 36–42.
BARBERINI, V., BURLINI, L., RUTTER, E. & DAPIAGGI,M. 2005. High-strain deformation tests on naturalgypsum aggregates in torsion. In: BRUHN, D. &BURLINI, L. (eds) High-strain Zones: Structure andPhysical Properties. Geological Society, London,Special Publications, 245, 277–290.
BAUMANN, V. W. 1984. Rheologische Untersuchungen anGips. Eclogae Geologicae Helvetiae, 77, 301–325.
BOEYENS, J. C. A. & ICHHARAM, V. V. H. 2002. Redeter-mination of the crystal structure of calcium sulphatedihydrate, CaSO4 * 2(H2O). Zeitschrift fuer Kristallo-graphie – New Crystal Structure, 217, 9–10.
BUNGE, H. J. & ESLING, C. 1982. Quantitative TextureAnalysis. Deutsche Gesellschaft fur Metallkunde, 551.
CASTELLANZA, R., GEROLYMATOU, E. & NOVA, R.2008. An attempt to predict the failure time of aban-doned mine pillars. Rock Mechanics and Rock Engin-eering, 41, 377–401.
CHATEIGNER, D. 2005. Reliability criteria in quantitativetexture analysis with experimental and simulatedorientation distributions. Journal of Applied Crystallo-graphy, 38, 603–611.
CRAKER, W. E. & SCHILLER, K. K. 1962. Plastic defor-mation of gypsum. Nature, 193, 672–673.
M. ZUCALI ET AL.96

DE MEER, S. 1995. Deformation Processes in Polycrystal-line Aggregates of Gypsum. PhD thesis, University ofUtrecht.
DE MEER, S. & SPIERS, C. J. 1995. Creep of wet gypsumaggregates under hydrostatic loading conditions. Tec-tonophysics, 245, 171–183.
GRAZULIS, S., CHATEIGNER, D. ET AL. 2009. Crystallo-graphy Open Database – an open access collectionof crystal structures. A tribute to Michael Berndt.Journal of Applied Crystallography, 42, 726–729.
HARLAND, W. B., MANN, A & TOWNSEND, C. 1988.Deformation of anhydrite–gypsum rocks in centralSpitsbergen. Geological Magazine, 125(2), 103–116.
HEARD, H. C. & RUBEY, W. W. 1966. Tectonic impli-cations of gypsum dehydration. Geological Society ofAmerica Bulletin, 77, 741–760.
HOXHA, D., GIRAUD, A. & HOMAND, F. 2005. Modellinglong-term behaviour of a natural gypsum rock. Mech-anics of Materials, 37, 1223–1241.
HOXHA, D., HOMAND, F. & AUVRAY, C. 2006. Defor-mation of natural gypsum rock; mechanisms and ques-tions. Engineering Geology, 86, 1–17.
KARATO, S. 2008. Deformation of Earth Materials: AnIntroduction to the Rheology of Solid Earth. Cam-bridge University Press, Cambridge.
KERN, H. & RICHTER, A. 1985. Microstructures and tex-tures in evaporites. In: WENK, H. R. (ed.) PreferredOrientation in Deformed Metals and Rocks; An Intro-duction to Modern Texture Analysis. Academic Press,New York.
KO, S. C., OLGAARD, D. L. & BRIEGEL, U. 1995. Thetransition from weakening to strengthening in dehy-drating gypsum: evolution of excess pore pressure.Geophysical Research Letters, 22(9), 1009–1012.
KOCKS, F., TOME, C. & WENK, R. 1998. Texture and Ani-sotropy. Cambridge University Press, Cambridge.
LEISS, B., ULLEMEYER, K. ET AL. 2000. Recent develop-ments and goals in texture research of geologicalmaterials. Journal of Structural Geology, 221531–1540.
LEVYKIN, A. I. & PARFENOV, V. D. 1983. Eksperimentypo derformatsii polikristallicheskogo gipsa. [Exper-iments of deformation of polycrystalline gypsum.]Doklady Akademii Nauk SSSR, 268, 1190–1192.
LUTTEROTTI, L., CHATEIGNER, D., FERRARI, S. &RICOTE, J. 2004. Texture, residual stress and structuralanalysis of thin films using a combined X-ray analysis,Thin Solid Films, 450, 34–41.
LUTTEROTTI, L., MATTHIES, S. & WENK, H.-R. 1999.MAUD (Material Analysis Using Diffraction): a userfriendly Java program for Rietveld Texture Analysisand more. Proceedings of the Twelfth InternationalConference on Textures of Materials (ICOTOM-12),2, 1599.
LUTTEROTTI, L., MATTHIES, S., WENK, H.-R.,SCHULTZ, A. J. & RICHARDSON, J. J. W. 1997. Com-bined texture and structure analysis of deformed lime-stone from time-of-flight neutron diffraction spectra.Journal of Applied Physics, 81, 594–600.
MATTHIES, S., LUTTEROTTI, L. & WENK, H.-R. 1997.Advances in texture analysis from diffraction spectra.Journal of Applied Crystallography, 30, 31–42.
MORALES, M., CHATEIGNER, D., LUTTEROTTI, L. &RICOTE, J. 2002. X-ray combined QTA using a CPS
applied to a ferroelectric ultrastructure. MaterialsScience Forum, 408–412, 113–118.
MUEGGE, O. 1898. Uber translationen und verwandteErscheinungen in Krystallen. Neues Jahrbuch furMineralogie, 1, 71–154.
OLGAARD, D. L., KO, S. & WONG, T. 1995. Deformationand pore pressure in dehydrating gypsum under transi-ently drained conditions. Tectonophysics, 245,237–248.
PANOZZO HEILBRONNER, R. 1993. Controlling thespatial distribution of deformation in experimentallydeformed and dehydrated gypsum. In: BOLAND,J. N. & FITZGERALD, J. D. (eds) Defects and Pro-cesses in the Solid State: Geosciences Applications.Elsevier, Amsterdam.
PANOZZO HEILBRONNER, R. & OLGAARD, D. L. 1987.Experimental shear deformation of synthetic gypsumrock. Terra Cognita, 7(1), 64–65.
PANOZZO HEILBRONNER, R. & DELL’ANGELO, L. N.1990. Fabric development in experimental gypsumshear zones. Eos, Transactions of the American Geo-physical Union, 71, 1595.
PASSCHIER, C. W. & TROUW, R. A. J. 1996. Microtec-tonics. Springer, Berlin.
PATERSON, M. S. & OLGAARD, D. L. 2000. Rock defor-mation tests to large shear strains in torsion. Journal ofStructural Geology, 22, 1341–1358.
PEDERSEN, B. F. & SEMMINGSEN, D. 1982. Neutrondiffraction refinement of the structure of gypsum,CaSO4. 2H2O. Acta Crystallographica, B38,1074–1077.
RANDLE, V. & ENGLER, O. 2000. Introduction to TextureAnalysis: Macrotexture, Microtexture and OrientationMapping. CRC Press, Baton Rouge, LA.
RASBAND, W. S. 1997–2008. ImageJ. US National Insti-tutes of Health, Bethesda, MD, USA, World wide webaddress: http://rsb.info.nih.gov/ij/
SCHOFIELD, P. F. & KNIGHT, K. S. 1996. Thermal expan-sion of gypsum investigated by neutron powder dif-fraction. American Mineralogist, 81, 847–851.
SNOKE, A. W., TULLIS, J. & TODD, V. R. 1998.Fault-related Rocks. A Photographic Atlas. PrincetonUniversity Press, Princeton, NJ.
STRETTON, I. C. 1996. An Experimental Investigation ofthe Deformation Properties of Gypsum. PhD thesis,University of Manchester.
TCHALENKO, J. S. 1970. Similarities between shear zonesof different magnitudes. Geological Society of AmericaBulletin, 81, 1625–1639.
TURNER, F. J. & WEISS, L. E. 1963. StructuralAnalysis of Metamorphic Tectonites. McGraw-Hill,New York.
WENK, H.-R. 1985. Preferred Orientation in DeformedMetals and Rocks; an Introduction to ModernTexture Analysis. Academic Press, New York.
WENK, H.-R. 2006. Neutron diffraction texture analysis.Reviews in Mineralogy and Geochemistry, 63,399–426.
YOUNG, R. A. & WILES, D. B. 1982. Profile shape func-tions in Rietveld refinements. Journal of AppliedCrystallography, 15, 430–438.
ZUCALI, M. & CHATEIGNER, D. 2006. Quantitativetexture analysis of metadiorites deformed during Alpinesubduction; Languard-Campo Nappe-Austroalpines,
GYPSUM QUANTITATIVE MICROSTRUCTURES 97

Central Alps. Rendiconti della Societa Geologica Itali-ana, 2, 199–200.
ZUCALI, M., CHATEIGNER, D., DUGNANI, M., LUTTER-
OTTI, L. & OULADDIAF, B. 2002. Quantitative textureanalysis of naturally deformed hornblendite undereclogite facies conditions (Sesia–Lanzo Zone,Western Alps): comparison between X-ray andneutron diffraction analysis. In: DE MEER, S.,DRURY, M. R., DE BRESSER, J. H. P. & PENNOCK,
G. M. (eds) Deformation Mechanisms, Rheology andTectonics: Current Status and Future perspectives.Geological Society, London, Special Publications,200, 239–253.
ZUCALI, M., DUGNANI, M., CHATEIGNER, D. &OULADDIAF, B. 2001. Quantitative textural analysisof geological low-symmetry materials: amphibolesfrom the Sesia–Lanso zone (Italy). ILL Highlights,54–55.
M. ZUCALI ET AL.98
Copyright © 2022 FDOKUMEN