
Brisbane Market Update - PRD
13
Brisbane Market Update 1st Half 2022
-
Upload
khangminh22 -
Category
Documents
-
view
6 -
download
0
Transcript of Brisbane Market Update - PRD

Brisbane Market Update1st Half 2022

INTRODUCTIONThis Brisbane market update report divides the city into the inner-ring (0-5km from the city), middle-ring (5-10km from the city), and outer-ring (10-20km from the city). It provides a comprehensive and in-depth analysis of each specified market and a holistic picture of property conditions in each area.
The Brisbane market saw exponential growth particularly in the middle-ring with its median house price sitting at $910K, a growth of 36.8% from 2017. There is now a distinctively different house market between the inner and outer rings, with premium pricing of $1.1M and above dominating the inner-ring (64.2%) and the most affordable bracket of less than $800K dominating the outer-ring (69.3%). Rental prices for houses have strengthened particularly in the middle-ring, whereas unit rental prices have grown the most in the outer-ring as working from home becomes the norm. All this is in conjunction with record low vacancy rates, particularly in the outer-ring which recorded 1.1%.
KeyBrisbane CBD
Middle: 5-10km
Inner: 0-5km
Outer: 10-20km

BRISBANE HOUSE SALES 2017-2021#
© Prepared by PRD Research. Source: APM Pricefinder.#2021 encapsulates sales transactions for 2H 2021 (01/07/2021 – 31/12/2021).
2 0 2 1 # M e di an Sa l e P r i c e• Inner: $1,266,000
• Middle: $910,000
• Outer: $655,000
Ke y Co m m e nts• Over the past five years, Brisbane median
house prices in all rings have recorded double-digit growth.
• Rising median house price growth alongside a substantial increase in sales suggests good returns on capital investment in an undervalued market.
BRISBANE UNIT SALES 2017-2021#
2 0 1 7 - 20 21 Pr i ce G r ow th• Inner: +36.1% (+$336,000)
• Middle: +36.8% (+$245,000)
• Outer: +21.3% (+$115,000)
© Prepared by PRD Research. Source: APM Pricefinder.#2021 encapsulates sales transactions for 2H 2021 (01/07/2021 – 31/12/2021).
2 0 2 1 # M e dian Sa l e P r i c e• Inner: $530,000
• Middle: $467,000
• Outer: $397,000
Ke y Co m m e nts• Brisbane median unit prices have recovered
from a dip in 2020, with all rings recording positive price growth in 2021.
• The outer-ring provides affordability for first home buyers and is also the fastest growing. Buyers must be quick to secure their property.
2 0 1 7 - 20 21 Pr i ce G r ow th• Inner: 6.0% (+$30,001)
• Middle: 3.1% (+$14,000)
• Outer: 6.4% (+$24,000)
0
5,000
10,000
15,000
20,000
25,000
30,000
35,000
40,000
$0
$200,000
$400,000
$600,000
$800,000
$1,000,000
$1,200,000
$1,400,000
2017 2018 2019 2020 2021#
Hou
se S
ales
Med
ian
Hou
se P
rice
Inner Sales Middle Sales Outer Sales
Inner Median Middle Median Outer Median
0
5,000
10,000
15,000
20,000
25,000
30,000
$0
$100,000
$200,000
$300,000
$400,000
$500,000
$600,000
2017 2018 2019 2020 2021#
Uni
t Sal
es
Med
ian
Uni
t Pric
e
Inner Sales Middle Sales Outer Sales
Inner Median Middle Median Outer Median

© Prepared by PRD Research. Source: APM Pricefinder. #2021 encapsulates sales transactions for 2021 (01/01/2021 – 31/12/2021).
Inner-Ring
Outer-RingInner-Ring
Outer-Ring
Middle-Ring
Middle-Ring
27.7%
31.2%
17.3%
10.5%
13.4%
BRISBANE HOUSE PRICE BREAKDOWN 2021#
31.3%
16.4%12.9%
7.1%
32.4%
BRISBANE UNIT PRICE BREAKDOWN 2021#
9.2%9.7%
9.6%
7.3%64.2%
Less than $799,999
$800,000 to $899,999
$900,000 to $999,999
$1,000,000 to $1,099,999
$1,100,000 and above69.3%
10.1%
6.6%3.2%
10.7%
21.8%
21.8%
17.6%
11.7%
27.1%
50.5%
24.1%
10.5%
5.9%8.9%Less than $399,999
$400,000 to $499,999$500,000 to $599,999$600,000 to $699,999$700,000 and above

BRISBANE HOUSE AVERAGE VENDOR DISCOUNT
BRISBANE UNIT AVERAGE VENDOR DISCOUNT
© Prepared by PRD Research. Source: APM Pricefinder.
Q 4 2 0 2 1 O ve r v iew• Inner: 2.0%
• Middle: 4.2%
• Outer: 5.2%
Ke y Co m m e nts• In Q4 2021 all Brisbane rings swung to
an average vendor premium. Sellers are achieving extraordinary results well above their asking prices.
• The outer-ring recorded the highest average vendor premium of 5.2%. A record high for Brisbane since mid-2020.
W ha t i s Ave r a ge Ve ndor D i s c ount?• The average percentage difference
between the first list price and final sold price.
-3.0%
-2.0%
-1.0%
0.0%
1.0%
2.0%
3.0%
4.0%
5.0%
6.0%
Q3 2020 Q4 2020 Q1 2021 Q2 2021 Q3 2021 Q4 2021
Aver
age
Vend
or D
isco
unt
Inner Middle Outer
© Prepared by PRD Research. Source: APM Pricefinder.
Ke y Co m m e nts• Units in all three Brisbane rings are selling for
higher than the first list asking price. There is a revival in the unit market after a period of price discounting in mid-2020.
• Units in the outer-ring recorded the highest average premium of 2.7% while inner-ring units recorded the smallest premium. This is great news for first home buyers.
W ha t i s Ave r a ge Ve ndor D i s c ount?• A lower percentage difference (closer to 0.0%)
suggests that buyers are willing to purchase closer to a property’s initial asking price.
Q 4 2 0 2 1 O ve r v iew• Inner: 0.9%
• Middle: 2.6%
• Outer: 2.7%
-4.0%
-3.0%
-2.0%
-1.0%
0.0%
1.0%
2.0%
3.0%
Q32020
Q42020
Q12021
Q22021
Q32021
Q42021
Aver
age
Vend
or D
isco
unt
Inner Middle Outer

BRISBANE HOUSE AVERAGE DAYS TO SELL
BRISBANE UNIT AVERAGE DAYS TO SELL
© Prepared by PRD Research. Source: APM Pricefinder.
Q 4 2 0 2 1 O ve r v iew• Inner: 29 days
• Middle: 23 days
• Outer: 22 days
Ke y Co m m e nts• Houses are selling quicker in the outer-
ring as demand starts to shift due to an increase in people working from home.
• Days to sell a house continued to decline as demand increased exponentially, with Q4 2021 recording the lowest amount of days since mid-2020.
W hy Ave r a ge Da ys t o Se l l?• The change in average days to sell a
property is indicative of buyer demand.
0
10
20
30
40
50
60
Q3 2020 Q4 2020 Q1 2021 Q2 2021 Q3 2021 Q4 2021
Aver
age
Day
s to
Sel
l
Inner Middle Outer
© Prepared by PRD Research. Source: APM Pricefinder.
Q 4 2 0 2 1 O ve r v iew• Inner: 46 days
• Middle: 39 days
• Outer: 39 days
Ke y Co m m e nts• Units are selling quicker in the middle and
outer rings as demand starts to shift due to an increase in people working from home.
• Days to sell a unit continued to decline over the past 18 months. The Brisbane unit market is moving faster again, allowing for new stock to come to the market.
W hy Ave r a ge Da ys t o Se l l?• A lower average number of days to sell a
property reveals an increase in the willingness of buyers to purchase property sooner.
0
10
20
30
40
50
60
70
80
90
Q3 2020 Q4 2020 Q1 2021 Q2 2021 Q3 2021 Q4 2021
Aver
age
Day
s to
Sel
l
Inner Middle Outer
* Annual price growth is based on comparison between Q4 2020 and Q4 2021 figures.
© Prepared by PRD Research. Source: APM Pricefinder.
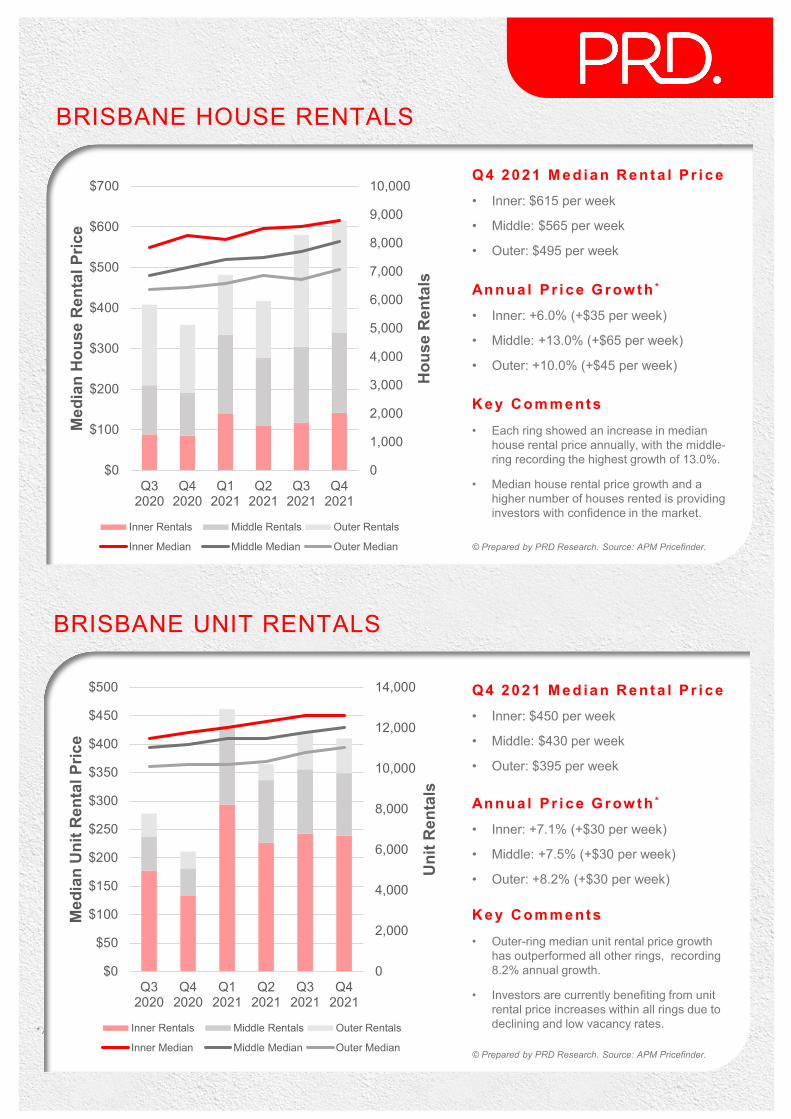
BRISBANE HOUSE RENTALS
BRISBANE UNIT RENTALS
© Prepared by PRD Research. Source: APM Pricefinder.
Q 4 2 0 2 1 M e d ia n Re n t a l P r i c e• Inner: $615 per week
• Middle: $565 per week
• Outer: $495 per week
Ke y Co m m e nts• Each ring showed an increase in median
house rental price annually, with the middle-ring recording the highest growth of 13.0%.
• Median house rental price growth and a higher number of houses rented is providing investors with confidence in the market.
Annua l P r i c e G r ow th *
• Inner: +6.0% (+$35 per week)
• Middle: +13.0% (+$65 per week)
• Outer: +10.0% (+$45 per week)
0
1,000
2,000
3,000
4,000
5,000
6,000
7,000
8,000
9,000
10,000
$0
$100
$200
$300
$400
$500
$600
$700
Q32020
Q42020
Q12021
Q22021
Q32021
Q42021
Hou
se R
enta
ls
Med
ian
Hou
se R
enta
l Pric
e
Inner Rentals Middle Rentals Outer Rentals
Inner Median Middle Median Outer Median
© Prepared by PRD Research. Source: APM Pricefinder.
Q 4 2 0 2 1 M e d ia n Re n t a l P r i c e• Inner: $450 per week
• Middle: $430 per week
• Outer: $395 per week
Ke y Co m m e nts• Outer-ring median unit rental price growth
has outperformed all other rings, recording 8.2% annual growth.
• Investors are currently benefiting from unit rental price increases within all rings due to declining and low vacancy rates.
Annua l P r i c e G r ow th *
• Inner: +7.1% (+$30 per week)
• Middle: +7.5% (+$30 per week)
• Outer: +8.2% (+$30 per week)
0
2,000
4,000
6,000
8,000
10,000
12,000
14,000
$0
$50
$100
$150
$200
$250
$300
$350
$400
$450
$500
Q32020
Q42020
Q12021
Q22021
Q32021
Q42021
Uni
t Ren
tals
Med
ian
Uni
t Ren
tal P
rice
Inner Rentals Middle Rentals Outer Rentals
Inner Median Middle Median Outer Median

BRISBANE HOUSE RENTAL PERFORMANCE 2020-2021
BRISBANE UNIT RENTAL PERFORMANCE 2020-2021
© Prepared by PRD Research. Source: APM Pricefinder.
2 0 2 1 M e d ia n Re n t a l P r i ce s
2 Bedroom• Inner: $460 per week• Middle: $420 per week• Outer: $350 per week
3 Bedroom• Inner: $575 per week• Middle: $500 per week• Outer: $425 per week
4+ Bedroom• Inner: $805 per week• Middle: $660 per week• Outer: $520 per week
Ke y Co m m e nts• Middle-ring 3 bedroom median house
rental prices were the most resilient, returning 11.1% growth annually.
• 4+ bedroom houses in the inner-ring are the most expensive rental stock.
$0
$100
$200
$300
$400
$500
$600
$700
$800
$900
2 Bed 3 Bed 4+ Bed
Med
ian
Hou
se R
enta
l Pric
e
Inner 2020 Inner 2021 Middle 2020
Middle 2021 Outer 2020 Outer 2021
2 0 2 1 M e d ia n Re n t a l P r i ce s
1 Bedroom• Inner: $385 per week• Middle: $320 per week• Outer: $280 per week
2 Bedroom• Inner: $460 per week• Middle: $400 per week• Outer: $350 per week
3+ Bedroom• Inner: $580 per week• Middle: $500 per week• Outer: $410 per week
Ke y Co m m e nts• Middle-ring 1 bedroom units have
recorded the largest annual increase of 10.3% in median rental prices.
• 3+ bedroom units in the inner-ring are the most expensive rental stock.
$0
$100
$200
$300
$400
$500
$600
$700
1 Bed 2 Bed 3+ Bed
Med
ian
Uni
t Ren
tal P
rice
Inner 2020 Inner 2021 Middle 2020
Middle 2021 Outer 2020 Outer 2021© Prepared by PRD Research. Source: APM Pricefinder.

BRISBANE UNIT AVERAGE RENTAL YIELD
BRISBANE HOUSE AVERAGE RENTAL YIELD
© Prepared by PRD Research. Source: SQM Research.
De c - 2 1 O ve r v iew• Inner: 3.7%
• Middle: 3.7%
• Outer: 4.1%
Ke y Co m m e nts• House rental yields have remained relatively
stable in the past 12 months due to house sale price growth being on par with house rental price growth.
• Outer-Brisbane offers a higher yield margin overall. With a lower entry price compared to other rings it offers a great return for investors.
Annua l Cha nge• Inner: +0.1%
• Middle: +0.1%
• Outer: 0.0%
0.0%
0.5%
1.0%
1.5%
2.0%
2.5%
3.0%
3.5%
4.0%
4.5%
5.0%
Jun-18Sep-18D
ec-18M
ar-19Jun-19Sep-19D
ec-19M
ar-20Jun-20Sep-20D
ec-20M
ar-21Jun-21Sep-21D
ec-21
Hou
se R
enta
l Yie
ld
Inner Middle Outer
© Prepared by PRD Research. Source: SQM Research.
De c - 2 1 O ve r v iew• Inner: 4.9%
• Middle: 5.1%
• Outer: 5.6%
Ke y Co m m e nts• Middle-ring unit yields improved the most
annually due to a surge in rental demand in those areas.
• Outer-ring unit yields slightly softened annually due to median sale price growth (10.3%) in the area, surpassing that of median rental price growth (8.2%).
Annua l Cha nge• Inner: +0.2%
• Middle: +0.3%
• Outer: -0.2%
0.0%
1.0%
2.0%
3.0%
4.0%
5.0%
6.0%
7.0%
Jun-18Sep-18D
ec-18M
ar-19Jun-19Sep-19D
ec-19M
ar-20Jun-20Sep-20D
ec-20M
ar-21Jun-21Sep-21D
ec-21
Uni
t Ren
tal Y
ield
Inner Middle Outer

BRISBANE VACANCY RATES
© Prepared by PRD Research. Source: SQM Research.
De c - 2 1 O ve r v iew• Inner: 2.3%
• Middle: 1.3%
• Outer: 1.1%
Ke y Co m m e nts• All rings recorded healthy vacancy rates
well below the Real Estate Institute of Australia’s healthy benchmark of 3.0%.
• Inner-ring vacancy rates continued to record the highest improvements of vacancy rates, dropping by -1.0% annually.
Annua l Cha nge• Inner: -1.0%
• Middle: -0.4%
• Outer: -0.2%
0.0%
0.5%
1.0%
1.5%
2.0%
2.5%
3.0%
3.5%
4.0%
4.5%
5.0%
Jun-18
Sep-18
Dec-18
Mar-19
Jun-19
Sep-19
Dec-19
Mar-20
Jun-20
Sep-20
Dec-20
Mar-21
Jun-21
Sep-21
Dec-21
Vaca
ncy
Rat
e
Inner Middle Outer REIA 'Healthy' Benchmark

REFERENCES
Inner-ring market data encapsulates aggregate property conditions within the following suburbs:Albion, Alderley, Annerley, Ascot, Ashgrove, Auchenflower, Balmoral, Bardon, Bowen Hills, Brisbane City, Bulimba, Camp Hill, Clayfield, Coorparoo, Dutton Park, East Brisbane, Fairfield, Fortitude Valley, Grange, Greenslopes, Hamilton, Hawthorne, Herston, Highgate Hill, Kangaroo Point, Kelvin Grove, Lutwyche, Milton, Morningside, New Farm, Newmarket, Newstead, Norman Park, Paddington, Petrie Terrace, Red Hill, Seven Hills, South Brisbane, Spring Hill, St Lucia, Taringa, Teneriffe, Toowong, West End, Wilston, Windsor, Woolloongabba, Wooloowin, Yeronga.
Middle-ring market data encapsulates aggregate property conditions within the following suburbs:Arana Hills, Archerfield, Aspley, Belmont, Brisbane Airport, Cannon Hill, Carina, Carina Heights, Carindale, Chapel Hill, Chelmer, Chermside, Chermside West, Coopers Plains, Corinda, Eagle Farm, Enoggera, Enoggera Reservoir, Everton Hills, Everton Park, Fig Tree Pocket, Gaythorne, Geebung, Gordon Park, Graceville, Hemmant, Hendra, Holland Park, Holland Park West, Indooroopilly, Kalinga, Kedron, Kenmore, Kenmore Hills, Keperra, Mansfield, McDowall, Mitchelton, Moorooka, Mount Coot-tha, Mount Gravatt, Mount Gravatt East, Murarrie, Nathan, Northgate, Nundah, Oxley, Pinkenba, Rocklea, Salisbury, Sherwood, Stafford, Stafford Heights, Tarragindi, Tennyson, The Gap, Tingalpa, Upper Kedron, Upper Mount Gravatt, Virginia, Wavell Heights, Yeerongpilly.
Outer-ring market data encapsulates aggregate property conditions within following suburbs:Acacia Ridge, Albany Creek, Alexandra Hills, Algester, Anstead, Bald Hills, Banyo, Bellbowrie, Birkdale, Boondall, Bracken Ridge, Bray Park, Brendale, Bridgeman Downs, Brighton, Brookfield, Bunya, Burbank, Calamvale, Camira, Camp Mountain, Capalaba, Carole Park, Carseldine, Cashmere, Chandler, Clear Mountain, Closeburn, Daisy Hill, Darra, Deagon, Doolandella, Draper, Drewvale, Durack, Eatons Hill, Eight Mile Plains, Ellen Grove, Ferny Grove, Ferny Hills, Fitzgibbon, Forest Lake, Gailes, Goodna, Greenbank, Griffin, Gumdale, Heathwood, Inala, Jamboree Heights, Jindalee, Jollys Lookout, Karalee, Karawatha, Kholo, Kuraby, Lake Manchester, Larapinta, Lawnton, Logan Central, Lota, Lytton, Macgregor, Mackenzie, Manly, Manly West, Middle Park, Moggill, Mount Crosby, Mount Ommaney, Murrumba Downs, Nudgee, Nudgee Beach, Pallara, Parkinson, Pinjarra Hills, Port Of Brisbane, Priestdale, Pullenvale, Ransome, Redbank, Richlands, Riverhills, Robertson, Rochedale, Rochedale South, Runcorn, Samford Valley, Samford Village, Sandgate, Seventeen Mile Rocks, Sheldon, Shorncliffe, Sinnamon Park, Slacks Creek, Springwood, Strathpine, Stretton, Sumner, Sunnybank, Sunnybank Hills, Taigum, Thorneside, Underwood, Upper Brookfield, Wacol, Wakerley, Warner, Wellington Point, Westlake, Wights Mountain, Willawong, Wishart, Woodridge, Wynnum, Wynnum West, Yugar, Zillmere.
Source: APM Pricefinder, SQM Research, ESRI ArcGIS.
Disclaimer: PRD does not give any warranty in relation to the accuracy of the information contained in this report. If you intend to rely upon the information contained herein, you must take note that the information, figures and projections have been provided by various sources and have not been verified by us. We have no belief one way or the other in relation to the accuracy of such information, figures and projections. PRD will not be liable for any loss or damage resulting from any statement, figure, calculation or any other information that you rely upon that is contained in the material.
Prepared by PRD Research © All medians and volumes are calculated by PRD Research. Use with written permission only. All other responsibilities disclaimed. © Copyright PRD 2021.

ABOUT PRD RESEARCHPRD Research Division provides reliable, unbiased, and authoritative property research and consultancy to clients in metro and regional locations across Australia
Our extensive research capability and specialised approach ensures our clients can make the most informed and financially sound decisions about residential and commercial properties.
OUR KNOWLEDGE
OUR SERVICES INCLUDE
PRD ResearchT +61 7 3229 3344E [email protected]
PRD.com.au
• Advisory and consultancy
• Market Analysis including
profiling and trends
• Primary qualitative and
quantitative research
• Demographic and target market
Analysis
• Geographic information mapping
• Project Analysis including product
and pricing recommendations
• Rental and investment return
analysis
Access to accurate and objective research is the foundation of all good property decisions.
As the first and only truly knowledge based property services company, PRD shares experience and knowledge to deliver innovative and effective solutions to our clients.
We have a unique approach that integrates people, experience, systems and technology to create meaningful business connections. We focus on understanding new issues impacting the property industry; such as the environment and sustainability, the economy, demographic and psychographic shifts, commercial and residential design; and forecast future implications around such issues based on historical data and fact.
OUR PEOPLEOur research team is made up of highly qualified researchers who focus solely on property analysis.
Skilled in deriving macro and micro quantitative information from multiple credible sources, we partner with clients to provide strategic advice and direction regarding property and market performance. We have the added advantage of sourcing valuable and factual qualitative market research in order to ensure our solutions are the most well considered and financially viable.
Our experts are highly sought after consultants for both corporate and government bodies and their advice has helped steer the direction of a number of property developments and secured successful outcomes for our clients.
OUR SERVICESOur research services span over every suburb, LGA, and state within Australia; captured in a variety of standard and customised products.
We have the ability and systems to monitor market movements, demographic changes and property trends. We use our knowledge of market sizes, price structure and buyer profiles to identify opportunities for clients and provide market knowledge that is unbiased, thorough and reliable.