Breaking news from the research desk: Roadway intersection lighting as it affects traffic safety
29
© 2013 Rensselaer Polytechnic Institute. All rights reserved. Breaking News From the Research Desk: Roadway Intersection Lighting as It Affects Traffic Safety November 14, 2013 John D. Bullough, Ph.D. Lighting Research Center Rensselaer Polytechnic Institute With Acknowledgment To: Eric T. Donnell, Ph.D., Pennsylvania State University Mark S. Rea, Ph.D., Lighting Research Center
Transcript of Breaking news from the research desk: Roadway intersection lighting as it affects traffic safety

© 2013 Rensselaer Polytechnic Institute. All rights reserved.
Breaking News From the Research Desk: Roadway Intersection Lighting as It Affects
Traffic Safety
November 14, 2013
John D. Bullough, Ph.D. Lighting Research Center
Rensselaer Polytechnic Institute
With Acknowledgment To: Eric T. Donnell, Ph.D., Pennsylvania State University
Mark S. Rea, Ph.D., Lighting Research Center

© 2013 Rensselaer Polytechnic Institute. All rights reserved.
We believe…
Roadway lighting improves visibility, which in turn leads to increased safety (fewer crashes): A + B = C
© 2013 Rensselaer Polytechnic Institute. All rights reserved. © 2013 Rensselaer Polytechnic Institute. All rights reserved. © 2013 Rensselaer Polytechnic Institute. All rights reserved. 2
© 2013 Rensselaer Polytechnic Institute. All rights reserved.
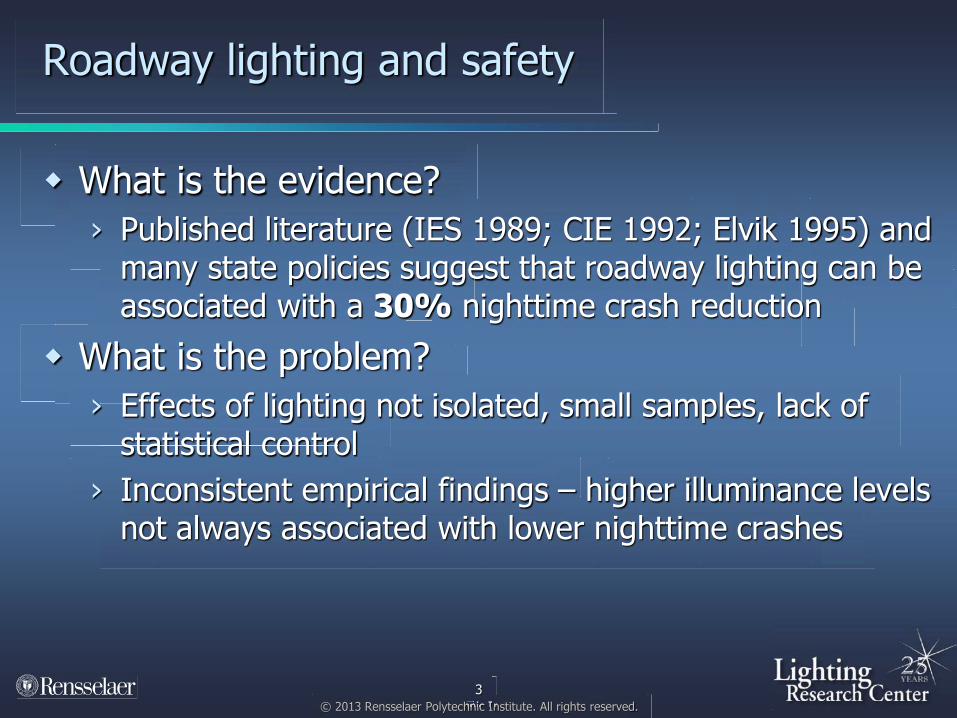
Roadway lighting and safety
What is the evidence? › Published literature (IES 1989; CIE 1992; Elvik 1995) and
many state policies suggest that roadway lighting can be associated with a 30% nighttime crash reduction
What is the problem? › Effects of lighting not isolated, small samples, lack of
statistical control › Inconsistent empirical findings – higher illuminance levels
not always associated with lower nighttime crashes
© 2013 Rensselaer Polytechnic Institute. All rights reserved. © 2013 Rensselaer Polytechnic Institute. All rights reserved. © 2013 Rensselaer Polytechnic Institute. All rights reserved. 3

© 2013 Rensselaer Polytechnic Institute. All rights reserved.
How can we know if lighting really matters?
Converging approaches: Statistical approach from Minnesota Highway Safety
Information System (HSIS) statewide database including lighting and crash data
Analytical approach using visibility coverage areas based on Minnesota DOT practices
© 2013 Rensselaer Polytechnic Institute. All rights reserved. © 2013 Rensselaer Polytechnic Institute. All rights reserved. © 2013 Rensselaer Polytechnic Institute. All rights reserved. 4

© 2013 Rensselaer Polytechnic Institute. All rights reserved.
Statistical Approach
5
© 2013 Rensselaer Polytechnic Institute. All rights reserved.
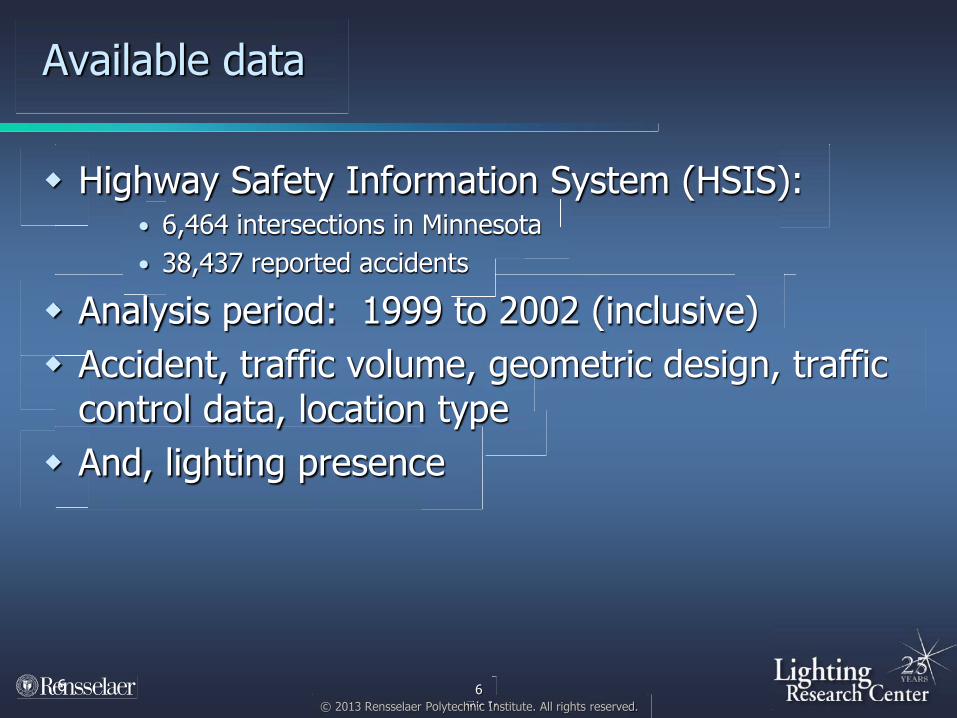
Available data
Highway Safety Information System (HSIS): • 6,464 intersections in Minnesota • 38,437 reported accidents
Analysis period: 1999 to 2002 (inclusive) Accident, traffic volume, geometric design, traffic
control data, location type And, lighting presence
© 2013 Rensselaer Polytechnic Institute. All rights reserved. © 2013 Rensselaer Polytechnic Institute. All rights reserved. © 2013 Rensselaer Polytechnic Institute. All rights reserved. 6 6

© 2013 Rensselaer Polytechnic Institute. All rights reserved.
Data summary
© 2013 Rensselaer Polytechnic Institute. All rights reserved. © 2013 Rensselaer Polytechnic Institute. All rights reserved. © 2013 Rensselaer Polytechnic Institute. All rights reserved. 7
Variable Minimum Maximum Mean Standard Deviation
Night accident frequency (per year) 0 28 0.3655 0.9687Day accident frequency (per year) 0 55 1.1211 2.4570Major road average daily traffic 40 77,430 8,284 9,381Percent heavy vehicles on major road 0 61.11 8.8880 5.1092Minor road average daily traffic 1 77,430 3,164 5,179Area type indicator (1 = urban/suburban; 0 = rural)
0 1 0.4456 0.4970
Traffic control indicator (1 = signal; 0 = stop-control)
0 1 0.1373 0.3442
Lighting indicator (1 = present; 0 = not present)
0 1 0.4212 0.4938
Intersection type indicator(1 = skew; 0 = cross or tee)
0 1 0.1095 0.3123
Speed indicator*(1 = 50 mph or greater; 0 otherwise)
0 1 0.6731 0.4691
No access control indicator *(1 = no access; 0 = partial access control)
0 1 0.9426 0.2326
Depressed median indicator*(1 = depressed median; 0 = barrier or no median)
0 1 0.1162 0.3204
Paved left-shoulder indicator*(1 = paved shoulder; 0 = unpaved or no shoulder)
0 1 0.4577 0.4982
Paved right-shoulder indicator*(1 = paved shoulder; 0 = unpaved or no shoulder)
0 1 0.5096 0.4999
*indicates that data were used for the major intersecting roadway only1

© 2013 Rensselaer Polytechnic Institute. All rights reserved.
Outcome measures
Three safety performance measures:
› Expected number of daytime accidents › Expected number of nighttime accidents › Percent change in night-to-day accident ratio
• The latter measure helps control for the influence of potential
safety-related differences other than lighting at locations that have lighting installed, which are not otherwise included among the factors in the HSIS database
› For rural and urban/suburban, signalized and
unsignalized intersections
© 2013 Rensselaer Polytechnic Institute. All rights reserved. © 2013 Rensselaer Polytechnic Institute. All rights reserved. © 2013 Rensselaer Polytechnic Institute. All rights reserved. 8
© 2013 Rensselaer Polytechnic Institute. All rights reserved.
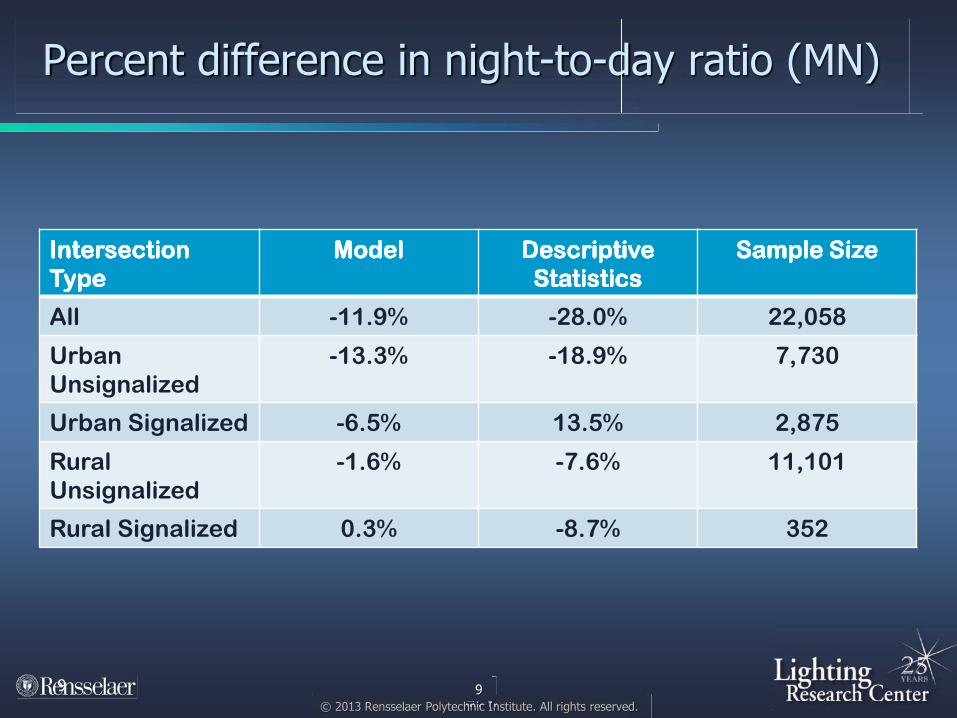
Percent difference in night-to-day ratio (MN)
© 2013 Rensselaer Polytechnic Institute. All rights reserved. © 2013 Rensselaer Polytechnic Institute. All rights reserved. © 2013 Rensselaer Polytechnic Institute. All rights reserved. 9
Intersection Type
Model Descriptive Statistics
Sample Size
All -11.9% -28.0% 22,058
Urban Unsignalized
-13.3% -18.9% 7,730
Urban Signalized -6.5% 13.5% 2,875
Rural Unsignalized
-1.6% -7.6% 11,101
Rural Signalized 0.3% -8.7% 352
9

© 2013 Rensselaer Polytechnic Institute. All rights reserved.
Statistical approach conclusions
Lighting has a safety benefit at intersections: › Overall, ~10% lower night-to-day accident ratio › Results are consistent across multiple statistical methods
Magnitude of lighting effect is lower than many past published studies (CIE, 1992; Elvik, 1995)
© 2013 Rensselaer Polytechnic Institute. All rights reserved. © 2013 Rensselaer Polytechnic Institute. All rights reserved. © 2013 Rensselaer Polytechnic Institute. All rights reserved. 10

© 2013 Rensselaer Polytechnic Institute. All rights reserved.
Analytical Approach

© 2013 Rensselaer Polytechnic Institute. All rights reserved.
How are Minnesota’s intersections illuminated?
MnDOT’s Roadway Lighting Design Manual is regularly maintained
Practices closely follow Illuminating Engineering Society (IES) and American Association of State Highway and Transportation Officials (AASHTO) recommendations
Photolog spot checks confirm that MnDOT “practices what it preaches”
© 2013 Rensselaer Polytechnic Institute. All rights reserved. © 2013 Rensselaer Polytechnic Institute. All rights reserved. © 2013 Rensselaer Polytechnic Institute. All rights reserved. 12
Roadway Intersection Type Roadway Illuminance
Intersection Illuminance
Ambient Illuminance
Speed Limit
Extended/ Localized
Urban signalized 18 lx 30 lx 2 lx 30 mph ExtendedSuburban unsignalized 9 lx 15 lx 0.2 lx 30 mph ExtendedRural signalized 6 lx 10 lx 0.2 lx 55 mph LocalizedRural unsignalized 6 lx 10 lx 0.02 lx 55 mph Localized
© 2013 Rensselaer Polytechnic Institute. All rights reserved.
Visibility analysis approach
How much (if at all) does lighting, as practiced along different types of roadway intersections in Minnesota, improve visual performance › Including the impacts of vehicle headlights (on visibility
and glare)
Using:
› Photometrically accurate, field-verified lighting calculation/simulation software and a validated model of visual performance
© 2013 Rensselaer Polytechnic Institute. All rights reserved. © 2013 Rensselaer Polytechnic Institute. All rights reserved. © 2013 Rensselaer Polytechnic Institute. All rights reserved. 13

© 2013 Rensselaer Polytechnic Institute. All rights reserved.
Common intersection crash types
Misjudgment of location/velocity of adjacent vehicles is a common cause of crashes at intersections (after red light running) (Chovan et al. 1994)
© 2013 Rensselaer Polytechnic Institute. All rights reserved. © 2013 Rensselaer Polytechnic Institute. All rights reserved. © 2013 Rensselaer Polytechnic Institute. All rights reserved. 14
Adapted from connectedvehicle.challenge.gov
Is the gap large enough to turn?
Which car would you rather be facing?

© 2013 Rensselaer Polytechnic Institute. All rights reserved.
Potential role of lighting in safety
© 2013 Rensselaer Polytechnic Institute. All rights reserved. © 2013 Rensselaer Polytechnic Institute. All rights reserved. © 2013 Rensselaer Polytechnic Institute. All rights reserved. 15
Which car would you rather be facing?

© 2013 Rensselaer Polytechnic Institute. All rights reserved.
Visibility coverage area
Characterizes drivers’ ability see potential hazards (other vehicles) and surrounding terrain for different driving speeds
Includes headlamps, ambient light (in urban/suburban and rural locations), extended (continuous) and localized (“point”) lighting, driver age (30, 45 and 60 year olds)
16 Rea et al. 2010
Relevant locations for high speeds (≥40 mph)
Relevant locations for low speeds (<40 mph)
© 2013 Rensselaer Polytechnic Institute. All rights reserved. © 2013 Rensselaer Polytechnic Institute. All rights reserved. © 2013 Rensselaer Polytechnic Institute. All rights reserved. 16

© 2013 Rensselaer Polytechnic Institute. All rights reserved.
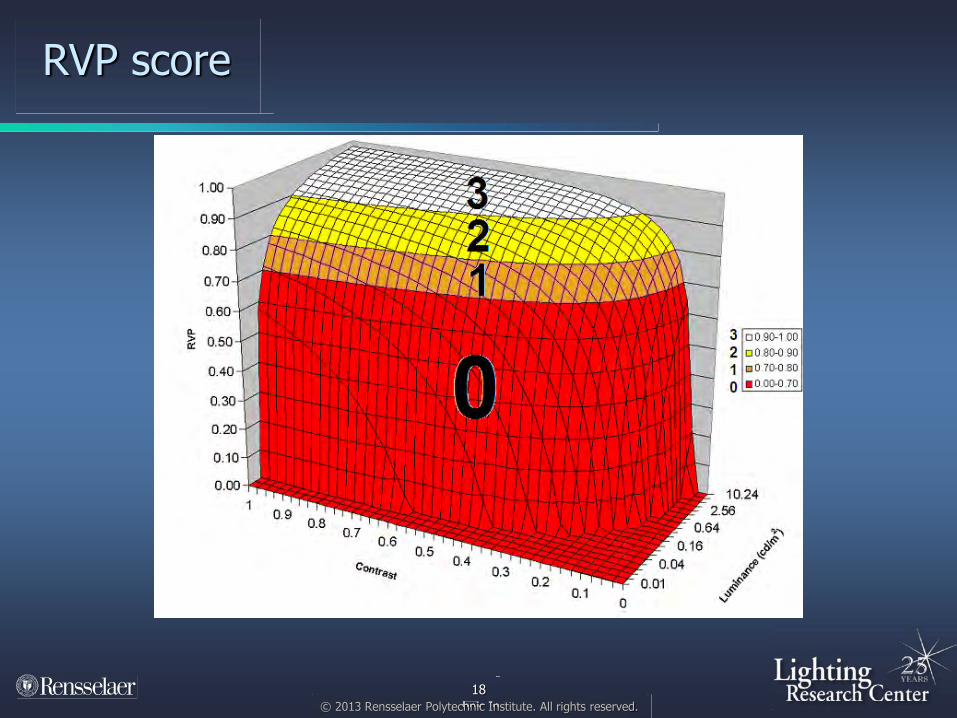
Relative visual performance (RVP) model
© 2013 Rensselaer Polytechnic Institute. All rights reserved. © 2013 Rensselaer Polytechnic Institute. All rights reserved. © 2013 Rensselaer Polytechnic Institute. All rights reserved. 17
Speed-accuracy is a function of object brightness, contrast, size, and observer age
Once high visual performance is achieved, further increases in light level do not improve speed-accuracy
Rea and Ouellette 1991
© 2013 Rensselaer Polytechnic Institute. All rights reserved.
RVP score
© 2013 Rensselaer Polytechnic Institute. All rights reserved. © 2013 Rensselaer Polytechnic Institute. All rights reserved. © 2013 Rensselaer Polytechnic Institute. All rights reserved. 18
© 2013 Rensselaer Polytechnic Institute. All rights reserved.
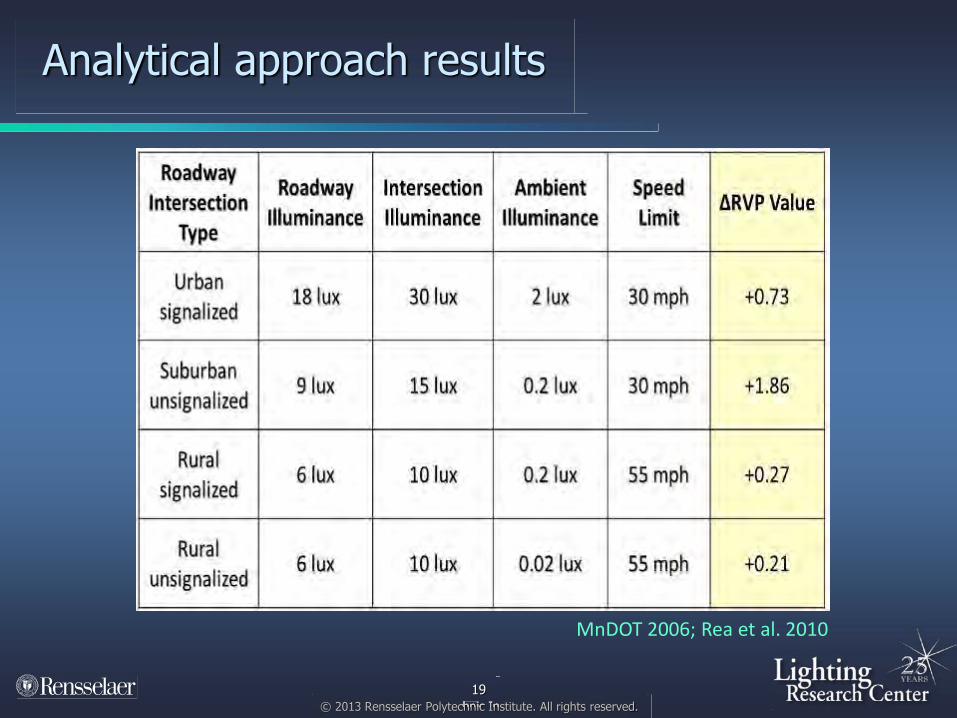
Analytical approach results
© 2013 Rensselaer Polytechnic Institute. All rights reserved. © 2013 Rensselaer Polytechnic Institute. All rights reserved. © 2013 Rensselaer Polytechnic Institute. All rights reserved. 19
MnDOT 2006; Rea et al. 2010

© 2013 Rensselaer Polytechnic Institute. All rights reserved.
A provisional transfer function for visibility and nighttime crash safety
© 2013 Rensselaer Polytechnic Institute. All rights reserved. © 2013 Rensselaer Polytechnic Institute. All rights reserved. © 2013 Rensselaer Polytechnic Institute. All rights reserved. 20

© 2013 Rensselaer Polytechnic Institute. All rights reserved.
Analytical approach conclusions
The relative visual performance (RVP) model is a robust predictor of speed and accuracy of seeing under nighttime driving conditions
Increases in visual performance from roadway intersection lighting are correlated with improvements in nighttime driving safety
© 2013 Rensselaer Polytechnic Institute. All rights reserved. © 2013 Rensselaer Polytechnic Institute. All rights reserved. © 2013 Rensselaer Polytechnic Institute. All rights reserved. 21
© 2013 Rensselaer Polytechnic Institute. All rights reserved.
Benefit/Cost Analysis

© 2013 Rensselaer Polytechnic Institute. All rights reserved.
Economic costs of roadway intersection lighting
Installation cost: Assumes dedicated poles with underground wiring (R.S. Means 2008) › Urban signalized: $13,500 (annualized over 20 yr: $1080) › Rural unsignalized: $4,600 (annualized over 20 yr: $370)
Operation and maintenance cost: › Urban signalized: $710 (annual) › Rural unsignalized: $230 (annual)
Overall annual(ized) cost: › Urban signalized: $1,790 (annual) › Rural unsignalized: $600 (annual)
Cost is unrelated to traffic volume
© 2013 Rensselaer Polytechnic Institute. All rights reserved. © 2013 Rensselaer Polytechnic Institute. All rights reserved. © 2013 Rensselaer Polytechnic Institute. All rights reserved. 23

© 2013 Rensselaer Polytechnic Institute. All rights reserved.
Economic benefits of avoided crashes
U.S. DOT (2008) estimates for different crash severities: › Fatality: $5,800,000 › Incapacitating injury: $401,538 › Evident injury: $80,308 › Possible injury: $42,385 › Property damage only: $4,462
Fatal and injury crashes are more prevalent at rural locations (higher speeds), so average weighted crash costs are: › Urban signalized: $122,056 › Rural unsignalized: $232,142
© 2013 Rensselaer Polytechnic Institute. All rights reserved. © 2013 Rensselaer Polytechnic Institute. All rights reserved. © 2013 Rensselaer Polytechnic Institute. All rights reserved. 24

© 2013 Rensselaer Polytechnic Institute. All rights reserved.
Applying the transfer function
© 2013 Rensselaer Polytechnic Institute. All rights reserved. © 2013 Rensselaer Polytechnic Institute. All rights reserved. © 2013 Rensselaer Polytechnic Institute. All rights reserved. 25
Roadway lighting, as practiced by MNDOT (based on IES recommendations), would be expected to reduce nighttime crashes by 1.5% at rural unsignalized intersections, and by 5.3% at urban signalized intersections
Roadway lighting, as practiced by MNDOT (based on IES recommendations), would be expected to reduce nighttime crashes by 1.5% at rural unsignalized intersections, and by 5.3% at urban signalized intersections
rural unsignalized
urban signalized
1.5%
5.3%

© 2013 Rensselaer Polytechnic Institute. All rights reserved.
Reduction in nighttime crashes associated with roadway intersection lighting
© 2013 Rensselaer Polytechnic Institute. All rights reserved. © 2013 Rensselaer Polytechnic Institute. All rights reserved. © 2013 Rensselaer Polytechnic Institute. All rights reserved. 26
5.3% of each value
$122,056
1.5% of each value
$232,142
(annual average daily traffic)

© 2013 Rensselaer Polytechnic Institute. All rights reserved. © 2013 Rensselaer Polytechnic Institute. All rights reserved. © 2013 Rensselaer Polytechnic Institute. All rights reserved. © 2013 Rensselaer Polytechnic Institute. All rights reserved. 27
Benefit/cost ratios
Urban signalized intersections
Rural unsignalized intersections
Urban signalized intersections Urban signalized intersections
16400 Mean (MN)
3200 Mean (MN)

© 2013 Rensselaer Polytechnic Institute. All rights reserved.
Summary
Roadway lighting can improve safety › Not necessarily as much as
previously assumed but often sufficiently for a net benefit/cost ratio
Safety can be increased by increasing visibility › Predictions possible, not just post
hoc inferences Value (benefits/costs) can be now
calculated to compare lighting of different types and with other possible safety interventions
© 2013 Rensselaer Polytechnic Institute. All rights reserved. © 2013 Rensselaer Polytechnic Institute. All rights reserved. © 2013 Rensselaer Polytechnic Institute. All rights reserved. 28

© 2013 Rensselaer Polytechnic Institute. All rights reserved.
Thank you!
References: www.lrc.rpi.edu/lighting-safety