Standardize the Service Desk - Ivanti
167
Info-Tech Research Group 1 Info-Tech Research Group 1 Info-Tech Research Group, Inc. is a global leader in providing IT research and advice. Info-Tech’s products and services combine actionable insight and relevant advice with ready-to-use tools and templates that cover the full spectrum of IT concerns. © 1997-2018 Info-Tech Research Group Inc. Standardize the Service Desk Strengthen your service desk to build a strong ITSM foundation.
-
Upload
khangminh22 -
Category
Documents
-
view
3 -
download
0
Transcript of Standardize the Service Desk - Ivanti

Info-Tech Research Group 1Info-Tech Research Group 1
Info-Tech Research Group, Inc. is a global leader in providing IT research and advice.
Info-Tech’s products and services combine actionable insight and relevant advice with
ready-to-use tools and templates that cover the full spectrum of IT concerns.
© 1997-2018 Info-Tech Research Group Inc.
Standardize the Service Desk
Strengthen your service desk to build a strong ITSM foundation.
Info-Tech Research Group 2Info-Tech Research Group 2
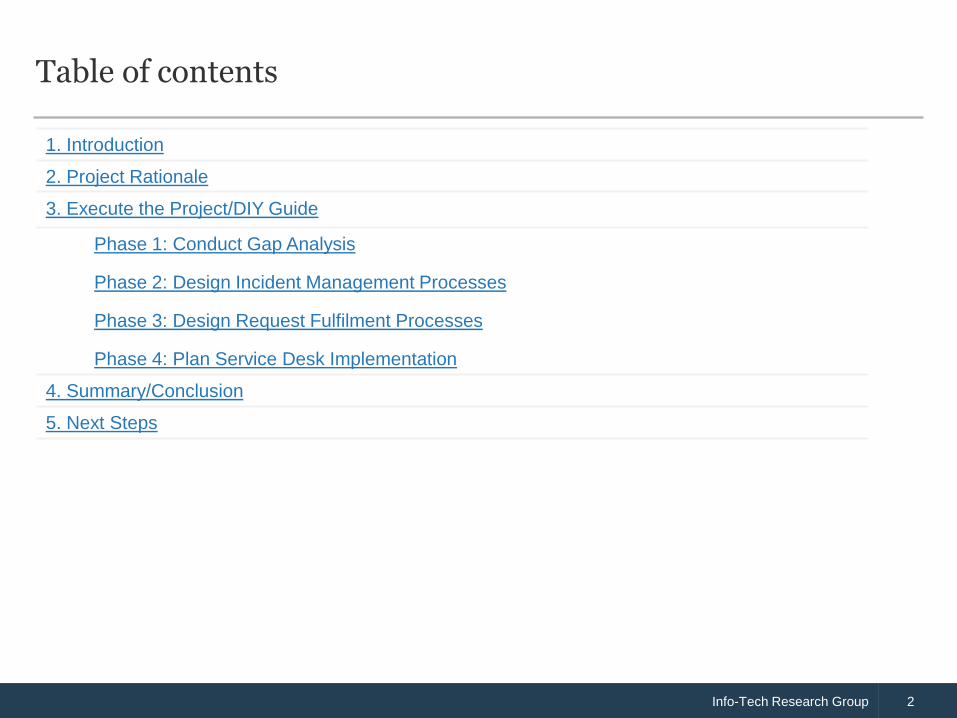
Table of contents
1. Introduction
2. Project Rationale
3. Execute the Project/DIY Guide
Phase 1: Conduct Gap Analysis
Phase 2: Design Incident Management Processes
Phase 3: Design Request Fulfilment Processes
Phase 4: Plan Service Desk Implementation
4. Summary/Conclusion
5. Next Steps

Info-Tech Research Group 3Info-Tech Research Group 3
Business leaders sometimes assume that standardizing the service desk is simply a matter of buying the right tool or sorting out the analysts who handle the initial tickets. This mistake is behind more than one misguided service desk standardization project and most hasty IT service management (ITSM) tool purchases.
Service desk technologies and processes are definitely part of the equation, but the variables extend far beyond the first tier of the service desk. Improving service support is an exercise in organizational change. The goal is to work toward establishing a single service-support team across the IT group and supporting it with a cooperative, customer-focused culture.
Focus on building standardized processes for incident management and service request fulfillment one group at a time until everyone who touches a ticket embraces the same set of processes and technologies.
Sandi Conrad,
Senior Director, Infrastructure Practice
Info-Tech Research Group
ANALYST PERSPECTIVE

Info-Tech Research Group 4Info-Tech Research Group 4
This Research is Designed For: This Research Will Help You:
This Research Will Assist:
This Research Is Designed For: This Research Will Help You:
This Research Will Also Assist:
A method for getting your service desk out of firefighter mode
• The CIO and Service Manager who need to
increase service desk effectiveness and
timeliness and improve end-user satisfaction.
• The Service Manager who wants to lead the
team from firefighting mode to providing
consistent and proactive support.
• Create a consistent customer service
experience for service desk patrons.
• Increase efficiency, first-call resolution, and
end-user satisfaction with the Service Desk.
• Decrease time and cost to resolve service
desk tickets.
• Understand and address reporting needs to
address root causes and measure success.
• Build a solid foundation for future IT service
improvements.
• Enhance demand planning and trend
reporting.
• Services teams who want to increase their
own effectiveness and move from a help desk
to a service desk.
• Infrastructure and Applications Managers
who want to decrease reactive support
activities within their teams.
Info-Tech Research Group 5Info-Tech Research Group 5
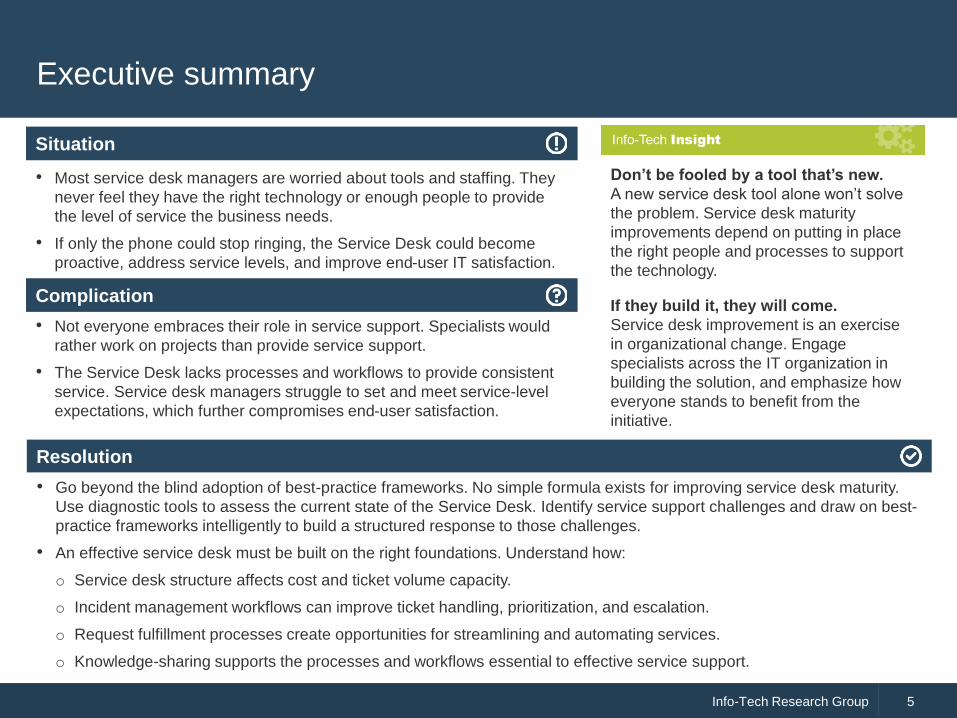
Resolution
Situation
Complication
Executive summary
• Most service desk managers are worried about tools and staffing. They
never feel they have the right technology or enough people to provide
the level of service the business needs.
• If only the phone could stop ringing, the Service Desk could become
proactive, address service levels, and improve end-user IT satisfaction.
• Not everyone embraces their role in service support. Specialists would
rather work on projects than provide service support.
• The Service Desk lacks processes and workflows to provide consistent
service. Service desk managers struggle to set and meet service-level
expectations, which further compromises end-user satisfaction.
• Go beyond the blind adoption of best-practice frameworks. No simple formula exists for improving service desk maturity.
Use diagnostic tools to assess the current state of the Service Desk. Identify service support challenges and draw on best-
practice frameworks intelligently to build a structured response to those challenges.
• An effective service desk must be built on the right foundations. Understand how:
o Service desk structure affects cost and ticket volume capacity.
o Incident management workflows can improve ticket handling, prioritization, and escalation.
o Request fulfillment processes create opportunities for streamlining and automating services.
o Knowledge-sharing supports the processes and workflows essential to effective service support.
Don’t be fooled by a tool that’s new.
A new service desk tool alone won’t solve
the problem. Service desk maturity
improvements depend on putting in place
the right people and processes to support
the technology.
If they build it, they will come.
Service desk improvement is an exercise
in organizational change. Engage
specialists across the IT organization in
building the solution, and emphasize how
everyone stands to benefit from the
initiative.

Info-Tech Research Group 6Info-Tech Research Group 6
7.3 7.26.8 6.6
9.0 9.0 9.0 8.9
0.0
1.0
2.0
3.0
4.0
5.0
6.0
7.0
8.0
9.0
10.0
Frontline Manager Director Executive
MG
D S
core
Seniority Level
Effectiveness Importance
Directors and executives understand the importance of the
service desk and believe IT can do better
Info-Tech Research Group’s IT Management and Governance Diagnostic (MGD) program
assesses the importance and effectiveness of core IT processes. Since its inception, the
MGD has consistently identified the service desk as an area to leverage.
Service Desk
Importance Scores
No Importance: 1.0-6.9
Limited Importance: 7.0-7.9
Significant Importance: 8.0-8.9
Critical Importance: 9.0-10.0
Service Desk
Effectiveness Scores
Not in Place: N/A
Not Effective: 0.0-4.9
Somewhat Ineffective: 5.0-5.9
Somewhat Effective: 6.0-6.9
Very Effective: 7.0-10.0
Source: Info-Tech, 2018 Responses (N=365 organizations)

Info-Tech Research Group 7Info-Tech Research Group 7
Since 2013, Info-Tech has surveyed
over 40,000 business stakeholders as
part of our CIO Business Vision
program.
Business stakeholders ranked the
following 12 core IT services in terms of
importance:
Network Infrastructure
Service Desk
Business Applications
Data Quality
Devices
Client-Facing Technology
Analytical Capability
Innovation Leadership
Work Orders
Projects
IT Policies
Requirements Gathering
11
10
12
1
2
4
5
8
9
7
6
3
Top IT Services for Business Stakeholders
Source: Info-Tech Research Group, 2018 (N=298 organizations)
Learn more about the CIO Business Vision program.
Business stakeholders consistently rank the service desk as
one of the most important services that IT provides

Info-Tech Research Group 8Info-Tech Research Group 8
Increase business satisfaction:
• Improve confidence that the service desk can meet service levels.
• Create a single point of contact for incidents and requests, and
escalate quickly.
Increase efficiency and lower operating costs:
• Empower end users and technicians with a targeted knowledgebase.
• Cross-train to improve service consistency.
Reduce recurring issues:
• Create tickets for every task and categorize them accurately.
• Generate reliable data to support root-cause analysis.
Enhance demand planning:
• Analyze trends to forecast and meet shifting business requirements.
Having an effective and timely service desk correlates with
higher end-user satisfaction with all other IT services
“Satisfied” organizations had average scores >=8.
“Dissatisfied" organizations had average scores <6.
Source: Info-Tech Research Group, 2018
(N=20,921 respondents from 113 organizations)
On average, organizations that were
satisfied with service desk effectiveness
rated all other IT processes 70% higher
than dissatisfied end users.
Organizations that were satisfied with
service desk timeliness rated all other IT
processes 40% higher than dissatisfied
end users.
Embrace Standardization
• Over time, organizations without standardized processes become a
mass of confusion, redundancies, and cost overruns. Standardization
prevents organizations from wasting energy on reinventing solutions to
recurring issues.
• Prepare your organization to scale its IT services with standardized
processes that promote creativity while defining repeatable approaches
to work. That way, process maturity increases with the size of your
organization.
4.7
5.8
8.0 8.1
1.0
2.0
3.0
4.0
5.0
6.0
7.0
8.0
9.0
10.0
Service DeskEffectiveness
Service Desk Timeliness
Avera
ge S
atisfa
ction w
ith I
T S
erv
ices
Dissatisfied End User Satisfied End User
40%70%
Info-Tech Research Group 9Info-Tech Research Group 9
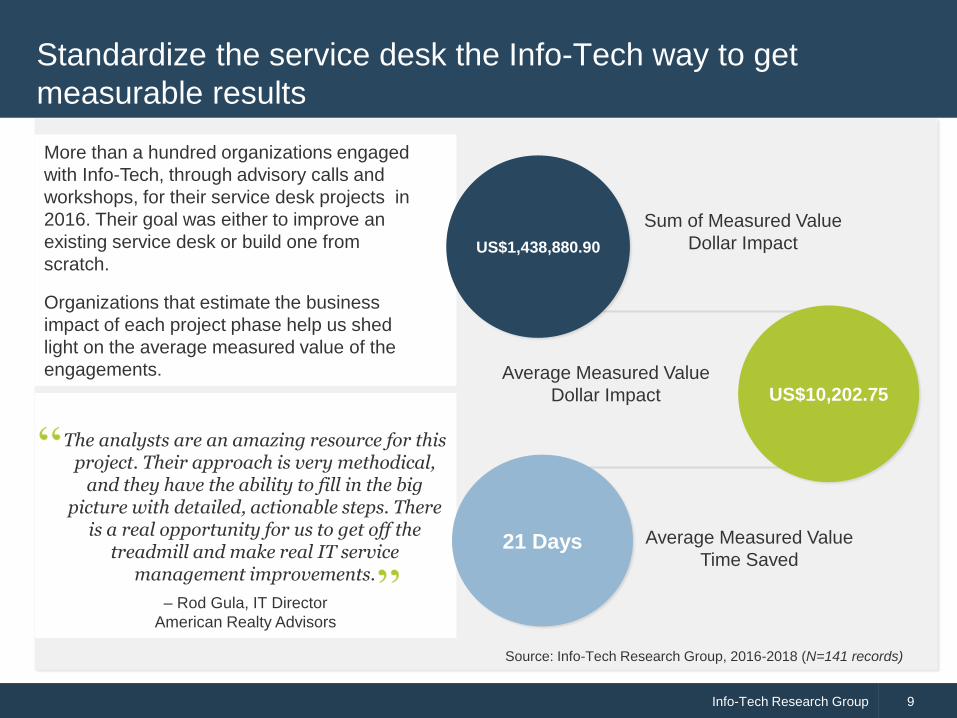
More than a hundred organizations engaged
with Info-Tech, through advisory calls and
workshops, for their service desk projects in
2016. Their goal was either to improve an
existing service desk or build one from
scratch.
Organizations that estimate the business
impact of each project phase help us shed
light on the average measured value of the
engagements.
Sum of Measured Value
Dollar Impact
Average Measured Value
Dollar Impact US$10,202.75
Source: Info-Tech Research Group, 2016-2018 (N=141 records)
Standardize the service desk the Info-Tech way to get
measurable results
Average Measured Value
Time Saved
US$1,438,880.90
The analysts are an amazing resource for this project. Their approach is very methodical,
and they have the ability to fill in the big picture with detailed, actionable steps. There
is a real opportunity for us to get off the treadmill and make real IT service
management improvements.
– Rod Gula, IT Director
American Realty Advisors
21 Days

Info-Tech Research Group 10Info-Tech Research Group 10
Info-Tech’s approach to service desk standardization focuses
on building service management essentials
Phase 1:
Conduct gap analysis
Phase 2:
Design incident
management
Phase 3:
Design request
fulfilment
Review best service
support practices
Assess service desk challenges
1.2
1.1
Review ticket
handling procedures
Build incident management
workflows
1.4
2.1
Build request workflows
Prepare for a self-service portal project
3.2
3.1
• Current-state assessment
• Diagnostic: end-user survey
• Shift-left service strategy
• Incident and critical incident
management workflows
• Categorization scheme
• Escalation guidelines
• Prioritization matrix
• Service-level objectives
• Request vs. project criteria
• Ticket handling guidelines
• Ticket QA tool
Phase 4:
Implement plan
Identify ITSM tool requirement
4.2
4.1
• Communication plan
• Executive presentation
• Implementation Gantt chart
• Sunshine diagram
Identify metrics and
reports1.3
• Metrics and reports
Deliverables
2.3 3.3 4.3Build a targeted
knowledgebase
• KB article template
• KB process and workflow
• Request workflows
• Service design checklist
2.2
Design incident
escalation and
prioritization
2.3
Design ticket
categorization
Build communication
plan
• Process adoption checklist
• Ticket handling procedures
• QA ticket testing checklist
Build implementation roadmap

Info-Tech Research Group 11Info-Tech Research Group 11
Info-Tech Research Group’s approach to service desk
standardization focuses on building essential best practices
Consolidate
Build a strategic
roadmap to consolidate
service desks to reduce
end-user support costs
and sustain end-user
satisfaction.
Standardize
Build essential incident,
service request, and
knowledge management
processes to create a
sustainable service desk
that meets business
needs.
Extend
Facilitate the extension of
service management best
practices to other business
functions to improve
productivity and position IT as a strategic partner.
Our Approach to the Service Desk
Service desk optimization goes
beyond the blind adoption of best-
practice frameworks.
Info-Tech’s approach focuses on
controlling support costs and making
the most of IT’s service management
expertise to improve productivity.
Complete the projects sequentially
or in any order.
Info-Tech’s
Service Desk
Methodology
Adopt Lean
Build value map incident
management and request
fulfilment workflows, and
focus the service desk’s
efforts on high-value-
added activities.
Improve
Build a continual
improvement plan for the
service desk to review and
evaluate key processes
and services, and manage
the progress of improvement initiatives.
Select and Implement
Review mid-market and
enterprise service desk
tools, select an ITSM
solution, and build an
implementation plan to
ensure your investment
meets your needs.
Info-Tech Research Group 12Info-Tech Research Group 12
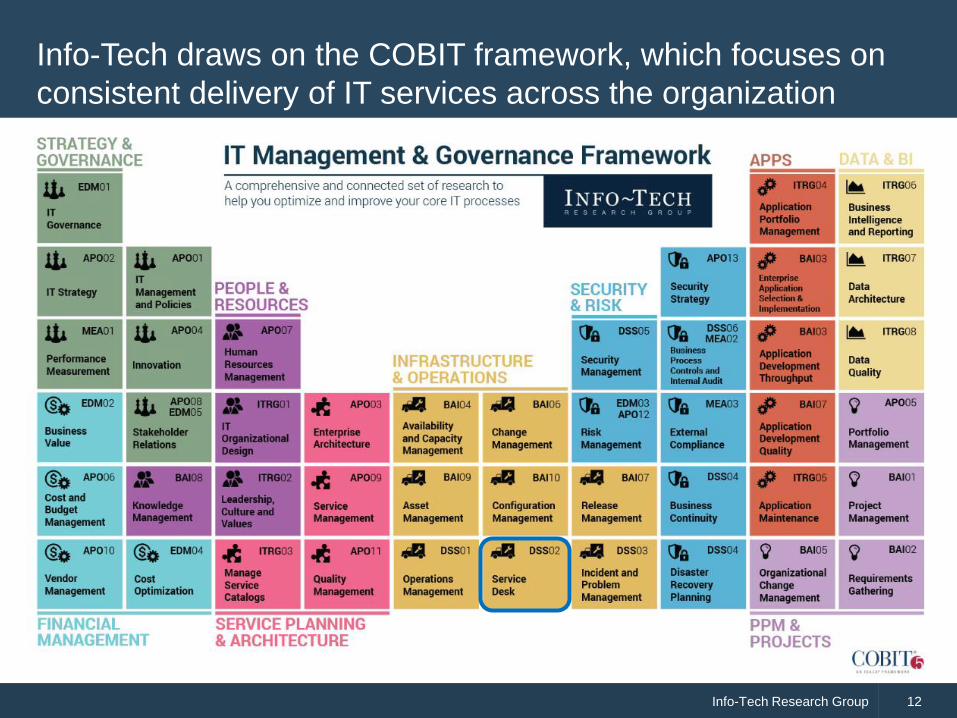
Info-Tech draws on the COBIT framework, which focuses on
consistent delivery of IT services across the organization

Info-Tech Research Group 13Info-Tech Research Group 13
The service desk is the foundation of all other service
management processes
Proactive
Stabilize
Service Provider
Asset Management
Service Desk
Incident Management, Request Fulfilment
Change Management
Problem Management
Capacity & Performance Management
Service Continuity Management
Event Management + Monitoring & Alerting
Demand Management
Service Level Management
Service Portfolio Management
Service Catalog
Business Relationship Management
Strategic Partner
Service Metrics
• Understand your environment and
take action to:o Avoid/prevent service disruptions.
o Improve quality of service
(performance, availability,
reliability).
• Deliver stable, reliable IT services to the business.
• Respond to user requests quickly and efficiently.
• Resolve user issues in a timely manner.
• Deploy changes smoothly and successfully.
• Create a service catalog that documents
services from the user perspective.
• Measure service performance, based on
business-oriented metrics.
Continual
Service
Improvement
Configuration Management
Availability Management
Release & Deployment Management

Info-Tech Research Group 14Info-Tech Research Group 14
Linde Engineering North America
Linde Engineering North America (LENA) is a leading technology
partner for plant engineering and construction. It has a broad
portfolio of plant and equipment solutions serving the gas
processing, refining, petrochemical, and chemical markets.
Service Desk Standardization Initiative
After a group series of mergers and acquisitions, the IT group
launched a service desk standardization project to improve
processes in their consolidated service desk. Linde Group
engaged Info-Tech Research Group to review the service desk
structure and perform a health check on incident management,
request fulfilment, and knowledge management processes.
Over the course of four-day onsite engagement, the service desk
team worked with two analysts to streamline and document
workflows, establish ticket handling guidelines, and review
technological requirements.
Results
The team developed a service desk standard operating procedure
and an implementation roadmap for the improvement program
with clear measures to reduce ticket backlog and improve
response and resolution times.
The Standardize the Service Desk engagement
included the following components:
Service Desk Foundations
Incident Management
Request Fulfilment
Knowledge Management
Technology
CASE STUDYIndustry
Source
Engineering
Client Engagement
Component falls into the scope of the project
Legend
Standardize service desks to improve key service
management metrics
Info-Tech Research Group 15Info-Tech Research Group 15
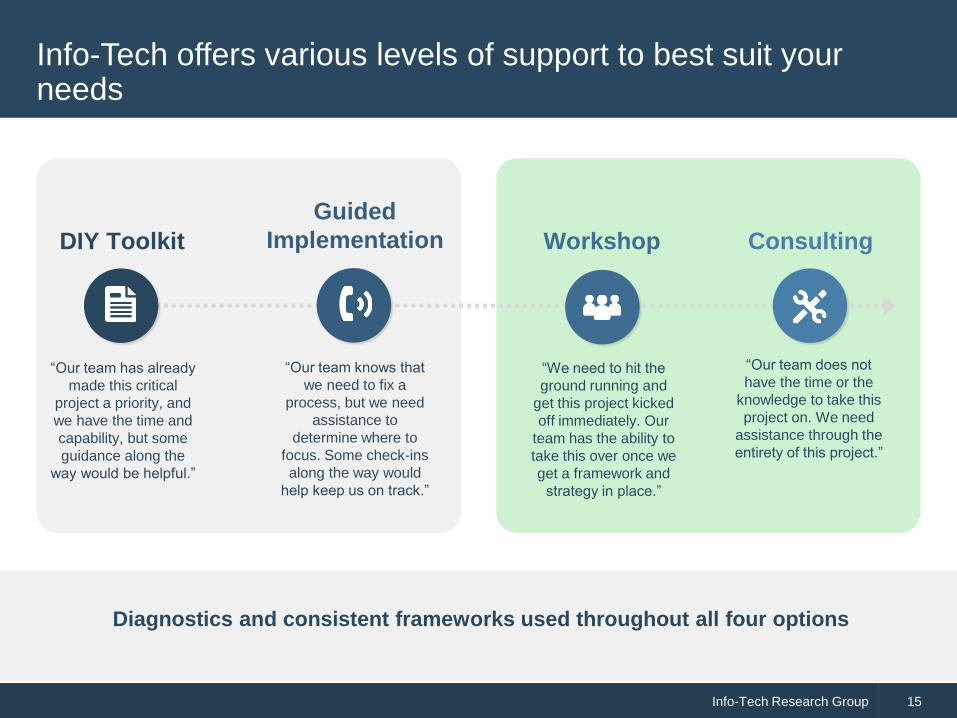
Consulting
“Our team does not
have the time or the
knowledge to take this
project on. We need
assistance through the
entirety of this project.”
Guided
Implementation
“Our team knows that
we need to fix a
process, but we need
assistance to
determine where to
focus. Some check-ins
along the way would
help keep us on track.”
DIY Toolkit
“Our team has already
made this critical
project a priority, and
we have the time and
capability, but some
guidance along the
way would be helpful.”
Workshop
“We need to hit the
ground running and
get this project kicked
off immediately. Our
team has the ability to
take this over once we
get a framework and
strategy in place.”
Diagnostics and consistent frameworks used throughout all four options
Info-Tech offers various levels of support to best suit your needs

Info-Tech Research Group 16Info-Tech Research Group 16
Use these icons to help direct you as you navigate this
research
This icon denotes a slide where a supporting Info-Tech tool or template will help you perform
the activity or step associated with the slide. Refer to the supporting tool or template to get
the best results and proceed to the next step of the project.
This icon denotes a slide with an associated activity. The activity can be performed either as
part of your project or with the support of Info-Tech team members, who will come onsite to
facilitate a workshop for your organization.
Use these icons to help guide you through each step of the blueprint and direct you to content related to
the recommended activities.

Info-Tech Research Group 17Info-Tech Research Group 17
Best-Practice
Toolkit
1.1 Assess service desk
challenges
1.2 Review best service
support practices
1.3 Identify metrics and
reports
1.4 Review ticket handling
procedures
2.1 Build incident
management workflows
2.2 Design ticket
categorization
2.3 Design incident
escalation and prioritization
3.1 Prepare for a self-service
portal project
3.2 Build request workflows
3.3 Build a targeted
knowledgebase
4.1 Identify ITSM tool
requirements
4.2 Build communication
plan
4.3 Build an implementation
roadmap
Guided
Implementations
Conduct current-state
assessment. Review shift-
left service support
strategy.
Identify operations metrics,
benchmarks, and reports.
Review ticket handling
procedures.
Map out incident
management workflows.
Design categorization and
identify escalation points.
Design prioritization
guidelines and service-
level objectives.
Differentiate between
requests and projects,
build request workflows,
and make a self-service
portal plan.
Design processes and
workflows to produce a
targeted knowledgebase.
Review ITSM tool
requirements and produce
a vendor shortlist.
Build a communication
plan and implementation
roadmap.
Onsite
Workshop
Module 1:
Conduct gap analysis
Module 2:
Design incident management
Module 3:
Design request fulfilment
Module 4:
Plan implementation
Phase 1 Results:
• Current-state assessment
and shift-left strategy
• Metrics and reports; ticket
handling procedures
Phase 2 Results:
• Defined processes for
logging, recording, and
resolving incidents
Phase 3 Results:
• Defined processes for
logging, scheduling, and
fulfilling requests
Phase 4 Results:
• ITSM tool review
• Communication plan and
implementation roadmap
Phase 1:
Gap Analysis
Phase 2:
Incident Management
Phase 3:
Request Fulfilment
Phase 4:
Implementation
Standardize the Service Desk – project overview

Info-Tech Research Group 18Info-Tech Research Group 18
Use the Standardize the Service Desk Task List to track your
progress
The Standardize the Service Desk
Task List helps organize project
tasks, assign resources and target
dates, and track your progress.
The project plan comes populated
with every activity in the project
blueprint. Before you proceed, identify
the tasks that will create the most
value to focus your efforts.
Use the tool to organize a do-it-
yourself project implementation or to
engage an analyst during a guided
implementation.

Info-Tech Research Group 19Info-Tech Research Group 19
Measure the value of a Guided Implementation (GI)
Engaging in GIs doesn’t just offer valuable project advice, it also results in
significant cost savings.
GI Measured Value*
Phase 1:
• Time, value, and resources saved by using Info-Tech’s methodology to engage
stakeholders, develop a project vision, and assess your current state.
• For example, 2 FTEs * 14 days * $80,000/year = $8,615
Phase 2:
• Time, value, and resources saved by using Info-Tech’s tools and templates to design the
consolidated service desk and evaluate cost and logistics.
• For example, 2 FTEs * 14 days * $80,000/year = $8,615
Phase 3:
• Time, value, and resources saved by following Info-Tech’s tools and methodology to build a
project roadmap and communications plan.
• For example, 2 FTE * 14 days * $80,000/year = $8,615
Phase 4:• Time, value, and resources saved by using Info-Tech’s methodology to engage
stakeholders, develop a project vision, and assess your current state.
• For example, 2 FTE * 14 days * $80,000/year = $8,615
Total savings $34,462
*Assuming 260 workdays in a year
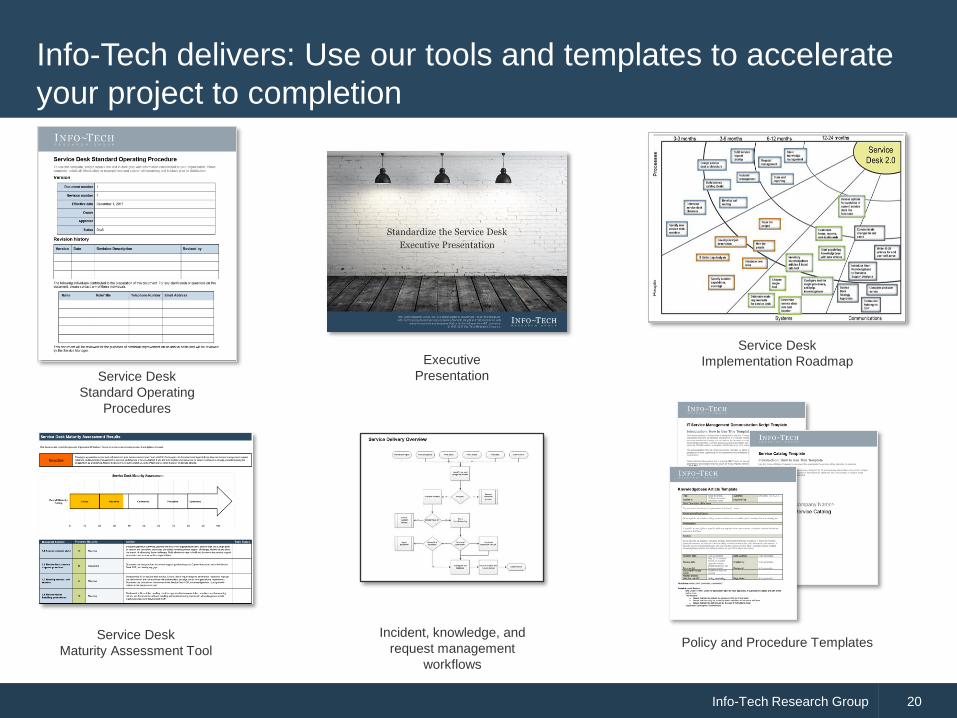
Info-Tech Research Group 20Info-Tech Research Group 20
Service Desk
Maturity Assessment Tool
Executive
Presentation
Service Desk
Implementation Roadmap
Info-Tech delivers: Use our tools and templates to accelerate
your project to completion
Service Desk
Standard Operating
Procedures
Policy and Procedure TemplatesIncident, knowledge, and
request management
workflows

Info-Tech Research Group 21Info-Tech Research Group 21
• Most organizations know it is good practice to have SOPs as
it improves consistency, facilitates process improvement, and
contributes to efficient operations.
• Though the benefits are understood, many organizations don't
have SOPs and those that do don't maintain them.
• Writing SOPs is the last thing most people want to do, so the
work gets pushed down the priority list and the documents
become dated.
• Promoting the use of SOPs can also face resistance as the
documentation is seen as time consuming to develop and
maintain, too convoluted to be useful, and generally out of date.
Implement a sustainable SOP documentation approach by doing the following:
• Create visual documents that can be scanned. Flowcharts, checklists, and diagrams are quicker to
create, take less time to update, and are ultimately more usable than a dense manual.
• Use simple but effective document management practices.
• Make SOPs part of your project deliverables rather than an afterthought. That includes checking
documentation status as part of your change management process.
Resolution
Situation
Complication
The project’s key deliverable is a service desk standard
operating procedure

Info-Tech Research Group 22Info-Tech Research Group 22
Document SOPs to improve knowledge transfer, optimize
processes, and, ultimately, save money
Benefits of documented SOPs Impact of undocumented/undefined SOPs
Improved training and knowledge transfer: Routine tasks
can be delegated to junior staff (freeing senior staff to work on
higher priority tasks).
Without documented SOPs: Tasks will be difficult to
delegate, key staff become a bottleneck, knowledge
transfer is inconsistent, and there is a longer
onboarding process for new staff.
IT automation, process optimization, and consistent
operations: Defining, documenting, and then optimizing
processes enables IT automation to be built on sound
processes, so consistent positive results can be achieved.
Without documented SOPs: IT automation built on
poorly defined, unoptimized processes leads to
inconsistent results.
Compliance: Compliance audits are more manageable
because the documentation is already in place.
Without documented SOPs: Documenting SOPs to
prepare for an audit becomes a major time-intensive
project.
Transparency: Visually documented processes answer the
common business question of “why does that take so long?”
Without documented SOPs: Other areas of the
organization may not understand how IT operates,
which can lead to confusion and unrealistic
expectations.
Cost savings: Work can be assigned to the lowest level of
support cost, IT operations achieve greater efficiency, and
expensive breakdowns are avoided.
Without documented SOPs: Work may be
distributed uneconomically, money may be wasted
through inefficient processes, and the organization is
vulnerable to costly disruptions.

Info-Tech Research Group 23Info-Tech Research Group 23
Workshop overview
Contact your account representative or email [email protected] for more information.
Pre-Workshop Workshop Day 1 Workshop Day 2 Workshop Day 3 Workshop Day 4
Ac
tivit
ies
Module 0: Gather
relevant data.
0.1 Interview service desk
management team.
0.2 Identify service desk
challenges.
0.3 Conduct CIO
Business Vision
Survey.
0.4 Conduct End-User
Satisfaction Survey.
Module 1: Conduct gap
analysis.
1.1 Assess service desk
challenges.
1.2 Review best service
support practices.
1.3 Identify service desk
metrics, benchmarks,
and reports.
1.4 Review ticket and call
handling procedures.
Module 2: Design
incident management.
2.1 Build incident and
critical incident
management
workflows.
2.2 Design ticket
categorization
scheme.
2.3 Design incident
escalation and
prioritization
guidelines.
Module 3: Design request
fulfilment.
3.1 Prepare for a self-
service portal project.
3.2 Build request
workflows.
3.3 Build a targeted
knowledgebase
Module 4: Build project
implementation plan.
4.1 Identify ITSM tool
requirements.
4.2 Build a
communication plan.
4.3 Build an
implementation
roadmap.
Deli
ve
rab
les
1. Workshop scope and
schedule
2. End-User Satisfaction
Survey Diagnostic
Results
1. Service desk
challenges
2. Shift-left service
support strategy
3. Service desk metrics
and reports
4. KB articles: ticket
handling and
troubleshooting
5. QA ticket and call
testing checklist
1. Incident and critical
incident management
workflows
2. Ticket categorization
scheme
3. Ticket escalation and
prioritization guidelines
1. Self-service portal
examples
2. Distinguishing criteria
for requests and
projects
3. Service request
workflows and SLAs
4. Knowledgebase article
template, processes,
and workflows
1. ITSM tool requirements
and vendor shortlist
2. Project communication
plan and executive
presentation.
3. Project implementation
roadmap

Info-Tech Research Group 24Info-Tech Research Group 24
Info-Tech Research Group, Inc. is a global leader in providing IT research and advice.
Info-Tech’s products and services combine actionable insight and relevant advice with
ready-to-use tools and templates that cover the full spectrum of IT concerns.
© 1997-2018 Info-Tech Research Group Inc.
PHASEConduct Gap Analysis
1
Standardize the Service Desk

Info-Tech Research Group 25Info-Tech Research Group 25
Step 1.1: Assess current state
This step will walk you
through the following
activities:
This step involves the
following participants:
1.1.1 Outline service desk
challenges
1.1.2 Review diagnostic results
• Project Sponsor
• IT Director, CIO
• IT Managers and Service
Desk Manager(s)
• Representation from tier 2
and tier 3 specialists
Alignment on the challenges that the service desk faces, an
assessment of the current state of service desk processes and
technologies, and baseline metrics against which to measure
improvements.
Outcomes
DELIVERABLES
• Current State Assessment
• End-User Satisfaction
Diagnostic Survey
• CIO Business Vision
Diagnostic Survey
Phase 1:
Conduct gap analysis
Review best service
support practices
Assess service desk challenges
1.2
1.1
Identify metrics and
reports1.3
Review ticket
handling procedures1.4

Info-Tech Research Group 26Info-Tech Research Group 26
Build the service desk from the ground up; this process focus must precede tools and framework adoption
A recent study of 623 organizations across different countries and
industries found that the most frequently adopted service
management processes were:
• Incident management (94.86%)
• Change management (87.96%)
• Problem management (71.11%)1
However, not all organizations that adopt ITSM practices are
experiencing positive outcomes. While most IT organizations had
pockets of maturity, process improvement tools CIOs embrace often
yield limited and sometimes negative results.
In some cases, enterprises pay more attention to ITSM tool selection
and implementation, but neglect the supporting service desk
processes.2
Technologies
Service
Desk
Foundations
1 – Marrone et al., 2014
2 – Tang and Todo, 2013
Don’t be fooled. A new service desk tool alone won’t solve your challenges. Most tools support service management best
practices, but those practices must be built from the ground up. Start by taking a snapshot of your existing service desk,
with all of its strengths and growing edges, and then build an organizational structure to support process improvements.
Best-practice frameworks offer accepted approaches that
reduce operating costs and improve end-user satisfaction.
But the right foundation must be laid first.

Info-Tech Research Group 27Info-Tech Research Group 27
The CIO of Westminster College took stock of existing processes before moving to empower the “helpless desk”
When he joined Westminster College as CIO in 2006,
the department faced a number of infrastructure
challenges, including:
• An unreliable network
• Aging server replacements and no replacement plan
• IT was the “department of no”
• A help desk known as the “helpless desk”
• A lack of wireless connectivity
• Internet connection speed that was much too slow
Case StudyScott Lowe helped a small staff of eight IT
professionals formalize service desk processes and
increased the amount of time available for projects.
He addressed the infrastructure challenges in part by analyzing IT’s routine processes.
Internally, IT had inefficient support processes that reduced the amount of time they could spend on projects.
They undertook an internal process analysis effort to identify processes that would have a return on investment if they
were improved. The goal was to reduce operational support time so that project time could be increased.
Five years later, they had a better understanding of the organization's operational support time needs and were able to
shift workloads to accommodate projects without compromising support.
Fully-loaded
staff
Constant
shift between
support and
project work
Some weeks, staff spent 80% of
their time working on projects.
Other weeks, support
requirements might leave only
10% for project work.
The project load of IT staff increased,
with new projects coming in every day.
With a long project list, it became
increasingly important to improve the
transparency of project request and
prioritization.
As the CIO investigated how to address the
infrastructure challenges, he realized people cared
deeply about how IT spent its time.

Info-Tech Research Group 28Info-Tech Research Group 28
Sketch out service desk challenges to shape the direction of the standardization project
• Low business satisfaction
o Users are unable to get assistance with IT services quickly.
o Users go to their favorite technician instead of using the service desk.
• High cost to resolve
o Tier 2 and tier 3 resolve issues that should be resolved at tier 1.
o Tier 2 and tier 3 often interrupt projects to focus on service support.
• Unresolved issues
o Tickets are not created for all incidents.
o Tickets are lost or escalated to the wrong technicians.
o Poor data impedes root-cause analysis of incidents.
• Poor planning
o Lack of data for effective trend analysis leads to poor demand planning.
o Lack of data leads to lost opportunities for templating and automation.
• Lost resources or accountability
o Lack of cross-training and knowledge sharing.
o Lack of skills coverage for critical applications and services.
o Time wasted troubleshooting recurring issues.
o Reports unavailable due to lack of data and ineffective categorization.
Service desk performance is driven by
supply and demand.
Immature service desks often lack the
processes and technologies to provide a
consistent supply or measure and respond
to shifts in demand over time.
An efficient, cost-effective service desk
represents an equilibrium: the point at
which the competing forces of supply and
demand are optimized.
A shift in supply or demand can move the
state of equilibrium beyond the reach of
the service desk and undermine its
performance.
Common supply issues:
• Cap on staffing to control cost.
• Inadequate outsourcing relationship.
Common demand issues:
• Growth of end-user base.
o Increase in contacts per end user.
o Increased IT usage in IT.
Common Service Desk Challenges

Info-Tech Research Group 29Info-Tech Research Group 29
Outline the organization’s service desk challenges
1.1.1 Time Allotment: 45 minutes
As a group, outline the service desk challenges facing the organization.
Use the previous slide or the following word cloud to help you get
started:
A
Brainstorm service desk challenges
Document challenges and metrics in the Service Desk Executive
Presentation.C
• CIO
• IT Managers
• Service Desk Manager
• Service Desk Agents
Participants
BIf you get stuck, use the short Service Desk Maturity Assessment to get
a quick view of your challenges and maturity targets and kick-start the
conversation.

Info-Tech Research Group 30Info-Tech Research Group 30
Data
–D
riven
Dia
gn
osti
cs
Solicit direct feedback from the organization to gain critical insights into
their perceptions of IT.
• CIO Business Vision: Understand the needs of your stakeholders
before you begin the standardization project. Use the results of this
survey to assess the satisfaction and importance of different IT
services.
• End-User Satisfaction: Solicit targeted department feedback on
core IT service capabilities, IT communications, and business
enablement. Use the results to assess the satisfaction of end users,
with each service broken down by department and seniority level.
We recommend completing at least the End-User Satisfaction Survey
as part of your service desk current-state assessment. An analyst will
help you set up the diagnostic and walk through the report with you.
To book a diagnostic, or get a copy of our questions to inform your own
survey, visit Info-Tech’s Benchmarking Tools, contact your account
manager, or call toll-free 1-888-670-8889 (US) or 1-844-618-3192
(CAN).
Expect the diagnostic process to take three to four weeks from the
moment you book the call to the moment you receive the results.
Don’t base your standardization on a hunch.
Gather reliable data to assess the current state.
Collect relevant quantitative and qualitative data to assess the current state of your service desk
End-User Satisfaction Survey
CIO Business Vision
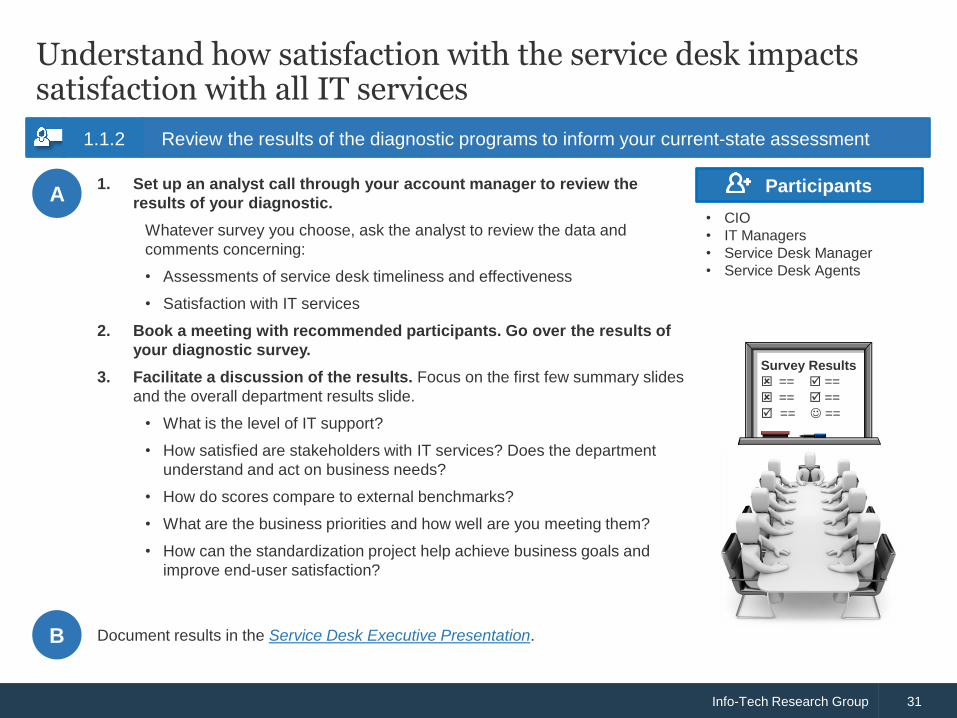
Info-Tech Research Group 31Info-Tech Research Group 31
Understand how satisfaction with the service desk impacts satisfaction with all IT services
1.1.2 Review the results of the diagnostic programs to inform your current-state assessment
1. Set up an analyst call through your account manager to review the
results of your diagnostic.
Whatever survey you choose, ask the analyst to review the data and
comments concerning:
• Assessments of service desk timeliness and effectiveness
• Satisfaction with IT services
2. Book a meeting with recommended participants. Go over the results of
your diagnostic survey.
3. Facilitate a discussion of the results. Focus on the first few summary slides
and the overall department results slide.
• What is the level of IT support?
• How satisfied are stakeholders with IT services? Does the department
understand and act on business needs?
• How do scores compare to external benchmarks?
• What are the business priorities and how well are you meeting them?
• How can the standardization project help achieve business goals and
improve end-user satisfaction?
• CIO
• IT Managers
• Service Desk Manager
• Service Desk Agents
Participants
Document results in the Service Desk Executive Presentation.B
A
Survey Results
== ==
== ==
== ☺ ==

Info-Tech Research Group 32Info-Tech Research Group 32
Assess current service desk maturity to establish a baseline and create a plan for service desk improvement
Rob England
IT Consultant & Commentator
Owner Two Hills
Also known as The IT Skeptic
Expert Insight A current-state assessment will help you build a foundation for process
improvements. Current-state assessments follow a basic formula:
1. Determine the current state of the service desk.
2. Determine the desired state of the service desk.
3. Build a practical path from current to desired state.
“How do you know if you aren’t mature enough? Nothing – or everything – is recorded and tracked, customer satisfaction is low, frustration is high, and there are multiple requests and incidents that nobody ever bothers to address.”
(1)
Assess
Current
State
(2)
Assess
Target
State
Cu
rren
t
Desir
ed
(3) Build a Roadmap
Ideally, the current-state assessment should align the delivery of IT services
with organizational needs. The assessment should achieve the following goals:
1. Identify service desk pain points.
2. Map each pain point to business services.
3. Assign a broad business value to resolution of each pain point.
4. Map each pain point to a process.

Info-Tech Research Group 33Info-Tech Research Group 33
Assess the process maturity of the service desk to determine which project phase and steps will bring the most value
Measure which activity will have the greatest impact
The Service Desk Maturity Assessment Tool helps organizations
assess their service desk process maturity and focus the project on
the activities that matter most.
The tool will help guide process improvement efforts and measure
your progress.
• The second tab of the tool walks through is a qualitative
assessment of your service desk processes. The assessment is
organized into typical process areas. Questions will prompt you to
rate the extent to which you are executing key activities. Select the
answer in the drop-down menus provided that reflect the degree to
which you agree with each statement.
• The third tab displays your rate of process completeness and
maturity. You will receive a score for each phase, an overall score,
and advice based on your performance.
• Document the results of the efficiency assessment in the Service
Desk Executive Presentation.
The tool is intended for periodic use. Review your answers each year,
and devise initiatives to improve the process performance where you
need it most.
Where do I find the data?
Consult:
• Service Manager
• Service Desk Tools

Info-Tech Research Group 34Info-Tech Research Group 34
Step 1.2: Establish target state
This step will walk you
through the following
activities:
This step involves the
following participants:
1.2.1 Identify implications of a
shift-left service support strategy
• Project Sponsor
• IT Director, CIO
• IT Managers and Service
Desk Manager(s)
• Representation from tier 2
and tier 3 specialists
Alignment on the challenges that the service desk faces, an
assessment of the current state of service desk processes and
technologies, and baseline metrics against which to measure
improvements.
Outcomes
DELIVERABLES
• Shift-left strategy
• List of necessary service
desk improvements
Phase 1:
Conduct gap analysis
Review best service
support practices
Assess service desk challenges
1.2
1.1
Identify metrics and
reports1.3
Review ticket
handling procedures1.4

Info-Tech Research Group 35Info-Tech Research Group 35
Everyone in IT contributes to the success of service support
If you try to standardize service desk processes without engaging specialists in
other parts of the IT organization, you will fail. Everyone in IT has a role to play
in providing service support and meeting service-level agreements.
Regardless of the service desk structure chosen to meet an organization’s service
support requirements, IT staff should be in no doubt about the role they play in
service support.
Specialists tend to distance themselves
from service support as they progress
through their career to focus on projects.
However, their cooperation is critical to the
success of the new service desk. Not only
do they contribute to the knowledgebase,
they also handle escalations from tiers 1
and 2.
Service Support Engagement Plan
• Identify who is accountable for different service support processes.
• Outline the different responsibilities of service desk agents at tier 1, tier 2,
and tier 3 in meeting service-level agreements for service support.
• Draft operational-level agreements between specialty groups and the
service desk to improve accountability.
• Configure the service desk tool to ensure ticket visibility and ownership
across queues.
• Engage tier 2 and tier 3 resources in building workflows for incident
management, request fulfilment, and writing knowledgebase articles.
• Emphasize the benefits of cooperation across IT silos:
o Better customer service and end-user satisfaction.
o Shorter time to resolve incidents and implement requests.
o A higher tier 1 resolution rate, more efficient escalations, and fewer
interruptions from project work.
Info-Tech Research Group 36Info-Tech Research Group 36
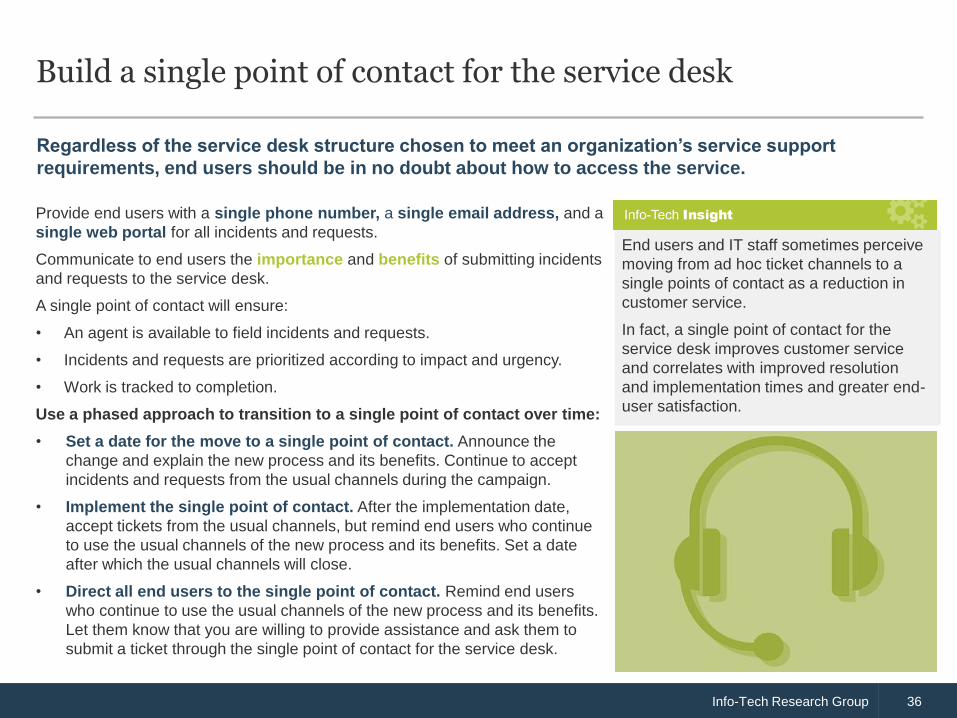
Regardless of the service desk structure chosen to meet an organization’s service support
requirements, end users should be in no doubt about how to access the service.
Build a single point of contact for the service desk
End users and IT staff sometimes perceive
moving from ad hoc ticket channels to a
single points of contact as a reduction in
customer service.
In fact, a single point of contact for the
service desk improves customer service
and correlates with improved resolution
and implementation times and greater end-
user satisfaction.
Provide end users with a single phone number, a single email address, and a
single web portal for all incidents and requests.
Communicate to end users the importance and benefits of submitting incidents
and requests to the service desk.
A single point of contact will ensure:
• An agent is available to field incidents and requests.
• Incidents and requests are prioritized according to impact and urgency.
• Work is tracked to completion.
Use a phased approach to transition to a single point of contact over time:
• Set a date for the move to a single point of contact. Announce the
change and explain the new process and its benefits. Continue to accept
incidents and requests from the usual channels during the campaign.
• Implement the single point of contact. After the implementation date,
accept tickets from the usual channels, but remind end users who continue
to use the usual channels of the new process and its benefits. Set a date
after which the usual channels will close.
• Direct all end users to the single point of contact. Remind end users
who continue to use the usual channels of the new process and its benefits.
Let them know that you are willing to provide assistance and ask them to
submit a ticket through the single point of contact for the service desk.

Info-Tech Research Group 37Info-Tech Research Group 37
Build a tiered generalist service desk to optimize costs and improve service
A tiered generalist service desk with a first-tier resolution rate greater than 60% has the best
operating cost and customer satisfaction of all competing service desk structural models.
Users
Phone
Walk-in
Web Portal
Sin
gle
ITS
M s
yste
m
Tier 1
Serv
ice D
esk
(Glo
ba
l Site
s, H
elp
De
sk,
De
sksid
e S
up
po
rt)
Tier 2/3
Security
Applications
Infrastructure
Generalists focused on first-
tier resolution.
Specialists split between
projects and support.
Web portal to support
self-service.
The tiered generalist model is about
48% more cost effective, saving
around $3.5M for an enterprise
producing just 1,000 calls per week.
The success of the tiered generalist
model depends on:
• Effective knowledge-sharing
processes between service desk
tiers.
• Clear ticket prioritization
guidelines.
• Efficient escalation procedures
based on service-level agreements.
• Clear service support metrics that
measure the service-level response
of all support groups.

Info-Tech Research Group 38Info-Tech Research Group 38
Use a shift-left strategy to lower service support costs, reduce average time to resolve, and improve end-user satisfaction
The shift-left strategy involves:
• Shifting service support tasks from specialists to generalists.
• Shifting service support tasks from generalists to self-service.
• Automating incident resolution.
Metrics Who resolves the incident?
Automated End User Tier 1 Generalist Tier 2 Specialist Vendor
Cost per ticket $ $$ $$$ $$$$ $$$$$
Average time to resolve
End-user satisfaction
Ticket volume
High
Medium
Low
In a typical organization, analysts resolve the majority of incidents.
Shift-left organizations resolve a majority of incidents automatically or through self-service.
Shift Left

Info-Tech Research Group 39Info-Tech Research Group 39
Work through the implications of adopting a shift-left strategy
1.2.1 Time Allotment: 45 minutes
As a group, review the results of the current-state assessment.
Which process gaps do you need to fill to identify ticket trends:
• What are your most common incidents and service requests?
• Which tickets could be resolved at tier 1?
• Which tickets could be resolved as self-service tickets?
• Which tickets could be automated?
A
Identify process gaps that you need to fill to support the shift-left strategy
Document the outcome of the conversation in the Service Desk
Executive Presentation.C
• CIO
• IT Managers
• Service Desk Manager
• Service Desk Agents
Participants
BWhich processes do you most need to improve to support a shift-left
strategy?
• How trustworthy is the data in your ticketing tool?
• What do you need to do to improve the quality of your data?
• Which incident and request processes are well documented?
• Do you have recurring tickets that could be automated?
• What is the state of your knowledgebase maintenance process?
• Which articles do you most need to support tier 1 resolution?
• What is the state of your web portal? How could it be improved to
support self-service?

Info-Tech Research Group 40Info-Tech Research Group 40
This step will walk you
through the following
activities:
This step involves the
following participants:
1.3 Create a list of required
reports to identify relevant
metrics
• Project Sponsor
• IT Managers and Service
Desk Manager(s)
• Representation from tier 2
and tier 3 specialists
Managers and analysts will have service desk metrics and reports
that help set expectations and communicate service desk
performance.
Outcomes
DELIVERABLES
• A list of service desk
performance metrics and
reports
Step 1.3: Identify service desk metrics and reports
Phase 1:
Conduct gap analysis
Review best service
support practices
Assess service desk challenges
1.2
1.1
Identify metrics and
reports1.3
Review ticket
handling procedures1.4

Info-Tech Research Group 41Info-Tech Research Group 41
Engage business unit leaders with data to appreciate needs
Presentation is everything:
If you are presenting outside of IT, or using
operational metrics to create strategic
information, be prepared to:
• Discuss trends.
• Identify organizational and departmental
impacts.
• Assess IT costs and productivity.
“Number of incidents with ERP system has
decreased by 5% after our last patch
release. We are working on the next set of
changes and expect the issues to continue
to decrease.”
Service desk reports are an opportunity to communicate the story of IT and collect stakeholder feedback.
Interview business unit leaders and look for opportunities to improve IT services.
Start with the following questions:
• What are you hearing from your team about working with IT?
• What are the issues that are contributing to productivity losses?
• What are the workarounds your team does because something isn’t
working?
• Are you able to get access to the information you need?
Work with business unit leaders to develop an action plan.
Remember to communicate what you do to address stakeholder
grievances.
The service recovery paradox is a situation in which end users think more
highly of IT after the organization has corrected a problem with their service,
compared to how they would regard the company if the service had not been
faulty in the first place.
The point is that addressing issues (and being seen to address issues) will
significantly improve end-user satisfaction. So communicate that you’re
listening and acting, and you should see satisfaction improve.

Info-Tech Research Group 42Info-Tech Research Group 42
Engage technicians to ensure they input quality data in the service desk tool
You need better data to address problems. Communicate to the technical team what
you need from them and how their efforts contribute to the usefulness of reports.
Service Desk Manager: Technical staff can help themselves analyze the
backlog and improve service metrics if they’re looking at the right
information. Ensure their service desk dashboards are helping them identify
high-priority and quick-win tickets, and anticipate potential SLA breaches.
Tickets MUST:
• Be created for all incidents and service
requests.
• Be categorized correctly, and categories
updated when the ticket is resolved.
• Be closed after the incidents and service
requests are resolved or implemented.
Emphasize that reports are analyzed regularly
and used to manage costs, improve services,
and request more resources.

Info-Tech Research Group 43Info-Tech Research Group 43
Produce service desk reports targeted to improve IT services
Tickets capture a lot of information, which ITSM tools turn into dashboards and
reports, but producing reports alone won’t improve IT services. The first step is
figuring out what problem you want to solve.
Use metrics and reports to tell the story of IT.
• Metrics should be tied to business requirements. They should
tell the story of how well IT is meeting those requirements, and
help identify when obstacles get in the way.
• The latter can be done by pointing to discrepancies between the
actual internal metrics, the internal metrics you expected to
reach but perhaps didn’t, and external metrics that you trust.
• Tailor metrics and reports to specific stakeholders.
o Technicians require mostly real-time information in the
form of a dashboard, ensuring they have visibility into a
prioritized list of tickets for which they are responsible.
o Supervisors need tactical information to manage the
team and set client expectations, as well as track and
meet strategic goals.
o Managers and executives need summary information
that supports strategic goals. Start by looking at
executive goals for the support team, then working
through some of the more tactical data that will help to
support those goals.
Take external metrics with a grain of salt.
First, most benchmarks represent what
service desks actually do across different
industries, not what they should do.
Second, there might be significant differences
between different industries in terms of the
kinds of tickets they deal with, differences
which the overall average obscures.
Use external metrics as a starting point, then
establish relevant internal metrics and track
historical trends.
Info-Tech Research Group 44Info-Tech Research Group 44
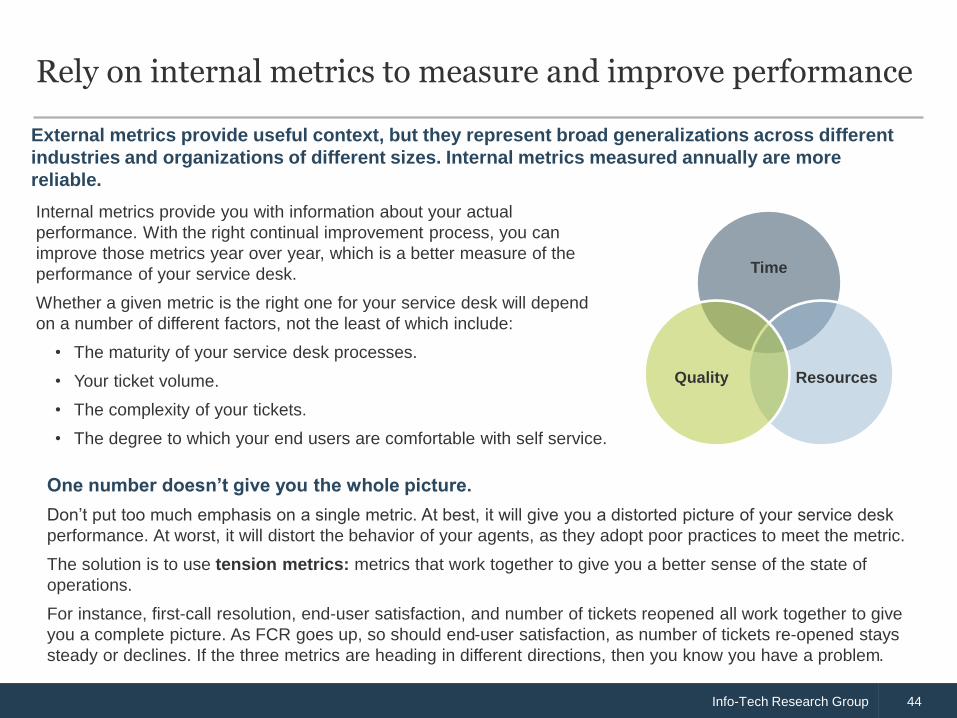
Rely on internal metrics to measure and improve performance
Internal metrics provide you with information about your actual
performance. With the right continual improvement process, you can
improve those metrics year over year, which is a better measure of the
performance of your service desk.
Whether a given metric is the right one for your service desk will depend
on a number of different factors, not the least of which include:
• The maturity of your service desk processes.
• Your ticket volume.
• The complexity of your tickets.
• The degree to which your end users are comfortable with self service.
External metrics provide useful context, but they represent broad generalizations across different
industries and organizations of different sizes. Internal metrics measured annually are more
reliable.
Time
ResourcesQuality
One number doesn’t give you the whole picture.
Don’t put too much emphasis on a single metric. At best, it will give you a distorted picture of your service desk
performance. At worst, it will distort the behavior of your agents, as they adopt poor practices to meet the metric.
The solution is to use tension metrics: metrics that work together to give you a better sense of the state of
operations.
For instance, first-call resolution, end-user satisfaction, and number of tickets reopened all work together to give
you a complete picture. As FCR goes up, so should end-user satisfaction, as number of tickets re-opened stays
steady or declines. If the three metrics are heading in different directions, then you know you have a problem.

Info-Tech Research Group 45Info-Tech Research Group 45
Select a few meaningful metrics that tell the story of IT and introduce them to end users to begin setting expectations
The right metrics can tell the business how hard IT works, and how many
resources it needs to perform. If you’re new to service desk metrics focus
on tension metrics that capture the triad of resources, time, and quality.
Remember, metrics should
be tied to business
requirements.
Metrics tell the story of how
well IT is meeting those
requirements and help
identify when obstacles get
in the way.
The latter can be done by
pointing to discrepancies
between the internal metrics
you expected to reach but
didn’t, and external metrics
you trust.
1. End-User Satisfaction
The most important metric for measuring the perceived value of the Service Desk.
Determined on the basis of a robust annual satisfaction survey of end users and
transactional satisfaction surveys sent with a percentage of tickets.
2. Ticket Volume and Cost per Ticket
A key indicator of service desk efficiency. Along with end-user satisfaction, it is generally
considered to be the most indicative of metrics. Computed as the monthly operating
expense divided by the average ticket volume per month (incidents + service requests).
Report ticket volume by department or ticket category, and include a brief historical trend
for context.
3. First-Contact Resolution (FCR) Rate
FCR is the single biggest driver of end-user satisfaction. A measure of the percentage of
tickets resolved during the Service Desk's first contact with an end user (i.e. before they
hang up or within an hour of email or self-reporting, regardless of escalation).
Depending on the kind of tickets you deal with, you can measure first-contact resolution,
first-tier resolution, or first-day resolution.
4. Average Time to Resolve (incidents) or Fulfil (service requests)
An assessment of the Service Desk's ability to resolve tickets effectively. Measures the
time elapsed between the moment the ticket status is set to “open” and the moment it is
set to “resolved”. We recommend distinguishing between ticket resolution and ticket
closure and measuring resolution time for incidents and service requests separately.
Info-Tech Research Group 46Info-Tech Research Group 46
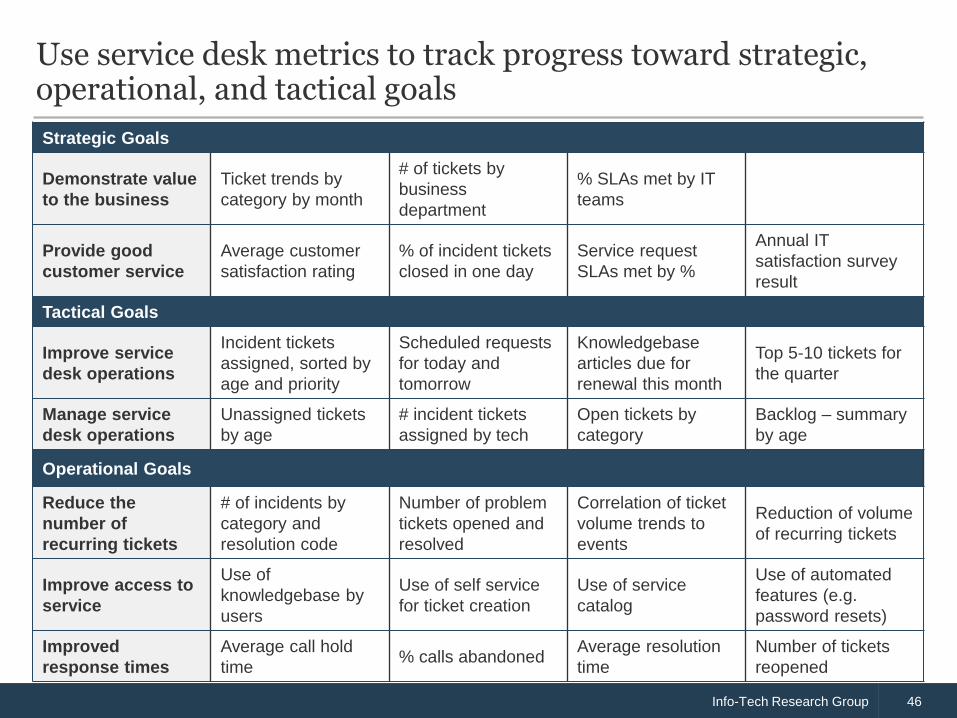
Use service desk metrics to track progress toward strategic, operational, and tactical goals
Strategic Goals
Demonstrate value
to the business
Ticket trends by
category by month
# of tickets by
business
department
% SLAs met by IT
teams
Provide good
customer service
Average customer
satisfaction rating
% of incident tickets
closed in one day
Service request
SLAs met by %
Annual IT
satisfaction survey
result
Tactical Goals
Improve service
desk operations
Incident tickets
assigned, sorted by
age and priority
Scheduled requests
for today and
tomorrow
Knowledgebase
articles due for
renewal this month
Top 5-10 tickets for
the quarter
Manage service
desk operations
Unassigned tickets
by age
# incident tickets
assigned by tech
Open tickets by
category
Backlog – summary
by age
Operational Goals
Reduce the
number of
recurring tickets
# of incidents by
category and
resolution code
Number of problem
tickets opened and
resolved
Correlation of ticket
volume trends to
events
Reduction of volume
of recurring tickets
Improve access to
service
Use of
knowledgebase by
users
Use of self service
for ticket creation
Use of service
catalog
Use of automated
features (e.g.
password resets)
Improved
response times
Average call hold
time% calls abandoned
Average resolution
time
Number of tickets
reopened

Info-Tech Research Group 47Info-Tech Research Group 47
Use key service desk metrics to build a business case for service support improvements
Many business cases are build on four key metrics:
• Ticket Volume
• Total Ticket Volume
• Ticket Volume by Tier
• Average Ticket Resolution Rate
• Average Resolution Rate by Ticket Type
• Cost per ticket
• Operational Costs / Ticket Volume
• (see previous slide for more details on the variables)
• Tier 1 Resolution Rate
• = Total tickets resolved / Tickets resolve at T1
For an example, see Build a Business Case for ITSM
Improvement, which is included on the Standardize the Service
Desk landing page.

Info-Tech Research Group 48Info-Tech Research Group 48
Service Desk Costs
Salaries and benefits
Indirect salaries andbenefits
Technologyexpenses
Telecommunicationexpenses
Facilities expenses
Travel, training, andoffice supplies
Cost per ticket is the total monthly operating
expense of the service desk divided by the monthly
ticket volume. Operating expense includes the
following components:
• Salaries and benefits for desktop support
technicians;
• Salaries and benefits for indirect personnel
(team leads, supervisors, workforce schedulers,
dispatchers, QA/QC personnel, trainers, and
managers);
• Technology expense (e.g., computers, software
licensing fees, etc.);
• Telecommunications expenses;
• Facilities expenses (e.g., office space, utilities,
insurance, etc.); and
• Travel, training, and office supplies.
Cost per ticket and customer satisfaction are the foundation metrics of service support
Ultimately, everything boils down to cost containment (measured by cost per ticket) and quality of service (measured by
customer satisfaction).
Cost per ticket is a measure of the efficiency of service support:
• A higher than average cost per ticket is not necessarily a bad thing, particularly if accompanied by higher-than-average
quality levels.
• Conversely, a low cost per ticket is not necessarily good, particularly if the low cost is achieved by sacrificing quality of
service.

Info-Tech Research Group 49Info-Tech Research Group 49
Reports will provide a picture of ticket distribution by staff and tiers – set goals if numbers don’t meet expectations
• Are the tickets distributed evenly among support
staff?
• Do the numbers support the plan?
• Keep in mind that quick solutions will mean more
tickets, and more technically challenging issues will
have fewer tickets.
• Are technicians all getting the opportunity to develop
their troubleshooting skills?
• Typically tier 1 should have the most tickets and tier 3
the least.
• Do these numbers match your support plan?
• Determine the target percentage for each group, and work
toward achieving it.
Info-Tech Research Group 50Info-Tech Research Group 50
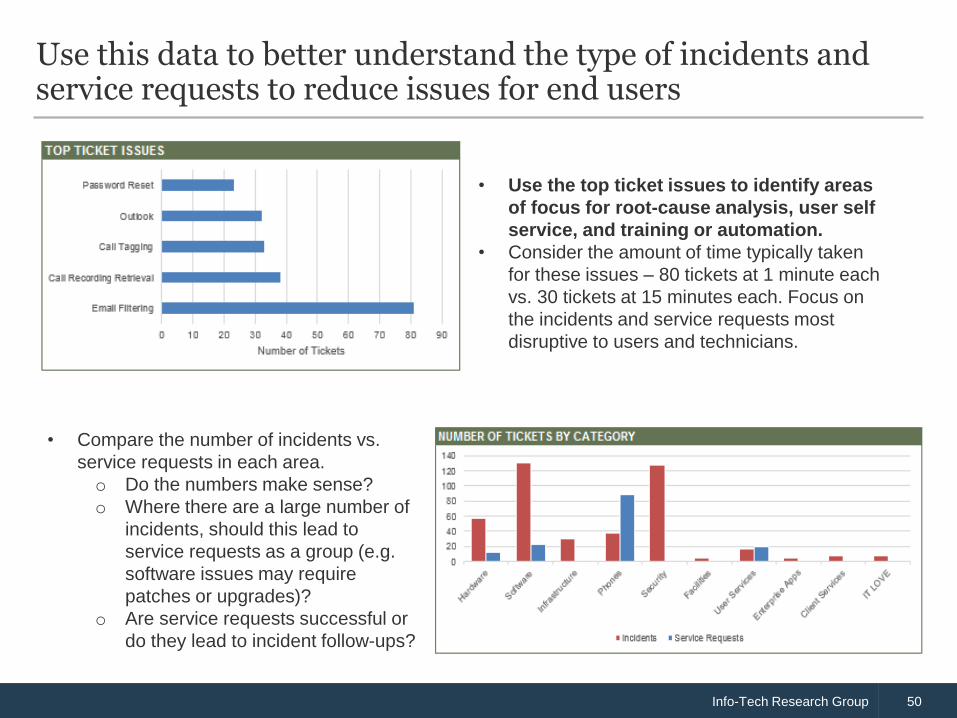
Use this data to better understand the type of incidents and service requests to reduce issues for end users
• Use the top ticket issues to identify areas
of focus for root-cause analysis, user self
service, and training or automation.
• Consider the amount of time typically taken
for these issues – 80 tickets at 1 minute each
vs. 30 tickets at 15 minutes each. Focus on
the incidents and service requests most
disruptive to users and technicians.
• Compare the number of incidents vs.
service requests in each area.
o Do the numbers make sense?
o Where there are a large number of
incidents, should this lead to
service requests as a group (e.g.
software issues may require
patches or upgrades)?
o Are service requests successful or
do they lead to incident follow-ups?
Info-Tech Research Group 51Info-Tech Research Group 51
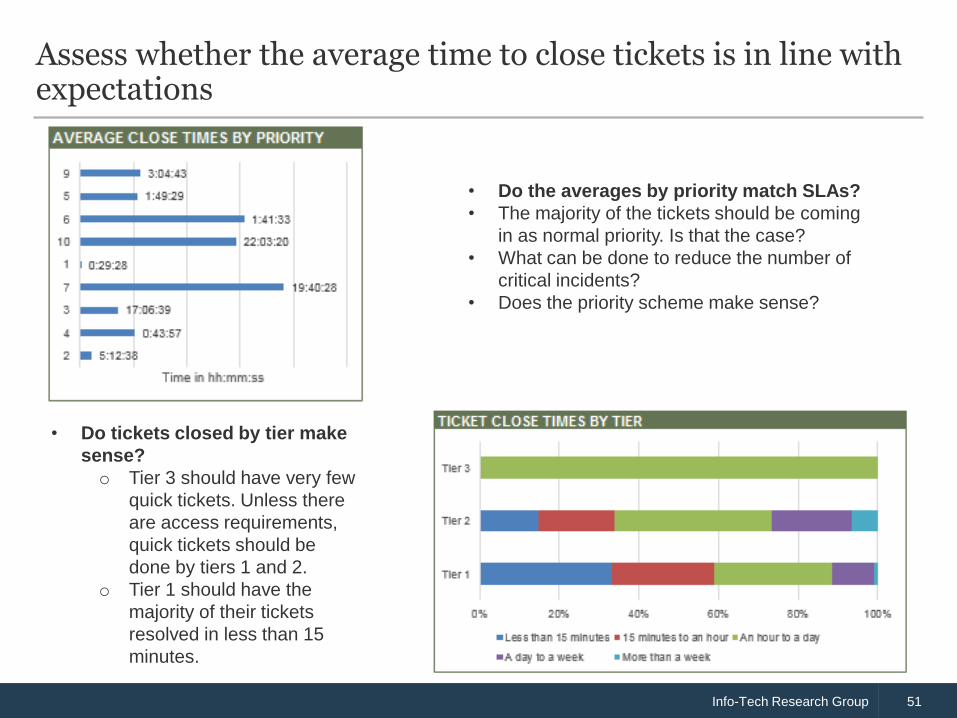
Assess whether the average time to close tickets is in line with expectations
• Do the averages by priority match SLAs?
• The majority of the tickets should be coming
in as normal priority. Is that the case?
• What can be done to reduce the number of
critical incidents?
• Does the priority scheme make sense?
• Do tickets closed by tier make
sense?
o Tier 3 should have very few
quick tickets. Unless there
are access requirements,
quick tickets should be
done by tiers 1 and 2.
o Tier 1 should have the
majority of their tickets
resolved in less than 15
minutes.

Info-Tech Research Group 52Info-Tech Research Group 52
Create a scorecard or dashboard to assess the performance of the service support organization
Service Desk
Performance
Metric
Metric Type Benchmark
Technician
Performance
Metric
Metric Type Benchmark
Cost per incident Resources $112Incidents closed
this monthResource 56.1
Cost per service
request
Resources$159
Service requests
closed this monthResource 22.0
Cost per ticket Resources $125
Average ticket end-
user satisfaction
rating
Quality 85.1%
Average ticket end-
user satisfaction ratingQuality 85.1%
First-tier resolution
rateTime 60%
Average time to
resolution (business
hours)
Time 9.6 business hoursUnplanned
absenteeismQuality -
Average time to fulfil
service requests
(business days)
Time 5.1 business days Teamwork Quality -
% of incidents resolved
in one business dayTime 35.7% Initiative Quality -
% Service request
fulfilled in three
business days
Time 26.2% Mentoring Quality -
First-tier resolution rate Quality 70%

Info-Tech Research Group 53Info-Tech Research Group 53
Create a list of required reports to identify metrics to track
1.3.1 Start by identifying the reports you need, then identify the metrics that produce them
• CIO
• IT Managers
• Service Desk Manager
• Service Desk Agents
Participants
• Service Desk SOP
• Flip Chart
• Whiteboard
What You’ll Need
1. Answer the following questions to determine the data your reports require:
• What strategic initiatives do you need to track?
Example: reducing mean time to resolve, meeting SLAs
• What operational areas need attention?
Example: recurring issues that need a permanent resolution
• What kind of issues do you want to solve?
Example: automate tasks such as password reset, software distribution
• What decisions or processes are held up due to lack of information?
Example: need to build a business case to justify infrastructure upgrades
• How can the data be used to improve services to the business?
Example: recurring issues by department
2. Document report requirements in Service Desk SOP. If the results represent a
significant change, document them in the Executive Presentation. Schedule a time
to revisit the requirements to ensure they still meet organizational needs.
3. Provide the list to your tool administrator to create reports with auto-distribution.

Info-Tech Research Group 54Info-Tech Research Group 54
This step will walk you
through the following
activities:
This step involves the
following participants:
1.4.1 Review ticket handling
practices
1.4.2 Identify opportunities to
automate ticket creation and
reduce recurring tickets
• Project Sponsor
• IT Managers and Service
Desk Manager(s)
• Representation from tier 2
and tier 3 specialists
Managers and analysts will have best practices for ticket handling
and troubleshooting to support ITSM data quality and improve first-
tier resolution.
Outcomes
DELIVERABLES
• List of ticket templates, and
recurring tickets.
• Ticket and Call QA
Template, and ticket
handling best practices.
• Shift-Handover Template.
Step 1.4: Review ticket handling procedures
Phase 1:
Conduct gap analysis
Review best service
support practices
Assess service desk challenges
1.2
1.1
Identify metrics and
reports1.3
Review ticket
handling procedures1.4

Info-Tech Research Group 55Info-Tech Research Group 55
Assign the following incident management roles and responsibilities to promote accountability
The role of incident manager is usually assigned to the service desk manager. In organizations with high
ticket volumes, a separate role may be necessary.
In both cases, everyone must recognize that incident management is a cross-IT organization process
and not uniquely a service desk process.
An incident manager is responsible for:
• Improving incident management
processes.
• Tracking metrics and producing
reports.
• Developing and maintaining the
incident management system.
• Developing and maintaining critical
incident processes.
• Ensuring the service support team
follows the incident management
process.
Tier 1: Service Desk
• Single point of contact for end users
during service disruptions.
• Point of coordination for IT groups
and processes.
Tier 2: Deskside Support
• Specialist group with additional time
to devote to diagnosis and resolution.
Tier 3:
• Specialists in internal technical group
or third-party suppliers.

Info-Tech Research Group 56Info-Tech Research Group 56
The phone should be the fastest way
to get help.
• Are enough agents answering calls?
• Are voicemails picked up on time?
• Are the automated call routing
prompts clear and concise? Does the
routing work?
• How many calls and emails are not
going through the service desk?
• Are end users contacting their
favorite technician directly instead?
Are walk-ins permitted and
formalized?
• If so, do you always have someone at
the desk? Is your equipment secure?
• Are walk-ins common because no
one picks up the phone or is the
traffic as you might expect given your
client base?
Ra
tio
na
lize
Tic
ke
t In
tak
e C
ha
nn
els
Start by reviewing the intake process.
• Ask are interacting with the IT team. Are they working with
your how the users processes? If not, why not? If so, are
they happy with them?”
Create alternative ways for users to seek help to manage the
volume of call intakes.
• Not every request is an emergency. Offering self service
resolution and ticket creation options will reduce the number
of agents you need on the phones.
Build a self service portal.
• Do end users know where to find the web portal?
• How many tickets are created through the self service portal?
• Does the self service interface identify how to create tickets
and access the knowledgebase?
Deal efficiently with email.
• How quickly are messages picked up?
• Are they manually transferred to a ticket or does the service
desk tool automatically create a ticket with a time stamp?
If end users are avoiding your service desk, you may
have an incident intake problem.
Start by reviewing the incident intake process to find opportunities for improvement
The two most traditional and fastest
methods to get help must deal with
emergencies and escalation effectively.

Info-Tech Research Group 57Info-Tech Research Group 57
Ensure technicians create tickets for all incidents and requests
Technician Calculations Benefit
Tier 2 and Tier 3 (T2 &
T3) Technicians
Calculate percentage of time supporting users
or team vs. completing projects.
• Make the case for reducing T2 and T3 ticket
volume.
• Understand the impact of service support on
project timelines.
T2 & T3 TechniciansUnderstand ticket types to determine which
support issues are most common.
• Focus training and documentation on tickets
that could be handled at a lower tier.
T1 & T2 TechniciansCalculate most common tickets to focus
process improvements.
• Create ticket templates and automate
escalations.
• Target knowledgebase articles on most
common tickets.
• Flag incident tickets for root-cause analysis.
T1, T2, & T3
Technicians
Calculate most common tickets to see which
applications and infrastructure components
need the most attention.
• Hire technicians to fill skill gaps.
• Create a business case for capacity,
development, and upgrades.
WHY COLLECT
TICKET DATA?
If a large number of tickets are missing, help service support staff
understand the need to collect the data.

Info-Tech Research Group 58Info-Tech Research Group 58
Use the ticket and call quality assessment tool to improve the quality of service desk data
Build a process to check-in on ticket and call quality monthly
Better data leads to better decisions. Use
the ticket quality assessment tool to
check-in on the ticket and call quality
monthly for each technician, and improve
the quality of service desk data.
1. Use the sample size calculator on Tab 2
to assess how many tickets and calls you
need to evaluate to get a representative
sample of service desk data quality for
each technician.
2. Use the questions on Tab 3 and Tab 4
to assess the quality of individual tickets.
Use the checklist in regular coaching
sessions with service desk analysts to
improve their performance over time.
3. Record the results on Tab 5 and Tab 6.
Info-Tech Research Group 59Info-Tech Research Group 59
• Create and update tickets, but not at the expense of
good customer service. Agents can start the ticket, but
shouldn’t spend five minutes creating the ticket when they
should be troubleshooting the problem.
• Update the ticket when the issue is resolved or needs to
be escalated. If agents are escalating, they should make
sure all relevant information is passed along to the next
technician.
• Update user of ETA if issue cannot be resolved quickly.
• Ticket templates for common incidents can lead to fast
creation, data input, and categorizations. Templates can
reduce the time it takes to create tickets from 2 minutes to
30 seconds.
Set expectations
Set ticket handling expectations to drive a consistent process
• Update categories to reflect the actual issue and resolution.
• Reference knowledgebase article or document steps taken to resolve the incident.
• Confirm incident is resolved with client.
• Close or resolve the ticket on time.

Info-Tech Research Group 60Info-Tech Research Group 60
Use ticket templates to make ticket creation, updating, and resolution more efficient
Name Department Autofill from AD
Phone Autofill from AD Location Autofill from AD
Date/Time Autofill Manager Autofill from AD
Assigned Tech Technician Name Critical User?
Status Drop Down: Open, Assigned, In Progress, On Hold, Resolved
Issue
Free form or drop down (triggers next autofill)
Type• Incident
• Service requestCategory
Autofill on
template
Sub-
categoryAutofill on template
Impact
• High
• Medium
• Low
Urgency
• High
• Medium
• Low
Priority
Autofill based on
Impact and
Urgency
SLAAutofill based on
priority
Cause
CodeDrop Down
Resolution
CodeAutofill on template
Description
Free form or autofill on template
Instructions
Email instructions or comments to user – can be automated based on template
Resolution
Free form or autofill on template
Resolution at Date/Time Resolved by Technician Name
Closed at Date/Time Closed by Technician Name
Contact info
pulled from AD
Issue should
trigger autofills
through
template
Automating
instructions to
user and
resolution steps
saves time

Info-Tech Research Group 61Info-Tech Research Group 61
Implement measures to improve ticket handling
1.4.1 Identify opportunities to automate ticket creation
• Service Desk Manager
• Service Desk Agents
Participants
• Flip Chart
• Whiteboard
What You’ll Need
1. Poll the team.
• How many are not creating tickets?
• How does incomplete data affect decision making?
• Calculate the impact of the missing data.
2. Discuss.
• Why is the team not creating tickets?
• How can we address those barriers?
• What are the expectations of management?
3. Brainstorm 5-10 good candidates for templates.
• What data can auto-fill?
• What will help process the ticket faster?
• What automations can we build to ensure a fast, consistent service?
Note:
• Ticket template name.
• Information that will auto-fill from Active Directory and other applications.
• Categories and resolution codes.
• Automated routing and email responses.
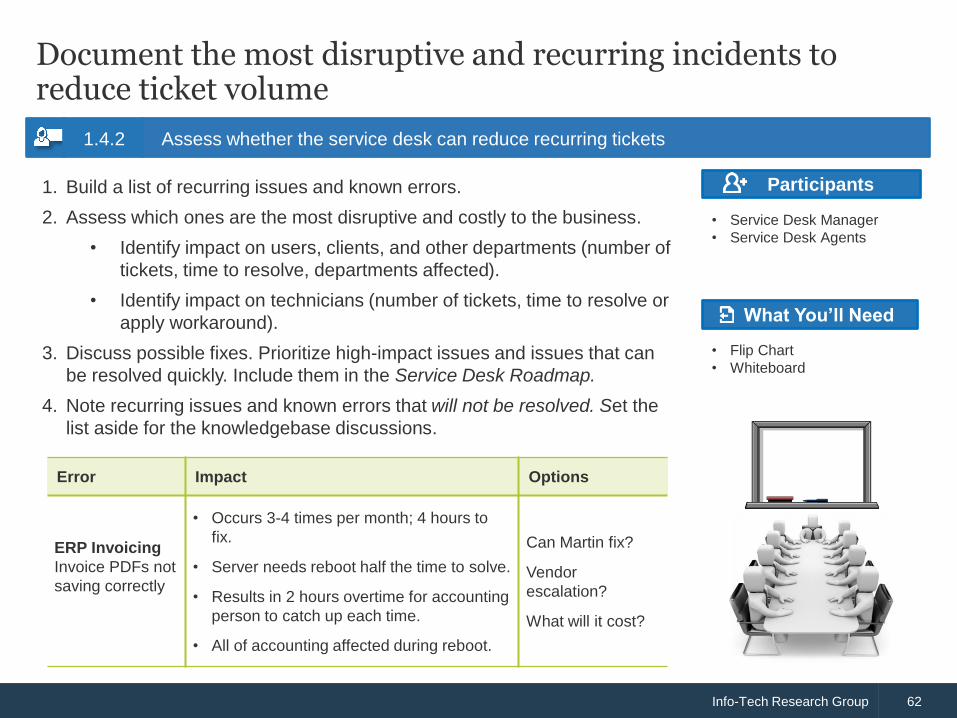
Info-Tech Research Group 62Info-Tech Research Group 62
Document the most disruptive and recurring incidents to reduce ticket volume
1.4.2 Assess whether the service desk can reduce recurring tickets
1. Build a list of recurring issues and known errors.
2. Assess which ones are the most disruptive and costly to the business.
• Identify impact on users, clients, and other departments (number of
tickets, time to resolve, departments affected).
• Identify impact on technicians (number of tickets, time to resolve or
apply workaround).
3. Discuss possible fixes. Prioritize high-impact issues and issues that can
be resolved quickly. Include them in the Service Desk Roadmap.
4. Note recurring issues and known errors that will not be resolved. Set the
list aside for the knowledgebase discussions.
Error Impact Options
ERP Invoicing
Invoice PDFs not
saving correctly
• Occurs 3-4 times per month; 4 hours to
fix.
• Server needs reboot half the time to solve.
• Results in 2 hours overtime for accounting
person to catch up each time.
• All of accounting affected during reboot.
Can Martin fix?
Vendor
escalation?
What will it cost?
• Service Desk Manager
• Service Desk Agents
Participants
• Flip Chart
• Whiteboard
What You’ll Need

Info-Tech Research Group 63Info-Tech Research Group 63
Phase 1 Guided Implementation
Guided Implementation 1: Conduct gap analysisProposed Time to Completion: 4 Weeks
Step 1.1: Assess service desk
challenges
Step 1.2: Review best service
support practices
Step 1.3: Identify metrics and
reports
Step 1.4: Review ticket handling
practices
Start with an analyst kick off call:
• Scope the project.
• Set up diagnostics.
• Conduct assessment.
Review findings with analyst:
• Discuss implications of a shift-left
service support strategy.
Review findings with analyst:
• Discuss distribution of service
support roles and responsibilities.
Review findings with analyst:
• Review ticket handling challenges.
Then complete these activities…
• Outline challenges.
• Review diagnostics.
• Review current state.
Then complete these activities…
• Identify implications of a shift-left
strategy for the direction of the
service desk.
Then complete these activities…
• Create a RACI chart.
• List service support roles.
• Review current task allocations.
• Conduct a skills gap analysis.
Then complete these activities…
• Automate ticket creation.
• Reduce recurring tickets.
With these tools & templates:
• Service Desk Maturity Assessment
• Executive Presentation
• Diagnostics
With these tools & templates:
• Executive Presentation
With these tools & templates:
• Service Desk SOP
With these tools & templates:
• Ticket Template
• Ticket Handling QA Template
• Knowledge base article for
troubleshooting and ticket handling
Phase 1 Insight: Don’t be fooled. A new service desk tool alone won’t solve your challenges. Most tools support service management
best practices, but those practices must be built from the ground up. Start by taking a snapshot of your existing service desk, with all of its
strengths and growing edges, and then build an organizational structure to support process improvements.
Call 1-888-670-8889 or email [email protected] for more information.
Complete these steps on your own, or call us to complete a guided implementation. A guided implementation is a series of
2-3 advisory calls that help you execute each phase of a project. They are included in most advisory memberships.
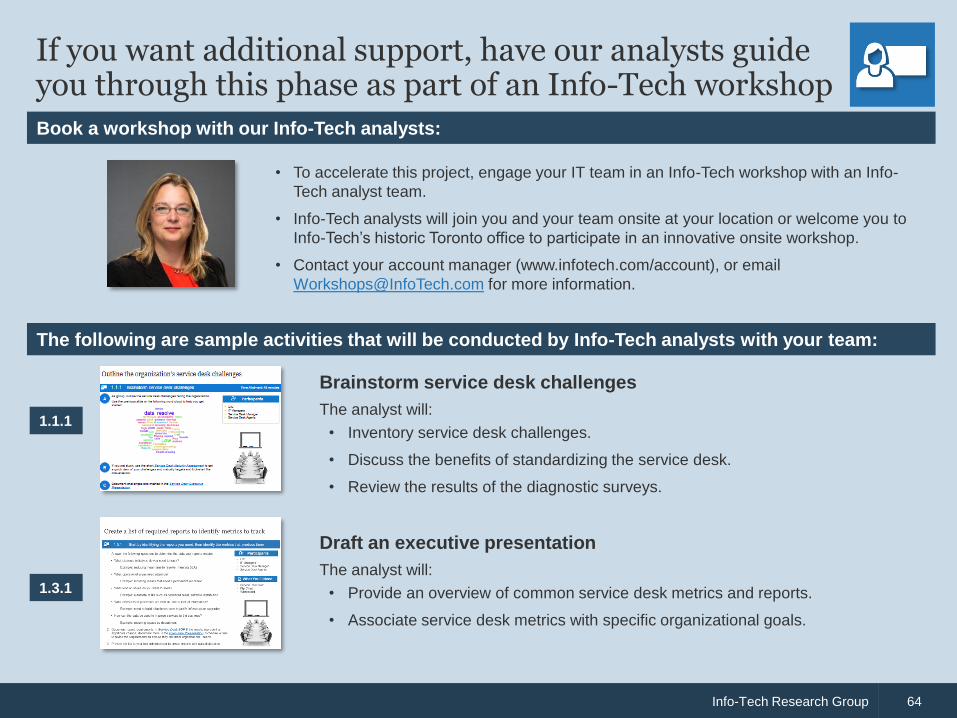
Info-Tech Research Group 64Info-Tech Research Group 64
If you want additional support, have our analysts guide you through this phase as part of an Info-Tech workshop
1.1.1
1.3.1
The following are sample activities that will be conducted by Info-Tech analysts with your team:
Book a workshop with our Info-Tech analysts:
• To accelerate this project, engage your IT team in an Info-Tech workshop with an Info-
Tech analyst team.
• Info-Tech analysts will join you and your team onsite at your location or welcome you to
Info-Tech’s historic Toronto office to participate in an innovative onsite workshop.
• Contact your account manager (www.infotech.com/account), or email
[email protected] for more information.
The analyst will:
• Inventory service desk challenges.
• Discuss the benefits of standardizing the service desk.
• Review the results of the diagnostic surveys.
Brainstorm service desk challenges
The analyst will:
• Provide an overview of common service desk metrics and reports.
• Associate service desk metrics with specific organizational goals.
Draft an executive presentation
Insert your
headshot
here

Info-Tech Research Group 65Info-Tech Research Group 65
Info-Tech Research Group, Inc. is a global leader in providing IT research and advice.
Info-Tech’s products and services combine actionable insight and relevant advice with
ready-to-use tools and templates that cover the full spectrum of IT concerns.
© 1997-2018 Info-Tech Research Group Inc.
PHASEDesign Incident Management Processes
2
Standardize the Service Desk

Info-Tech Research Group 66Info-Tech Research Group 66
Step 2.1: Build incident management workflows
Phase 2:
Design incident
management
Build incident management
workflows
2.2
2.1
Design ticket
categorization
Design incident
escalation and
prioritization
2.3
This step will walk you
through the following
activities:
This step involves the
following participants:
2.1.1 Review incident
management challenges
2.1.2 Define the incident
management workflow
2.1.3 Define the critical incident
management workflow
2.1.4 Design critical incident
communication plan
• IT Managers
• Service Desk Manager(s)
• Representation from tier 2
and tier 3 specialists
Workflows for incident management and critical incident
management will improve the consistency and quality of service
delivery and prepare the service desk to negotiate reliable service
levels with the organization.
Outcomes
DELIVERABLES
• Incident management
workflows
• Critical incident
management workflows
• Critical incident
communication plan

Info-Tech Research Group 67Info-Tech Research Group 67
Communicate the great incident resolution work that you do to improve end-user satisfaction
End users think more highly of IT after the organization has corrected a problem with their
service than they would have had the service not been faulty in the first place.
Use the service recovery paradox to your
advantage. Address service desk
challenges explicitly, develop incident
management processes that get services
back online quickly, and communicate the
changes.
If you show that the service desk
recovered well from the challenges end
users raised, you will get greater loyalty
from them.
Service Recovery Paradox
End-U
ser
Satisfa
ction
Time
Service Failure Service Recovery
End users without
service failures
End users with
service failure and
successful recovery
Info-Tech Research Group 68Info-Tech Research Group 68
The Director of IT Services invested in incident management to improve responsiveness and set end-user expectations
Practitioner InsightBen Rodriguez developed a progressive plan to create a responsive, service-oriented culture for
the service support organization.
When I joined the organization, there wasn’t a service desk. People just phoned, emailed, maybe left [sticky] notes for who they thought in IT would resolve it. There wasn’t a lot of investment in developing clear processes. It was ‘Let’s call somebody in IT.’
I set up the service desk to clarify what we would do for end users and to establish some SLAs.
I didn’t commit to service levels right away. I needed to see how many resources and what skill sets I would need. I started by drafting some SLA targets and plugging them into our tracking application. I then monitored how we did on certain things and established if we needed other skill sets. Then I communicated those SOPs to the business, so that ‘if you have an issue, this is where you go, and this is how you do it,’ and then shared those KPIs with them.
I had monthly meetings with different function heads to say ‘this is what I see your guys calling me about,’ and we worked on something together to make some of the pain disappear.
– Ben Rodrigues
Director, IT Services
Gamma Dynacare

Info-Tech Research Group 69Info-Tech Research Group 69
Sketch out incident management challenges to focus improvements
End Users
• No faith in the service desk beyond speaking with their favorite technician.
• No expectations for response or resolution time.
• Non-IT staff are disrupted as people ask their colleagues for IT advice.
Technicians
• No one manages and escalates incidents.
• Incidents are unnecessarily urgent and more likely to have a greater impact.
• Agents are flooded with requests to do routine tasks during desk visits.
• Specialist support staff are subject to constant interruptions.
• Tickets are lost, incomplete, or escalated incorrectly.
• Incidents are resolved from scratch rather than referring to existing solutions.
Managers
• Tickets are incomplete or lack historical information to address complaints.
• Tickets in system don’t match the perceived workload.
• Unable to gather data for budgeting or business analysis.
Consistent incident management
processes will improve end-user
satisfaction with all other IT services.
However, be prepared to overcome these
common obstacles as you put the
process in place, including:
• Absence of management or staff
commitment.
• Lack of clarity on organizational
needs.
• Outdated work practices.
• Poorly defined service desk goals
and responsibilities.
• Lack of a reliable knowledgebase.
• Inadequate training.
• Resistance to change.
Common Incident Management Challenges

Info-Tech Research Group 70Info-Tech Research Group 70
Prepare to implement or improve incident management
2.1.1 Review incident management challenges and metrics
• Service Desk Manager
• Service Desk Agents
Participants
• Service Desk SOP
• Flip Chart
• Whiteboard
What You’ll Need
1. Review your incident management challenges and the benefits of addressing them.
If necessary, refer to summaries included in the challenges, benefits, and process
flowchart in this section’s previous slides.
2. Review the level of service you are providing with the current resources. Define clear
goals and deliverables for the improvement initiative.
3. Decide how the incident management process will interface with the service desk.
Who will take on the responsibility for resolving incidents? Specifically, who will:
• Log incidents.
• Perform initial incident troubleshooting.
• Own and monitor tickets.
• Communicate with end users.
• Update records with the resolution.
• Close incidents.
• Implement next steps (e.g. initiate problem management).
4. Document recommendations in the Executive Presentation and the incident
management process requirements in the Service Desk SOP.
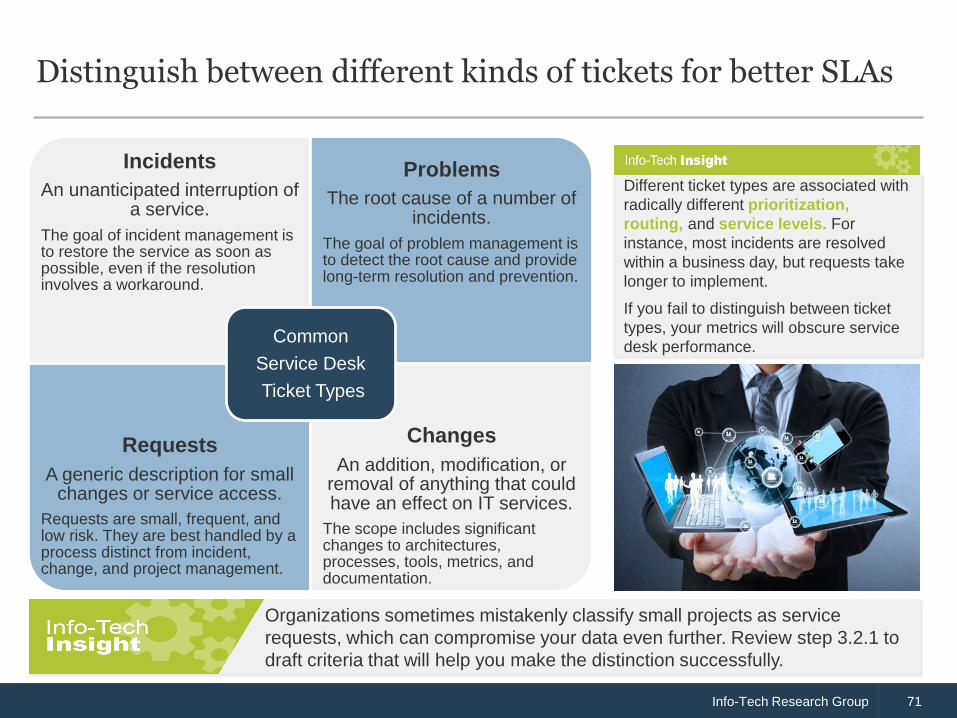
Info-Tech Research Group 71Info-Tech Research Group 71
Distinguish between different kinds of tickets for better SLAs
Different ticket types are associated with
radically different prioritization,
routing, and service levels. For
instance, most incidents are resolved
within a business day, but requests take
longer to implement.
If you fail to distinguish between ticket
types, your metrics will obscure service
desk performance.
Incidents
An unanticipated interruption of a service.
The goal of incident management is to restore the service as soon as possible, even if the resolution involves a workaround.
Problems
The root cause of a number of incidents.
The goal of problem management is to detect the root cause and provide long-term resolution and prevention.
Requests
A generic description for small changes or service access.
Requests are small, frequent, and low risk. They are best handled by a process distinct from incident, change, and project management.
Changes
An addition, modification, or removal of anything that could have an effect on IT services.
The scope includes significant changes to architectures, processes, tools, metrics, and documentation.
Common
Service Desk
Ticket Types
Organizations sometimes mistakenly classify small projects as service
requests, which can compromise your data even further. Review step 3.2.1 to
draft criteria that will help you make the distinction successfully.

Info-Tech Research Group 72Info-Tech Research Group 72
Separate incidents and service requests for increased customer service and better defined SLAs
Defining the differences between service requests and incidents is not just for reporting
purposes. It also has a major impact on how service is delivered.
Incidents will be prioritized based on
urgency and impact to the organization.Prioritization
Service requests will be scheduled and only
increase in prioritization if there is a request
process issue (e.g. we hired someone to start
today).
Track these and report on non-compliance.
Did incidents get resolved according to
prioritization rules?SLAs Did service requests get completed on time?
Incidents will typically need triage at the
service desk unless something is set up
to go directly to a specialist.
Routing of
calls or
tickets
Service requests don’t need triage (typically)
and can be routed automatically for approvals
and fulfillment.
Definitions:
• Incidents are unexpected disruptions to normal business processes and require attempts to restore
services as soon as possible (e.g. the printer is not working).
• Service requests are tasks that don’t involve something that is broken or has an immediate impact
on services. They do not require immediate resolution and can typically be scheduled (e.g. new
software application).

Info-Tech Research Group 73Info-Tech Research Group 73
Focus on the big picture first to capture and streamline how your organization resolves incidents
Incident inputs
• Incident details logged.
• Configuration details from the
configuration management database.
• Output from problem management
and known errors.
• Resolution details from other
incidents.
• Responses to requests for change.
Incident outputs
• Incident resolution and closure.
• Updated incident record and call log.
• Methods for workarounds.
• Communication with the user.
• Requests for change.
• Management information (reports).
• Input to problem management
process.
Identify, log, and categorize
incident
Request?
Request Fulfilment
ProcessYES
Prioritize incident
NO
Critical incident?
Critical Incident Process
NOTier 1
troubleshooting
Functional Escalation?
YESFunctional
Escalation Tier 2/3
NO
Investigate and Diagnose
YESHierarchical Escalation?
YESMgmt
Escalation
Resolve incident and recover
serviceClose incident
From event mgmt
From web portal
From email From phone From text From walk-in
YES
NO
Take this opportunity to re-evaluate how
you approach and resolve incidents.

Info-Tech Research Group 74Info-Tech Research Group 74
Document your incident management workflow to identify opportunities for improvement
Workflow should include:
• Ticket creation and closure
• Triage
• Troubleshooting
• Escalations
• Communications
• Change management
• Documentation
• Vendor escalations
Notes:
• Include both hierarchical
escalations to managers and
functional escalations to T2
and T3 specialists.
• If closing the ticket will
include a simple survey, take
advantage of the workflows
to send poor reviews to the
service manager for
immediate follow-up.
• Workflows for critical
incidents should follow a
different path.

Info-Tech Research Group 75Info-Tech Research Group 75
Collaborate to define each step of the incident management workflow
2.1.2 Time Allotment: 60 minutesDefine the incident management workflow
Option 1: Whiteboard
1. Discuss the workflow and draw it on the whiteboard.
2. Assess whether you are using the best workflow. Modify it if
necessary.
3. Engage the team in refining the process workflow.
4. Transfer data to Visio and add to the SOP.
Option 2: Table Top Exercise
1. Distribute index cards to each member of the team.
2. Have each person write a single task they perform on the index card.
Be granular. Include the title or the name of the person responsible.
3. Mark cards that are decision points. Use a card of a different color or
use a marker to make a colored dot.
4. Arrange the index cards in order, removing duplicates.
5. Assess whether you are using the best workflow. Engage the team to
refine it if necessary.
6. Transfer data to Visio and add to the Service Desk SOP and
Executive Presentation.
• Service Manager
• Service Desk Support
• Applications or
Infrastructure Support
Participants
• Flip Chart Paper
• Sticky Notes
• Pens
• Service Desk SOP
• Executive Presentation
What You’ll Need

Info-Tech Research Group 76Info-Tech Research Group 76
Add transactional end-user surveys to tickets at close to escalate unsatisfactory results
If a more complex survey is required, you may wish to include some of these questions:
Please rate your overall satisfaction with the way your issue was handled (1=unsatisfactory, 5=fantastic)
❑ The professionalism of the analyst.
❑ The technical skills or knowledge of the analyst.
❑ The timeliness of the service provided.
❑ The overall service experience.
Please rate your overall satisfaction with the way your issue was handled (1=unsatisfactory, 5=fantastic)
1 2 3 4 5
Comments:
Escalate these results to the service desk manager for
immediate follow-up.
A simple quantitative survey at the closing of a ticket can inform the service desk manager of any
issues that were not resolved to the end user’s satisfaction. Take advantage of workflows to
escalate poor results immediately for quick follow-up.
Add an open-ended, qualitative question to put the number in context, and solicit critical feedback:
What could the service desk have done to improve your experience?
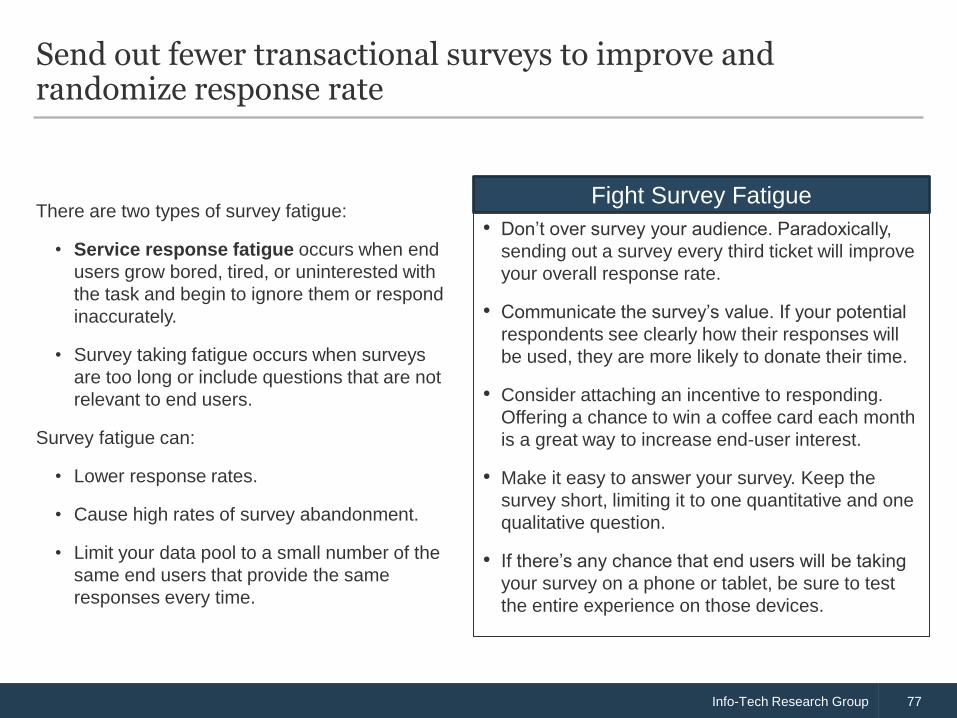
Info-Tech Research Group 77Info-Tech Research Group 77
Send out fewer transactional surveys to improve and randomize response rate
There are two types of survey fatigue:
• Service response fatigue occurs when end
users grow bored, tired, or uninterested with
the task and begin to ignore them or respond
inaccurately.
• Survey taking fatigue occurs when surveys
are too long or include questions that are not
relevant to end users.
Survey fatigue can:
• Lower response rates.
• Cause high rates of survey abandonment.
• Limit your data pool to a small number of the
same end users that provide the same
responses every time.
Fight Survey Fatigue
• Don’t over survey your audience. Paradoxically,
sending out a survey every third ticket will improve
your overall response rate.
• Communicate the survey’s value. If your potential
respondents see clearly how their responses will
be used, they are more likely to donate their time.
• Consider attaching an incentive to responding.
Offering a chance to win a coffee card each month
is a great way to increase end-user interest.
• Make it easy to answer your survey. Keep the
survey short, limiting it to one quantitative and one
qualitative question.
• If there’s any chance that end users will be taking
your survey on a phone or tablet, be sure to test
the entire experience on those devices.

Info-Tech Research Group 78Info-Tech Research Group 78
Formalize the process for critical incident management to reduce organizational impact
Discuss these elements to see how the organization will handle them.
• Communication plan:
It’s important to separate the role of the technician trying to solve a
problem with the need to communicate progress.
o Who communicates with end users?
o Who communicates with the executive team?
• Change management:
Define a separate process for regular and emergency change
management to ensure changes are timely and appropriate.
• Business continuity plan:
Identify criteria to decide when a business continuity plan (BCP) must
be implemented during a critical incident to minimize the business
impact of the incident.
• Post mortems:
Formalize the process of discussing and documenting lessons learned,
understanding outstanding issues, and addressing the root cause of
incidents.
• Source of incident notification:
Does the process change if users notify the service desk of an issue or
if the systems management tools alert technicians?
Critical incidents are high-
impact, high-urgency events that
put the effectiveness and
timeliness of the service desk
center stage.
Build a workflow that focuses on
quickly bringing together the
right people to resolve the
incident and reduces the
chances of recurrence.

Info-Tech Research Group 79Info-Tech Research Group 79
Document your critical incident management workflow to identify opportunities for improvement
Workflow should
include:
• Ticket creation and
closure
• Triage
• Troubleshooting
• Escalations
• Communications
plan
• Change
management
• Disaster recovery or
business continuity
plan
• Documentation
• Vendor escalations
• Post mortem

Info-Tech Research Group 80Info-Tech Research Group 80
Collaborate to define each step of the critical incident management workflow
2.1.3 Time Allotment: 60 minutesDefine the critical incident management workflow
Option 1: Whiteboard
1. Discuss the workflow and draw it on the whiteboard.
2. Assess whether you are using the best workflow. Modify it if
necessary.
3. Engage the team in refining the process workflow.
4. Transfer data to Visio and add to the SOP.
Option 2: Table Top Exercise
1. Distribute index cards to each member of the team.
2. Have each person write a single task they perform on the index
card. Be granular. Include the title or the name of the person
responsible.
3. Mark cards that are decision points. Use a card of a different
color or use a marker to make a colored dot.
4. Arrange the index cards in order, removing duplicates.
5. Assess whether you are using the best workflow. Engage the
team to refine it if necessary.
6. Transfer data to Visio and add to the Service Desk SOP.
• Service Manager
• Service Desk Support
• Applications or
Infrastructure Support
Participants
• Flip Chart Paper
• Sticky Notes
• Pens
• Service Desk SOP
What You’ll Need

Info-Tech Research Group 81Info-Tech Research Group 81
Establish a critical incident management communication plan
When it comes to communicating during major incidents, it’s important to get the information just right. Users don’t want too little, they don’t want too much, they just want what’s relevant to them, and they want that information at the right time.
As an IT professional, you may not have a background in communications,
but it becomes an important part of your job. Broad guidelines for good
communication during a critical incident are:
1. Communicate as broadly as the impact of your incident requires.
2. Communicate as much detail as a specific audience requires, but no
more than necessary.
3. Communicate as far ahead of impact as possible.
End users understand that sometimes
things break. What’s important to them is
that (1) you don’t repeatedly have the
same problem, (2) you keep them
informed, and (3) you give them enough
notice when their systems will be impacted
and when service will be returned.
Why does communication matter?
Sending the wrong message, at the wrong time, to the wrong stakeholders,
can result in:
• Drop in customer satisfaction.
• Wasted time and resources from multiple customers contacting you with
the same issue.
• Dissatisfied executives kept in the dark who can damage your reputation.
• Increased resolution time if the relevant providers and IT staff are not
informed soon enough to help.

Info-Tech Research Group 82Info-Tech Research Group 82
Automate communication to save time and deliver consistent messaging to the right stakeholders
You’ll need distinct messages for distinct
audiences. For example:
• To incident resolvers: “Servers X through Y
in ABC Location are failing intermittently.
Please test the servers and all the
connections to determine the exact cause so
we can take corrective action ASAP.”
• To the IT department head: “Servers X
through Y in ABC Location are failing
intermittently. We are beginning tests. We
will let you know when we have determined
the exact cause and can give you an
estimated completion time.”
• To executives: “We’re having an issue with
some servers at ABC Location. We are
testing to determine the cause and will let
you know the estimated completion time as
soon as possible.”
• To end users: “We are experience some
service issues. We are working on a
resolution diligently and will restore service
as soon as possible.”
Once templates are in place, when the incident occurs, it’s
simply a matter of:
1. Choosing the relevant template.
2. Updating recipients and messaging if necessary.
3. Adding specific, relevant data and fields.
4. Sending the message.
In the middle of resolving a critical incident, the last thing you have time for is worrying about crafting a
good message. Create a series of templates to save time by providing automated, tailored messages for
each stage of the process, which can be quickly altered and sent out to the right stakeholders.
When to communicate?
Tell users the information they need to know, when they need to know it. If
a user is directly affected by the failure, tell them what they need to know.
If the incident does not directly affect the user, the communication may
lead to decreased customer satisfaction or failure to pay attention to
future relevant messaging.
What to say?
• Keep messaging short and the point.
• Only say what you know for sure.
• Provide only the details the audience needs to know to take any
necessary action or steps on their side and no more. There’s no need
to provide details on the reason for the failure before it’s resolved,
though this can be done after resolution and restoration of service.

Info-Tech Research Group 83Info-Tech Research Group 83
Map out who will need to be contacted in the event of a critical incident
2.1.4 Design the critical incident communication plan
• Identify critical incidents that require
communication.
• Identify stakeholders who will need to be informed
about each incident.
• For each audience, determine:
1. Frequency of communication
2. Content of communication
Use the sample template to the right as an example.
Some questions to assist you:
• Whose work will be interrupted, either by their
services going down or by their workers having to
drop everything to solve the incident?
• What would happen if we didn’t notify this person?
• What level of detail do they need?
• How often would they want to be updated?
Document outcomes in the Service Desk SOP.
Unplanned service outage template
From: Service Desk
Subject: Issue with [KEY SERVICE NAME]
[KEY SERVICE NAME] is currently experiencing issues.
*[WHEN APPLICABLE] Specify which groups of people,
which platforms, and how the services are affected (for
example, slow, unavailable, some parts working and
others not).
*[WHEN APPLICABLE] Suggest workaround.
IT is currently working to resolve the issue. We will
provide an update as soon as we have more information.
[Additional sentences as needed to provide adequate
details on the impact of the outage.]
Thanks for your patience and understanding.
Service Desk

Info-Tech Research Group 84Info-Tech Research Group 84
Step 2.2: Design ticket categorization
This step will walk you
through the following
activities:
This step involves the
following participants:
2.2.1 Assess ticket
categorization
2.2.2 Enhance ticket categories
with resolution codes
• IT Managers
• Service Desk Manager(s)
• Representation from tier 2
and tier 3 specialists
The reviewed ticket categorization scheme will be easier to use
and deployed more consistently, which will improve the
categorization of data and the reliability of reports.
Outcomes
DELIVERABLES
• Optimized ticket
categorization
Phase 2:
Design incident
management
2.2
2.1
Design ticket
categorization
Design incident
escalation and
prioritization
2.3
Build incident management
workflows

Info-Tech Research Group 85Info-Tech Research Group 85
Design a ticket classification scheme to produce useful reports
Too many options cause confusion; too few options provide little
value. As you build the classification scheme over the next few slides,
let call routing and reporting requirements be your guide.
Effective classification schemes are concise, easy to use correctly,
and easy to maintain.
Reliable reports depend on an effective
categorization scheme.
Keep these guidelines in mind:
• A good categorization scheme is exhaustive and mutually exclusive: there’s a place for every ticket and every ticket fits
in only one place.
• As you build your classification scheme, ensure the categories describe the actual asset or service involved based on
final resolution, not how it was reported initially.
• Pre-populate ticket templates with relevant categories to dramatically improve reporting and routing accuracy.
• Use a tiered system to make the categories easier to navigate. Three tiers with 6-8 categories per tier provides up to
512 categories, which should be enough for the most ambitious team.
• Track only what you will use for reporting purposes. If you don’t need a report on individual kinds of laptops, don’t create
a category beyond “laptops.” Avoid “miscellaneous” categories. A large portion of your tickets will eventually end up
there.
Don’t do it alone! Collaborate with managers in the specialized IT groups responsible for root-cause
analysis to develop a categorization scheme that makes sense for them.

Info-Tech Research Group 86Info-Tech Research Group 86
The first approach to categorization breaks down the IT portfolio into asset types
Type Category Subcategory
WHY SHOULD I
START WITH
ASSETS?
Start with asset types if asset management and configuration
management processes figure prominently in your practice or on your
service management implementation roadmap.
Think about how you will use the data to determine which components need to be
included in reports. If components won’t be used for reporting, routing, or warranty,
reporting down to the component level adds little value.
Building the Categories
Ask these questions:
• Type: What kind of asset am I
working on?
• Category: What general asset
group am I working on?
• Subcategory: What particular
asset am I working on?
Hardware Tablets Surface
iPad
Desk-Side Hardware Laptops
Monitor
PCs
Printers
Peripherals
Projector/LCD
Infrastructure Network Switches/Routers
Connectivity/ISP
Cabling
Wireless
Need to make quick progress? Use
Info-Tech Research Group’s asset-
focus ticket categorization
example.

Info-Tech Research Group 87Info-Tech Research Group 87
The second approach to categorization breaks down the IT portfolio into types of services
Type Category Subcategory
WHY SHOULD I
START WITH
SERVICES?
Start with asset services if service management generally figures
prominently in your practice, especially service catalog management.
Remember, ticket categories are not your only source of reports. Enhance the classification scheme
with resolution and status codes for more granular reporting.
Building the Categories
Ask these questions:
• Type: What kind of service am I
working on?
• Category: What general service
group am I working on?
• Subcategory: What particular
service am I working on?
Accounts &
Access
Active Directory
Create file structure
Increase email quota
Increase file quota
Restore AD object
Create new security group
General Access
Policy
Remove all user access
Authentication
Endpoint
Computing
Desktop Computing and
Support
Application and desktop
virtualization support
Office – on-campus install
Office – at-home install
VPN install and set-up
Need to make quick progress?
Use Info-Tech Research Group’s
service-focus ticket
categorization example.

Info-Tech Research Group 88Info-Tech Research Group 88
Improve the categorization scheme to enhance routing and reporting
2.2.1 Assess whether the service desk can improve its ticket categorization
• Service Desk Manager
• Service Desk Agents
Participants
• Flip Chart
• Whiteboard
• Service Desk SOP
What You’ll Need
1. As a group, review existing categories, looking for duplicates and
designations that won’t affect ticket routing. Reconcile duplicates and
remove non-essential categories.
2. As a group, re-do the categories, ensuring that the new categorization
scheme will meet the reporting requirements outlined earlier.
• Are categories exhaustive and mutually exclusive?
• Is the tier simple and easy to use (i.e. 3 tiers x 8 categories)?
3. Test against recent tickets to ensure you have the right categories.
4. Record the ticket categorization scheme in the Service Desk SOP.

Info-Tech Research Group 89Info-Tech Research Group 89
Discuss:
• How can we use resolution information to enhance reporting?
• Are current status fields telling the right story?
• Are there other requirements like project linking?
Draft:
1. Write out proposed resolution codes and status fields and critically assess their value.
2. Resolutions can be further broken down by incident and service request if desired.
3. Test resolution codes against a few recent tickets.
4. Record the ticket categorization scheme in the Service Desk SOP.
Examples:
Enhance the classification scheme with resolution and status codes for more granular reporting
2.2.2 Enhance ticket categories with resolution codes
Resolution Codes
❑ How to/training
❑ Configuration change
❑ Upgrade
❑ Installation
❑ Data import/export/change
❑ Information/research
❑ Reboot
Status Fields
❑ Declined
❑ Open
❑ Closed
❑ Waiting on user
❑ Waiting on vendor
❑ Reopened by user
• CIO
• Service Desk Manager
• Service Desk Technician(s)
Participants
• Whiteboard or Flip Chart
• Markers
What You’ll Need

Info-Tech Research Group 90Info-Tech Research Group 90
Step 2.3: Design incident escalation and prioritization
This step will walk you
through the following
activities:
This step involves the
following participants:
2.3.1 Build a small number of
rules to facilitate prioritization
2.3.2 Define escalation rules
2.3.3 Define automated
escalations
• IT Managers
• Service Desk Manager(s)
• Representation from tier 2
and tier 3 specialists
The reviewed ticket escalation and prioritization will streamline
queue management, improve the quality of escalations, and
ensure agents work on the right tickets at the right time.
Outcomes
DELIVERABLES
• Optimized ticket
prioritization scheme
• Guidelines for ticket
escalations
• List of automatic
escalations
Phase 2:
Design incident
management
2.2
2.1
Design ticket
categorization
Design incident
escalation and
prioritization
2.3
Build incident management
workflows

Info-Tech Research Group 91Info-Tech Research Group 91
Build a ticket prioritization matrix to make escalation assessment less subjective
Mission-critical systems or problems
that affect a large number of people
should always come first (i.e. Severity
Level 1).
The bulk of reported problems, however,
are often individual problems with
desktop PCs (i.e. Severity Level 3 or 4).
Some questions to consider when
deciding on problem severity include:
• How is productivity affected?
• How many users are affected?
• How many systems are affected?
• How critical are the affected
systems to the organization?
Decide how many severity levels the
organization needs the service desk to
have. Four levels of severity are ideal
for most organizations.
Priority = Impact x Urgency
URGENCY
Critical High Medium Low
IMP
AC
T
ExtensiveCritical
1
High
2
Medium
3
Medium
3
SignificantHigh
2
High
2
Medium
3
Low
4
ModerateMedium
3
Medium
3
Medium
3
Low
4
LocalizedMedium
3
Low
4
Low
4
Low
4
WHAT DO I NEED
TO PRIORITIZE?
Most IT leaders agree that prioritization is one of the most difficult
aspects of IT in general. Set priorities based on business needs first.

Info-Tech Research Group 92Info-Tech Research Group 92
Define specific criteria for impact assessments to design a more granular categorization scheme
The impact of an incident ticket is a function of a number of criteria, which can be summed up as the effect
of the incident. Assess the impact of an incident according to each of the criteria and make a judgment on
which criteria is most important in a given case.
Impact
RatingBusiness
Criticality
Type of
Requester
Geographic
Scope
# of Groups
Affected
# of Users
Affected
1
Extensive
Widespread
Mission Critical - Nationwide Two or more offices 100 or more
2
Significant
Large
Significant Executives Statewide One entire office 50 to 99
3
Moderate
Limited
Moderate/Limited - CitywideMultiple groups
within one office6 to 49
4
Minor
Localized
Low - Local outageSingle group within
one office1 to 5

Info-Tech Research Group 93Info-Tech Research Group 93
Define specific criteria for urgency assessments to design a more granular categorization scheme
The urgency of an incident ticket is a function of a number of criteria, which can be summed up as how
soon the incident must be resolved. Assess the urgency of an incident according to each of the criteria and
make a judgment on which criteria is most important in a given case.
Urgency
Rating
Public safety
and public healthFinancial systems User work stoppage
CriticalPublic safety or public health is
compromised nowFinancial loss is occurring now Work totally stopped
HighPublic safety or public health will be
compromised within 48 hoursFinancial loss will occur within 48 hours
Significant loss of work capacity, but
can get some work done
MediumPublic safety or public health will be
compromised between 48 hours and one
week
Financial loss will occur between 48
hours and one weekWorking with some loss of efficiency
LowPublic safety or public health will not be
compromised for at least one week
Financial loss will not occur for
at least one weekWorkaround identified

Info-Tech Research Group 94Info-Tech Research Group 94
Bring an incident’s urgency impact and urgency ratings together to define each severity level
The following table uses descriptions of impact and urgency to describe severity levels and assigns times
to respond and times to escalate for each severity level.
Severity
LevelsDescription
Time to
RespondTime to Escalate
Tier 1 Tier 2/3
1
Critical system is down; little to no
functionality; no workaround; many
services affected; or many users
affected.
ImmediateEscalate immediately to tier 2 or
manager
Escalate to peer group or vendor
after 30 minutes without progress
2Functionality severely restricted; no
workaround; or several users
affected.
30 minutes
during
normal
business
hours
Escalate to tier 2 after 15 minutes
without progress; auto-escalate
from tier 1 queue to tier 2 queue
after 30 minutes unassigned
Escalate to peer group or vendor
after two hours without progress
3Basic functionality with some
restrictions; workaround available; or
one or more users affected.
30 minutes
during
normal
business
hours
Escalate to tier 2 after 20 minutes
without progress; auto-escalate
from tier 1 queue to tier 2 queue
after 30 minutes unassigned
Escalate to peer group or vendor
after four hours without progress
4Minor problem; functionality
unaffected; or cosmetic or an
annoyance.
30 minutes
during
normal
business
hours
Escalate to tier 2 after one hour
without progress, ticket volume
permitting; auto-escalate from tier
1 queue to tier 2 queue after 30
minutes unassigned
Escalate to peer group or vendor
after four hours without progress,
ticket volume permitting

Info-Tech Research Group 95Info-Tech Research Group 95
Collect the ticket prioritization scheme in one diagram to ensure service support aligns to business requirements
Priority
Critical• No viable alternative
solution
• Imminent/current
learning or teaching
impact
High• Complex alternative
solution
• Impact within a week
Medium• Complex alternative
solution
• Intermittent
• Impact by next week
Low• Easy alternative
solution
• Failover in place
• Not service disrupting
Extensive• Highly business
critical
• Division-wide outage
• Two or more schools
• 100 or more users
Critical
1
High
2
Medium
3
Medium
3
Significant• Significant business
criticality
• Initiated by VIP
• Regional outage
• 50-99 users
High
2
High
2
Medium
3
Low
4
Moderate• Moderate or limited
business criticality
• School-wide outage
• 6-49 users
Medium
3
Medium
3
Medium
3
Low
4
Localized• Low business
criticality
• Local outage
• Single group within
one school
(classroom)
• 1-5 users
Medium
3
Low
4
Low
4
Low
4
URGENCY
IMP
AC
T

Info-Tech Research Group 96Info-Tech Research Group 96
Define response and resolution targets for each priority level to establish service-level objectives for service support
Response
Priority Response SLO Resolution SLO Escalation Time
T1
Severity 1 Critical Within 30 minutes 4 hours to resolve Immediate
Severity 2 High Within 1 business hour8 business hours to
resolve20 mins
Severity 3 Medium Within 4 business hours24 business hours to
resolve
After 20 mins without
progress
Severity 4 Lowsame day
(8 hours)
72 business hours to
resolve
After 1 hour without
progress
SLO ResponseTime it takes for service desk to respond to service
request or incident.
Target response is 80%
of SLA
SLO ResolutionTime it takes to resolve incident and return business
services to normal.
Target resolution is
80% of SLA

Info-Tech Research Group 97Info-Tech Research Group 97
Prioritize incidents based on severity and urgency to foreground critical issues
2.3.1 Time Allotment: 60 minutes
A
B
Build a small number of rules to facilitate prioritization
Start by identifying the indicators of high- or low-priority
tickets. Once you have these sketched out, you can begin to
break them into manageable levels.
Define each level of severity. Outline the potential impact
on the business and the end user’s ability to work. Provide
examples for each level.
Estimate the time it will take for the service desk to
respond to the end user for each severity level.
Discuss process for reprioritization of scheduled tasks that
are now due or are in danger of missing SLAs.
Identify exceptions to the prioritization matrix that may
include specific roles, departments, or timing around
business processes that will need to be treated as a high
priority.
Collect the guidelines in the Service Desk SOP.
C
D
E
F
• Service Manager
• Service Desk Support
• Applications or
Infrastructure Support
Participants
• Flip Chart Paper
• Sticky Notes
• Pens
• Service Desk SOP
What You’ll Need

Info-Tech Research Group 98Info-Tech Research Group 98
Discuss the possible root causes for escalation issuesTechnic
ian
Symptom Possible Root Cause Suggested Action
• No one available to pick up the
phone.
• Tickets not escalated soon
enough.
• Tier 1 technicians spending too
much time troubleshooting issues.
• Limit time to triage and troubleshoot to 15-
20 minutes. If issue cannot be resolved
during that time, escalate to tier 2 or 3.
• Tickets escalated too soon. • Tier 1 technician does not use
appropriate triage procedures or
questions.
• Update knowledgebase with triage
questions for specific applications.
• Train tier 1 on common issues that could
be identified and solved before escalation
to a specialist.
• Multiple technicians involved in
resolving incidents.
• Tickets escalated to wrong role.
• Cost to support is high.
• Tier 1 technician does not have
clearly defined list of application
owners.
• Create or update list of application owners
for correct first-time escalations.
• SLAs on critical services are not
being met.
• Critical incident workflow and
communications are not
differentiated from normal incidents
or clearly defined.
• Define expected response and escalation
times for critical incidents.
• Define workflow and communication
procedures.
WHY IS
ESCALATION
IMPORTANT?
Escalation is not about admitting defeat, but about using your resources properly.
Defining procedures for escalation reduces the amount of time the service desk
spends troubleshooting before allocating the incident to a higher service tier. This
reduces the mean time to resolve and increases end-user satisfaction.
You can correlate escalation paths to ticket categories devised in step 2.2.

Info-Tech Research Group 99Info-Tech Research Group 99
Build clear rules to help agents determine when to escalate
2.3.2 Time Allotment: 60 minutes
A
B
Define escalation guidelines
Identify escalation rules including applications, process, or
SLA issues and time to resolve. Ask:
• If a technician is not making progress, when should
they escalate (e.g. tier 1: 20 minutes)?
• Which vendors should receive an escalation
immediately (e.g. printer partner)?
• Which events or applications require an immediate
escalation (e.g. virus outbreak)?
• Can automated alerts be set up when SLAs are in
danger of being breached?
• Does the ownership of the ticket change when it is
escalated?
• Can tickets be flagged if they are escalated but could
be solved at tier 1? Can you create knowledgebase
articles and cross-train on these cases?
Document the guidelines in the Service Desk SOP and
communicate to the team.
Create alerts in the service desk tool for breached SLAs.C
• Service Manager
• Service Desk Support
• Applications or
Infrastructure Support
Participants
• Flip Chart Paper
• Sticky Notes
• Pens
What You’ll Need

Info-Tech Research Group 100Info-Tech Research Group 100
Escalation is not about admitting defeat, but about using your resources properly.
Identify escalation guidelines and prioritization exceptions to empower your staff
Questions Examples
Which roles or individuals will require faster response times due to the
nature of the work that they do?
Executives
Field Sales Representatives
Which departments do you consider to be of highest priority within the
organization due to their impact to the organization?
Sales
Classroom technology
Is there any hardware that could impact the business that would need to be
prioritized?
Shipping printer
Are there any business functions that will be a high priority based primarily
on timing?
Payroll software leading up to payroll
deadline
Accounting, year end
When there are requests with competing priorities submitted, who has the
authority to make prioritization decisions?
How much effort or time to resolve or cost to resolve should analysts expend
at each tier before escalation?
Tier 1: Less than 20 minutes without
progress, unless call volume is low
Tier 2: Based on priority
1. Brainstorm to identify exceptions to the prioritization matrix that may include specific roles, departments, or timing
around business processes that will need to be treated as a high priority.
2. Discuss what can be pre-approved to ensure users have low downtime.
3. Create a decision matrix and add to SOP.

Info-Tech Research Group 101Info-Tech Research Group 101
Create a list of application specialists to get the escalation right the first time
2.3.3 Time Allotment: 60 minutes
1. Identify applications that will require
specialists for troubleshooting or access
rights.
2. Identify primary and secondary specialists
for each application.
3. Identify vendors that will receive escalations
either immediately or after troubleshooting.
4. Set up application groups in the service desk
tool.
5. Set up workflows in the service desk tool
where appropriate.
6. Document the automated escalations in the
categorization scheme developed in step 2.2,
and in the Service Desk SOP.
• Service Manager
• Service Desk Support
• Applications or
Infrastructure Support
Participants
• Flip Chart Paper
• Sticky Notes
• Pens
• Service Desk SOP
What You’ll Need
Define automated escalations

Info-Tech Research Group 102Info-Tech Research Group 102
Phase 2 Guided Implementation
Guided Implementation 2: Design incident managementProposed Time to Completion: 4 Weeks
Step 2.1: Build incident management
workflows
Step 2.2: Design ticket categorization Step 2.3: Design incident escalation and
prioritization
Start with an analyst kick off call:
• Review incident management challenges.
Review findings with analyst:
• Review existing ticket categorization scheme.
Review findings with analyst:
• Review escalation and prioritization challenges.
Then complete these activities…
• Define incident management workflow.
• Define critical incident management workflow.
• Design critical incident management
communications plan.
Then complete these activities…
• Design ticket categorization scheme.
• Enhance categorization with resolution codes.
Then complete these activities…
• Build ticket prioritization scheme.
• Define escalation guidelines.
• Define automated escalations.
With these tools & templates:
• Service Desk SOP
• Workflow Library
With these tools & templates:
• Service Desk SOP
• Ticket Categorization Examples
With these tools & templates:
• Service Desk SOP
• Ticket prioritization matrix
Phase 2 Insight: Use the service recovery paradox to your advantage. Address service desk challenges explicitly, develop
incident management processes that get services back online quickly, and communicate the changes. If you show that the
service desk recovered well from the challenges end users raised, you will get greater loyalty from end users.
Call 1-888-670-8889 or email [email protected] for more information.
Complete these steps on your own, or call us to complete a guided implementation. A guided implementation is a series of
2-3 advisory calls that help you execute each phase of a project. They are included in most advisory memberships.

Info-Tech Research Group 103Info-Tech Research Group 103
If you want additional support, have our analysts guide you through this phase as part of an Info-Tech workshop
2.1.2
2.3.2
The following are sample activities that will be conducted by Info-Tech analysts with your team:
Book a workshop with our Info-Tech analysts:
• To accelerate this project, engage your IT team in an Info-Tech workshop with an Info-
Tech analyst team.
• Info-Tech analysts will join you and your team onsite at your location or welcome you to
Info-Tech’s historic Toronto office to participate in an innovative onsite workshop.
• Contact your account manager (www.infotech.com/account), or email
[email protected] for more information.
The analyst will:
• Review the components of effective incident management workflows.
• Walk through a workflow example.
• Provide feedback on your own incident management workflow.
Define incident management workflows
The analyst will:
• Provide an overview of best practices for ticket prioritization.
• Help configure the best practices to the needs of your organization.
Define escalation guidelines
Insert your
headshot
here
Info-Tech Research Group 104Info-Tech Research Group 104
Info-Tech Research Group, Inc. is a global leader in providing IT research and advice.
Info-Tech’s products and services combine actionable insight and relevant advice with
ready-to-use tools and templates that cover the full spectrum of IT concerns.
© 1997-2018 Info-Tech Research Group Inc.
PHASEDesign Request Fulfilment Processes
3
Standardize the Service Desk

Info-Tech Research Group 105Info-Tech Research Group 105
Step 3.1: Prepare for a self-service portal project
3.2
3.1
3.3
This step will walk you
through the following
activities:
This step involves the
following participants:
3.1.1 Develop self-service tools
for the end user
3.1.2 Review service definition
checklist for standardized
request models
• IT Managers
• Service Desk Manager(s)
• Representation from tier 2
and tier 3 specialists
The section prepares you to tackle a self-service portal project
once the service desk standardization is complete.
Outcomes
DELIVERABLES
• High-level activities to
create a self-service portal
• Service Definition Checklist
Phase 3:
Design request
fulfilment
Prepare for a self-service portal project
Build request workflows
Build a targeted
knowledgebase
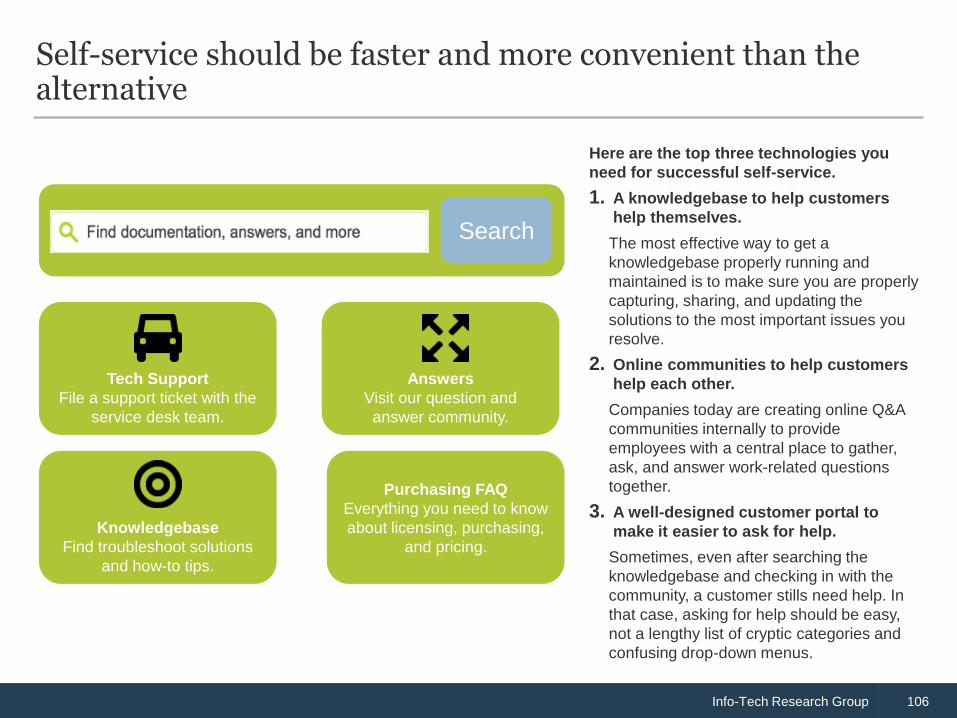
Info-Tech Research Group 106Info-Tech Research Group 106
Self-service should be faster and more convenient than the alternative
Here are the top three technologies you
need for successful self-service.
1. A knowledgebase to help customers
help themselves.
The most effective way to get a
knowledgebase properly running and
maintained is to make sure you are properly
capturing, sharing, and updating the
solutions to the most important issues you
resolve.
2. Online communities to help customers
help each other.
Companies today are creating online Q&A
communities internally to provide
employees with a central place to gather,
ask, and answer work-related questions
together.
3. A well-designed customer portal to
make it easier to ask for help.
Sometimes, even after searching the
knowledgebase and checking in with the
community, a customer stills need help. In
that case, asking for help should be easy,
not a lengthy list of cryptic categories and
confusing drop-down menus.
Search
Tech Support
File a support ticket with the
service desk team.
Knowledgebase
Find troubleshoot solutions
and how-to tips.
Purchasing FAQ
Everything you need to know
about licensing, purchasing,
and pricing.
Answers
Visit our question and
answer community.

Info-Tech Research Group 107Info-Tech Research Group 107
Self-service portal examples (1/3)
Search bar Collaboration
News and notices
Image source: HPE Service Anywhere

Info-Tech Research Group 108Info-Tech Research Group 108
Self-service portal examples (2/3)
Password reset
Track my
items
Problems
and known
errors
Service
desk hours
and contact
info
Discussion
board
Submit request
or incident
Knowledgebase
(KB) & FAQs Devices
Chat
Image source: Cherwell Service Management
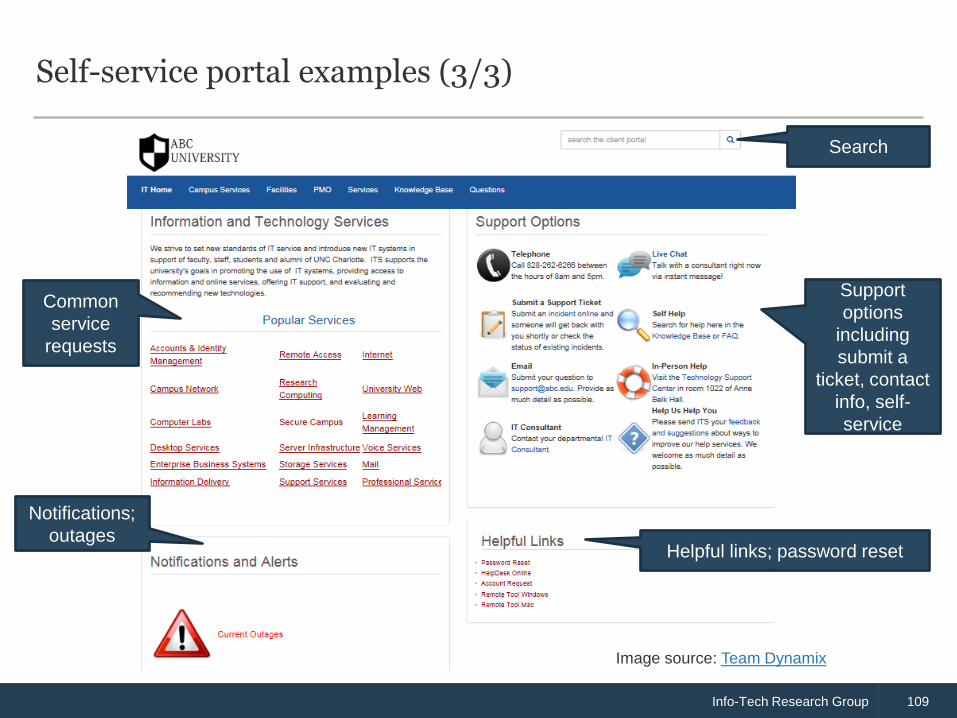
Info-Tech Research Group 109Info-Tech Research Group 109
Self-service portal examples (3/3)
Search
Common
service
requests
Notifications;
outagesHelpful links; password reset
Support
options
including
submit a
ticket, contact
info, self-
service
Image source: Team Dynamix

Info-Tech Research Group 110Info-Tech Research Group 110
A recent study by the OECD offers a useful reminder of one of usability’s
most hard-earned lessons: you are not the user.
Design the self-service portal with the users’ computer skills in mind
• There is an important difference between IT
professionals and the average user that’s even
more damaging to your ability to predict what will
be a good self-service tool: skills in using
computers, the internet, and technology in
general.
• A recent international research study explored the
computer skills of 215,942 people aged 16-65
in 33 countries.
• The results show that across 33 rich countries,
only 5% of the population has strong computer-
related abilities and only 33% of people can
complete medium-complexity computer tasks.
• End users are skilled, they just don’t have the
same level of comfort with computers as the
average IT professional. Design your self-service
tools with that fact in mind.
0%
10%
20%
30%
40%
50%
60%
70%
80%
90%
100%
US
A
Canad
a
OE
CD
Ave
rag
e
UK
Austr
alia
Germ
any
Neth
erl
and
s
Sca
nd
an
avia
Sin
gap
ore
Jap
an
Distribution of Computer Skills Among People Aged 16-65
Level 3(strong)
Level 2(medium)
Level 1(poor)
Below 1(terrible)
Can't usecomputers
Source: OECD, 2016 (N=215,942)
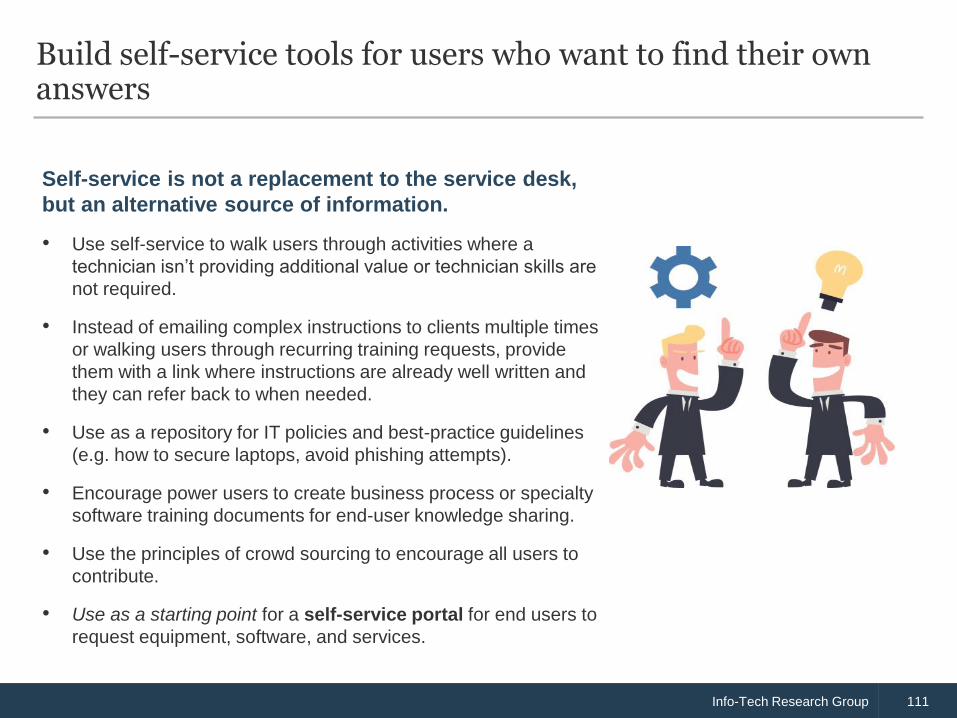
Info-Tech Research Group 111Info-Tech Research Group 111
Build self-service tools for users who want to find their own answers
Self-service is not a replacement to the service desk,
but an alternative source of information.
• Use self-service to walk users through activities where a
technician isn’t providing additional value or technician skills are
not required.
• Instead of emailing complex instructions to clients multiple times
or walking users through recurring training requests, provide
them with a link where instructions are already well written and
they can refer back to when needed.
• Use as a repository for IT policies and best-practice guidelines
(e.g. how to secure laptops, avoid phishing attempts).
• Encourage power users to create business process or specialty
software training documents for end-user knowledge sharing.
• Use the principles of crowd sourcing to encourage all users to
contribute.
• Use as a starting point for a self-service portal for end users to
request equipment, software, and services.

Info-Tech Research Group 112Info-Tech Research Group 112
A knowledgebase or FAQs can also provide self-service solutions for end users
Keep the end-user facing knowledgebase relevant with workflows, multi-device
access, and social features.
Workflows:
• Easily manage peer reviews and editorial and
relevance review.
• Enable links and importing between tickets and
knowledgebase articles.
• Enable articles to appear based on ticket
content.
Multi-device access:
• Encourage users to access self-service.
• Enable technicians to solve problems from
anywhere.
Social features:
• Display most popular articles first to solve
trending issues.
• Enable voting to improve usability of articles.
• Collaboration on self-service.
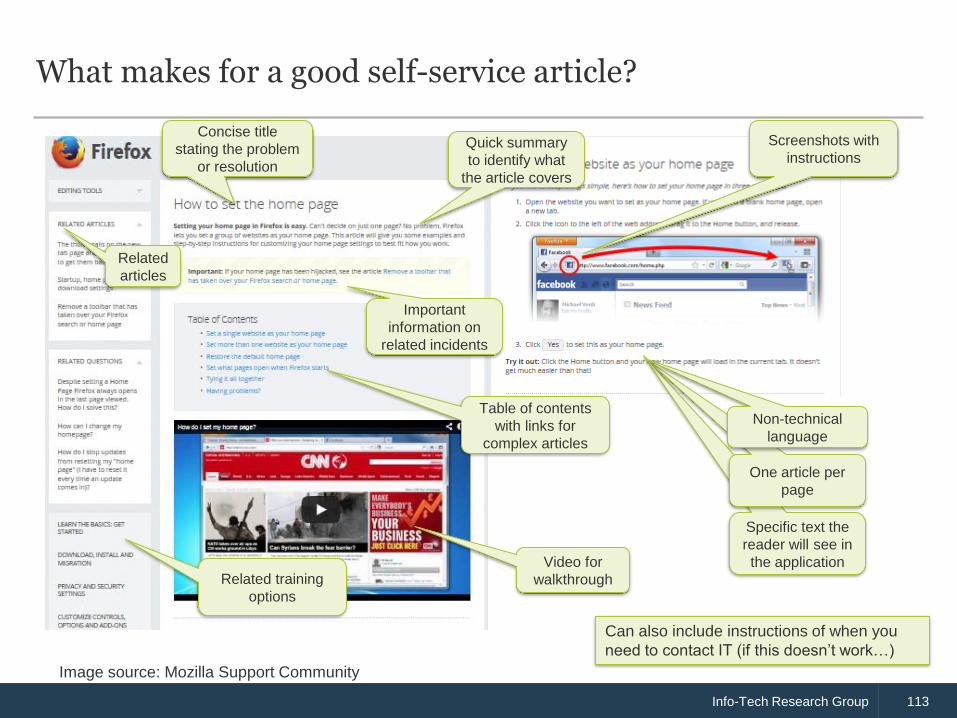
Info-Tech Research Group 113Info-Tech Research Group 113
What makes for a good self-service article?
Specific text the
reader will see in
the application
One article per
page
Concise title
stating the problem
or resolution
Quick summary
to identify what
the article covers
Related
articles
Important
information on
related incidents
Table of contents
with links for
complex articles
Video for
walkthrough
Screenshots with
instructions
Non-technical
language
Related training
options
Can also include instructions of when you
need to contact IT (if this doesn’t work…)
Image source: Mozilla Support Community

Info-Tech Research Group 114Info-Tech Research Group 114
Draft a high-level project plan for a self-service portal project
3.1.1 Draft a high-level project plan for a self-service portal project
• Service Desk Manager
• Service Desk Agents
Participants
• Flip Chart
• Whiteboard
• Service Desk Roadmap
What You’ll Need
1. Identify stakeholders who can contribute to the project.
• Who will help with FAQ creation?
• Who can design the self-service portal?
• Who needs to sign off on the project?
2. Identify the high-level tasks that need to be done.
• How many FAQs need to be created?
• How will we design the service catalog’s web portal?
• What might a phased approach look like?
• How can we break down the project into design, build, and
implementation tasks?
• What is the rough timeline for these tasks?
3. Capture the high-level activities in the Service Desk Roadmap.
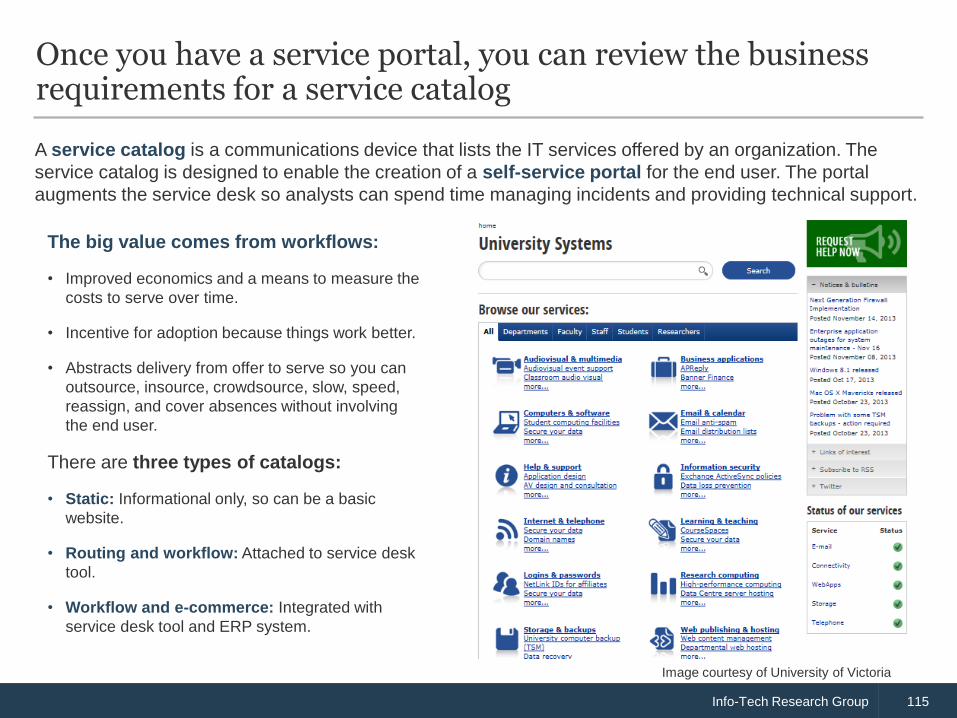
Info-Tech Research Group 115Info-Tech Research Group 115
Once you have a service portal, you can review the business requirements for a service catalog
A service catalog is a communications device that lists the IT services offered by an organization. The
service catalog is designed to enable the creation of a self-service portal for the end user. The portal
augments the service desk so analysts can spend time managing incidents and providing technical support.
The big value comes from workflows:
• Improved economics and a means to measure the
costs to serve over time.
• Incentive for adoption because things work better.
• Abstracts delivery from offer to serve so you can
outsource, insource, crowdsource, slow, speed,
reassign, and cover absences without involving
the end user.
There are three types of catalogs:
• Static: Informational only, so can be a basic
website.
• Routing and workflow: Attached to service desk
tool.
• Workflow and e-commerce: Integrated with
service desk tool and ERP system.
Image courtesy of University of Victoria

Info-Tech Research Group 116Info-Tech Research Group 116
A self-service portal will streamline IT service delivery, but putting one
together requires a significant investment. Service desk standardization
comes first.
Understand the time and effort involved in building a service catalog
• Workflows and back-end services must be
in place before setting up a service catalog.
Think of the catalog as just the delivery
mechanism for service you currently provide. If
they aren’t running well, and delivery is not
consistent, you don’t want to advertise SLAs
and options.
• Service catalogs require maintenance.
It’s not a one-time investment – service
catalogs must be kept up to date to be useful.
• Service catalog building requires input
from VIPs.
Architects and wordsmiths are not the only
ones that spend effort on the service catalog.
Leadership from IT and the business also
provide input on policy and content.
“I would say a client with 2,000 users and an IT department with a couple of hundred, then you're looking at six months before you have the catalog there.”
– Service Catalog Implementation Specialist, Health
Services
Sample Service Catalog Efforts
• A college with 17 IT staff spent one week on a simple
service catalog.
• A law firm with 110 IT staff spent two months on a
service catalog project.
• A municipal government with 300 IT people spent over
seven months and has yet to complete the project.
• A financial organization with 2,000 IT people has spent
seven months on service catalog automation alone! The
whole project has taken multiple years.
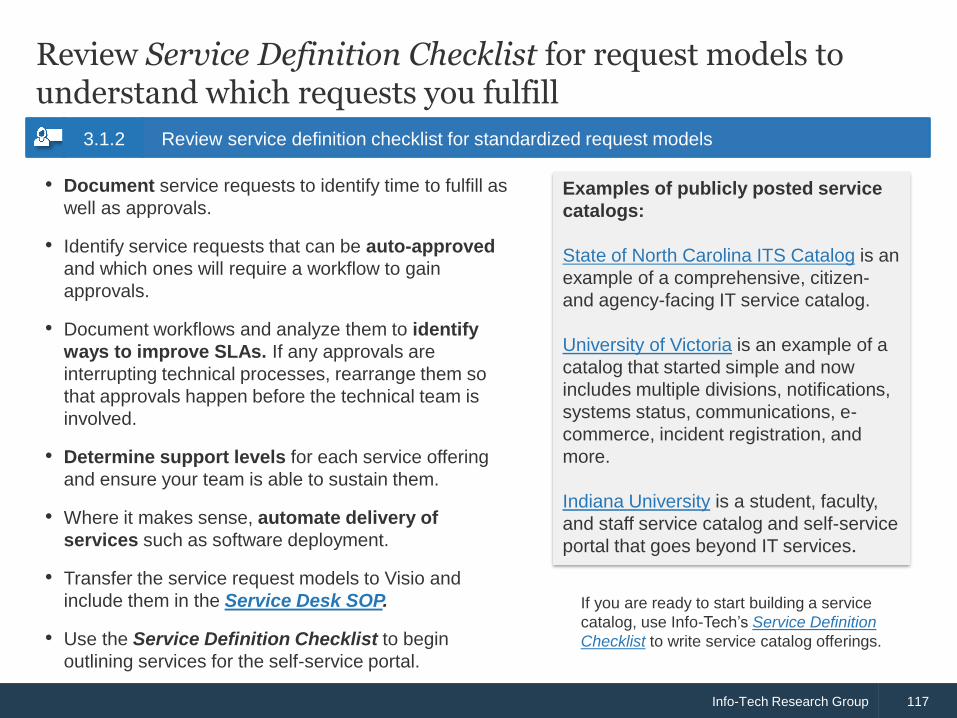
Info-Tech Research Group 117Info-Tech Research Group 117
Review Service Definition Checklist for request models to understand which requests you fulfill
3.1.2 Review service definition checklist for standardized request models
• Document service requests to identify time to fulfill as
well as approvals.
• Identify service requests that can be auto-approved
and which ones will require a workflow to gain
approvals.
• Document workflows and analyze them to identify
ways to improve SLAs. If any approvals are
interrupting technical processes, rearrange them so
that approvals happen before the technical team is
involved.
• Determine support levels for each service offering
and ensure your team is able to sustain them.
• Where it makes sense, automate delivery of
services such as software deployment.
• Transfer the service request models to Visio and
include them in the Service Desk SOP.
• Use the Service Definition Checklist to begin
outlining services for the self-service portal.
Examples of publicly posted service
catalogs:
State of North Carolina ITS Catalog is an
example of a comprehensive, citizen-
and agency-facing IT service catalog.
University of Victoria is an example of a
catalog that started simple and now
includes multiple divisions, notifications,
systems status, communications, e-
commerce, incident registration, and
more.
Indiana University is a student, faculty,
and staff service catalog and self-service
portal that goes beyond IT services.
If you are ready to start building a service
catalog, use Info-Tech’s Service Definition
Checklist to write service catalog offerings.

Info-Tech Research Group 118Info-Tech Research Group 118
Step 3.2: Build request workflows
3.2
3.1
3.3
This step will walk you
through the following
activities:
This step involves the
following participants:
3.2.1 Distinguish between
requests and small projects
3.2.2 Define service requests
with SLAs
3.2.3 Build and critique request
workflows
• IT Managers
• Service Desk Manager(s)
• Representation from tier 2
and tier 3 specialists
Workflows for service requests will improve the consistency and
quality of service delivery and prepare the service desk to
negotiate reliable service levels with the organization.
Outcomes
DELIVERABLES
• Workflows for the most
common service requests
• An estimated service level
for each service request
• Request vs. project criteria
Phase 3:
Design request
fulfilment
Prepare for a self-
service portal project
Build request
workflows
Build a targeted
knowledgebase

Info-Tech Research Group 119Info-Tech Research Group 119
Distinguish between service requests and small projects to ensure agents and end users follow the right process
The distinction between service requests and small
projects has two use cases, which are two sides of
the same resourcing issue.
• Service desk managers need to understand the difference to
ensure the right approval process is followed. Typically, projects
have more stringent intake requirements than requests do.
• PMOs need to understand the difference to ensure the right
people are doing the work and that small, frequent changes are
standardized, automated, and taken out of the project list.
What’s the difference between a service request and a small project?
The key differences involve resource scope, frequency, and risk. Requests are likely to require fewer
resources than projects, be fulfilled more often, and involve less risk. Requests are typically done by tier 1
and 2 employees throughout the IT organization. A request can turn into a small project if the scope of the
request grows beyond the bounds of a normal request.
Suppose a mid-sized organization goes on a hiring blitz and needs to onboard 150 new employees in one
quarter. Submitting and scheduling 150 requests for onboarding new employees would be time consuming
and the tasks will require a greater investment in time and resources than a request normally would. This is
certainly not business as usual.
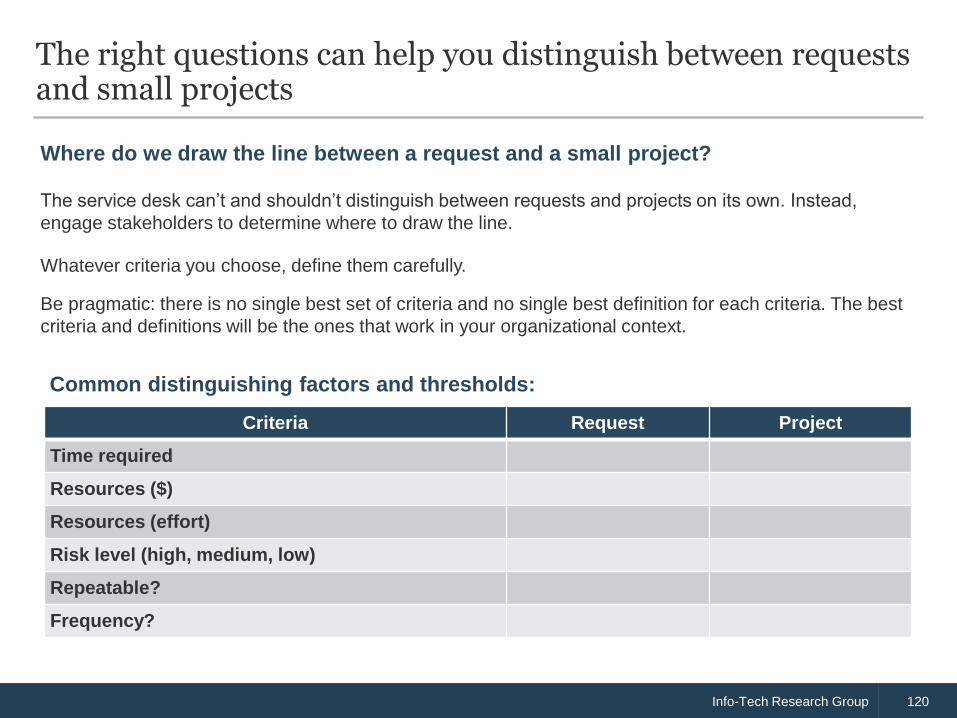
Info-Tech Research Group 120Info-Tech Research Group 120
The right questions can help you distinguish between requests and small projects
The service desk can’t and shouldn’t distinguish between requests and projects on its own. Instead,
engage stakeholders to determine where to draw the line.
Common distinguishing factors and thresholds:
Where do we draw the line between a request and a small project?
Criteria Request Project
Time required
Resources ($)
Resources (effort)
Risk level (high, medium, low)
Repeatable?
Frequency?
Whatever criteria you choose, define them carefully.
Be pragmatic: there is no single best set of criteria and no single best definition for each criteria. The best
criteria and definitions will be the ones that work in your organizational context.

Info-Tech Research Group 121Info-Tech Research Group 121
Distinguish between service requests and projects
3.2.1 Distinguish between service requests and projects
• Service Desk Manager
• Service Desk Agents
Participants
• Service Desk SOP
• Flip Chart
• Whiteboard
What You’ll Need
1. Divide the group into two small teams.
2. Each team will brainstorm examples of service requests and small projects.
3. Identify factors and thresholds that distinguish between the two groups of items.
4. Bring the two groups together and discuss the two sets of criteria.
5. Consolidate one set of criteria that will help make the distinction between projects
and service requests.
6. Capture the table in the Service Desk SOP.
Common distinguishing factors and thresholds
Criteria Request Project
Time required
Resources ($)
Resources (effort)
Risk level (high, medium, low)
Repeatable?
Frequency?

Info-Tech Research Group 122Info-Tech Research Group 122
Don’t standardize request fulfilment processes alone
New service desk managers sometimes try to standardize request
fulfilment processes on their own only to encounter either apathy
or significant resistance to change.
Moving to a tiered generalist service desk with a service-oriented
culture, a high first-tier generalist resolution rate, and collaborative
T2 and T3 specialists can be a big change. It is critical to get the
request workflows right.
Don’t go it alone. Engage a core team of process champions from
all service support. With executive support, the right process
building exercises can help you overcome resistance to change.
Consider running the process building activities in this project
phase in a working session or a workshop setting.
If they build it, they will come. Service desk improvement is an exercise in organizational change that crosses IT
disciplines. Organizations that fail to engage IT specialists from other silos often encounter resistance to change that
jeopardizes the process improvements they are trying to make. Overcome resistance by highlighting how process changes
will benefit different groups in IT and solicit the feedback of specialists who can affect or be affected by the changes.
Everyone in IT contributes to the fulfilment of
requests, but do they know it?
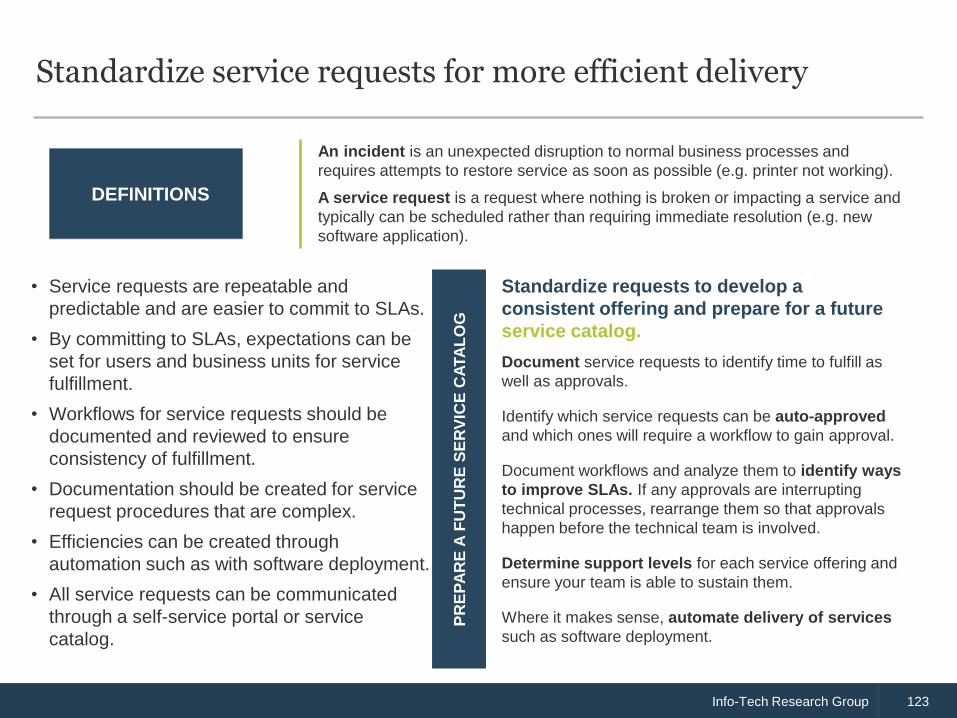
Info-Tech Research Group 123Info-Tech Research Group 123
Standardize service requests for more efficient delivery
• Service requests are repeatable and
predictable and are easier to commit to SLAs.
• By committing to SLAs, expectations can be
set for users and business units for service
fulfillment.
• Workflows for service requests should be
documented and reviewed to ensure
consistency of fulfillment.
• Documentation should be created for service
request procedures that are complex.
• Efficiencies can be created through
automation such as with software deployment.
• All service requests can be communicated
through a self-service portal or service
catalog.
PR
EP
AR
E A
FU
TU
RE
SE
RV
ICE
CA
TA
LO
G
Standardize requests to develop a
consistent offering and prepare for a future
service catalog.
Document service requests to identify time to fulfill as
well as approvals.
Identify which service requests can be auto-approved
and which ones will require a workflow to gain approval.
Document workflows and analyze them to identify ways
to improve SLAs. If any approvals are interrupting
technical processes, rearrange them so that approvals
happen before the technical team is involved.
Determine support levels for each service offering and
ensure your team is able to sustain them.
Where it makes sense, automate delivery of services
such as software deployment.
DEFINITIONS
An incident is an unexpected disruption to normal business processes and
requires attempts to restore service as soon as possible (e.g. printer not working).
A service request is a request where nothing is broken or impacting a service and
typically can be scheduled rather than requiring immediate resolution (e.g. new
software application).

Info-Tech Research Group 124Info-Tech Research Group 124
Define standard service requests with SLAs and workflows
Standard Service Requests Approvals IT SLAs
Set up new user
• AD account
• Equipment
• Telephone
• Application access
HR
Hiring Manager5 business days
Update user access to applications
• Security access
• Application rights
Manager approval
Application owner for non-standard requests
1 business day
Update security group access
Manager approval
Application owner for non-standard requests
1 business day
Hardware update request (store)Manager approval
Store technical approval
5-10 days (standard requests)
TBD for non-standard
Example:
WHY DO I NEED
WORKFLOWS?
Move approvals out of technical IT processes to make them more efficient.
Evaluate all service requests to see where auto-approvals make sense. Where
approvals are required, use tools and workflows to manage the process.

Info-Tech Research Group 125Info-Tech Research Group 125
Document service requests to ensure consistent delivery and communicate requirements to users
3.2.2 Define service requests with SLAs
• Service Desk Manager
• Service Desk Agents
Participants
• Service Desk SOP
• Flip Chart
• Whiteboard
What You’ll Need
1. On a flip chart, list common service requests.
2. Identify time required to fulfill, including time to schedule resources.
3. Identify approvals required; determine if approvals can be automated
through defining roles.
4. Discuss opportunities to reduce SLAs or automate, but recognize that this
may not happen right away.
5. Discuss plans to communicate SLAs to the business units, recognizing
that some users may take a bit of time to adapt to the new SLAs.
6. Work toward improving SLAs as new opportunities for process change
occur.
7. Document SLAs in the Service Desk SOP and update as SLAs change.
8. Build templates in the service desk tool that encapsulate workflows and
routing, SLAs, categorization, and resolution.
These should all be scheduled services. Anything that is
requested as a rush needs to be marked as a higher urgency or
priority to track end users who need training on the process.

Info-Tech Research Group 126Info-Tech Research Group 126
SE
RV
ICE
RE
QU
ES
T M
AN
AG
EM
EN
T W
OR
KF
LO
W
Example: New user request
Use the sample service request workflow to define your own
Workflow should include:
• Ticket creation and closure
• Classification
• Escalations
• Communications
• Documentation
• Relevant sub-processes
(e.g. procurement)
Notes:
• If the ticket closure will include a simple
survey, take advantage of the
workflows to send poor reviews to the
service manager for immediate follow-
up.
See the next slide for exercise
instructions.

Info-Tech Research Group 127Info-Tech Research Group 127
Analyze service request workflows to improve service delivery
3.2.3 Build and critique request workflows
• Service Desk Manager
• Service Desk Agents
Participants
• Service Desk SOP
• Executive Presentation
• Flip Chart
• Whiteboard
What You’ll Need
1. Divide the group into small teams.
2. Each team will choose one service request from the list created in the previous
module and then draw the workflow. Include decision points and approvals.
3. Discuss availability and technical support
• Can the service be fulfilled during regular business hours or 24x7?
• Is technical support and application access available during regular business
hours or 24x7?
4. Reconvene and present workflows to the group.
5. Document workflows in Visio and add to the Service Desk SOP and Executive
Presentation.
6. Where appropriate, enter workflows in the service desk tool.
Critique workflows for efficiencies and effectiveness:
• Do the workflows support the SLAs identified in the previous exercise?
• Are the workflows efficient?
• Is the IT staff consistently following the same workflow?
• Are approvals appropriate? Is there too much bureaucracy or can some
approvals be removed? Can they be preapproved?
• Are approvals interrupting technical processes? If so, can they be moved?

Info-Tech Research Group 128Info-Tech Research Group 128
Step 3.3: Build targeted knowledgebase
This step will walk you
through the following
activities:
This step involves the
following participants:
3.3.1 Design knowledge
management processes
3.3.2 Create actionable
knowledgebase articles
• IT Managers
• Service Desk Manager(s)
• Representation from tier 2
and tier 3 specialists
The section will provide an introduction to service catalogs, and
get the organization to envision what self-service tools it might
include.
Outcomes
DELIVERABLES
• Knowledgebase policy and
process
3.2
3.1
3.3
Build request
workflows
Phase 3:
Design request
fulfilment
Build a targeted
knowledgebase
Prepare for a self-
service portal project

Info-Tech Research Group 129Info-Tech Research Group 129
Draw on organizational goals to define the knowledge transfer target state
Level 3Optimized
Level 2Proactive
Level 1 Stabilize
Level 0Accidental
Goal: Risk Mitigation
Goal: Efficiency
Goal: Innovation
Goal: Not Prioritized
At level one, knowledge transfer is focused around
ensuring that high-risk, explicit knowledge is
covered for all high-risk stakeholders.
Organizations have knowledge transfer plans for all
high-risk knowledge to ensure redundancies exist
and to leverage this to drive process improvements,
effectiveness, and employee engagement.
Increase end-user satisfaction and create a
knowledge value center by leveraging the collective
knowledge to solve repeat customer issues and
drive new product innovation.
No formal knowledge transfer program exists;
knowledge transfer is ad hoc or may be conducted
through an exit interview only.
Seventy-four percent of organizations are at
level 0.*
Info-Tech’s
Knowledge Transfer Maturity Model
*Source: McLean & Company, 2013; N=120
Building a knowledge transfer capacity is
not a one-size-fits-all project.
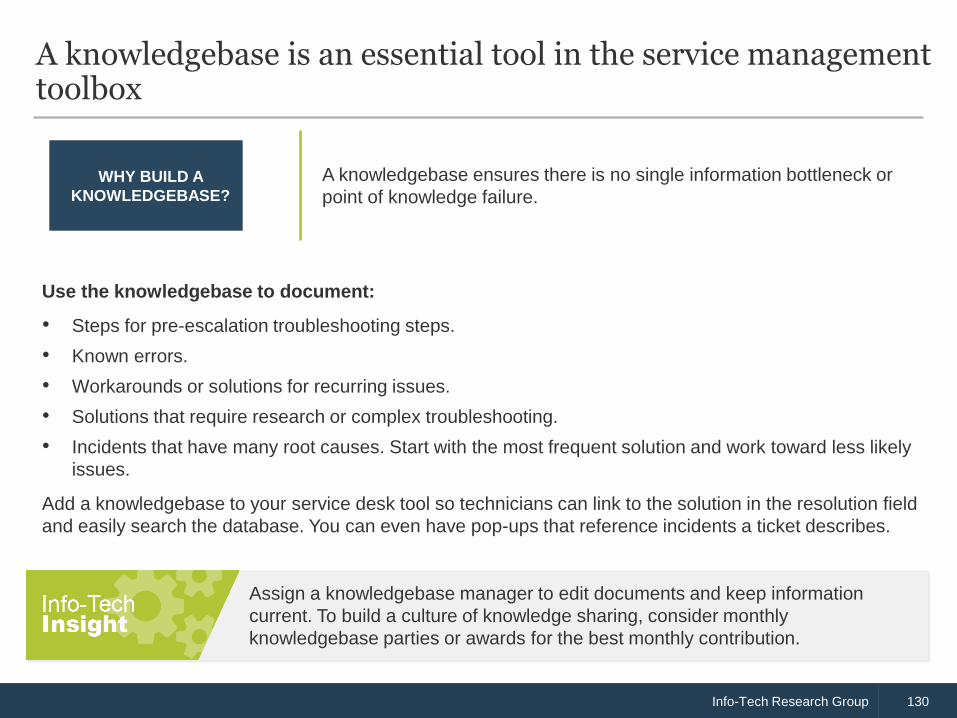
Info-Tech Research Group 130Info-Tech Research Group 130
A knowledgebase is an essential tool in the service management toolbox
Use the knowledgebase to document:
• Steps for pre-escalation troubleshooting steps.
• Known errors.
• Workarounds or solutions for recurring issues.
• Solutions that require research or complex troubleshooting.
• Incidents that have many root causes. Start with the most frequent solution and work toward less likely
issues.
Add a knowledgebase to your service desk tool so technicians can link to the solution in the resolution field
and easily search the database. You can even have pop-ups that reference incidents a ticket describes.
WHY BUILD A
KNOWLEDGEBASE?
A knowledgebase ensures there is no single information bottleneck or
point of knowledge failure.
Assign a knowledgebase manager to edit documents and keep information
current. To build a culture of knowledge sharing, consider monthly
knowledgebase parties or awards for the best monthly contribution.
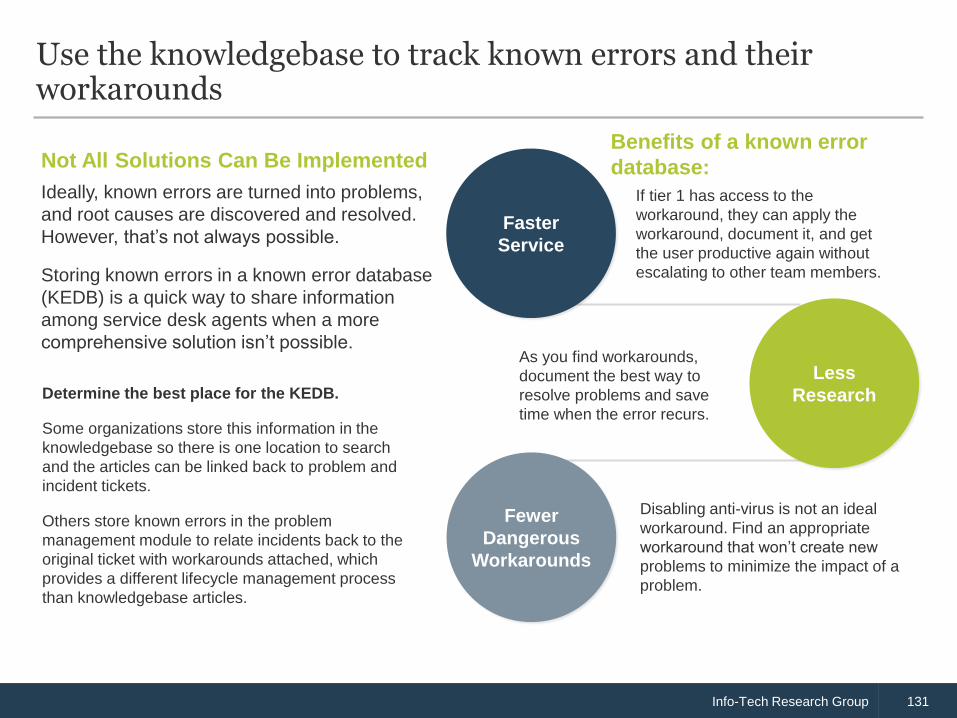
Info-Tech Research Group 131Info-Tech Research Group 131
Use the knowledgebase to track known errors and their workarounds
Determine the best place for the KEDB.
Some organizations store this information in the
knowledgebase so there is one location to search
and the articles can be linked back to problem and
incident tickets.
Others store known errors in the problem
management module to relate incidents back to the
original ticket with workarounds attached, which
provides a different lifecycle management process
than knowledgebase articles.
If tier 1 has access to the
workaround, they can apply the
workaround, document it, and get
the user productive again without
escalating to other team members.
As you find workarounds,
document the best way to
resolve problems and save
time when the error recurs.
Disabling anti-virus is not an ideal
workaround. Find an appropriate
workaround that won’t create new
problems to minimize the impact of a
problem.
Less
Research
Faster
Service
Fewer
Dangerous
Workarounds
Not All Solutions Can Be Implemented
Ideally, known errors are turned into problems,
and root causes are discovered and resolved.
However, that’s not always possible.
Storing known errors in a known error database
(KEDB) is a quick way to share information
among service desk agents when a more
comprehensive solution isn’t possible.
Benefits of a known error
database:

Info-Tech Research Group 132Info-Tech Research Group 132
Use a quarterly, phased approach to build a knowledgebase targeted on your most important incidents and requests
• Use service desk reports to identify the current top five or ten incidents, and create related
knowledgebase articles.
• Evaluate for end-user self-service or technician resolution.
• Note any resolutions that require access rights to servers.
• Assign documentation creation tasks for the knowledgebase to individual team members each week.
• Apply only one incident per article.
• Set goals for each technician to submit one meaningful article per week (or two per month).
• Assign a knowledge manager to monitor creation, and edit and maintain the database. See Info-Tech’s
knowledge manager role description if you need a hand defining this position.
• Set policy to drive currency of the knowledgebase. See the Service Desk SOP for an example of a
workable knowledge policy.
WHERE DO I START?
Inventory and consolidate existing documentation, then evaluate it for
audience relevancy, accuracy, and usability. Use the exercise and the
next slides to develop a knowledgebase template.
Engage the team to come up with a plan to improve the knowledgebase.

Info-Tech Research Group 133Info-Tech Research Group 133
Develop a template to ensure knowledgebase articles are easy to read and write
Audience and
applicability
Quick summary
to identify what
the article covers
Known errors and
root causes to
minimize recurrences
Solution – step by
step
Prerequisites for solving,
such as server access
rights
Related
articles
Document or
process owner
Review date for
future alerts
Concise title
stating the problem
or resolution
Tags indicating what
this article applies to
(including versions)
QUICK TIPS
• Use non-technical language whenever possible to help less-technical readers.
• Identify error messages and use screenshots where it makes sense.
• Take advantage of social features like voting buttons to increase use.
• Use Info-Tech’s Knowledgebase Article Template to get you started.

Info-Tech Research Group 134Info-Tech Research Group 134
Links to related
tools
Build a template to make knowledgebase articles easy to read and write
Browsing options
Role-based
authentication so only
technicians gain
access to information
Most used
articles
Concise
titles
Table of contents
with links for
related articles
Forums for team
collaboration
Search capabilities
Related training
options
Announcements
Image source: Microsoft

Info-Tech Research Group 135Info-Tech Research Group 135
Use a quarterly, phased approach to continue to build and maintain your knowledgebase
• Once a knowledgebase is in place, consistent articles should
be written with established templates.
• Articles should be regularly reviewed. Outdated information
will be retired and retired articles will be archived.
• Ticket trend analysis should be done on an ongoing basis and
new articles identified.
• A proactive approach will anticipate upcoming issues based on
planned upgrades and maintenance or other changes, and
document resolution steps in knowledgebase articles ahead of
time.
Every quarter:
1. Conduct a ticket trend analysis. Identify the most important
and common incidents and service requests.
2. Review the knowledgebase to identify relevant articles that
need to be revised or written.
3. Use data from the knowledge management tool to track
expiring content and lesser used articles.
4. Assign the task of writing articles to all IT staff members.
5. Build and revise ticket templates for incident and service
requests.
Critical Success Factors
Critical Success Factor #1: Maintaining Knowledge
Quality and Relevance
• All articles have been verified and updated
within the past 365 days.
Critical Success Factor #2: Integration With Incident
Management
• Increase in number of incidents resolved
through reuse of an existing knowledgebase (a
KB is attached).
• Increase in number of incidents participating in
the knowledge management process.
• Increased number of times that the
knowledgebase is accessed.
• Increased percentage of issues solved through
KB articles relative to total incident volume.
Critical Success Factor #3: Improved Accessibility
and Management of Standards and Policies
• Increased number of documented policies and
procedures.
• Increased percentage of policies that have been
reviewed based on annual review schedule.

Info-Tech Research Group 136Info-Tech Research Group 136
Design knowledgebase management processes
3.3.1 Design knowledgebase management processes
• Service Desk Manager
• Service Desk Agents
Participants
• Service Desk SOP
• Flip Chart
• Whiteboard
What You’ll Need
1. Assign a knowledge manager to monitor creation and edit and maintain the
database. See Info-Tech’s knowledge manager role description if you need a
hand defining this position.
2. Discuss how you can use the service desk tool to integrate the knowledgebase with
incident management, request fulfilment, and self-service processes.
3. Discuss the suitability of a quarterly process to build and edit articles for a target
knowledgebase that covers your most important incidents and requests.
4. Set knowledgebase creation targets for tier 1, 2, and 3 analysts.
5. Identify relevant performance metrics.
6. Brainstorm elements that might be used as an incentive program to encourage the
creation of knowledgebase articles and knowledge-sharing more generally.
7. Set policy to drive currency of knowledgebase. See the Service Desk SOP for an
example of a workable knowledge policy.

Info-Tech Research Group 137Info-Tech Research Group 137
Analyze the necessary features for your knowledgebase and compare them against existing tools
Service desk knowledgebases range in complexity from simple FAQs to fully
integrated software suites.
Options include:
• Article search with negative and positive filters.
• Tagging, with the option to have keywords generate top
matches.
• Role-based permissions (to prevent unauthorized deletions).
• Ability to turn a ticket resolution into a knowledgebase article
(typically only available if knowledgebase tool is part of the
service desk tool).
• Natural language search.
• Partitioning (so one article can be used for end user, tier 1,
and tier 3) or self-service/FAQ section for end users.
• Wikis for collaboration.
• Editorial workflow management.
• Ability to set alerts for scheduled article review.
• Article reporting (most viewed, was it useful?).
• Rich text fields for attaching screenshots.
Determine which features your
organization needs, and check to
see if your tools have them.
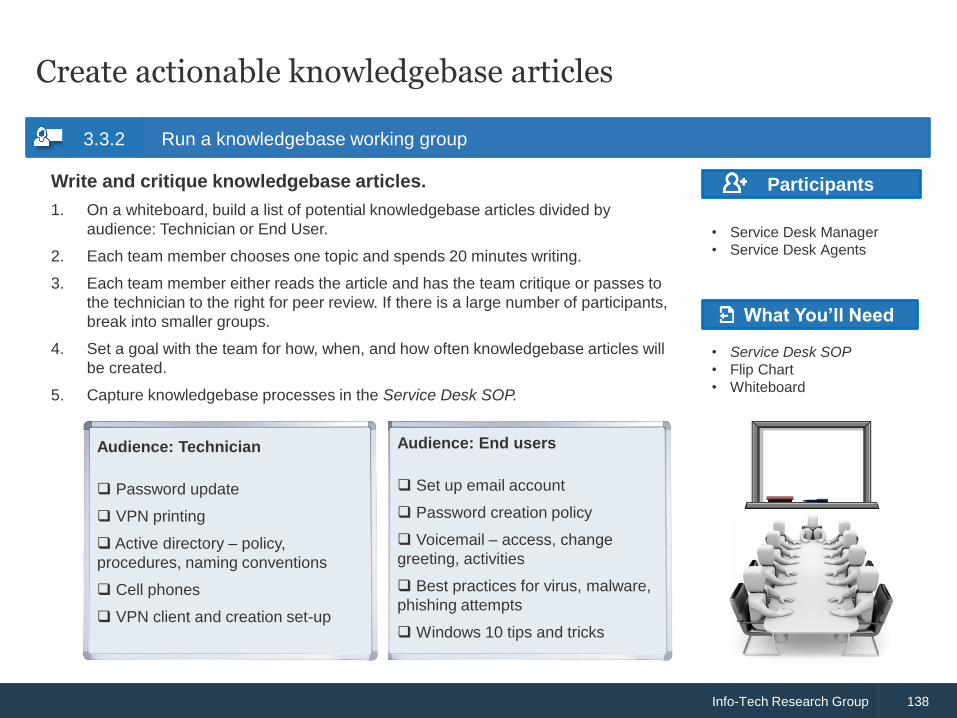
Info-Tech Research Group 138Info-Tech Research Group 138
Create actionable knowledgebase articles
3.3.2 Run a knowledgebase working group
• Service Desk Manager
• Service Desk Agents
Participants
• Service Desk SOP
• Flip Chart
• Whiteboard
What You’ll Need
Write and critique knowledgebase articles.
1. On a whiteboard, build a list of potential knowledgebase articles divided by
audience: Technician or End User.
2. Each team member chooses one topic and spends 20 minutes writing.
3. Each team member either reads the article and has the team critique or passes to
the technician to the right for peer review. If there is a large number of participants,
break into smaller groups.
4. Set a goal with the team for how, when, and how often knowledgebase articles will
be created.
5. Capture knowledgebase processes in the Service Desk SOP.
Audience: End users
❑ Set up email account
❑ Password creation policy
❑ Voicemail – access, change
greeting, activities
❑ Best practices for virus, malware,
phishing attempts
❑ Windows 10 tips and tricks
Audience: Technician
❑ Password update
❑ VPN printing
❑ Active directory – policy,
procedures, naming conventions
❑ Cell phones
❑ VPN client and creation set-up

Info-Tech Research Group 139Info-Tech Research Group 139
Phase 3 Guided Implementation
Guided Implementation 3: Design Request FulfilmentProposed Time to Completion: 4 Weeks
Step 3.1: Prepare for a self-service portal
project
Step 3.2: Build request workflows Step 3.3: Build a targeted knowledgebase
Review findings with analyst:
• Review business requirements for a service
portal.
Start with an analyst kick off call:
• Review service request challenges.
Review findings with analyst:
• Review knowledgebase challenges.
Then complete these activities…
• Develop self-service tools for the end user.
• Review service definition checklist for
standardized request models.
Then complete these activities…
• Distinguish between requests and projects.
• Define service requests with SLAs.
• Build and critique request workflows.
Then complete these activities…
• Design knowledge management processes.
• Create actionable knowledgebase articles.
With these tools & templates:
• Ticket Template
• Service Design Checklist
With these tools & templates:
• Service Desk SOP
• Executive Presentation
• Workflow Library
With these tools & templates:
• Service Desk SOP
• KB Article Template
• KB Process and Workflow
• Role Description: Knowledge Manager
Phase 3 Insight: If they build it, they will come. Service desk improvement is an exercise in organizational change that crosses IT
disciplines. Organizations that fail to engage IT specialists from other silos encounter resistance to change that jeopardizes the improvements
they are trying to make. Overcome resistance by highlighting how changes will benefit different groups and solicit feedback.
Call 1-888-670-8889 or email [email protected] for more information.
Complete these steps on your own, or call us to complete a guided implementation. A guided implementation is a series of
2-3 advisory calls that help you execute each phase of a project. They are included in most advisory memberships.

Info-Tech Research Group 140Info-Tech Research Group 140
If you want additional support, have our analysts guide you through this phase as part of an Info-Tech workshop
3.1.2
3.4.1
The following are sample activities that will be conducted by Info-Tech analysts with your team:
Book a workshop with our Info-Tech analysts:
• To accelerate this project, engage your IT team in an Info-Tech workshop with an Info-
Tech analyst team.
• Info-Tech analysts will join you and your team onsite at your location or welcome you to
Info-Tech’s historic Toronto office to participate in an innovative onsite workshop.
• Contact your account manager (www.infotech.com/account), or email
[email protected] for more information.
The analyst will:
• Provide examples of common service request workflows.
• Provide feedback on the service request workflows you outline for your
organization.
Analyze service request workflows
The analyst will:
• Review a simple approach to build a targeted knowledgebase.
• Provide strategies to engage the IT team to build and maintain the
knowledgebase.
Run a knowledgebase working group
Insert your
headshot
here

Info-Tech Research Group 141Info-Tech Research Group 141
Info-Tech Research Group, Inc. is a global leader in providing IT research and advice.
Info-Tech’s products and services combine actionable insight and relevant advice with
ready-to-use tools and templates that cover the full spectrum of IT concerns.
© 1997-2018 Info-Tech Research Group Inc.
PHASEPlan the Implementation of the Service Desk
4
Standardize the Service Desk

Info-Tech Research Group 142Info-Tech Research Group 142
Step 4.1: Identify ITSM tool requirements
This step will walk you
through the following
activities:
This step involves the
following participants:
4.1.1 Create a requirements list
for the service desk tool
4.1.2 Investigate which tool best
meets your needs
• CIO
• IT Director
• IT Managers
• Service Desk Manager(s)
• Representation from tier 2
and tier 3 specialists
The ITSM tool requirements, vendor shortlist, and briefing script
will accelerate the tool selection process.
Outcomes
DELIVERABLES
• ITSM tool requirements
• Vendor shortlist
• Vendor briefing script
Phase 4:
Plan service desk
implementation
Identify ITSM
tool requirements
Build communication plan
Build implementation roadmap
4.1
4.2
4.3

Info-Tech Research Group 143Info-Tech Research Group 143
Resolution
Situation
Info-Tech Insight
Most ITSM tools are replaced because they are poorly configured and poorly adopted
• Most organizations know a quality ITSM tool that meets operational
requirements is critical to a well-functioning service desk.
• IT professionals are skilled at gathering requirements and selecting
software. Provided the right service desk processes are developed,
building a shortlist of vendors that meet requirements is straightforward.
• Purchasing an ITSM tool is an expensive proposition. Remember, the
value of any ITSM tool is a function of the processes it supports and
the adoption of those processes.
• The ITSM tool with the best functionality is worth little if you do not build
the right processes, configure the tool to support them, and work to
improve tool adoption in your organization.
• Create an implementation plan tailored to improve not only processes but also their adoption over time.
• With incident management, request management, and knowledge management in place, the next natural steps
are to take steps to reduce ticket volumes and make the service desk more proactive, which includes:
o Building a service catalog.
o Implementing change management.
o Initiating problem management.
• As you develop an ITSM implementation roadmap, map out how the new processes will change the behaviors of
stakeholders and implement a communication plan to facilitate those changes.
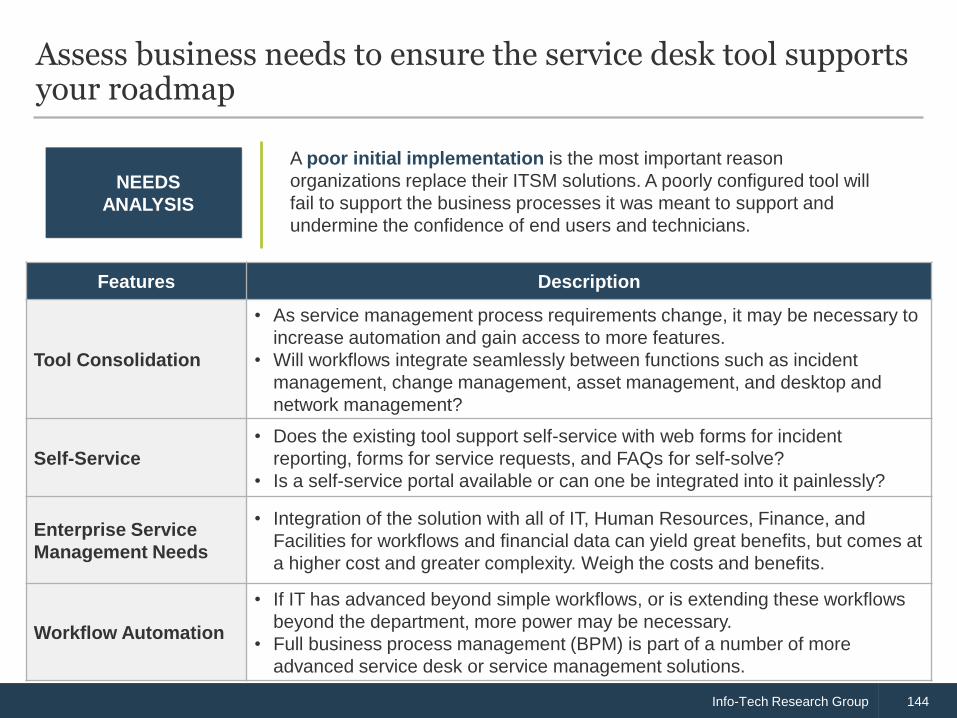
Info-Tech Research Group 144Info-Tech Research Group 144
Assess business needs to ensure the service desk tool supports your roadmap
Features Description
Tool Consolidation
• As service management process requirements change, it may be necessary to
increase automation and gain access to more features.
• Will workflows integrate seamlessly between functions such as incident
management, change management, asset management, and desktop and
network management?
Self-Service
• Does the existing tool support self-service with web forms for incident
reporting, forms for service requests, and FAQs for self-solve?
• Is a self-service portal available or can one be integrated into it painlessly?
Enterprise Service
Management Needs
• Integration of the solution with all of IT, Human Resources, Finance, and
Facilities for workflows and financial data can yield great benefits, but comes at
a higher cost and greater complexity. Weigh the costs and benefits.
Workflow Automation
• If IT has advanced beyond simple workflows, or is extending these workflows
beyond the department, more power may be necessary.
• Full business process management (BPM) is part of a number of more
advanced service desk or service management solutions.
NEEDS
ANALYSIS
A poor initial implementation is the most important reason
organizations replace their ITSM solutions. A poorly configured tool will
fail to support the business processes it was meant to support and
undermine the confidence of end users and technicians.

Info-Tech Research Group 145Info-Tech Research Group 145
Review the service desk solution to ensure it delivers value
Features Description
License Maintenance
Costs
• Are license and maintenance costs still reasonable and appropriate for the
value of the tool?
• Will the vendor renegotiate?
• Are there better tools out there for the same or better price?
Administration Costs
• Templates, forms, workflows, and reports all take time and skills but bring big
benefits. Can these changes be done in-house? How much does it cost to
maintain and improve?
Speed/Performance• Data growth and volume may have reached levels beyond the current
solution’s ability to cope, despite database tuning.
Vendor Support• Is the vendor still supporting the solution and developing the roadmap? Has it
been acquired? Is the level of support still meeting your needs?
NEEDS
ANALYSIS
Start small, but start. Implement tools while the service desk is small,
and implement more sophisticated ones as the service desk grows.
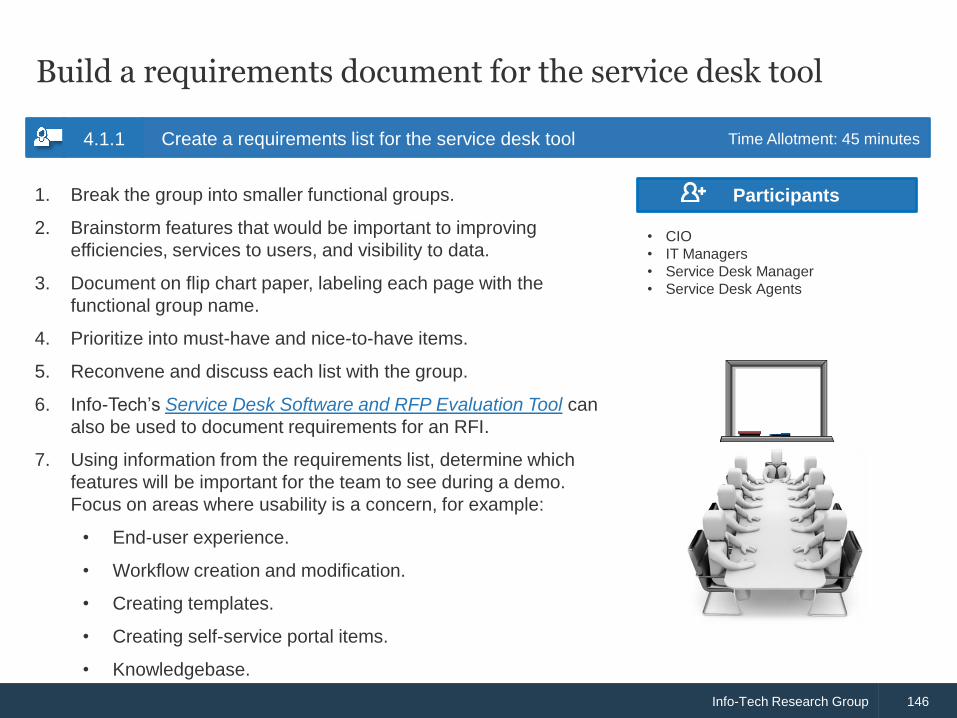
Info-Tech Research Group 146Info-Tech Research Group 146
Build a requirements document for the service desk tool
4.1.1 Time Allotment: 45 minutesCreate a requirements list for the service desk tool
• CIO
• IT Managers
• Service Desk Manager
• Service Desk Agents
Participants1. Break the group into smaller functional groups.
2. Brainstorm features that would be important to improving
efficiencies, services to users, and visibility to data.
3. Document on flip chart paper, labeling each page with the
functional group name.
4. Prioritize into must-have and nice-to-have items.
5. Reconvene and discuss each list with the group.
6. Info-Tech’s Service Desk Software and RFP Evaluation Tool can
also be used to document requirements for an RFI.
7. Using information from the requirements list, determine which
features will be important for the team to see during a demo.
Focus on areas where usability is a concern, for example:
• End-user experience.
• Workflow creation and modification.
• Creating templates.
• Creating self-service portal items.
• Knowledgebase.

Info-Tech Research Group 147Info-Tech Research Group 147
Evaluate alternative tools, build a shortlist for RFPs, and arrange web demonstrations or evaluation copies
4.1.2 Time Allotment: 45 minutesInvestigate which tool best meets your needs
• CIO
• IT Managers
• Service Desk Manager
• Service Desk Agents
Participants1. Evaluate current tool:
a) Investigate to determine if these features are present and
just not in use.
b) Contact the vendor if necessary.
c) If enough features are present, determine if additional
training is required.
d) If tool is proven to be inadequate, investigate options.
2. Consider alternatives:
a) Fill in RFP template with a features list.
b) Create demo script to identify features your team wishes to
see.
c) Review the following Info-Tech Vendor Landscapes to find
the most appropriate vendors for your organization:
• Vendor Landscape: Mid-Market Service Desk Software
• Vendor Landscape: Enterprise Service Desk Software
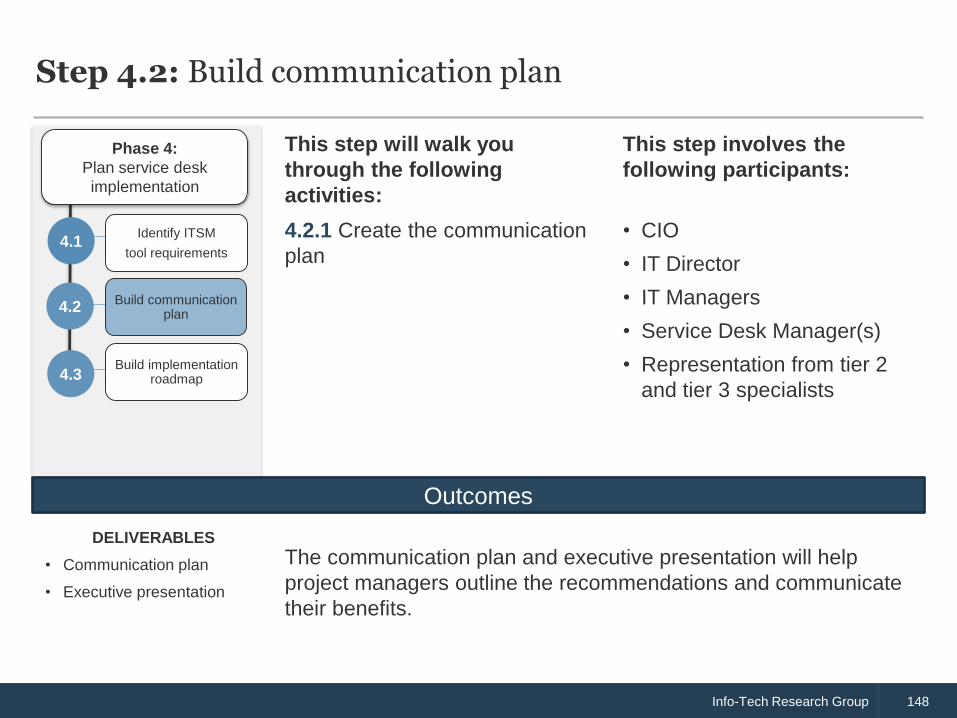
Info-Tech Research Group 148Info-Tech Research Group 148
Step 4.2: Build communication plan
This step will walk you
through the following
activities:
This step involves the
following participants:
4.2.1 Create the communication
plan
• CIO
• IT Director
• IT Managers
• Service Desk Manager(s)
• Representation from tier 2
and tier 3 specialists
The communication plan and executive presentation will help
project managers outline the recommendations and communicate
their benefits.
Outcomes
DELIVERABLES
• Communication plan
• Executive presentation
Phase 4:
Plan service desk
implementation
Identify ITSM
tool requirements
Build communication plan
Build implementation roadmap
4.1
4.2
4.3

Info-Tech Research Group 149Info-Tech Research Group 149
Effectively communicate the game plan to IT to ensure the success of service desk improvements
Communication is crucial to the integration and overall implementation of your
service desk improvement. An effective communication plan will:
• Gain support from management at the project proposal phase.
• Create end-user buy-in once the program is set to launch.
• Maintain the presence of the program throughout the business.
• Instill ownership throughout the business, from top-level management to new hires.
Use the variety of components as part of your communication plan in order to reach the organization.
1. Communicate benefits to IT:
• Share the standard operating procedures for training and feedback.
• Train staff on policies as they relate to end users and ensure awareness of all policy changes.
• As changes are implemented, continue to solicit feedback on what is and is not working and communicate
adjustments as appropriate.
2. Train technicians:
• Make sure everyone is comfortable communicating changes to customers – especially if they have to tell them “not
right now” or “you need to call the help desk.”
3. Measure success:
• Review SLAs and reports.
• Are you consistently meeting SLAs?
• Is it safe to communicate with end users?

Info-Tech Research Group 150Info-Tech Research Group 150
Use a stakeholder analysis to identify the people that can help ensure the success of your project
Why is a stakeholder analysis essential?
✓ Ignoring key stakeholders is an important cause of failed ITSM implementations.
✓ You can use the opinions of the most influential stakeholders to shape the implementation at an early stage. Their
support will secure resources for the project and improve the quality of the implementation.
✓Communicating with key stakeholders early and often will ensure they fully understand the benefits of your project.
✓ You can anticipate the reaction of key stakeholders to your project and plan steps to win their support.
Goal: Create a prioritized list of people who are affected or can affect your project, and determine how
best to communicate with them during the project.
Outcome: A list of key stakeholders to include in your communication plan.
ITSM implementation projects have a high risk of failure and a poor rate of end-user adoption. The
mistake is to assume that IT can tell the business what ITSM processes it needs. Reduce the risk of
failure and improve uptake by using what IT knows to help others envision service desk opportunities
that best meet the needs of the business.

Info-Tech Research Group 151Info-Tech Research Group 151
The first step in the mapping process is to understand that there
is no magic list of stakeholders. The final list will depend on your
business, its impacts, and your current engagement objectives –
as a result it should not remain static. This list will change as the
environment around you evolves and as stakeholders
themselves make decisions or change their opinions.
Action: Brainstorm a list of stakeholders without screening,
including everyone who has an interest in your objectives today
and who may have one tomorrow. Where possible, identify
individuals.
First, identify everyone who is affected by the service desk project
Considerations to help you along:
• Learn from past and ongoing engagement: What are the objectives of existing engagements? What
stakeholders communicate regularly with the company? Where can you reach beyond this existing comfort zone to
engage lesser-known stakeholders?
• Be forward thinking: Consider potential stakeholders from new markets, technologies, customers, and regulations.
• Be diverse: Make sure to include a rich diversity of stakeholder expertise, geography, and tactics.
• Be social: Use social media to reach lesser-known stakeholder groups.
• Be aware: The loudest voices and heaviest campaigners are not necessarily your key stakeholders. Step back and
add silent members to your list. They may have the key expertise you need.

Info-Tech Research Group 152Info-Tech Research Group 152
Second, brainstorm criteria to analyze the importance of stakeholders on your list
Use explicit ranking criteria to help identify issues before you implement
your service desk improvements.
The interest stakeholders have in your project and their potential influence are important evaluation
criteria, but they’re not the end of the story. You can also measure:
• Engagement: How willing is the stakeholder to participate?
• Contribution (value): Does the stakeholder have expertise that could be helpful? Who can most
assist with early scoping?
• Legitimacy: How legitimate is the stakeholder’s claim for engagement?
Next Step:
Assign values (low, medium, and high) to each stakeholder for each criterion. Use the results to create
and populate a chart with short descriptions of how stakeholders fulfill them. This first data set will help
you decide which stakeholders to engage.
Interest Influence Contribution
SH1 High – proactive group with a lot to
gain from the project
Low – no direct say in the project High – can help with early scoping
SH2 Medium Medium High

Info-Tech Research Group 153Info-Tech Research Group 153
• The stakeholder planning chart situates
stakeholders on a grid that identifies which ones
have the most interest in and influence on your
project and helps develop a tailored engagement
strategy.
• Mapping allows you to see where stakeholders stand
when evaluated by the same key criteria and
compared to each other and helps you visualize the
often complex interplay of issues and relationships
created in the criteria chart above.
Action: Identify key stakeholders with this 2x2 chart.
1. Draw a quadrant using two axes labeled “Low” to
“High.”
2. Assign “Influence” to the Y-axis.
3. Assign “Interest” to the X-axis.
4. Determine where each stakeholder falls.
5. Plot the stakeholders on the grid.
6. Use circle size to denote a stakeholder’s “Value.”
Finally, map stakeholders on a grid to assess where they stand
-10
-8
-6
-4
-2
0
2
4
6
8
10
-8 -6 -4 -2 0 2 4 6 8
Inte
res
t
Influence
Stakeholder Analysis
Communication plan by quadrant
Info-Tech Research Group 154Info-Tech Research Group 154
Create a communication plan to outline the project benefits
Improved business satisfaction:
• Improve confidence that the service desk can
solve issues within the service-level agreement.
• Channel incidents and requests through the
service desk.
• Escalate incidents quickly and accurately.
Increased efficiency or lower cost to serve:
• Use FAQ to enable end users to self-solve.
• Use knowledgebase to troubleshoot once, solve
many times.
• Cross-train to improve service consistency.
Fewer recurring issues:
• Tickets are created for every incident and
categorized correctly.
• Reports can be used for root-cause analysis.
Enhanced demand planning:
• Trend analysis and reporting improve IT’s ability to
forecast and address the demands of the
business.

Info-Tech Research Group 155Info-Tech Research Group 155
Select and publicize a single number or email, for each service desk, and a single
web service desk contact page.
Make the contact information for the service desk available when users are likely to need them
Include service desk contact information on:
• Hardware CI labels attached to components about which the
user is likely to be calling.
• Telephones.
• Customized desktop or laptop backgrounds, along with
information users will need when they contact the service desk
(IP address, OS build number, etc.).
• Freebies such as pens, pencils, mugs, and mouse pads.
• Service desk internet or intranet sites.
• Calling cards or satisfaction survey cards left with users when
a desk visit has been necessary.
• All correspondence sent to users.
• Notice boards or physical locations that users are likely to
regularly visit.
Communicate the single point of contact

Info-Tech Research Group 156Info-Tech Research Group 156
Create your communications plan to anticipate challenges, remove obstacles, and secure buy-in
Technicians
Management
End users
Why:
• What problems are you
trying to solve?
What:
• What processes will it
affect (that will affect me)?
When:
• When will this be
happening?
• When will it affect me?
Who:
• Who will be affected?
• Who do I go to if I have
issues with the new
process?
How:
• How will these changes
manifest themselves?
Goal:
• What is the final goal?
• How will it benefit me?

Info-Tech Research Group 157Info-Tech Research Group 157
Organize the information to manage the deployment of key messages
Group Benefits Impact How to Communicate Timeframe
Service
Desk
Team
• Reduce time to resolve
• Improve time to respond
• Start to measure SLAs
• Name one individual as
an internal go-to person
when there is an issue
• January 2018
IT
• Able to measure impact of users
jumping the queue to go directly to
tier 3 technicians
• Reduce the number of direct-to-
tech calls
• Obtain a view into how much time
is being put into support
• Gain a view into how to balance
time between support and projects
• Create knowledgebase
articles
• Create and close tickets
• Coach users on new
process
• Improve communication
efforts
• January 2018
End
Users
• Improved customer service:
o Web portal for tickets,
incidents, service requests
o FAQs
• Service transparency
• Improved communications
• Improved feedback
• Call the service desk
• Use the web portal
Tell the users that we:
• Listened to feedback
• Made positive changes
to the process to improve
user experience and will
continue to make
changes
• April 2018

Info-Tech Research Group 158Info-Tech Research Group 158
Create the communications plan
4.2.1 Time Allotment: 45 minutesCreate the communications plan
• CIO
• IT Managers
• Service Desk Manager
• Service Desk Agents
ParticipantsDevelop a stakeholder analysis.
1. Identify everyone affected by the project.
2. Assess their level of interest, value, and influence.
3. Develop a communication strategy tailored to their level of engagement.
Craft key messages tailored to each stakeholder group.
Finalize the communication plan.
1. Examine your roadmap and determine the most appropriate timing for
communications.
2. Assess when communications must happen with executives, business unit
leaders, end users, and technicians.
3. Identify any additional communication challenges that have come up during the
workshop.
4. Identify who will send out the communications.
5. Identify multiple methods for getting the messages out (newsletters, emails,
posters, company meetings).
6. For inspiration, you can refer to the Sample Communication Plan for the project.

Info-Tech Research Group 159Info-Tech Research Group 159
Step 4.3: Build implementation roadmap
This step will walk you
through the following
activities:
This step involves the
following participants:
4.3.1 Build implementation
roadmap
• CIO
• IT Director
• IT Managers
• Service Desk Manager(s)
• Representation from tier 2
and tier 3 specialists
The implementation plan and sunshine diagrams will help
implement next steps and finalize the project.
Outcomes
DELIVERABLES
• Implementation Gantt chart
• Sunshine diagram
Phase 4:
Plan service desk
implementation
Identify ITSM
tool requirements
Build communication plan
Build implementation roadmap
4.1
4.2
4.3

Info-Tech Research Group 160Info-Tech Research Group 160
Collaborate to create an implementation plan
4.3.1 Time Allotment: 45 minutesCreate the implementation plan
• CIO
• IT Managers
• Service Desk Manager
• Service Desk Agents
ParticipantsTable Top Exercise
Essential tasks
1. Distribute green index cards to each member of the team.
2. The green cards represent essential tasks that need to be done
to improve the service desk. Place the cards in order of
implementation.
3. Use symbols on the corner of the card to classify tasks in four
categories: people, process, technology, and communication.
4. Mark cards that represent decision points. Use a card of a
different color or use a marker to make a colored dot.
Group-generated tasks
1. Next, use the yellow cards to generate tasks that represent
things that you can do to complement the implementation plan.
2. Arrange the index cards in order, removing duplicates.
3. Use symbols on the corner of the card to classify tasks in four
categories: people, process, technology, and communication.
4. Transfer data to Visio and add to the Service Desk Roadmap.
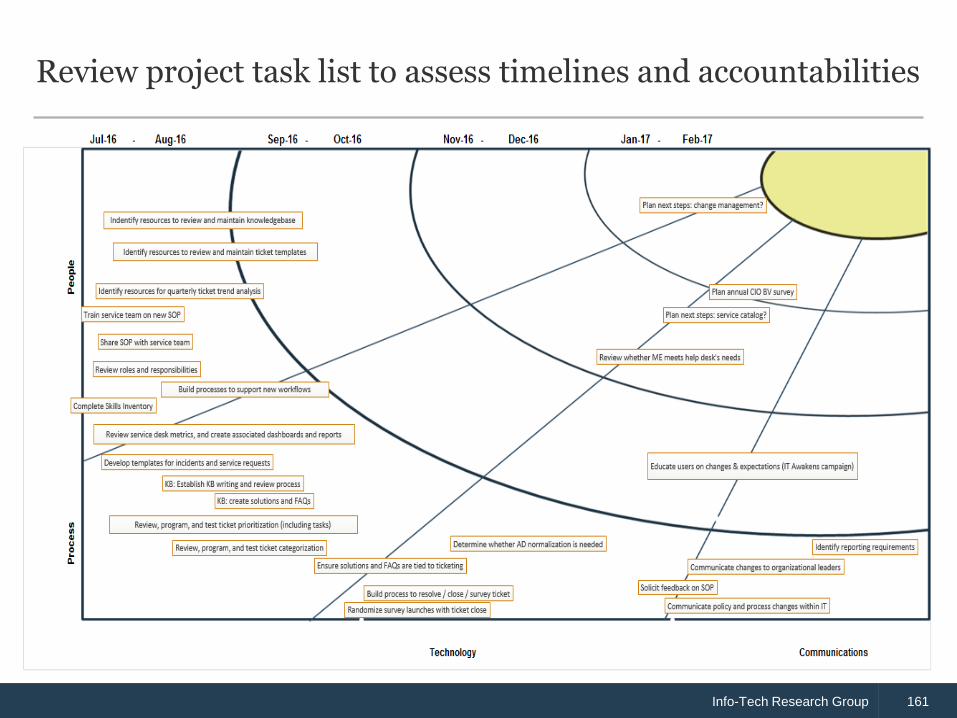
Info-Tech Research Group 161Info-Tech Research Group 161
Review project task list to assess timelines and accountabilities

Info-Tech Research Group 162Info-Tech Research Group 162
Phase 4 Guided Implementation
Guided Implementation 4: Plan Service Desk ImplementationProposed Time to Completion: 4 Weeks
Step 4.1: Identify ITSM tool requirements Step 4.2: Build communication plan Step 4.3: Build implementation roadmap
Start with an analyst kick off call:
• Review trends in the ITSM tool market place.
Review findings with analyst:
• Review best communication practices to
prepare stakeholders for the service desk
implementation.
Review findings with analyst:
• Build an implementation plan.
Then complete these activities…
• List requirements for the service desk tool.
• Investigate which tool best meets your needs.
Then complete these activities…
• Create the communication plan.
Then complete these activities…
• Build the implementation roadmap.
With these tools & templates:
• Service Desk SOP
• Executive Presentation
• Vendor Landscapes: Mid-Market and Enterprise
Service Desk Software
With these tools & templates:
• Communication Plan
• Executive Presentation
With these tools & templates:
• Service Desk Implementation Roadmap
Phase 4 Insight: Communicate the great work you do. The service recovery paradox is a situation in which end users think more
highly of IT after the organization has corrected a problem with their service than they would have had the service not been faulty in the first
place. Use it to your advantage: develop a communication plan with targeted messages that outline how the standardization project will impact
each group of stakeholders. Keep in mind that your end users are just as important to the success of your project as IT staff.
Call 1-888-670-8889 or email [email protected] for more information.
Complete these steps on your own, or call us to complete a guided implementation. A guided implementation is a series of
2-3 advisory calls that help you execute each phase of a project. They are included in most advisory memberships.

Info-Tech Research Group 163Info-Tech Research Group 163
If you want additional support, have our analysts guide you through this phase as part of an Info-Tech workshop
4.3.1
4.1.2
The following are sample activities that will be conducted by Info-Tech analysts with your team:
Book a workshop with our Info-Tech analysts:
• To accelerate this project, engage your IT team in an Info-Tech workshop with an Info-
Tech analyst team.
• Info-Tech analysts will join you and your team onsite at your location or welcome you to
Info-Tech’s historic Toronto office to participate in an innovative onsite workshop.
• Contact your account manager (www.infotech.com/account), or email
[email protected] for more information.
The analyst will:
• Help identify outstanding project tasks.
• Help identify risks and dependencies for each task.
• Guide you in collecting the information in an actionable roadmap.
Build an implementation roadmap
The analyst will:
• Help identify use cases and draft software requirements.
• Generate a shortlist of vendors that meet your organizational needs.
Investigate which service desk tool best meets your needs.
Insert your
headshot
here

Info-Tech Research Group 164Info-Tech Research Group 164
Don’t be fooled.
Insight breakdown
Service desk improvement is an exercise in organizational change that crosses IT disciplines. Organizations that fail to
engage IT specialists from other silos often encounter resistance to change that jeopardizes the process improvements they
are trying to make. Overcome resistance by highlighting how process changes will benefit different groups in IT, and solicit
the feedback of specialists who can affect or be affected by the changes.
Organizations are sometimes tempted to track their work under a single ticket type. Unfortunately, the practice obscures the
fact that incidents, requests, and projects require radically different amounts of time and resources, and can create the
impression that IT is underperforming. Distinguish between incidents, requests, and projects, and design specific processes
to support and track the performance of each activity.
A new service desk tool alone won’t solve your challenges. Most tools support service management best practices, but those
practices must be built from the ground up. Start by taking a snapshot of your existing service desk, with all of its strengths
and growing edges, and then build an organizational structure to support process improvements.
If they build it, they will come.
Organize your data to help you tell the story of IT.
The service recovery paradox is a situation in which end users think more highly of IT after the organization has corrected a
problem with their service than they would have had the service not been faulty in the first place. Use the paradox to your
advantage: develop a communication plan with targeted messages that outline how the standardization project will impact
each group of stakeholders. Keep in mind that your end users are just as important to the success of your project as IT staff.
Communicate the great work you do.

Info-Tech Research Group 165Info-Tech Research Group 165
Standardize the Service Desk
Implement IT Asset Management
Optimize Change Management
Manage Resources With Incident and
Problem Management
Build a Continual Improvement Plan for
the Service Desk
Build a strong ITSM foundation
The Standardize blueprint reviews service desk
structures and metrics and builds essential
processes and workflows for incident
management, service request fulfillment, and
knowledge management practices.
Once the service desk is operational, there are
three paths to basic ITSM maturity:
• Having the incident management
processes and workflows built allows you
to:
o Introduce Change Management to
reduce change-related incidents.
o Introduce Problem Management to
reduce incident recurrence.
o Introduce Asset Management to
augment service management
processes with reliable data.
• Having the service request fulfillment
processes and workflows built allows you to
build a self-service portal to improve self-
service, task automation, and resolution
times.
You will then be in a position to build a continual
improvement plan for the service desk to ensure
best practices remain in place.
Info-Tech Research Group 166Info-Tech Research Group 166
Works cited
Giva. “Help Desk Staffing Models: Simple Analysis Can Save You Money.” Giva, Inc., 2 Sept. 2009. Web.
Marrone et al. “IT Service Management: A Cross-national Study of ITIL Adoption.” Communications of the Association for
Information Systems: Vol. 34, Article 49. 2014. PDF.
OECD. “The Survey of Adult Skills (PIAAC).” Organisation for Economic Co-operation and Development (OECD), 2016. Web.
Rumburg, Jeff. “Metric of the Month: First Level Resolution Rate.” MetricNet, 2011. Web.
Tang, Xiaojun and Yuki Todo. “A Study of Service Desk Setup in Implementing IT Service Management in Enterprises.”
Technology and Investment: Vol. 4, pp. 190-196. 2013. PDF.
Wikipedia. “Service Recovery Paradox.” Wikipedia, n.d. Web.

Info-Tech Research Group 167Info-Tech Research Group 167
Contributors
• Jason Aqui, IT Director, Bellevue College
• Kevin Sigil, IT Director, Southwest Care Centre
• Lucas Gutierrez, Service Desk Manager, City of Santa Fe
• Rama Dhuwaraha, CIO, University of North Texas System
• Annelie Rugg, CIO, UCLA Humanities
• Owen McKeith, Manager IT Infrastructure, Canpotex
• Rod Gula, IT Director, American Realty Association
• Rosalba Trujillo, Service Desk Manager, Northgate Markets
• Jason Metcalfe, IT Manager, Mesalabs
• Bradley Rodgers, IT Manager, SecureTek
• Daun Costa, IT Manager, Pita Pit
• Kari Petty, Service Desk Manager, Mansfield Oil
• Denis Borka, Service Desk Manager, PennTex Midstream
• Lateef Ashekun, IT Manager, City of Atlanta
• Ted Zeisner, IT Manager, University of Ottawa Institut de Cardiologie