Brain imaging predictors and the international study to predict optimized treatment for depression:...
13
STUDY PROTOCOL Open Access Brain imaging predictors and the international study to predict optimized treatment for depression: study protocol for a randomized controlled trial Stuart M Grieve 1,2,3,4* , Mayuresh S Korgaonkar 1,5 , Amit Etkin 6,7 , Anthony Harris 1,5 , Stephen H Koslow 8,9 , Stephen Wisniewski 7 , Alan F Schatzberg 6 , Charles B Nemeroff 8 , Evian Gordon 1,2 and Leanne M Williams 1,5,6 Abstract Background: Approximately 50% of patients with major depressive disorder (MDD) do not respond optimally to antidepressant treatments. Given this is a large proportion of the patient population, pretreatment tests that predict which patients will respond to which types of treatment could save time, money and patient burden. Brain imaging offers a means to identify treatment predictors that are grounded in the neurobiology of the treatment and the pathophysiology of MDD. Methods/Design: The international Study to Predict Optimized Treatment in Depression is a multi-center, parallel model, randomized clinical trial with an embedded imaging sub-study to identify such predictors. We focus on brain circuits implicated in major depressive disorder and its treatment. In the full trial, depressed participants are randomized to receive escitalopram, sertraline or venlafaxine-XR (open-label). They are assessed using standardized multiple clinical, cognitive-emotional behavioral, electroencephalographic and genetic measures at baseline and at eight weeks post-treatment. Overall, 2,016 depressed participants (18 to 65 years old) will enter the study, of whom a target of 10% will be recruited into the brain imaging sub-study (approximately 67 participants in each treatment arm) and 67 controls. The imaging sub-study is conducted at the University of Sydney and at Stanford University. Structural studies include high-resolution three-dimensional T1-weighted, diffusion tensor and T2/Proton Density scans. Functional studies include standardized functional magnetic resonance imaging (MRI) with three cognitive tasks (auditory oddball, a continuous performance task, and Go-NoGo) and two emotion tasks (unmasked conscious and masked non-conscious emotion processing tasks). After eight weeks of treatment, the functional MRI is repeated with the above tasks. We will establish the methods in the first 30 patients. Then we will identify predictors in the first half (n = 102), test the findings in the second half, and then extend the analyses to the total sample. Trial registration: International Study to Predict Optimized Treatment - in Depression (iSPOT-D). ClinicalTrials.gov, NCT00693849. Keywords: Major depressive disorder, Antidepressant treatments, Imaging, Biomarker, iSPOT-D * Correspondence: [email protected] 1 The Brain Dynamics Centre, University of Sydney Medical School - Westmead and Westmead Millennium Institute, Sydney, NSW 2145, Australia 2 Brain Resource, Level 12, 235 Jones Street, Ultimo, Sydney, NSW 2007, Australia and Suite 200, 1000 Sansome Street, San Francisco, CA 94111, USA Full list of author information is available at the end of the article TRIALS © 2013 Grieve et al.; licensee BioMed Central Ltd. This is an Open Access article distributed under the terms of the Creative Commons Attribution License (http://creativecommons.org/licenses/by/2.0), which permits unrestricted use, distribution, and reproduction in any medium, provided the original work is properly cited. Grieve et al. Trials 2013, 14:224 http://www.trialsjournal.com/content/14/1/224
-
Upload
metabolic-institute -
Category
Documents
-
view
2 -
download
0
Transcript of Brain imaging predictors and the international study to predict optimized treatment for depression:...

TRIALSGrieve et al. Trials 2013, 14:224http://www.trialsjournal.com/content/14/1/224
STUDY PROTOCOL Open Access
Brain imaging predictors and the internationalstudy to predict optimized treatment fordepression: study protocol for a randomizedcontrolled trialStuart M Grieve1,2,3,4*, Mayuresh S Korgaonkar1,5, Amit Etkin6,7, Anthony Harris1,5, Stephen H Koslow8,9,Stephen Wisniewski7, Alan F Schatzberg6, Charles B Nemeroff8, Evian Gordon1,2 and Leanne M Williams1,5,6
Abstract
Background: Approximately 50% of patients with major depressive disorder (MDD) do not respond optimally toantidepressant treatments. Given this is a large proportion of the patient population, pretreatment tests that predictwhich patients will respond to which types of treatment could save time, money and patient burden. Brainimaging offers a means to identify treatment predictors that are grounded in the neurobiology of the treatmentand the pathophysiology of MDD.
Methods/Design: The international Study to Predict Optimized Treatment in Depression is a multi-center, parallelmodel, randomized clinical trial with an embedded imaging sub-study to identify such predictors. We focus onbrain circuits implicated in major depressive disorder and its treatment. In the full trial, depressed participants arerandomized to receive escitalopram, sertraline or venlafaxine-XR (open-label). They are assessed using standardizedmultiple clinical, cognitive-emotional behavioral, electroencephalographic and genetic measures at baseline and ateight weeks post-treatment. Overall, 2,016 depressed participants (18 to 65 years old) will enter the study, of whoma target of 10% will be recruited into the brain imaging sub-study (approximately 67 participants in each treatmentarm) and 67 controls. The imaging sub-study is conducted at the University of Sydney and at Stanford University.Structural studies include high-resolution three-dimensional T1-weighted, diffusion tensor and T2/Proton Densityscans. Functional studies include standardized functional magnetic resonance imaging (MRI) with three cognitivetasks (auditory oddball, a continuous performance task, and Go-NoGo) and two emotion tasks (unmasked consciousand masked non-conscious emotion processing tasks). After eight weeks of treatment, the functional MRI isrepeated with the above tasks. We will establish the methods in the first 30 patients. Then we will identifypredictors in the first half (n = 102), test the findings in the second half, and then extend the analyses to the totalsample.
Trial registration: International Study to Predict Optimized Treatment - in Depression (iSPOT-D). ClinicalTrials.gov,NCT00693849.
Keywords: Major depressive disorder, Antidepressant treatments, Imaging, Biomarker, iSPOT-D
* Correspondence: [email protected] Brain Dynamics Centre, University of Sydney Medical School -Westmead and Westmead Millennium Institute, Sydney, NSW 2145, Australia2Brain Resource, Level 12, 235 Jones Street, Ultimo, Sydney, NSW 2007,Australia and Suite 200, 1000 Sansome Street, San Francisco, CA 94111, USAFull list of author information is available at the end of the article
© 2013 Grieve et al.; licensee BioMed Central Ltd. This is an Open Access article distributed under the terms of the CreativeCommons Attribution License (http://creativecommons.org/licenses/by/2.0), which permits unrestricted use, distribution, andreproduction in any medium, provided the original work is properly cited.
Grieve et al. Trials 2013, 14:224 Page 2 of 13http://www.trialsjournal.com/content/14/1/224
BackgroundMajor depressive disorder (MDD) is a leading cause ofmorbidity, mortality and disability for individuals aged 15to 44 years [1]. A substantial percentage, (approximately50%), of patients do not respond to antidepressant treat-ments and these individuals constitute a large proportionof the disease burden [2-5]. There is an urgent need forobjective tests that can be obtained before initiating treat-ment to predict which patients will go on to show a clin-ical response to treatment, and to identify which type oftreatment is best for the individual patient. Functional andstructural brain imaging offers a means to identify treat-ment predictors, which are based upon the neurobio-logical mechanisms of these treatments, and the means tothe pathophysiology of MDD and its subtypes.The international Study to Predict Optimized Treatment
for Depression (iSPOT-D) [6] is a large, international,multi-center, parallel model, clinical randomized trialwhich seeks to identify factors that predict treatment re-sponse to three common antidepressants. In iSPOT-D, wehave combined a practical clinical trial design with the useof brain imaging to identify imaging predictors oftreatment outcome in a real-world setting, along withother objective measures, such as electrophysiology andcognitive performance metrics. This paper presents thebackground, rationale and methodology for the imagingsub-study embedded within iSPOT-D.Recent developments in neuroimaging have yielded
powerful tools that enable quantification of both functionaland static neural connectivity. These tools include diffusiontensor imaging (DTI), functional magnetic resonance im-aging (fMRI), resting state fMRI, arterial spin labeling, posi-tron emission tomography (PET) and high-resolutioncortical mapping techniques that enable the automated, ac-curate localization of brain regions. Unfortunately, the ma-jority of studies that have used these techniques to addresstreatment prediction in MDD have been underpowered,employing small cohorts (for example, n = 20 to 30), andthey have typically focused upon a single imaging measurerather than seek convergence across multiple measures.Also, to date, no published study has been designed to testprediction across multiple antidepressants. However, aconsiderable body of data has examined the structural andfunctional differences that exist between the brains of de-pressed and non-depressed patients. These studies servedto identify the brain circuits that represent viable targetsfor testing predictors of treatment outcome.The rationale behind the use of three treatment arms in
iSPOT-D is to identify what are the unique and commonbrain circuits that modulate response and remission to dif-ferent types of anti-depressant medications, that is, select-ive serotonin reuptake inhibitors (SSRIs) versus selectivenorepinephrine reuptake inhibitors (SNRIs), or betweenthe two different types of SSRIs. The receptor-level
pharmacological actions of these medications may not bethe best indicator of the mechanisms by which they leadto remission of depression, (which may take weeks, unlikereceptor binding), and which is the primary focus of ouranalysis. For instance, sertraline and citalopram (the par-ent compounds for escitalopram) have been found to havedifferential effects in animals on hippocampal neuronalexcitability [7], and are also known to differentially alterbehavior in humans that are relevant to the brain circuitsassessed in this study [8]. To date, there have been a fewstudies using small samples that examine the functionalimaging predictors of response to individual antidepres-sants. These studies provide the basis for our rationale forthe study. For example, using emotion activation tasks, de-pression has been associated with hyper-reactivity ofamygdala circuits, which attenuates the following responseto SSRIs [9-11]. The antidepressant sertraline has similarlybeen found to predict response and “normalize” amygdalahyperactivity and medial prefrontal hypo-activity, whichcharacterize generalized social phobia, a disorder often co-morbid with depression [12].The need for a new mechanism-based approach to diag-
nosing and treating depression has been recognized inseveral initiatives. First, the research agenda for DSM-5(the fifth edition of Diagnostic and Statistical Manual ofMental Disorders) emphasizes a need to translate neuro-science research findings into a new classification systemfor mental illnesses based on underlying brain circuitry[13]. Second, the Research Domain Criteria project - aNational Institute of Mental Health initiative - aims to“develop, for research purposes, new ways of classifyingmental disorders based on dimensions of observable be-haviour and neurobiological measures” [14,15]. These ob-jectives have also been touched upon by the recentMayflower Action Group Initiative [16]. Imaging tech-niques, such as magnetic resonance imaging (MRI), pro-vide a precise window into the circuits that play a role inthe pathogenesis of depression and in the response totreatment, enabling the quantification of these circuits aspotentially predictive “biomarkers”. The National Insti-tutes of Health biomarker working group defined a bio-marker as: “a characteristic that is objectively measuredand evaluated as an indicator of normal biological pro-cesses, pathogenic processes, or pharmacologic responsesto a therapeutic intervention” [17]. There are currently noclinically useful biomarkers for predicting response toantidepressant medications [18], a shortfall that the im-aging sub-study of the iSPOT-D is designed to address.In this paper, we characterize the key features of the
iSPOT-D imaging sub-study. These features include (i) afocus on the discovery of imaging biomarkers that are likelyto be clinically useful in the treatment of depression; (ii) alarge and representative sample to achieve generalizable re-sults, including a large percentage of treatment-naive

Grieve et al. Trials 2013, 14:224 Page 3 of 13http://www.trialsjournal.com/content/14/1/224
participants; (iii) a translational design involving three com-mon, current treatment regimes to provide an understand-ing of response heterogeneity; (iv) a highly standardizedapproach across sites to maximize the power of the data;and (v) a multi-modality MRI-based approach that providesconvergent evidence that highlights key changes that arepresent.Specifically, the iSPOT-D imaging study will serve to
answer the following key questions:
1. What pre-treatment aspects of brain circuitrypredict and moderate responses to anti-depressants?
2. What aspects of brain circuitry improve followingtreatment? We expect partially distinct circuitry tobe involved in predicting response and remission todifferent antidepressants.
3. Do these predictive aspects of brain circuitry overlapwith the core imaging features that are seen indepression when we compare depressed patients tohealthy controls? Drawing on the available evidenceto date, it is expected that those circuits impaired indepression will also be the mechanism by whichantidepressants exert their mechanism of action.Thus, we will also assess if depression-relatedimpairments are “normalized” post-treatment.
4. Are there additional distinctive alterations thatidentify specific “subtypes” of depression?
5. Are there associations between the imagingmeasures and the other data available from theiSPOT-D protocol?
Methods/DesignStudy designThe structure of the parent iSPOT-D trial has been previ-ously described in detail [6]. Briefly, it is a multi-center,international, prospective, parallel model, open-label ran-domized clinical trial involving 2,016 MDD patients aged 18to 65 years. There are three treatment arms (escitalopram,sertraline and venlafaxine-XR) and a control arm, eachwith 672 participants. The healthy control participants arestudied only at baseline, while the depressed participantsare studied both at baseline and at eight weeks. The twosites for the imaging sub-study are the Brain DynamicsCenter, University of Sydney (Sydney) and the Departmentof Psychiatry and Behavioral Sciences, Stanford University(Stanford). A target of 10% of iSPOT-D participants are tobe recruited into the brain imaging sub-study with an over-all target of approximately 200 participants with MDD (67in each treatment arm) and 67 in the control group.
Organizational structure/Acquisition sitesThe iSPOT-D Executive Committee for the trial overseesthe overall study. Supervision of the study on a day-by-day basis is performed at the Global Coordinating
Center and Data Center (Sydney). Coordination of thestudy occurs via a Global Trial Coordinator and the ex-ecutive management team. There are 20 global clinicalsites involved in patient recruitment, though only twosites are involved in the imaging sub-study (Sydney andStanford). The imaging-specific components of the sub-study are overseen by the senior imaging scientist (MSK)and the head of the imaging unit (SMG) at the centralimaging site (University of Sydney, Westmead Hospital).The imaging data obtained at the secondary imaging site(Stanford University) are monitored at both the point ofacquisition and the central imaging facility.
Study participantsDetails of the study inclusion–exclusion criteria are pro-vided in Williams et al. [6]. In short, the primary diagno-sis of nonpsychotic MDD is confirmed using the Mini-International Neuropsychiatric Interview (MINI) [2,3],according to DSM-IV criteria, and a score ≥16 on the17-item Hamilton Rating Scale for Depression (HRSD-17) [4]. All MDD participants are either antidepressantmedication (ADM) naïve or, if they had been previouslyprescribed an ADM, had undergone a wash-out periodof at least five half-lives. Healthy control participants areextensively screened for the absence of Axis I disorders(using the MINI) and for an HRSD17 score <7.Imaging participants are selected by sequentially
recruiting patients at the time of enrollment (Figure 1).Additional MRI-specific exclusion criteria not applied tothe general patients include the standard safety criteriafor MRI scanning: a cardiac pacing/defibrillator device,claustrophobia, the presence of a magnet-incompatiblemetal prosthesis. Demographic information for both theMDD and control groups in the first 15% of participantsis summarized in Table 1.
TreatmentParticipants were randomized to treatment usingPhaseForward’s™ validated, Web-based Interactive ResponseTechnology. A blocked randomization procedure wasundertaken centrally (block size: 12, across sites). Neitherparticipants nor investigators/raters were blinded to treat-ment assignment. The participant’s treating clinician (gen-eral practitioners and psychiatrists) prescribed ADMsadjusted dosage according to routine clinical practice.
Ethical considerationsThe study is being conducted according to the principlesof the Declaration of Helsinki 2008 and the InternationalConference on Harmonization guidelines. Local regula-tions were also observed: The Australian TherapeuticGoods Association [19] and the United States Food andDrug Administration Code of Federal Regulations [20].Prior to enrollment, the study procedures are fully
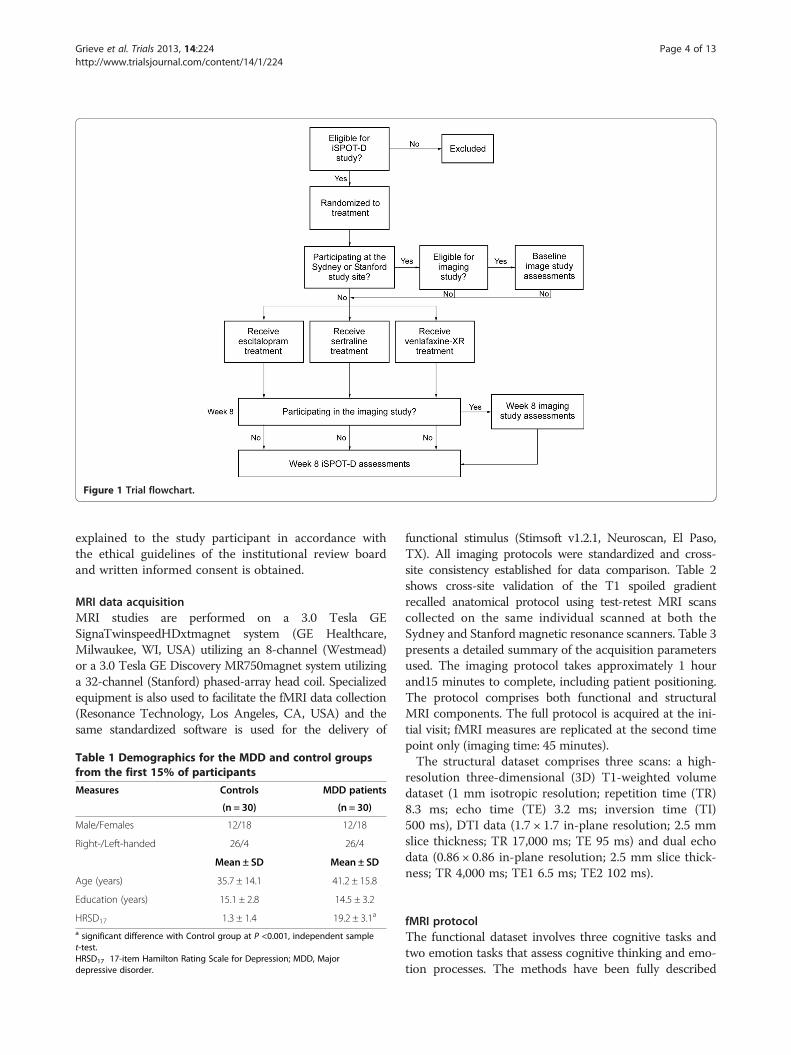
Figure 1 Trial flowchart.
Grieve et al. Trials 2013, 14:224 Page 4 of 13http://www.trialsjournal.com/content/14/1/224
explained to the study participant in accordance withthe ethical guidelines of the institutional review boardand written informed consent is obtained.
MRI data acquisitionMRI studies are performed on a 3.0 Tesla GESignaTwinspeedHDxtmagnet system (GE Healthcare,Milwaukee, WI, USA) utilizing an 8-channel (Westmead)or a 3.0 Tesla GE Discovery MR750magnet system utilizinga 32-channel (Stanford) phased-array head coil. Specializedequipment is also used to facilitate the fMRI data collection(Resonance Technology, Los Angeles, CA, USA) and thesame standardized software is used for the delivery of
Table 1 Demographics for the MDD and control groupsfrom the first 15% of participants
Measures Controls MDD patients
(n = 30) (n = 30)
Male/Females 12/18 12/18
Right-/Left-handed 26/4 26/4
Mean ± SD Mean ± SD
Age (years) 35.7 ± 14.1 41.2 ± 15.8
Education (years) 15.1 ± 2.8 14.5 ± 3.2
HRSD17 1.3 ± 1.4 19.2 ± 3.1a
a significant difference with Control group at P <0.001, independent samplet-test.HRSD17 17-item Hamilton Rating Scale for Depression; MDD, Majordepressive disorder.
functional stimulus (Stimsoft v1.2.1, Neuroscan, El Paso,TX). All imaging protocols were standardized and cross-site consistency established for data comparison. Table 2shows cross-site validation of the T1 spoiled gradientrecalled anatomical protocol using test-retest MRI scanscollected on the same individual scanned at both theSydney and Stanford magnetic resonance scanners. Table 3presents a detailed summary of the acquisition parametersused. The imaging protocol takes approximately 1 hourand15 minutes to complete, including patient positioning.The protocol comprises both functional and structuralMRI components. The full protocol is acquired at the ini-tial visit; fMRI measures are replicated at the second timepoint only (imaging time: 45 minutes).The structural dataset comprises three scans: a high-
resolution three-dimensional (3D) T1-weighted volumedataset (1 mm isotropic resolution; repetition time (TR)8.3 ms; echo time (TE) 3.2 ms; inversion time (TI)500 ms), DTI data (1.7 × 1.7 in-plane resolution; 2.5 mmslice thickness; TR 17,000 ms; TE 95 ms) and dual echodata (0.86 × 0.86 in-plane resolution; 2.5 mm slice thick-ness; TR 4,000 ms; TE1 6.5 ms; TE2 102 ms).
fMRI protocolThe functional dataset involves three cognitive tasks andtwo emotion tasks that assess cognitive thinking and emo-tion processes. The methods have been fully described

Table 2 Cross-site validation of the T1 SPGR anatomical protocol
Intra-class correlation Stanford scan 1 Stanford scan 2 Sydney scan 1 Sydney scan 2
Stanford scan1 1.0
Stanford scan 2 0.999 1.0
Sydney scan1 0.996 0.996 1.0
Sydney scan 2 0.997 0.996 0.996 1.0
Mean gray matter volume (mm3) 7,175 ± 5,527 7,198 ± 5,552 7,193 ± 5,620 7,226 ± 5,668
Intra-class reliability coefficients for volumetric data estimated for 68 brain gray matter regions using the T1 SPGR MRI protocol, using repeat scans done at theStanford and Sydney site magnetic resonance scanners. Data show that inter-site scan reliability (for example, Stanford scan 1 - Sydney scan 1) is high and on thesame comparative level as within-site scans (for example, Sydney scan 1 and Sydney scan 2). The mean (+ SD) for gray matter volume across the 68 brain regionsfor each scan is also listed.MRI Magnetic resonance imaging, SD Standard deviation, SPGR Spoiled gradient recalled.
Grieve et al. Trials 2013, 14:224 Page 5 of 13http://www.trialsjournal.com/content/14/1/224
elsewhere but are summarized below for completeness[21,22].The cognitive tasks include an auditory oddball task, a
continuous performance task and the Go-NoGo task.The oddball task is used for evaluating attention modu-lation. The stimuli consist of 20 high-pitched (1,000 Hzat 75 dB) ‘target’ tones and 100 lower-pitched (500 Hz at75 dB) ‘non-target’ tones. In the continuous perform-ance task, participants view a series of 120 letters (B, C,D or G) and are instructed to press a button when thesame yellow letter appears twice in a row (a ‘1-back’ de-sign). To provide a baseline, 40 stimuli are presented inwhite, which participants are instructed to ignore. TheGo-NoGo task is used to assess impulsivity (automatic-ally-generated ‘Go’ responses) versus inhibition (‘NoGo’responses). ‘Go’ responses are defined by the word‘press’ presented in GREEN, while ‘NoGo’ responses aredefined by the word ‘press’ presented in RED.The emotion tasks consist of an unmasked conscious
emotion processing task and a masked non-consciousemotion processing task. The unmasked emotion process-ing task [23,24] was developed from a standardized set of3D evoked facial expressions that depict fear, anger, dis-gust, sadness, happiness or are neutral [25]. There are atotal of 240 stimuli grouped in blocks of eight faces of thesame emotion, with each emotion block repeated fivetimes. In the masked non-conscious emotion processingtask, the same set of facial emotion stimuli are used buteach stimulus consists of the emotion face presented non-consciously (for 10 ms), followed immediately by a neutralface mask stimulus (for 150 ms). This paired presentationis designed to prevent conscious awareness of the emotionstimulus [23,24].
Data processing pipelineData are processed using a custom-built automatedpipeline run via scripts in the MATLAB 7.5 software(MathWorks, Natick, MA, USA). Processing tasks areperformed by a cluster of 18 custom-built computernodes running Linux (CENTOS 5.0 distribution); tasksare assigned, queued and coordinated using a central
computer. Specific details of the analysis procedures areprovided below. In summary, the raw DICOM data fromthe magnetic resonance scanner are imported using ascript and converted to NIfTI format, then is run throughsequential routines drawn from the Functional MRI of theBrain (FMRIB) Software Library (FSL) release 4.1.3(http://www.fmrib.ox.ac.uk/fsl) [26], the Freesurfer imageanalysis suite (version 4.3) (documented and freely avail-able for download online (http://surfer.nmr.mgh.harvard.edu/) [27], SPM8 software [28] and custom-written rou-tines that have been described in previous publications[29-32]. Anonymized data are transferred between the twoimaging sites via a secure ftp connection.
Data storageAnonymized data are kept in a structured file systemthat includes selected intermediate steps to permit theeasy recalculation of data for specific analyses. Off-siteback-ups of data are kept in a secure facility.
Specific MRI analysesVolumetric and cortical thickness dataMeasurements of cortical thickness and volume are madeas described previously [33] using Freesurfer. Briefly, cor-tical surface reconstruction and volumetric segmentationare performed in an automated manner on the 3D T1weighted structural images using the Freesurfer imageanalysis suite (version 4.3). The full technical details ofthese procedures are described elsewhere [34-45]. All cor-tical segmentation and labels are manually inspected foraccuracy. Voxel-based morphometry (VBM8) analysis asimplemented in SPM8 is also performed.
DTI processing - tract-based spatial statistical (TBSS) andtractography analysisWe have previously presented the TBSS-based analysisused to process our DTI data [46]. DTI data arepreprocessed and analyzed using the Oxford Centre forFMRIB Diffusion Toolbox and TBSS software tools, partof the FSL release 4.1.3 (http://www.fmrib.ox.ac.uk/fsl)[26,47,48]. The raw DTI data for each participant are

Table 3 Detailed summary of the MRI acquisition parameters
Domain Task/Scan type MRI/Autonomic measures Scan protocol/Task description
Structuralscans
T1 Gray/white matter volume Scan protocol: 3D T1 weighted high resolution SPGR MRIscan, TR = 8.3 ms, TE = 3.2 ms, Flip angle = 110, TI = 500 ms,NEX = 1, Matrix = 256 × 256, resolution = 1 mm× 1 mm, 180contiguous 1 mm sagittal slices.
Cortical thickness
Cortical surface area
Diffusion TensorImaging (DTI)
Fractional Anisotropy (FA), mean (MD), axial(AD), radial (RD) diffusivity measures for whitematter regions and fiber tracts
Scan protocol: Spin echo DTI echo planar imaging scan, 42directions, b value = 1,250, TR = 17,000 ms, TE = 95 ms, NEX = 1,Matrix = 128 × 128, resolution = 1.72 mm × 1.72 mm, 70contiguous 2.5 mm axial/oblique slices covering the whole brain.
PD/T2 Proton density Scan protocol: 2D Fast Spin echo scan, TR = 4,000 ms, TE1 =6.4 ms, TE2 = 102 ms, NEX = 1, Matrix = 256 × 256, resolution =0.86 mm× 0.86 mm, ETL = 16, 70 contiguous 2.5 mm axial/oblique slices covering whole brain.
T2 structural scan for clinical evaluation
Functionalscans
Oddball Changes in fMRI BOLD signal Scan protocol: Echo planar imaging scan, TR = 2,500 ms, TE =27.5 ms, Flip angle = 900, NEX = 1, Matrix = 64 × 64, resolution =3.75 mm× 3.75 mm, 40 contiguous 3.5 mm axial/obliqueslices covering whole brain in each volume, total 120 volumes.
Average heart rate
Average skin conductance Task description: 20 target (1,000 Hz) and 100 nontarget(50 Hz) tones presented one at a time at 75 db (50 ms each,ISI = 2.4 seconds).
Continuous performancetest (CPT)
Changes in fMRI BOLD signal Scan protocol: See Oddball protocol
Average heart rate Task description: 120 stimuli are presented (B, C, D or G letters,for 200 ms each, ISI = 2.3 sec). Sixty were yellow letters to beheld in working memory (no consecutive repetitions), 20 were1-back sustained attention stimuli (consecutive repetitions of aletter in yellow) and 40 were perceptual baseline stimuli inwhite letters. Participants were measured for the number oferrors or omissions.
Average skin conductance
Go-NoGo Changes in fMRI BOLD signal Scan protocol: See Oddball protocol
Average heart rate Task description: 180 Go stimuli (word ‘press’ in green) andNoGo stimuli (word ‘press’ in red) each presented sequentially(500 ms each, ISI = .75 seconds). NoGo stimuli were notrepeated more than three times in a row. Participants weremeasured for target detection rate, response time, errors ofcommission and errors of omission.
Average skin conductance
Emotion (masked‘nonconscious’; Thenunmasked ‘conscious’)
Changes in fMRI BOLD signal Scan protocol: See Oddball protocol
Average heart rate Task description: 240 3D evoked standardized facial expressionsthat depicted fear, anger, disgust, sadness, happiness or neutralwere presented for 500 ms (ISI = .75 seconds). Stimuli weregrouped into eight faces expressing the same emotion andwere repeated five times in a pseudorandom order.Participants were assessed for explicit emotion processing forthe ‘Masked’ condition.
Average skin conductance The same set of facial expressions was presented for the‘Unmasked’ condition; however, backward masking (expressionpresented for 10 ms immediately followed by a neutral face for190 ms) was used to prevent conscious awareness offacial expression.
Additionalscan
Phase map Map magnetic field in homogeneitiesfor EPI distortion correction
Scan protocol: Dual echo MRI scan, TE1 = 10 ms, TE2 = 12.5 ms,TR = 700 ms, Flip angle = 150, NEX = 1, Matrix = 128 × 128,40 contiguous 3.5 mm axial/oblique slices.
2D Two-Dimensional, 3D Three-Dimensional, BOLD Blood oxygen level dependent; EPI, Echo-planar imaging, ETL Echo-train length, fMRI Functional magneticresonance imaging, ISI Inter-stimulus interval, MRI Magnetic resonance imaging, NEX Number of excitations, PD Proton density, SPGR Spoiled gradient recalled,TE Echo time, TR Repetition time.
Grieve et al. Trials 2013, 14:224 Page 6 of 13http://www.trialsjournal.com/content/14/1/224
first corrected for head movement and eddy current dis-tortions. Diffusion tensor models are then fitted inde-pendently for each voxel within the brain mask andimages of fractional anisotropy (FA), mean diffusivity(MD) and first (λ1), second (λ2) and third Eigen value
(λ3) are generated for each participant. FA images fromeach participant are then aligned to the FMRIB58_FAtemplate and transformed into Montreal NeurologicalInstitute (MNI) 152 1 mm3 standard space usingFMRIB’s nonlinear registration tool FNIRT [49,50]. Next,

Grieve et al. Trials 2013, 14:224 Page 7 of 13http://www.trialsjournal.com/content/14/1/224
an average FA image is generated and thinned to createa white matter skeleton representing the centers of allwhite matter tracts common to all participants. This FAskeleton is then thresholded to FA ≥0.3 to include themajor white matter pathways but avoid peripheral tractsthat are more vulnerable to inter-participant variabilityand/or partial volume effects with gray matter. Each par-ticipant’s aligned FA image is then projected onto themean FA skeleton. These skeletonized participant datawill be used for performing voxel-wise cross-participantstatistics using permutation testing procedures. Clusterswith significant differences will be labeled using theJohns Hopkins University International Consortium forBrain Mapping (JHU ICBM)-DTI-81 white matter labelsatlas [51]. DTI tractography will also be performed usinga multi-fiber diffusion probabilistic model [52]. Thismethod estimates probability distributions for one ormore fiber populations at each brain voxel. DTItractography will allow obtaining a more precise quanti-fication of the exact orientation and trajectory of WMfiber tracts.
Functional MRI data analysisThe fMRI analysis procedures are described in detailelsewhere [22]. In brief, pre-processing and analysis areperformed using SPM8 software (www.fil.ion.ucl.ac.uk/spm), and involve motion correction, global signal esti-mation and removal, estimation of normalization trans-forms from functional to standard MNI space, spatialsmoothing, and then application of a high-pass filter. Acanonical hemodynamic response function (HRF)-con-volved event-related model is used to model the bloodoxygen level dependent (BOLD) responses for the threecognitive tasks. An HRF-convolved box-car function isused to model the BOLD response for both of the emo-tional processing tasks. Contrast images for each cogni-tive thinking and emotion processing task are generatedand will be evaluated for voxel-wise comparisons inBOLD signal for the whole brain. A significance thresh-old of P <0.05 corrected for multiple comparisons willbe used. Clusters with significant differences will be la-beled using the Talairach Atlas.
Region of interest definitionsTo test specific hypotheses of regional involvement in vol-ume measurements, fMRI activation tasks and, in the rest-ing state-fMRI, standardized regions of interest (ROI) havebeen defined using the WFU PickAtlas software as a basis[53]. For selected ROIs without standardized availablemasks, custom definitions will be generated using the au-tomated coordinate extraction method within theNeuroSynth framework (http://neurosynth.org) [54]. Thisenvironment uses data derived from a machine-learningtechnique (naive Bayes classification) to estimate meta-
analysis maps of activation maps based on specified searchterms. For DTI data, the JHU white matter atlas will beused with the TBSS processed data to define white matterfiber bundles. DTI tractography will also be performed todefine individualized fiber tracts for each participant.
Quality controlMRI data are evaluated at the time of acquisition by theradiographer. Each MRI study (excluding the fMRI data)is reported by a radiologist at the site of acquisition (De-partments of Radiology, Westmead Hospital and StanfordUniversity) to exclude structural abnormalities. Theimported NIfTI files are visually inspected by the local im-aging scientist prior to analysis. MRI protocols were stan-dardized by using careful synchronization of parametersbetween sites, scanning of a human phantom on multipleoccasions (MSK, SMG), inter-site visits and ongoing clin-ical assessment (see Table 2). Routine quality control ofthe analysis pipeline was performed using standardizedoutputs generated to reflect the quality of motion correc-tion, image registration and parameter maps for the func-tional data, fractional anisotropy images for the DTI dataand cortical-subcortical parcellations from Freesurfer forthe structural T1 data.
Analytic approachAnalyses of iSPOT-D imaging data will be conducted inthree phases.
Phase 1 - identification of putative imaging biomarkers forMDD and subtype classificationPhase 1 includes the first 15% of the MDD cohort tested atthe Sydney site (that is, 30 MDD participants, 30 matchedcontrols). Analyses will test for the convergence of struc-tural and functional imaging data for brain circuitry dys-function in depression (that is, Question 1). These analyseswill replicate existing analyses in the literature using struc-tural and functional imaging in MDD. We provide out-comes from these Phase 1 analyses in this report.
Phase 2 - testing of biomarkers, hypothesis generation fortesting against Phase 3 dataPhase 2 includes the first 50% of the MDD cohort tested atthe Sydney site (that is, 102 MDD participants with 34 ineach of the three treatment arms, and 34 matched con-trols). Analyses will mainly identify baseline brain circuitrypredictors of treatment response, core brain circuitry asso-ciated with depression and its subtypes, and brain circuitsthat change with treatment (that is, Questions 1 through 4).
Phase 3 - replication of early findings, testing associationsin pooled dataPhase 3 includes the full MDD cohort tested at the Syd-ney site (204 MDD participants, 68 matched controls)
Grieve et al. Trials 2013, 14:224 Page 8 of 13http://www.trialsjournal.com/content/14/1/224
and Stanford site (51 MDD participants, 17 matchedcontrols). Analyses will replicate findings from Phase 2analyses using the entire Sydney cohort and, a separatereplication will be performed in an independent Stanfordcohort. The issue of inter-site variance between the twoimaging sites will be addressed prior to pooling data. Wewill first check for systematic differences, if these existthen they will be modeled out from the analysis, usingsite as a covariate. The full cohort will also provide suffi-cient power to test for associations of imaging measureswith other data available from the iSPOT-D study proto-col (Question 5).As a first pass, each of the MRI measures will be ana-
lyzed independently and then combined into a multi-modal multiple regression analysis.
Power Calculation/Effect sizeFor analysis of predictive measures (for example, im-aging measures that predict treatment response or re-mission due to a specific agent, or predict treatmentresistance assuming that about 50% of participants willrespond [55]) at a statistical power of 80% and an effectsize of 1 standard deviation, the sample size required is17, (that is, assuming each treatment has N of approxi-mately 102/3 -- > N = 34; meaning n(R) = 34*.5 = 17 re-sponders/non-responders). This permits us to analyzesingle treatment arms at the 50% data level, enablingreplication of effects with the second 50% of data.
Future exploratory analysesThe high-powered imaging dataset available from theiSPOT-D study will also provide the opportunity for newanalyses on the cutting edge of the imaging field. Below,we list some of the novel analyses that we plan to con-duct using the imaging data.
Whole brain mapping of inter-regional connectivityusing DTIWe quantify inter-regional white matter connectivity bydefining cortical ROIs based on the cortical thicknessparcellation, then determining the number of fibersconnecting each region. Fiber tracking utilizes a multi-fiber diffusion probabilistic model that estimates probabil-ity distributions for one or more fiber populations at eachbrain voxel [52]. Tractography is performed by sequen-tially using each of the cortical labels as seed and theremaining labels as targets. The resulting dataset, a 70 ×70 inter-regional connectivity matrix for each participant,will then be subjected to either a pattern-based analysis(for example, principle components analysis [56] or grouptheory [57-60]), or a focused, hypothesis-driven analysis ofspecific inter-regional connectivity. This method has beenpreviously described using Phase 1 data from the first 15%of the iSPOT-D dataset [56]. We used a pattern analysis
approach to analyze these data to show a 92% accuracy incharacterizing the MDD and control cohorts.
White matter hyperintensity (WMH) analysisWMH will be measured using a custom, semi-automatedroutine using dual-echo data (proton density and spinecho data) combined with reformatted T1W data in theaxial plane. Initial lesions are selected using OsiriX (http://www.osirix-viewer.com) [61]; then lesions are quantifiedin MATLAB using a multi-modality (T1, T2, Proton Density)cluster analysis technique (details to be published in a fu-ture paper). A separate qualitative analysis will also beperformed using the well-validated Schelton’s score [62].
Volume and connectivity analysis of the basal ganglia,amygdala, thalamus, brainstem and cerebellumSeveral novel analytical approaches currently underwayare designed to obtain more detailed connectivity infor-mation from the deep gray structures and from the cere-bellum and brainstem structures, along the lines ofprevious probabilistic approaches [47].
Resting state fMRI analysisThe fMRI task data will be used to extract resting statefMRI data. To identify resting state connectivity, the taskeffects are modeled within a general linear model frame-work. These effects are removed and the remaining (re-sidual) time-series signal is analyzed using SPM8 software.This method of obtaining resting connectivity from taskfMRI data has been previously established and validatedagainst non-task-derived resting state data [63,64].
Small world analysis of brain networksThe application of graph theory methods to imaging datahas been useful in extracting sensitive measures of brainconnectivity [57-60]. We will test how these measures arealtered in MDD and test their prognostic value.
ResultsHere we present a summary of outcomes to date fromthe analysis of Phase 1 using multimodality data (DTI,fMRI and T1). Using these measures, we test for conver-gent evidence of core brain circuitry dysfunction in de-pression, looking at the baseline data for the first 15% ofsubjects (prior to treatment). For this analysis, we inves-tigate the mechanisms of this circuitry, with a specificfocus on the dorsolateral prefrontal cortex, anterior cin-gulate cortex (ACC) and amygdala.Our preliminary data (first 15% of subjects) demon-
strate prefrontal dysfunction in MDD, with contributionsfrom DTI, fMRI and T1 datasets. In the melancholicMDD subgroup, we have shown alterations of whitematter within the white matter fiber tracts that are asso-ciated with the prefrontal, limbic and thalamic circuitry

Grieve et al. Trials 2013, 14:224 Page 9 of 13http://www.trialsjournal.com/content/14/1/224
[46,56]. For the same cohort, we also found prefrontaldysfunction using fMRI data from all five cognitive andemotion processing tasks: MDD participants were distin-guished by a distinctive biosignature of hypoactivation ofthe dorsolateral prefrontal cortex during working mem-ory updating and during conscious negative emotionprocessing, hyperactivation of the dorsomedial pre-frontal cortex (ACC) during working memory and
Figure 2 Summary of preliminary functional MRI data from the first 1demonstrating significant hypoactivation of the left amygdala for non-consand control groups (left) shows a significant difference (corrected P <0.05).are shown in the right amygdala, right dorsolateral prefrontal cortex and athe cingulate bundle was significantly lower (P <0.05) in the MDD group in
response inhibition cognitive tasks, and hypoactivationof the dorsomedial prefrontal cortex (ACC) during con-scious processing of positive emotion tasks [22].Further data from the first 15% of subjects highlight
the central role of the limbic regions and the ACC inMDD using convergent evidence from fMRI, structuralT1 and DTI data. The fMRI data and DTI data were an-alyzed using the methods described in Korgaonkar et al.
5% of participants (MDD versus controls). (a) A coronal view (right)cious negative emotion processing. Comparison between the MDD(b) Significant reductions in gray matter volume (uncorrected P <0.05)nterior cingulate regions. (c) FA in the fornix and cingulum portion ofcomparison to controls.

Grieve et al. Trials 2013, 14:224 Page 10 of 13http://www.trialsjournal.com/content/14/1/224
[22,46], while the structural T1 weighted data were ana-lyzed using the methods described above. We tested forMDD-Control group differences in the fMRI BOLD signaland gray matter volume in the ACC and amygdala, as wellas for FA differences in two white matter fiber bundles as-sociated with these regions, that is, the cingulum cingulatebundle and fornix respectively. A significant difference(corrected P <0.05) between the MDD and control groupwas found in the left amygdala for non-conscious negativeemotion processing, with hypoactivation of this regionseen in the MDD group (Figure 2a) (significant differencesin ACC and DLPFC are already reported in [22]). A reduc-tion in gray matter volume (uncorrected P <0.05) was alsoseen in both the amygdala and ACC regions (Figure 2b).FA in the cingulum cingulate bundle was also found to besignificantly reduced (P <0.05) in the MDD group in com-parison to controls (Figure 2c).
DiscussionThere are currently no clinically useful predictors ofMDD response or remission with the antidepressantsescitalopram, sertraline or venlafaxine-XR. MRI mea-sures of brain circuitry and function hold great potentialas “biomarkers” in psychiatric disease; however, there isa lack of data regarding their use in predicting treatmentresponse in MDD. The imaging sub-study of iSPOT-Dseeks to provide high-level evidence regarding which as-pects of brain circuitry predict and moderate responseto these antidepressants.In this paper, we have outlined the protocol and ration-
ale for the imaging sub-study of iSPOT-D. We summa-rized the already-published outcomes from the first 15%of the data and also presented some additional supportivedata. These multimodality outcomes provide the first con-vergent evidence of dysregulation in both the activationand connectivity of the prefrontal-limbic circuitry in de-pression. Analysis of the 50% data will focus on predictivemeasures of treatment response, with an a priori focus onthese circuits. The careful design of our study, its powerand the focus on multimodality data maximize the possi-bility of achieving our aim of generating imaging-basedmetrics that have clinically relevant predictive value.At the completion of iSPOT-D and the imaging sub-
study delineated here, we will investigate how imagingmeasures of brain circuitry relate to other clinical, gen-etic, behavioral and physiological units of analysis inorder to test combined predictors of treatment outcome.
Trial statusEnrollment is ongoing. Final data collection date for pri-mary outcome measure is estimated to be August 2013.Study completion date is estimated to be December 2013.
Abbreviations2D: Two-dimensional; 3D: Three-dimensional; ACC: Interior cingulate cortex;ADM: Antidepressant medication; BOLD: Blood oxygen level dependent;DSM-5: the fifth edition of the Diagnostic and Statistical Manual of MentalDisorders; DTI: Diffusion tensor imaging; EPI: Echo-planar imaging; ETL: Echo-train length; FA: Fractional anisotropy; fMRI: Functional magnetic resonanceimaging; FMRIB: Functional MRI of the brain; FSL: Functional MRI of the brainsoftware library; HRF: Hemodynamic response function; HRSD17: 17-itemHamilton Rating Scale for Depression; ISI: Inter-stimulus interval; iSPOT-D: International study to protect optimized treatment for depression; JHUICBM: Johns Hopkins University International Consortium for Brain Mapping;MD: Mean diffusivity; MDD: Major depressive disorder; MINI: Mini-international neuropsychiatric interview; MNI: Montreal neurological institute;MRI: Magnetic resonance imaging; NEX: Number of excitations; PET: Positronemission tomography; ROI: Regions of interest; SD: Standard deviation;SNRIs: Selective norepinephrine reuptake inhibitors; SPGR: Spoiled gradientrecalled; SSRIs: Selective serotonin reuptake inhibitors; TBSS: Tract-basedspatial statistical; TE: Echo time; TR: Repetition time; VBM8: Voxel-basedmorphometry; WMH: White matter hyperintensity; λ1: First Eigen value;λ2: Second Eigen value; λ3: Third Eigen value.
Competing interestsSMG has received consulting fees from the Brain Resource Company. AH hasreceived consultancy fees from Eli Lilly, Janssen-Cilag and Lundbeck Australia.He has received payments for educational sessions run for Astra Zeneca,Janssen Cilag and Eli Lilly. He has run educational sessions Reed BusinessInformation. He is an investigator on industry sponsored trials by Hoffman-LaRoche, Janssen-Cilag Australia and Brain Resource Company. SHK serves as aconsultant and has stock options with Brain Resource Company. SW hasreceived fees as a consultant from CyberonicInc, ImaRx Therapeutics Inc,Bristol-Myers Squibb Company, Organon, Case-Western University andSingapore Clinical Research Institute. AFS has received fees as a consultantfrom Brain Cells, CeNeRxm, CNS Response, Corcept, Glaxo-Smith Kline, Merckand Company, Neuronectics, PharmaNeuroBoost, Sanofi-Aventis and Takeda.He is a stock holder in Amnestix, Brain Cells, CeNeRx, Corpect, Forest, Merckand Company, Neurocrine, Pfizer, PharmaNeuroBoost, Somaxon and Synosis.CBN has received a Scientific Advisory Board/Board of Directors fee fromAstraZeneca, PharmaNeuroboost, Forest Laboratories, NARSAD, Quintiles,Janssen/Ortho-McNeil, Mt. Cook PharmaInc, George West Mental HealthFoundation and NovaDelPharma. He holds stock in Corcept, CeNeRx, ReVax,PharmaNeuroboost and NovadelPharma. CBN has patents for methods anddevices for the transdermal delivery of lithium (US 6,375,990 BI) and amethod to estimate serotonin and norepinephrine transporter occupancyafter drug treatment using patient or animal serum (provisional filing April,2001). EG is founder of Brain Resource Ltd and receives income as its ChiefExecutive Officer and Chairman. He has stock options in Brain Resource Ltd.LMW has received consulting fees and stock options in Brain Resource Ltd,and is a stock holder in Brain Resource Ltd. She has received Advisory Boardfees from Pfizer.MSK and AE have no competing interests to disclose.
Authors’ contributionsSMG made substantial contributions to conception and design of the trial,provided important intellectual content to the manuscript, and wassubstantially involved in drafting and revising the manuscript. MSK, AE, AH, SHK,SW, AS, CBN and EG made substantial contributions to the conception of thetrial, and were substantially involved in drafting and revising the manuscript.LMW made substantial contributions to the conception and design of the trial,provided important intellectual content to the manuscript, and wassubstantially involved in drafting and revising the manuscript. All authors gavefinal approval of the submitted version of the manuscript.
Authors’ informationSMG is an Associate Professor at the Sydney Medical School in the Universityof Sydney. He designed the imaging protocol for the study and with MSKhas led the analysis and processing of the imaging data. He is a clinician-scientist with a strong interest in translational imaging. He completed hisspecialty training in radiology at Royal Prince Alfred Hospital and hisdoctorate in MRI imaging of the brain at Oxford University. His clinical andresearch interests are focused on cardiac and neuroimaging. He is currently a
Grieve et al. Trials 2013, 14:224 Page 11 of 13http://www.trialsjournal.com/content/14/1/224
Sydney Medical Foundation Fellow at the University of Sydney and Head ofImaging at the Brain Dynamics Center.MSK is a Senior Imaging Scientist on the study. He completed his Masters inMedical Physics and doctoral degree in MR Imaging at the department ofBiomedical Engineering at Stony Brook University, NY. He is currentlyappointed as Senior Imaging Scientist and Director of Brain DynamicsCenter, Sydney Medical School - Westmead.AE is Assistant Professor of Psychiatry and Behavioral Sciences at StanfordUniversity, an Investigator in the Sierra-Pacific Mental Illness ResearchEducation and Clinical Center (MIRECC) at the Veterans Affairs Palo AltoHealth Care System, and a board-certified psychiatrist. He directs a laboratoryfocused on understanding the neurobiology of mood and anxiety disorders.AH is an Associate Professor in the Discipline of Psychiatry at the Universityof Sydney and is the Clinical Director at the Brain Dynamics Centre,Westmead Millennium Institute at the University of Sydney. He is a seniorstaff specialist for the Western Sydney Local Health Network. His interestshave centered upon the treatment, psychophysiology and neuroimaging ofyoung people with psychosis and depression.SHK is a senior research fellow in the Miami University School of Psychiatryand Behavioral Sciences and a Director on the board of the BRAINnetFoundation. He recently served as the Research Director for the AmericanFoundation for Suicide Prevention. He was the first Director of theNeuroscience Research Branch at the NIMH where he was responsible forinitiating new research programs, including Human Brain Imaging and theHuman Brain Project. SHK was founder of the International NeuroinformaticsCoordinating Facility. He currently serves as a consultant to Brain Resources.SW is a professor in the Department of Epidemiology and Co-Director of theEpidemiology Data Center, University of Pittsburgh. His secondaryappointment is in psychiatry. He is an Associate Dean for Research in theGraduate School of Public Health.AFS is the Kenneth T. Norris, Jr. Professor in Psychiatry and BehavioralSciences at Stanford University. Before this, he built the department ofPsychiatry and Behavioral Sciences as chair of the department.CBN is the Leonard M. Miller Professor and Chairman of the Department ofPsychiatry and Behavioral Sciences, University of Miami.EG is the founder and Chairman of Brain Resource, which has establishedthe first standardized battery for assessing human behavior and brainfunction and structure.LMW is acting Professor in Psychiatry and Behavioral Sciences at StanfordUniversity, and holds a joint appointment as Professor in CognitiveNeuropsychiatry at Sydney Medical School.
AcknowledgementsWe acknowledge Brain Resource as the sponsor for the iSPOT-D study(NCT00693849). Claire Day (Global Study Co-ordinator) is thanked for her pivotalrole in making this study happen, and for her boundless enthusiasm andenergy. We thank the iSPOT-D Executive Committee for their valuable inputinto this manuscript and into the study overall (Members: A John Rush (Chair),Lea Williams (Academic PI), Steve Koslow, AmitEtkin, Evian Gordon, SteveKoslow, Stephen R Wisniewski. We also thank those responsible for designingthe iSPOT-D protocol (A. John Rush, Lea M Williams, Evian Gordon, Charles BNemeroff, Alan F Schatzberg). We gratefully acknowledge the editorial supportof Jon Kilner, MS, MA (Pittsburgh, PA, USA). SMG acknowledges the support ofthe Sydney University Medical Foundation. Dr Lavier Gomes, Ms Sheryl Fosterand the Department of Radiology at Westmead are thanked for their substantialcontributions to MRI data acquisition.
Author details1The Brain Dynamics Centre, University of Sydney Medical School -Westmead and Westmead Millennium Institute, Sydney, NSW 2145, Australia.2Brain Resource, Level 12, 235 Jones Street, Ultimo, Sydney, NSW 2007,Australia and Suite 200, 1000 Sansome Street, San Francisco, CA 94111, USA.3Sydney Medical School, University of Sydney, Camperdown, NSW 2050,Australia. 4Department of Radiology, Royal Prince Alfred Hospital,Camperdown, NSW 2050, Australia. 5Discipline of Psychiatry, University ofSydney Medical School: Western, Westmead Hospital, Sydney, NSW 2145,Australia. 6Department of Psychiatry and Behavioral Sciences, StanfordUniversity, 401 Quarry Road, Stanford, CA 94305, USA. 7Sierra-Pacific MentalIllness Research, Education, and Clinical Center (MIRECC), Veterans Affairs PaloAlto Health Care System, 3801 Miranda Ave, Palo Alto, CA 94304, USA.8Department of Psychiatry and Behavioral Sciences, University of Miami Miller
School of Medicine, Miami, FL 33136, USA. 9BRAINnet Foundation, 71Stephenson Street, Suite 400, San Francisco, CA 94105, USA.
Received: 4 February 2013 Accepted: 4 July 2013Published: 18 July 2013
References1. Mathers C, Fat DM, Boerma JT: The Global Burden of Disease: 2004 update.
Geneva: World Health Organization; 2008.2. Exner C, Lange C, Irle E: Impaired implicit learning and reduced pre-
supplementary motor cortex size in early-onset major depression withmelancholic features. J Affect Disord 2009, 119:156–162.
3. Shah PJ, Glabus MF, Goodwin GM, Ebmeier KP: Chronic, treatment-resistant depression and right fronto-striatal atrophy. Br J Psychiatry 2002,180:434–440.
4. Soriano-Mas C, Hernández-Ribas R, Pujol J, Urretavizcaya M, Deus J, HarrisonBJ, Ortiz H, López-Solà M, Menchón JM, Cardoner N: Cross-sectional andlongitudinal assessment of structural brain alterations in melancholicdepression. Biol Psychiatry 2011, 69:318–325.
5. Greenberg P, Corey-Lisle PK, Birnbaum H, Marynchenko M, Claxton A:Economic implications of treatment-resistant depression amongemployees. Pharmacoeconomics 2004, 22:363–373.
6. Williams LM, Rush AJ, Koslow SH, Wisniewski SR, Cooper NJ, Nemeroff CB,Schatzberg AF, Gordon E: International study to predict optimizedtreatment for depression (iSPOT-D), a randomized clinical trial: rationaleand protocol. Trials 2011, 12:4.
7. Igelstrom KM, Heyward PM: Inhibition of hippocampal excitability bycitalopram. Epilepsia 2012, 53:2034–2042.
8. Riedel WJ, Eikmans K, Heldens A, Schmitt JA: Specific serotonergicreuptake inhibition impairs vigilance performance acutely and aftersubchronic treatment. J Psychopharmacol 2005, 19:12–20.
9. Arnone D, McKie S, Elliott R, Thomas EJ, Downey D, Juhasz G, Williams SR,Deakin JF, Anderson IM: Increased amygdala responses to sad but notfearful faces in major depression: relation to mood state andpharmacological treatment. Am J Psychiatry 2012, 169:841–850.
10. Ruhe HG, Booij J, van Weert HC, Reitsma JB, Franssen EJ, Michel MC, ScheneA: [Dose-escalation of SSRIS in major depressive disorder. Should not berecommended in current guidelines]. Tijdschr Psychiatr 2010, 52:615–625.
11. Victor TA, Furey ML, Fromm SJ, Bellgowan PS, Ohman A, Drevets WC: Theextended functional neuroanatomy of emotional processing biases formasked faces in major depressive disorder. PLoS One 2012, 7:e46439.
12. Phan KL, Coccaro EF, Angstadt M, Kreger KJ, Mayberg HS, Liberzon I, SteinMB: Corticolimbic brain reactivity to social signals of threat before andafter sertraline treatment in generalized social phobia. Biol Psychiatry2013, 73:329–336.
13. Charney D, Barlow D, Botteron K, Cohen J: Neuroscience Research Agendato Guide Development of a Pathophysiologically Based ClassificationSystem. In A research agenda for DSM-V. Edited by Kupfer DJ, First MB,Regier DA. American Psychiatric Publishing, Incorporated; 2002:31–84.
14. National Institute of Mental Health: The National Institute of Mental HealthStrategic Plan. Bethesda, MD: National Institute of Mental Health. NIHpublication 08–6368; 2008.
15. Insel T, Cuthbert B, Garvey M: Research Domain Criteria (RDoC): toward anew classification framework for research on mental disorders. Am JPsychiatry 2010, 167:748–751.
16. Koslow SH, Williams LM, Gordon E: Personalized medicine for the brain: acall for action. Mol Psychiatry 2010, 15:229–230.
17. Atkinson AJ, Colburn WA, DeGruttola VG, DeMets DL, Downing GJ, Hoth DF,Oates JA, Peck CC, Schooley RT, Spilker BA, Woodcock J, Zeger SL:Biomarkers and surrogate endpoints: preferred definitions andconceptual framework. Clin Pharmacol Ther 2001, 69:89–95.
18. Rush AJ, Fava M, Wisniewski SR, Lavori PW, Trivedi MH, Sackeim H, ThaseME, Nierenberg A, Quitkin FM, Kashner TM, Kupfer DJ, Rosenbaum JF, AlpertJ, Stewart JW, McGrath PJ, Biggs MM, Shores-Wilson K, Lebowitz BD, Ritz L,Niederehe G, STAR*D Investigators Group: Sequenced treatmentalternatives to relieve depression (STAR*D): rationale and design. ControlClin Trials 2004, 25:119–142.
19. Australian Government: Department of Health and Ageing: Therapeutic GoodsAdministration. http://www.tga.gov.au/docs/about/publications.htm.
20. CFR - Code of Federal Regulations Title 21. http://www.accessdata.fda.gov/scripts/cdrh/cfdocs/cfcfr/cfrsearch.cfm?cfrpart = 312.

Grieve et al. Trials 2013, 14:224 Page 12 of 13http://www.trialsjournal.com/content/14/1/224
21. Gatt JM, Korgaonkar MS, Schofield PR, Harris A, Clark CR, Oakley KL, Ram K,Michaelson H, Yap S, Stanners M, Wise V, Williams LM: The TWIN-E projectin emotional wellbeing: study protocol and preliminary heritabilityresults across four MRI and DTI measures. Twin Res Hum Genet 2012,15:419–441.
22. Korgaonkar MS, Grieve SM, Etkin A, Koslow SH, Williams LM: Usingstandardized fMRI protocols to identify patterns of prefrontal circuitdysregulation that are common and specific to cognitive and emotionaltasks in major depressive disorder: first wave results from the iSPOT-Dstudy. Neuropsychopharmacology 2013, 38:863–871.
23. Liddell BJ, Williams LM, Rathjen J, Shevrin H, Gordon E: A temporaldissociation of subliminal versus supraliminal fear perception: an event-related potential study. J Cogn Neurosci 2004, 16:479–486.
24. Williams LM, Palmer D, Liddell BJ, Song L, Gordon E: The ‘when’ and‘where’ of perceiving signals of threat versus non-threat.Neuroimage 2006, 31:458–467.
25. Gur RC, Sara R, Hagendoorn M, Marom O, Hughett P, Macy L, Turner T,Bajcsy R, Posner A, Gur RE: A method for obtaining 3-dimensional facialexpressions and its standardization for use in neurocognitive studies.J Neurosci Methods 2002, 115:137–143.
26. Smith SM, Jenkinson M, Woolrich MW, Beckmann CF, Behrens TEJ,Johansen-Berg H, Bannister PR, De Luca M, Drobnjak I, Flitney DE, Niazy RK,Saunders J, Vickers J, Zhang Y, De Stefano N, Brady JM, Matthews PM:Advances in functional and structural MR image analysis andimplementation as FSL. Neuroimage 2004, 23(Suppl 1):S208–S219.
27. Fischl B: FreeSurfer. Neuroimage 2012, 62:774–781.28. Frackowiak RSJ, Ashburner JT, Penny WD, Zeki S: Human Brain Function. 2nd
edition. Waltham, MA: Academic; 2004.29. Grieve SM, Clark CR, Williams LM, Peduto AJ, Gordon E: Preservation of limbic
and paralimbic structures in aging. Hum Brain Mapp 2005, 25:391–401.30. Grieve SM, Williams LM, Paul RH, Clark CR, Gordon E: Cognitive aging,
executive function, and fractional anisotropy: a diffusion tensor MRimaging study. AJNR Am J Neuroradiol 2007, 28:226–235.
31. Paul R, Henry L, Grieve SM, Guilmette TJ, Niaura R, Bryant R, Bruce S,Williams LM, Richard CC, Cohen RA, Gordon E: The relationship betweenearly life stress and microstructural integrity of the corpus callosum in anon-clinical population. Neuropsychiatr Dis Treat 2008, 4:193–201.
32. Seckfort D, Paul R, Grieve S, Vandenberg B, Bryant R, Williams L, Clark C,Cohen R, Bruce S, Gordon E: Early life stress on brain structure andfunction across the lifespan: a preliminary study. Brain Imaging Behav2008, 2:49–58.
33. Grieve SM, Korgaonkar MS, Clark CR, Williams LM: Regional heterogeneityin limbic maturational changes: evidence from integrating corticalthickness, volumetric and diffusion tensor imaging measures.Neuroimage 2011, 55:868–879.
34. Fischl B, Sereno MI, Tootell RB, Dale AM: High-resolution intersubjectaveraging and a coordinate system for the cortical surface. Hum BrainMapp 1999, 8:272–284.
35. Fischl B, Sereno MI, Dale AM: Cortical surface-based analysis. II: inflation,flattening, and a surface-based coordinate system. Neuroimage 1999,9:195–207.
36. Dale AM, Fischl B, Sereno MI: Cortical surface-based analysis. I.Segmentation and surface reconstruction. Neuroimage 1999, 9:179–194.
37. Dale AM, Sereno MI: Improved localization of cortical activity bycombining Eeg and Meg with Mri Cortical surface reconstruction - alinear-approach. J Cogn Neurosci 1993, 5:162–176.
38. Fischl B, Dale AM: Measuring the thickness of the human cerebral cortexfrom magnetic resonance images. Proc Natl Acad Sci U S A 2000,97:11050–11055.
39. Fischl B, Liu A, Dale AM: Automated manifold surgery: constructinggeometrically accurate and topologically correct models of the humancerebral cortex. IEEE Trans Med Imaging 2001, 20:70–80.
40. Fischl B, Salat DH, Busa E, Albert M, Dieterich M, Haselgrove C, van derKouwe A, Killiany R, Kennedy D, Klaveness S, Montillo A, Makris N, Rosen B,Dale AM: Whole brain segmentation: automated labeling ofneuroanatomical structures in the human brain. Neuron 2002, 33:341–355.
41. Fischl B, Salat DH, van der Kouwe AJ, Makris N, Segonne F, Quinn BT, DaleAM: Sequence-independent segmentation of magnetic resonanceimages. Neuroimage 2004, 23(Suppl 1):S69–S84.
42. Han X, Jovicich J, Salat D, van der Kouwe A, Quinn B, Czanner S, Busa E,Pacheco J, Albert M, Killiany R, Maguire P, Rosas D, Makris N, Dale A,
Dickerson B, Fischl B: Reliability of MRI-derived measurements of humancerebral cortical thickness: the effects of field strength, scanner upgradeand manufacturer. Neuroimage 2006, 32:180–194.
43. Jovicich J, Czanner S, Greve D, Haley E, van der Kouwe A, Gollub R, KennedyD, Schmitt F, Brown G, Macfall J, Fischl B, Dale A: Reliability in multi-sitestructural MRI studies: effects of gradient non-linearity correction onphantom and human data. Neuroimage 2006, 30:436–443.
44. Segonne F, Dale AM, Busa E, Glessner M, Salat D, Hahn HK, Fischl B: Ahybrid approach to the skull stripping problem in MRI. Neuroimage 2004,22:1060–1075.
45. Fischl B, van der Kouwe A, Destrieux C, Halgren E, Ségonne F, Salat DH,Busa E, Seidman LJ, Goldstein J, Kennedy D, Caviness V, Makris N, Rosen B,Dale AM: Automatically parcellating the human cerebral cortex. CerebCortex 2004, 14:11–22.
46. Korgaonkar MS, Grieve SM, Koslow SH, Gabrieli JD, Gordon E, Williams LM:Loss of white matter integrity in major depressive disorder: evidenceusing tract-based spatial statistical analysis of diffusion tensor imaging.Hum Brain Mapp 2011, 32:2161–2171.
47. Behrens TE, Johansen-Berg H, Woolrich MW, Smith SM, Wheeler-KingshottCM, Boulby P, Barker GJ, Sillery EL, Sheehan K, Ciccarelli O, Thompson AJ,Brady JM, Matthews PM: Non-invasive mapping of connections betweenhuman thalamus and cortex using diffusion imaging. Nat Neurosci 2003,6:750–757.
48. Smith SM, Jenkinson M, Johansen-Berg H, Rueckert D, Nichols TE, MackayCE, Watkins KE, Ciccarelli O, Cader MZ, Matthews PM, Behrens TE: Tract-based spatial statistics: voxelwise analysis of multi-subject diffusion data.Neuroimage 2006, 31:1487–1505.
49. Andersson JL, Jenkinson M, Smith S: Non-linear Registration aka SpatialNormalisation. FMRIB Technical Report TR07JA2. 2007. www.fmrib.ox.ac.uk/analysis/techrep.
50. Andersson JL, Jenkinson M, Smith S: Non-linear Optimisation. FMRIBTechnical Report TR07JA1. 2007 www.fmrib.ox.ac.uk/analysis/techrep.
51. Mori S, Oishi K, Jiang H, Jiang L, Li X, Akhter K, Hua K, Faria AV, Mahmood A,Woods R, Toga AW, Pike GB, Neto PR, Evans A, Zhang J, Huang H, Miller MI,van Zijl P, Mazziotta J: Stereotaxic white matter atlas based on diffusiontensor imaging in an ICBM template. Neuroimage 2008, 40:570–582.
52. Behrens TE, Berg HJ, Jbabdi S, Rushworth MF, Woolrich MW: Probabilisticdiffusion tractography with multiple fibre orientations: what can wegain? Neuroimage 2007, 34:144–155.
53. Ja M, Laurienti PJ, Ra K, Burdette JH: An automated method forneuroanatomic and cytoarchitectonic atlas-based interrogation of fMRIdata sets. Neuroimage 2003, 19:1233–1239.
54. Yarkoni T, Poldrack RA, Nichols TE, Van Essen DC, Wager TD: Large-scaleautomated synthesis of human functional neuroimaging data.Nat Methods 2011, 8:665–670.
55. Trivedi MH, Rush AJ, Wisniewski SR, Nierenberg AA, Warden D, Ritz L, NorquistG, Howland RH, Lebowitz B, McGrath PJ, Shores-Wilson K, Biggs MM,Balasubramani GK, Fava M, STAR*D Study Team: Evaluation of outcomes withcitalopram for depression using measurement-based care in STAR*D:implications for clinical practice. Am J Psychiatry 2006, 163:28–40.
56. Korgaonkar MS, Cooper NJ, Williams LM, Grieve SM: Mapping inter-regionalconnectivity of the entire cortex to characterize major depressivedisorder: a whole-brain diffusion tensor imaging tractography study.Neuroreport 2012, 23:566–571.
57. He H, Sui J, Yu Q, Turner J, Ho B-C, Sponheim SR, Manoach DS, Clark VP,Calhoun VD: Altered small-world brain networks in schizophreniapatients during working memory performance. PLoS One 2012, 7:e38195.
58. Milo R, Shen-Orr S, Itzkovitz S, Kashtan N, Chklovskii D, Alon U: Networkmotifs: simple building blocks of complex networks. Science 2002,298:824–827.
59. Wang J-H, Zuo X-N, Gohel S, Milham MP, Biswal BB, He Y: Graph theoreticalanalysis of functional brain networks: test-retest evaluation on short-and long-term resting-state functional MRI data. PLoS One 2011, 6:e21976.
60. Zhao X, Liu Y, Wang X, Liu B, Xi Q, Guo Q, Jiang H, Jiang T, Wang P:Disrupted small-world brain networks in moderate Alzheimer’s disease: aresting-state FMRI study. PLoS One 2012, 7:e33540.
61. Rosset A, Spadola L, Ratib O: OsiriX: an open-source software fornavigating in multidimensional DICOM images. J Digit Imaging 2004,17:205–216.
62. Scheltens P, Barkhof F, Leys D, Pruvo JP, Nauta JJ, Vermersch P, Steinling M,Valk J: A semiquantative rating scale for the assessment of signal
Grieve et al. Trials 2013, 14:224 Page 13 of 13http://www.trialsjournal.com/content/14/1/224
hyperintensities on magnetic resonance imaging. J Neurol Sci 1993,114:7–12.
63. Fair DA, Schlaggar BL, Cohen AL, Miezin FM, Dosenbach NU, Wenger KK,Fox MD, Snyder AZ, Raichle ME, Petersen SE: A method for using blockedand event-related fMRI data to study “resting state” functionalconnectivity. Neuroimage 2007, 35:396–405.
64. Gavrilescu M, Stuart GW, Rossell S, Henshall K, McKay C, Sergejew AA,Copolov D, Egan GF: Functional connectivity estimation in fMRI data:influence of preprocessing and time course selection. Hum Brain Mapp2008, 29:1040–1052.
doi:10.1186/1745-6215-14-224Cite this article as: Grieve et al.: Brain imaging predictors and theinternational study to predict optimized treatment for depression: studyprotocol for a randomized controlled trial. Trials 2013 14:224.
Submit your next manuscript to BioMed Centraland take full advantage of:
• Convenient online submission
• Thorough peer review
• No space constraints or color figure charges
• Immediate publication on acceptance
• Inclusion in PubMed, CAS, Scopus and Google Scholar
• Research which is freely available for redistribution
Submit your manuscript at www.biomedcentral.com/submit