
Application of the Direct Optimized Probabilistic Calculation
20
Application of the Direct Optimized Probabilistic Calculation Martin Krejsa Department of Structural Mechanics, Faculty of Civil Engineering, VSB - Technical University Ostrava, Ludvika Podeste 1875/17, 708 33 Ostrava - Poruba, Czech Republic, [email protected] . Abstract. The Direct Optimized Probabilistic Calculation method - DOProC - deals with probabilistic tasks where certain input quantities are of a random nature. DOProC is typically used in probabilistic reliability assessment of load carrying structures. DOProC can be also employed in probabilistic designs of structural elements with the specified reliability. In many cases, this calculation method is very efficient and provides accurate estimates of resulting probabilities. DOProC has been successfully applied, among others, in the probabilistic calculation of fatigue cracks in steel structures and bridges which are subject to cyclical loads. The software used for that purpose, FCProbCalc, makes it possible to monitor efficiently and operatively development of fatigue damage to the structure and to specify times for service inspection. This means, the structure is compliant and well suited for operation in terms of fatigue damage. The methods and application can considerably improve estimation of maintenance costs for the structures and bridges subject to cyclical loads. Keywords: Direct Optimized Probabilistic Calculation; DOProC; Safety Margin; Probability of Failure; Fatigue Crack Propagation; Inspection of Structure; Random Variable. 1. Introduction Many calculation methods exist now for the designing and reliability assessment of load carrying structures and elements with the specified reliability. Those methods are based on the probability theory and mathe- matic statistics. They have been becoming more and more popular. The methods which are referred to as probabilistic or stochastic make it possible to analyze safety margin Z defined by a calculation model where at least some input quantities are of a random nature (Rackwitz et al., 1978). The calculation procedures contribute to a qualitatively higher level of the reliability assessment and, in turn, higher safety of those who use the buildings and facilities (Melchers, 1994). The most frequently used and most numerous group of the computational method comprises the simula- tion methods which are based on the popular simulation technique - Monte Carlo (Bjerager, 1988; Hurtado et al., 1998) or any advanced or stratified simulation methods, for instance, Adaptive Sampling (Bucher, 1988), LHS (Helton et al., 2003; Olsson et al., 2003) and Importance Sampling. Eurocodes which are in force now mention the application of approximation methods FORM and SORM types (Der Kiureghian et al., 1998; Zhao et al., 2001) which are used mostly for calibration of partial factors. Those methods are also used in rather complex software applications based on Finite Elements Methods (FEM) (Vanmarcke et al., 1986; Reh et al., 2006; Stefanou, 2009). The probabilistic approach to the assessment and designing of the structures has started appearing in practice recently only (Bergmeister et al., 2009). The pre-requisite is, however, a sufficient database of input
Transcript of Application of the Direct Optimized Probabilistic Calculation

Application of the Direct Optimized Probabilistic Calculation
Martin KrejsaDepartment of Structural Mechanics, Faculty of Civil Engineering, VSB - Technical University Ostrava,
Ludvika Podeste 1875/17, 708 33 Ostrava - Poruba, Czech Republic, [email protected] .
Abstract. The Direct Optimized Probabilistic Calculation method - DOProC - deals with probabilistic taskswhere certain input quantities are of a random nature. DOProC is typically used in probabilistic reliabilityassessment of load carrying structures. DOProC can be also employed in probabilistic designs of structuralelements with the specified reliability. In many cases, this calculation method is very efficient and providesaccurate estimates of resulting probabilities.
DOProC has been successfully applied, among others, in the probabilistic calculation of fatigue cracksin steel structures and bridges which are subject to cyclical loads. The software used for that purpose,FCProbCalc, makes it possible to monitor efficiently and operatively development of fatigue damage to thestructure and to specify times for service inspection. This means, the structure is compliant and well suitedfor operation in terms of fatigue damage. The methods and application can considerably improve estimationof maintenance costs for the structures and bridges subject to cyclical loads.
Keywords: Direct Optimized Probabilistic Calculation; DOProC; Safety Margin; Probability of Failure;Fatigue Crack Propagation; Inspection of Structure; Random Variable.
1. Introduction
Many calculation methods exist now for the designing and reliability assessment of load carrying structuresand elements with the specified reliability. Those methods are based on the probability theory and mathe-matic statistics. They have been becoming more and more popular. The methods which are referred to asprobabilistic or stochastic make it possible to analyze safety margin Z defined by a calculation model whereat least some input quantities are of a random nature (Rackwitz et al., 1978). The calculation procedurescontribute to a qualitatively higher level of the reliability assessment and, in turn, higher safety of those whouse the buildings and facilities (Melchers, 1994).
The most frequently used and most numerous group of the computational method comprises the simula-tion methods which are based on the popular simulation technique - Monte Carlo (Bjerager, 1988; Hurtadoet al., 1998) or any advanced or stratified simulation methods, for instance, Adaptive Sampling (Bucher,1988), LHS (Helton et al., 2003; Olsson et al., 2003) and Importance Sampling. Eurocodes which are inforce now mention the application of approximation methods FORM and SORM types (Der Kiureghian etal., 1998; Zhao et al., 2001) which are used mostly for calibration of partial factors. Those methods are alsoused in rather complex software applications based on Finite Elements Methods (FEM) (Vanmarcke et al.,1986; Reh et al., 2006; Stefanou, 2009).
The probabilistic approach to the assessment and designing of the structures has started appearing inpractice recently only (Bergmeister et al., 2009). The pre-requisite is, however, a sufficient database of input

Martin Krejsa
quantities including the experience from practical operation because many input quantities cannot be basedon models and laboratory measurements only (this being the case, for instance, of geotechnics). Those com-putational methods are used, in particular, when designing the load-carrying systems for civil engineeringstructures and bridges (Kala, 2005; Krivy et al., 2007), where degradation processes in structures can be alsotaken into account (Konecny et al., 2007; Straub, 2009). It is possible to carry out the Performance-BasedDesign of structures which consider utility values such as durability, fire resistance, insulation or seismicresistance (Kralik et al., 2009; Teply et al., 2010). The probabilistic approach is used also in risk engineering(Kubecka, 2010). Stochastic models are being developed which describe interaction of building structureswith subsoil or which taken into account undermining effects (Marschalko et al., 2011).
This paper describes the use of the original method and method which is under development now: theDirect Optimized Probabilistic Calculation (in short ”DOProC”) uses a purely numerical approach withoutany simulation techniques. This provides more accurate solutions to probabilistic tasks, and, in some cases,to considerably faster completion of computations. Such solution entails a small numerical error only andminor inaccuracies, the reason being discretizing of input and output quantities. In case of the probabilisticassessment of the reliability of structures, DOProC expresses directly the probability of failure pf , which canbe compared with the design value of nominal failure probability pd, defined in standards and regulationsin force. Where the failure probability pf is zero (the structure is excessively reliable) or equal to one (theinput quantities in any combination result in a failure), DOProC estimates the result immediately and noprobabilistic calculations are needed anymore. In this case, DOProC method represents a very suitable andhighly efficient solution (Krejsa, 2011).
Theoretical background of DOProC was described in detail in many publications (Janas et al., 2009).DOProC can be used now to solve efficiently a number of probabilistic computations. It has been used, forinstance, in probabilistic assessment of combined load, reliability of cross-sections and systems consistingof statically determined or undetermined load carrying constructions, in probabilistic assessment of loadcarrying constructions which are subject to impact, in probabilistic analyses of steel-fibre reinforced concretemixtures or in probabilistic assessment of reliability of anchored reinforcement or arc reinforcement inunderground and long mine works with a special focus on anti-slipping properties.
DOProC has proved to be a good solution, among others, in probabilistic analyses of fatigue crackpropagation in constructions subject to cyclical loads. Detailed methods with examples of the probabilisticassessment for a construction subject to fatigue load are available, a particular attention being paid to cracksfrom the edge and those from surface. Similarly to other probabilistic analyses, this information is used as abasis for proposing a system of inspections of the cyclic load construction (Moan, 2004; Chen et al., 2011;Li et al., 2011). In order to improve quality of probabilistic calculations, a special software - FCProbCalc -was developed. Using this software, the task can be solved flexibly in a user-friendly environment.
2. Direct Optimized Probabilistic Calculation
The Direct Optimized Probabilistic Calculation (”DOProC”) has been under development since 2002. Thecalculation procedure for a certain task in DOProC is clearly determined by its algorithm, while MonteCarlo simulation methods generate calculation data for simulation on a random basis. The term in the nameof the method - ”the optimized” - is based on following facts: the number of variables that enter calculationof the failure probability pf , computation is, however, limited by capabilities of the software to process the

Application of the Direct Optimized Probabilistic Calculation
application numerically. If there are too many random variables, the application is extremely time demanding- even if high-performance computers are used. Therefore, efforts have been made to optimize calculationsin order to reduce the number of operations, keeping, at the same time, reliable calculation results. Currently,the DOProC along with the optimizing steps can address well several probabilistic tasks.
2.1. BASICS OF DOPROC METHOD
Similarly as with the other probabilistic methods, input random quantities in DOProC (such as the load,geometry, material properties, or imperfections) are described using the non-parametric (empirical) distri-bution in histograms. This technique can be also used for parametric divisions. The distribution is typicallybased on observations, being often long-lasting ones. A computational procedure is being developed now,the aim being to implement into DOProC the statistic dependence of input parameters, such as (Vorechovskyet al., 2009).
The basic computation algorithm of DOProC is based on general terms and procedures used in proba-bilistic theories. Let the histogram B be an arbitrary function f of histograms Aj where j ranges from 1 ton. Then:
B = f(A1, A2, A3, . . . , Aj , . . . , An) . (1)
Each histogram Aj consists of ij interval where each interval is limited with aj,i from below and aj,i+1
from above. This means, that for the interval ij = 1, the values will be as follows:
aj,1 ≤ aj < aj,2 , (2)
whereaj,2 = aj,1 + ∆aj , (3)
where∆aj =
aj,max − aj,min
ij. (4)
In ij , following formula is valid:aj,i ≤ aj < aj,i+1 . (5)
Let us express aj in that interval as a(ij)j . Similar relations are valid for the B histogram. If there are i
intervals, the values of the histogram in the ith interval range from bi to bi+1, this means b(i). They can beexpressed as follows:
b(i) = f(a
(i1)1 , a
(i2)2 , . . . , a
(ij)j , . . . , a(in)
n
)(6)
for the specific combination of arguments: a(i1)1 , a
(i2)2 , . . . , a
(ij)j , . . . , a
(in)n . The same value - b(i) - can be
derived for other values too (or at least for some values too) - a(ij)j . If the potential combination of values
a(ij)j is marked as l, the following general formula can be derived:
b(i) = f(a
(i1)1 , a
(i2)2 , . . . , a
(ij)j , . . . , a(in)
n
)l. (7)

Martin Krejsa
The probability pibl of occurrence of b(i) is the product of p(ij)aj (probabilities of occurrence of aijj values).
Then:pibl =
(p
(i1)aj · p
(i2)aj · p
(i3)aj · . . . · p
(ij)aj · . . . · p
(in)aj
). (8)
The probability of occurrence of all potential combinations(ai11 , a
i22 , . . . , a
ijj , . . . , a
inn
)l
of f with the
result of b(i) is:
p(i)b =
l∑l=1
p(i)bl . (9)
The number of intervals ij in each histogram Aj can vary similarly as the number of i intervals in thehistogram B. The number of intervals is of utter importance for the number of needed numerical operationsand required computing time. On top of this, the accuracy of the calculation depends considerably on thenumber of intervals.
Fig. 1 shows the numerical operations in the probabilistic calculations with two random quantities ex-pressed in a histogram using the basic computational DOProC algorithm. In this case, two load componentsare combined or a sum of two histograms is used.
Figure 1. Principles of numerical operations with two histograms (the combination of dead load and long lasting load).
DOProC method is possible to use in ProbCalc (Janas et al., 2009; Janas et al., 2012) - software applica-tion which is still under development. It is rather easy and simple to implement quite a complicated analyticaltransformation model of a probabilistic task defined using a text-oriented editor, similar to Nessus software(Thacker et al., 2006) or Proban software (Tvedt, 2006). In more complex numerical calculation models,

Application of the Direct Optimized Probabilistic Calculation
there is a chance to use the procedure programmed by the user as DLL (with a dynamic library extension).More advanced user knowledge is required then to enter the probabilistic tasks in ProbCalc. It is essentialto know, at least, general basics of algorithms because this influences the way of defining the computationalmodel and selection of the best optimizing procedure. This weakness is removed if the application softwareis customized for a specific probabilistic task, this being, for instance, the case of FCProbCalc which isdescribed in Chapter 3.3.
The computational complexity of DOProC is given, in particular, by:
− the number of random input quantities i = 1 . . . N ,− the number of histogram classes (intervals) for each random input quantity ni,− complexity of the task (computational model),− the algorithm used in the probabilistic calculation (the method used for definition of the computational
model - in a ProbCalc text mode or using a dynamic library or application software).
2.2. USING DOPROC FOR CALCULATION OF FAILURE PROBABILITY
The construction should be designed in such as way so that the structural resistance R, would be higherthan the load effects S. Considering all random phenomena in the load, manufacturing and installationinaccuracies and inaccuracies where the construction is used, the structural resistance R, and load effect S,should be regarded as random quantities - see Fig. 2. The both quantities need to be of the same dimension.
Figure 2. Probability density curves - load effect S, structural resistance R, and the area where a failure may occur.
The probabilistic reliability assessment is based on the reliability condition which can be expressed asfollows:
Z = R− S ≥ 0 , (10)
where Z is safety margin, R is the structural resistance and S is the load effect. If the reliability conditionis not fulfilled, such situation is undesirable in terms of reliability - it is a failure when the load effect Sexceeds the magnitude of the structural reliability R. The area where a failure may occur is shown in Fig. 2.

Martin Krejsa
Figure 3. Basic approach to the calculation of the safety margin histogram Z, for two random variables using DOProC.
Fig. 3 shows the calculation of the safety margin Z, for two random quantities using the DOProC algo-rithm. The probability pZ,i in the i-class is the sum of products of the ps,i probabilities for si in i-classes ofthe S histogram and pr,i probability of ri in i classes for the R histogram:
pZ,i =∑
ps,i · pr,i . (11)
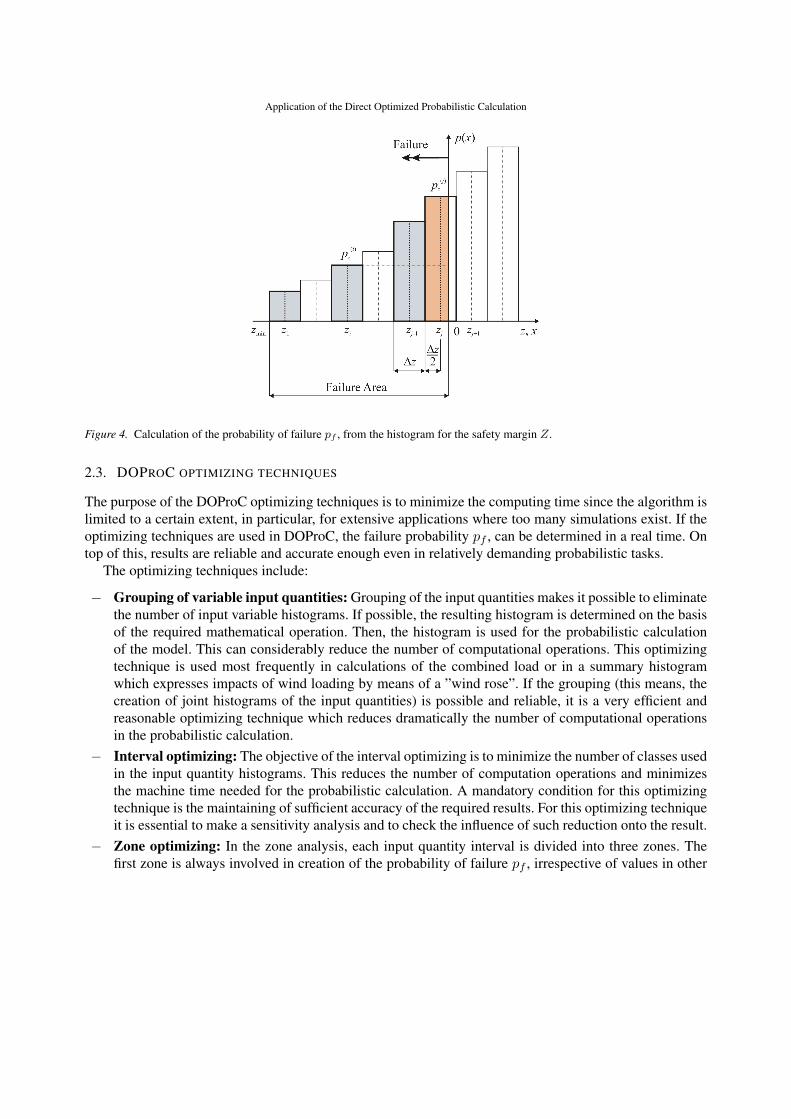
This results in the histograms for the safety margin Z, the final part of which gives the resulting proba-bility failure pf , which is compared then with the nominal probability of failure pd.
If the Z histogram comprises n classes (intervals) with the ∆z width, the resulting probability of failurepf , is calculated then as the sum of probabilities p(i=1...j)
z in individual intervals (classes) where the safetymargin is Z < 0 (this results from (10)). In the interval where the boundary values of the j class of theZ reliability histograms are within zj < 0 < zj+1, the distribution of probability p(j)
z should be dividedproportionally into two parts. This means, the final probability of failure pf is determined using Fig. 4 andequation:
pf =
j−1∑i=1
p(i)z + p(j)
z ·
(1−
zj + ∆z2
∆z
)=
j−1∑i=1
p(i)z + p(j)
z ·(
1
2− zj
∆z
). (12)
Application of the Direct Optimized Probabilistic Calculation
Figure 4. Calculation of the probability of failure pf , from the histogram for the safety margin Z.
2.3. DOPROC OPTIMIZING TECHNIQUES
The purpose of the DOProC optimizing techniques is to minimize the computing time since the algorithm islimited to a certain extent, in particular, for extensive applications where too many simulations exist. If theoptimizing techniques are used in DOProC, the failure probability pf , can be determined in a real time. Ontop of this, results are reliable and accurate enough even in relatively demanding probabilistic tasks.
The optimizing techniques include:
− Grouping of variable input quantities: Grouping of the input quantities makes it possible to eliminatethe number of input variable histograms. If possible, the resulting histogram is determined on the basisof the required mathematical operation. Then, the histogram is used for the probabilistic calculationof the model. This can considerably reduce the number of computational operations. This optimizingtechnique is used most frequently in calculations of the combined load or in a summary histogramwhich expresses impacts of wind loading by means of a ”wind rose”. If the grouping (this means, thecreation of joint histograms of the input quantities) is possible and reliable, it is a very efficient andreasonable optimizing technique which reduces dramatically the number of computational operationsin the probabilistic calculation.
− Interval optimizing: The objective of the interval optimizing is to minimize the number of classes usedin the input quantity histograms. This reduces the number of computation operations and minimizesthe machine time needed for the probabilistic calculation. A mandatory condition for this optimizingtechnique is the maintaining of sufficient accuracy of the required results. For this optimizing techniqueit is essential to make a sensitivity analysis and to check the influence of such reduction onto the result.
− Zone optimizing: In the zone analysis, each input quantity interval is divided into three zones. Thefirst zone is always involved in creation of the probability of failure pf , irrespective of values in other

Martin Krejsa
histograms (the first zone is involved there, whatever combination of interval of the remaining inputquantities is). The second zone may, but does not need to, be involved in the process (it is involved onlyin some combinations of intervals of the other input quantities), while the third zone is never involvedthere (when determining the probability of failure pf , it is possible to omit this part of the histogram).If the zones are known, it is possible to calculate the probability of failure pf very efficiently. Detailedinformation is available about the zone optimizing and practical aspects of this approach.
− Trend optimizing: Trend optimizing can be used as a supplement to the zone optimizing in the prob-abilistic calculations. In the zone optimizing technique is used, the calculation is carried out only forthe zone #2. If a trend is found for the random variable (this means that the resulting positive valueof the safety margin Z, increases with changes in the random variable) it does not make any sense tointroduce other computational combinations. For such a quantity, the safety margin Z, cannot reachnegative values and cannot influence the failure probability pf . This means, it is possible to eliminatecomputational combinations and to keep only those which are really needed.
− Grouping of partial computation results: The purpose of the grouping of partial computational re-sults is to decrease the number of computational operations during the assessment of the histograms ofthe quantities which are the result of the computational model. In case of the probabilistic reliabilityassessment, this group is defined by the safety margin Z, where the values entered pursuant to (10) arethe calculated reliability of the structure R, and loading impacts S. In some cases, it is possible to enterdirectly the input quantity histogram into this group. (Such quantity can be the strength characteristicof the used material if the reliability assessment is done for the tension and the quantity is not involvedin the computational model, or a limit deflection of the reliability assessment is based on the ultimatestate of usability).
− Computation parallelization: The computation is carried out in several processors or core at the sametime. The basic algorithm of DOProC is an optimum solution for the parallelism: partial results reachedby multi core/processor computation are summed up in the final phase of the probabilistic calculation.
− Combination of the aforementioned optimizing techniques: Below is the recommended sequenceof the optimizing techniques in DOProC:
• Grouping: It should be used always, if possible.• Interval optimizing: It is recommended to minimize the number of histogram groups, particularly,
when debugging the computational algorithm. Then, the number of the histogram classes shouldbe optimized for specific results.
• Other optimizing techniques which should be used, if possible and feasible in terms of complexity.
The optimizing techniques have been described in detail and implemented into ProbCalc and can becombined in the probabilistic calculation.
3. Using DOProC to calculate propagation of fatigue cracks
Probabilistic calculation of steel structures and bridges using DOProC method, leads to the probabilitiesof three basic random events in dependence on years of bridge’s operation and fatigue crack propagation.On the basis of that calculation for each individual year, determined by analysis of reliability function, the

Application of the Direct Optimized Probabilistic Calculation
dependence of the failure probability on time of the bridge’s operation is specified. When the limit reliabilityis known, it is possible to determine times of the structure’s inspections (Krejsa, 2011).
3.1. BASICS OF PROPAGATION OF FATIGUE CRACKS
Reliability of the load-bearing structure has been significantly influenced by degradation resulting, in par-ticular, from the fatigue of the basic materials. Whler’s curves are used when designing such structures.The service life can be limited until a failure occurs. The failure is, however, very difficult to determine.For purposes of the modeling, the amplitude oscillation is considered to be constant, and a certain numberof load cycles is taken into account. The method has been developed to provide procedures describingreal conditions, all this making the work of design engineers easier. As fatigue cracks appear randomly onexisting structures (in crane rails and bridges), it is believed that the designing method is imperfect to acertain extent (Fisher et al., 1998). Methods are under development that would be able to reveal potentialdefects and damage resulting from initiation cracks that accelerate considerably the propagation of fatiguecracks (Giner et al., 2008). Linear fracture mechanics is among alternative methods. Machinery experts havebeen dealing with such issues for many years. Results have been gradually taken over and implemented intodesigns of the loading structures in buildings. This approach is typically used for the determination of timesof inspection and analyses of inspection results. If cracks are not found, a conditional probability exists thatthey might appear later on.
Attention is paid to fatigue damage of building steel structures and bridges where the acceptable fatigue(Anderson, 2005) crack size is assessed. The acceptable crack size plays a key role in degradation of anelement dimensioned for an extreme loading combination that is exposed to variable operation loads. Itrepresents a possible degradation of an element in an ultimate limit state that can be still monitored.
The outcome is procedures that should clarify currently acceptable methods used for the designing of thefatigue crack in the context of the safe service life and acceptable failure rate. A flange of the compositereinforced concrete bridge has been chosen for applications of the theoretical solution. This tension isexposed, in particular, to tension. Depending on location of an initial crack, the crack may propagate fromthe edge or surface. Regarding the frequency, weight and concentration of stresses, those locations rankamong those with the major hazard of fatigue cracks appearing in the steel structures and bridges.
3.2. PROBABILISTIC APPROACH TO PROPAGATION OF FATIGUE CRACKS
Occurrence of initiation cracks and crack propagation in structures subject to fatigue load has been knownfor a long time. The process is closely connected with fabrication of the steel structures and, in particular,with creation of details which tend to be damaged by fatigue. The key difference is between initiationof cracks resulting from steelmaking inclusions and those created during fabrication of structural details.Regarding the former, it takes a long time until it reaches the surface, while the latter is at the surfacefrom the beginning of the loading. Standardized approaches of previous EC standards suppose that surfacecracks were not present there. The acceptable damage method which is described in the new standard admitsrandom occurrence of surface cracks. The major difference is that a fatigue crack might not be fragile, butcould be ductile. In real components of steel structures and bridges, the latter is more frequent that theformer which is used in experimental measurements in processed small test-pieces. This fact is not a newphenomenon. It has been known for a long time and has been mentioned, for instance, by (Anderson, 2005).

Martin Krejsa
During the designing, fabrication and processing of details, nobody, however, paid attention to randomoccurrence of initiation cracks from surface areas (from the surface or from the edge).
Three sizes are important for the characteristics of the propagation of fatigue cracks. These are theinitiation size, the detectable size and the final size which occurs prior to failure caused by a fragile orductile crack. The fatigue crack damage depends on a number of stress range cycles. This is a time factor inthe course of reliability for the entire designed service life. In the course of time, the failure rate increases,while the reliability drops.
The topic is discussed in two levels that affect each other: the probabilistic solution to the propagation ofthe fatigue crack and uncertainties in determination of quantities used in the calculation. When investigatinginto the propagation, the fatigue crack that deteriorates a certain area of the structure components is describedwith one dimension only: a. In order to describe the propagation of the crack, the linear elastic fracturemechanics is typically used. It is based on the Paris-Erdogan law (Sanford, 2003):
da
dN= C · (4K)m , (13)
where C, m are material constants (Carpinteri et al., 2007), a is the crack size and N is the number ofloading cycles.
The initial assumption is that the primary design should take into account the effects of the extremeloading resulting from the ultimate state of carrying capacity method. Then, the fatigue resistance should beassessed. This means, the reliability margin in the technical probability method is:
Z(R,S) = RF = R− S , (14)
where R is the random resistance of the element and S represents random variable effects of the extremeload.
When using (13), the condition for the acceptable crack length aac is:
N =1
C
∫ aac
a0
da
4Km> Ntot , (15)
where N is the number of cycles needed to increase the crack from the initiation size a0 to the acceptablecrack size aac, and Ntot is the number of cycles throughout the service life.
The equation for the propagation of the crack size (13) needs to be modified for this purpose. The stateof stress near the crack face is described using ∆K (the stress intensity coefficient) which depends on theloading (bending, tension), size and shape of the fatigue crack, and geometry of the load-bearing component.If the ∆σ stress range and axial stress-load of the flange are constant, the following relation applies:
∆K = ∆σ ·√πa · F(a) , (16)
where F(a) is the calibration function which represents the course of propagation of the crack. After thechange of the number of cycles from N1 to N2, the crack will propagate from the length a1 to a2. Havingmodified (13) and using (16), the following formula will be achieved:∫ a2
a1
da
(√πa · F(a))m
=
∫ N2
N1
C · (4σ)m dN . (17)

Application of the Direct Optimized Probabilistic Calculation
If the length of the crack a1 equals to the initial length a0 (this is the assumed size of the initiation crackin the probabilistic approach) and if a2 equals to the final acceptable crack length aac (this is the acceptablecrack size which replaces the critical crack size acr if the crack results in a brittle fracture), the left-handside of the equation (17) can be regarded as the resistance of the structure R(aac):
R(aac) =
∫ aac
a0
da
(√πa · F(a))m
. (18)
If the upper integration limit ad is used, the resistance of the structure R(aad) can be specified similarly.Similarly, it is possible to define the cumulated effect of loads that is equal to the right side (randomlyvariable effects of the extreme load) (17):
S =
∫ N
N0
C · (4σ)m dN = C · (4σ)m · (N −N0) , (19)
whereN is the total number of oscillations of stress peaks (∆σ) for the change of the length from a0 to aaac ,and N0 is the number of oscillations in the time of initialization of the fatigue crack (typically, the numberof oscillations is zero).
It is possible to define a reliability function RF :
RF(X) = R(aac) − S(N) . (20)
where X is a vector of random physical properties such as mechanical properties, geometry of the structure,load effects and dimensions of the fatigue crack.
The analysis of the reliability function (20) gives a failure probability pf :
pf = P (RF(X) < 0) = P (R(aac) < S(N)) . (21)
3.3. APPLYING THEORETICAL APPROACH TO PROPAGATION OF FATIGUE CRACKS IN FCPROBCALC
A tension flange has been chosen for applications of the theoretical solution suggested in the studies (Tomicaet al., 2007). Depending on location of an initial crack, the crack may propagate from the edge or from thesurface (see Fig. 5). Regarding the frequency, weight and stress concentration, those locations rank amongthose with the major hazard of fatigue cracks appearing in the steel structures and bridges.
A flange without stress concentration is used for confronting the both cases depending on the location ofthe crack initiation. The cases are different in calibration functions F(a) - and in weakened surfaces whichare appearing during the crack propagation.
3.3.1. Probabilistic calculation of fatigue cracks propagating from the edgeFor the crack propagating from the edge, the calibration function is:
F(a) = 1.12− 1.39 · ab
+ 7.32 ·(ab
)2− 13.8 ·
(ab
)3+ 14.0 ·
(ab
)4, (22)
where a is the length of the crack and b is the width of the flange (Janssen et al., 2002); (see Fig.5).

Martin Krejsa
Figure 5. Characteristic propagation of cracks from the outer edge (left) and from the surface (right).
The acceptable crack size aac can be described then by a formula resulting from the deduced weakeningof the cross-section area of the flange:
aac = b ·(
1− σmax
fy
). (23)
3.3.2. Probabilistic calculation of fatigue cracks propagating from the surfaceA similar approach can be used to determine the acceptable size of a crack propagating from the surface.The bending component can be neglected for welded steel two-axis symmetric I-profiles where the fatiguecrack appears in the lower tension flange. The flange is loaded only by the normal stress resulting from theaxial load - tension: σm = σ.
It is rather difficult to deduce analytically the acceptable size of the crack propagating from the surface.In accordance with (Krejsa et al., 2010), the shape is replaced with a semi-elliptic curve where the ellipsisaxes are a (the crack depth) and c (a half of the crack width) - see Fig. 5. The area of the surface crackdepends on the number of N loading cycles and is described by the following formula:
Acr(N) =1
2· π · aN · cN . (24)
During propagation of the fatigue crack from the surface, it is not enough to monitor only one crack size(which would be sufficient, for instance, for a crack propagating from the edge). In that case, the crack sizeneeds to be analyzed for directions of the both semi-axes: a and c. The propagation of the fatigue crack fromthe surface in the a direction depends on the propagation in the c direction. Crack velocity propagation is

Application of the Direct Optimized Probabilistic Calculation
described by (13). In (Krejsa et al., 2010) there is a formula for calculation of the crack depth ∆a as a resultof an increased width of the ∆c crack:
∆a =
1[
1.1 + 0.35 ·(at
)2·√a
c
]
m
·∆c . (25)
The crack sizes for a and c are during the propagation limited by upper limit values:
2 · c ≤ 0, 4 · bf a ≤ 0, 8 · tf , (26)
If these upper limit values are exceeded, the fatigue crack propagates differently. (Krejsa, 2011) gives alsothe formula for the mutual dependence of the sizes in a and c:
c = 0.3027 · a2
t+ 1.0202 · a+ 0.00699 · t . (27)
When determining the acceptable crack size, a modified relation (24) using (25) and (27), should be takenas a basis. After modification:
σmax ·bf tf
bf tf −1
2· πa ·
(0.3027 · a
2
tf+ 1.0202 · a+ 0.00699 · tf
) ≤ fy , (28)
It is difficult to describe the a crack size directly explicitly. In order to calculate the acceptable crack sizeaac, it is necessary to use a numerical iteration approach where restrictions resulting from (28) should betaken as a basis.
3.3.3. Determination of inspections of structures subject to fatigueBecause it is not certain in the probabilistic calculation whether the initiation crack exists and what theinitiation crack size is and because other inaccuracies influence the calculation of the crack propagation, aspecialized inspection is necessary to check the size of the measureable crack in a specific period of time.The acceptable crack size influences the time of the inspection. If no fatigue cracks are found, the analysisof inspection results gives conditional probability during occurrence.
While the fatigue crack is propagating, it is possible to define following random phenomena that arerelated to the growth of the fatigue crack and may occur in any time t during the service life of the structure.Then:
− U(t) phenomenon: No fatigue crack failure has not been revealed within the t-time and the fatiguecrack size a(t) has not reached the detectable crack size ad . This means:
a(t) < ad , (29)
− D(t) phenomenon: A fatigue crack failure has been revealed within the t-time and the fatigue cracksize a(t) is still below the acceptable crack size aac. This means:
ad ≤ a(t) < aac , (30)

Martin Krejsa
− F(t) phenomenon: A failure has been revealed within the t-time and the fatigue crack size a(t) hasreached the acceptable crack size aac. This means:
aac < a(t) . (31)
If the crack is not revealed within the t-time, this may mean that there is not any fatigue crack in theconstruction element. This might be an initiative phase of nucleation of the fatigue crack (when a crackappears in the material) and this phenomenon is not taken into account in the fracture mechanics. Even ifthe fatigue crack is not revealed it is likely that it exists but the fatigue crack size is so small that it cannotbe detected under existing conditions.
Using the phenomena above, it is possible to define probability for their occurrence in any t-time. Thosethree phenomena cover the complete spectrum of phenomena that might occur in the t-time. This means:
P (U(t)) + P (D(t)) + P (F(t)) = 1 . (32)
The probabilistic calculation is carried out in time steps where one step typically equals to one year of theservice life of the construction. When the failure probability P (F(t)) reaches the nominal failure probabilitypd, an inspection should be carried out in order to find out fatigue cracks, if any, in the construction element.The inspection provides information about real conditions of the construction. Such conditions can be takeninto account when carrying out further probabilistic calculations. The inspection in the t time may result inany of the three mentioned phenomena. Using the inspection results for the t time, it is possible to definethe probability of the mentioned phenomena in another times: T > tI . For that purpose, the conditionalprobability should be taken into consideration.
3.3.4. Using FCProbCalc for the probabilistic calculation of fatigue cracks propagatingFCProbCalc (Fig. 6) was developed using the aforementioned techniques. By means of FCProbCalc, itis possible to carry out the probabilistic calculation of propagation of fatigue cracks in a user friendlyenvironment. The cracks propagate from edges or surface and the goal of the probabilistic calculation isto determine the time for the first inspection which focuses on damage to the structure.
Both deterministic and stochastic approaches are used for input values in the probabilistic calculation. In(Krejsa et al., 2010), the probabilistic assessment was carried out for a detail of a highway bridge madefrom steel/concrete which tends to suffer from fatigue damage. Real input values were used there: thegeometric shape in the specified place, the yield stress fy, the nominal designed stress of extreme impactsσ, material constants m and C, as well as constant stress oscillation ∆σ. The source of the oscillation valuewas measurements of the response in regular operation. Other input data include the random quantities - theyare expressed by means of the parametric distribution and were rather inaccurate if used as the input values.These values include the expected length of the detectable crack ad = 10 mm, the number of load cyclesper year N = 1.106 and, in particular, the size and exact location of the initiation crack a0. Consideringthe detail of connection of the flange plate, it was decided to choose the mean value of a0 = 0.2 mm withlognormal distribution. For all input data see Table I (the random quantities with variable values) and Table II(the deterministic quantities). The required reliability is expressed in the technical practice as a reliabilityindex β = 2, that corresponds to the failure rate of pd = 0.02277.
Using FCProbCalc it is possible to specify for a certain time interval the load effect S (Fig. 7), resistanceof the structure R(ad) (Fig. 8) and R(aac) (Fig. 9), as well as probability of elementary phenomena U , D

Application of the Direct Optimized Probabilistic Calculation
Figure 6. FCProbCalc desktop - entry of input quantities.
Table I. Overview of variable input quantities expressed in a histogram with parametric distribution ofprobabilities.
Quantity Type Mean value Standard deviation
Oscillation of stress peaks ∆σ [MPa] Normal 30 3Total number of oscillation of stress peaks per year N [-] Normal 106 105
Yield stress fy [MPa] Lognormal 280 28Nominal stress in the flange plate σ [MPa] Normal 200 20Initial size of the crack a0 [mm] Lognormal 0.2 0.05
Smallest detectable size of the crack ad [mm] Normal 10 0.6
and F (Fig. 10) which are the source information for determination of the time of inspection which focuseson fatigue damage to the construction (Fig. 11).
The probabilistic calculation in FCProbCalc has proved, among others, that the propagation of the fatiguecrack from the surface is considerably slower than that from the edge. The calculated time for the first in-spection of the bridge is the 55th year of operation for the fatigue crack propagating from the edge and 113th
year of operation for the fatigue crack propagating from the surface. This means the former propagation rateis approximately twice slower than the latter one.

Martin Krejsa
Table II. Overview of input quantities expressed in adeterministic way.
Quantity Value
Material constant m 3Material constant C 2.2 · 1013
Width of the flange plate bf [mm] 400Thickness of the flange plate tf [mm] 25Nominal probability of failure pd 0.02277
Figure 7. FCProbCalc program output: histograms for the load effects S after 55 years (left) and 113 years (right) of operation.
Figure 8. FCProbCalc program output: Resulting histogram of the structural resistance R(ad) for propagation of fatigue crackfrom the edge (left) and from the surface (right).

Application of the Direct Optimized Probabilistic Calculation
Figure 9. FCProbCalc program output: Resulting histogram of the structural resistance R(aac) for propagation of fatigue crackfrom the edge (left) and from the surface (right).
Figure 10. FCProbCalc program output: Probabilities of the phenomena U , D and F for the propagation of fatigue crack fromthe edge (30 to 70 years of operation, left) and for the propagation of fatigue crack from the surface (80 to 120 years of operation,right).
4. Conclusions
This paper discusses development of probabilistic methods and application of the probabilistic methodsin assessment of reliabilities of structures. The basics of this work are a detailed overview of the DirectOptimized Probabilistic Calculation (DOProC) which can be used now in many probabilistic calculations.DOProC appears to be a very efficient tool that results in the solution affected by a numerical error andby an error resulting from the discretizing of the input and output quantities only. The biggest weaknessof DOProC is a considerable increase in the machine time for probabilistic operations and rather manyrandom variables in the computational model. The maximum number of the random variables depends oncomplexity of the computational model. What is also important is whether it is possible to use any of thedescribed optimized steps.

Martin Krejsa
Figure 11. FCProbCalc program output: failure probability pf , depending on the years of operation for the propagation of fatiguecrack from the edge (30 to 70 years of operation, left) and for the propagation of fatigue crack from the surface (80 to 120 years ofoperation, right).
Examples of applications of the probabilistic method DOProC described in specialized papers and men-tioned in this work should provide general information about this probabilistic method. DOProC seems tobe a good choice not only for reliability assessment tasks but also for other probabilistic calculations. Forinstance, theoretical information and practical guidelines are available to the probabilistic assessment ofpropagation of fatigue cracks from the surface and edge, a particular attention being paid to the maximumpermissible dimension and proposed system of regular inspections of the structure.
FCProbCalc was used for the probabilistic assessment of fatigue damage to a bridge structure wherecracks were propagating from both the surface and edge. Times were specified for inspections of the bridgestructure, where the purpose was to monitor occurrence of certain fatigue cracks. The comparison provedthat velocity of propagation of the fatigue crack from the surface is considerably slower than that from theedge.
A relatively complex algorithm in DOProC requires good theoretical knowledge and practical computingskills of the user. It is essential to know, at least, general basics of algorithms because this influence theway of defining the computational model and selection of the best optimizing procedure. This weakness isremoved if the application software is customized for a specific probabilistic task, this being, for instance,the case of FCProbCalc.
It should be pointed out that DOProC still provides many other options to be used. What is worth beinginvestigated further is the use of statistically dependent input quantities with direct entries in the computa-tional algorithm, assessment of reliability of structural systems and development of numerical procedureswhich will make the application of DOProC in matrix calculations more efficient.
Appendix
For a lite version of FCProbCalc and for other software products based on DOProC method please visit webpages http://www.fast.vsb.cz/popv (Janas et al., 2012).

Application of the Direct Optimized Probabilistic Calculation
Acknowledgements
The paper was published thanks to the financial support granted to the project ”Mathematics for the 21st
century engineers – innovating the teaching of mathematics in technical schools in the context of a fastdeveloping information and technical society”. The project registration number is CZ.1.07/2.2.00/07.0332.Universities responsible for the project are the Technical University of Ostrava and West Bohemia Universityin Pilsen.
References
Anderson, T. L. Fracture mechanics: fundamentals and applications. Third edition, CRC Press, Taylor & Francis Group, BocaRaton, Florida, 2005. ISBN 0-8493-1656-1.
Bergmeister, K., Novak, D., Pukl, R. and V. Cervenka V. Structural and Reliability Analysis for Existing Engineer-ing Structures, Theoretical Background. Structure and Infrastructure Engineering, vol. 5, issue 4, pp 267–275 (9 p),DOI 10.1080/15732470601185612, 2009.
Bjerager, P. Probability Integration by Directional Simulation. Journal of Engineering Mechanics – ASCE, vol. 114, issue 8,pp 1285–1302 (18 p), 1988.
Bucher, C. G. Adaptive Sampling – an Iterative Fast Monte-Carlo Procedure. Structural Safety, vol. 5, issue 2, pp 119–126 (8 p),DOI 10.1016/0167-4730(88)90020-3, 1988.
Carpinteri, A. and M. Paggi. Self-similarity and crack growth instability in the correlation between the Paris’ constants. EngineeringFracture Mechanics, vol. 74, issue 7, pp 1041–1053 (13 p), DOI 10.1016/j.engfracmech.2006.12.007, May 2007.
Chen, N. Z., Wang, G. and C. G. Soares. Palmgren-Miner’s rule and fracture mechanics-based inspection planning. EngineeringFracture Mechanics, vol. 78, issue 18, pp 3166–3182 (17 p), DOI 10.1016/j.engfracmech.2011.08.002, December 2011.
Der Kiureghian, A. and T. Dakessian. Multiple Design Points in First and Second-Order Reliability. Structural Safety, vol. 20,issue 1, pp 37–49 (13 p), DOI 10.1016/S0167-4730(97)00026-X, 1998.
Fisher, J. W., Kulak, G. L. and I. F. C. Smith. A Fatigue Primer for Structural Engineers. National Steel Bridge Allience, U.S.A.,May 1998.
Giner, E., Sukumar, N., Denia, F. D. and F. J. Fuenmayor. Extended finite element method for fretting fatigue crack propagation.International Journal of Solids and Structures, vol. 45, issue 22–23, pp 5675–5687 (13 p), DOI 10.1016/j.ijsolstr.2008.06.009,November 2008.
Helton, J. C. and F. J. Davis. Latin Hypercube Sampling and the Propagation of Uncertainty in Analyses of Complex Systems.Reliability Engineering & System Safety, vol. 81, issue 1, pp 23–69 (47 p), DOI 10.1016/S0951-8320(03)00058-9, 2003.
Hurtado, J. E. and A. H. Barbat. Monte Carlo Techniques in Computational Stochastic Mechanics. Archives of ComputationalMethods in Engineering, vol. 5, issue 1, pp 3–29 (27 p), DOI 10.1007/BF02736747, 1998.
Janas, P., Krejsa, M. and V. Krejsa. ProbCalc Software and DOProC Method. Web pages. [on-line]. ¡http://www.fast.vsb.cz/popv¿.VSB – Technical University Ostrava, 2012.
Janas, P., Krejsa, M. and V. Krejsa. Structural Reliability Assessment using a Direct Determined Probabilistic Calculation. Pro-ceedings of the 12th International Conference on Civil, Structural and Environmental Engineering Computing, Civil–CompPress, Stirlingshire, Scotland. Paper 79, 2009, ISBN 978-1-905088-31-7.
Janas, P., Krejsa, M. and V. Krejsa. Using the Direct Determined Fully Probabilistic Method for determination of fail-ure. Proceedings of the European Safety and Reliability Conference, Esrel 2009. Taylor & Francis Group, London, 2010,ISBN 978-0-415-55509-8 (set of 3 volumes + CD-ROM), ISBN 978-0-203-85975-9 (e-book).
Janssen, M., Zuidema, J. and R. J. H. Wanhill. Fracture Mechanics. Second edition, Delft University Press, 2002. ISBN 90-407-2221-8.
Kala, Z. Sensitivity Analysis of the Stability Problems of Thin–Walled Structures. Journal of Constructional Steel Research,vol. 61, issue 3, pp 415–422 (8 p), DOI 10.1016/j.jcsr.2004.08.005, 2005.
Konecny, P., Tikalsky, P. J. and D. G. Tepke. Performance Evaluation of Concrete Bridge Deck Affected by Chloride Ingress.Transportation Research Record, issue 2028, pp 3–8 (6 p), DOI 10.3141/2028-01, 2007.

Martin Krejsa
Kralik, J. and J. Kralik. Seismic Analysis of Reinforced Concrete Frame–Wall Systems Considering Ductility Effects in Accordanceto Eurocode. Engineering Structures, vol. 31, issue 12, pp 2865–2872 (8 p), DOI 10.1016/j.engstruct.2009.07.029, 2009.
Krejsa, M. and V. Tomica. Calculation of Fatigue Crack Propagation Using DOProC Method. Transactions of the VSB – TechnicalUniversity of Ostrava, no.1, 2010, vol.X, Civil Engineering Series, paper #11 (9 p), DOI 10.2478/v10160-010-0011-6. PublisherVersita, Warsaw, ISSN 1213-1962 (Print) ISSN 1804-4824 (Online).
Krejsa, M. and V. Tomica. Determination of Inspections of Structures Subject to Fatigue. Transactions of the VSB – Technical Uni-versity of Ostrava, no.1, 2011, vol.XI, Civil Engineering Series, paper #7 (11 p), DOI 10.2478/v10160-011-0007-x. PublisherVersita, Warsaw, ISSN 1213-1962 (Print) ISSN 1804-4824 (Online).
Krejsa, M. Using DOProC Method for Structural Reliability Assessment. Habilitation thesis, VSB – TU Ostrava, 2011. ISBN 978-80-248-2385-0.
Krivy, V. and P. Marek. Probabilistic Design of Steel Frame Structures. Stahlbau, vol. 76, issue 1, pp 12–20 (13 p),DOI 10.1002/stab.200710003, 2007.
Kubecka, K. Utilisation of Risk Analysis Methods in Decision – Making Process on Fitness of Rehabilitation. Stavebnictv, pp 26–31(6 p), 2010. ISSN 1802-2030, EAN 977180220300501.
Li, J., Peng, Y. B. and Chen J. B. Probabilistic Criteria of Structural Stochastic Optimal Controls. Probabilistic EngineeringMechanics, vol. 26, issue 2, pp 240–253 (14 p), DOI 10.1016/j.probengmech.2010.07.011, 2011.
Marschalko, M., Yilmaz, I., Bednarik, M. and K. Kubecka. Variations in the building site categories in the underground miningregion of Doubrava (Czech Republic) for land use planning. Engineering Geology, vol. 122, issue 3–4, pp 169–178 (10 p),DOI 10.1016/j.enggeo.2011.05.008, October 2011.
Melchers, R. E. Structural System Reliability Assessment Using Directional Simulation. Structural Safety. vol. 16, issue 1–2,pp 23–37 (15 p), DOI 10.1016/0167-4730(94)00026-M, 1994.
Moan, T. Reliability–based management of inspection, maintenance and repair of offshore structures. Structure and InfrastructureEngineering, vol. 1, issue 1, pp 33–62 (30 p), DOI 10.1080/15732470412331289314, Taylor & Francis Ltd., March 2005.
Olsson, A., Sandberg, G. and O. Dahlblom. On Latin Hypercube Sampling for Structural Reliability Analysis. Structural Safety,vol. 25, issue 1, pp 47–68 (22 p), Article Number: PII S0167-4730(02)00039-5, DOI 10.1016/S0167-4730(02)00039-5, 2003.
Rackwitz, R. and B. Fiessler. Structural Reliability Under Combined Random Load Sequences. Computers & Structures, vol. 9,issue 5, pp 489–494 (6 p), DOI 10.1016/0045-7949(78)90046-9, 1978.
Reh, S., Beley, J. D., Mukherjee, S. and E. H. Khor. Probabilistic Finite Element Analysis Using ANSYS. Structural Safety, vol. 28,issue 1–2, pp 17–43 (27 p), DOI 10.1016/j.strusafe.2005.03.010, 2006.
Sanford, R. J. Principles of Fracture Mechanics. Pearson Education, Inc., U.S.A., 2003. ISBN 0-13-092992-1.Stefanou, G. The Stochastic Finite Element Method: Past, Present and Future. Computer Methods in Applied Mechanics and
Engineering, vol. 198, issue 9–12, pp 1031–1051 (21 p). DOI 10.1016/j.cma.2008.11.007, 2009.Straub, D. Stochastic Modeling of Deterioration Processes through Dynamic Bayesian Networks. Journal of Engineering
Mechanics. 2009. DOI 10.1061/(ASCE)EM.1943-7889.0000024.Teply, B., Vorechovska, D. and Z. Kersner. Performance-Based Design of Concrete Structures: Durability Aspects. Structural
Engineering and Mechanics, vol. 35, issue 4, pp 535–538 (4 p), 2010.Thacker, B. H., Riha, D. S., Fitch, S. H. K., Huyse, L. J. and J. B. Pleming. Probabilistic Engineering Analysis Using the NESSUS
software. Structural Safety, vol. 28, issue 1–2, pp 83–107 (25 p), 2006, DOI 10.1016/j.strusafe.2004.11.003.Tomica, V. and M. Krejsa. Optimal Safety Level of Acceptable Fatigue Crack. Proceedings of 5th International Probabilistic
Workshop, Ghent, Belgium, 2007. Edited by L.Taerwe and D.Proske. (12 p). ISBN 978-3-00-022030-2.Tvedt, L. Proban - Probabilistic Analysis. Structural Safety, vol. 28, issue 1-2, pp 150-163 (14 p), 2006,
DOI 10.1016/j.strusafe.2005.03.003.Vanmarcke, E., Shinoyuka, M., Nakagiri, S., Schueller, G. I. and M. Gtigoriu. Random – Fields and Stochastic Finite – Elements.
Structural Safety, vol. 3, issue 3-4, pp 143–166 (24 p), DOI 10.1016/0167-4730(86)90002-0, 1986.Vorechovsky, M. and D. Novak. Correlation Control in Small-Sample Monte Carlo type simulations I: A Simulated Annealing
Approach. Probabilistic Engineering Mechanics. vol. 24, issue 3, pp 452–462 (11 p), DOI 10.1016/j.probengmech.2009.01.004,2009.
Zhao, Y. G. and T. Ono. Moment Methods for Structural Reliability. Structural Safety, vol. 23, issue 1, pp 47–75 (29 p),DOI 10.1016/S0167-4730(00)00027-8, 2001.