Boston Fed Communities & Banking magazine
28
Communities & Banking Also Inside 25 Level Playing Field Transforms Civic Engagement 8 It’s Not Like I’m Poor 12 Older Workers in Northern Vermont 23 Empowering Black and Brown Communities Read Communities & Banking online at www.bostonfed.org/commdev EQUAL PAY LIFTS FAMILIES PAGE 4 fall 2015 volume 26, number 4
-
Upload
khangminh22 -
Category
Documents
-
view
0 -
download
0
Transcript of Boston Fed Communities & Banking magazine

Communities & Banking
Also Inside
25 Level Playing Field Transforms Civic Engagement
8 It’s Not Like I’m Poor
12 Older Workers in Northern Vermont
23 Empowering Black and Brown Communities
Read Communities & Banking online at www.bostonfed.org/commdev
EQUAL PAYLIFTS FAMILIES
PAGE 4
fall 2015volume 26, number 4

Communities & Banking magazine aims to be the central forum for the sharing of information about low- and moderate-income issues in New England.
MANAGING EDITOR
Caroline Ellis
DESIGN
Lee Bodzioch
EDITORIAL BOARD
Claritza AbreuMichel BamaniKatharine BradburyMary BurkePrabal ChakrabartiRobert CliffordTom DeCoffClaire GreeneElbert HardemanKevin O’ConnorJennifer Weiner
PHOTOS & ILLUSTRATIONS
Ken Dubrowski (cover)iStockTodd Maki, Photo Op Photography
The views expressed are not necessarily those of the Federal Reserve Bank of Boston or the Federal Reserve System. Information about upcoming events and organizations is strictly informational and not an endorsement of these activities.
If you would like to submit an article for a future issue of Communities & Banking, please contact the editor.
Articles may be reprinted if Communities & Banking and the author are credited and the above disclaimer is used. Please send copies to:
Caroline EllisManaging Editor, Communities & BankingFederal Reserve Bank of Boston600 Atlantic AvenueBoston, MA 02210(617) 973-3187
For free subscriptions, contact:Regional and Community Outreach, Unit 31Federal Reserve Bank of Boston600 Atlantic AvenueBoston, MA [email protected]
Read online atwww.bostonfed.org/commdev/c&b
What struck me most about Heidi Hartmann and Elyse Shaw’s cover article was the extent to which equal pay for women would alleviate poverty for families and children. That has to be a win-win for both government coffers and individuals. And as Sarah Halpern-Meekin points out in “It’s Not Like I’m Poor,” the psychological benefits of relying less on government programs go beyond monetary benefits. Check out her Earned Income Tax Credits article—and Marco Gorini and Kaili Mauricio’s map showing where New Englanders are getting those credits.
In other articles of interest, Patricia Sears shares new AARP research on older workers in northern Vermont, and Lawrence Andrews and Carmen Panacopoulos write about Massachu-setts Growth Capital Corporation and how it often helps small businesses by first building their capacity, then lending them money. Brian Clarke describes a new Boston Fed collabora-tion that could yield insights on how prepaid cards could help lower-income consumers save for a rainy day. And researcher Leah Zallman and coauthors from the Cambridge-based Institute for Community Health demonstrate that, contrary to popular misconceptions, immigrants’ tax payments are benefiting the US health system, keeping Medicare’s Hospital Insurance Trust Fund solvent.
Steve McDonagh, of the Union of Minority Neighborhoods, provides tips on how power and leadership can be nurtured in black and brown communities. And Bill Traynor and Frankie Blackburn explain how they use circles and marketplaces to level the playing field for civic engagement across race and class.
Caroline Ellis
Managing [email protected]
Communities & Banking

4 Equal Pay for Women Would Decrease US Poverty by Heidi Hartmann and Elyse Shaw Institute for Women’s Policy Research Equal pay for working women is an essential lever for decreasing family
poverty and growing the US economy.
8 It’s Not Like I’m Poor Perceptions of the Earned Income Tax Credit by Sarah Halpern-Meekin, University of Wisconsin Government assistance through tax-refund checks offers financial and
psychological benefits to lower-income working families without the
stigma of many other means-tested programs.
10 Mapping New England: Earned Income Tax Credit by Marco Gorini and Kaili Mauricio Federal Reserve Bank of Boston Among the areas where the most residents are taking advantage of their
earned “bonus” at tax time are rural counties in Maine and Vermont.
12 Older Workers in Northern Vermont by Patricia M. Sears, NEKTI Consulting With more transportation and job-information services available,
older residents are aiming to contribute more to northern
Vermont’s revitalization.
16 Bridging Disparities in Small Business Access to Capital by Lawrence Andrews and Carmen Panacopoulos Small businesses that need capital may have an equally great need for
assistance in building their capacity.
Contents
18 Savings on Prepaid Cards: An Opportunity for Both Consumers and Industry by Brian Clarke, Federal Reserve Bank of Boston New tools are emerging to help consumers access affordable financial
services and save for emergencies.
21 How Immigrants Subsidize Care for Seniors by Leah Zallman, Adriana Bearse, Lisa Arsenault, and Blessing Dube, Institute for Community Health Between 1996 and 2011, immigrants contributed $182.4 billion more to
Medicare’s Hospital Insurance Trust Fund than the Fund expended on
their health-care benefits.
23 Viewpoint: Giving a Voice to Communities of Color by Steve McDonagh, Union of Minority Neighborhoods A nonprofit committed to building power and leadership in black and
brown communities is pioneering a multifaceted approach.
25 Circles and Marketplaces: Spaces for Transforming Community Life by Bill Traynor and Frankie Blackburn Trusted Space Partners New kinds of community moments for connection and exchange are
helping communities build diverse networks of aspirational people to
repopulate the civic landscape.
8
18
12
23
Fall 2015

4 fall 2015
Equal Pay for Women Would Decrease US Poverty

5Communities & Banking
New FindingsEach state reflects the national picture, as shown in “The Status of Women in the States 2015: Employment and Earnings,” by the Institute for Women’s Policy Research (IWPR).3 In general, women in the New England and Mid-Atlantic states fare the best on an employment-and-earnings composite, an index that includes the wage ratio, median annual earnings, percent of women in the labor market, and percent employed in professional or managerial occu-pations. Five of the six New England states are ranked in the top 12 states and earn a grade of B or a B+. Maine is ranked 19th (still above the median state), earning a C+ on the composite.
Despite the mostly positive composite scores, no New Eng-land state has reached pay equity. Vermont, Maine, Rhode Island, and Massachusetts have high female-male ratios (at 86 percent, 84 percent, 83 percent, and 81 percent respectively) and hence the smallest wage gaps in the region (14 percent, 16 percent, 17 per-cent, and 19 percent). Connecticut and New Hampshire have a larger gap (23 percent), ranking 34th and 38th. Vermont (4th), Maine (8th), and Rhode Island (11th) rank within the top states nationwide for pay equity, and Massachusetts ranks 18th, well above the median. For Connecticut, Massachusetts, and New Hampshire, however, the pay-equity rank is their lowest rank among the four compo-nents of the composite. For Maine and Vermont, pay equity is their best score on any indicator in the composite.
Many differences between the states affect pay equity, includ-ing what industries predominate in a state, women’s educational
attainment, and the friendliness of state policies toward working women (higher minimum wages, more collective bargaining, pub-lically provided child care, and on-the-job accommodations for pregnant workers).
The racial composition of a state’s workforce also is signifi-cant. Because minority men earn substantially less than white men, whereas minority women earn less than white women but not as much less, a state with a large minority population often has a higher female-to-male pay ratio.
In 2014, Hispanic men earned at the median only about 68 percent of what white men earned weekly; Hispanic women earned 75 percent of what white women earned. Black men earned about 76 percent of what white men earned; black women earned 83 per-cent of white women’s earnings. Still, the pay gap between women of color and white men is large. Hispanic women’s median weekly earnings in 2014 were 61 percent of white men’s, and the median weekly earnings of black women were 68 percent of white men’s. Women of all major racial and ethnic groups also earn less than men in their own ethnic group.4
Of the 71 percent of US mothers who work for pay, 68 percent are married, typically with access to men’s incomes, but married mothers’ earnings are nevertheless important to families.5 It is esti-mated that about 37 percent of working mothers are either joint breadwinners (earning at least 40 percent of the household income) or primary breadwinners.6 Thirty-two percent are single mothers—often the family’s sole support. And many women without children support themselves and other relatives.
Equal pay would greatly benefit women and their families. Yet IWPR’s straight-line projection shows that at the same rate of progress since 1960, equal pay will not be realized until 2058.7 The likely year in which pay parity is reached depends on the starting year of the projection and the method used. A 1960 start includes
Heidi Hartmann and Elyse Shaw INSTITUTE FOR WOMEN’S POLICY RESEARCH
COVER STORY
Women make up nearly half the US workforce, and their earnings are essential to the economic security of millions of families. Yet women who work full-time and year-round earn only 78 cents on the dollar compared with men who work full-time and
year-round. In 2013, the last year for which median annual earnings for full-time workers are available, the gender wage gap at the median was $11,053.1 The glass ceiling and occupational segregation—the concentration of women in some jobs
and men in others—remain stubborn features of the labor market.2
Women of all major racial and ethnic groups earn less than men in their own ethnic group.
Equal pay for working women is an essential lever for decreasing family poverty and growing the US economy.

6 fall 2015
the period of men’s rapidly rising wages. Starting in the late 1970s, when men’s real wages began to stagnate, shortens the time to pay parity. Including only the most recent 10 years would lengthen the time because, in this period, both women’s and men’s real wages show little growth. In an alternative method, still using 1960 as the starting date and the straight-line method but making the cal-culation separately for men’s and women’s wages, pay parity arrives in 2080.
What If? IWPR researchers also calculated how much women would gain in earnings, how much poverty would be reduced, and how much the economy would be likely to grow if women earned pay equal to that earned by comparable men.
Labor supply, human capital, and labor-market characteristics (urban, rural, and regional) were statistically controlled in the cal-culation. Nationally, 59.3 percent of women would earn more if working women were paid the same as men of the same age with similar education and hours of work in the same type of labor market.
Providing equal pay to women would also have a dramatic impact on their families. (See “Equal Pay Would Reduce Poverty by Half.”) The poverty rate for all working women would be halved, falling to 3.9 percent. For the 36.2 million families headed by mar-ried women, the poverty rate would fall by more than half, from 2.4 percent to 1.1 percent. The high poverty rate for working sin-gle mothers would fall by nearly half, from 28.7 percent to 15.0 percent, and two-thirds would receive a pay increase. For the 14.3
million single women, equal pay would mean a very significant drop in poverty from 11.0 percent to 4.6 percent. The average woman worker is estimated to gain $6,251 in annual pay (which includes $0 values for those who gain nothing).
To the extent women’s lower pay is due to discrimination, it’s a market failure resulting in the misallocation of human capital. It contributes to women working at less productive pursuits, which holds back economic growth. Some, possibly many, women who are crowded into lower-paying, female-dominated occupations (for example, cashiers, child-care workers, and personal-care aides) have the skills to work in higher-paying jobs that are dominated by men. IWPR researchers estimated that the US economy would have pro-duced additional income of $447.6 billion if women received equal pay. That represents 2.9 percent of 2012 gross domestic product, or the addition of a state the size of Virginia. And that estimate is low, since women’s work hours, educational achievement, and occupational attainment were not increased in the model, and women almost surely would upgrade those factors if they expected to receive equal pay.
One barrier to equal pay has been pay secrecy. In 2014, Cali-fornia, Colorado, Illinois, Louisiana, Maine, Michigan, Minnesota, New Hampshire, New Jersey, and Vermont passed laws prohibiting retaliation against workers who share pay information.8 The laws appear necessary: in 2010, nearly half of all workers nationwide reported being forbidden or strongly discouraged from discussing their pay with colleagues.9 The federal government, which has high levels of pay transparency, has a gender wage gap of only 11 per-cent, compared with 22 percent across the economy.10
Pay transparency alone will not close the gap, however. Trans-parency needs to be combined with strengthened enforcement of equal employment opportunity laws, a higher minimum wage,
Equal Pay Would Reduce Poverty by Half for Families with a Working Woman
Single mothers
0
10
20
30
40
50
Potential Upper-Bound E�ects of Policy Alternatives on 401(k) Participation Rates of Lower-Income Individuals Age 50–58
Current participation rate
Poverty rate
Percent
12%
16%
33%
42%
Auto-enroll- all current plans
All employers o�er plan
All employers o�er plan + auto-enrollSource: Institute for Women’s Policy Research analysis of 2010–2012 Current
Population Survey, Annual Social and Economic Supplement. Source: Bank-level call reports (the Federal Financial Institutions Examination Council Consolidated Reports of Condition and Income).
0
5
10
15
20
25
30
Other singlewomen
Married women
If working women earned the same as comparable men
Current
Per
cen
t
35
Approaches that raise wages at the bottom are especially important to women, who hold more than their share of low-wage jobs.
Equal pay would lower the poverty rate for working single mothers by nearly half.
ph
oto
Fe
rtn
ig/i
Sto
ck
This Communities & Banking article is copyrighted by the Federal Reserve Bank of Boston.
The views expressed are not necessarily those of the Bank or the Federal Reserve System.
Copies of articles may be downloaded without cost at www.bostonfed.org/commdev/c&b.

7Communities & Banking
increased union representation and collective bargaining, and more family-friendly policies.
Approaches that raise wages at the bottom, such as increases in the minimum wage and collective bargaining, are especially impor-tant to women since they hold a disproportionate share of low-wage jobs. The gender wage gap being smaller among union members, collective bargaining also raises wages more for women and minori-ties on average than for white men.
The lowest-paid workers are the least likely to receive any kind of leave benefits, especially paid sick days and paid family leave. Married women with high-earning husbands may take time off work for a baby without a disastrous effect on family finances, but low- and moderate-wage women are typically married to men with low or moderate wages, which makes the loss of their earnings more deleterious. Paid sick days and paid family leave would help new mothers maintain family income while having time to recover and take care of their babies’ health needs.
The increased labor-market attachment and longer job tenure with which family leave is associated should also help raise women’s wages—and for low-wage women’s lifetime earnings, strengthening and lengthening labor-force attachment is essential.
Any policy that benefits women in the workforce is going to be important for improving the lives of their family members.
Heidi Hartmann, PhD, an economist, is president and CEO of the Institute for Women’s Policy Research, where Elyse Shaw, MA, is a research associate. They are based in Washington, DC. Contact the authors at [email protected] or [email protected].
Endnotes1 Carmen DeNavas-Walt and Bernadette D. Proctor, “Income and Poverty in the
United States: 2013” (report, US Government Printing Office, Washington, DC, 2014), http://www.census.gov/content/dam/Census/library/publications/2014/demo/p60-249.pdf. The data are derived from the Annual Social and Economic Supplement of the Current Population Survey.
2 Ariane Hegewisch, Hannah Liepmann, Jeffrey Hayes, and Heidi Hartmann, “Separate and Not Equal? Gender Segregation in the Labor Market and the Gender Wage Gap” (briefing paper #C377, Institute for Women’s Policy Research, Washington, DC, 2010), http://www.iwpr.org/publications/pubs/separate-and-not-equal-gender-segregation-in-the-labor-market-and-the-gender-wage-gap.
3 “The Status of Women in the States” (report #R401, Institute for Women’s Policy Research, Washington, DC, 2015), http://www.iwpr.org/publications/pubs/the-status-of-women-in-the-states-2015-2014-employment-and-earnings. The state-by-state equal-pay ratios are based on microdata analysis by IWPR of the American Community Survey for 2013.
4 Ariane Hegewisch, Emily Ellis, and Heidi Hartmann, “The Gender Wage Gap 2014: Earnings Differences by Race and Ethnicity” (fact sheet #C430, Institute for Women’s Policy Research, Washington, DC, 2015), http://www.iwpr.org/publications/pubs/the-gender-wage-gap-2014-earnings-differences-by-race-and-ethnicity. The weekly earnings data are from the Current Population Survey as reported by the Bureau of Labor Statistics.
5 Heidi Hartmann, Jeff Hayes, and Jennifer Clark, “How Equal Pay for Working Women Would Reduce Poverty and Grow the American Economy” (briefing paper #C411, Institute for Women’s Policy Research, Washington, DC, 2014), http://www.iwpr.org/publications/pubs/how-equal-pay-for-working-women-would-reduce-poverty-and-grow-the-american-economy.
6 Ariane Hegewisch and Jessica Milli (unpublished microdata analysis of the American Community Survey for 2013, Institute for Women’s Policy Research, Washington, DC, 2015), forthcoming in The Status of Women in the States: 2015 (Institute for Women’s Policy Research, Washington, DC, 2015).
7 “Women’s Median Earnings as a Percent of Men’s Median Earnings, 1960–2013” (quick figures #Q026, Institute for Women’s Policy Research, Washington, DC, 2014), http://www.iwpr.org/publications/pubs/women2019s-median-earnings-as-a-percent-of-men2019s-median-earnings-1960-2013-full-time-year-round-workers-with-projection-for-pay-equity-in-2058.
8 “Pay Secrecy” (report, US Department of Labor, Women’s Bureau, Washington, DC, 2014), http://www.dol.gov/wb/media/pay_secrecy.pdf.
9 Jeff Hayes and Heidi Hartmann, “Women and Men Living on the Edge: Economic Insecurity after the Great Recession” (report #C386, Institute for Women’s Policy Research Washington, DC, 2011), http://www.iwpr.org/publications/pubs/women-and-men-living-on-the-edge-economic-insecurity-after-the-great-recession.
10 Ariane Hegewisch, Claudia Williams, and Robert Drago, “Pay Secrecy and Wage Discrimination” (report #Q016, Institute for Women’s Policy Research, Washington, DC, 2011), http://www.iwpr.org/publications/pubs/pay-secrecy-and-wage-discrimination.
Nationally, 59.3 percent
of women would earn
more if working women
were paid the same as
men of the same age
with similar education
and hours of work
in the same type of
labor market.
ph
oto
Xav
ier
Arn
au/i
Sto
ck

8 fall 2015
Government assistance through tax-refund checks offers financial and psychological benefits to lower-income working families without the stigma of many other means-tested programs
“It’s not like I’m poor,” one father told us during a kitchen table conversation in the Boston metropolitan area. This man’s identity as a worker, not a dependent on government assistance, is key to his sense of self and his dignity, as it was for so many of the 115 Boston-area families whom we met for our study It’s Not Like I’m Poor: How Working Families Make Ends Meet in a Post-Welfare World.1
A Special Kind of AssistanceIn America, “poor” is not just a descriptor of one’s bank account balance. It can be seen as a statement of a person’s worth and role in society. An individualistic culture and the historical legacy of the Protestant work ethic mean government support can be stigmatiz-ing. And yet many families depend on help to get by, with more than a quarter of households receiving means-tested benefits in any given month.2
Unlike the Supplemental Nutrition Assistance Program (SNAP), Temporary Assistance for Needy Families (TANF), or
subsidized housing, tax-refund checks spare families the feeling of compromising their positive identities by claiming a benefit. For lower-income families with children, that check at tax time is often far more than just a refund of what they’ve overpaid in taxes. It’s a set of government assistance programs—the Earned Income Tax Credit (EITC) and Child Tax Credit (CTC)—that lifts some 9.4 million families over the poverty line.3 Available only to workers—those with earned income—the program features benefits that phase in as earnings rise and then phase out gradually. There are higher income limits for married parents and higher benefits for workers with more children.
Parents in our study described tax time as “better than Christ-mas” and their refund check as a “bonus.” All year long they struggled to make ends meet, but tax time meant the arrival of a big refund check, ending the year’s financial drought. The money quenches a thirst both financial and psychological, without exact-ing the costs associated with other forms of government assistance.
The Financial SideLiving paycheck to paycheck was common among the families in our study, many of whom faced volatility in income and expenses. Debt was common, with only five of the 115 families holding no debt. Each month often meant a juggling act as parents figured out how to spread too few resources over too many expenses. Earned income alone covered only some 68 percent of monthly expenses. Tax time offered a chance to catch up.
Sarah Halpern-Meekin UNIVERSITY OF WISCONSIN
It’s Not Like I’m PoorPerceptions of the Earned Income Tax Credit
photo NoDerog/iStock

9Communities & Banking
One quarter of refund dollars went to regular monthly expenses, like groceries or rent. Another quarter went to back bills and debts, such as past-due utilities and credit card bills. The average house-hold that allocated tax-time funds to debt payment reduced its debt load by nearly half. One-fifth of refund dollars were spent on assets, like a used car or furniture. One-sixth went into savings accounts (although much of that was spent within six months). Finally, one-tenth of the tax check went to treats like gifts or eating out.4
For some families, the money meant an end to harassing phone calls from creditors. For others, it meant the chance to repair credit scores, secure essential items (say, beds for kids who had been bunk-ing with their mother), or stockpile food to help weather tough times. Occasionally, the needs were even more pressing. Upon learning the size of her refund check, one mother said, “I knew that that was going to keep us out of eviction court.”
The Psychological and Physiological SideThe hardships involve more than dollars and cents. There is stress for parents in trying to ensure their kids have essentials. And it can be hard to keep believing in a more comfortable, financially mobile future. The lump sum at tax time can feel like an answer to a prayer. The bills are paid on time, children’s desires for a Dora the Explorer kiddie table or a video game can be indulged, and the possibility of one day using an EITC check as a house down payment beckons, offering the hope of home ownership and a safer neighborhood.
Relief on the physiological side also matters. Other studies of EITC recipients have found that mothers who received higher ben-efits were in better health on measures of self-reported well-being, mental health, and risk biomarkers.5 And higher EITC benefits have been found to translate into a lower likelihood of stress-related behaviors like smoking and drinking during pregnancy. Hence higher EITC benefits are associated with a lower frequency of pre-term and low-birth-weight babies.6
Avoiding StigmaAlthough, like most of us, parents on our study had a fuzzy under-standing of tax law, they saw their refund check as something that they earned for being a working parent. It made for a positive iden-tity and a sense of “deservingness.” The check was seen as a reward for doing the right thing—working hard to provide for one’s children.
Further, the complexity of the tax code often obscures which monies in the refund check are coming from where. Many fami-lies engaged in purposeful over-withholding to guard against owing money at tax time and as a forced-savings mechanism. The refund check, therefore, really did include money parents had earned, on top of whatever EITC and CTC provided. Parents often didn’t know what portion of the refund came from which source. That lack of transparency seemed to provide a further guard against the government assistance being stigmatized.
In addition, unlike welfare, SNAP, or housing assistance, which can require a trip to an office designated only to help those perceived to be asking for a handout, most EITC recipients visit a for-profit preparer at tax season, getting treated like a customer, not a case
number. At such companies, EITC claimants are like other Ameri-cans, filing their taxes and hoping not to get hit with a big tax bill.
Higher-income families might be filling out Schedule D to claim their capital gains and losses while lower income families are filing the EIC schedule, but they share in common the experi-ence of filing their taxes. The delivery mechanism is the same for tax payments and refunds. So on the surface, at least, the tax pro-cess creates more similarities than differences across socioeconomic strata, meaning it incorporates, rather than ostracizes, those claim-ing government assistance through the tax system.
This tax-time method of supporting families certainly leaves many behind, particularly those who cannot work or find a job and those without dependent children. But for those who benefit from government support in the form of a tax-refund check, the funds have deep financial and psychological importance and reaffirm posi-tive identities of recipients, who feel they are getting a bonus they earned and not a handout.
Sarah Halpern-Meekin is an assistant professor in the Human Devel-opment and Family Studies department at the University of Wisconsin-Madison. Contact her at [email protected].
Endnotes1 Sarah Halpern-Meekin, Kathryn Edin, Laura Tach, and Jennifer Sykes, It’s Not
Like I’m Poor: How Working Families Make Ends Meet in a Post-Welfare World (Berkeley: University of California Press, 2015). The researchers studied EITC recipient families from the Boston metropolitan area recruited through H&R Block and volunteer income-tax preparers in East Boston and Dorchester and through Head Start centers in Somerville, Charlestown, South Boston, Jamaica Plain, and Roslindale. Approximately 330 completed an initial survey on site. We then drew a stratified random sample of 120 families for in-depth interviews; 115 ultimately took part in the study’s qualitative portion.
2 See http://www.census.gov/programs-surveys/sipp/publications/tables/hsehld-char.html. In our sample of EITC recipients, 86 percent benefited from at least one other government assistance program.
3 Chuck Marr et al., “EITC and Child Tax Credit Promote Work, Reduce Poverty, and Support Children’s Development, Research Finds” (report, Center on Budget and Policy Priorities, Washington, DC, 2015), http://www.cbpp.org/cms/?fa=view&id=3793. In addition to the federal EITC, 25 states and the District of Columbia also offer their own EITCs, typically set at a percentage of the family’s federal EITC.
4 For more information, see Ruby Mendenhall et al., “The Role of the Earned Income Tax Credit in the Budgets of Low-Income Families,” Social Service Review 86 (2012): 367–400. In addition to the refund check’s financial benefits to individuals, EITC and CTC effects can be examined at a community level, as the influx of cash into families’ pockets is quickly spent. See Alan Berube, “Using EITC to Stimulate Local Economies” (report, Brookings Institution, Washington, DC, 2006), http://www.brookings.edu/research/reports/2006/11/childrenfamilies-berube.
5 William N. Evans and Craig L. Garthwaite, “Giving Mom a Break: The Impact of Higher EITC Payments on Maternal Health,” American Economic Journal: Economic Policy 6 (2014): 258–290.
6 Hilary W. Hoynes, Douglas L. Miller, and David Simon, “Income, the Earned Income Tax Credit, and Infant Health” (working paper no. 18206, National Bureau of Economic Research, 2012), http://www.nber.org/papers/w18206; Hilary W. Hoynes, Douglas L. Miller, and David Simon, “The EITC: Linking Income to Real Health Outcomes” (policy brief, University of California Davis Center for Poverty Research, 2013), http://poverty.ucdavis.edu/research-paper/policy-brief-linking-eitc-income-real-health-outcomes; and Kate W. Strully, David H. Rehkopf, and Ziming Xuan, “Effects of Prenatal Poverty on Infant Health: State Earned Income Tax Credits and Birth Weight,” American Sociological Review 75 (2010): 534–562.
This Communities & Banking article is copyrighted by the Federal Reserve Bank of Boston.
The views expressed are not necessarily those of the Bank or the Federal Reserve System.
Copies of articles may be downloaded without cost at www.bostonfed.org/commdev/c&b.

10 fall 2015
Mapping New EnglandUse of Earned Income Tax Credit, 2013, by County
Marco Gorini and Kaili MauricioFEDERAL RESERVE BANK OF BOSTON
The Earned Income Tax Credit (EITC) is a federal assistance program designed to benefit lower-income, working families by increasing the amount of their annual tax refund. For the 2013 tax year, 20.2 percent of federal tax filers nationwide received the earned income tax credit, with the average credit totaling $2,411. In order to qualify, taxpayers must have received “earned income” (such as wages, tips, or income from running a business or farm), and their income must have been below certain thresholds as defined by the number of qualifying children. Fewer children and higher eligible incomes translate into a smaller tax credit. Families with more children and lower incomes receive the largest credits.
In the New England states in 2013, a smaller share of the population claimed federal EITC credits than the national average and received, on average, a smaller credit. Rhode Island and Maine experienced the highest rates of EITC claims—17.3 percent and 17.1 percent, re-spectively. Rhode Island also had the highest average tax credit in New England, followed by Connecticut and Massachusetts. New Hampshire had the lowest statewide average of EITC claims, at 12.4 percent, and the second-lowest average credit, ahead of Vermont.
The rural New England counties of Maine, New Hampshire, and Vermont generally have higher rates of EITC claims, but smaller average credits, while the opposite is true in many of southern New England’s more urban and suburban counties. Since the size of the claim is inversely proportional to the recipient’s income (and proportional to the size of the fam-ily), there are probably somewhat higher incomes overall (and/or smaller families) among EITC filers in the northern New England states. Furthermore, since they have more claims as a share of the population, the data may reflect lower levels of income disparity in north-ern New England versus southern. Statewide averages, however, can hide the story at the county level. Several poor counties—Providence County in Rhode Island, Essex Coun-ty in Vermont, Hampden County in Massachusetts, as well as Somerset and Piscataquis counties in Maine—all rank in the top 10 on both rates of EITC claims and average size of credits received.
Average Size of Earned Income Tax Credit per Recipient in New England States
0
500
1000
1500
2000
2500
3000
Ave
rag
e E
ITC
/Re
cip
ien
t ($
)
$2,139 $2,051
CT MA ME NH RI VT US
$2,040 $1,930$2,264
$1,897
$2,411
Sources: Internal Revenue Service, http://www.irs.gov/uac/Newsroom/Earned-Income-Tax-Credit-Do-I-Qualify, and Brookings
Institution, http://www.brookings.edu/research/interactives/eitc.

11Communities & Banking
Percent of Tax ReturnsReceiving EITC
CT
RI
MA
NH
VT
ME
< 10%
10%–15%
15%–20%
20%–25%
$23K
This Communities & Banking article is copyrighted by the Federal Reserve Bank of Boston.
The views expressed are not necessarily those of the Bank or the Federal Reserve System.
Copies of articles may be downloaded without cost at www.bostonfed.org/commdev/c&b.

12 fall 2015photo iStock
Older Workers in Northern Vermont “Remote” Doesn’t Have to Mean “Removed”
Patricia M. Sears NEKTI CONSULTING
ph
oto
iSt
ock
13Communities & Banking
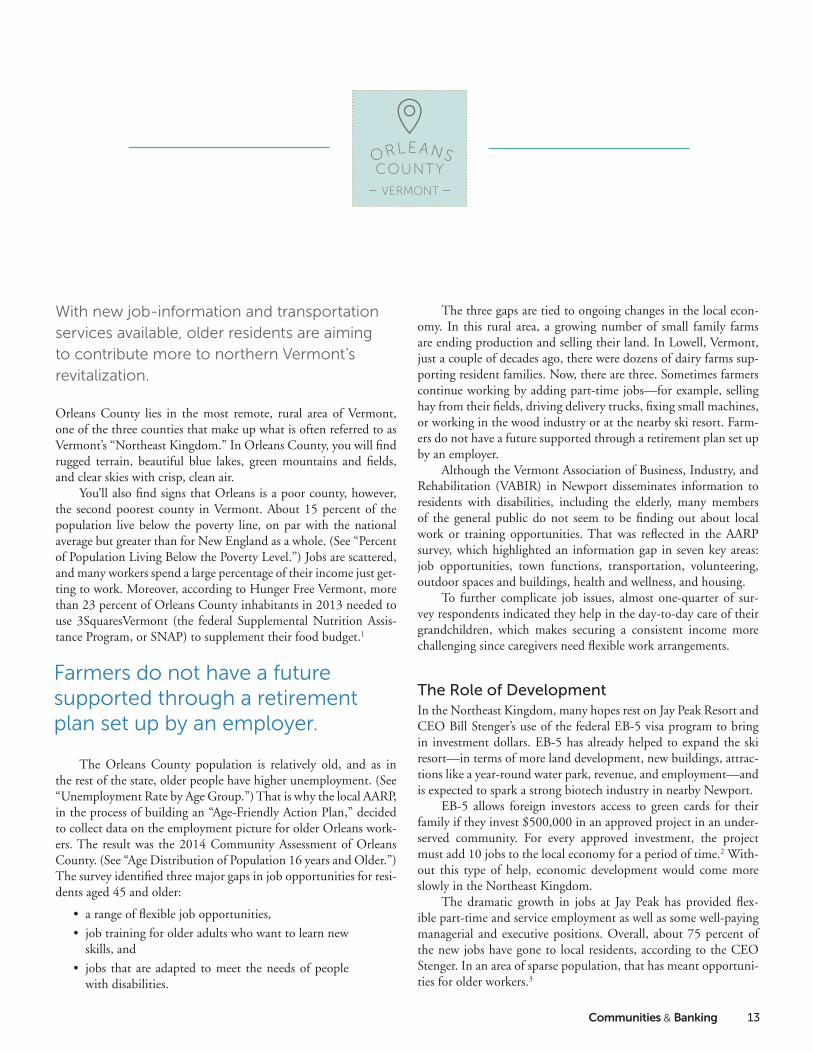
With new job-information and transportation services available, older residents are aiming to contribute more to northern Vermont’s revitalization.
Orleans County lies in the most remote, rural area of Vermont, one of the three counties that make up what is often referred to as Vermont’s “Northeast Kingdom.” In Orleans County, you will find rugged terrain, beautiful blue lakes, green mountains and fields, and clear skies with crisp, clean air.
You’ll also find signs that Orleans is a poor county, however, the second poorest county in Vermont. About 15 percent of the population live below the poverty line, on par with the national average but greater than for New England as a whole. (See “Percent of Population Living Below the Poverty Level.”) Jobs are scattered, and many workers spend a large percentage of their income just get-ting to work. Moreover, according to Hunger Free Vermont, more than 23 percent of Orleans County inhabitants in 2013 needed to use 3SquaresVermont (the federal Supplemental Nutrition Assis-tance Program, or SNAP) to supplement their food budget.1
The Orleans County population is relatively old, and as in the rest of the state, older people have higher unemployment. (See “Unemployment Rate by Age Group.”) That is why the local AARP, in the process of building an “Age-Friendly Action Plan,” decided to collect data on the employment picture for older Orleans work-ers. The result was the 2014 Community Assessment of Orleans County. (See “Age Distribution of Population 16 years and Older.”) The survey identified three major gaps in job opportunities for resi-dents aged 45 and older:
• a range of flexible job opportunities,
• job training for older adults who want to learn new skills, and
• jobs that are adapted to meet the needs of people with disabilities.
The three gaps are tied to ongoing changes in the local econ-omy. In this rural area, a growing number of small family farms are ending production and selling their land. In Lowell, Vermont, just a couple of decades ago, there were dozens of dairy farms sup-porting resident families. Now, there are three. Sometimes farmers continue working by adding part-time jobs—for example, selling hay from their fields, driving delivery trucks, fixing small machines, or working in the wood industry or at the nearby ski resort. Farm-ers do not have a future supported through a retirement plan set up by an employer.
Although the Vermont Association of Business, Industry, and Rehabilitation (VABIR) in Newport disseminates information to residents with disabilities, including the elderly, many members of the general public do not seem to be finding out about local work or training opportunities. That was reflected in the AARP survey, which highlighted an information gap in seven key areas: job opportunities, town functions, transportation, volunteering, outdoor spaces and buildings, health and wellness, and housing.
To further complicate job issues, almost one-quarter of sur-vey respondents indicated they help in the day-to-day care of their grandchildren, which makes securing a consistent income more challenging since caregivers need flexible work arrangements.
The Role of Development In the Northeast Kingdom, many hopes rest on Jay Peak Resort and CEO Bill Stenger’s use of the federal EB-5 visa program to bring in investment dollars. EB-5 has already helped to expand the ski resort—in terms of more land development, new buildings, attrac-tions like a year-round water park, revenue, and employment—and is expected to spark a strong biotech industry in nearby Newport.
EB-5 allows foreign investors access to green cards for their family if they invest $500,000 in an approved project in an under-served community. For every approved investment, the project must add 10 jobs to the local economy for a period of time.2 With-out this type of help, economic development would come more slowly in the Northeast Kingdom.
The dramatic growth in jobs at Jay Peak has provided flex-ible part-time and service employment as well as some well-paying managerial and executive positions. Overall, about 75 percent of the new jobs have gone to local residents, according to the CEO Stenger. In an area of sparse population, that has meant opportuni-ties for older workers.3
ORLEANS
– VERMONT –
COUNTY
Farmers do not have a future supported through a retirement plan set up by an employer.

14 fall 2015
Additionally, many residents are hoping to find jobs at the planned biotech firm. When AnC Bio VT had its groundbreak-ing on May 12, 2015, the Burlington Free Press reported that “the roughly 80,000-square AnC Bio Vermont facility will do research, manufacture heart-lung machines and portable dialysis machines, and perform cell-culturing for heart therapy.”
The 400 to 450 jobs will be one-third researchers and execu-tives, one-third managers, and one-third plant operations, according to Stenger, who also is an AnC Bio VT executive.4 The company expects to open in 2017.
Transportation development will also be important for improved employment numbers, and not just for older workers. In rural areas, there is always a high demand for reliable transportation. Recently, a partnership encouraged by VABIR between Jay Peak Resort and the Vermont Transportation Agency has added shut-tles for workers in communities up to a 90-minute drive from the
resort.5 The idea is to save expense for workers and provide a reliable workforce for the resort even on the snowiest days.
New Approaches In December 2013, the Newport City Coun-cil and Mayor Paul Monette put the Orleans County municipality forward as the first in Vermont to join AARP’s nationwide Network of Age-Friendly Communities—approving a resolution to establish and participate in a cit-izen advisory council that involves the active engagement of older adults.6
In another positive development, one that could ultimately provide employment opportunities for workers who need flexi-bility, so-called maker spaces are popping up around the state. These are places where inter-generational partnerships create new products and help to launch entrepreneurs, many of whom are developing solutions for improved
caregiving and mobility.7 But challenges remain. A frequently mentioned barrier to
livability and economic growth in the Northeast Kingdom is telecommunications. Access to reliable, affordable, high-speed broadband Internet service and cellular service is spotty at best, a situation that affects not only the mundane functions of munici-pal government but robust information sharing, telemedicine, and plans to expand businesses.
And of course there is the challenge of long-term unem-ployment, which can affect older workers disproportionately. Fortunately, according to the AARP Public Policy Institute, the fed-eral Workforce Innovation and Opportunities Act (WIOA), which took effect on July 1, 2015, has five provisions that could help alle-viate that challenge.
First, the WIOA singles out for assistance individuals with bar-riers to employment, such as those aged 55 and older, “along with
New England
United States
Orleans County
Vermont
New England
United States
Orleans County
Vermont
Total population
Under 18 18–64
65 and older
Pe
rce
nt
Percent of Population Living Below the Poverty Level
0
5
10
15
20
25
30
35
16–19
20–24
25–44 45–54
55–64
65–74
75 and older
Age Distribution of Population 16 Years and Older
Pe
rce
nt
0
5
10
15
20
25
30
Unemployment Rate by Age Group
16 and under
16–19
20–24
25–44
45–54
55–64 65–74
75 and older
Percent of Population with Some DisabilityP
erc
en
t
Totalpopulation
under 5 years 5–17 years 18–64 years 65 years and over
Pe
rce
nt
Age groupAge group
Age groupAge group
40
35
30
25
20
15
10
5
0
25
20
15
10
5
0
New England
United States
Orleans County
Vermont
New England
United States
Orleans County
Vermont
Total population
Under 18 18–64
65 and older
Pe
rce
nt
Percent of Population Living Below the Poverty Level
0
5
10
15
20
25
30
35
16–19
20–24
25–44 45–54
55–64
65–74
75 and older
Age Distribution of Population 16 Years and Older
Pe
rce
nt
0
5
10
15
20
25
30
Unemployment Rate by Age Group
16 and under
16–19
20–24
25–44
45–54
55–64 65–74
75 and older
Percent of Population with Some Disability
Pe
rce
nt
Totalpopulation
under 5 years 5–17 years 18–64 years 65 years and over
Pe
rce
nt
Age groupAge group
Age groupAge group
40
35
30
25
20
15
10
5
0
25
20
15
10
5
0
ph
oto
Bo
wd
en
imag
es/
Sto
ck
Many of today’s seniors want to learn new skills and have jobs.

15Communities & Banking
New England
United States
Orleans County
Vermont
New England
United States
Orleans County
Vermont
Total population
Under 18 18–64
65 and older
Pe
rce
nt
Percent of Population Living Below the Poverty Level
0
5
10
15
20
25
30
35
16–19
20–24
25–44 45–54
55–64
65–74
75 and older
Age Distribution of Population 16 Years and Older
Pe
rce
nt
0
5
10
15
20
25
30
Unemployment Rate by Age Group
16 and under
16–19
20–24
25–44
45–54
55–64 65–74
75 and older
Percent of Population with Some DisabilityP
erc
en
t
Totalpopulation
under 5 years 5–17 years 18–64 years 65 years and over
Pe
rce
nt
Age groupAge group
Age groupAge group
40
35
30
25
20
15
10
5
0
25
20
15
10
5
0
several groups in which older workers are disproportionately rep-resented: the long-term unemployed, displaced homemakers, and persons with disabilities. States must develop plans on how they will serve these groups and report how they have been served. Reporting data must be disaggregated by age,” the AARP Public Policy Insti-tute notes.
Second, the WIOA eliminates the sequencing of services, which should enable job seekers to access training and supports immedi-ately rather than going through a time-consuming protocol.8 Third, the WIOA improves services to people with disabilities, many of whom are older. (See “Percent of Population with Some Disabil-ity.”) Fourth, it broadens state flexibility on supportive services that many older people need if they are to work. And finally, it “enhances
reporting requirements. Core programs will be required to report on performance indicators such the number of participants who entered and retained employment, median wages, and credential acquisition. Administrative reports on individuals with barriers to employment must be made public.”
The AARP Public Policy Institute continues, “If effectively implemented, WIOA will result in a streamlined workforce devel-opment system that promotes job training and encourages greater collaboration between employers and training providers, such as community colleges.”
As promising as such changes are, however, the effects of the law will not be felt immediately. Says New School for Social Research professor Teresa Ghilarducci, “The disturbing new work reality is that nonexistent and too-small 401(k) account balances give less bargaining power to older workers to quit a job or find a job they love. The [national] average Social Security benefit is about $15,000 per year; the median income from IRAs, and 401(k) plans will yield
$2,400 per year, which barely meets the federal poverty standard for living in a chronic state of want and deprivation.”9
Ghilarducci adds that “having a secure pension, an adequate nest-egg, a small or zero mortgage, and a strong Social Security and Medicare system are some of the best ways to ensure the jobs older people get are the ones they love.” Even so, she says, “Work is good, and many Americans like it. Anyone who loves to work should be able to.”
Patricia M. Sears is the CEO of NEKTI Consulting. She is based in Lowell, Vermont. Contact her at [email protected]. Endnotes1 See http://www.hungerfreevt.org/learn/what-is-the-issue.2 See Audrey Singer, “The EB-5 Visa Program for Immigrant Investors,”
Communities & Banking 26, no. 1 (winter 2015), http://www.bostonfed.org/commdev/c&b/2015/winter/singer-zeuli-eb-5-visa-for-economic-development.htm.
3 The unemployment rate in Orleans County is 5.80 percent, with job growth of 1.37 percent. One analysis predicts job growth over the next 10 years as high as 36.90 percent. See http://www.bestplaces.net/economy/county/vermont/orleans.
4 Dan D’Ambrosio, “AnC Coming to Newport in May,” Burlington Free Press, April 7, 2015, http://www.burlingtonfreepress.com/story/money/2015/04/06/anc-bio-coming-newport-may/25377385/.
5 Jay Peak, “Jay Peak to Offer Free Van Service to Employees,” news release, November 23, 2014, http://vtdigger.org/2014/11/23/jay-peak-offer-free-van-service-employees/.
6 Launched by the World Health Organization, the Age-Friendly Community initiative was adopted in 2012 by AARP. There are 258 such communities worldwide—34 in the United States. They emphasize safe, walkable streets, decent housing and transportation, access to key services, and community-engagement opportunities for all ages. See http://www.aarp.org/livable-communities/network-age-friendly-communities/info-2014/an-introduction.html and http://states.aarp.org/newport-to-become-an-age-friendly-community/#sthash.gZ4BidUy.dpuf.
7 Listen to “Makers: The Movement that Captures the Imagination” at the Conference on World Affairs archive, http://www.colorado.edu/cwa/archives/2015/.
8 Instead of having to first try self-directed services, then job counseling before being eligible for training, the unemployed may be able to go straight to training. See http://policybook.aarp.org/the-policy-book/chapter-5/sub027-1.2034567.
9 Teresa Ghilarducci, “The New Work Reality,” Future of Work @50+ (March 2015), http://www.aarp.org/content/dam/aarp/ppi/2015-03/the-new-work-reality-ghilarducci-aarp.pdf.
“Work is good, and many Americans like it. Anyone who loves to work should be able to.”
New England
United States
Orleans County
Vermont
New England
United States
Orleans County
Vermont
Total population
Under 18 18–64
65 and older
Pe
rce
nt
Percent of Population Living Below the Poverty Level
0
5
10
15
20
25
30
35
16–19
20–24
25–44 45–54
55–64
65–74
75 and older
Age Distribution of Population 16 Years and Older
Pe
rce
nt
0
5
10
15
20
25
30
Unemployment Rate by Age Group
16 and under
16–19
20–24
25–44
45–54
55–64 65–74
75 and older
Percent of Population with Some Disability
Pe
rce
nt
Totalpopulation
under 5 years 5–17 years 18–64 years 65 years and over
Pe
rce
nt
Age groupAge group
Age groupAge group
40
35
30
25
20
15
10
5
0
25
20
15
10
5
0
This Communities & Banking article is copyrighted by the Federal Reserve Bank of Boston.
The views expressed are not necessarily those of the Bank or the Federal Reserve System.
Copies of articles may be downloaded without cost at www.bostonfed.org/commdev/c&b.

16 fall 2015
Small businesses that need capital may have an equally great need for assistance in building their capacity.
The 2014 “Joint Small Business Credit Survey Report,” by the Federal Reserve banks of New York, Atlanta, Cleveland, and Phila-delphia, shows that the top challenge for small businesses operating fewer than five years continues to be lack of credit availability. Even as businesses have matured, credit availability has seen only modest growth after years of decline. Small businesses spent, on average, 24 hours in researching and applying for credit, but 45 percent were denied because of low personal credit scores.
Interestingly, although a large percentage of prospective bor-rowers are not getting credit, lenders contend that they love making loans. According to 25,000 reviews by users of the job site Career-Bliss, one of the “10 Happiest Jobs in America for 2015,” is the job of loan officer. The reason: “Loan officers often have the pleasure of helping people realize their dreams.”
So, why the disparity between the pleasure of making loans and the denial of loan applications?
Tackling the DisparityThe disparity lies, of course, in lenders’ need for assurance that they will be paid back according to underwriting standards. So until a struggling business can do well enough to look promising to a tradi-tional lender, it needs an alternative source of capital.
In Massachusetts, the lack of small business access to capi-tal resulted in the state’s decision to create Massachusetts Growth
Capital Corporation (MGCC) in 2010. MGCC’s mission is to pro-vide capital to minority and women-owned businesses, businesses located in smaller postindustrial cities (Massachusetts focuses on a list it calls Gateway Cities), as well as businesses that traditional lenders have turned away.
During the economic downturn, when credit was scarce for small businesses, MGCC became a critical financing resource, tak-ing measured risk to finance certain businesses that might otherwise have had to lay off employees or close down. Through its revolv-ing loan fund, MGCC has, as of this writing, made $74 million in loans to 224 small businesses that were unable to access financing elsewhere. Those loans affected more than 7,530 jobs, either by pre-serving employment or creating new jobs.
As MGCC does not rely on collateral to repay its loans, it takes time to assess the ability of borrowers to generate sufficient cash flow to satisfy the obligation. The analysis includes due diligence on the company’s historical and projected financials and an evaluation of the character of borrowers, including how they have handled diffi-cult situations in the past.
MGCC also has administered the state’s $2 million Small Busi-ness Technical Assistance Grant Program, which distributes grants of up to $100,000 on a competitive basis to community develop-ment corporations (CDCs) for innovative small business programs. In fiscal year 2015, 81 percent of the 1,806 small business clients that the CDCs served fit into at least one underserved category for technical assistance and loans.
MGCC’s role is to demystify the credit process, helping com-panies ascertain whether there really is a need for capital or whether other issues are impeding success. It’s all about getting to the root cause of why the business has not been sustainable and creating tools so that it can build strength.
Many of the MGCC companies survive despite working in very difficult situations and industries. Once they are able to build capacity to improve how they align their offerings with customer demand, they repay their loans. Often they are able to refinance afterward with traditional lending institutions.
According to Gail Scott, principal of Down Home Cooking and Catering in Dorchester, “Not only did MGCC provide business assistance by providing a much needed accounting assessment, but it then put us in a position [to receive] funding for working capital and growth.”
And David Slutz, CEO of engineering company Precix, says that MGCC was “a key enabler to our survival and to our thriving
Lawrence Andrews and Carmen Panacopoulos
Bridging Disparities in Small Business Access to Capital
Gary Webster and Gale Scott of Down Home Cooking and Catering.
ph
oto
To
dd
Mak
i, P
ho
to O
p P
ho
tog
rap
hy

17Communities & Banking
today, with headcount of over 400 now. Calm, cool, and collected, they took the time to understand our business, where we were on the demand cycle, and what the future looked like. They got it right, and instead of New Bedford having another empty building, they have an $18 million payroll in the city.”
Four Critical ElementsTo do this kind of lending successfully, four elements are critical: a good process, strong products, the ability to recognize passion in the prospective borrower, and strong collaborative partners and advisers.
ProcessWith a site visit to a client’s business, a review of the small business’s financials, and an interview with the business owner, MGCC is often able to establish quickly whether the prospective borrower has a capital issue or a capacity issue. If it is a capacity issue, technical assistance becomes a prerequisite to any funding. MGCC provides technical assistance of up to $5,000 (for needs related to account-ing, financial controls, production scheduling, costing, payroll, IT support, marketing, and the like). The small business contributes half of the consultant’s fee.
One thing that sets MGCC apart from traditional lenders is that it can require improvements in business skills and more-active reporting of the business’s financial progress. Insisting on solid busi-ness practices can only help the company and is likely to provide a road to traditional capital.
ProductsIn choosing to deploy lines of credit and term loans, traditional lenders are obliged to rely on the borrower’s historical results. Tra-ditional loans and even Small Business Administration (SBA) loans take personal credit scores into account, and that can be a barrier in lower-income communities especially.
In contrast, MGCC requires no minimum credit score but instead looks at the borrower’s projected working capital and pro-jected profitability, analyzes current personal-debt obligations, provides technical assistance to remedy credit issues, and generally tries to get to yes on the business loan.
PassionPassion is vital for small business success in lower-income commu-nities. Business owners who are well known within their community and have everything at risk are usually determined to make things work. After all, they may be employing family members, friends, and neighbors who count on them.
Passion is not something revealed by financial statements but in more subtle ways—for example, in an owner’s reputation in the community. Passion really can be a measure of future success in business and, if correctly identified, can mitigate some of the financial risk for the lender. Giving tools for success to a passionate entrepreneur can ensure the strength of the company and can help borrowers get beyond a bad credit history. MGCC staff often say when discussing a client, “Do they get it? Do they understand their business and their need for capital?” Small businesses that MGCC serves show that they have earned the capital assistance.
Making this kind of loan is more of an art than a science. Although one would expect that a portfolio of such loans would be quite risky, MGCC’s loss ratio has historically been under 5 percent, and delinquencies have averaged only 2 percent—a tribute to good underwriting and the business owners’ passion.
PartnersPartners are vital every step of the way. To help meet the needs of small businesses, an agency like MGCC relies on many players: other government agencies, local CDCs, microfinanciers, small business development centers, the SBA, municipal economic devel-opment departments, “Main Street” businesses, banks and credit unions, trade organizations, chambers of commerce, trade unions, and the like.
MGCC’s networks are critical for clients because succeeding as a small business is getting more complex every day. Businesses must not only keep up with relevant technology and adapt quickly to industry changes, but in many cases, they must deal with the gen-trification of their communities and the associated higher rents and customer expectations.
Lenders, too, must adapt to new technologies, new online competitors, and new constituencies needing loans. Immigrant entrepreneurs, for example, make up the fastest-growing segment of business owners in Massachusetts cities, and that presents lend-ers with unique demands for training and service. Meanwhile, the need for lenders like MGCC to help strengthen minority, female, and veteran businesses is growing as more corporations encourage veterans, women, and minorities to apply for corporate contracts.
In short, giving small businesses access to capital that they might not otherwise have received may make lending one of the happiest jobs. But lending the capital must go hand in hand with building the capacity of a business. The ultimate goal is equal access to loans. Providing a business with knowledge about the prudent application of capital can help it not only survive but thrive.
Lawrence Andrews is president and CEO of Massachusetts Growth Capital Corporation. Carmen Panacopoulos is a Federal Reserve Bank of Boston senior relationship manager working with community banks in New England. Contact them at [email protected] and [email protected].
Michael Gonsalves Jr., O-ring press operator, left, and David Slutz, Precix president and CEO.
ph
oto
To
dd
Mak
i, P
ho
to O
p P
ho
tog
rap
hy
This Communities & Banking article is copyrighted by the Federal Reserve Bank of Boston.
The views expressed are not necessarily those of the Bank or the Federal Reserve System.
Copies of articles may be downloaded without cost at www.bostonfed.org/commdev/c&b.

18 fall 2015
Savings on Prepaid Cards An Opportunity for Both Consumers and Industry
Brian Clarke, FEDERAL RESERVE BANK OF BOSTON
ph
oto
Le
tty1
7/iS
tock

19Communities & Banking
Lower-Income ConsumersGPR prepaid cards are popular with many low- and moderate-income consumers. A 2013 Federal Reserve Bank of Boston study found—after controlling for demographic factors—that 49 percent of people with household income less than $25,000 owned a GPR prepaid card, compared with just 18 percent of people with house-hold income between $75,000 and $99,000.3
Although savings rates are generally low across the income spec-trum, the concern is greater for lower-income populations given that a financial shock (for example, having the car break down) could have significant negative effects on financial stability. A tool for emergency savings could be especially important for such consum-ers and help them avoid having relatively small problems escalate from an urgent cash outlay to intractable, long-term debt.
GPR card companies that offer savings pockets have indicated that they are seeing consumers utilize the features to set money aside, but for extremely short periods of time—weeks, not months. So the industry knows that consumers are not going to be suddenly saving large sums simply because a savings pocket has been added to a card. However, saving even a small amount of money, and thereby changing savings behavior, can begin a process toward financial sta-bility with the potential for long-lasting positive effects.
The GPR prepaid card market has matured to the point that approximately $65 billion was loaded onto cards in 2012, repre-senting more than double the load amount in 2009.4 But although
Saving for an emergency is something that we are constantly told to do, but it’s hard to save if you don’t have a bank account—or enough money to meet minimum deposit requirements.
New opportunities are coming, however. We are entering an era of rapid technological advancement in the financial-services indus-try. You no longer need your provider to be located near you or have a physical presence at all. Consumers are being offered more choice, and competition among market participants is driving down costs.1
Financial-services companies are increasingly competing for customers in traditionally underserved markets and counting on new products to meet consumer needs. General-purpose reload-able (GPR) prepaid cards are one such product. As prepaid cards become more popular, it will be important for the industry to offer additional features that benefit the consumer. A feature that permits saving, for example, could help low- and moderate-income consum-ers begin asset building or create a fund for emergencies. There is some evidence that by lowering the barriers to entry and utilizing mobile technology to make it easier to transfer money from a spend-ing account to a reserve account, consumers will begin the savings process and learn positive saving habits.2
Consumers seem to be using GPR prepaid cards to conduct everyday transactions in a way that is similar to use of debit cards. But there are differences. In the words of the Consumer Financial Protection Bureau (CFPB), “A bank account debit card is linked to your checking account; a prepaid debit card is not. Instead, you pay in advance to load funds onto a prepaid card, and then use the money you have loaded onto the card. In most cases, you can’t spend more money than you have already loaded onto your prepaid debit card, but with bank account debit cards, if you opt into your bank’s overdraft service, the bank may cover the cost of a purchase that exceeds what you have in your account, and charge you a fee (as well as requiring you to repay the overdraft).”
To acquire a fully functional GPR prepaid card, the consumer must go through an identification process that is similar to open-ing a checking account at a financial institution. Since most GPR prepaid cards do not offer overdraft protection, however, the GPR prepaid card provider will not need to check to see if the customer has a history of mishandling a checking account.
As the GPR prepaid market matures, there is an opportunity for the industry to experiment with product design and engage in research that will determine if the card is a financial tool that at least does no harm and, with enhanced features, is truly beneficial to consumers.
What if prepaid cards had a savings feature? An emerging
partnership is looking into ways to help lower-income
people save for a rainy day. Partners include:
• The Federal Reserve Bank of Boston
• Doorways to Dreams
• The Center for Financial Services Innovation
• Private-sector entities that focus on consumer finance
New tools are emerging to help consumers access affordable financial services and save for emergencies.

20 fall 2015
“The results of our design and pilot of the Rainy Day Reserve showed broad usage (16.5 percent adoption rate) and substantial savings (over $14 million saved from October of 2011 to the pres-ent),” said Timothy Flacke, executive director of D2D. “We believe that when financially vulnerable consumers are offered a product that meets their needs—easy to access, simple to use, framed for a specific use like emergency savings—they will save more. For those without traditional savings accounts, having the opportunity and ability to securely set aside funds allows them to better manage unexpected expenses.”
The Boston Fed, D2D, and the CFSI are thinking about GPR prepaid card–linked savings as an important feature to begin the process of emergency savings. The next horizon is determining if technological improvements can lead to improved financial habits overall and better money management. Being able to reach people via their phones when they are making financial decisions is one promising avenue for encouraging them to set aside small amounts of money. Since most GPR prepaid cards have a mobile presence via a mobile phone app or mobile website, a text message or other notification could help users decide against making an unbudgeted purchase or remind them to put money aside at the point of sale if they have underspent an item’s predetermined budget.
Multiple channels, mostly digital, will be crucial to delivering high-quality financial services and leveling the playing field so that low- and moderate-income consumers have access to the financial information needed to make well-informed decisions. Technology can be a great equalizer in that it allows for access to financial ser-vices that are not dependent on a traditional physical presence.
As for the industry, lower-income people are an important group of consumers that could be drawn to traditional banking by way of GPR prepaid cards and perhaps become the source of future business. The industry has already taken steps to make the fee structure more transparent. Moving forward, it should con-tinue to seek innovative approaches to engage consumers on asset building and to bring a full suite of financial-product options to all cardholders.
Brian Clarke is a Federal Reserve Bank of Boston senior relationship manager working with New England’s community banks and other financial-services providers to engage traditionally underserved popula-tions. Contact him at [email protected].
Endnotes1 “Consumers Continuing to Load Up on Prepaid Cards” (report, The Pew
Charitable Trusts, 2014), http://www.pewtrusts.org/~/media/legacy/uploadedfiles/pcs_assets/2014/PrepaidCardsStillLoadedReportpdf.pdf.
2 Sarika Abbi, Shaheen Hasan, and Elizabeth Straghalis,“Paving the Way Forward: Savings on Prepaid Cards” (report, D2D Fund, Boston, 2013).
3 Marcin Hitczenko and Mingzhu Tai, “Measuring Unfamiliar Economic Concepts: The Case of Prepaid Card Adoption” (working paper no. 14-9, Federal Reserve Bank of Boston, 2014), http://www.bostonfed.org/economic/wp/wp2014/wp1409.pdf.
4 “Why Americans Use Prepaid Cards” (report, The Pew Charitable Trusts, 2014), http://www.pewtrusts.org/~/media/legacy/uploadedfiles/pcs_assets/2014/PrepaidCardsSurveyReportpdf.pdf.
increasing numbers of companies are offering savings options on GPR cards—and in some cases, pairing those options with text reminders about saving and similar features to promote use—there is not a lot known yet about customer usage or the effects of different features on behavior. One goal for new research would be to determine which interventions and innovations in the pre-paid-card market are effective in generating net new savings among consumers.
An emerging partnership among the Federal Reserve Bank of Boston, the nonprofit Doorways to Dreams (D2D), the Center for Financial Services Innovation (CFSI), and several private-sector entities that focus on consumer finance looks promising for produc-ing the necessary research. And the time is right for collaboration. All stakeholders want to see financially stable, economically viable households that are not only able to transact affordably and safely but are given the opportunity to set aside money for emergencies and aspirational goals should they choose to do so.
Savings PilotIn one study, D2D partnered with Banking Up, a financial-services technology company, to pilot a “Rainy Day Reserve” on Banking Up’s Upside Visa prepaid card. What they found was that there was demand from consumers for a savings product tied to GPR prepaid cards.
The next horizon is determining if technological improvements can lead to improved financial habits overall and better money management.
ph
oto
tri
loks
/iSt
ock
Increasingly, technology is connecting the unbanked to financial services.
This Communities & Banking article is copyrighted by the Federal Reserve Bank of Boston.
The views expressed are not necessarily those of the Bank or the Federal Reserve System.
Copies of articles may be downloaded without cost at www.bostonfed.org/commdev/c&b.

21Communities & Banking
How Immigrants Subsidize Care for SeniorsLeah Zallman, Adriana Bearse, Lisa Arsenault, and Blessing DubeINSTITUTE FOR COMMUNITY HEALTH
Between 1996 and 2011, immigrants contributed $182.4 billion more to Medicare’s Hospital Insurance Trust Fund than the Fund expended on their health-care benefits.
A recent study published by the Partnership for a New American Economy, “Staying Covered: How Immigrants Have Prolonged the Solvency of One of Medicare’s Key Trust Funds and Subsidized Care for US Seniors,” looks at Medicare’s Hospital Insurance Trust Fund and the role that tax revenues from immigrant paychecks have played in keeping Medicare going.1
The research was spurred by the observation that although Americans are aware of some of the roles immigrants play in the US health-care system, there was a less visible benefit that might inform the public debate. People know that immigrants work as doctors, home health aides, radiology technicians, and pharma-cists; that they staff nursing homes and retirement communities, and contribute to advances in pharmaceuticals, biotechnology, and public-health programs. But there has been less awareness of the importance of immigrants’ tax payments in shoring up Medicare.
Keeping Medicare SolventMedicare is a publicly funded health-insurance program that pro-vides health care to 50 million American seniors and disabled individuals. In recent years, many policymakers have voiced con-cerns about the long-term sustainability of the Medicare program.
With baby boomers retiring at the rate of 10,000 people per day, there will soon be fewer working-age Americans to cover the retired cohort’s care.2 Consider that in the 1980s, there were roughly 240 seniors for every 1,000 working-age individuals in the country. But by 2030, the 240 figure is expected to rise to an estimated 411 seniors for every 1,000 working-age adults.3 The Medicare trustees have written that the imbalance will present a major financial strain on the system. They project that Medicare’s Hospital Insurance Trust Fund, a pool of funds covering services such as hospital-izations and home health care, will become insolvent by 2030 if current trends continue.4
Considering immigrants’ demographic makeup, it makes sense that they would play a valuable role in boosting the finances of the Medicare program. Immigrants tend to be younger than the US population as a whole and are therefore more likely to be of working age.5 Many come to the United States for the purpose of working, and their high labor-force participation rate makes them valuable contributors to the economy as taxpayers.6
The Partnership for a New American Economy study probes data from the Current Population Survey and the Medical Expendi-ture Panel Survey (MEPS) to examine the impact immigrants have on the Hospital Insurance Trust Fund. The fund is the only part of Medicare that functions like a true trust fund, with the financing coming principally from payroll taxes.
The study finds that, between 1996 and 2011, immigrants contributed $182.4 billion more to Medicare’s Hospital Insurance Trust Fund than the Fund expended on their health-care benefits. (See “Net Medicare Hospital Insurance Trust Fund Surplus or Defi-
ph
oto
Su
san
Ch
ian
g/i
Sto
ck

22 fall 2015
cit, 1996 to 2011.”) In fact, in the average year during that period, immigrants contributed $11.4 billion more to the Fund than was paid out of the Fund for their medical care. During the same period, the US-born population generated a net deficit in the Fund of $68.7 billion.
Immigrants also played a critical role during the Great Reces-sion. From 2008 to 2011, when massive job losses nationwide crimped payroll tax revenues, Medicare’s Hospital Insurance Trust Fund operated at an annual deficit, in each year failing to bring in enough contributions to cover costs. During the same time period, however, annual contributions to the Fund from immigrants always exceeded the Fund’s annual expenditures on immigrant care. For example, during the worst of the recession in 2008, immigrants paid in $16.3 billion more to the Fund (via payroll taxes) than was paid out of the Fund on their behalf.
Note: Data for noncitizen immigrants for 1996 to 1999 are not shown because citizenship status is unavailable in the MEPS data set. Source: Authors’ analysis of data from 1997 to 2012 Current Population Surveys and 1996 to 2011 Medical Expenditure Panel Surveys.
If Past Is PrologueAccording to the study, if immigrants had not participated in the Medicare program from 1996 to 2011, Medicare’s core trust fund would be expected to become insolvent by the end of 2027, roughly three years earlier than currently predicted by the Medicare trustees themselves.
The findings counter common misperceptions about the role of immigrants in US entitlement programs. Critics of immigration have argued that immigrants are a net drain on America’s health
resources—a particular concern as baby boomers retire and become dependent upon the publicly funded Medicare program. The new report, however, shows that instead of being a drain on the Medi-care program, immigrants are arguably a key reason why Medicare’s Hospital Insurance Trust Fund will remain solvent through the next decade. The positive impact of immigrants on the program may be even more dramatic than described here, as the researchers’ calcula-tions cover only the period from 1996 to 2011, whereas immigrants likely also generated surpluses within the Medicare trust fund prior to 1996 and since 2011. Although their analysis is limited to the impact on the Hospital Insurance Trust Fund, it is important to mention that immigrants seek medical care through other publicly subsidized programs, such as Medicare’s other trust fund, the Supple-mental Medical Insurance Trust Fund as well as uncompensated care and Medicaid. However, immigrants also contribute substantially to federal, state, and local taxes that help support these programs.
The report suggests that any discussion of immigration reform should take into account the significant role that immigrants play in strengthening at least one US entitlement program. The research makes clear that policies that reduce the number of young, work-ing-age immigrants arriving in the United States will weaken the financial health of Medicare’s Hospital Insurance Trust Fund. Con-versely, policies that increase the number of immigrants arriving in the coming years will likely add to the balance of the Fund. Many of the comprehensive immigration-reform options currently being discussed on Capitol Hill would increase the number of immigrants moving to America in the coming years. That would increase the number of working-age people overall, and by extension, the tax revenues that the Hospital Insurance Trust Fund can ultimately tap.7
Leah Zallman is a junior scientist, Adriana Bearse is a research asso-ciate, Lisa Arsenault is a senior epidemiologist, and Blessing Dube is a data analyst II at the Institute for Community Health in Cambridge, Massachusetts. Contact them at [email protected].
Endnotes1 Leah Zallman, “Staying Covered: How Immigrants Have Prolonged the Solvency
of One of Medicare’s Key Trust Funds and Subsidized Care for US Seniors” (report, Partnership for a New American Economy, August 2014), http://www.renewoureconomy.org/research/staying-covered-immigrants-prolonged-solvency-one-medicares-key-trust-funds-subsidized-care-u-s-seniors/.
2 See http://www.pewresearch.org/daily-number/baby-boomers-retire/. 3 Dowell Myers, “Immigrants’ Contributions in an Aging America,” Communities
& Banking 19, no. 3 (summer 2008), https://www.bostonfed.org/commdev/c&b/2008/summer/myers_immigrants_and_boomers.pdf.
4 See http://www.cms.gov/Research-Statistics-Data-and-Systems/Statistics- Trends-and-Reports/ReportsTrustFunds/downloads/tr2014.pdf.
5 Audrey Singer, “Immigrant Workers, Human Capital Investment and the Shape of Immigration Reform” (report, Brookings Institution, Washington, DC, February 27, 2013).
6 “Foreign-Born Workers: Labor Force Characteristics 2014” (report, US Department of Labor Bureau of Labor Statistics, Washington, DC, 2013), http://www.bls.gov/news.release/pdf/forbrn.pdf.
7 Determining the exact effect of passing comprehensive immigration reform on Medicare’s finances is beyond the scope of this report. Although an increased number of immigrants would boost Medicare’s finances, it is also possible a large number of beneficiaries could become eligible to collect Medicare, potentially counteracting at least some of that effect.
All immigrants
Net Medicare Hospital Insurance Trust Fund Surplus or Deficit,1996 to 2011
-50
-40
-30
-20
-10
0
10
20
30
40
1996 1998 2000 2002 2004 2006 2008 2010
Bill
ion
s o
f D
olla
rs
Noncitizenimmigrants
US-bornpersons
This Communities & Banking article is copyrighted by the Federal Reserve Bank of Boston.
The views expressed are not necessarily those of the Bank or the Federal Reserve System.
Copies of articles may be downloaded without cost at www.bostonfed.org/commdev/c&b.

23Communities & Banking
A nonprofit committed to building power and leadership in black and brown communities is pioneering a multifaceted approach. .
Since 2001, the Union of Minority Neighborhoods (UMN) has worked to develop leaders and build power in black and brown communities across Massachusetts.
The organization was started by Horace Small, a lifetime activist and veteran of Philadelphia city politics, the 1970s antiwar move-ment, and the South African antiapartheid movement. Among the issues his Boston-based nonprofit has tackled are efforts to change laws that keep ex-offenders from a reasonable chance at employment and an initiative to plumb the lingering pain of 1970s court-ordered school busing. In addition, UMN fosters leadership-development programs and initiatives aimed at building opportunity for people at the bottom of the ladder and creating real democracy.
Public School EngagementFour years ago, UMN’s Black People 4 Better Public Schools was organizing to increase black parents’ involvement in their children’s education in the Boston Public Schools.
Given that black students, particularly boys, were being diag-nosed as “special needs” at much higher rates than their white counterparts and being funneled out of mainstream classrooms, sus-pended, and disciplined more often than whites, UMN saw a need to help parents build their influence in the school system.
In speaking with many parents, UMN surfaced a consistent theme. One of the biggest impediments to parental involvement—and a prominent cause of their lack of faith in the school system—was their experience during the school desegregation crisis of the 1970s. Across all racial groups, layers of trauma festered, unaddressed and unacknowledged by the City of Boston itself.
Giving a Voice to Communities of Color
Steve McDonagh, UNION OF MINORITY NEIGHBORHOODS
Realizing that organizing for parental involvement in schools would be fruitless until the root causes were fully addressed, UMN shifted focus and launched the Boston Busing/Desegregation Proj-ect (BBDP). For four years, BBDP collected desegregation stories from members of every community in Boston in an effort to craft a new narrative of school desegregation (frequently called “busing” or “forced busing”) and the challenges to race and class equity, demo-cratic access, and excellence in public institutions that black and brown communities still face.
Though the Project’s methods initially were based around story collection, in the last year, the focus shifted to analyzing and synthesizing what was collected. In September 2014, as a way to commemorate the 40th anniversary of the first day of school under the desegregation order, BBDP released Unfinished Business: 7 Ques-tions, 7 Lessons. That accounting distilled hundreds of personal stories and interviews into seven fundamental questions that were heard over and over again from residents who rode the buses in the 1970s, as well as from younger people whose stories around race and class came from their own educational experiences. Among the questions were, “Was it about racism or about class?” “Whose story counts?” and “Why don’t people just get over it?” They were for-mulated with the goal of creating greater understanding of the ways that race and class overlap, the way not everyone’s story gets to con-tribute to public memory and policy, and how trauma can linger for generations.
ph
oto
Sky
ne
she
r/iS
tock
VIEWPOINT

24 fall 2015
Recently, BBDP has been taking these questions back to com-munity members and grassroots organizations in an effort to create a public-learning campaign that involves neighborhood workshops, the development and distribution of educational materials, and the creation of partnerships with other grassroots organizations to increase “race and class literacy.” Essentially, the nonprofit is engaged in a process to help people understand the ways race and class inform their everyday lives—and to investigate questions of governance on local, state, and national levels. The other purpose of the campaign is to enable those who become “race and class lit-erate” to go back to their own neighborhoods and share their new lens with others. BBDP hopes to develop a core of people of all races working throughout Boston who can address issues of race and class, push the conversation forward on a city level, and develop new solutions to decades-old problems.
One type of solution BBDP aims for was seen in early 2015, when BBDP director Donna Bivens and several longtime volun-teers worked with Boston Public Schools to change the history curriculum to include the desegregation crisis. Before when students learned about this momentous period in history, the illustrative example of violent school desegregation was the one that occurred in Little Rock, Arkansas. Going forward, local children will learn of what happened in their own backyard to their neighbors and family members. And they will learn about the context in which the expe-riences occurred (such as redlining and housing segregation) and the race and class issues that continue to shape the city they live in.
Confronting IssuesThe barriers between black communities and opportunity were also behind UMN’ s involvement in work to reform Criminal Offender Record Information (CORI). Aware of the data covered in books like Michelle Alexander’s The New Jim Crow: Mass Incarceration in the Age of Colorblindness—which shows that people of color are dis-proportionately represented in prison—UMN was concerned that men and women returning to neighborhoods from prison had few options for rebuilding their lives.
For ex-offenders, any job opportunity became a potential source of embarrassment, humiliation, and anxiety. Even wow-ing employers in an interview might just mean delaying rejection until after a background check. UMN took up the issue, first at the city level, getting Mayor Tom Menino to enact CORI reform within Boston, and then with the state, where more than 3,000 supporters came out to push the issue with the legislature. Eventu-ally, they succeeded, and in 2010, Governor Patrick signed into law measures regulating who can access a person’s criminal record and allowing past records to be sealed in certain cases. That represented a step forward in expanding opportunity for ex-offenders, with the potential to generate positive ripple effects—economic and other-wise—throughout the communities they live in. Though UMN has shifted its focus since then, it continues the work by hosting CORI Sealing days, when people can come and get more information and guidance on how to get their records sealed, and by referring others to services that can help them.
In the last few years, UMN’s focus has been on developing new leaders in Boston’s black and brown communities. In the spring and the fall, UMN’s Institute for Neighborhood Leadership runs a series of workshops for people of color centered around skill and knowl-edge building, with experts from across the Boston nonprofit and legislative sectors. Sessions on topics ranging from public speaking to fundraising aim to identify community members interested in leadership and cultivate their talents.
In addition, UMN is graduating the second cohort of its How-ard Rye Institute. Started in 2013, Howard Rye is an intensive nine-month leadership-development program for young people of African descent.1 Twice a month, the class gathers with an invited guest for deep discussions and debate around the issues they face. Guests have included American Civil Liberties Union attorneys and local education activists. The goal is to meld thought and action, and the most recent class has taken that to heart, having been instru-mental in Massachusetts Governor Charlie Baker’s recommitment to affirmative action. They also started a political action committee to get more state fuel assistance to those who need it, to advocate for a special prosecutor in cases of police misconduct, and to push other issues important to black communities.
* * *
UMN likes to tackle problems from many different sides. With CORI reform, the organization was aiming to remove a barrier to economic growth for working-class people and people of color. With the Boston Busing/Desegregation Project, they are working to develop a renewed historical understanding to tackle the inequities that the 1974 crisis revealed and that are still present. Through the Institute for Neighborhood Leadership and the Howard Rye Insti-tute, UMN takes an intensely local approach, focusing on building individual leadership skills and awareness so that people can make their workplaces and neighborhoods work for them. However dif-ferent, each method is aimed at creating powerful, self-sufficient communities of color that are able to create and implement their own solutions to problems. The multiple angles of the programs represent an acknowledgment that the issues black and brown com-munities face are complex and multilayered, and leaders who are willing to take a stand and even ruffle feathers must become active in neighborhoods, at City Hall, in the State House, and beyond.
The holistic approach involves a comprehensive awareness of history, economics, and race, and how all three impact people on an everyday basis. As a Frederick Douglass slogan posted in the UMN office states, “Power concedes nothing without a demand. It never has and it never will.”
Steve McDonagh is program coordinator at the Union of Minority Neighborhoods in Boston. Contact him at [email protected].
Endnote1 Howard Rye was a lifetime activist and fighter for the black and brown
communities of Philadelphia. He is a model for UMN Fellows when it comes to organizing effectively and living your values. See http://www.philadelphiacontroller.org/page.asp?id=299.
This Communities & Banking article is copyrighted by the Federal Reserve Bank of Boston.
The views expressed are not necessarily those of the Bank or the Federal Reserve System.
Copies of articles may be downloaded without cost at www.bostonfed.org/commdev/c&b.

25Communities & Banking
New kinds of community moments for connection and exchange are helping communities build diverse networks of aspirational people to repopulate the civic landscape.
At the local level, positive civic engagement cannot be untangled from productive economic engagement. Making communities functional and competitive—to tackle tough challenges, plan for an uncertain future, and cultivate quality of life—requires residents to develop the personal capacity and bandwidth needed to form mutually beneficial relationships with one another.
Unfortunately, in many communities today, there are few opportunities for people to connect across differences such as class and race. The civic landscape is failing to cultivate interconnect-edness and can be an indifferent, even hostile, environment for otherwise aspirational people who want to be involved in civic life.
Circles and MarketplacesSpaces for Transforming
Community LifeBill Traynor and Frankie Blackburn
TRUSTED SPACE PARTNERS
ph
oto
tim
sa/S
tock

26 fall 2015
Not as Apathetic as You ThinkThe hallmark of a successful community is sustained and collec-tive resilience. Things change, we change, but we can find a way to remake ourselves and to go on together. Communities are com-plex ecosystems, and the capacity for reinvention and resilience can happen only when thousands of people start interacting in new ways, taking risks, building new relationships, asking better ques-tions, contributing their time and resources, and ultimately, having enough fun and seeing enough progress to stay in the game.
Over a decade ago in Lawrence, Massachusetts, activists started an initiative called Lawrence CommunityWorks (LCW). They
began by spending countless hours knocking on doors, talking to residents, attending community meetings and City Hall hearings, and meeting with public- and private-sector leaders. In knocking on doors, they discovered scores of ambitious, friendly, aspirational—and, yes, struggling—families anxious to improve their lives and their community. In contrast, community and private-sector leaders were mostly pessimistic and engaged in boring, aimless bickering, unproductive practices, and complaints about residents’ “apathy.”
How do you build a community when current approaches erode trust, douse entrepreneurial energy, dismiss individuals’ gifts, and derail positive change? You cannot. People are, by and large, not apathetic. They are discerning. And thousands of Lawrence res-idents were discerning that the kinds of community engagement available then were not worth their time.
LCW realized that to have an impact, they had to create com-munity moments explicitly designed for people to bring their best selves and their aspirations to each other and into civic life—while having fun, connecting, exchanging, and driving change. If LCW
could shape and sustain enough community rooms that could do that, it could mobilize the energy, talent, and time commitments that the city needed.
Through community rooms such as NeighborCircles (in which neighbors host a series of dinners on their block), LCW’s network of almost 5,000 residents has driven change in the civic environ-ment, influencing zoning and budget reforms, garnering nearly $100 million in new development, and more. Although still facing challenges, Lawrence has a different spirit, thanks to diverse net-works of individuals doing thousands of things every week to move the city forward. An ever widening circle of resident facilitators
leading NeighborCircles has emerged, as have community-educa-tion circles that bring teachers, parents, and children together to build fruitful relationships.
More Community Rooms A growing number of organizations are pioneering positive com-munity moments—moments that level power dynamics, invite a wider range of people to behave differently in community life, and build networks. Among them are Impact Silver Spring in Maryland, Network Center for Community Change in Louisville, Kentucky, and Neighborhood Connections in Cleveland. Their community rooms are designed to optimize the creative capacity that people are always willing to contribute to the civic environment under the right conditions. The new rooms, called circles and marketplaces, help to do the following:
• steward productive networks that break barriers, cross boundar-ies, and unleash resources;
Community-building circles allow participants to discover commonalities.
ph
oto
Ste
ve D
e b
en
po
rt/i
Sto
ck

27Communities & Banking
• shape and share stories that connect, inspire, move, and mobi-lize people;
• stimulate entrepreneurial spirit, action, and self-organization;• establish new marketplaces that unleash hidden resources; and• model and cultivate better habits of engagement.
Circles Circles are conducted in small, intimate rooms. People learn about them through both word of mouth and concerted door-knocking and street-conversation campaigns. Putting aside the daily distrac-tions of screen time and virtual connections, participants embrace safe, productive face time with others—who often turn out to have similar traits, interests, or aspirations.
Consider Silver Spring, Maryland, a community with stark disparities. It sits in one of the wealthiest counties on the East Coast, just outside Washington, DC, but it has significant pockets of poverty. In the early 2000s, a group called Impact Silver Spring, using small circles of mutual support, began to build networks to bridge diverse communities and support the aspirations of immi-grant residents and others who were in danger of being left behind. The gatherings were largely self-organized, having only a modicum of support from community organizers. (One of the larger circles continued meeting for two years every week without any signifi-cant intervention from Impact staff.) There was a clear intention to include middle- and upper-middle-class homeowners, to emphasize that the circles were not just about needs and to forge neighbor-to-neighbor connections across class and race.
The resulting mutual support circles and neighbors exchanges are examples of ways that diverse groups can come together to support each other, take action, and exchange advice, favors, and most anything participants need. When obstacles get in the way of participants’ ability to follow through on something they care about—getting their high school equivalency certificate, saving for a new home, going to community college, or even sticking with an exercise regimen—the circles help them stay in the game. Some-times a circle sparks ideas that beget other circles. For instance, two weeks after a tragic incident of youth violence in the newly developed downtown, a small group of youth, parents, police, and community partners came together in a circle to talk about creat-ing a commercial area that was safe, welcoming, and comfortable to all. That circle sparked three more diverse action circles to pursue concrete initiatives. The regular gatherings served as support and accountability mechanisms to ensure that ideas were implemented, without the need for complex leadership structures. Once ideas were implemented, circle members moved on.
Marketplaces Marketplaces are designed to be open gatherings that invite people to mix across differences, exchange ideas, advice, and needed items, and to take entrepreneurial action.
The authors were once asked to design a process for a founda-tion to connect with and support a distressed Boston community. We designed a weekly gathering of neighbors, foundation staff, and other stakeholders that we called the “Q Marketplace” (Q signi-fying quality of life). We wanted gatherings to be a space where people could leave professional and other identities behind, come together, and talk about what is happening now. The Q Marketplace occurred for 10 weeks and drew overall more than 400 residents and other stakeholders. Sessions were hosted by a revolving group of trained facilitators working in pairs, with careful attention to creat-ing a positive feeling and an energetic pace. The design ensured that four simple things happened each week—always the same way and always for precisely 90 minutes total:
• time to mix, connect, and eat good food together;• time to share what was new and good in people’s personal lives; • time to have conversations on specified topics (the group would
break into four to five tables to discuss subjects that people were willing to host that night, such as a walking club, a summer program for kids, job-search help, holiday ideas, and loss and trauma); and
• time to exchange (we made offers and requests for things like advice on applying for the Earned Income Tax Credit, rides to the grocery store, help moving a couch, support for a teen in crisis, finding a good insurance plan).
Outcomes from table conversations and the offers and requests were tracked, and successful matches between residents were announced and celebrated at subsequent marketplaces.
* * *
Today, some form of a monthly marketplace is taking place in schools, apartment communities, and neighborhoods in Birming-ham, Cleveland, Akron, Chicago, Lawrence, Norfolk, Washington, DC, and beyond.
These circles and marketplaces are consistently effective in bringing people together on a level playing field. They are designed to be easy to organize, inexpensive to maintain, and easily replicated in a wide range of settings. They can help shape a new local ecosys-tem to make the process of engaging in civic life more human and to energize all members of a community. The emphasis is always on fairness and building trust across differences.
But as easy as circles and marketplaces are to do and as organic as they feel when done well, they do not happen on their own. They need to be intentional and resourced in order to have an impact. Because they are designed to be simple and inexpensive, they can, as in the case of Lawrence and Silver Spring, develop new habits of community life. Communities that do this work are effectively cul-tivating and tilling new soil for genuine, inclusive, and robust civic engagement to take root.
Bill Traynor, former executive director of Lawrence CommunityWorks, and Frankie Blackburn, founder and former executive director of IM-PACT Silver Spring, are the principals of Trusted Space Partners, a national consulting and training intermediary working with grassroots efforts. Contact them at [email protected].
People are, by and large, not apathetic. They are discerning.
This Communities & Banking article is copyrighted by the Federal Reserve Bank of Boston.
The views expressed are not necessarily those of the Bank or the Federal Reserve System.
Copies of articles may be downloaded without cost at www.bostonfed.org/commdev/c&b.

PRST STDUS POSTAGE
PAIDREYNOLDS DEWALT
Communities & Banking
Regional & Community OutreachFederal Reserve Bank of Boston600 Atlantic AvenueBoston, MA 02210
Change Service Requested