Office - Downtown Boston
8
Office Boston, MA 21 Q2 Accelerating success.
-
Upload
khangminh22 -
Category
Documents
-
view
1 -
download
0
Transcript of Office - Downtown Boston

Office
Bost
on, M
A
21Q2
Accelerating success.

20Q2 21Q1 21Q2
Total Inventory (in Thousands of SF) 66,760 65,938 65,938
New Supply (in Thousands of SF) (45) (822) 0
Net Absorption (in Thousands of SF) (1,502) (1,297) (123)
Overall Vacancy 10.9% 15.6% 15.8%
Under Construction
(in Thousands of SF) 4,388 4,388 4,153
Overall Asking Lease Rates $65.26 $63.52 $63.25
YOY
FORECAST
YOYYOY
FORECAST
YOY
FORECASTFORECAST
Office
Bost
on21Q2
Market SummaryThe market appears to be at a turning point at midyear. With 4.1 million people fully vaccinated in the state, more workers are returning to offices. Physical occupancies remain low but are picking up with each passing week. Numerous employers are expecting their workforce back after Labor Day, suggesting that Boston will start to feel more like Boston again by the end of next quarter. Negative absorption continued, though at a much more muted level in Q2; sublease space growth is stabilizing, and recent commitments and LOIs suggest that it will start to turn in short order. Rents held quarter-over-quarter, while vacancies ended Q2 at 15.8%, a 4.9-percentage-point increase from one year ago.
The “Great Return” has begun. How it ultimately plays out remains an open question because of much uncertainty about permanent remote and flexible work and its effect on physical occupancy. Smooth sailing is unlikely, but we anticipate 2021 being a year of discovery and stabilization before a potential recovery in 2022.
Forecast/Vacancy & AbsorptionMarket Indicators
Historic Comparison
6.19%Unemployment Rate
1.514%U.S. 10 Year Treasury Note
13.82%GDP - Quarterly % change yr/yr
Source: Oxford Economics
Vacancy Rate
15.8%Net Absorption
-123K SF
Overall Class A Asking Lease Rates (FSG)
$69.26/SF
Under Construction
4.2M SF
Key Takeaways• Employees are returning to the city, improving the outlook.
• Vacancy increases have subsided dramatically from recent quarters.
• Sublease space growth stabilized, and commitments suggest that this market is about to turn.
• Average asking rents are holding steady at Q1 levels.
Absorption New Supply Total Vacancy
Supply, Demand & VacancyFundamentals continued to soften in Q2, though not to the extent of recent quarters. Negative net absorption of 123,000 square feet was driven by the Class A market (Class B posted positive absorption). Overall vacancies are 15.8%, a 0.2-percentage-point increase from Q1 and 4.9
7%
8%
9%
10%
11%
12%
13%
14%
15%
16%
17%
(2,000,000)
(1,500,000)
(1,000,000)
(500,000)
-
500,000
1,000,000
Q1 Q2 Q3 Q4 Q1 Q2 Q3 Q4 Q1 Q2 Q3 Q4 Q1 Q2
2018 2019 2020 2021
Absorption New Supply Total Vacancy

One Kenmore Squaresource: Related Beal
percentage points from one year ago. But the mood in the city has changed as tenant activity has picked up. Whoop signed a full building deal (121,000 SF) in Fenway, while numerous subleases came off the market, either taken back by occupiers or leased by other firms. Tenants are out touring, and build-to-suit development will come on line later this year, bolstering absorption. Charlestown has the highest vacancies in the market, at 27.6%, as sublease space is in line with direct vacancy there. Fenway/Kenmore boasts the lowest vacancy, at 3.1%.
Boston’s strong appeal for venture capital and NIH funding and a historic IPO pace bode well for demand. Healthcare and health tech tenants are currently active, as are cybersecurity and other technology-centered platforms. Life science remains a growth industry, but not all life science firms need lab space, and relocating from Cambridge to Boston can save $30 per square foot or more. Speaking of life science, development continues to shift in that direction, with lab space conversion projects ultimately reducing competitive office stock in the market. Tower development/repositioning at Winthrop Center, South Station, Hub on Causeway, One Congress, and One Post Office Square will add new product to the market in the quarters ahead. These projects bear watching, as only one is more than 50% preleased, while two are fully spec. Leasing announcements may occur in short order but are likely to leave backfill vacancy in their wake.
Looking AheadSeptember will mark an important milestone for the city of Boston when college students return en masse, adding vibrancy and activity throughout the city. Public transportation use will increase — it is still well below pre-pandemic levels, even though highway congestion has returned — and combined with a return to offices for tens of thousands of workers, a “new normal” will be easier to envision.
Deliveries will pick up over the next 24-36 months, putting added stress on fundamentals in Boston as the market recovers from the pandemic. Given this wave of development and the lack of preleasing in multiple buildings, vacancies are likely to remain elevated despite an anticipated demand rebound. Historically, new product wins out in Boston, and in an era when tenants are focused on health and wellness, environmental sustainability, and convenience, these new buildings are expected to attract attention. That may be from growing companies such as Amazon adding jobs in the area or from established companies relocating, and will go a long way toward determining how vacancy looks in the quarters ahead.
Rental RatesRents showed very little movement in Q2. Landlords have been able to hold on to asking rents, with very little movement on average rates, although certain buildings and spaces have reduced rents. Concessions are up, and tenants are negotiating extra months of free rent or tenant improvement allowances. But overall, rents haven’t responded to market conditions as they have historically: In essence, the market is defying gravity. Class A rents have decreased 2.5% over the past year, while Class B dropped 6%. Class A sublease rents, however, are 20.1% below direct asking rents, making some spaces quite attractive.
Class A High Rise Class A Mid Rise Class A Low Rise
$80-$115 $65-$80 $60-$65 $50-$65 /SFClass B
Combined 20Q2 21Q1 21Q2
Total Inventory (in Thousands of SF) 121,784 122,353 122,476
New Supply (in Thousands of SF) (5) (70) 123
Net Absorption (in Thousands of SF) (19) 49 (581)
Cambridge 20Q2 21Q1 21Q2
Overall Vacancy 6.1% 10.2% 9.9%
Under Construction
(in Thousands of SF) 845 420 420
Overall Asking Lease Rates
$81.38 $84.16 $85.57
Suburbs 20Q2 21Q1 21Q2
Overall Vacancy 16.4% 18.1% 18.8%
Under Construction
(in Thousands of SF) 1,483 1,493 1,344
Overall Asking Lease Rates $25.35 $25.39 $25.74
Office
Cam
brid
ge &
Sub
urbs
21Q2
Historic Comparison
Cambridge & Suburbs
Key Takeaways• Space is hard to find in Cambridge, where rents continue to
push higher.
• Tenants are more actively looking, and several large-scale deals took place in Q2.
• Conversions are popular. Lab, GMP manufacturing, flex, and warehouse are all replacing outdated office stock.
• Construction remains limited, but tenants are looking at new ground-up space.
YOY
YOY
FORECAST
FORECAST
YOYYOY
FORECAST
YOY
FORECASTFORECAST
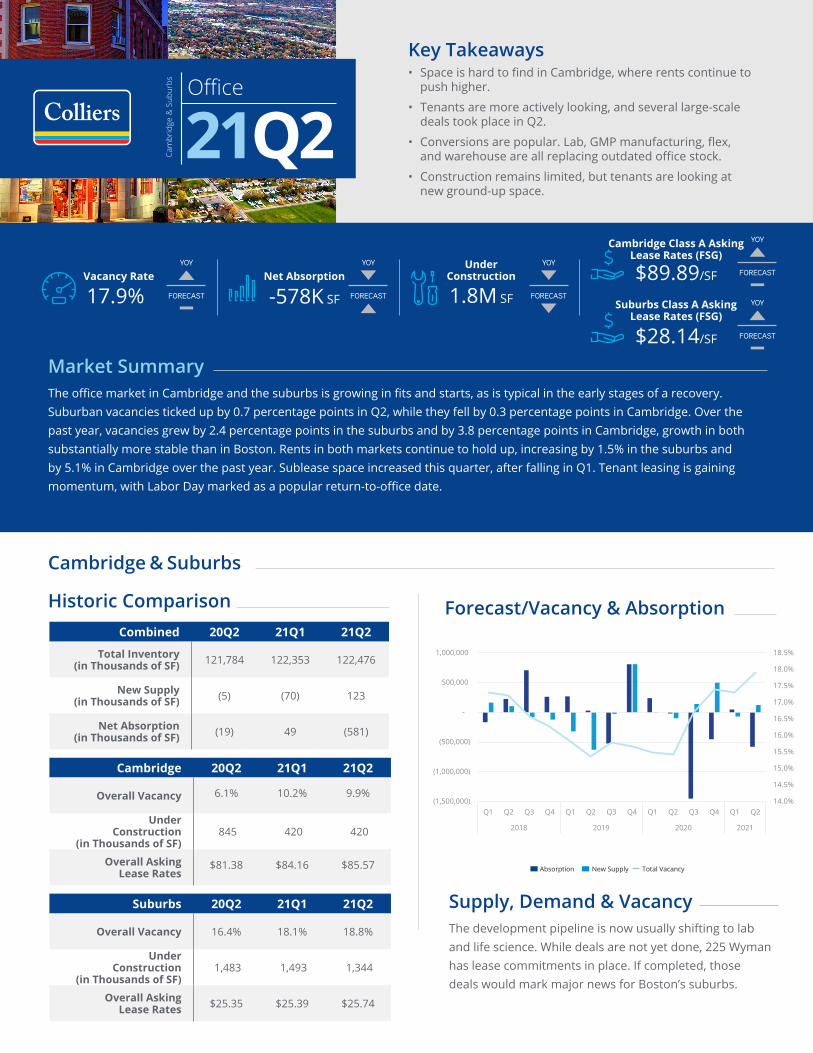
Market SummaryThe office market in Cambridge and the suburbs is growing in fits and starts, as is typical in the early stages of a recovery. Suburban vacancies ticked up by 0.7 percentage points in Q2, while they fell by 0.3 percentage points in Cambridge. Over the past year, vacancies grew by 2.4 percentage points in the suburbs and by 3.8 percentage points in Cambridge, growth in both substantially more stable than in Boston. Rents in both markets continue to hold up, increasing by 1.5% in the suburbs and by 5.1% in Cambridge over the past year. Sublease space increased this quarter, after falling in Q1. Tenant leasing is gaining momentum, with Labor Day marked as a popular return-to-office date.
Vacancy Rate
17.9%Net Absorption
-578K SF
Cambridge Class A Asking Lease Rates (FSG)
Suburbs Class A Asking Lease Rates (FSG)
$89.89/SF
$28.14/SF
Under Construction
1.8M SF
Supply, Demand & VacancyThe development pipeline is now usually shifting to lab and life science. While deals are not yet done, 225 Wyman has lease commitments in place. If completed, those deals would mark major news for Boston’s suburbs.
Forecast/Vacancy & Absorption
Absorption New Supply Total Vacancy
14.0%
14.5%
15.0%
15.5%
16.0%
16.5%
17.0%
17.5%
18.0%
18.5%
(1,500,000)
(1,000,000)
(500,000)
-
500,000
1,000,000
Q1 Q2 Q3 Q4 Q1 Q2 Q3 Q4 Q1 Q2 Q3 Q4 Q1 Q2
2018 2019 2020 2021
Absorption New Supply Total Vacancy

Olympus’s build-to-suit delivered early in the quarter, adding 150,000 SF of new space in Westborough. Puma’s new home at Assembly Square is nearing completion, while other properties are scattered throughout the market, and Cambridge is headlined by Google’s campus expansion. Conversions should take office space out of the competitive inventory, particularly in the suburbs.
Cambridge and the suburbs’ highly educated workforce creates diversified demand from numerous industries and business categories. Cambridge has been tech-centric on the office side, attracting companies such as Google, which will ultimately occupy over one million square feet in the market. The suburban markets have long been dominated by technology companies as well, which have evolved to software as a service (SaaS), 3-D printing, robotics, manufacturing, and life sciences, the current and future drivers of the market. Healthcare and medical and business services also continue to be important. The area’s strong venture capital investment flows bode well for future demand. Highlight deals in the second quarter include BJ’s Wholesale Club’s move to Marlborough (188,000 square feet), IBM relocating to Lowell (150,000 square feet), Butterfly Network moving to Burlington (61,000 square feet), and Smithsonian extending in Alewife (59,000 square feet).
Vacancies are the lowest in Harvard Square, at just 9.2%; along the 128 belt they’re in the teens, while in 495 submarkets they are generally over 20%. The Route 128 Mass Pike submarket leads the suburbs in absorption this year. Active tenants such as Pegasystems, Oracle, and Microsoft suggest that future demand is right around the corner.
Looking AheadGrowing demand drivers such as life science and cGMP manufacturing offer opportunities to reposition suburban office assets. We have also seen office product along the 495 belt scraped in order to build new industrial — whether warehouse/distribution or flex — and portions of floors (or entire floors) removed to provide taller clear heights. Numerous buildings in Waltham, Watertown, Lexington, and West Cambridge are earmarked for lab/life science conversion. These conversions are removing competitive office space and will continue to reduce vacancy, marginally in some cases and meaningfully in others.
Boston’s suburbs remain weighed down by large blocks of empty space, which props up the vacancy rate and somewhat skews the health of the market. Further, many unanswered questions remain about the future of office work: how many workers will return, at what frequency, and on what timeline. With many large occupiers in Boston’s suburban market, this situation bears watching. If more companies go the way of IBM in reducing their campus footprint, vacancies will remain elevated, particularly along 495. Even campuses closer in to the city are a challenge: it took years to fill Reebok’s former headquarters. The decisions of these major occupiers will affect the trajectory and pace of the impending recovery.
Rental RatesAsking rents are holding steady, increasing over the past year, and deal volume is just a fraction of that in a typical market. Tenants hold some pricing power today, though negotiating typically leads to higher tenant improvement allowances or free rent, rather than lower face rents. Tenants are beginning to return to the office and occupancy is improving, so it’s possible that this cycle will avoid the typical rent reductions of a recession/downturn. Since Boston rents are mostly holding as well, the rent discount in the suburbs remains substantial. And future infrastructure projects along the Mass Pike and the completion of the Green Line Extension may lead to more growth in the suburbs as a result.
IBM | Crosspoint in Lowell source: bizjournal.com

Office/Lab
Multifamily
321 Harrison/1000 Washington Street | Boston
BioMed Realty
$314,150,000 | $660/SF *Portfolio Sale
Princeton North Andover | 1252 Osgood Street | North Andover
Jones Lang LaSalle Income Property Trust
$72,500,000 | $377,604/Unit
1 Investors Way | Norwood
Alexandria Real Estate Equities
$105,000,000 | $444/SF
The Calvin at Coolidge Corner | 420 Harvard Street | Brookline
Hamid Shirkhan
$23,900,000 | $956,000/Unit
153 Second Ave | Waltham
Boston Properties
$100,000,000 | $1,111/SF
Pointe 1620 | 84 Obery Street | Plymouth
Schreiber Realty
$21,250,000 | $379,464/SF
10 Maguire Road | Lexington
Singerman Real Estate
$66,465,000 | $215/SF *4-building campus park
561 Windsor Street | Somerville
Leggat McCall Properties
$60,000,000 | $635/SF
21 Hickory Drive | Waltham
Phase 3 Real Estate Partners
$52,200,000 | $432/SF
Sales & HighlightsCa
pita
l Mar
kets
21Q2

Retail
Industrial
Industrial
550 Arsenal Street | Watertown Mall | Watertown
Alexandria Real Estate Equities
$130,000,000| $498/SF
351/353 Maple Street | Bellingham
EverWest Real Estate Investors
$93,350,000 | $218/SF *Two buildings next door
565 Squire Road | Showcase Cinemas | Revere
Amazon
$49,800,000 | $488/SF
155 N Beacon Street | Brighton
IQHQ
$50,000,000 | $398/SF
419 Maple Street | Bellingham
Stockbridge Capital Group
$49,524,415 | $97/SF
National Development Portfolio | Norwood, Middleboro, Chelsea
Realterm US
$169,158,000 | $173-450/SF *Includes assets across multiple markets
Key Capital Markets Takeaways• Life science remains the driving force of the investment sales
market, leaning strongly towards redevelopment/conversion/repositioning.
• Industrial is still a major focus, with plentiful capital chasing its strong cash flow and rising rents. Structurally higher e-commerce sales and the growth of cGMP manufacturing have grabbed investors’ attention.
• Multifamily investors are still clamoring for product, which is scarce, presenting opportunities for sellers as fundamentals improve and the return of college students is just around the corner.
• Capital is on the sidelines and lenders are active. Favorable interest rates and potential tax law changes could drive an increase in transaction volumes by year-end.

FOR MORE INFORMATIONAaron Jodka Director of Research | Boston & U.S. Capital Markets+1 617 330 [email protected]
Kelly Doonan Research Analyst+1 617 330 [email protected]
Dion SorrentinoResearch Analyst
Copyright © 2021 ColliersThe information contained herein has been obtained from sources deemed reliable. While every reasonable effort has been made to ensure its accuracy, we cannot guarantee it. No responsibility is assumed for any inaccuracies. Readers are encouraged to consult their professional advisors prior to acting on any of the material contained in this report.
The data in this report reflects recent organizational changes to our data series. This report represents the Class A and B office market. Lab properties have been removed and are available in their own series/publication. Historical comparisons will now reflect this reorganization.
Submarket/ClassTotal
Inventory SFDirect
AvailabilitySublease
AvailabilityAvailability
Rate
Availability Rate
Previous
Net Absorption
Current
Net Absorption
YTD
Under Construction
Deliveries YTD
Avg Direct Asking Rate
(FSG)
Boston
A 48,219,374 4,268,098 2,478,386 14.0% 13.5% (217,294) (660,938) 4,152,634 - $69.26
B 17,718,713 2,685,671 977,366 20.7% 21.2% 94,753 (758,162) - - $53.68
TOTAL 65,938,087 6,953,769 3,455,752 15.8% 15.6% (122,541) (1,419,100) 4,152,634 - $63.25
TOTAL 188,414,352 25,367,421 6,946,219 17.2% 16.7% (700,488) (1,949,229) 5,916,090 150,000
Cambridge
A 9,846,182 489,597 443,151 9.5% 10.4% 62,961 48,662 420,000 - $89.89
B 2,495,302 208,127 85,181 8.3% 7.9% -60,334 (73,460) - - $75.40
TOTAL 12,341,484 697,724 528,332 9.9% 10.2% 2,627 (24,798) 420,000 - $85.57
Boston
Back Bay 13,379,652 870,451 472,960 10.0% 11.2% 161,322 2,684 - - $67.53
Downtown 34,251,697 4,155,734 1,813,328 17.4% 16.7% (248,361) (677,883) 772,422 - $65.27
Allston / Brighton 758,521 33,952 47,056 10.7% 9.8% (6,862) (6,862) - - $55.00
Charlestown 2,067,701 262,126 307,866 27.6% 27.3% (6,107) (238,487) - - $46.69
Crosstown 504,000 44,473 10,997 11.0% 8.8% (10,997) (1,293) - - $40.42
Fenway / Kenmore 1,918,948 42,913 16,940 3.1% 5.1% 37,659 81,978 275,000 - $53.00
North Station 2,245,004 335,986 139,314 21.2% 22.6% 31,086 52,027 1,715,212 - $55.20
Seaport 9,556,423 989,012 611,565 16.7% 16.3% (39,402) (583,899) 730,000 - $62.07
South Station 1,256,141 219,122 35,726 20.3% 17.0% (40,879) (47,365) 660,000 - $53.21
TOTAL 65,938,087 6,953,769 3,455,752 15.8% 15.6% (122,541) (1,419,100) 4,152,634 - $63.25
Suburbs
Inner Suburbs 5,350,998 643,839 178,834 15.4% 16.6% 67,728 29,034 379,312 - $36.80
Route 128 North 6,902,551 1,099,556 61,151 16.8% 15.3% (106,716) 14,262 374,000 - $22.29
Route 128 Northwest 17,595,526 2,231,495 270,152 14.2% 14.2% (5,332) (177,680) - - $31.09
Route 128 Mass Pike 20,765,396 2,866,507 592,929 16.7% 16.4% (41,571) 131,085 253,810 - $38.26
Route 128 South 16,159,772 2,189,135 336,275 15.6% 14.8% (132,327) (117,532) 116,334 - $24.90
Route 495 North 18,740,522 4,181,658 598,246 25.5% 23.5% (373,787) (236,931) 220,000 - $19.60
Route 495 West 19,435,736 3,730,937 733,925 23.0% 22.5% 33,419 (73,481) - 150,000 $20.24
Route 495 South 3,196,097 440,099 90,623 16.6% 15.3% (41,988) (105,379) - - $20.21
Worcester 1,988,183 332,702 100,000 21.8% 22.8% 20,000 31,291 - - $23.34
TOTAL 110,134,781 17,715,928 2,962,135 18.8% 18.1% (580,574) (505,331) 1,343,456 150,000 $25.74
Cambridge
Alewife Station / Route 2 1,681,993 151,512 59,848 12.6% 14.6% 6,599 42,400 - - $77.75
East Cambridge 8,842,083 451,085 396,314 9.6% 9.4% (15,872) (39,415) 420,000 - $89.43
Harvard Square / Mass Ave 1,817,408 95,127 72,170 9.2% 9.9% 11,900 (27,783) - - $79.71
TOTAL 12,341,484 697,724 528,332 9.9% 10.2% 2,627 (24,798) 420,000 - $85.57
Suburbs
A 44,569,641 6,855,373 1,536,974 18.8% 18.7% 67,203 469,697 1,343,456 150,000 $28.14
B 65,565,140 10,860,555 1,425,161 18.7% 17.7% -647,777 (975,028) - - $24.21
TOTAL 110,134,781 17,715,928 2,962,135 18.8% 18.1% (580,574) (505,331) 1,343,456 150,000 $25.74
Boston | 21Q2 | Office | Market Statistics
Submarkets