
Book of Abstracts - Iasbs
157
Book of Abstracts
-
Upload
khangminh22 -
Category
Documents
-
view
3 -
download
0
Transcript of Book of Abstracts - Iasbs

Book of Abstracts

Oral Presentations

EARLY JURASSIC METAMORPHISM IN CENTRAL IRAN:
GEODYNAMIC IMPLICATIONS
Zanchi, A.1, Zanchetta, S.2, and Javadi, H.3
1,3Department of Earth and Environmental Sciences, Univ. Milano- Bicocca, Milan, Italy 2Geological Survey of Iran, Meraj Boulevard, Teheran, Iran
E-mail: [email protected]
Central Iran consists of several terranes, mainly derived from Gondwana and accreted to the
Eurasian margin during the Cimmerian orogeny. In its NW part, three metamorphic
complexes containing dismembered “ophiolites”, the Anarak, Jandaq and Posht-e-Badam,
occur. The age of metamorphism, geodynamic significance, and palaeogeographic
provenance of such units are largely debated. The evolution of the Anarak complex is, until
now, the best understood among the others. It has been interpreted as an allochthonous crustal
fragment belonging to the accretionary belt developed during Carboniferous times on the
southern margin of Eurasia. The mechanisms and timing of large-scale deformation during
Mesozoic and Cenozoic times that brought the Anarak unit in its present-day position are
poorly understood. An undefined Precambrian to early Palaezoic age has been instead
inferred for the Posht-e-Badam and Jandaq complexes.
The Jandaq complex is divided in two subunits: the Arusan ophiolitic mélange and the Jandaq
metamorphic unit. To the north, the complex is in tectonic contact with the Airekan
basement, mainly made of Lower Cambrian granites. The ophiolitic mélange consists of
serpentinized harzburgites, metagabbros, prasinites and quartzites, the last likely representing
metacherts. Minor marbles lenses also occur. The ophiolites display a predominant
greenschists facies mineralogical assemblage, with only minor relicts of amphibolite-facies
minerals. The surrounding basement consists of metapelites with minor amphibolites. The
metamorphic peak phase assemblages in micaschists is made of garnet, kyanite, staurolite,
plagioclase, biotite and muscovite. Garnet is also stable within mafic rocks of the same unit,
indicating that the Jandaq metamorphics reached P-T conditions well within the garnet
amphibolite facies. We provided new Norian U-Pb zircon ages for the granites that intruded
the Arusan ophiolites. Peak metamorphism that affected the Jandaq metamorphics is
constrained to the Early Jurassic by new Ar/Ar data on peak metamorphic minerals.
Preliminary data seems also to suggest the same age for the metamorphic event that affected
the Arusan ophiolites.
All these data suggest that the two subunits of the Jandaq complex experienced a significant
post-Cimmerian tectonometamorphic collisional event. We notice that the same record has
been recently recognized within the Mashhad metamorphic complex (Sheikholeslami et al.,
2019), suggesting that this tectonic event affected several areas of central and NE Iran. The
Upper Jurassic-Lower Cretaceous Chah Palang Conglomerate finally non-conformably

covered the Jandaq complex. Our new data strengthen the idea that part of Central Iran was
displaced to its present-day position along the Great-Kavir - Doruneh fault system during
Mesozoic and Cenozoic times. Cenozoic dextral shearing along precursors of this fault
system was also identified by us within the Jandaq-Arusan area.
KEYWORDS: Central Iran, metamorphism, ophiolites, structural geology.

The Iranian Plateau at the end of the Quaternary: new synthesis of
geological, archaeological and historical data
Nazari, H.1, Ritz, JF.2
1 Research Institute for Earth sciences, Geological Survey of Iran, Tehran-Iran. 2 Laboratoire Géosciences Montpellier, Université de Montpellier – CNRS UMR 5243,
Montpellier France.
From a synthesis of geological and geochronological data combined with archaeological and
historical data, we show that the northern part of the central plateau of Iran corresponded to a
huge lake, at least as large as the Aral Sea, at the very end of the Pleistocene-early Holocene
period, there are ca 16 Ka, at the transition between marine isotope stage MIS 2 and 1.
The morphological and stratigraphic markers of this ancient lake still visible in some areas of
the central plateau of Iran, especially in the Kavir desert, the Qom-Aran desert and the region
of Masileh, as well as archeological and historical data allow reconstructing its evolution
during the past 15 thousands years. These various data allow showing that this huge lake
(which most likely also existed during the previous interglacial MIS 5e period) experienced
dry periods during which it get evaporated and wet periods during which it was filled again.
Indices showing the presence of the lake around 16-14 ka, are ancient shorelines located at an
altitude of ~ 1100 m found in many places around the current Great Kavir depression.
Our geochronological data suggest then that between the beginning of the Holocene (~ 11.5
ka) and 8 ka, the lake level gradually decreased by 250 m, to reach the altitude of 850 m. We
believe that the cause of this lowering is the evaporation due to warmer and drier climate.
Around 8200 years ago, due to a a sudden drop of the temperature, the Neolithic peoples
moved from higher altitude to warmer and more fertile plains, and settled in such areas such
as Sialk, Shoorabeh hill, Gharehtappeh, Qomrood, Cheshmeh Ali etc... The spatial
distribution of archaeological and historical data indicates the drying up of the Masileh Basin,
in a region higher than the heights of the Kavir Desert. And we think that the Masileh Basin
has survived to the Sasanid Empire. The eastern part of the Kavir Basin had dried up earlier.
The lake of the Masileh Basin (the Great Salt Lake Basin and the Howz-e-Sultan Basin)
probably corresponds to the ancient Lake Saveh mentioned in the old myth.
The absence of archaeological remains dating back to the second millennium BC suggests
that the lake rose in the late Bronze Age (NB / pre-Islamic archaeological remains are
confined to the edge of the ancient lake). However, the existence of cultural remains from
intermittent human settlements in the Iron Age within the area of the former lake suggests
that there may have been a period of drought again.
KEYWORDS: Paleoclimatology, Paleo-lake, Saveh Lake, Iran.

Frictional behavior of carbonate fault rocks in Zagros Suture Zone
Yassaghi, A.1, and CMarone, C.2
1Dept. of Geology, Tarbiat Modares University, 14115-175, Tehran, Iran.
2Dept. of Geosciences, Pennsylvania State University, University Park, 16802, Pennsylvania,
USA
Email: [email protected]
Frictional strength of carbonate fault rocks generally depends on the rock internal
fabric/structures and composition. The fault rocks are frictionally strong and may have the
potential for seismic slip. In this paper, we investigate frictional behavior of carbonate fault
rocks from the Zagros suture zone. We present field observations along with results from
friction experiments on carbonate intact and powdered fault rocks from Zagros suture zone.
Due to the absence of micro-seismicity and lack of deformation out of GPS measurements,
the Zagros suture zone considered as currently inactive. We measured frictional strength and
rate/state dependence of the fault rocks over a range of normal stresses and shear slip
velocities. They showed potentially stable, velocity-strengthening frictional behavior. Our
results suggest that solution seams, cleavage processes in clay content carbonate rocks, and
development of stylolite and calcite veins in pure carbonate fault rocks of the suture zone
continually rejuvenate and rework shear structures that result in velocity-strengthening
frictional behavior. We propose that these processes occurred in the Zagros suture zone
during its exhumation to the upper crust throughout the final continental collision between
the Arabia microplate and central Iran.

Low-temperature thermochronology and structural constraints on
Cenozoic fault kinematic inversion in Northern Iranian Plateau margin,
case of the Kushk-e-Nosrat Fault, central Iran
Khodaparast, S.1, Madanipour, S.2, Enkelmann, E.2, Nozaem, R.3, Hessami, K.4, and
Matthews, W.2
1Department of Geology, Tarbiat Modares University, Tehran, Iran. 2Department of Geoscience, University of Calgary, Alberta, Canada. 3School of Geology, College of science, University of Tehran, Iran. 4International Institute of Earthquake Engineering and Seismology, Tehran, Iran.
Email: [email protected]
Deformation reorganization in Alborz Mountains of the northern margin of the Iranian
Plateau represents a Late Cenozoic slip sense inversion of major fault systems from right to
left lateral strike slip motion. This late Pliocene kinematic change has been attributed to the
clockwise rotation of the rigid South Caspian Basement (SCB) block. However our
knowledge of the southward penetration of this kinematic change in to the central parts of the
Iranian Plateau is still debated. Here we integrate detail structural kinematic data and apatite
(U‐Th)/He low-temperature themochronometry on the WNW-ESE trending Kushk-e- Nosrat
(KN) Fault system to unravel the uplift and cooling history and regional distribution of
kinematic change at the northwestern margin of the Iranian Plateau. There is a parallel fault
set in the western side of KN Fault and also several different sets of strike slip related
structures along KN Fault system, which are classified into three categories based on their
cross-cutting relation and the superposition of kinematic indicators. Structural analysis
suggests dextral, dextral transpression and sinistral kinematics. The relative timing of activity
is respectively documented along KN Fault system since Miocene time. The cooling ages
from a significant restraining bend on the west side of KN Fault suggest older cooling ages at
the bend margin which getting younger toward the core. The cooling ages are peaking at two
major cooling events including early Miocene (~20-18Ma) and early Pliocene (~6-4Ma). We
associate the Miocene cooling to dextral motion and the Pliocene age to the initiation of
dextral transpression on the restraining bend. This bend created a local highland region with
1000 meters local relief at the western side of KN Fault system. Our structural evidence also
indicates an inversion from a dextral transpression array to a sinistral array possibly during
post Pliocene time. This kinematic change is regionally due to the clockwise rotation of SCB
as it also proposed for the central Alborz Mountains of northern Arabia-Eurasia collision
zone. We propose here the KN Fault system in the northern margin of the Iranian Plateau as
the southernmost boundary of the region experienced fault slip sense inversion due to post
Pliocene shift in kinematics of SCB.
KEYWORDS: Fault slip inversion, Northern Iranian Plateau Margin, KN Fault system,
South Caspian Block

Tectonic geomorphology of highlands in Tehran region
Solaymani Azad, S.1, 2
1Seismotectonics & Seismology Department of Geological Survey of Iran, P.O.Box: 13185 1494,
Teheran, Iran.
2Université Montpellier 2, Laboratoire Géosciences Montpellier, UMR 5243, Montpellier,
France.
In the central portion of the Arabia-Eurasia collision zone, Tehran domain locates in a
transitional boundary between seismotectonic zones of Central Iranian lowland (to the south)
and Alborz highland (to the north). Accordingly, it affects from interaction of the both of
active tectonic zones. In this research, we will discuss tectonic geomorphology of the region
within the mountain front of the Alborz territory on the hanging wall of the North Tehran
fault. Our results highlight some prominent topographic scars as important features showing
co-seismic deformation markers. Huge landslides and rockfalls, offset geomorphic surfaces
etc. could be present as the main direct and indirect co-seismic deformation features. All
these geomorphic markers reveal seismic potential of Tehran new capital city to experience
really strong seismic events, maybe in new future. This is differ from previouse maximum
credible earthquake magnitude estimated for this area. Then, the results of seismic hazard
studies of Tehran City are still under estimated and a new seismic hazard assessment needs to
be run for this important area.

Risk Assessment of Geo-Hazards and Post-Earthquake Fire in Tehran
Zare, M.1, Kamranzad, F.2, Memarian, H.2
1International Institute of Earthquake Engineering and Seismology (IIEES), Tehran, Iran. 2College of Engineering, University of Tehran, Iran.
Email: [email protected]
Tehran is one of the most hazardous metropolises of the world in terms of the risk of different
natural disasters (e.g. earthquake, flood, subsidence, drought, landslide, fire following
earthquake, etc.). On the other hand, Tehran has over 8,700,000 populations with a mixture of
old non-resistant structures as well as modern high-rise buildings which affect the
vulnerability of this city. Risk of natural hazards is usually defined as below:
Risk = Hazard * Vulnerability * Exposure
In which Hazard represents the probabilities and intensities of a disaster. Vulnerability can be
considered in terms of technical, physical, organizational, psycho-social or economic
vulnerabilities and the Exposure is the number or the amount of a target which is considered
as elements at risk such as the population of a city.
In this study, for the city of Tehran, the hazard assessment of earthquake, flood, landslide and
subsidence are performed to derive an overall multi-hazard map. Then, by combining the
overall multi-hazard map with the distribution of non-resistant structures as the vulnerability
factor and the population density as the exposure term, a risk map of the multi-hazards is
prepared (Fig. 1). The risk map of the multi-hazards in Tehran indicates that the central and
southern regions of the city are located at a higher risk zone than other regions, so that the
central and southern regions need a closer attention in disaster risk reduction plans.
In addition, during the recent years, several researchers have attempted to model and assess
the post-earthquake fire in urban areas (e.g. the studies by Cousins et al. 2002; Scawthorn
2012 and Li et al. 2014). The recent serious fire incidents in single tall buildings in 2017 such
as the fire in the Plasco Building in Tehran (Fig. 2-a) and the Grenfell Tower in London (Fig.
2-b), draws our attention to the fact that how resilient will urban areas be in case of an
extensive post-earthquake conflagration? Therefore, modeling of the risk of earthquakes and
their subsequent fires should be regarded as an important issue in disaster risk reduction
strategies in urban areas, especially in the metropolises and large developing cities like
Tehran.

Fig. 1. Risk map of the multi geo-hazards in Tehran.
In this paper, we have attempted to model the risk of probable post-earthquake fire in Tehran.
At first, the earthquake hazard map was prepared by preparation and combination of two
maps: a PGA map with 475 years return period for surface deposits using the probabilistic
seismic hazard analysis and fault rupture hazard map. Then, a human exposure map was
provided in terms of population density according to the latest census of Iran (Statistical
Center of Iran, 2017). In the next step, the raster maps of several vulnerability factors (Table
1) were depicted with the pixel sizes of 50*50 meter in the ArcGIS software, and by
aggregating these maps, an overall vulnerability map was prepared. Finally, by multiplying
the hazard map with the vulnerability and the exposure maps, the risk map of the post-
earthquake fire was prepared for Tehran (Fig. 3) which indicates that the central and southern
regions of this city are located at a higher risk zone.

(a)
(b)
Fig. 2. Two recent fire incidents in high-rise buildings in 2017: (a) The 17-storey Plasco Building in
Tehran which was engulfed by a fire and fully collapsed on January 19, 2017 and (b): The 24-storey
Grenfell Tower in London which was burned almost completely by a huge fire on June 14, 2017.
Table 1. Factors of risk of post-earthquake fire in Tehran
Hazard Exposure Vulnerability
Surface PGA
Surface fault rupture zone
Population density High-rise buildings (> 10 floors)
Buildings quality (high quality, moderate, worn out or non-
resistant)
Narrow paths (width<10 m)
Accessibility to main streets, freeways and highways
Bridges and tunnels
Fire hydrant valves
Accessibility to fire station
Accessibility to hospitals
Strategic facilities (oil refinery, gas and water lines, etc)
Potential flammable places (wood and textiles warehouses)
Population centers (the great bazaar, malls, stadiums, etc)

Fig. 3. Risk Map of post-earthquake fire in Tehran
References
Cousins, J., Heron, D., Mazzoni, S., Thomas, G. and Lloydd, D., (2002). Estimating Risks from Fire
Following Earthquake. New Zealand Fire Service Commission, 47 pages.
Li, J., Wang, Y., Chen, H. and Lin, L., (2014), Risk assessment study of fire following an earthquake:
a case study of petrochemical enterprises in China, Natural Hazards Earth Syst. Sci., 14, pp. 891–900,
doi:10.5194/nhess-14-891-2014.
Scawthorn, C., Eidinger, J.M., Schiff, A.J., (2005). Fire Following Earthquake. American Society of
Civil Engineering, 345 pp. ISBN: 0-7844-0739-8.
Scawthorn, C., (2012). Fire Following Earthquake: Analysis and Mitigation in North America.
Proceedings of the International Symposium on Engineering Lessons Learned from the 2011 Great
East Japan Earthquake, March 1-4, 2012, Tokyo, Japan.
Statistical Center of Iran, (2017). https://www.amar.org.ir/english.
Zoback, M.L., (2006). The 1906 earthquake and a century of progress in understanding earthquakes
and their hazards. GSA Today, 16(4/5), 4-11. doi: 10.1130/GSAT01604.1.

QFL: Memory of Ancient Rocks
Hosseini-Barzi, M.1, Etemad-Saeed, N.2
1Shahid Beheshti University, Tehran, Iran. 2Institute for Advanced Studies in Basic Sciences (IASBS), Zanjan, Iran.
E-mail: [email protected]
Geoscience uses remnant information from ancient rocks and sedimentary deposits to unravel
the history of our 4.6 billion years old planet. Using actualistic point of view, provenance
study is a back-striping of a sedimentary cycle to develop reliable paleogeographic models of
Earth for particular time and area in the past. In fact, provenance study is a special and
temporal investigation of parent rock lithology, age, tectonic setting of the hinterland and of
the basin, and paleoclimate. Among different methods of provenance study, we want to
illuminate the outstanding importance of petrography in the framework of QFL memory and
its priority. Although, in recent decades scientists emphasize on quantitative approaches,
these kinds of data only are as spot and stain of reality in provenance work. In contrast,
petrography as a descriptive and qualitative method, possess the real face of vanished rocks
and therefore can be used as undeniable evidence for provenance. Traditionally petrographic
techniques include compositional and textural analyses and can provide reliable information
on origin, timing, and composition of grains of silisiclastic rocks. Although, it should be
noted that some tricky points may affect validity of petrographic data. Grain identification,
selective destruction of grains during sedimentary and diagenetic processes, and
distinguishing intrabasinal and extrabasinal grains are the most important limitations.
However, multiplicity of diagrams in provenance studies could help us for filtering the effect
of different variables to illuminate the main controlling factors. Ultimately better
understanding of paleogeography in provenance studies needs a close cooperation of
sedimentologists, field geologists, and tectonists.
KEYWORDS: Paleogeography, Petrography, Provenance, QFL memory, Sedimentary cycle

The story of Kermanshah radiolarite basin from Early Jurassic to Late
Cretaceous
Abdi, A.1, Bádenas, B.2, Mahmudy Gharaie, MH.3, Gorican, N.4, Toodekesht, S.1, SAmini, S.1,
Mattioli, M.5 1Zamin rizkavan Co. Ltd. Tehran, Iran 2 Department of Earth Sciences, Faculty of Sciences, University of Zaragoza, Spain 3Department of Geology, Faculty of Sciences, Ferdowsi University of Mashhad, Mashhad, Iran 4Ivan Rakovec Institute of Paleontology, Research Centre of the Slovenian Academy of Sciences
and Arts, Ljubljana, Slovenia 5 Université de Lyon, UCBL, ENSL, CNRS, LGL-TPE, F-69622 Villeurbanne, France
E-mail: [email protected]
The Kermanshah Radiolarite basin was developed at the western border of central Neo-
Tethys Sea and the eastern edge of Gondwana during the Mesozoic era (Gharib and De
Wever, 2010). This basin was located northeast of the Arabian continental platform and, in
West Zagros, was separated from the Neotethys basin by the Bisotoun carbonate platform
(Navabpour et al., 2011). During this time period, a high variety of marine sedimentary rocks,
including radiolarites, pelagic limestones, pyroclastic deposits, shales and gravity deposits
(internalites, turbidites, debris flows, etc.) were accumulated. These rocks are exposed in the
Kermanshah area (West Iran) in the Zagros orogenic system (e.g., Wrobel-Daveau et al.,
2010). The outcrops studied in this work, 5 sections, is located at the south of the
Kermanshah city, between the Kuh-e-Sefid fault to the south and the Bisotoun fault to the
north of the Kermanshah city.
An integrated analyses of sedimentological, paleontological and geochemical data has been
performed to in order to improve the knowledge of the sedimentary evolution of the basin
and the controlling factors (e.g. tectonics, climate, and volcanism). Paleontological studies
(calcareous nannofossils, radiolarians and planktonic foraminifera) indicate and Early
Jurassic to Late Cretaceous age for the studied sections. The Lower Jurassic (earlier than
Sinemurian) succession is formed by shales with intercalations of turbidites, pyroclastic and
radiolarite beds passing upwarads to pelagic limestones with intercalated internalites and
pyroclastic deposits. The Upper Jurassic to Lower Cretaceous succession is characterized by
chertshale alternations (radiolarites: Baumgartner, 2013) with intercalations of pyroclast
layers. The lower Cretaceous deposits also include intercalations of Fe- and Mn-rich
metalliferous and black chert deposits. The Upper Cretaceous succession is formed by
pelagic limestone and shale layers with intercalations of gravity deposits such as turbidites,
olistrostromes and debris flow. Relatively Enrichment of LREE, Zr, Nb, Hf, and Th indicate
a upper continental crust source for the Early to Late Jurassic as well as Late Cretaceous
deposits. However, flat to slightly light rare element-enriched (LREE) patterns and positive
correlation of P, V, Zn, As with Fe, and enrichment of V, Co and Ni elements in Early
Cretaceous chert and metalliferous deposits conform to those of modern mid-ocean ridge
(MOR) iron-rich sediments.

It is concluded that continental break-up and initial sea-floor spreading took place probably
during the earlier time of Sinemurian triggering deposition of distal turbidity deposits. Fe-
and Mn-rich metalliferous sediment in Early Cretaceous indicate that further opening of the
basin and creation of oceanic crust continued until this time. Lastly, occurrence of gravity
flow deposits in Late cretaceous indicate basin closure and emplacement onto Arabian
foreland.
KEYWORDS: South Neotethys; West of Iran; Kermanshah radiolarite basin;
Sedimentology; Biostratigraphy; Geochemistry

Hormuz Formation of Jabal Sanam Salt Structure: The Oldest Rocks
Outcrops in Southern Iraq
Soltan, B.1, and Abdulnaby, W.1
1Department of Geology, College of Science, University of Basrah
Jabal Sanam structure is a salt dome located in southern Iraq near Iraq-Kuwait border. Sanam
salt structure has an oval shape with 1.7 km length and 1.5 km width. The highest elevation
of Jabal Sanam is about 96 km above surrounding areas and 152 km above sea level. Jabal
Sanam is a salt plug of which its cap rocks crop out on the surface and compose mainly from
evaporates and it has general properties similar to that of Infra-Cambrian Hormuz series.
Detailed geological field investigations were carried out at Jabal Sanam structure that has
very lithological complexity and large variety in its rock components. Therefore, the
reconstruction of the lithological and stratigraphical succession of the structure is difficult.
The cap rocks of Jabal Sanam considered as a complex because of the significant difference
in thickness and dips of beds from place to place and many parts of them disappear under the
slopes of the sediments as a result of big-scale distortion by the effect of salt intrusion. Thus,
the reconstruction of the lithological succession was needed to make a composite section. The
detailed fieldwork and petrological properties showed that Jabal Sanam structure contains
three major units: brecciated limestone unit, gypsum unit, and dolomite (dolostone) unit.
Petrological, stratigraphic and tectonic correlation were made with similar structures in Iran
and the Arabian Peninsula in light of their composition, which in general consist of Infra-
Cambrian evaporates of Hormuz Formation. This study shows great similarity between the
rocks of Hormuz Formation complex and those of Jabal Sanam that can be considered in
terms of stratigraphy and petrology as equivalent rock unit of Hormuz Formation. The
development of Hormuz evaporative rocks in isolated and isochronous sedimentary basins
indicates the independence of sedimentary conditions from those associated with the geneses
of Jabal Sanam rocks. Therefore, the study suggests that the rocks of Jabal Sanam can be
called Sanam Formation.

Paleoenvironmental and Biostratigraphy studies of the Qum Formation
based on calcareous nannofossils in Shadiyan section, Central Iran
Senemari, S.1, and Bahrammanesh Thehrani, M.2
1Imam Khomeini International University, Qazvin, Iran 2Geological Survey of Iran, Tehran, Iran.
Email: [email protected]
One of the most extensive Tertiary deposits in central Iran, the marine sediments of the Qum
Formation, the first in the area around Qum based on stratigraphy and paleontology was
identified. Type section of the Qum Formation is studied around Qum (Khaksar and
Maghfouri-Moghadam, 2007). The most important things that can be done given of this
formation in Iran, determining the exact age of by calcareous nanofossil. In this study, the
sediments of Qum Formation were investigated in Shadiyan section, southeast of Kashan.
This Formation with a thickness of about 340 m consists of marl and marly limestone, and
gradually covered by conglomerate of Pliocene. The study of 100 samples taken from the
section led to the identification of 33 species of calcareous nannofossils. According to
distribution of the index species, created several distinct biostratigraphic marker zones in this
section, described as nanno floral zones NN1, NN2, NN3 and NN4. As a result of this study
and based on the identified zones, the age of Qom Formation in the studied section is Late
Chattian to Burdigalian/Langhian. We can also learn about the predominant conditions of the
studied sedimentary basin that was in fact part of the Neo-Tethys basin with the existence of
indexed species calcareous nannofossils that indicate warm climate and high water depths of
the basin in low latitudes.
KEYWORDS: Qum Formation, Biostratigraphy, Calcareous nannofossils, Kashan, Chattian,
environment change.

Why garnierite is absent from mineralization in the Ni-bearing laterites
from Bavanat region, Fars province, Iran?
Rasti, S.1, Rajabzadeh, M.1, Quantin, C 1Department of Earth Sciences, Faculty of Sciences, Shiraz University, Shiraz 7146713565, Iran 2UMR 8148GEOPS, Université Paris Sud — CNRS, 91405 Orsay Cedex, France
E-mail address: [email protected].
Nickel-bearing laterites in Bavanat region occur in two parallel belts between the
Sedimentary Zagros Orogenic (SZO) and Metamorphic Sanandaj-Sirjan (MSS) zones in SW
Iran. These belts, trending NW-SE are called Northern belt and Southern belt and extend 180
and 450 km, respectively. They are the only known Ni-bearing soft rocks in the country.
These laterites are regarded as the weathering products of ultramafic rocks (mainly
harzburgite) of the Neyriz ophiolite which emplaced on continental margin during collision
between Afro-Arabian and Iranian micro-plate in Late Cretaceous. Lithologies of the study
area include altered ultramafic plutons, marl, limestone and conglomerate overlaid by recent
sediments. The weathering of ophiolite ultramafic rocks under Mediterranean climatic
conditions led to the development of the iron oxide soils containing nickel rich ferruginous
horizons. Vertical profile of the laterites includes protolith, hard and soft saprolite, and then
oxide horizon. Protolith is the extremely serpentinized harzburgite composed of olivine and
orthopyroxene with dark green color and network texture. Minerallogically, hematite,
goethite, talc, dolomite and, quartz increase whereas chlorite, olivine, serpentine and,
pyroxene decrease from hard saprolite to oxide horizon. Hematite and goethite are the
dominant phases in the oxide horizon. The Ni concentration varies gradually from base to top
of the soils, and reaches up to 12 g/kg in the oxide horizon. Iron oxide-hydroxide minerals are
the major Ni-bearing phases in the studied laterites. SEM-EDS analyses showed that liberated
Ni from serpentine group minerals in the parent rock was concentrated in hematite in oxide
horizon. Concentration of Ca, Na, K and, Mg decrease, whereas concentrations of Fe, Mn,
Ni, Cr, Co and Al increase in an upward direction along the selected profiles.
Garnierite is the main Ni-bearing mineral in Ni laterites around the world. This mineral
occurs in saprolite horizon at the top of the serpentinized parent peridotites. The lack of
garnierite in the studied latterites is explained by a number of geological and environmental
factors. Very low Ni concentration (0.69 to 2.39 g/kg) in the protolith did not provide the
abundant Ni source of formation the garnierite. High Fe concentrations (up to 9.54 wt%) of
the parent serpentines and the presence of a few clasts of these phases in saprolite horizon
prevent the formation of garnierite in the studied laterites. The rainforest climate condition
was also unfavorable for Ni transportation and accumulation in the weathering solutions.
Despite the in-situ profile thicknesses of 10-15 m in some places, the weathering intensity
was low and the weathering period was relatively short. These result in little or no formation
of nickel-rich secondary silicates. In addition, insufficient joints and fractures in the source
rock from Bavanat region prevent fluid circulation along fractures, the process that controls
the infiltration of Ni-saturated solution and the precipitation of garnierite in the lower part

(saprolite) of the laterite profile. Garnierite minerals cannot precipitate from fluids enriched
in light isotopes of Ni (-0.05 to +0.15 ‰). High pH values (up to 8) of Ni-laterite samples in
Bavanat region and low organic matter content as well (between 0.69 and 1.93 g/kg) also
explain the absent of garnierite in these soils.
KEYWORDS: Bavanat; Garnierite; Iran; Laterite; Mineralization; Nickel.

Seismic hazard assessment for Makran from mechanical modelling
Cubas, N.1
1Sorbonne Universités, UPMC Univ Paris06, ISTEP, Institut des Sciences de la Terre de Paris, France
Recent geodetic studies have shown that some accumulation of elastic strain along the plate
interface is required to explain the velocities on both western and eastern Makran. They
proposed a relatively strong coupling along the eastern segment where the 1945 earthquake
occurred, a decrease along the central part, and a possible increase westward. However, due
to the sparsity of stations and the large trench-coast distance, these studies were unable to
constrain the locked zones.
From heat flow measurements, we now know that the effective friction along megathrusts
differs significantly between aseismic or seismic patches. These differences of effective
friction are significant enough to produce wedge segments with varying morphologies and
deformation patterns. As a consequence, studying the prism deformation can allow us to
locate more precisely the locked zones. During this talk, I will show how mechanical
modelling can help us to establish relationships between deformation and seismic behavior
and thus improve the seismic and tsunamigenic hazard assessment. During this presentation, I
will first show results obtained along the South American, Japan, Sumatra and Cascadia
subduction zones. Finally, I will discuss recent results for the Makran accretionary prism.
New seismic constraints for deep structure of the western Makran
subduction zone, SE Iran
Motaghi, K.1, Meymand, R.Z.1, Momeni, H.R.1, Akbarzadeh, M.1, Mokhtarzadeh, R.1,
Ghods, A.1, Sobouti, F.1, Priestley, K.2
1Department of Earth Sciences, Institute for Advanced Studies in Basic Sciences, Zanjan, Iran 2University of Cambridge, Madingley Road, Cambridge CB30EZ, UK
E-mail: [email protected]
Deep structure of the western Makran subduction zone in SE Iran has not been investigated in
details so far. Shortage of seismic stations and events in the region made improper data coverage
which in turn made it impossible to prepare high resolution seismic images for the region. To
solve this shortage, the Institute for Advanced Studies in Basic Sciences in Zanjan, Iran, has
installed a dense seismic array since May 2016 and gathered continues data in 35 seismic stations
(at least one year for each station) so far. Combining these data with sparse seismic stations from
Iranian national networks generated a unique chance for preparing high resolution teleseismic
images for the region. The study region (25–30oN and 58–62oE) covers the accretionary prism at
northern shoreline of Oman Gulf to north of Taftan volcano which is part of the Makran volcanic
arc. We carried out a teleseismic P-wave travel time tomography, a teleseismic surface wave
tomography and a P receiver function analysis to reveal the deep features. The obtained results
show that the slab is almost flat up to ~100 km north of the northern shoreline of the Oman Gulf
attesting that subduction trench is beneath Qasr-e-Qand fault. This is inconsistent with widely-
accepted tectonic maps showing the subduction starts at middle of the Oman Gulf. The resolved
slab bends even more beneath the Taftan volcano reaching to depth of 300 km in a high angle.
This geometry has been confirmed by combining the obtained results from three different images
prepared by the above mentioned seismological techniques.
KEYWORDS: Western Makran subduction zone, Surface wave tomography, Teleseismic
travel time tomography, P receiver functions
Integrated geophysical modeling of the Makran subduction zone

Khaledzadeh, M.1, 2, Ghods, A.1, Zeyen, H.2, Abbasi, M.3
1Institute for Advanced Studies in Basic Sciences (IASBS), Zanjan, Iran 2GEOPS, Univ. Paris-Sud, CNRS, Université Paris-Saclay, 91405 Orsay, France 3Surveying Engineering Department, University of Zanjan, Iran
E-mail: [email protected]
Makran subduction zone extends ~1000 km between SE Iran to SW Pakistan in E-W
direction and from 24°N inside the Oman Sea to the JazMurian and Mashkel depressions in
N-S direction. The Makran is a unique subduction zone in terms of its very low subducting
angle, wide accretionary prism, and a large distance of 400-600 km between its volcanic arc
and deformational front.
In order to estimate the geometry of the subduction zone in the Iranian side of the Makran,
the department of Earth Sciences of Institute for Advanced Studies in Basic Sciences
(IASBS) deployed a seismic network in Makran region in June 2016. The network is
consisted of 30 seismometers and will be working in the region up to the end of 2019. The
network is installed along a line starting from the Iranian coasts of Oman Sea and crosses the
accretionary wedge and Bazman-Taftan volcanic arcs in Central Iran. In this study, we
present a new crustal and lithospheric density model for the Makran subduction zone by
applying an integrated geophysical modeling method along a N-S profile centered at 60.5°E
latitude. The profile starts inside the Oman Sea at 23°N and extends along the IASBS seismic
profile. We model density and thermal structure of the crust and lithosphere by integrating
seismological data, gravity (free-air and Bouguer), geoid, absolute topographic elevation data
while assuming local isostatic equilibrium (e.g. Zeyen and Fernandez, 1994), to reduce non-
uniqueness of the geophysical modeling. The calculation is performed using a finite element
technique which links the different equation of states. The lithospheric density is assumed to
vary linearly with temperature whereas the density of sediments is assumed to vary
exponentially with depth. For the crustal parts, we defined constant densities.
We constrained the geometry of the offshore part of the model using the results of previous
reflection and refraction seismic studies. Based on the previous studies, the angle of the
subducting plate is very low ~1°-2° in the front of Makran wedge where the sedimentary
cover is ~7 km thick and the oceanic crust has an average thickness of 9 km. We assumed a
density of 2300-2450 gr/cm3 for the sedimentary cover. A phase change is considered for the
oceanic crust where the basalt partially changes to eclogite at depths deeper than 40 km. The
density of basalt and the partially eclogitized oceanic crust are assumed to be 3050 and 3200
gr/cm3, respectively. For the continental part, we used the result of receiver function along
the IASBS seismic profile (Mokhtarzadeh et al., 2019). The receiver function analysis
showed a very low angle of ~3° for the subducting Arabian plate at and north of the Iranian
Oman sea coastlines, ~13° north of the Qasr_e_Qand fault, south of JazMurian depression
and then a more dipping plate of ~35° for the north of the Taftan-Bazman volcanic arc. The
receiver function study also showed a normal continental crust with a thickness of 40-50 km
beneath JazMurian and Central Iran. We split the continental crust into upper and lower parts
with a density of 2800 and 2950 gr/cm3 and average thickness of 25 and 15 km, respectively.

We defined the density for the continental sediments in the range of 2450-2600 gr/cm3 that is
suitable for Eocene-Miocene Flysch and Molasses that construct the accretionary wedge and
Quaternary sediments covering the JazMurian depression. Moreover, we defined a narrow
ophiolite belt with an average width and density of 15 km and 2700 gr/cm3, in the south of
JazMurian, similar to its surface outcrop in the geological map. The magnetic field map in
JazMurian shows that there is a strong magnetic anomaly beneath the Quaternary sediments
in this area. Previous studies related this positive strong magnetic anomaly to the old remnant
oceanic crust that created with back-arc spreading mechanism. However, the gravity signals
shows a negative anomaly above the JazMurian, very similar to the gravity signal of the
continental part. If there is a back-arc related oceanic crust in JazMurian, we expect a strong
Bouguer gravity anomaly above the JazMurian like the oceanic area. The rather thin (~40
km) and strongly magnetized continental crust of JazMurian suggests that the JazMurian was
a passive volcanic thinned marginal basin connected to Central Iran before commencement of
the subduction. Therefore, we defined a magnetized volcanic basement as a marginal basin in
JazMurian to justify both gravity and magnetic signals. We considered constant values for
density and temperature of the asthenosphere, 3200 gr/cm3 and 1300° C, respectively. These
values are used as a reference to construct the density of lithosphere. In this way, we defined
the temperature-dependent density for oceanic and continental lithosphere that varies with
respect to this reference values. We determine the thickness of oceanic lithosphere from the
global plate cooling model.
The proposed density model has a good fit with the observed free-air and Bouguer gravity
and geoid signals. The misfit values are 16 and 11 mGal for Bouguer and free-air signals and
0.37 and 334 m for geoid and topographic elevation signals, respectively. To achieve a
reasonable model, our priority is to obtain first a good fit for the gravity data, then for the
geoid and finally for the topographic elevation data. This is because local isostatic
equilibrium may not always be established and the crust and lithosphere may compensate
some part of the topographic load with their inherent rigidity. Our density model shows a lack
of isostatic equilibrium in the deformational front and in coastlines where short topography
wavelengths are present. Our modeling suggests a normal continental crust for the JazMurian
depression, a lithospheric thickness of 110 km for the ~90 Myr. Old subducting plate, and a
partially eclogitized oceanic crust at depths deeper than 40 km.
KEYWORDS: Geoid, Gravity, Integrated Geophysical Modeling, Local Isostasy, Makran,
Steady State
References
Mokhtarzadeh, R., Sobouti, F., Priestley, K., Ghods, A., Motaghi, K., 2018. Structure of the western
Makran subduction zone from seismological studies. 2nd TRIGGER International Conference,
Tehran.
Zeyen, H., Fernandez, M., 1994. Integrated lithospheric modeling combining thermal, gravity and
local isostasy analysis: application to the NE Spanish Geotransect. J.
Geophys. Res. 99, 18089–18102.

Imaging the crust and upper mantle structures in the makran subduction
zone in south-east of iran
Abdollahi, S.1, Ebrahimzadeh Ardestani, V. 1, Zeyen, H.2, and Shomali, Z.H.1, 3
1 Earth Physics Department, Institute of Geophysics, University of Tehran, Tehran, Iran
2 CNRS/Université Paris-Saclay, Département des Sciences de la Terre, Orsay, France
3 Department of Earth Sciences, Uppsala University, Uppsala, Sweden
E-mail: [email protected]
In this study, Simulated Annealing (SA) algorithm is applied to non-linear inversion of
fundamental mode Rayleigh wave group dispersion curves for shear and compressional wave
velocities. At first, to determine the efficiency and stability of the Simulated Annealing
method, two noise-free and two noisy synthetic data sets are inverted. Then real data for
Makran region are inverted to examine the usage and robustness of the proposed approach on
real surface wave data. In a second step, we applied 3D Gravity Modeling based on surface
wave analysis results to obtain the density structure of each layer. The reason for using both
types of data sets, is that gravity anomaly has a bad vertical resolution and surface wave
group velocities are good for placing layer limits at depth, but they are not very sensitive to
densities. Therefore, using gravity data increases the overall resolution of density distribution.
Our results show that Moho depth increases from Oman Sea (18-28 km) and Makran fore-arc
setting (35–40 km) to the Taftan-Bazman volcanic-arc (46–48 km). Also, results show a high
shear and compressional velocity under the Gulf of Oman which reduce to the North of the
Makran region. We find a high-velocity anomaly in the upper mantle under the Oman Sea
corresponding to the subducting slab. The density image shows an average crustal density
with maximum values under the Gulf of Oman decreasing northward to the Makran region.
The crustal density is high in the Oman Sea as should be expected for the oceanic crust.
KEYWORDS: Gravity; Makran; Moho; Shear velocity; Simulated Annealing algorithm

A plume-ridge interaction for Neo-Tethys: Insights from various basalts of
Makran accretionary complex, SE Iran”
Wan, B.1, and Esmaeili, R.1
1State Key Laboratory of Lithospheric Evolution, Institute of Geology and Geophysics, Chinese
Academy of Sciences
The Makran region in southeast Iran provides a spectacular subduction-accretionary complex
to understand continental growth. In this paper, we present new major and trace element
compositions of mafic volcanic blocks from the ophiolitic mélange complex exposed in the
Makran area. Our aim was to assess the genesis of these rocks and discuss their implications
on the evolution of the Neo-Tethys Ocean. These volcanic blocks are composed mainly of
basalts with minor trachytes. Based on their geochemistry, the basalts in the ophiolitic
mélange complex are divided into three groups, N- MORB, E-MORB, P--MORB and
alkaline basalts. The chemistry of these rocks suggests that they were formed most likely in
a plume-ridge interaction oceanic setting from partial melting of a highly heterogeneous
mantle characterized by the extensive occurrence of OIB-metasomatized portions . Despite
exposed as blocks or components in the wide Makran subduction-accretion complex, none of
these basaltic groups exhibit geochemical evidence of subduction. These rocks are more
similar to oceanic plateau and/or ridges similar to Iceland-Reykjanes Ridge before being
fragmented and accreted into the Ophiolitic Mélange Complex.
Coseismic deformation and source parameters of 12 December 2017 Mw
6.2 Hojedk Iran earthquakes
Vajedian, S1, Mousavi, Z.2, Motagh, M.1,3
1Institute of Photogrammetry and GeoInformation, Leibniz University Hannover, 30167
Hannover, Germany; [email protected] 2Department of Earth Sciences, Institute for Advanced Studies in Basic Sciences,45137-66731
Zanjan (IASBS), Iran; 3GFZ German Research Centre for Geosciences (GFZ), Section of Remote Sensing, 14473
Potsdam, Germany;
On December 1st 2017 an Mw 6.1 earthquake struck a region between Central Iran and Lut
block in southeastern Iran. The mainshock followed by two moderate aftershocks (Mw 5 and
Mw6) occurred on 12 December positioned in close spatial proximity to each other. The area
has been hit continuously by the 10 tremendous events (Mw > 5) over the eight months. This
study investigates the geometric and kinematic characteristics of the seismogenic faults
ruptured during the earthquakes occurred on 1st and 12th December 2017.
Monitoring the crustal deformation caused by earthquakes provides invaluable kinematic
coseismic information to better understanding of tectonics processes. SAR interferometry is a
popular technique to remotely detect large coverage Earth’s surface deformation associated
with various phenomena including earthquakes, volcanic activity and landslide movements.
However in the presence of large deformation, in near-field area, InSAR observations get
complex and noisy due to the image mis-registration. Retrieving near field displacement may
be more of interest however, as they allow to improve constraints on fault geometry and slip
distribution especially within the shallowest crust.
Here is this study, we use the available Sentinel-1 TOPS and ALOS-2 ScanSAR in both
geometries of ascending and descending to retrieve LOS surface deformation. Beside LOS
observations, we implement orientation correlation method to estimate sub-pixel offset over
the near-field area. We then combine both observations including coseismic deformation
derived from InSAR and near field offsets retrieved from orientation correlation to estimate
the source model.
Combining geodetic observations acquired by independent methods, InSAR and offset
tracking in this study, requires a data weighting method to balance the observed data with
respect to each other. Considering data quality of the observed data in weighting approach
can significantly improve resolving source model parameters. To properly combine
observations, here we use noise covariance structures obtained from the observed data. We
further use resolution based resampling method to downsample the continuous measurements
in order to reduce the computational cost. Bayesian optimization method is implemented on
the resampled data to apply coseismic joint inversion in order to solve the source model

parameters. We complement the satellite observations by additionally using of aftershock
relocations and surface rupture evidence obtained from optical satellite as independent
constraints to find a unique fault structure that is more consistent with the real earth. Once the
unique fault is defined, we fix the fault geometry and split it to a coarse grid of dislocations.
We then appropriately resize dislocations so that each discrete dislocation is robustly
constrained by the observed data. Our results demonstrate earthquakes occurred in the area
were caused by reactivity of Lakar Kuh fault located between north-south trending Kuhbanan
and Nayband faults. The main deformation related to the 12 December earthquake occurred
as a result of WNW-ESE thrusting faulting where main rupture was concentrated at a depth
between 8 and 10 km, characterized by a shallow rupture reaching the surface.
KEYWORDS: InSAR, Orientation Correlation, Bayesian, Earthquake, Coseismic analysis

GPS and seismic data to highlight the interaction between deep and
shallow deformation related to the 2013 Okhotsk earthquake, Kamchatka
Walpersdorf, A.1, Titkov, N.2, Chebrov, D.2, Rousset, B.1, Jara, J.1, Campillo, M.1, Shapiro, N.3
1ISTerre, Université Grenoble Alpes, CNRS, Grenoble, France (andrea.walpersdorf@ujf-
grenoble.fr), 2Kamchatka Branch of the Geophysical Service, Russian Academy of Sciences, Petropavlovsk-
Kamchatsky, Russia ([email protected]),
3Institut de Physique du Globe, Paris, France
The 24/05/2013 Okhotsk earthquake (M=8.3) took place at 600 km depth on the Kamchatka
subduction zone that accommodates 8 cm/yr of westward convergence of the Pacific plate
with respect to the North American plate. The Okhotsk event has been preceded by several
shallow earthquake swarms that stopped instantaneously at the time of the large and deep
earthquake. This work aims at investigating the interaction between shallow and deep
seismicity based on a detailed earthquake catalog, and to search for related signals of
transient surface displacements monitored by the Kamchatka permanent GPS network. The
earthquake catalog localizes the swarms before Okhotsk in depths between 40 and 80 km,
and some notable activity of aftershocks between 500 and 700 km depth, with no events in
the intermediate depths. The cumulated number of earthquakes from 2004 to 2016 reflects the
occurrence of the shallow swarms by an increased rate before Okhotsk, while the earthquake
rate of deep events (500-700 km) decreases simultaneously. Furthermore, an increase of
earthquake rate is observed in 2009 in both depths. While it is difficult to extract a clear
signal of surface deformation comparing the period before and after 2009 in the GPS data, the
shallow swarms do have a surface expression, indicating purely co-seismic release of
constraints during the last swarm just before Okhotsk, and co- and a-seismic release for the
most energetic swarm with a cumulated magnitude of 7.1. In particular, during this swarm, a
large-scale transient motion is observed of ~5mm toward the SE, covering the whole
peninsula. Investigations are ongoing to identify possible sources, like hydrological loading
(using GRACE data), stress transfer following the 2011 Tohoku event, or following the 2007
Kuril earthquakes that created large scale a-seismic creep over several years. Eventually, this
transient is a first observation of a loading and unloading mechanism of the deep slab that
could explain the simultaneous increase and decrease of seismic activity in shallow and large
depths, respectively, before the Okhotsk event.

Aquifer storativity and hydraulic head estimation from InSAR
Rezaei, R. 1, 2, Mousavi, Z. 1,3
1 Department of Earth Sciences, Institute for Advanced Studies in Basic Sciences (IASBS), 444
Prof. Sobouti Blvd., Zanjan 45137–66731, Iran.
2 Center for Research in Climate Change and Global Warming (CRCC), Institute for Advanced
Studies in Basic Sciences (IASBS), 444 Prof. Sobouti Blvd., Zanjan 45137–66731, Iran.
3 Earth System Physics Section, Abdus Salam International Centre for Theoretical Physics,
Trieste, Italy.
E-mail: ([email protected])
This study uses Interferometric Synthetic Aperture Radar (InSAR) to quantify the land
deformation across the Gorgan confined aquifer system (GCAS), Iran, susceptible to
significant subsidence imposed by aquifer storage depletion. Analysis of TOPS S1 month-
scaled images from 2014 to 2016 reveals that significant inelastic (70 mm/yr on average) and
periodic elastic (ranging from about 20 to 132 mm) deformations based on the decomposed
vertical displacement map have occurred in GCAS. It is also observed that a high cross-
correlation coefficient exists between the seasonal (de-trended) components of head and land
deformation time series (ranging from 0.60 to 0.93; ~0.78 on average). From a joint well-
InSAR data analysis, we estimate bulk aquifer parameters of the elastic skeletal storativity (
0.0035 to 0.0142 ; 0.0085 on average), specific storage (51.54 10 to
5 17.68 10 m ; 5 14.35 10 m
on average), and compressibility (101.50 10 to
10 27.40 10 /N m ; 10 24.20 10 /N m on average)
at 14 piezometer locations. InSAR-derived aquifer storage parameters are reasonably
correlated with the hydrogeological setting of GCAS. Further, the elastic land deformation
data are acceptably converted to head fluctuations at 14 piezometers where the heads
reconstructed from InSAR and measured in piezometers are consistent over a broad portion
of GCAS. Finally, the confining degree map across GCAS is extracted from seasonal elastic
land deformations that occurred between wet and dry seasons in 2015. The higher confining
degrees are observed in those areas of higher subsidence signatures, implying that the
subsidence potential in confined aquifers is higher compared to unconfined aquifers. In this
study, we have demonstrated more benefits of the InSAR observations in estimating aquifer
storage properties and reconstructing head in confined aquifers of significant subsidence
signatures with better temporal and spatial resolution than that can retrieve from
hydrogeological data alone.
KEYWORDS: Aquifer confining degree; Aquifer storage parameters; Gorgan Plain of Iran;
Inelastic and elastic land deformation; InSAR deformation map

Characterizing surface deformation in the 1990 Rudbar earthquake (Iran)
using optical image correlation
Ajorlou, N.1, Hollingsworth, J.2, Mousavi, Z.1, Ghods, A.1, Masoumi, Z.1
1 Institute for Advanced Studies in Basic Sciences, Zanjan, Iran
2 ISTerre, Univ. Grenoble Alpes, Grenoble, France
E-mail: ([email protected])
The 1990 June 20th Rudbar earthquake (7.3 Mw) was a catastrophic event that killed ~40,000
people, made ~500,000 people homeless, and destroyed three cities and 700 villages in
Northern Iran. The earthquake ruptured a previously unknown left-lateral strike slip fault
over a distance of 80 km (Fig. 1a) in the western Alborz Mountain belt. The field study
indicated a maximum horizontal displacement of ~60 cm and a vertical displacement of ~95
cm [Berberian et al., 1992; Berberian and walker, 2010]. The main shock was followed by
several aftershocks, with many striking north of the fault plane, and displaying strike-slip or
reverse focal mechanisms (Fig. 1a). The reported surface slip displacements are surprisingly
low given the relatively shallow and high moment release in this event, coupled with the pure
nearly vertical left-lateral fault (e.g. ~2.5 m of slip would be expected from a Mw 7.3 event
with a fault surface of 15 in depth and 80 km in length). The Rudbar earthquake occurred
before InSAR and GPS eras, thus we re-examine the surface displacement field using optical
image correlation to better understand the faulting associated with the Rudbar earthquake.
This method allows the retrieval of near-field fault displacements by cross-correlation of pre-
and post-earthquake satellite and aerial images [Leprince et al., 2007; Avouac et al., 2015].
We use SPOT images from before (1989) and after (1994) the earthquake to document the
horizontal deformation produced by the Rudbar earthquake. We find much larger surface slip
(~1 to 5 m, Fig. 1b) than those reported by field measurements (~60 cm, Berberian et al.,
[1992]). To study the surface rupture in more detailes, we correlat aerial photos of 1955-2003
and 1968-2003. We use Ames Stereo Pipeline to bundle adjust all our photos together to
make a seamless DEM and ortho-photo mosaic, which we then correlate [Shean et al., 2016]
applying COSI-corr [Leprince et al., 2007]. The disparity between the two measurments is
related to a distributed deformation occurring in a volume around the fault. We found that the
horizontal displacement happened within an average width of ~770 m centered on the Rudbar
fault. Furthermore, we identify a newly mapped surface rupture with lenght of 23 km in the
eastern end of the Rudbar fault.
KEYWORDS: Optical image correlation, aerial photo, Rudabr fault, COSI-corr, Ames Stereo
Pipeline

a
b
Figure 1. (a) The black solid lines present the Rudbar fault trace mapped by Berberian et al., [1992].
The horizontal displacements, reported by Berberian and Walker, [2010]. The red and blue beach
balls represent the focal mechanisms of mainshock and aftershocks, respectively [Gao and Wallence,
1995, Jozi 2014]. The location of the mainshock is marked by a red star. (b) Correlation map in east-
west direction of SPOT images. The red line shows the surface trace of Rudbar fault as mapped by
our method. The black line shows a new surface rupture for the Rudbar event. The lower panel show
the horizontal displacement along the Rudbar fault (solid red lines) strike. The vertical lines show
error for each measurement.
References
Avouac, J.-P., Leprince, S. (2015). Geodetic Imaging Using Optical Systems, in Treatise on
Geophysics, G. Schubert, Ed. Elsevier, Oxford, ed. 2, (2015), vol. 3, pp. 387-424.
Berberian, M., Qorashi, M., Jackson, J. A., Priestley, K., & Wallace, T. (1992). The Rudbar-Tarom
earthquake of 20 June 1990 in NW Persia: preliminary field and seismological observations, and its
tectonic significance. Bulletin of the Seismological Society of America, 82(4), 1726-1755.
Berberian, M. and Walker, R. (2010), The Rudbār Mw 7.3 earthquake of 1990 June 20;
seismotectonics, coseismic and geomorphic displacements, and historic earthquakes of the western
‘High-Alborz’, Iran, Geophysical Journal International, Volume 182, Issue 3, 1 September 2010,
Pages 1577–1602.
Jozi, A., Ghods, A., Rezaeian, M., 2014. Seismotectonics of northern Iran using local network data,
Master thesis, Institute for Advanced Studies in Basic Sciences, Zanjan, Iran.

Investigating the Signature of the Offsets on Wavelet Rough Sets in GPS
Experiment
Moghtased-Azar, K.1, Safari, A.2, and Tehranchi, R.2
1Department of Surveying & Engineering, Faculty of Civil Engineering, University of Tabriz,
Tabriz, Iran 2School of Surveying and Geospatial Engineering, Research Institute of Geoinformation
Technology (RIGT), College of Engineering, University of Tehran, Tehran, Iran
E-mail: [email protected]
The GPS position time series can be contaminated by the presence of probable offsets. An
offset is defined as a sharp change of the mean caused by known or unknown reasons. In
order to estimate the unknown parameters and their uncertainties accurately, the locations of
probable offsets have to be detected. The problem of the allocation methods of the offsets in
GPS time series based on the least squares principle, such as Detection, Identification and
Adaptation (DIA) procedure, is that they depend not only on the correct structure of the
design matrix, but also on the covariance matrix of the observations. Hence, the objective of
this study was to use wavelet rough sets of Maximal Overlap Discrete Wavelet Transform
(MODWT) to address the location of the offsets in continuous GPS (CGPS) time series
without apriori information of the functional or stochastic models. The performance of the
proposed method was tested against The Detection of Offsets in GPS Experiment (DOGEx)
database. These time series consist of an intercept, linear trend, two trigonometric functions
for the annual and semi-annual signals, offsets, and white and flicker noises composed in an
additive model. The results of the proposed method were compared to those of other methods
using three different metrics including (i) fifth percentile ranges in velocity biases, (ii)
sensitivity versus specificity and (iii) TP (true positive), FP (false positive) and FN (false
negative) ratios. The results indicated that the method had an equivalent offset detection
threshold of 5.7 mm and fifth percentile range (5% to 95%) in velocity biases were equal to
1.24 mm/year. Meanwhile, the sensitivity and 1-specificity values were 0.54 and 0.28,
respectively. Furthermore, the offsets detected by this method were split into 34.3% of TP,
36.5% of FP and 29.2% of FN. Consequently, based on these metrics, the proposed method
offered the best results among all tested solutions.
KEYWORDS: Discrete wavelet transform, GPS time-series, Maximal overlap discrete
wavelet transform, Offset detection

Regional gravity-field modeling combining terrestrial and SGG-derived
surface residual gravity disturbances based on least-squares collocation
Saadat, S.A.1, Safari, A.2, Pitoňák, M.3, Moritz Rexer4, Cheraghi, H.1, Djamour, Y.1, Arabi, S.1,
Nankali, H.1 and Tavakoli, F.1
1National Cartographic Center (NCC), Meraj Avenue, Azadi Square, Tehran, Iran 2School of Surveying and Geospatial Engineering, College of Engineering, University of Tehran,
Tehran, Iran 3NTIS - New Technologies for the Information Society, Faculty of Applied Sciences, University
of West Bohemia, Technická 8, 306 14 Plzeň, Czech Republic 4Institute for Astronomical and Physical Geodesy, Institute for Advanced Study, Technische
Universität München, Arcisstrasse 21, 80333 Munich, Germany
Gravity of the Earth has main role in many geosciences such as geodesy and geophysics.
Gravity field recovery of the void areas, where the terrestrial gravity data are not available is
very important, because gravity surveys are difficult in some regions like inaccessible deserts
or mountainous areas. In this study the regional gravity field modelling of the Earth is done
by combining surface gravity disturbances and satellite gravity gradiometry (SGG) data
based on the least-squares collocation (LSC) over the void areas in Iran, where the existing
gravity data are not intensified or available. The gravity disturbances are obtained at
minimum geocentric sphere, which is inside the topographic masses by joint inversion of the
four high-accuracy components (Vxx, Vyy, Vzz, Vxz) of the GOCE SGG data using second
derivatives of the Hotine integral. The GOCE-only global geopotential model (GGM)
GO_CONS_GCF_2_TIM_R5 up to degree and order 60 is applied to reduce the effect of the
omitted distant-zone, which is restored after calculation. The residual terrain model (RTM) is
removed to estimate the effect of omission error of the GGM and provide mass-free space
outside the boundary surface. The GOCE-based gravity disturbances at minimum geocentric
sphere are continued upward on the Earth's surface based on planar approximation of the
Poisson integral and subtracted from terrestrial gravity measurements to compute the residual
gravity disturbances. The surface residual gravity disturbances are gridded in different cell-
sizes according to the distribution of input gravity data and the locations of the empty cells
that represent the void areas are determined. The height-uncorrelated residual values are
applied to predict the residual gravity disturbance for every empty cell based on the LSC
method using analytical local covariance function. The calculated results yielded an
improvement of about 18.1% to 24.6% in gravity field recovery compared to the only RTM-
corrected GGM-based solutions for two selected test areas in Iran.
KEYWORDS: Gravity field recovery, GOCE gradiometry data, Hotine integral, void area,
Iran
Geochemical Multivariate Outlier Detection in Compositional Data
Simin Saadati1, Omid Asghari1, Mohammad Fahimi Nia1
1Faculty of Mining Engineering, University of Tehran, Tehran, Iran
E-mail: [email protected]
Compositional data and mostly geochemical data have the kind of information that is
relatively connected rather than being absolute. Multivariate outlier detection methods
indicate the benefits of transformation in data to distinguish potential outliers more
efficiently. In this article, we use isometric log-ratio (ilr) transformation, which seems to be
the most effective method to result in reasonable outcome practically and theoretically.
Interpretation of distant elements and also deciding on their outlyingness is complex;
therefore, methods suggested in this case consider residential data in multivariate database
using single variable scatter plots, maps, and plots. Considering three methods, outlier
detection is one of the principles in multivariate data analysis. Compositional data or
multivariate data sets are positive values which are constant in the sum. In practice, standard
statistical methods can be obscure if applied directly to the original data. Therefore, the
isometric logratio (ilr) is introduced for its one-to-one transformations of compositional data
into the real space. Three methods of detecting outliers are applied to the data. First, we tried
using a method from PCA family called Sign function, which stands for Modified Principal
Component Analysis. In this method, the data is modified by the statistical mean of the data.
In the second method, the estimated covariance of the data is used to allocate a distance to
each observation demonstrating how far the observation is from the center of the data cloud.
This distance measure is called robust Mahalanobis distance (MCD) in which robust distance
is used as the estimator. The third method is the robust Mahalanobis distance which is applied
to transformed data by isometric logratio (ilr). The data used in this case is Sarigunay
epithermal gold deposit which is analyzed using these three methods. It is located within a
mildly alkaline latitic to trachytic volcanic complex in central-northwest Iran. Including 1054
observation in 15 different variables and mainly focusing on Au paragenesis, it shows various
outlier portions. Using Sign function 55% of whole observations are indicated as outliers,
which is 53% for robust Mahalanobis distance before transformation and 6% for robust
Mahalanobis distance after transformation in compositional data.
KEYWORDS: Compositiona data; Mahalanobis; Multivariate analysis; Sarigunay

The Morphology of transported gold grains, Case Study: Razligh Stream,
Sarab, NW of Iran
Khan Mohammadi, A.1, Mirmohammadi, M.1 and Meshkani, A.1
1 University of Tehran, School of Mining Engineering
E-mail: [email protected]
Placer is first used as a place where gold can be extracted from sand. Now, the term placer is
a deposit made from sand and other clastic sediments that contain valuable mineral or
minerals, which are collected by weathering or mechanical processes. The necessary
conditions for formation of placer deposits are existence of valuable mineral in source areas,
which is relatively heavy and it’s resistant to weathering and abrasion. Second, separation of
minerals from gangue and third is ore concentration in local areas. Since gold is a heavy
mineral and it's also resistant to weathering, the study of gold deposits can yield results. The
studied area is located between 37°56'55"N- 47°33'37"E and 38°00'13"N- 47°30'30"E
coordinates. Based on geological studies and maps, Neogene volcanic rocks include andesite,
trachyte, and dacite and also Eocene shale and ignimbrite are most important rock types at
Sarab area. There are two main faults that divide north part of Sarab into gold-bearing and
without gold placers. In this study, totally 44 samples were taken along Razligh Stream that
surprisingly 34 samples of them had gold grains. The total number of gold grains are 210 and
among all of them the largest of grains was 1284 microns and smallest was 49 microns in
size. Morphological Study on recovered gold grains shows that sphericity (Krumbein Index)
and roundness are functions of transported istance from source and generally they have direct
relationship with each other. Relationship between minimum krumbein index of gold grains
and transported distance from source along Razligh stream is defined in the equation (1);
Pearson correlation between them is 0.493 and p-value or Sig is 0.004.
Which X is distance from sample with maximum elevation on Razligh stream profile,
Relationship between minimum roundness of gold grains and transported distance from
source is defined in the equation (2) along Razligh stream; Pearson correlation between them
is 0.469 and pvalue or Sig is 0.007.
(1) Min Sphericity = 1 - 1 / (X ^ 0.167765)
(2) Min Roundness = 6.76883e-009 × X ^ 2 +0.592372
Which X is distance from sample with maximum elevation on Razligh stream profile, Mean
and median roundness of gold grains are 0.71 and 0.73 respectively. The result of this study
based on roundness index and krumbein index of sphericity and their relationships with
transported distance shows that studied gold grains may originated from one or more gold
deposits located at radius of about 5km. According to previous morphological studies on
Razligh stream gold grains particularly flatness index of grains confirms this allegation.
KEYWORDS: Gold grains; Morphology; Placer gold deposit; Roundness; Sarab; Sphericity

Geochemical modeling and hydrothermal alteration mapping in Sonajil
Cu-Au alkaline porphyry prospect area, NW Iran
Safari, M.1, Hezarkhani, A.1, Esmaeillzadeh, N.2
1Department of Mining and Metallurgical Engineering, Amirkabir University of Technology.
2Department of Mining Engineering, Sahand University of Technology
E-mail: [email protected]
The Sonajil porphyry, in the Ahar-Arasbaran volcanic belt which is the most potential
metallogenic province in NW of Iran for porphyry and epithermal gold and copper
mineralization. The oldest rocks exposed in the Sonajil area are a sequence of Eocene tuffs
with intercalations of andesite and andesitic breccia. The Sonajil porphyritic stock with a
variant composition from quartz-monzonite to granodiorite due to different intrusive phases
has been emplaced within the Eocene andesitic sequence and followed by the Incheh
Oligocene granitoid emplacement in the north of Sonajil stock. Several dykes and veins of
Incheh have penetrated into the Sonajil porphyry subsequently. The youngest rock units in
the study area are the recent terraces and river deposits and a thick basaltic lava flow erupted
at the center of porphyry system and covered a significant area. Rocks in the study area were
subjected to intense hydrothermal alteration due to several intrusion phases. Potassic
alteration is presented at the surface as small patches traced to 100m depth in the drilling core
logs. Phyllic alteration is widespread in the surface and it is the prominent type of alteration
in the borehole. Propylitic alteration is almost absent at surface and in depth has small
footprints; and finally, argillic alteration have been recognized almost in all the area
especially near the potassic outcrops. Argillic alteration shows hypogene origin rather than
supergene since montmorionite is a widespread mineral in argillic alteration within the study
area and jarosite is absent.
The current study investigates the petrochemistry and Cu mineralization in the Sonajil
porphyry based on the drilling core samples. Statistical analysis approach (fractal modeling
and element chemical behavior modeling) have been carried out to delineate the anomal
subpopulation in the drilling core samples. According to results, a set of criteria is defined for
mineralized samples population in the study area. In purpose of mapping hydrothermally
altered zones in the study area and defining targets for further exploration, a remote sensing
study based on ASTER remotely sensed data carried out. Conventional mapping techniques
such as band ratioing, principle component analysis and matched filtering are used to map
clay minerals and separate the different alteration zones. Based on the field surveys
alterations in the study area are classified to three types (intense, intermediate and weak) with
respect to presence of clay minerals then the average spectra for each of the alteration classes
are calculated. The average spectra of these three classes were used to find the minerals
presented in each of the classes, then the detected minerals were used as endmembers to map
the study area.

Geochemical studies demonstrate that Cu mineralization in depth occurs from 50m to 200m
and mostly hosted by andesitic and quartz dioritic rocks which are subjected to potassic
alteration. The main mineralization is the chalcopyrite veins and veinlets that are
accompanied by bornite, covellite and chalcocite ore minerals. Lower Cu grades are observed
in the phyllic alteration and a small number of high grade Cu samples are in andesitic tuffs
with propylitic alteration. The Sonajil Porphyry lacks a considerable supergene zone because
of a wide impenetrable basaltic lava cap which inhibits circulation of meteoritic water
beneath and low sulfide-bearing minerals such as pyrite in hypogene zone and subsequently
low acid production to leach the Cu in the supergene zone. The petrological composition and
mineralization style in hypogene zone indicates that the Sonajil is an alkaline Cu-Au
porphyry system with sub-economic Cu grade due to lack of initial Cu concentration in the
magmatic fluids and latterly intruding Incheh dykes into the Sonajil stock which prevented
hydrothermal ore-bearing fluids to circulate in adjacent rocks and depositing Cu.
KEYWORDS: Sonajil, Porphyry System, ASTER, Hydrothermal Alteration, Gold Vein

Detecting rare earth elements using reflectance spectroscopy; a case study
of esfordi phosphate deposit, central Iran
Karimzadeh, Z.1*, Tangestani, M. H.1 and Modabberi, S.2
1Department of Earth Sciences, Faculty of Sciences, Shiraz University, Shiraz, Iran
2Department of Economic Geology, School of Geology, University of Tehran, Tehran, Iran
E-mail: [email protected]
Modern-day devices, transport, computer, and telecommunication technologies require
increasing supply of rare earth elements (REEs). As a consequence, adequate and robust
detection methods become essential for exploration and discovery of new deposits of REEs,
the improved characterization of existing deposits, and the future recycling of today’s high-
tech products. REEs display diagnostic absorption features in visible to shortwave infrared
(VNIR-SWIR) reflectance spectra. Neodymium (Nd) has the most prominent absorption
features in VNIR region and, as a whole, could be a key pathfinder for REEs. This study is an
effort to detect REEs in Esfordi phosphate deposit, 36 Km northeast of Bafgh, Iran, by using
hyperspectral spectroscopy. This deposit is hosted in Precambrian-Cambrian volcano-
sedimentary rocks with 16.5 million tones of phosphate minerals and avarage grade of 13.9%
P2O5. The litratures show that the avarage grade of total rare earth oxides in this deposit is
1.2%. Among the 60 field samples of surface outcrops, 10 samples were collected from
rhyolitic and dioritic rocks, altered zones consisting of actinolite, epidote, kaolinite and
limonite, veins of chalky white, maroon-red and yellowish green phosphate minerals and fine
grain apatite hosted in green metasomatite zone for petrographic studies and laboratory
spectroscopy. Spectral analysis of chalky white, maroon-red and yellowish green apatite, and
fine grain apatite indicated the Nd absorption features centered near 583, 744, 802, and 871
nm. To evaluate these findings, the selected samples were analyzed by inductively coupled
plasma-mass spectrometry (ICP-MS) technique for rare earth elements. The concentrations of
Nd were 92 to 1677.14 ppm and for REE, it was 188.26 to 9521.82 ppm. The Nd absorption
features correlate positively with whole-rock Nd contents. It was demonstrated that Nd
absorption features were only detected in samples with Nd concentrations >1,000 ppm. The
result of this study was a qualitative outcrop map that highlights enriched zones of
neodymium. It was concluded that reflectance spectroscopy is a nondestructive, time and
cost-saving method for determining neodymium at outcrops, and could be conducted in the
field and drill core libraries as well.
KEYWORDS: Rare earth elements; Reflectance spectroscopy; Neodymium; Esfordi
phosphate deposit.

Processing of ASTER satellite imagery for detecting iron oxides in
Almobolagh Mountain, West Hamadan, Iran
Moradpour, H.1, Rostami Paydar, G.2, Valizadeh Kamran, K.3, and Bakhtiar Feizizadeh.3
1Faculty of Planning and Environmental Sciences, Tabriz University, Iran. 2 Department of geology, Ahvaz Branch, Islamic Azad University, Ahvaz, Iran. 3 Department of Remote Sensing and Geographical Information Systems, Faculty of Planning and
Environmental Sciences, Tabriz University, Iran.
E-mail: [email protected]
The provinces of Hamedan, Kurdistan, and Kermanshah in western Iran contain more than 10
iron ore deposits, which some of them are in operation. These reserves are largely different
from other sources of iron in other regions of Iran, especially in central Iran. The Babali iron
deposit is located about 60 km west, Southwest of Hamedan and near the Almobolagh
Mountain. This range is located in the Sanandaj-Sirjan (SSZ) dynamic geologic zone, which
has occurred due to the history and events of tectono-magmatism, in which extensive
alterations have occurred along with iron mineralization. The data of these studies belong to
the terrestrial satellite ASTER sensor, which has been processed by the integration of bands
(VNIR + SWIR) and utilizing the software ENVI 5.3. This study aims to investigate various
measuring techniques on ASTER image sensors which are intended to represent images for
the exploration of iron ore deposits of this region. The method of false-color combination
(FCC), relative absorption band imaging (RBD) and Matched Filtering (MF) method was
used to determine alteration mapping, mineralogical and geological evidence. The alteration
types exist in volcanic-sedimentary units as well as around the semi-deep igneous bodies.
Propyilitic alteration is the most characteristic alteration. This phenomenon is widely
observed in the diorite, granitic and kalaoinite rocks of the Almobolagh Mountain and Babali
mine region. Argillic alteration is often in the outbreak of some rhyolitic masses and acidic
Tuffs. In the RBD method, argillic alteration from the band (4+7)/5, propylitic (6+9)/8 and
Philic (5+7)/6 were used. In the FCC method for the identification of the gossan, the
alteration and the host rock from the combination R:4/2 G:4/5 B:5/6 and for the silica and
Fe2+ of the combination R:14/12, G:(1/2)+(5/3), B:MNF band 1 and for the alteration zone
in the area of the combination was R:9/8, G:4/3, R:2/1. In the MF method, minerals with iron
oxide compounds such as hematite, magnetite, Jarosite, goethite, and siderite were used to
investigate iron oxide. Finally, the southern and southwestern parts of the Almobolagh
Mountain are recommended for priority exploration in the region.
KEYWORDS: Almobolagh Mountain, iron oxide, ASTER data, FCC, RBD, MF

Towards a comprehensive geodynamic evolution of Northern Sistan (E.
Iran)
Agard, P.1, Jentzer, M.1, Whitechurch, H.2, Fournier, M.1, Omrani, J.3, Bonnet, G.4,
Zarrinkoub, MH.5, Mahdi Khatib, MM.5
1Sorbonne Universités, UPMC Univ Paris06, ISTEP, Institut des Sciences de la Terre de Paris, France 2Ecole et observatoire des sciences de la Terre (EOST), University of Strasbourg, France 3Geological Survey of Iran 4Dept. of Geology, Faculty of Sciences, University of Birjand, Birjand, Iran 5Dept. of Earth Science, University of California, Santa Barbara, USA
The diachronous closure of the Neotethyan realm, from the Alps to the Himalayas, led to the
formation of numerous mountain belts. The Sistan belt, which stretches N-S across ~700 km,
preserves extensive ophiolite fragments, is still poorly documented and is oriented at odds
with respect to the other major adjacent structures like Zagros, Makran or Alborz. Five mains
domains have been recognized in Sistan in the early 1980s: the Afghan and Lut continental
blocks, the Neh and Ratuk ophiolitic complexes (respectively slightly and highly
metamorphosed, the latter at high pressure low temperature conditions) and the overlying
Sefidabeh basin. Currently, only local petrological and stratigraphic studies exist but the
overall structure is still elusive and its geodynamic history is largely debated. In order to
refine the tectonic style of each domain and their mutual relationships, detailed field
investigations were performed in the northern part of the Sistan belt.
Eleven representative cross sections, from the km to 10 km-scale, are combined into two
largescale (~200 km long) comprehensive sections across Northern Sistan. These notably
indicate that (1) the main vergence concords with a north-east dipping subduction polarity,
(2) the Neh complex is a large-scale obducted ophiolite thrust onto the Lut block and (3) the
migration of the deformation is essentially en sequence.
Metamorphic investigations (1) reveal for the first time the existence of a metamorphic sole
in Sistan in support of intra-oceanic subduction (with P-T conditions around 700°C-0.7 GPa)
and evidence for subordinate intra-oceanic slicing, (2) constrain the extent of burial in
sedimentary basins through estimation of their maximum temperatures (~250°C, via
RAMAN spectroscopy on organic matter)and (3) document an older, much higher
temperature event affecting former sediments of the Lut block (which we tentatively relate to
the rifting stage). Petrological investigations on magmatic rocks reveal that (1) the ophiolite
structure is that of an ultra-low spreading ocean and that (2) Upper Cretaceous magmatic
rocks located on the Afghan block correspond to a calc-alkaline low-K magmatic arc
associated with north-east dipping subduction.
These structural and petrological data, together with those of previous studies, allow to
propose a refined geodynamic evolution for Northern Sistan, whose main stages are: a rifting
stage prior to the Barremian, active spreading during the Aptian-Albian, onset of NE-dipping
subduction during the Turonian, intra-oceanic subduction and inception of obduction during
the late Campanian to Maastrichtien and onset of ‘soft’ collision during the early Eocene.
Soft collision, together with ongoing mostly strike-slip deformation since the mid-Miocene,

make Northern Sistan a key, well preserved, ‘frozen-in’ example of the progressive evolution
from subduction to collision.

The Eocene to Oligocene High-K intrusions in Lut block-East of Iran:
implication of Eastern Iran Magmatic Belt’s tectonomagmatic evolution
Omidianfar, S.1, Monsef, I.2, Rahgoshay, M.1, Zheng, J.3 and Cousens, B.4
1Faculty of Earth Sciences, Shahid Beheshti University, Tehran, Iran 2Department of Earth Sciences, Institute for Advanced Studies in Basic Sciences (IASBS),
Zanjan 45137-66731, Iran 3State Key Laboratory of Geological Processes and Mineral Resources, School of Earth Sciences,
China University of Geoscience, Wuhan, China 4Ottawa-Carleton Geoscience Centre, Department of Earth Sciences, Carleton University, 1125
Colonel By Drive, Ottawa, ON., K1S 5B6,Canada
The studying intrusion is well-exposed in the south Birjand around the Koudakan which
herein compared to previously studied outcrops along the Eastern Iran Magmatic Belt. This
pluton is composed mainly of diorite, monzodiorite, tonalite, granodiorite, and granite with
high-K calcalkaline to shoshonitic affinities. The U-Pb zircon geochronology from
monzodiorite and tonalite rocks reveals the crystallization ages of 41.7 ± 3.4 to 37.88 ± 0.77
Ma (Bartonian). The chondrite and primitive mantle normalized rare earth and trace elements
patterns show enrichment in the light rare earth elements, K, Rb, Cs, Pb, Th, and U and
depletion in heavy rare earth elements, Nb, Zr, and Ti. The studying samples have low values
of εNd(i) (+1.32 to +1.68), and high 87Sr/86Sr(i) ratios (0.7044 to 0.7047) indicating mantle
derived melts isotopically similar to the Island Arc Basalts (IAB). These isotopic and
geochemical signatures indicate an enriched mantle source for these rocks and thus indicate a
contribution of subducted slab component to their mantle source. Additionally, the Nd-Sr
isotopic modeling suggests less assimilation (~ 5 to 10%) of upper continental crust by
juvenile mantle melts. Our new geochemical, isotopic, and geochronological studies plus
taking into account other regional geological evidence indicate that the Koudakan intrusion
like other Eocene to Oligocene granitoids in Lut block formed in a post-collisional tectonic
environment. We suggest northeastward subduction of the Neo-Tethys Ocean beneath the Lut
block caused the mantle wedge to be enriched by the slab components. At a later stage, a
collision between the Lut and Afghan blocks was accompanied by lithospheric delamination,
and subsequent asthenospheric upwelling led to melting of metasomatized mantle and
generation of Eocene to Oligocene intrusive bodies in the Eastern Iran Magmatic Belt.

Middle Jurassic compressional to extensional tectonics of the Sanandaj-
Sirjan magmatic arc revealed by S-type granites Maghdour-Mashhour, R.1 & Ali Tabbakh Shabani, A.2
1School of Geosciences, Faculty of Science, University of the Witwatersrand, Johannesburg,
South Africa 2Faculty of Earth Sciences, Kharazmi University, Tehran, Iran
E-mail: [email protected]
The Sanandaj-Sirjan Magmatic Arc (SSMA) of Iran is situated in the southwestern margin of
Eurasia. It is a NW trending orogenic belt mainly of Mesozoic age. Subduction initiation
beneath the SSMA and consequent arc magmatism occurs in Jurassic. The first half of
Jurassic is a time during which thick sequences ranging from continental to marine deposits
and volcanic rich flysch are accommodated on the SSMA (Hassanzadeh and Wernicke,
2016). The mid-Jurassic is, on the other hand, represented by a peak in calc-alkaline arc
magmatism which accompanies with polyphase metamorphism of magmatic and sedimentary
succession in deep basins. The Jurassic deposits are reported to be overlain unconformably by
unmetamorphosed Cretaceous limestones. In spite of a plethora of studies for almost half a
century, the state of stress within the SSMA during the Jurassic has still remained elusive
(Hassanzadeh and Wernicke, 2016) and no explanatory picture, to best of our knowledge, is
available to our geological society. S-type granites in orogenic belts could be regarded as
paleo-geodynamic black-boxes of the continental lithosphere. S-type granites herald the
initiation of slab roll-back phase and subsequent extensional backarc systems. On the other
hand, thickening of a preexisting, sediment-dominated backarc basin is a prerequisite for their
generation (Collins and Richards, 2008). In this study, petrogenesis of two S-type granitoids
from the peak magmatic phase (i.e. mid-Jurassic Kolah-Ghazi and Shir-Kuh S-type
granitoids; KGG and SKG hereafter) are revisited to deduce the geodynamic evolution of the
SSMA during the Jurassic. Both KGG and SKG consist of a complete compositional
spectrum of typical S-type granitoids: granodiorite, monzogranite and syenogranite. It is
interpreted by previous researchers (Bayati et al. 2017; Sheibi et al., 2010) that the
leucocratic rocks evolved from more mafic parental magma through fractional crystallization.
However, our detailed inspection on the trace element concentrations of these S-type granites
exhibits positive correlation with maficity index (atomic Fe+Mg). This evidence along with
the presence of the peritectic garnet and cordierite in mafic rocks (e.g. granodiorite) indicate
that the leucocratic portions (syenogranite) of these plutons have not arisen through fractional
crystallization of mantle-derived mafic magmas, as the syenogranite would have inherited the
zircon-saturated character of the hypothetical earlier mafic magma (e.g. Villaros et al., 2009).
In fact, the peraluminous, S-type KGG and SKG are the product of biotite incongruent
melting of a metasedimentary crustal source. Syenogranites represent melts from the
anatectic source and more mafic varieties such as granodiorites and monzogranites are
typically saturated with regard to zircon and represent mixtures of melt and peritectic phase
such as garnet. Disequilibrium melting and accessory phase entrainment in the source is a
process that requires a metasedimentary source buried deep enough in the crust before
anatexis. Flat subduction, subsequent backarc compression and structural thickening of
previously formed back-arc turbidite deposits on the over-riding plate are envisaged to

provide an optimum depth for anatexis in arc environments. Therefore, we suggest that
Jurassic evolution history of the SSMA had been dominated by extensional arc environment
which interrupted by a compressional regime during the late mid-Jurassic.
KEYWORDS: S-type granite; Sanandaj-Sirjan Magmatic Arc; Iran

A new magmatic map of Iranian plateau as constrained by susceptibility
map of Iran
Ghods, A.1, Teknik, V.1, and Monsef, I.1
1Department of Earth Sciences, Institute for Advanced Studies in Basic Sciences (IASBS),
Zanjan, Iran
The Iranian plateau is one of the most complex geodynamic setting within the Alpine-Zagros-
Himalayan orogenic belt. The subduction of Neo-Tethys Ocean is responsible for the
formation of the Late Cretaceous Neo-Tethyan ophiolites and Cenozoic magmatic belts
within the Iranian plateau. In this paper, we report a new method to track the Cenozoic
magmatic flare-ups and Neo-Tethyan ophiolites by aeromagnetic data. We present a new map
of crustal susceptibility calculated by a radially averaged power spectrum method. High
susceptibility regions correlate with the outcrops of magmatic and ophiolitic rocks, and low
susceptibility regions coincide with the sedimentary basins. Although, sedimentary cover
impedes visual identification of the Northeast Iran Magmatic Belt and Eastern Iran Magmatic
Belt, but we could trace these belts southwestward into the Great Kavir plain and southward
into the Lut plain, respectively. We could also show that the trend of the Urumieh-Dokhtar
Magmatic Belt does not continue directly towards its northern part and this trend jumps in
arc-trench distance towards Alborz-Azerbaijan Magmatic Belt. The narrower width of the
Urumieh-Dokhtar Magmatic Belt implies a steeper dip of the subducted slab (~ 60º dip)
during Eocene to Oligocene time. By contrast, the wider width of the Alborz-Azerbaijan
Magmatic Belt suggests a gentler dip of the subducted slab (~ 35º dip). Additionally, we can
identify hitherto unknown two parallel arc-shaped magmatic and ophiolitic belts in eastern
Iran named as the Southern and Northern Sistan Magmatic Belts.

Uncertainties in seismic sources and their effects of seismic hazard Analysis
Talebian, M.1
1Research Institute for Earth Sciences, Geological Survey of Iran
Uncertainties are unavoidable in design and planning of an engineering system. Therefore,
the tools of engineering analysis often include methods and concepts for evaluating the
significant of uncertainty on system performance. Probability is the conceptual and
theoretical basis for modelling and analysing such uncertainties. A significant role of
Probabilistic Seismic Hazard Analysis (PSHA) method lies in its unified framework for
quantitative analysis of theoretical uncertainty and assessment of associated risk. However,
less attention often paid to epistemic uncertainties associated with seismic sources. A simple
way of taking into account such uncertainties is to define logic trees and quantify the
uncertainty associated with the inputs to PSHA. However, there are many potential threats in
setting up a logic tree, mainly related to the fact that in practice the weight associated with
each branch is questionable.
Special care has to be taken to protect results from being biased by unreliable information.
Unfortunately, it is very common to rely of earthquake catalogues for defining seismicity
parameters. An incomplete catalogue, which covers short period of time comparing to return
period of earthquakes, could highly mislead especially on defining frequency of larger events
or the maximum expected magnitude. An example of such inconsistency is the north Tabriz
fault which has no instrumental record of major activity despite showing high rate of slip.
There are many statistical methods for evaluating maximum expected magnitude of
earthquake. Output of such calculations may vary by about one unite depending on
assumptions and quality of inputs. In addition, errors in locations of 30 kilometres or more
are very common for earlier period of instrumental records, leading to misevaluation of
seismicity parameters.
Geometry of both exposed and hidden faults have great effects on PSHA results. A structure
located on hanging wall of a fault receive higher ground acceleration by factor of up to 2,
comparing to those on footwall. Damage due to activation of a blind fault can occur in wider
region (2-3 times) depending on depth and slop of the buried fault.
A very crucial character of an active fault is its slip rate. It is essential to define slip rate of
the faults by geological and geodetic studies. Space based geodetic observations have
potential to provide general pattern of movements, while Paleseismological studies often
concentrate on more detailed activity of individual faults. It is important to accompany these
studies with geomorphologic observations which present longer history of deformation.
Finally, in order to obtain a reliable seismic hazard analysis, it is important to exclude
unreliable source of information from PSHA analysis and perform comprehensive multi
discipline study of active sources.

Synthetic earthquake catalogs simulating seismic activity in NW Iran fault
system
Rastbood, A.1, Bulghar, R.2, Ghanouni, B.3 and Ghasemzadeh, A.4
1Assistant Professor, Tabriz University, Tabriz, Iran 2MsC Student, Tabriz University, Tabriz, Iran 3 MsC Student, Tabriz University, Tabriz, Iran 4 BsC Student, Tabriz University, Tabriz, Iran
E-mail: [email protected]
The characteristic earthquake hypothesis is the basis of time-dependent modeling of
earthquake recurrence on major faults. However, the characteristic earthquake hypothesis is
not strongly supported by observational data. Few fault segments have long historical or
paleo-seismic records of individually dated ruptures, and when data and parameter
uncertainties are allowed for, the form of the recurrence distribution is difficult to establish.
This is the case, for instance, of the North Tabriz Fault System, for which only few
characteristic earthquakes are reported for individual fault segments. The use of a physics-
based earthquake simulator has allowed the production of catalogs lasting 100,000 years and
containing more than 500,000 events of magnitudes ≥ 4.0. The main features of our
simulation algorithm are (1) an average slip rate released by earthquakes for every single
segment in the investigated fault system, (2) heuristic procedures for rupture growth and stop,
leading to a self-organized earthquake magnitude distribution, (3) the interaction between
earthquake sources, and (4) the effect of minor earthquakes in redistributing stress. The
application of our simulation algorithm to the NTF has shown realistic features in time,
space, and magnitude behavior of the seismicity. These features include long-term periodicity
of strong earthquakes, short-term clustering of both strong and smaller events, and a realistic
earthquake magnitude distribution departing from the Gutenberg-Richter distribution in the
higher-magnitude range. One of the main ingredients of our simulation algorithm is the
imposition of an average slip rate released by earthquakes to each one of the segments
recognized in the investigated fault system. This slip rate is derived from a combination of
geological and geodetic observations, and in particular comparison of GPS measurements
with old triangulations. Although no constraint is made to the propagation of the fracture
across different segments during an earthquake, the result of the longterm slip released by the
simulated seismic activity matches the imposed slip rate quite well. There are no intrinsic
limitations in the model to adopt a continuous slip rate distribution instead of introducing
discontinuities imposed by the fault system segmentation. The frequency-magnitude
distribution of the earthquakes reported in our synthetic catalogs is consistent with the
frequencymagnitude distribution obtained from real observations.
KEYWORDS: Earthquake Simulator Algorithm; Synthetic Catalogs

Slip distribution of two moderate earthquakes occurred in Iran from finite
fault modeling
Bazargan, S.1, Shomali, Z.H.2,3, and Rezapour, M.2
1University of Zanjan, Department of Physics
2University of Tehran, Institute of Geophysics
3Uppsala University, Department of Earth Science
E-mail: [email protected]
The slip distribution of two moderate earthquakes occurred in Iran, the 2007 June 18 Mw 5.5
Kahak and 2010 September 27 Mw 5.9 Kazerun earthquakes, were estimated from regional
broadband seismic data using constrained non-negative least squares linear slip inversion
method. A rupture velocity of 2.8 km/s and rise time of 1.4 sec were utilized for the first
event, and 2.5 km/s and 2.2 sec were used for the second one. Results show a rupture with
peak slip of 8.0 and 35.0 cm for the Kahak and the Kazerun earthquakes, respectively.
Because of the non-uniqueness of the inversion problem, a set of solutions was acquired for
both events. To the best of our knowledge, this is the first time to consider linear finite-fault
inversion procedure for moderate earthquakes of Iran to model a set of slip histories at
regional distances.
KEYWORDS: finite-fault modeling, seismic data, slip inversion, the 2007 Kahak earthquake,
the 2010 Kazerun earthquake
Introduction
The tectonic of Iran is governed by convergent plate collisions along the Alpine-Himalayan
active belt (Berberian, 1981; Mirzaei et al. 1998). In this study, two earthquakes were chosen
from the two main seismotectonic provinces of Iran. The first event is the 2007 June 18 Mw
5.5 Kahak earthquake, which occurred in the Central-East Iran seismotectonic province, in
the vicinity of the Kahak district of Qom province. The other is the 2010 September 27 Mw
5.9 Kazerun earthquake situated in the Zagros seismotectonic province, near the Kazerun
County. The purpose of this study is to acquire finite-fault modeling of the broadband three-
component displacement waveforms of these earthquakes through a least-squares inversion
method for the spatial and temporal slip distribution.
Data
The data used in this study obtained from the national broadband seismic network operated
by the International Institute of Earthquake Engineering and Seismology of Iran (IIEES).
These data consist of 21 waveforms for the Kahak earthquake and 23 waveforms for the
Kazerun earthquake. The aftershocks of the corresponding earthquakes were taken from the
catalog of the Iranian Seismological Center (IRSC). The observed waveforms were filtered

and decimated from the original 50 to 10 samples per second. The instrument responses were
removed, and the data were then converted to displacement. A band-pass filter of 0.03-0.15
Hz for the first event and 0.05-0.07 Hz for the second one were applied to the displacement
waveforms.
Model Parameterization
Green’s functions were computed using the frequency-wavenumber integration code
(FKRPROG) developed by Saikia (1994). Also, the inversion algorithm applied to the
observed data is based on a stabilized constrained non-negative least-squares method
introduced by Hartzell and Heaton (1983).
Fault and subfault sizes are the first parameters constructing our parameterization. We found
that the equal-sized 1 km × 1 km subfaults for the first event and 2 km × 2 km subfaults for
the second one accommodate all of the slip distribution inside the given fault plane. Also,
different hypocenters reported by several seismological agencies, i.e., ISC, GCMT, USGS,
and EMSC were tested. If one nodal plane generates a better fit to the data, then it can be
construed as the fault plane (Abercrombie et al. 2001). With this in mind, the focal
mechanism (strike, dip, and rake) of faults estimated by USGS and GCMT were tested to find
the nodal plane with the best fit. The measure to choose the optimal result in all runs has been
total variance reduction demonstrating the fit between observed and synthetic data as well as
the final variance of the data misfit. For all hypocentral parameters of the Kahak earthquake,
the inversion found better fits with strike equals to 266˚ nodal plane of GCMT; thus, this
plane is the fault plane. For the Kazerun earthquake, GCMT focal mechanism having a fault
plane (strike, dip, rake: 301˚, 6˚, 100˚) provides the maximum fitting percentage. Therefore,
we used these nodal planes for the rest of the investigation.
The next important parameter is rupture velocity. The rupture velocity was assumed to be a
constant fraction of the shear wave velocity at the source area, and we tested different values
of this parameter in a range of 0.7 to 0.9 of the shear wave velocity. Stabilization constraints
i.e. moment minimization and smooth weight are other parameters in the inversion that
reduce instability or extreme complexity. To choose the optimal results, we tested different
amounts of these constraints to find the best values that yield a smooth slip model with the
minimum seismic moment (Hartzell and Heaton 1983).
The results for 2007 Kahak earthquake
The Kahak earthquake was chosen to be studied because there had not been any similar
earthquakes bigger than that (Mw 5.5) in a distance less than 140 kilometers, affecting
Tehran, the capital of Iran. The velocity model based on the study of Ashtari et al. (2005) was
used for this event. ISC hypocenter provided the best fit to the observed data with a
maximum total variance reduction of about 35 % for spatial and 54 % for spatiotemporal
distribution (not shown here). Hence, it was chosen as the preferred slip model of the Kahak
earthquake (Figure 1, top). Also, the rupture velocity of 2.8 km/s (78 percent of shear wave
velocity at the source area) provided the best fit to the data. According to different inversion
trials, optimum rise time was also chosen to be 1.4 sec.

The results for 2010 Kazerun earthquake
The 2010 Kazerun earthquake (Mw 5.9) has been the largest recorded earthquake in the
Kazerun region since 2000, and its aftershocks did not exceed the magnitude 4.3. The best fit
to the observed data (not shown here), with a maximum total variance reduction of about
52% was obtained with ISC hypocenter. The optimum rise time of 2.2 sec yielded the best fit
to the data with maximum total variance reduction and minimum variance. Velocity structure
based on the study of Hatzfeld et al. (2003) has been used for this earthquake and led to 2.5
km/s as the optimum rupture velocity.
Conclusion
This study presents a set of solutions for the Kahak and Kazerun earthquakes, and among
them, the ISC hypocenter and GCMT focal mechanism give the best spatial and
spatiotemporal distribution with maximum total variance reduction of 35% and 54%,
respectively, for the first event (Figure 1, top) and 52.2% for the spatial distribution of the
second event (Figure 1, bottom). According to the lots of inversion trials, rupture velocity
plays an indispensable role in the slip inversion. The observed data were re-inverted for
different rupture velocities. Figure 1 (right) shows analogies between the projected final
spatial distributions on the Earth's surface with the aftershock distribution. The squares depict
the whole region of the fault plane. Aftershocks are a phase of relaxing stress concentrations
result from the mainshock (Scholz 1990), and occurred near the western end of the slip
distribution for the Kahak event. There is also a predominance of aftershocks that surrounds
the majority of the slip for the Kazerun earthquake. As a whole, for both events, the
aftershocks distribute mostly outside of the asperity zone. Identical results have been
acquired in a good many studies such as Reasenberg and Ellsworth (1982) and Doser and
Kanamori (1986).

Figure 1. Slip distributions for the preferred finite-fault models for the a) Kahak and b) Kazerun
earthquake in the latitude-longitude coordinate (right) and along strike-dip directions (left). Dashed
squares (right) are presented the fault planes on the earth. Black stars show ISC hypocenters for both
events. The white circles refer to the aftershocks which occurred during the three months after the
mainshock. Generally, the aftershocks distribute outside of the asperity zone for both earthquakes.
The peak slip value of the first and second event are 8.0 and 35.0 cm, respectively.
References
Abercrombie, R.E., Bannister, S., Pancha, A., Webb, T.H. and Mori, J.J. [2001] Determination of
fault planes in a complex aftershock sequence using two-dimensional slip inversion. Geophysical
Journal International, 146, 134-142.
Ashtari, M., Hatzfeld, D. and Kamalian, N. [2005] Microseismicity in the region of Tehran.
Tectonophysics, 395, 193-208.

Berberian, M. [1981] Active faulting and tectonics of Iran. Zagros Hindu Kush Himalaya
Geodynamic Evolution, 33-69.
Doser, D.I., and Kanamori, H. [1986] Depth of seismicity in the Imperial Valley region (1977-1983)
and its relationship to heatflow, crustal structure, and the October 15, 1979 earthquake. Journal of
Geophysical Research: Solid Earth, 91(B1), 675-688.
Hartzell, S.H. and Heaton, T.H. [1983] Inversion of strong ground motion and teleseismic waveform
data for the fault rupture history of the 1979 Imperial Valley, California, earthquake. Bulletin of the
Seismological Society of America, 73, 1553-1583.
Hatzfeld, D., Tatar, M., Priestly, K., and Ghafory-Ashtiany, M. [2003] Seismological constraints on
the crustal structure beneath the Zagros Mountain belt (Iran). Geophysical Journal International, 155,
403- 410.
Mirzaei, N., Mengtan, G., and Yuntai, C. [1998] Seismic source regionalization for seismic zoning of
Iran: major seismotectonic provinces. Journal of Earthquake Prediction Research, 7, 465-495.
Reasenberg, P., and Ellsworth, W.L. [1982] Aftershocks of the Coyote Lake, California, earthquake
of August 6, 1979: A detailed study. Journal of Geophysical Research, 87(B13), 10637-10655.
Saikia, C.K. [1994] Modified frequency-wave-number algorithm for regional seismograms using
Filon’s quadrature–modeling of L(g) waves in eastern North America. Geophysical Journal
International, 118, 142–158.
Scholz, C.H. [1990] The mechanics of earthquakes and faulting. Cambridge University Press,
Cambridge.

Seismic imaging of the upper-mantle beneath the Zagros collision zone
Mahmoodabadi, M.1, Yaminifard, F.1,*, Tatar, M.1, Kaviani, A.2, Rümpker, G.2, Motaghi, K.3 1Seismological Research Center, International Institute of Earthquake Engineering and
Seismology, Iran. 2Institute of Geosciences, Goethe University, Frankfurt, Germany. 3Department of Earth Sciences, Institute for Advanced Studies in Basic Sciences, Iran.
*E-mail: [email protected]
One of the youngest orogenic belts, the Zagros orogeny in the northern margin of the Arabian
plate is formed during Arabia-Eurasia collision. Despite a number of studies, many questions
still remain open about the deep structure and dynamics of the collision zone. To figure out
the dynamics of the collision, we have used different seismological methods to investigate the
deep structure of the Zagros and its surrounding regions. First, to investigate upper mantle
processes related to the collision, a proper dataset consisting of 32738 P-wave and 4629 S-
wave relative arrival time residuals have been picked from distant earthquakes recorded in
129 seismic stations. The residual patterns are mapped as 3-D perturbations in P-wave
(Mahmoodabadi et al. 2019) and S-wave velocity using a nonlinear teleseismic tomography
method (Rawlinson et al. 2006). Then the lithospheric and uppermost mantle absolute S-wave
velocity structure beneath the northern Zagros and western Central Iran is estimated by
jointly inverting high frequency scattered wavefield observed in P-wave coda, together with
long period surface wave phase and group velocity dispersion data (Rahimi et al. 2014) using
a trans-dimensional Bayesian Markov Chain Monte Carlo approach (Bodin et al. 2012,
2014). To unravel the dynamical processes in the continental collision, it is important to
figure out the accommodation of convergence and the flow behaviors in the upper mantle.
We used an unprecedented dataset, consisted of 3260 core-refracted shear phases to probe the
fast polarization directions and delay times of shear waves propagating through anisotropic
structures beneath each seismic station using energy minimization of transverse components.
The absolute S-wave and relative P and S-wave velocity models, obtained by different data
sets and methods, show a thick (>150 km) high-velocity anomaly beneath the northern part of
the collision zone, which could be the thickened Zagros lithosphere that probably is
responsible for active continental shortening. A relatively thin lithosphere (~80 km) and
lower seismic velocity beneath the UDMA further NE may suggest that the lithospheric
mantle of Central Iran and Alborz has been weakened by upwelling of the hot asthenosphere
associated with slab break-off. Besides, the cumulative processes of Neotethyan flat-slab
subduction in the middle of Cretaceous, mantle preconditioning by dehydration of subducted
plate, slab roll back in the Eocene and tectonic erosion, driven by convective flow before the
collision, are partially responsible for the weakened mantle lithosphere beneath the Alborz
and Central Iran. The Quaternary volcanic activities in the Alborz could be the result of these
processes. We observe a segment of Neotethyan oceanic slab, which is detached from the
continental leading edge.
Our results suggest that the Arabian mantle lithosphere plays an important role in
accommodating the convergence between the Arabian and Eurasian plates. High seismic
activity to the west of the suture and lack of seismic activity to the east may support this
hypothesis. Besides, the presence of a narrow low-velocity anomaly between the Zagros and

SSZ lithosphere may suggest that the mantle lithosphere lid of the Zagros is delaminating
from the lower crust which prohibits transferring stress to the SSZ lithosphere causing lack of
tectonic activities in the edge of the overriding plate. Shear wave splitting observations
suggest that both lithosphere and asthenosphere have a contribution to the mantle anisotropy
over the plateau. A simple asthenospheric flow cannot justify the mantle anisotropy data in
the region. These observations show the possibility of a rotational flow around the Zagros
lithosphere which may confirm its thickening and deformation. Our observations suggest that
both simple-shear and pure-shear processes deform upper mantle beneath the Iranian plateau,
and in some areas, crust and mantle are deformed coherently through these processes.
KEYWORDS: Continental collision, Joint inversion, Mantle dynamics, Seismic tomography,
Shear-wave splitting, Zagros.
References
Bodin, T., Sambridge, M., Tkalčíc, H., Arroucau, P., Gallagher, K. & Rawlinson, N., 2012.
Transdimensional inversion of receiver functions and surface wave dispersion. J. Geophys.
Res.117(B02), 301.doi:10.1029/2011JB008560.
Bodin, T., Yuan, H. & Romanowicz, B., 2014. Inversion of receiver functions without deconvolution.
Geophys. J. Int.,196(2), 1025–1033, doi:10.1093/gji/ggt431.
Mahmoodabadi, M., Yaminifard, F., Tatar, M., Kaviani, A. & Motaghi, K., 2019. Upper mantle
velocity structure beneath the Zagros collision zone, Central Iran and Alborz from nonlinear
teleseismic tomography, Geophys. J. Int., 218(1), 414-428, doi:10.1093/gji/ggz160.
Rahimi, H., Hamzehloo, H., Vaccari, F. & Panza, G.F., 2014. Shear wave velocity tomography of the
lithosphere–asthenosphere system beneath the Iranian Plateau, Bull. seism. Soc. Am., 104(6), 2782–
2798.
Rawlinson, N., Reading, A.M. & Kennett, B.L.N., 2006. Lithospheric structure of Tasmania from a
novel formof teleseismic tomography, J. geophys. Res., 111(B2), doi:10.1029/2005JB003803.

High resolution tomographic images of the lithospheric structure of the
Iranian plateau
Irandoust, M.1, 2, Priestley, K.2, and Sobouti, F.1
1Department of Earth Sciences, Institute for Advanced Studies in Basic Sciences, Zanjan, Iran 2Bullard Laboratories, Department of Earth Sciences, University of Cambridge, Cambridge, UK
E-mail: [email protected]
The Arabian-Eurasian collision is similar to the Indo-Eurasian collision which has formed the
Himalayas and the Tibet, but the Arabian-Eurasian collisionis much younger, and studies of
the Zagros Mountains and the Iranian Plateau can provide clues to understanding the earlier
stages of continent-continent collision processes. We have studied the lithospheric structure
of the collision zone in Iran and obtained a high-resolution 3D shear wave velocity (Vs)
structure of the crust and uppermost mantleby joint inversion of fundamental mode Rayleigh
wave group velocity and P receiver functions (PRF). The surface wave measurements for the
periods range 5-70 s were extracted from two seismic data sets: ambient noise cross-
correlations and regional earthquakes recorded on 109 and 156 broadband stations,
respectively. From these measurements, we built Rayleigh wave tomographic maps including
both isotropic and azimuthal anisotropic terms for fundamental mode group velocity. Then,
PRFs calculated at 256 seismic stations were interpolated for a grid of 0.5° cell size, to
conduct ajoint receiver function/surface wave dispersioninversion for a uniform distribution
of nodes across Iran. The short period (<20 s) Rayleigh wave tomograms do not show aclear
anisortopic pattern, but at longer periods, the southern Zagros, central and eastern Iran, and
Kopeh-dagh show almost NE-SW anisotropictrends, while the northern part of Zagros shows
a NW-SE trend and anE-W orientation is dominant in the Alborz and NW Iran. The low Vs
anomalies of the upper crust correspond to regions ofthick sediments such as theZagros fold-
thrust belt, theMakran accretionary wedge, the South Caspian Basin, and the central desert of
Iran. The velocity structure of southernZagros is almost homogeneous atall levels of the
crust, but the low Vs anomaly beneath theLurestan separates the central Zagros from the
northernmost Zagros. The underplating of the Arabian Plate below the main faults of
theZagros (MRF and MZT) causing exhumation of crystalline rocks of the Sanandaj-Sirjan
Zone (SSZ), is one of the visible geodynamic structures of ourmodel. The high-velocity
structures of Central Alborz and Kopeh-Dagh area testament to their thickened crystalline
crust. From the strong gradients of the Vs at the crust-mantle boundary, we determine a new
Moho map for Iran (Fig. 1). There are strong correlations between thevariationsof
topography, crustal thickness, Bouguergravity anomaly, and the distribution of the major
fault systems across the Iranian Plateau. While the thickest parts of the crust are located under
the collisional belts of the Iranian plateau comprising the high Zagros, SSZ, Talesh, Alborz,
and Kopeh-dagh (>55 km), the regions of low deformationsuch as the Central Iran and the
Lut block, and also the regions of younger and active deformation such as the Makran wedge
and the simply folded belt of Zagros show the crustal thickness less than 45 km.
KEYWORDS: Iranian Plateau; Receiver function; Shear wave; Surface wave; Tomography;
Moho depth.
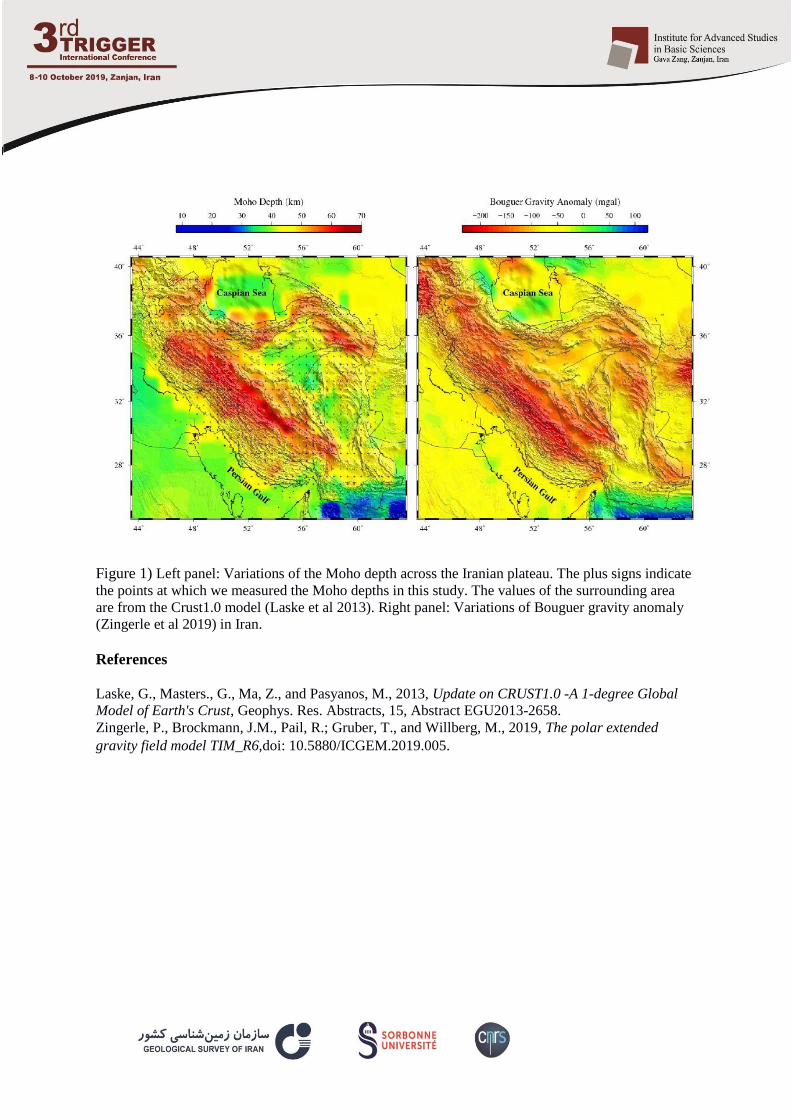
Figure 1) Left panel: Variations of the Moho depth across the Iranian plateau. The plus signs indicate
the points at which we measured the Moho depths in this study. The values of the surrounding area
are from the Crust1.0 model (Laske et al 2013). Right panel: Variations of Bouguer gravity anomaly
(Zingerle et al 2019) in Iran.
References
Laske, G., Masters., G., Ma, Z., and Pasyanos, M., 2013, Update on CRUST1.0 -A 1-degree Global
Model of Earth's Crust, Geophys. Res. Abstracts, 15, Abstract EGU2013-2658.
Zingerle, P., Brockmann, J.M., Pail, R.; Gruber, T., and Willberg, M., 2019, The polar extended
gravity field model TIM_R6,doi: 10.5880/ICGEM.2019.005.

Surface wave tomography of Rayleigh waves using the STP method in
Iranian Plateau
Mohammadi, N.1, 2, Gholami, A.1, Rahimi, H.1, and Aoudia, A.2
1Institute of Geophysics, University of Tehran, Tehran, Iran
2Earth System Physics Section, Abdus Salam International Centre for Theoretical Physics,
Trieste, Italy.
E-mail: [email protected]
Two dimensional surface wave travel time tomography is one of the most practical methods
to image the lateral variation of phase/group velocity. Although 2-D inversion is numerically
efficient, it does not consider the temporal dependency between periods and thus can lead to a
suboptimal phase/group velocity. To address this issue, we propose Simultaneous
Tomography of all Periods (STP) method. We consider the model parameters as a 3-D
volume of dimensions x, y and T, where the first two parameters are related to spatial
location of cells and T denotes period. Therefore the minimization problem is written as:
min‖𝐝 − 𝐆𝐦‖22 +𝜆Reg(𝐦) (1)
Where 𝐝 𝜖 ℝ𝑀 includes the data corresponding to all periods and is obtained by concatenating
travel times related to all periods one after another. Similarly, the model vector 𝐦 is formed
by concatenation of 𝐦𝑗 associated with each period and 𝐆 is the total sensitivity matrix
corresponding to all periods:
𝐝 = [
𝐝1
𝐝2
⋮𝐝𝑗
] 𝜖 ℝ𝑁 , 𝐦 = [
𝐦1
𝐦2
⋮𝐦𝑗
] 𝜖 ℝ𝑁 , 𝐆 =
[ 𝐆𝟏
0
0
𝐆2
0
0
⋯
⋯
0
0
0 0 𝐆3 ⋯ 0
⋮
0
⋮
0
⋮
0
⋱
⋯
⋮
𝐆𝑗 ]
In Eq. (1), Reg is the regularization functional and which plays a key role in this paper
because it is responsible for coupling the model parameters along the period. We consider
two types of the regularization in this paper: the traditional Tikhonov regularization
(Tikhonov & Arsenin 1977) and sparsity-promoting regularization. The former is used to
generate a flat model by minimizing the squared l2-norm of the model gradient while the
latter is used to force the sparsity of the model in the discrete cosine transform (DCT)

domain. Furthermore, we employ the split Bregman technique (Goldstein & Osher 2009) to
solve the minimization problem described by eq. (1) with the l1-norm regularization. The
performance of the proposed tomography methods is shown by applying it on both synthetic
and real group travel time data and then the results are compared with those obtained from
the 2-D tomography method. Figure 1 shows the synthetic group velocity tomography results
obtained from all tomography methods used in this study at period 30 s at noise level 10%. It
can be seen that the results of STP methods, particularly the sparse STP, are more similar to
the main model in comparison to the 2-D tomography. We also tested the proposed method
on real data including group velocity dispersion curves extracted from the local earthquakes
distributed inside Iran in the period of 2005-2016 and (Ms) range of 5 ≤ Ms ≤ 6.5 recorded by
the 19 broad-band stations of IIEES. Our results show that at periods less than 40 s with
sufficient ray path number, there are trivial differences between tomography images obtained
from the 2-D tomography and the smooth STP, while the tomography results of the spars STP
reveals more details and localizes similar features better. At longer periods, generally, STP
using DCT-sparsity regularization method resolves finer structures in a larger velocity
variation.
Figure 1. Synthetic group velocity tomography maps for period 30 s and noise level of 10%. (a)
The main synthetic group velocity model. (b) Tomography map obtained by the 2-D tomography. (c)
Tomography map obtained by the smooth STP method. (d) Tomography map obtained by the sparse
STP method.
In order to show how much each method affects the shear wave velocity model, using a non-
linear inversion based on Monte carlo search, we inverted local disperion curves estimated by
the all methods along a pofile studied by Motaghi et al., 2015 and compared the results with
their shear wave velocit model. They reported two low velocity anomalies beneath Cental
Iran that these are also visible in the shear velocity model obtained from local dispersion
curves calcultaed from the 2-D tomography with much more absolute values. However, shear
wave velocity models extracted by the STP methods show that they, particularly the sparse
one, are more able to reveal these low velocity anomalies.

Figure 2. The lithosphere-asthenosphere beneath profile AA' (a) the result presented by Motaghi et al.
2015, (b-d) shear wave velocity models obtained from 1-D inversion of dispersion curves estimated
by the 2-D tomography, the smooth STP and the sparse STP, respectively.
KEYWORDS: Inverse theory, Seismic tomography, Surface waves and free oscillations.

3-d modeling of the Tehran alluvial deposits using Active and Passive
Measurments: Premilinary results of Tehran experiments
Soltani, S.1, 2, Haghshenas, E.1, Guillier, B.2 and Cornou, C.2 1International Institute of Earthquake Engineering and Seisomlogy, Tehran, Iran 2ISTERRE, Grenoble, France
E-mail: [email protected]
Tehran is located in the Southern part of the central Alborz, the region with very high
seismicity due to the existence of several large active faults. On the other hand, the city is
built on a very thick alluvial deposits coming from the Alborz Mountains Range.
Large thickness of quaternary alluviums alongside with lateral discontinuities caused by
faulting and folding in the alluvial units increases the possibility of multidimensional effects.
Haghshenas (2002), by using the data of a temporary seismologic network and applying
experimental methods, showed a significant amplification of ground motion for Tehran
alluvial deposits in a wide frequency range. Moreover the multidimensional effects are
indirectly supported by the significant difference observed between the SSR and the HVSR
results. With these conditions it is necessary to define the geometry and properties of the
Tahran alluvial basin in order to predict a more realistic surface ground motion for future
earthquakes.
Since the impact of an earthquake is strongly linked to the shear waves velocity in the
subsurface structure we started to evaluate 3-d shear wave velocity model of the Tehran‘s
alluvial deposits using Active and Passive measurements. The large number of datasets and
different methods used in this study will enable us to develop this model. We deployed 22
small to medium arrays to define locally the velocity profiles as well as numerous HVSR
measurements. We also measured seismic surface waves generated from active source
(MASW method) to provide an experimental dispersion curve over a broad frequency band
from surface to maximum reached depth.
The preliminary results confirmed the gradient increase in shear wave velocity in depth that
could be explain the failure of the HVSR method in Tehran (figure 1).

Figure 1: Up- Velocity – wavelength dispersion curve for MET Station. Middle - 2D arrays section.
Bottom - an example of 2D velocity – wavelength profile (west east profile)

Poster Presentations

Paleoenvironments and chronology of the late Miocene Maragheh
Formation, northwest Iran
Kaakinen, A.1, Salminen, J.1, Sakai, T.2, Mirzaie Ataabadi, M.3*, and Paknia, M.4
1Department of Geosciences and Geography, University of Helsinki, Finland 2Department of Geoscience, Shimane University, Matsue 690-8504, Japan 3Department of Geology, Faculty of Science, University of Zanjan, Iran 4Department of Science, University of Roma Tre, Rome, Italy
*Email: [email protected]
The terrestrial sequence in Maragheh (NW Iran) is a world-famous source of late Miocene
fossil mammals, critical to our understanding of the late Miocene faunal and environmental
evolution and dispersal patterns. While the sequence has been collected and studied
sporadically over the last 150 years, the ages of the Maragheh faunas remain controversial.
We present new high-resolution magnetostratigraphic records from the Dareh Gorg section,
east of Maragheh town, which provide age constraints for the mammal assemblages in the
middle Maragheh Formation. The correlation to the geomagnetic polarity time scale (GPTS)
is based on the succession of magnetozones, paleontological constraints and recent K-Ar age
determinations from this sequence, enabling a fairly unambiguous correlation of the local
magnetozones to the GPTS. As a result, the recently discovered and preserved locality (field
museum) is correlated to the upper part of the normal polarity chron C4n.2n (7.695–8.108
Ma). Based on the detailed sedimentological investigations, nine lithofacies are identified.
The lithofacies associations are interpreted as emerging from a fluvial depositional system
with occasional hyperconcentrated floods. Lithologically, the formation is dominated by fine-
grained over bank deposits, including paleosols and laminated lake/pond sediments.
Combined evidence from sedimentology and faunal studies suggest a seasonal climate and a
mosaic vegetational habitat.
KEYWORDS: Maragheh Formation, late Miocene, mammals, magnetostratigraphy,
Sedimentology

A tide-dominated delta from the upper Jurassic/lower Cretaceous of
Central Iran
Sharafi, M.1, Janocko, J.2, Prekopova, M.2, and Mirzaie Ataabadi, M.3* 1Research Institute of Petroleum industry, Tehran, Iran 2Institute of Geosciences, Faculty BERG, Technical University in Košice, Slovakia 3Department of Geology, Faculty of Science, University of Zanjan, Znjan, Iran
* Email: [email protected]
The upper Jurassic-lower Cretaceous Bidu Formation (also known as red beds or red series)
deposits are distributed substantially in Kerman (and Tabas) basins of central Iran. In the Ab
Bid area of the northern Kerman (south of Ravar), a ca. 400m thick section of this formation
has been studied. It consists mainly of alternation of thick red shales and thick bedded
sandstone units that display thickening and coarsening up-ward cycles. Detailed
sedimentological and ichnological analysis allows recognition of four facies associations
including playa (FA), delta plain (FB), upper distributary channels (FC), and delta front (FD).
Playa facies association consists of evaporite layers and thin-bedded sandstone and siltstone.
Delta plain facies association consists of the thick red shale intercalated with current and
climbing ripple sandstone (Scr), trough cross bedded sandstone (St) and horizontal laminated
sandstone (Shl), as well as Ophiomorpha nodosa and Taenidium barrette ichnofossils.
Distributary channel associations include channel shape, thick sandstone units with trough
and planar cross bed (St and Sp) and ichnofossils such as Taenidium barretti, Ophiomorpha
nodosa and Arenicolites. Delta front association consists of the amalgamated sandstone unites
with trough and planar cross bed (St and Sp), herring bone and tide bundles, as well as
Taenidium barretti, Ophiomorpha nodosa, Arenicolites and Skolithos ichnofossils.
KEYWORDS: Red series, Bidu Formation, Central Iran, Kerman, tide-dominated delta, trace
fossils

Kinematic analysis of the Qolqoleh-Kesnezan shear zone using shear
indicators
Heydari, M.1, and Behyari, M.2 1MSc student in Tectonics, Geology Department of Urmia University, Iran 2Assistant Professor of Geology Department of Urmia University, Iran
Email: [email protected]
Qolqoleh-Kesnezan area is located in the NW Sanandaj-Sirjan zone. The Sanandaj-Sirjan
zone is structurally active and is considered as an active margin and part of the Alpine-
Himalayan orogenic belt. Also, this zone has high potential for gold mineralization which is
of the type of shear zones. In this geological setting, two types of ductile and brittle
mineralization have been identified according to geological and structural studies. Shear
zones affect most of the rocks in the area. The brittle structures are comparable in scale from
the fault to the joint and fractures studied and have affected the structures formed during the
previous plastic deformation. The shear zones with ductile structural changes contain
microstructures that show the bearing and direction of the mesoscopic and microscopic
scales. Severs indicator of shear zones such as shear-band geometry (S-C fabric),
porphyroclast tails and folding (kink band and chevron folds) have been identified at various
points and used in kinematic analysis of these zones. These indicators show the direction of
left-lateral shear in the region, which is along the main fracture trend in the region. Also,
these areas are prone to mineralization, and geological structures must be considered for
mineral exploration.
KEYWORDS: Qolqoleh-Kesnezan shear zone; Sanandaj-Sirjan zone; shear indicators;
kinematic analysis.

Cyclostratigraphy and the effect of sequence stratigraphy on reservoir
quality of the Kangan formation in the gas field of the Tabnak anticline,
SW Iran
Nikbin, M.1, Khanehbad, M.1, Mussavi-Harami, R. 1, Mahboubi, A.1, Khoddami, M.2
1 Department of Geology, Faculty of Science, Ferdowsi University of Mashhad, Mashhad, Iran 2 Iranian Central Oil Fields Company, Tehran, Iran
E-mail: ([email protected])
The Kangan Formation (Early Triassic) is one of the most important gas reservoirs in the
Zagros fold-thrust belt. The study area is located in the west of the Hormozgan Province and
on the Gavbandi highland. This field is one of the important gas production anticlines in the
SW Iran. The sequence stratigraphy studies are based on seismic data segregation, outcrop
observation, and study of thin sections related to cores and cuttings and study of
petrophysical logs. The sequence stratigraphy studies in subsurface sections to identify
sedimentary sequences of a well is not easy always, because many wells do not have core or
are not continuously extracted from them. It is also difficult to study of cutting, especially
when samples intervals are high, but well logs are available for almost all wells. In the
absence of core and cutting data, these graphs (well logs) are useful tools for investigating
sequences. One of these logs is the gamma ray log that petroleum geologists use to
differentiate reservoir zones as well as adaptation between different wells in a field. The
cyclolog software to use of gamma ray log and analyze it, providing a log that the sequence
surface are completely separated and easy to identify, as well as easy matching of identified
surfaces. Input data are cyclolog software, raw data of resistivity, gamma ray, neutron,
density and son ic logs. But since diagenesis has less effect on the gamma log, it is used more
frequently. The cyclolog software creates a log to called INPEFA (Integrate Predicate Error
Filter Analysis). The basis of this log is that wavelet analysis is performed in a window of
specified length specified by the user. Then, based on the results, the trend of the log is then
aggregated into the next predicted stage and their trend is shown as a graph. According to the
general principles and methods of sequence stratigraphy, the Kangan Formation using facies
features and their equivalence with petrophysical logs, especially gamma ray log, the
parasequenes accumulation pattern, sequence boundaries and their relationship with surface
fluctuations seawater has led to the identification of two third-order sedimentary sequences
(at the time of the formation of the third-order cycles, sea-level changes are global and not
dependent on local variations) with type-II sequence boundaries. The basis for the
determination of sedimentary sequences in this study is the INPEFA log obtained from the
cyclolog software. Considering the trend of the curve in the wells of the gas field studied and
changing the range of this curve, positive and negative trends and according to which
stratigraphic boundaries (sequence boundaries and maximum flooding surface) are identified.
Each sequence consisted of one positive boundary surface (match to the sequence boundary)
and one negative boundary surface (match to the maximum flooding surface) and in total two
wells (wells "A" and "B") was identified six positive boundary surface and four negative
boundary surface. By integrating relatively more complete data from the petrographic study
of well-B, the classification of each system tract was accurately verified. As in this well, each sequence has been identified from the transgressive system tract (often

Including tidal flat and lagoon facies) and the highstand system tract (often including shoal
facies) in the studied sedimentary system. However, due to the lack of complete access to all
the thin sections of well-A only with the trend of the INPEFA log and gamma ray matching
with well-B, the system tract and sedimentary sequences of the Kangan Formation in this
section of the field have been studied and adapted. The sequences studied usually begin with
transgressive system tract (TST), followed by transitional surfaces of maximum flooding
surface (mfs), and finally to highstand system tract (HST). Generally, according to the thin-
sections from the two wells studied and the software output well data, the sequences
identified were from bottom (border with the Dalan Formation), upwards (border with the
Aghar-shale member of the Dashtak Formation) are named "Sq-I" and "Sq-II", respectively.
The relationship of sequence stratigraphy with reservoir properties is investigated in relation
to two main processes controlling; the porosity and permeability, namely facies distribution
in sedimentary and diagenesis environments. The sequence stratigraphy emphasizes the role
of sedimentary environment conditions in reservoir quality control and assesses the
conditions for the development of reservoir-prone sediments regardless of the changes that
the facies undergoes after deposition. Investigating the relationship between the reservoir
quality of a Formation and the distribution of sedimentary facies using sequence stratigraphy
concepts helps to understand the relationship between relative fluctuations in seawater in the
Formation of reservoir-prone and non-prone facies, and therefore, these studies are essential
for hydrocarbon reservoirs. In the Kangan Formation, highenergy facies of grain-supported
(peloid and ooid grainstone) are more abundant than facies of lowenergy environmets of
mud-supported (mudstone and bioclast wackestone), resulting in the formation of high-
expansion reservoirs and high reservoir quality in this formation. In the two wells studied,
especially well-B, according to petrophysical graphs, especially the effective porosity curve
incremental trend, high reservoir horizon is located at the end of the transgressive system
tract and the lower part of the highstand system tract is "Sq-II" sequence, which according to
the above, it is fully compatible with the high quality grain-supported facies of the shoal
environment. In these sequences, the quality of the reservoir is largely dependent on the
pattern of distribution of facies and sedimentary texture created, and good reservoir units are
due to the expansion of high porosity grainstone units. The mud-supported facies due to lack
of porosity and high permeability, either lack reservoir quality or have low reservoir quality.
These facies are related to low-energy environments and are formed in two positions; either
at sea-level drop which reduces the accumulation space of the sediment or at high sea-level
rise which results in excessive accumulation space and it forms the facies of deep areas. In
the first sequence of well B, the transgressive system tract is related to garin-supported facies
of shoal, but probably due to the influence of diagenesis processes, especially cementation
and compaction, causes horizontal formation of undesirable reservoir quality. Considering the
similarity of the separation parasequence of the two wells and considering the difference in
thickness, the above points can be applied to well-A based on its output data
KEYWORDS: Cyclolog, Kangan Formation, Reservoir quality, Sequence stratigraphy,
Tabnak Anticline.

Provenance and Tectonic Setting of the Oligocene–Lower Miocene
Syntectonic Deposits in the Mahneshan Area, Central Iranian Basin
Alimola, Z.1*, Etemad-Saeed, N.2, Najafi, M.2, Karimi, S.3
1Master of Tectonics of Institute for Advanced Studies in Basic Sciences (IASBS) 2Assistant Professor of Institute for Advanced Studies in Basic Sciences (IASBS) 3Bachelor science student, University of Zanjan (ZNU)
E-mail: [email protected]
The Mahneshan Basin is one of the Cenozoic syntectonic sedimentary basins in the north
west of the Central Iran, which is located between the western Alborz Mountains and the
Takab Complex (Fig. 1A; 1B). The aim of this study is to constrain the provenance and
tectonic setting of the Oligocene-Miocene clastic sediments comprising the Lower Red (Orb
and Org Members) and Qom formations in the Mahneshan Basin (Fig. 1c).

Fig. 1. (A) geological map of the Iran (Afsari et al., 2012) and (B) google earth Image from study
area; (C) Stratigraphic column of the Cenozoic sedimentary basins in the north west of the Mahneshan
This well-preserved sedimentary archive provides an opportunity to examine tectono-
sedimentary evolution of the Arabian-Euarasian collision zone. A combination of remote-
sensing and field mapping of fault kinematics, fold geometries, growth strata patterns and
unconformities allowed us to construct a structural cross-section across the Mahneshan Basin
and the Takab Complex. The studied succession is composed of about 2.5-km-thick of
predominantly sandstone, hybrid carbonate-volcaniclastic, volcaniclastic, and minor
carbonate rocks. About 160 samples were collected from the Lower Red (Orb and Org units)
and the Qom formations in this section. Standard microscopic thin sections were prepared
from all samples and polarized microscopic petrography studies were performed at Institute
for Advanced Studies in Basic Sciences. The modal analysis was performed by counting 300
points on 49 thin sections using the Gazzi-Dickinson method (Ingersoll et al., 1984).
In addition, petrography and modal analysis of sandstones were combined with Paleocurrent
directions to define the exhumation history of source regions. Petrographically, the
sandstones are poorly to well sorted lithic arkose to feldspathic volcanic arenite with average
compositions of Q10F52RF38, Q8F46RF46, and Q5F35RF60 in the Orb and Org members
and Qom Formation, respectively. Point-counting modal analysis and framework
composition of these sandstones suggest that the Orb and lower part of the Org were derived
from felsitic-metamorphic dissected/transitional arc sources which were uplifted in the west-
southwest of the depositional basin, in accordance to published thermochronologic data
indicating that this source may have been situated within the Takab Range Complex.
Towards the Qom Formation, andesitic-basaltic sources are the main contributors to the
sediments. These arc-related volcanic rocks were exposed in the north-northeast of the
depositional basin. In addition, the occurrence of interbedded volcaniclastic and hybrid
carbonate-volcaniclastic rocks in the Qom Formation indicate that clasts derived from
contemporaneous volcanic activity.
The NW-trending Mahneshan fault zone show an almost pure reverse mechanism and aligned
parallel to the Takab dextral Fault System. This implies a strain partitioning in a
transpressional deformation in the Mahneshan Basin. This folding and faulting started atleast
in the middle Oligocene. The exhumation of the Takab Complex occurred during the two
main phases, coeval with the deposition of the middle part of Lower Red Formation (middle
Oligocene), and also close to the Lower Red-Qom contact (late Oligocene).
KEYWORDS: Lower Red Formation, Qom Formation, Mahneshan Basin, Mahneshan
Fault, Paleocurrent, Sediment Provenance, Strain partitioning
References Afsari, N., Sodoudi, F., Farahmand, F.T. and Ghassemi, M.R., 2011. Crustal structure of northwest
Zagros (Kermanshah) and Central Iran (Yazd and Isfahan) using teleseismic PS converted phases.
Journal of Seismology, 15(2), pp.341-353.
Daneshian, J. and Ghanbari, M., 2017. Stratigraphic distribution of planktonic foraminifera from the
Qom
Formation: A case study from the Zanjan area (NW Central Iran). Neues Jahrbuch für Geologie und
Paläontologie-Abhandlungen, 283(3), pp.239-254.

Occurrence of Fe-Mg cordierite in contact aureole of the late Precambrian
granite Doran, SW Zanjan, Iran
Haji-Abolfath, A.1, and Izadyar, J.1
1Department of Geology, University of Zanjan, Iran
E-mail: [email protected]
The granite of Doran is the oldest known intrusive rock in Iran. The type locality of this
granite crops out in south of Zanjan. The latest dating studies suggest an age of 567 Mio.
years for this granite around the Chavarzagh village in western Zanjan (Hassanzadeh et al.,
2008). In southwestern Zanjan, the late Neoproterozoic slates and schists of the Kahar
Formation are metamorphosed into hornfels by the intrusion of the Granite of Doran.
The hornfels shows porphyroblastic texture in which porphyroblasts of quartz, alkali-feldspar
and cordierite are present in cryptocrystalline matrix of a very fine muscovite-sericitic
material. In addition, the accessory minerals are sphen, andalusite, zircon and opac minerals.
Usually cordierite porphyroblasts are oval to ellipsoid in shape and some of them show
hexagonal form with sector trilling. They are also changed to pinite. The microprobe analysis
of a oval shaped cordierite blast revealed chemical composition of a Fe-Mg cordierite in
which XFe and XMg are 0.616, 0.384, also an iron-rich cordierite. The existence of Fe
cordierite is restricted to low pressures; with increasing XMg the stability limit of cordierite
is shifted to higher pressures and also to higher temperatures. In addition, the channel volatile
content of cordierite also affects its stability (Schreyer, 1986).
However by considering of diagram for the stability of Mg- and Fe-cordierite (Schreyer,
1986) the max. Pressure and temperature formation of observed cordierite could be 3 Kbar
and 600 °C which reflects nearly the emplacement conditions of the Doran granite into slates
and schists of the Kahar Formation.
KEYWORDS: Contact aureole; cordierite; granite Doran; Kahar Formation; Zanjan; Iran

Metamorphism changes and estimates of thermodynamic conditions
section of metamorphic mylonite massif Ali abad-e damaq
Aghayari, F.1 and Mahmoudi, Sh.1
1Geology Department, Kharazmi University, 31979-37551 Tehran, I.R of IRAN
E-mail: [email protected]
Structural-metamorphic zone of Sanandaj-Sirjan in western Iran has experienced numerous
magmatism-metamorphic history in this area, occurrence of several metamorphic phases,
intrusions of igneous masses and pegmatite veins, as well as influence of tectonic forces on
area, has created a complex.
Ali abad-e Damaq region consists of units of Alvand intrusive rocks, contact metamorphic
rocks and ragional in which pegmatite veins and quartz veins are scattered in it.The rocks of
this zone have been metamorphosed by low-grade metamorphism in green schist facies and
amphibolite.
In the northern part of the region, sedimentary rocks are also exposed and some parts of the
area are covered by present-day sediments. And according to Mohajjel., 1997, the study area
is subdivided into complex deformations Other minor minerals that can be observed locally
in zicroscopic thin sections include tourmaline, zircon, epidote, microcline, and sphene The
main texture of these rocks is lipidogranoblast, which indicates the alteration and magmatic
nature of this rock mass.On the other hand, these rocks have a weak S-C fabric parallel to the
shear, indicating a gradual evolution of magmatism to metamorphism.Based on the ratio of
porphyroclasts Stone Crumbs,in the masses of the tissues vary from ultramylonite to
proteomilonite. Lithologically, the diversity of the main minerals in the main mass is
relatively low. The major constituent minerals of this rock mass are quartz and feldspar
(alkaline, plagioclase, perthite and feldspars). Foliation is formed by the orientation of these
crystals and the accumulation of sub-minerals such as biotite, phengite muscovite, along this
orientation.
According to the evidence presented in the study of microscopic thin sections, including the
type and percentage of Producing minerals, the studied rock masses are in the range of
granites (syenogranite and monzogranite). As well as the dominant lipidogranoblast texture
of the rocks indicates the magmatic and metamorphic maior of Ali Abad-e Damaq mass.
Based on microscopic studies and determination of suitable paragenesis to estimate the
temperature and pressure of the specimens purposefully for evaluation of selected chemical
analysis and the results after the analysis are as follows based on the Ti and Mg thermometry
method found in the structure of the biotite Henry and Guidotti (2002) and Henry et al.
(2005) Ali-Abad-e Damaq rocks show a temperature range of 540 to 570 ° C.
The three feldspar Thermobarometrys available in the SOLVECALC program show that the
Aliabad deep granite is formed at a pressure of 1.80 ± 0.05 Kb and a final temperature of 550
at 580 ° C. The calculated temperatures in the thermobarometry of the three feldspars are
lower than that of the sub-salidos granites, indicating that the feldspars have undergone

changes in sub-salidus conditions. And these changes could be the same pressure that led to
the formation of mylonites in the Ali Abad-e Damaq granite massif.
The thermometry of the Or - Ab feldspars of Ali Abad-e Damaq granite is based on the graph
of the two - feldspar granite at a pressure of 1.8 kbar and a temperature of 490 to 540 °
C.Also based on Al2O3 vs. MgO, Al2O3 vs. FeO, MgO-Al2O3-FeO and MgO vs. FeO plots
to determine the tectonic setting of biotites.
The magmatic tectonic setting of the studied biotites in the Ali Abad-e Damaq Mylonite
granite is in the calc-alkaline and peraluminous range. According to the thermobarometric
results, the metamorphic rocks of Ali Abad Damagh massif have been metamorphosed into
green schist facies.
KEYWORDS: Thermobarometry, Metamorphism, Mylonite, Sanandaj-Sirjan Granite, Ali
abad-e Damaq
Oligo-Miocene basaltic magmatism of Urmieh-Dokhtar magmatic belt:
transitional geochemical signature between arcs to OIB sources
Ghorbani, K.1, Morteza Delavari, M.*, 1, Shabani, A.1
1Department of Geochemistry, Faculty of Earth Sciences, Kharazmi University, Tehran, Iran.
E-Mail*: [email protected]
The Urmieh- Dokhtar magmatic belt lying parallel to the Zagros suture zone is commonly
considered as the result of subduction of Neotethyan oceanic lithosphere beneath
southwestern margin of Central Iranian continental terrane (Omrani et al., 2008; Chiu et al.,
2013; Kananian et al., 2014). So, it provides a unique opportunity to evaluate spatial and
temporal magmatic variation along a segment of Neotethyan arc. Based on earlier research
(Verdel et al., 2011), the chemical characteristics and genesis of Urmieh- Dokhtar
magmatism display evolution from Eocene to Oligocene. Here, we aim to put some new
constraints on the genesis and tectonic environment of basaltic suites in part of Urmieh-
Dokhtar magmatic belt. The study area is located to the northeast of Razan city, Hamadan
Province. The western- southwestern border of the area with Sanandaj-Sirjan zone and north-
northeastern border with Alborz zone are characterized by Avaj and Zanjan-Takestan- Boein
Zahra Faults, respectively (Bolourchi, 1978). In the study area, basaltic units are intercalated
with limestone and marls of Qom Formation suggesting that the volcanism is Oligo-Miocene
in age. The basalts appear as both massive and pillowed units. Microscopically, the samples
display porphyritic textures with intersertal to intergranular groundmass. The main
phenocrysts are plagioclase, olivine and clinopyroxene. In some samples plagioclase forms
more than 50% whereas clinopyroxene is less than 10% of mode. In olivine basalt, olivine is
modally up to 20%.
The major and trace element contents of whole rock samples have been obtained by XRF
(ARL Advant XP automated X-ray) and ICP-MS (Thermo Series X-I) at Ferrara University,
Italy. The SiO2 value ranges between 50 to 53.3 wt.% and total alkalis (Na2O+ K2O) is from
4.7 to 6.8 wt.%. In Nb/Y vs. Zr/TiO2 diagram (Winchester and Floyd, 1977) all the samples
plot within alkali basalt field. Moreover, TiO2 content varies from 1.07 to 1.5 wt.% and Mg#
[MgO*100/(MgO+FeOT)] show relatively wide ranges of variation (49- 71.3). Low Ni values
(5 to 56 ppm) displays important role of olivine fractionation in melt differentiation process.
Primitive mantle- normalized multielement patterns are characterized by LILE enrichment
and HFSE depletion. Furthermore, the chondrite- normalized REE patterns show
LREE/HREE enricment (La/Yb= 8-13). Compared to OIB, the samples display lower LREE-
MREE and higher LILE contents. The abundances of trace elements e.g. Nb, Zr values and
Sm/Yb and La/Yb ratios indicate that the melt originated from a relatively enriched
astenospheric mantle with low partial melting percent (< 20 %). Also, trace element ratios
e.g. Zr/Nb, Nb/Th, Nb/Y, Zr/Y indicates that the tectonomagmatic setting of magma
formation is transitional between arc and within-plate environment. Therefore, we interprete
alkaline nature and trace element chemical signatures of studied samples as a result of low
degree partial melting of deep astenospheric mantle above a subduction zone. In fact, after
Eocene magmatic flare-up in central iran which triggered by Neotethyan subduction, later

magmatic activity (Oligo-Miocene) is related to the partial melting of upwelling
astenospheric mantle in renewed extensional regime which is documented by formation of
sedimentary basin of Qom Formation (Morley et al., 2009). Compared to the the mantle
source of Eocene magmatism, that of Oligo-Miocene magmatism is relatively less affected by
subduction components.
KEYWORDS: Alkaline basalt, Oligo-Miocene, Tectonic setting, Urmieh-Dokhtar
magmatic belt.

Subduction-unrelated magmatism of southern periphery of Paleotethys:
constraints from Late Paleozoic magmatism from the south of Masuleh,
western Alborz
Sehhat, K.1, Delavari, M.*, 1, Saccani, E.2, Barbero, E.2, Hossein Mosaddegh, H.1
1Department of Geochemistry, Faculty of Earth Sciences, Kharazmi University, Tehran, Iran. 2Department of Physics and Earth Sciences, University of Ferrara, 44122 Ferrara, Italy
E-Mail*: [email protected]
The Alborz Mountains in north of Iran correlates with the Paleotethyan Suture so preserves
valuable clues for geodynamic clarifications and paleotectonic reconstructions. During life
span of Paleotethys from Early Paleozoic to Late Triassic, major parts of Alborz appear as a
continental margin in southern border of the oceanic basin. To test paleotectonic setting of
Alborz during Late Paleozoic and its passive or active condition, geochemical data of
magmatic rocks can provide useful clues. The Masuleh area (western Alborz) involves
important exposures of Late Paleozoic volcanic associations. These volcanics are poorly
studied and understood, so we intend to present new geochemical data about them. Field
studies characterize various lithological units in tectonic and stratigraphic contact with
volcanic units including Late Paleozoic low-grade metamorphics (slate-phyllite) and
calcareous units of upper Devonian, Carboniferous to Permian. The whole rock geochemical
data has been obtained by XRF and ICP-MS at Ferrara University, Italy. The volcanics
mainly comprise basaltic to trachy-basaltic compositions. They show moderate to high
alteration reflected in their LOI content (2.2 to 7.8 wt.%). Thus, for major element we used
recalculated anhydrous values. The SiO2 abundances of 45.3 to 50.7 wt.% display basic
nature of the studied rocks. Other major element components such as TiO2, Al2O3, CaO and
MgO are in the ranges of 1-4.4, 13.7-18.3, 5-10.7 and 2.5-14.9 wt.%, respectively. Moreover,
Mg# [MgO*100/(MgO+FeO*)] varies from 19-71. Wide range of major element variations
likely corresponds to different modal mineralogy and also various extent of melt evolution
and fractionation processes. Total alkali element abundance (Na2O+K2O) displays elevated
values (1.95-7.9 wt.%) reflecting alkaline composition of the samples. Compatible elements
such as Ni (2.2-213.7 ppm) and Cr (17-739 ppm) indicate highly varied amounts, as well,
suggesting nearly primitive to extremely fractionated nature. In La/Sm vs. La plot, the
compositional trend is consistent with fractional crystallization process. Chondrite-
normalized REE patterns and primitive mantle -normalized spider diagrams are characterized
by similar patterns suggesting genetic relationships of different samples. The spider diagrams
display humped-shaped patterns in which the LILEs (Rb, Ba, Sr and K) and HFSEs (e.g. Th,
Ta, Nb, Zr and REEs) show enrichment with increasing incompatibility and a slightly
negative Nb anomaly. These patterns are consistent with typical intraplate alkaline
magmatism (OIBs). REE patterns are characterized by pronounced negative slope reflecting
high LREE/HREE enrichment ((La/Yb) N= 5-17). Moreover, La and Yb represent
enrichment of 47-248 and 6.5-22 times chondrite abundances, respectively. Immobile trace
elements (e.g. La, Y, Zr and Nb) discrimination diagrams suggest subduction unrelated
within-plate mantle origin similar to OIB source. Furthermore, the mantle source nature and
partial melting degrees are inferred from modeling based on incompatible element ratios
(Sm/Yb vs. La/Yb plot) suggesting that parental melt derived from garnet-bearing lherzolite
and partial melting of <15%. Finally, we conclude that the area located to the southern
margin of Paleotethys during Late Paleozoic was a passive margin (Gondwanian affinity) and
the magmatic activity was related to thermal perturbation of mantle via hot spot/plume effects
in an extensional tectonic regime.
KEYWORDS: basalt, within-plate, Late- Paleozoic, Alborz

Petrography and geochemistry of the Late Campanian siliciclastic rocks in
the Kopet-Dagh basin NE Iran; implication for provenance and
paleoclimate condition
Keshmiri, M.1, Mahmudy Gharaie, M.H.*1, Moussavi Harami, R.1, Mahboubi, A.1 1Department of geology, Faculty of science, Ferdowsi University of Mashhad, Iran.
E mail: [email protected]
The Kopet-Dagh Sedimentary basin extends from the eastern part of the Caspian Sea to the
northeastern part of Iran as well as into Turkmenistan and North Afghanistan. Following the
collision of the Iran and Turan plates, the Kopet- Dagh Basin was formed on the southern margin
of the Eurasian Plate from the Jurassic to the Neogene. Neyzar Formation is mainly composed of
shales, marl, sandstone and sandy limestone. Two stratigraphic sections of Neyzar Formation
(Late Campanian) near Tang-e-Neyzar and padelli village were documented by measuring and
sampling in eastern part of the Kopet-Dagh basin. In this study, petrographic and geochemical
parameters of shales and sandstone rocks of the Neyzar Formation in the eastern part of Kopet-
Dagh basin have been analyzed to reveal their provenance such as parent rock composition,
tectonic setting and source area paleoweathering indicating the paleoclimate condition.
Petrographic studies showed that the sandstones are mostly classified as subliharenite and
litharenite. Geochemical data revealed that the CIA values of Neyzar siliciclastic rocks confirm a
medium to high weathering that could be due to warm and humid climate condition in the source
area. Felsic to intermediate igneous composition of parent rocks and quatzolithic lithofacies of
the Neyzar Formation sandstones and their constituents such as: Qm, Qp, Ls, Lm, and F show
that these sediments may have derived from uplifted and trusted belt of sedimentary-
metamorphic rocks of Binalood region in the south. In addition, geochemical and petrographic
analyses suggest that Neyzar sediments are deposited in a continental rifting and recycled
sedimentary orogeny's system.
KEYWORDS: Neyzar Formation, Paleoclimate, Provenance, Tectonic setting, Weathering

Petrology and Geochemistry of the intrusive units in Chahargonbad,
Northeastern of Sirjan- Kerman
Saffar Heidari, M.1*, Ghorbani, M.2, Sheikh Fakhradini, S.3 1*M. Sc., Department of Geology, Shahid Beheshti University, Tehran, Iran 2Prof. , Department of Geology, Shahid Beheshti University, Tehran, Iran 3Ph.D. , Department of Geology, Shiraz University, Shiraz, Iran
E-mail: [email protected]
The study area is located in southeastern Iran, about 110 Km southwest of Kerman. It is
southeast of Urumieh- Dokhtar Magmatic Assemblage (UDMA). A part in UMDA called
Dehaj-Sarduieh volcano-plutonic belt in Kerman province. Is specified by the occurrences of
numerous felsic plutons of Oligocene-Miocene age famous for world-class porphyry copper
deposits .The UDMA contains Eocene- Quaternary intrusive and extrusive rocks. The
magmatic activity climax accurred in Eocene period. Geologically the area is composed of
ophiolitic rocks, volcanic rocks, intrusive bodies and sedimentary rocks. The Dehaj-Sarduieh
volcanic belt contains a broad range of Eocene volcano-sedimentary rocks, intruded by the
so-called Jabale-Barez type granitoides with crystalline texture. Most of granitoids is
composed of granite to granodiorite at south west of Kerman and they are Metaluminous and
calc-alkaline. The UDMA includes alkaline and calc-alkaline volcanic rocks and the related
plutonic I-type, mode by subduction of the Arabian plate beneath central Iran during Alpian
orogeny. Chahargonbad granitoids are known as the Jabale-Barez type granitoids which
intruded into the Eocene volcanic rocks consist of different andesite, dacite, pyroclastic and
sedimentary rocks. Chahargonbad plutonic rocks contain quartzdiorite porphyry to granitoid.
Garnite and quartzdiorite are mianly composed of plagioclase, alkali feldspar, quartz,
amphibole, pyroxene and biotite. These rocks display granular texture. Anhedral quartz with
embayed margins is as phenocrysts and inclusion in biotite, plagioclase and orthose. They are
also of they are characterized by 25-40% plagioclase phenocryst with disequilibrium
evidence of magma they show zoning. Based on the scheme, the analysed samples from the
Chahargonbad plutons consist granite and granodiorite or quartzdiorite.
Considering K2O vs SiO2 discrimination diagram by Peccerillo and Taylor all rocks plot in
the high K calc-alkaline and shoshonite field. The plutonic rocks of the chahargonbad are I-
type metaluminous to slightly peraluminous. Primitive mantle-normalized trace element
spider diagrams belonging to the chahargonbad intrusive show strong enrichments regarding
large-ion lithophile elements (LILE) and those incompatible elements that behave as LILE.
The most characteristic high-field strength elements (HFSE) and HREE have Cleary lower
normalized values compared to LILE. Nb, Ti and P show negative anomalies. The flat HREE
patterns of these rocks exclude garnet or spinel as a refractory phase while melting. In
continental subduction zones, magma can be the result of two main origins: the upper crust
and lower crust-upper mantle and a composite origin: crust mantle (mix), caused by fluids of
the subducted plate. Partial melting of subducted sediments and fluids originated from the
subducted slab metasomatize or enrich the origin of magma in subducted zones. Petrological
evidence show that fractional crystallization from quartzdiorite to granite had main role in
genesis of these rocks enrichment in LILE and depletion in high-field strength elements

(HFSE) in rare earth element distribution patterns of spider diagrams, indicate a subduction –
related environment for formation of these rocks. Also, they are enriched in LREE rather than
HREE. The characteristics, which are usually observed in the rock from subduction
environments and active continental margins. Chemical and petrological studies indicate a
common source for these igneous rocks and the main role of fractional crystallization in the
evolution of magma although, minor amounts of assimilation and contamination of magma
by crustal rocks occurred. The alkaline magma formed by low degree partial melting of an
enriched sub-continental lithospheric garnet-lherzolite mantle. The high content of Sr, LREE
enrichment, absente of Eu anomaly, HREE depletion pattern suggest the existence of garnet,
amphibole and absence of plagioclase in the source rocks. Our data suggest that the plutons
produced by partial melting of amphibole- eclogite or garnet- amphibolite, due to the
subduction of Neotethys oceanic slab Central Iran Plate (CIP). Oblique subduction created
appropriate spaces in the edge of the CIP. Hence, partial melting occurred due to
decompression in the mantle wedge or base of the lower crust. The melts, which were quartz
diorite to granite in composition, were injected into these spaces. In addition to mineral
chemistry of some minerals, petrographic and geochemistry of special trace and rare elements
can be used to distinguish the tectonic setting of the granitic rocks. All of the studied
intrusive rocks on Nb versus Y and Ta versus Yb diagram are classified as volcanic arc
granites and on La/Yb versus Th/ Yb diagram fall in the continental margin arc (volcanic arc)
domain.
KEYWORDS: Petrology, Geochemistry, Magmatic rocks, Subduction, Calc-alkaline,
Chahargonbad

Metamorphism of sedimentary rocks in the southern Sanandaj-Sirjan zone
Determined from RSCM method
Gharibnejad, P.1, Rosenberg, C.2, Omrani, J.3, Agard, P.2 and Kananian, A.1
1University of Tehran, School of Geology, College of Science 2ISTeP, Institut des Sciences de la Terre de Paris, Sorbonne Université, 4 Place Jussieu 75252
Paris cedex, France 3Geological Survey of Iran
E-mail: ([email protected])
The Sanandaj-Sirjan Zone (SSZ) played the role of active margin during the Afro-Arabian and
Central Iranian continental collision. The southern part of this zone, mainly consists of
Precambrian and Paleozoic metamorphic rocks, mostly characterized by Barrovian type
metamorphism that formed under Amphibolite to Greenschist facies conditions. The convergence
history can be traced through the subduction/obduction processes that are recorded within the
geodynamic evolution of Zagros orogeny. Therefore, to reconstruct the geodynamic evolution of
southern SSZ, metamorphic and structural investigations are very crucial. In south of SSZ,
metamorphic conditions were documented in a few studies; but, only on the local scale. In this
study we provide a temperature map, based on a data set obtained using Raman Spectroscopy of
Carbonaceous Material (RSCM) of 28 peak-temperature estimates. The collected meta-
sedimentary samples consist of calcareous (limestone, marble, dolomitic-marble and dolostone)
and non-calcareous (phyllite and different type of schists) rocks. The obtained results indicate
that older samples have higher temperature than the younger ones; hence, the samples can be
classified into two groups: those with temperature between 500°C to 600°C (Precambrian and
lower Paleozoic) and those with temperature ≤ 400°C (upper Paleozoic to pre-upper Mesozoic).
The tectonic events that can explain burial and metamorphism of these samples probably are the
Pan-African (Hercynian) and early Alpine orogeny (Cimmerian episodes and after) which were
active during Precambrian and upper Paleozoic onwards. The alternative possibility is the
exhumation and erosion of deep seated metamorphic rocks along the thrusts of suture zone
(mainly MZT) which have been activate at least since the Eocene.
KEYWORDS: Alpine orogeny; Exhumation; Neo-Tethys; Pan-African orogeny; peak
temperature; Raman Spectroscopy of Carbonaceous Material; Sanandaj-Sirjan Zone; Zagros
orogeny

Mineralogical and Geochemical study of Shirkooh granitoid, Yazd
Ghanzavi, P.1, Khatami, M.1, pourfarzi, H.2
1School of Geology, College of Science, University of Tehran, Tehran, Iran 2Geological Survey & Mineral Explorations of Iran (GSI)
E-mail: [email protected]
Shirkouh Batholithic located 30 km southwest of Yazd in terms of structural zone in central
Iran. This mass is greater than 550 square kilometers. This area, located in the Nayband
Formation, and belongs to the Upper Jurassic. The coordinates of the study area are 31
degrees 23 minutes to 31 degrees 45 minutes’ north latitude and 53 degrees 50 minutes 54
degrees 20 minutes east of Yazd province. Microscopic studies of 50 thin sections reveal the
petrological and mineralogical information of the above specimens. In this study, GCDKIT
Microsoft office excel software was used. The nature of the mass is in the range of alkalic
acid in terms of the amount of alumina, peralumin. The samples in the diagrams illustrate the
nature of calc-alkaline. According to lithological studies the main composition of the massive
is granite- granodiorite. Field studies indicate a batholithic mass consisting of hornblende-
rich granite type I as the main mineral, magnetite and rarely apatite and s-type granite
inclusions containing almandine-rich garnet metamorphic enclaves that are chemically
intrusive with intrusive garnets. Peralumines have similarities, cordierite, primary and
secondary muscovites, and biotite and felsic microgranular with pegmatite veins. This granite
(type S) is more precisely comprised of monzogranite, granite and granodiorite rocks. The
main minerals forming the Shirkuh granitoid massif including biotite, cordierite, andalusite-
sillimanite, zircon and apatite and ilmenite minerals are visible as minor-minerals in some
samples. From the tectonic point of view, the Shirkuh batholith lies within the continental arc
granite (VAG).
KEYWORDS: Geochemistry, Mineralogy, Granitoid, Shirkooh, Yazd

Coesite in the eclogite of the Sulabestarea, southeast of Birjand in
Sistansuturezone, Iran: Evidence from textural and Raman studies \
Nasihatsheno, N.1, and Izadyar, J.1*
1Department of Geology, Zanjan University, Zanjan, Iran1
Email: [email protected]
Email: [email protected]
Petrographic and Raman microprobe spectroscopy were carried out for the metamorphic
rocks from the Sulabest area, in the Sistan suture zone, eastern Iran, and coesite was
recognized in the eclogitic rocks. The coesite-bearing eclogite consists mainly of garnet,
omphacite, gloucophane and white mica. The coesite occurs as inclusion surrounding by
albite within porphyroblast garnet. Eclogites in the Sulabest area form topographically
prominent lenses several metres across, embedded in the schistose mélange matrix.
Microstructural investigations and mineral chemistry results indicate that eclogites in the
Sulabest area recorded two events of metamorphism. The first or peak metamorphic stage
(M1) is characterized by mineral assemblage of garnet, omphacite, sodic amphibole,
phengite, coesite, quartz and water that indicated eclogitefacies. Phases of Peak stage contain
undecomposed minerals and middle parts of minerals which have zoning and formed in early
stages ofmetamorphic. The second or retrograde metamorphic stage (M2) can be recognized
by mineral assemblage like; garnet, sodic-calcic amphibole, muscovite, chlorite, epidote,
quartz, albite and water that indicated epidote- amphibolite facies. Phases of retrograde stage
contain decomposed minerals and rim parts of minerals which have zoning and formed in
future stages of metamorphic.
This finding represents a first piece of evidence for ultrahigh-pressure metamorphism in
Sistan suture zone of eastern Iran. The Sistan Suture Zone of eastern Iran is a Cretaceous to
Tertiary orogenic belt that formed by closure of a north wards projecting arm of the Neo-
Tethys ocean. Disrupted ophiolitic rocks within the subduction complex include a tectonic
mélange of metamorphic rocks. The metabasite lenses include variably overprinted eclogites,
epidote–amphibolites and greenschists.
KEYWORDS: coesite, eclogite, Raman spectroscopy, Sistan suture zone, Iran.

Petrography, mineralogy and Texture of chondrule from the Sarpol Zahab
H chondrite
Ghanzavi, P.1, and Kamali, H.2 1School of Geology, College of Science, University of Tehran, Tehran, Iran 2Management of Iran meteorite museum
E-mail: [email protected]
Stony meteorites consist predominantly of the silicate minerals olivine, pyroxene, and
feldspar. They may also contain metallic iron and iron sulfide, but always in lesser amounts.
The stony meteorites are further divided into chondrites and achondrites. The characteristic
components (40 to 90%) of chondrites are the chondrules or small spheres, ranging in
diameter from 0.2 to 1 mm. On a broken surface they catch the eye because they protrude as
hemispheres or because their color differentiates them from the fine-grained groundmass.
Chondrules are easily removed from some chondrites, while in others they are firmly
incorporated into their surroundings. They consist chiefly of olivine and pyroxene, with a
small amount of feldspar that is generally found as a binding agent filling the spaces between
the olivine and pyroxene crystals. Their structure becomes clear when examined in thin
section under the microscope. Chondrules are a major component of chondritic meteorites.
Understanding their formation conditions provides fundamental insights about how the early
solar system formed and evolved. Chondrules represent a significant evolutionary step in
planet formation. We studied the textures of ∼20 chondrules from one groups (H) of ordinary
chondrites that is a new H chondrite fell near Sarpol Zahab, Kermanshah, Iran on August 10
at 7:55 AM. The fall was observed by local villager. We also describe mineralogical and
petrologic information for a selected subset of the same suite of chondrules. The data
investigate the relationships between chondrule mineralogy and texture.
KEYWORDS: Chondrite, Chondrule, Meteorite, Mineralogy, Petrology

Study of Granit types and alterations of Shirkooh granitoids, Yazd
Khatami, M.1, Ghanzavi, P.1, pourfarzi, H.2
1School of Geology, College of Science, University of Tehran, Tehran, Iran 2Geological Survey & Mineral Explorations of Iran (GSI)
E-mail: [email protected]
Shirkouh granitoid batholith, over 1000 square kilometers, is located in the coordinates of 31
degrees 23 minutes to 31 degrees 45minutes north latitude and 53 degrees 50 minutes 54
degrees 20 minutes east of Yazd province. The study area of Shirkouh granitoid is located 30
km southwest of Yazd in Nayband Formation and Structural Zone of Central Iran. Fifty
samples of granitoid masses were subjected to XRF and ICP analyzes. Microscopic studies of
50 thin sections reveal the petrological and mineralogical information of the above
specimens. In this study, GCDKIT and Microsoft office excel software were used. The
studied batholithic mass can be studied in three categories: The first group is granodiorite
that, have plagioclase-rich mineralogy of plagioclase-rich mineralogy in the center, quartz,
potassium feldspar, and biotite that encompasses the hearing margin of the mass. The second
group of monzogranites, which are the largest of the batholithic, are separated from the
granodioritic melt. Cordierite mafic rocks and differentiated types of muscovite give rise to
Shirkuh batholithic. The third group is leucogranite and their color is clearly shown due to the
absence of dark minerals on the western margin of this batholithic mass is light, which are the
result of late melt. As a result of contact metamorphism, alteration hydrothermal alteration is
visible in the host rocks. According to studies of altered types of propolytic, quartz-sericite,
which is the most extensive zone in the study area, advanced argillic including APS
(aluminum phosphate sulphate) minerals (jarocyte minerals, alunite). Examination of trace
elements indicates that the Shirkuh batholith is a type of tectonic source granite. The
mentioned granite is derived from upper crust anatexy and biotite mineralization failure
reactions. These granites ,Due to the high amount of aluminum are peraluminous.
KEYWORDS: Geochemistry, Alteration, Granit types, Shirkooh granitoid, Yazd

Chemical constraints on the genesis and geodynamic setting of Late
Cretaceous magmatism in northeast of Tehran, Central Alborz
Namvar, R.1, Delavari, M*, 1 , Saccani, E.2, Barbero, E.2, Karimi, B.3
1Department of Geochemistry, Faculty of Earth Sciences, Kharazmi University, Tehran, Iran. 2Department of Physics and Earth Sciences, University of Ferrara, 44122 Ferrara, Italy 3Iran Mineral Processing Research Center, IMPRC- Kavosh Research Twon, Karaj, Iran.
E-Mail*: [email protected]
The Alborz range is part of Alpine- Himalayan orogenic system which preserved important
magmatic features related to the evolution of Gondwana-Eurasia junction realm. Several
well-developed sub-marine Cretaceous volcanic units are exposed in Central to Northern
Alborz e.g. in Marzan-Abad and Lahijan areas. The volcanics display mainly basaltic
composition. Study of chemical signatures of these rocks is a key issue to constrain the
tectonomagmatic environment of melt formation and paleogeographic reconstructions. In this
research we aim to study the volcanic outcrops located to the northeast of Tehran (south of
Amol), Central Alborz. Stratigraphic relationships show that the volcanics are interlayered
with marly limestone, limestone and marls of Late Cretaceous. Here, we present new
geochemical data on these rocks to identify the origin and condition of magma genesis which
helps to infer paleotectonic setting of Alborz magmatism during Late Cretaceous. The major
and trace element contents of whole rock samples have been obtained by XRF and ICP-MS at
Ferrara University, Italy. Using recalculated anhydrous major elements, the samples display
wide range of variation in SiO2 (42-68 wt.%), TiO2 (0.45- 4.7 wt.%), Al2O3 (12.6-18.8 wt.%),
Mg# (17.8-49) and Na2O + K2O (2.9-11.7 wt.%), likely reflecting various mineralogy and
different degrees of fractionation. Based on Nb/Y (1.8-3.4) and Zr/Ti (0.01-0.29) ratios the
rocks plot within alkali basalt, trachy-andesite and trachyte fields. High Zr (83-738 ppm) and
Nb (43-111 ppm) contents is also consistent with alkaline nature of the samples. Other
incompatible element values shown by normalized multi-element patterns are enriched as
well, which is similar to typical within-plate alkaline basalts, such as ocean island basalts
(OIB). Furthermore, no negative Nb and Ta relative depletion can be observed in these
patterns. In chondrite- normalized REE patterns, the rocks display elevated LREE enrichment
with respect to HREE, exemplified by high (La/Yb)N ratio (15-33). Overall, the REE
enrichment of the rock suites is 155- 375 and 8.5- 17 times chondrite value for La and Yb,
respectively. Using trace element abundances such as Zr, Y, Nb and Ti contents and also the
ratios of Zr/P2O5, Nb/Y, Zr/Y, Ti/Y, Th/Yb and Ta/Yb, the basaltic rocks plot in the fields of
alkaline and subduction-unrelated OIB-like magmas. Moreover, theoretical modeling using
REE ratios e.g. Sm/Yb and La/Yb displays that the parental melt originated from partial
melting of deep garnet-bearing enriched mantle with low (<15%) partial melting. Therefore,
we conclude that the tectonic environment of melt formation is unrelated to subduction
process and mostly corresponds to within-plate magmatism in an extensional setting. This
conditions is more probably consistent with hot spot/mantle plume activity and continental
rift-related events.

KEYWORDS: Alkaline basalt, Late-Cretaceous, Central Alborz

Geochemistry and petrogenesis of host rocks of hydrothermal springs in
Meshkinshahr, northwest of Sabalan volcano
Khatami, M.1, and Modabberi, S.1
1School of Geology, College of Science, University of Tehran, Tehran, Iran
E-mail: [email protected]
The study area is located northwest of Sabalan Volcano. Sabalan region is located between two
structural areas of Alborz-Azerbaijan and Orumiyeh-Dokhtar. Samples from eight hot springs
available in the area were sampled. These rocks are in continental and orogenic range with high
aluminum oxide and potassium oxide.According to Harker diagrams for the host rocks sample of the
hot springs under study, oxides of the major elements, such as Al2O3, CaO, MgO, FeO2, P2O5,
TiO2, show a marked decrease with increasing SiO2. These trends are justified by the crystallization
of myfic minerals and plagioclase. K2O shows an upward trend with increasing SiO2. This process
can be related to the crystallization of potassium feldspars. Na2O shows an almost irregular course,
which can be due to the alteration of the specimens, as the Na and K elements are Mobile elements,
and their inconsistency in the process can be evidence of the alteration of the specimens. Overall,
most of these diagrams show distinct process rock compositions, which may indicate their parent
magma kinship. As noted earlier, CaO shows a decreasing trend against SiO2. CaO is a compatible
oxide, thus having a high content in the early stages of subtraction and tends to participate in the
formation of minerals such as pyroxenes (especially clinopyroxenes) and calcium plagioclases, so it
can be concluded that the final stages of differentiate decrease. MgO also declines against SiO2.
Since Mg is one of the compatible elements in magma, it tends to separate from magma at high
temperatures and at the beginning of the differentiate process. It can enter the structure of refractory
minerals such as olivines and pyroxenes in magma. As a result, as the subtraction process progresses
and the SiO2 content in the magma increases, the amount of Mg in the magma and the resulting rock
decreases. FeO is also a compatible oxide that shows a decreasing trend against SiO2. In addition to
being involved in the formation of the first refractory minerals and pyroxene, this oxide is also
incorporated into the magnetite structure. TiO2 is also oxide compatible, which results in a
downward trend of SiO2. P2O5 does not show a uniformity.
KEYWORDS: Geochemistry, Patrogenesis, hydrothermal springs, Sabalan volcano

Structural evolution of Moghanlu Gneissic mass, NW Iran
Aflaki, M.1, Honarmand, M.1, and Zaringol, Z.1 1Earth Sciences Department, Institute for Advanced Studies in Basic Sciences, Zanjan, Iran
E-mail: ([email protected])
Moghanlu gneissic mass, late Ediacaran-Cambrian in age (579-531 Ma), is part of the Takab
magmatic–metamorphic assemblage of NW Iran, Zanjan province. It characterized by complex
composition and structure inherited from experience of several orogenic events, including
metamorphic rocks in central part which are sorounded by plutonic intrusions. They are dominantly
overprinted by brittle fault zones. Recent geochemical and isotopic studies investigate tectono-
magmatic evolution of the complex and indicate effect of late Oligocene crustal thickening and later
extentional events (results in formation of a core-complex structure) on its post collisional evolution.
But, the structure of Moghanlu gneissic mass is not well undrestud. To have a better insight from its
tectonic evolution, we motivated to search for destribution of ductile deformation within the gneissic
part and brittle fault zones, especially around the complex. Our studies reveal a mylonitic fabric for
the gneissic rocks, with high strain bands in deeper part of the outcrops. Altough ductile structures
are overprinted and rotated by younger brittle events, there is a systematic change in orientation of
foliation within the area. Foliation is dominamtly NW-SE striking, but its dip gradually changes from
semi-vertical at the western part of the mass to semi-horizontal at cental part and moderatly dipping
NE-ward at eastern part of the area. Most measured lineation are NE or SW trending. Shear sence
indicators in meso- and micro-scalescale view, including C/C‘-type shear bands and Sheath folds, are
compatible with up to the NE shearing through the area. These structural data present evidences of
mylonitic gneiss, in central part of the Moghanlu mass, with structure comparable to core-complexes.
The ductile mylonitic foliation is overprinted by brittle-ductile structures including gash fractures
and minor conjugate shear bands. Orientations of these structures are compatible with direction of
maximum compression perpendicular to the orientation of foliation. It suggests their exhumation to
upper part of the crust during an extensional event. Satellite images and field observations reveal that
present outcrop of the Moghanlu mass is bounded by Precambrian-paleozoic rocks at NE and
Cenozoic rocks at SW. It thrusted along its western and southern boundaries over mudstones of
Upper Red Formation, Miocene in age. Our structural data present evidence of a core-complex
structure which may have been emplaced, later, during late Cenozoic compressional tectonic
regimes.
KEYWORDS: Moghanlu; Mylonitic gneiss; Petrophabric; Sanandaj-Sirjan; Structural evolution.

Geology of Bajalia Anticline in Amarah, Al-Teeb, Iraq-Iran Border
Abdulnaby, W.1, Mahdi, M.1, Al-Mohammed, R.1, Darweesh, N.1, Hashoosh, A.2 1Department of Geology, College of Science, University of Basrah 2Groundwater Authority, Ministry of Water Resources, Maysan Governorate
Bajalia Anticline is located about 60 km northeast the center of Amarah city within the Low Folded
Zone of Iraq at Al-Teeb area near Iraq-Iran border. Field and office works were achieved in order to
study the topography, geomorphology, stratigraphy, structural geology, and hydrology of Bajalia
Anticline. The Anticline has longitudinal shape with about 28 km long and 5 km width, and it has
northwest-southeast trend, which is the Zagros trend. Injana, Mukdadiya, and Bai Hassan formations
(Upper Miocene-Pleistocene) are the three formations that were recognized in the study area. The
topography of the Anticline indicates that the elevations range from about 40 meters at the
southwestern limb to 120 meters at the northeastern limb. The geomorphology of the study area
shows differential erosion that occurs because of physical properties of rocks. Different huge valleys
run through the Anticline perpendicular to the hinge line. The geometrical structural analysis depicts
that the Anticline is asymmetrical, non-cylindrical, linear, upright, horizontal, and open fold. Most of
the fractures in the Anticline are joints. These joints were classified based on the tectonics axes,
which are a, b, and c, into: ac, bc, hol. A major reverse fault is located at the margin of the
southwestern limb parallel to the fold axis with about 25 km length. This fault is responsible on the
vergency of the Anticline and overturned of part of the southwestern limb. The Anticline was formed
as a result of the collision between the Arabian and Iranian plates during the Late Tertiary. The
maximum stress axis, which caused by collision, is perpendicular to the hinge line. The geometrical
and genetic classification indicates that the Anticline was formed by high folding intensity. Salt
tectonics of the Middle Miocene Fat’ah and the Late Jurassic Gotnia evaporite formations may play a
role in forming the Anticline. This role can be identify by geophysical studies to the Anticline. KEYWORDS: Bajalia Anticline, Geology of Iraq, Structural geology of Amarah, Hemrin-Makhul
Folded Belt

Tectonic evolution of the Central Alborz: from paleostress investigations to the
present state of the stress
Pourbeyranvand, Sh.1, Gholami Dargahi, M.2
1International Institute of Earthquake Engineering and Seismology 2Kharazmi University
E-mail: [email protected]
Central Alborz has so far been affected by several strong tectonic stages. In this summary of the
paper, it has been attempted to summarize the changes in the direction of maximum compressional
stress in the Central Alborz region over time from the Eocene to the present-day. The paleostress
direction in this area which is calculated by fault slip data stress inversion has been published in
some papers.
Abbasi and Shabiani (2005) used 181 fault slip observations and associated lineaments to determine
the paleostress state during the Pliocene to Holocene geological time in the south-central Alborz in
geographic range 51 to 52.5 using stress tensor inversion method. Stress directions from the Eocene
to the Late Quaternary change clockwise, from NW-SE to NS and finally to NE-SW.
Mehrnaz et al. (2005) used the data related to the shear fault planes and the associated lineation and
implemented the stress inversion method in East Tehran at Longitude 51 ° 30 min to 51 ° 45 min and
Latitude 35 ° 30 min to 35 ° 45 Min. The obtained the paleostress direction through this study during
the Mesozoic and the Cenozoic (Paleogene) is NS.
Finally, Eliassi and Ahmadian (2008) studied a number of mesoscale faults containing slickenside
lineations related to the Eocene from latitude 50 degrees 50 minutes to 51 degrees 25 minutes and
from latitude 35 degrees 45 minutes to 36 degrees 8 minutes by Multiple Inverse Method. The results
of this study were checked by some other geological phenomena such as axial level of folds, and
Stylolites. The calculated stress paths have an N-S trend, indicating an increase in stress intensity
during fault system activities.

Figure 1. Comparison between paleostress and contemporary stress directions in the central Alborz.
Description of the colors can be found in the text.
From many studies, only the above-mentioned ones were employed because the rest could not be
used in comparison with the others effectively because of inaccurate information about the location
of the paleostress sites under investigation. The other 3 studies were analyzed regarding the
geological time. Thus the paleostress main orientation conducted through these studies were
classified into 4 phases including the Mesozoic, the Paleogene (the Eocene), the Neogene, and the
Quaternary. The main paleostress direction in these phases is illustrated in fig. 1 as red, green, blue
and magenta bars.
A recent study on the present state of the stress in the Central Alborz is used seeking a comparison
between the paleostress results in the study area with the contemporary stress directions
(Pourbeyranvand, 2019). The SHmax from focal mechanism stress tensor inversions is in yellow.
The present-day stress, a trend with a mean NE direction is the dominant trend. The difference
between the paleostress directions and the calculated present-day SHmax directions reflects the
clockwise rotation of the principal stress orientations over time in most of the cases but the
differences in the geological times covered by the studies and also the location of the sites under

investigations causes complexities in the analysis of the data. Hence it seems that a simple rotation
model cannot be easily assigned to the tectonic evolution of the study area.
Anyhow, the clockwise rotation which is observed in this study from older geological time up to
more recent and finally present time, is supported by some other similar studies comparing the
paleostress and contemporary stress directions, carried out in other locations in the country. A
paleostress study compared to the present state of the stress in the Azerbaijan NW Iran (Aflaki et al.
2017) and also a similar study in the Western Zagros (Pourbeyranvand, 2003) revealed a comparable
clockwise rotation of the principal stress orientations through the geological time. The issue thus
worth more investigations and when completed, can lead to an insight to the tectonic evolution of the
Alborz range which is very important from a variety of different aspects including seismotectonic,
economic, industrial and also oil and gas perspective.
KEYWORDS: Central Alborz; Fault-slip data; Focal mechanism; Tectonic evolution; Stress
inversion
Refrences
Abbassi M.R., Shabanian Borujeni, E., (2005). Determination of stress state and direction by inversion of
fault-slip data in the southern flank of Central Alborz, Geosciences, Vol. 14, No. 55, 2-17 pp.
Aflaki, M., Shabaniyan, E. and Davoudi, Z., (2017). Deformation evidence from Plio-Quaternary paleostress
in Mahneshan Miyaneh basin, Bulletin of Earthquake Science and Engineering, Year 4, V. 4.
Eliasi, M., and Ahmadian, S., (2009). The geometric arrangement of σ1 paths in the Kan-Karaj extension
(south-central Alborz) based on multiple inversion method. Earth Science, Spring 1387, Vol. 17, No. 67, 140-
149 pp.
Pourbeyranvand, Sh. (2013). Stress variations in the Zagros by inversion of earthquake Focal mechanisms,
Ph.D. These, University of Tehran, Tehran, Iran.
Pourbeyranvand, S., 2018. Stress studies in the Central Alborz by inversion of earthquake focal mechanism
data. Acta Geophysica, 66(6), 1273–1290. DOI: 10.1007/s11600-018-0207-1
Sa’adat, M., Alavi, A. and Saeedi, A., (2005) Analysis of Fragile Tectonics and PaleoStress pattern in the east
of Tehran. 24th Earth Sciences Conference, Tehran, Geological Survey. 24th Earth Sciences Conference,
Tehran, Geological Survey.

The effect of dextral Abarkuh Fault on the occurrence of sinistral top-to-the NW
deformation in the Zagros Hinterland Fold-and-Thrust Belt, Iran
Ghanbarian, M.A.1, and Sadeghi Mazidi, M.1
1Department of Earth Science, College of Science, Shiraz University, Shiraz, Iran
E-mail: [email protected]
The sinistral top-to-the NW deformation in the ductile and brittle-ductile shear zones of the central
part of the Zagros Hinterland Fold-and-Thrust Belt (ZHFTB) has already been introduced. In the
present study, fault slip data, pressure-solution seams (stylolites), and en-echelon vein arrays were
investigated in the rock exposures with different ages, in the northeastern margin of Fars Province
(between north of Bavanat to north of Shurjestan as an important part of the ZHFTB), via an
intensive field campaign. The results of this study indicate that in the time span of the occurrence of
these structures, the maximum principal (σ1) stress axes were horizontal and directed towards NE-
SW and ENE-WSW. These directions are compatible with the expected directions of σ1 stress axes
responsible for occurrence of the sinistral top-to-the NW ductile and brittle-ductile shear zones of the
area. This compatibility indicates a longstanding stable stress condition over a long period and
different pressure/temperature conditions. This may suggest the occurrence of a major dextral NW-
SE trending fault in the NE of the ZHFTB (i.e. 25 km NE of the Main Deep Fault or Abadeh Fault)
which we named it Abarkuh Fault. The dextral activities of the Zagros Thrust System and this
newly-recognized fault, which are subparallel, might result in the sinistral top-to-the NW
deformation in the area between the Abarkuh Fault and the Main Deep Fault (i.e. ZHFTB). Although
the Abarkuh Fault is hidden by Quaternary alluvium of the Abarkuh plain, a significant change in
topography between the Abarkuh plain and its southwestern mountains (e.g. the Hambast and the
Pouzehsiah Mountains) and great age difference of rock units of the Esteghlal Anticline and its
northeastern rock exposures may be evidence of the existence of the Abarkuh Fault.
KEYWORDS: Central Iran, Fault slip inversion, Stress inversion, Stylolite, Tension gash.

Eocene to Quaternary deformation and stress filed in Central Iran
“Evidence of an anticlockwise rotation”
Babaee, S.E.1, Hajiloo, M.1 and Rezaeian, M.1
1Department of Earth Sciences, Institute for Advanced Studies in Basic Sciences (IASBS), Zanjan 45137-
66731, Iran
E-mail: [email protected]
Paleostress analysis data in the northern edge of the Urmia-Dokhtar Magmatic Arc (UDMA) in the
south of Qazvin is presented. Evolution of stress filed related to the geodynamic events reveals eight
different fields since Eocene. Tens of structural outcrop in folds and faults was investigated in the
Cenozoic formations. To analyse the fault slip data, we used multiple inversion method (MIM;
Yamaji 2006) that has an advantage in separating multiple stress tensors from a heterogenous data
set. Four parameters including stress ellipsoid form and stress axes were calculated based on the
multiple inversion method that detects temporal change of tectonic stress state. Stress state for eight
major deformation phases reveals that the orientation of the maximum horizontal stress axis has an
azimuthal change from 165° to 20° during Eocene to present time. That coincide with a 145 degree
anticlockwise rotation of maximum horizontal stress in less than 56 million years during Cenozoic.
The geodynamic regime in this area has been governed by several tectonic phases in Eocene to
Pliocene which correlated with those in the Iranian Plateau. Three tectonic phases in the Eocene
(compression, transtension and transpression), two phases in the Oligocene (compression and
transpression) were introduced. Also, in the Oligo-Miocene, Miocene and Pliocene a transpressional,
compressional and transpressional tectonic regime were detected, respectively. The anticlockwise
rotation of the stress filed was investigated through Iranian Plateau, it can be tentatively supported by
hypothesis of an anticlockwise change in the movement direction of the Arabian indenter with
respect to the Eurasian plate.
KEYWORDS: Paleostress; Cenozoic; anticlockwise rotation

Microstructural characteristics of the mylonitic rocks in the
TanbourMetamorphic Complex, Sanandaj-Sirjan metamorphic belt, SE Iran
Mansouri, S.M.1, Keshavarz, S.1*, Shahpasandzadeh, M.1, Faghih, A.2
1Department of Earth Sciences, Graduate University of Advanced Technology, Kerman, Iran
2Department of Earth Sciences, College of Sciences, Shiraz University, Shiraz, Iran
Email: [email protected]
Tanbour Metamorphic Complex is located east of the Sirjan within the Sanandaj-Sirjan metamorphic
belt, SE Iran. Deformed and metamorphosed rocks of this complex consist of slates, phyllites,
chlorite schists, actinolite schists, marbles, mica schists, garnet schists and amphibolites, gneisses,
metasandstone and metabasic rocks. The sedimentary protoliths were turbiditic sandstone, carbonates
and politic rocks, which are metamorphosed regionally up to amphibolite facies (Dimitrivic, 1973;
Moazzen, 2004; Moradian et al, 2005). While there is no radiometric data for the metamorphism
history and rocks, based on microfossil studies, Lower to Upper Permian ages were suggested for
phyllites, slates and garnet-mica schist (Mijalkovic and Saric, 1973; Safei et al., 2015). Polyphase
deformation is highlighted by occurrence of two generations of foliation in this deformed zone,
where the first and dominant phase of deformation produced a penetrative foliation (S1) in mica-
garnet schists and actinolite schist. This foliation has a mean attitude of N50°W, 20°NE. The second
phase of deformation produced asymmetric crenulation cleavage (S2), which commonly lies at an
angle of about ~35° to S1. In addition, two generations of mineral/stretching lineation have been
recognized in the amphibolites, schists and gneisses in the study area. Several mesoscopic and
microscopic structures including lenticular/subrounded δ- and σ-type K-feldspar porphyroclasts,
quartz petrofabrics, veins and drag folds were used to estimate strain (Passchier &Trouw, 2005;
Mukherjee, 2017). Kinematic indicators including S-C shear bands, asymmetric mantled
porphyroclast, oblique quartz foliation, domino-like structure and mica fish confirm strong dextral
sense of ductile shearing. Microscopic evidence in the quartz-rich samples indicate the presence of
two type of recrystalization regims, which characterized by deformed ribbon quartz, weak
undulatory, oblique grain shape alignments and lobate boundaries microstructures and second type of
quartz grains typically have straight grain boundaries and relatively uniform sizes that are similar to
adjacent subgrains. These features show intracrystalline deformation accompanied mainly by grain
boundary migration (GBM) and subgrain rotation (SGR) recrystallization of quartz, respectively.
Deformation of feldspar porphyroclasts in the Tanbour mylonites ranges from fracturing to bulging
recrystallization (BLG) and subgrain rotation (SGR). Dynamic recrystallization and dislocation
creep regimes, derived from quartz and feldspar microstructures studies provide further constrains on
deformation temperature in sheared rocks, although they are also controlled by strain rate, existence
of fluid phases and 3D strain-type geometry(Stipp et al., 2002; ). The textural features of the quartz
and feldspar in the study area indicate temperature of mylonitization range between 450 and 600°C
in the amphibolite facies conditions.
KEYWORDS: mylonites, shear zone, Sirjan, Tanbour metamorphic complex, Zagros

Hydrogeological Structure of the southern portion of the Anar fault, Central
Iran
Kardoost, A. 1, Shahpasandzadeh, M. 1 *, Keshavarz, S. 1, Abbasnejad, A. 2 1Department of Earth Sciences, Graduate University of Advanced Technology, Kerman, Iran 2Department of Geology, ShahidBahonar University, Kerman, Iran
Email: [email protected]
The subsurface flow model of faults, cutting poorly lithified sediment, constitute one of the greatest
uncertaintyin many fields of subsurface fluid research due to their wide range of potential hydraulic
behaviour. The conduit, barrier or conduit-barrier behaviour of faults can impact groundwater
resources (e.g. Caine et al., 1996); For example, compartment of aquifers by fault barriers can limit
the extent of accessible groundwater, or prevent the spread of contaminants.In contrast, fault
conduits can influence groundwater recharge, or provide pathways for salt water intrusion
intofreshwater aquifers. An understanding of theseprocesses is important for protecting groundwater
supplies in modern societies (Wada et al. , 2010). Although there is a reasonable understanding of
how faults impact fluid flow in crystalline or lithified rock, less is known about how faults in poorly
lithified sediment impact groundwater flow. These sediments accommodate major aquifers in Iran.
Located in an arid and semi-arid region, the central Iran is struggling with the recent droughts and a
constant drop in groundwater levels due to irregular harvests. This condi_on has made the region
vulnerable to social and environmental crises. Hydrogeological structure of faults such as the Anar
fault isone of the most ambiguous issue in many groundwater studies (e.g.; Rawling et al., 2001;
Caine et al., 1996).This research illustrates the hydraulic behaviour of the southern por_on of the
Anar fault and identify the structure and deformation processes of the fault zone in poorly lithified
alluvial sediment, which influence fluid-flow. In this research, the outcrop inves_ga_ons of the
sediments are used to deduce fault zone hydraulic conduc_vity structure. In fact, the behaviour of the
fault in poorly lithified alluvial sediment was determined by the structural and hydrogeological
features of the fault. The 200-km-long Anar strike-slip fault is known as aseismically ac_ve fault
with a minimum slip rate es_mate of 0.8 ± 0.1 mm/yr in the central Iran (e.g. Le Dortz et al., 2009;
Foroutan et al., 2012). In this research, we have focused on the southern portion of the fault, which
runs along the Anar salt flat and through the populated city of Anar. The fault affected locally
voluminous deposits of poorly lithified alluvial sediment, constituting the aquifer and confining units
of the Anar plain. With an averaged net sedimentation rate of ~ 0.47 ± 0.11 mm/yr) Foroutan et al.,
2012), the age of the aquifer could be poorly constrained between 240 to 480 ka. The aquifer is
characterized dominantly by alluvial deposits, composed of coarse gravel alluvial conglomerates,
inter-bedded with sand and clay layers. The fault zone structure was found to be different along the
southern portion of the Anar fault.The mixed zone scomprise of variably deformed sediment that
accommodate the majority of strain. Specific structural elements in the mixed zones differ according
to the lithology, in particular the rheology and stratigraphic relationships. The mixed zones are
flanked by damage zones. The damage zones comprise antithetic or synthetic subsidiary faults that
cutsometimes disaggregation bands that cut fine-grained sediment. Our findings show the cemented
fault zones could reduce fault zone hydraulic conductivity more than primary fault zone processes.
Although the most modest method of understanding fault zone hydrogeology is through analysis of
hydrogeological data, analysis of the hydraulic head either side of the southern portion of the Anar

fault infer the seal capacity of northern segment of the fault. In addition, the estimated hydraulic
conductivity of fault zone in the north and south segments of the southern portion of the Anar fault
are 1.38 E-04 and 2.54 E-04, respectively.
The gradient of groundwater at the north of Anar fault is from the west and northwest towards east
and southeast, but at its southern part, from the west and southwest toward the east and northeast.
Groundwater at the west of Anar fault, which is the recharge area, is much fresher than in the east, so
that it abruptly becomes saline at the east. The depth of groundwater at the west of this fault is less
that its eastern part, and additionally, there is a sharp difference in groduwater depth between the
southern and western sides. Accordingly, this fault behaves as a low permeable barrier, because of
chemical precipitation (especially aragonite) in the fault zone, as well as just a position of permeable
and non permeable layers against each other. The mother wells or all Qanats near the fault zone lies
at the west of fault.
This means that the eastern side has not sufficient groundwater and groundwater is collected in the
west. In another words, upon reacharging the west of the fault, where groundwater is accumulated,
there is no need to continue excavation of Qanats.
KEY WORDS: Fault zone hydraulic behaviour, hydraulic conduc_vity, Anar Fault, central Iran References
Caine, S. J., J. P.Evans, C. B.Forster, 1996., Fault zone architecture and permeability structure.
Geology 24, 1025-1028.
Le Dortz, B. Meyer, M. Sebrier,H. Nazari, R. Braucher, M. Fattahi,2009., Holocene right-slip rate determined
by cosmogenic and OSL dating on the Anar fault, Central Iran. Geophys. J. Int. 179,
700-710.
Foroutan,M., M. Sebrier, H. Nazari, H.Meyer, B. M. Fattahi,A. Rashidi, 2012., New evidence for large
earthquakes on the Central Iran plateau:palaeoseismology of the Anar fault , Geophys. J. Int.
189, 6–18.
Wada, Y., L.P.H.Van Beek, C.M. Van Kempen, J.W.T.M. Reckman, S.Vasak, and M.F.P. Bierkens, 2010.,
Global depletion of groundwater resources.Geophysical Research Letters 37, L20402.

Structural pattern of the Shirinak Cu deposit in the Urumieh-Dokhtar magmatic
arc
Ebrahimi, Z.1, Shahpasandzadeh, M.1 *, Keshavarz, S.1, Bani Amerian, J.1 1Department of Earth Sciences, Graduate University of Advanced Technology, Kerman, Iran
Email: [email protected]
Emplacement of porphyry/vein-type Cu deposits is not only influenced by magmatic and
hydrothermal processes, but also by the prevailing regional structures and tectonic regime (Richard
et al., 2012; Asadi et al., 2014). The Cu deposits often occur in island arcs, continental magmatic
arcs, and collisional tectonic setting. The geological studies (e.g. Shafiei et al., 2009; Zarasvandi et
al., 2015; Asadi, 2018) manifest Cu deposits in the Kerman Cenozoic magmatic arc (KCMA), as the
southeastern part of the Urumieh-Dokhtar magmatic arc, was associated with a common calc-
alkaline magmatism and tectonic regime.
Determining structural pattern and role of structures in emplacement/deformation of the Cu deposits
have a great importance in preparing 3D geological models and ore exploration. No structural studies
have been carried out in the Shirinak Cu ore deposit yet. The purpose of this research is constraining
structural pattern and determining structural controlling of the ore deposit. With detailed field
mapping, geometrical/kinematic of the structures and their relationship with Cu mineralization have
been constrained.
The Shirinak Cu deposit is mainly composed of Upper Eocene volcanic and pyroclastic rocks of the
Razak Complex, which is intruded by sub-volcanic granodioritic-dacitic and latter dioritic-
monzodioritic plutons, influenced by hydrothermal alterations. The Cu mineralization occurs mainly
in the siliceous vein/veinlet networks.
According to this research, the 3D geological model of the ore deposit is suggested as a granitoid
stock, intruded by dibasic dykes. In this model, intrusion of the granodioritic-dacitic plutons, as the
first magmatic phase, was associated with ore mineralization. Emplacement of the stock is controlled
by nearly parallel NW-SE striking right-lateral with reverse-component faults; similarly, the NE-SW
striking left-lateral strike-slip faults restricted the plutonic extrusion. The vein/veinlet Cu
mineralization often recorded along these latter faults, which usually intersect the former NW-SE
striking faults. Interestingly, field evidences display a network of aforementioned fault system in the
ore district. According to the interaction and mechanism of the prevailing fault system, we suggest a
rhomboidal horst-graben structure for the Shirinak Cu deposit.
KEY WORDS: Structural style, structural controlling, fault, Shirink Cu deposit, Kerman
Reference:
Asadi, S., Moore, F. and Zarasvandi., A. 2014, Discriminating productive and barren porphyry Cu deposits in
the southeastern part of the Central Iranian volcano-plutonic belt, Kerman region, Iran: A review. Earth-
Science Reviews 138, 25–46.
Asadi, S., 2018, Triggers for the generation of post–collisional porphyry Cu systems in the Kerman magmatic
copper belt, Iran: New constraints from elemental and isotopic (Sr–Nd–Hf–O) data, Gondwana Research, 64,
97-121.
Richards, J. P., Spell, T., Rameh, E., Razique, A. and Fletcher, T., 2012, High Sr/Y magmas reflect arc
maturity, high magmatic water content, and porphyry Cu ± Mo ± Au potential: examples from the Tethyan
arcs of central and eastern Iran and western Pakistan. Economic Geology 107, 295-332.
Shafiei, B., Haschke, M., and Shahabpour, J., 2009, Recycling of orogenic arc crust triggers porphyry Cu
mineralization in Kerman Cenozoic arc rocks, southeastern Iran. Mineralium Deposita, 44, 265.
Zarasvandi, A., Rezaei, M., Sadeghi, M., Lentz, D., Adelpour, M. and Pourkaseb, H., 2015. Rare earth
element signatures of economic and sub-economic porphyry Cu systems in Urumieh-Dokhtar magmatic arc
(UDMA), Iran. Ore Geology Reviews 7, 407-423.

Kinematics and active tectonics of the NW continuation of the Zagros Main
Recent Fault (NW Iran)
Niassarifard, M.1, Shabanian, E.2, Solaymani Azad, S.3, Madanipour, S.1
1Department of Geology, Tarbiat Modares University, Tehran, Iran.E-mail: [email protected]
2Department of Earth Sciences, Institute for Advanced Studies in Basic Sciences (IASBS), Zanjan 45137-
66731, Iran
3Seismotectonics & Seismology Department of Geological Survey of Iran
The Main Recent Fault (MRF) is a major active strike-slip fault system on the border between the
northern Zagros belt and Central Iran. Both the geometry and kinematics of the fault is rather well-
known along its central part and at the SE termination of the fault system, while our knowledge on
the geometry, structural pattern and kinematics of the continuation of the fault system towards
northwest from the Piranshahr fault (NW Iranian Kurdistan) is insufficient. The lack of such kinds of
data has hampered any conclusion on the structural and geodynamic roles of the MRF in the
accommodation of ongoing deformation in NW Iran and SE Anatolia. Traditionally, the MRF is
considered to be turn NW into the Bitlis thrust zone system changing its pure dextral strike-slip
character. Nevertheless, possible relationship between this major crustal fault system and other main
faults and their related deformation in NW Iran – SE Anatolia is unclear. This study is aimed at (1)
characterizing both the geometry and kinematics of faulting, as well as the pattern of Quaternary
displacements along the NW continuation of the MRF, and (2) describing its possible structural
connection to the nearby main active faults of the region. The geodynamic role of the fault in the
accommodation of ongoing convergence in NW Iran is investigated in the light of collected data and
deduced results. We have used a combined approach including fault-slip data analysis and tectonic
geomorphology to investigate active faulting of the MRF in NW Iran. More than 425 fault-slip data
were gathered and analyzed from Quaternary and active fault zone in the region between Khoy and
Piranshahr town. Our original results indicate that, to the north of latitude 37°N (NW from
Piranshahr town), the main zone of the MRF continues northwards along a branch of the Neotethyan
suture up to the sinistral Khoy – Baskale fault zone in SE Anatolia. This almost 200 km long active
fault system is transtensional dextral in character and is constituted by several strike-slip and normal
fault zones. Another branch of the MRF turns to NW in the north of Oshnavieh town into the
Yuksikova-Semdinli fault in the southeast of Lake Van (Turkey). Our results also reveals that the
NW continuation of the MRF clearly terminates to a NE-striking sinistral fault zone. In that area, the
active dextral shear between Arabia-Central Iran is accommodated by ESE-trending extension
localized at the intersection zone of the NNW-SSE dextral and NE-SW sinistral faults. The
extensional basins in the west of Lake Urmia and SE Lake Van are resulted from this plate boundary
related extension.
KEYWORDS: NW Iran; SE Anatolia; Zagros suture; Fault slip-data analysis; MRF; strike-slip fault

Active deformation in the north of Zagros – Makran transition zone using
Quaternary fault kinematics data
Hassanzadeh, M.1, Shabanian, E.1, Ghods, A.1 1Department of Earth Sciences, Institute for Advanced Studies in Basic Sciences (IASBS), Zanjan 45137-
66731, Iran
E-mail: [email protected]
The transition between subduction to collision zones mostly are separated with sharp lithospheric
fault. These fault zones are similar to transform faults and may capable of seismic activity. There are
some regions in the world which have this condition, e.g., west of Greece (Baker et al., 1997)
،Taiwan (Kao et al., 1998) and New Zealand (Anderson et al., 1993). South-Eastern of Iran is the site
of a rare case of young transition between the Zagros intra-continental collision and the Makran
oceanic subduction. This transition zone is not like the above cases. Some geologists believe that the
main structure and deformation of this zone is control by the ZMP (Zendan-Minab-Palami) fault
system. There are scattered seismicity in the north and no seismicity in the south of this transition
zone (Yamini-Fard et., 2006). Thus the pattern of seismicity in this area does not show a lineament
around the ZMP fault system and this may indicate a complex deformation model. Therefore
detection of nature, a pattern of active deformation and seismic potential of this transition zone is
very important. Also, it would be useful to know more about other similar regions in the world.
In this study, data were used include remote sensing, satellite imagery, digitized geological and
papers map, a pattern of active faults with topography and morphotectonic evidence and field
observations. After preparing the fault map using remote sensing analysis of satellite images,
depicted faults were controlled and validated by field observations. Structural data (mainly including
bedding attitudes, strike, dip and rake of fault planes, with well-known senses) were gathered in
several outcrops along the main fault zones in 12 days. The active tectonic investigations based on
prepared fault maps, field observations, and fault-slip measurements in 15 important outcrops along
the main faults, allows proposing a modern kinematic model for the northern part of the study area.
This model explains a variety of faults with different kinematics, all compatible with a NE
compression. Also, suggesting that active deformation is taken up by a complex fault network
comprising differently-oriented faults reactivated in the present-day stress state.
KEYWORDS: Collision, Makran, Subduction, Transition zone, Zagros
References
Byrne, D. E., Sykes, L. R., & Davis, D. A. N. M. (1992). Great Thrust Earthquakes and aseismic slip along
the plate boundary of the Makran, 97(91), 449–478.
Gholamzadeh, A., Yamini-Fard, F., Hessami, K., & Tatar, M. (2009). The February 28, 2006 Tiab earthquake,
Mw 6.0: Implications for tectonics of the transition between the Zagros continental collision and the Makran
subduction zone. Journal of Geodynamics, 47(5), 280–287.
Kao, H., Jian, P. R., Ma, K. F., Huang, B. S., & Liu, C. C. (1998). Moment‐tensor inversion for offshore
earthquakes east of Taiwan and their implications to regional collision. Geophysical Research Letters, 25(19),
3619-3622.
Niazi, M., (1980). Microearthquakes and crustal structure off the Makran coast of Iran. Geophysical Research
Letters, 7(5), 297-300.

Regard, V., et al., (2010). The transition between Makran subduction and the Zagros collision: recent
advances in its structure and active deformation. Geological Society of London, Special Publications, 330(1),
43–64.
Yamini-Fard, F., Hatzfeld, D., Farahbod, A. M., Paul, A., & Mokhtari, M. (2007). The diffuse transition
between the Zagros continental collision and the Makran oceanic subduction (Iran): Microearthquake
seismicity and crustal structure. Geophysical Journal International, 170(1), 182–194.

Seismotectonics of Central Alborz
Banimahdi Dehkordi, M. J.1, Ghods, A.1, Mousavi, Z.1, Shabanian, E.1, and Abbasi, M.2
1Institute for Advanced Studies in Basic Sciences 2University of Zanjan
E-mail: [email protected]
The tectonic activity in the Alborz mountain range, northern Iran, is due both to the northward
convergence of central Iran toward Eurasia, and to the northwestward motion of the South Caspian
Basin with respect to Eurasia. The motion is oblique to the belt and involves roughly ~5 mm/y of
shortening and ~4 mm/y of left-lateral strike–slip motion. Previous studies have shown Central
Alborz has a low rate of strain rate, especially around Tehran city. The low strain rate has been
further distributed between several large active faults. The low seismicity, large recurrence time of
earthquakes, a large number of active faults and sparse seismic networks are the main obstacles to
study the seismotectonics of the region. There are several precise seismotectonic studies in Tehran
region but they are for small regions, performed over short periods and does not cover the whole
Central Alborz. To overcome some of the mentioned obstacles, we take two approaches. First, we
have compiled a new catalog of earthquakes and focal mechanisms for Central Alborz by compiling
waveforms of all permanent and temporary seismic networks in the region over the period of 1996-
2019. By combining the data from all the networks, we have improved the azimuthal coverage and
decreased the possibility of systematic location biases caused by deviations of the assumed travel
time model from the true Earth. By expanding the time period of our catalog, we have increased the
number of well-located events and focal mechanisms by as much as possible. We first located all
events using manually picked Pg and Sg arrival times and then applied a multiple-event relocation
analysis to precisely relocate some of the seismic clusters. Figure 1 shows single-event location of
490 events. By visual inspection of waveforms, we made sure that the selected events are not related
to explosions. The selected events have Pg azimuthal gap smaller than 180 degrees. Figure 2 shows
60 focal mechanism solutions derived using first polarity method. To obtain the focal mechanism
solutions, we face the problem of temporal polarity change of short period stations of IRSC seismic
networks. We have overcome this problem by calibrating the polarities using larger events and also
using teleseismic events. The seismicity map (Fig. 1) shows that the seismicity is mostly
concentrated in the east of Central Alborz along Mosha, Firuzkuh, and Astaneh faults. Our focal
mechanism solutions indicate a mostly left-lateral strike-slip mechanism. Unlike Firuzkuh and
Astaneh faults, the seismicity along Mosha fault is more disperse, implying the fault is connected to
a myriad of subsidiary faults. Seismicity along the so-called Garmsar fault is mostly limited to the
segment south of Kavir Kuh and it seems that the eastern part of the Garmsar fault is related to the
front of the salt glacier and is not an active fault. We detect a rather disperse and disconnected
alignment of seismic events along Hableh Rud valley. The disconnected seismicity along the Hableh
Rud is very correlated with the salt extrusions in the region. Events along the lineament have either
thrust or strike-slip sense of motion. Second, in order to study the present-day crustal deformation,
we use two types of data, first Iranian Permanent GPS Network (IPGN). It’s contain 28 stations that
data was collected from 2006 to the end of 2018 and second 55 km network stations, it’s contain 18
stations. This is the first time such data will be used. Figure 3 indicates that IPGN stations generally
scattered near Tehran, where Kahrizak, Mosha, and North Tehran faults located. East of the study

region, there are only one IPGN station and four 55 km stations. The concentration of 55 km network
stations in this area helps us to investigate the answer of challenging question on North Alborz and
Khazar faults in more details. The distribution of 55 km stations in south and east-south of Garmsar
fault can help us to overcome the lack of IPGN stations in this area. In addition, in the west of the
interesting area, liniments at the north of the Taleghan fault and south of the Eshtehard fault, have
not covered by IPGN stations, while 55 km network covered all around this gap area. By collecting
the combination of both GPS networks we can present more precise and valuable results.
KEYWORDS: Iran, Central Alborz, Seismotectonics, Focal mechanism, GPS, Faults


Fault kinematics and stress history in the Makran accretionary wedge, SE Iran
Aghdamirad, H.1, and Najafi, M.1
1Institute for Advanced Studies in Basic Sciences
E-mail: [email protected]
The Makran is one of the largest accretionary wedges on Earth, produced from the convergence
between the Arabian and Eurasian plates since the Late Cretaceous. It is associated with the active
subduction of the Arabian oceanic lithosphere at a present-day rate of about 20 mm/a in an almost
northward direction (McQuarrie et al. 2003).
In this study, a combination of remote-sensing mapping and field survey (more than 700
measurements) permit to define the gemetry and mechanism of faulting and the variations of stress
field in time and space, across the Makran. The results indicated that, the modern stress field in the
north, inner, outer and the north part of the Coastal Makran has an NE-SW compression direction,
which is in accordance to earthquake focal mechanisms and GPS vectors. Althoug, the paleostress
field show an N-S compression direction, perpendicular to the trend of folds and thrusts. This early
E-W fold-and-thrust system is displace by NE-SW sinistral and N-S dextral recent transverse faults.
However, the coastal Makran has experienced a different evolution of the stress fields. The area had
an NNE-SSW compressional system during Miocene, which was replaced by an extensional regime
in Plio-Quaternary. Consequently, the Miocene sedimentary rocks in the north part of the Coastal
Makran recorded both compressian and extensional events, although, the Plio-Quaternary sediments
only show the extensional fault systems (Fig. 1).
KEYWORDS: Makran Accretionary Wedge, Subduction Zone, Fault Kinematic, Stress Field

The Kharvana Fault System as an active fault system in NW Iran
Mesbahi, F.1, Bakhti, K.1
1University of Tabriz, Faculty of Natural Science, Department of Earth Sciences
E-mail: [email protected]
The NW Iran as a part of the Alpine‒Himalayan orogenic belt is a dynamic and unstable region from
the viewpoint of tectonic and seismicity. Although several articles have already studied active faults
of NW Iran, many faults in this region are still remained unknown or not investigated. The Kharvana
Fault System is intoducing for the first time in this research.
The Kharvana Fault System with general NW‒SE trending folds and right-lateral strike-slip and
reverse faults is located in NW Iran, North-West of Tabriz city.
The geological maps, Landsat satellite images, earthquake catalogs and field measurements have
been used to verify structural and active tectonic features of the Kharvana Fault System.
The Kharvana Fault System could be considered as the southeastern continuation of the
Nakhichevan‒Sardarapat fault system in Azerbaijan toward NW Iran. The Nakhichevan‒Sardarapat
fault system with dextral strike-slip movement, consists of four segments with left-step en-echelon
pattern.Toward SE, the Kharvana Fault System reaches to the Qoshadagh active fault.
The WNW-ESE trending Qoshdagh Fault is a dominantly dextral strike-slip fault that is also called
South Ahar fault. The Qoshdagh Fault, is one of the most important active faults in NW Iran, from
the viewpoint of seismicity. In 2011, the twin earthquakes with the magnitudes of 6.1 and 6.3 in
Richter scale have occurred along the Qoshdagh Fault, which led to a lot of destruction and death in
the Ahar and Varzeqan towns. The major faults within the Kharvana Fault System from North to
South are Kharvana Fault with dextral strike-slip movement, Estarkhan‒Komar fault with reverse
movement, Nahand fault with dextral strike-slip and reverse movements and Zonouz fault with
dextral strikeslip movement.Based on the occurrence of earthquakes up to magnitude of 5 in Richter
scale and dextral displacement of the drainage pattern along the major faults within the Kharvana
Fault System, it is an active fault system.
KEYWORDS: NW Iran; Kharvana Fault System; dextral strike-slip fault; reverse fault; active fault

Geological arguments for a devastating earthquake in Alborz province
Malekzade, Z.1
1 Department of Geology, Payame Noor University, PO BOX 19395-3697, Tehran, Iran.
This article introduces the Alborz Master Fault Zone (AMFZ) as one of the major active fault
systems in Alborz orocline north of Iran. The AMFZ is a left-lateral strike-slip fault system
extending over a distance of 500 km from Tazareh syntax to the east to the Rudbar syntaxes in the
west and is related to oblique underthrusting of the South Caspian Sea plate beneath central Iran.
Therefore, the AMFZ is accommodating the boundary-parallel components of slip along obliquely
convergent plate margins. The AMFZ follows the strike of the Alborz orocline with two different
N65E in the eastern part and N65W in the western part. Each part of the AMFZ is responsible for the
devastating earthquakes. The fatal one was Qumis earthquake that is amongst the five biggest events
in the world.
The stress state along the AMFZ changed after the reorganization of Arabian plate convergence in
respect of the Eurasia and/or after developing the rectilinear Alborz to the orocline. This event is in
connection with the change of the transpressional tectonic regime to the transtensional one. This
study decides to show that after the change of stress state, the step overs that have already divided
the AMFZ to segments, play the role of the barrier against earthquake rupture and/or the rupture,
unless in especial condition, could not jump from one segment to another. This behavior of the faults
may suspect the Astaneh as the only causative fault for the Qumis earthquake that is a traditional
earthquake in Alborz.

Post-Pliocene Faulting in Polour region, central Alborz
Sharifi, A.1, and Yassaghi, A.1
1Department of Geology, Tarbiat Modares University, Tehran, Iran
E-mail: [email protected]
Structural analysis of Polour region in south and southeast of Damavand Mount in the central part of
Alborz demonstrates evidence of recent fault activity in Mesozoic to present deposits. In this region,
Quaternary basaltic and trachyandesitic rocks of Damavand Mount are the youngest masses laying
on the quaternary alluviums. Detailed structural mapping resulted in identification of two main NW
and NE-trending fault zones. The NE-trending faults that cut the quaternary rocks of the Damavand
Mount eruption are younger and have also cut the NW-trending one. Study of the fault kinematic
indicators such as slickensides and riedel shear fractures shows the faults mechanism from normal to
oblique slip (left-slip fault with normal component). Since the faults has cut the Damavand
quaternary rocks, they are the youngest faults in the region. It is proposed that the faults, like the NE-
trending Karaj-Chaloos Fault, have developed more likely by reactivation of older basement faults
during northwest wards movement of the South-Khazar block since Pliocene.
KEYWORDS: Central Alborz, NE-trending, left-slip Fault, Pliocene, South-Khazar block, Recent
faulting

Evaluation of Anthropogenic Contribution to Groundwater loss Using by
GRACE Satellite Gravity Data
Asaadi, S.1, and Joodaki, G.1
1Department of Surveying Engineering, University of Zanjan (ZNU), Zanjan, Iran
E-mail: [email protected]
In recent years and decades, the issue of drought has become one of the biggest global problems in
all arid and semi-arid regions of the world. Undoubtedly, identifying and monitoring drought can be
a great step toward struggling this global problem and reducing the resulting damage. The purpose of
this thesis is to investigate the feasibility of estimating the amount of groundwater in agriculture uses
by using GRACE satellite data. The level-2 GRACE satellite data is used to estimate the monthly
changes in groundwater levels in the Central Plateau Basin during the period January 2003 to July
2017. The results show a sharp decline in groundwater level changes trends (a volume decline of
about 142 cubic kilometres during this period) in the centre of Iran. By correcting and removing the
share of water equivalent to snowfall, rainfall, canopy and soil moisture, and also by using the
GLDAS hydrology model, it was shown that how much the groundwater volume has declined, and
by removing the amount of groundwaters from the results we find how much of the uses were used
in agriculture.
By using piezometric wells data as the correct data, and comparing them with the data obtained from
GRACE satellite, we found that these two series of data were in good matching, and it was
concluded that by using GRACE satellite data, the amount of groundwater reserves with an
acceptable accuracy could be estimated.
KEYWORDS: Drought, Groundwater, Hydrology, Grace Satellite, Piezometric wells

LAND SUBSIDENCE ANALYSIS IN THE ARDABIL PLAIN USING SBAS-
INSAR TECHNIQUE
Ghorbani, Z.1, Joodaki, G1, and Javadnia, E.1
1Department of Surveying Engineering, University of Zanjan (ZNU), Zanjan, Iran
E-mail: [email protected]
Ardabil Plain with an approximate area of 1097/23 km², is an inter-mountain plain in northwestern
Iran in the geographical coordinates of 38°5' to 38°27' North latitude and 48°9' to 48°37' East
longitude, has been encountered a significant drop in groundwater in recent years. Land subsidence
due to the exploitation of groundwater resources, and severe atmospheric changes; is one of the
environmental problems that must be investigated in a long-term research. Previous studies in this
study area have also generally focused on geotechnical methods of soil layers and geology to use
deformation information along with underground numerical simulations to detect land subsidence
mechanisms. However, a combination of radar interferometry technology and remote sensing
technology to investigate land degradation factors at various scales has rarely been studied.
Therefore, Interferometric SAR technique based on Small Baseline Subset (SBAS-InSAR) time
series analysis has been used to measure the displacement with the approach of creating a permanent
monitoring system and to show an overview of the existing threats posed by the subsidence of
Ardabil plain. In this study, two ENVISAT ASAR satellite image datasets were selected for the
period 2003 to 2006 related to descending pass orbits for track 235 with 16 images and track 6 with
20 images. By analysing the two descending pass data along the satellite line of sight, we find that
both tracks have a high degree of correlation and relatively good temporal overlap. Processing of
radar images shows that the southeastern part of Ardabil Plain, which has the largest volume of deep
wells utilized for agricultural and drinking purposes in the region, had the highest subsidence
behaviour compared to other areas. After reduction of residual topographic, orbit errors and
atmospheric phase error with the weather model corrections, the maximum subsidence rate in
Ardabil Plain was about 11 to 14 mm/year, which is consonance with geotechnical modelling results.
Thus, the feasibility and applicability of SBAS-InSAR technique in monitoring the surface
deformation of the study area could be one of the most suitable and effective methods for monitoring
local subsidence phenomena at different scales.
KEYWORDS: Ardabil Plain; Subsidence; Groundwater; ENVISAT ASAR; SBAS-InSAR; Time-
Series

Comparison of Different data Processing Strategies for Precise GPS
Observations across the Makran accretionary wedge, SE Iran
Kheradmandi, M.1*, Abbasi, M.2, Najafi, Z.1, Mousavi, S.1, Abbasy, S.3 1Department of Earth Sciences, Institute for Advanced Studies in Basic Sciences (IASBS), Zanjan, Iran 2Department of Surveying Engineering, University of Zanjan, Zanjan, Iran 3Department of Surveying Engineering, University of Isfahan, Isfahan, Iran
Email: [email protected]
The Makran accretionary prism is formed in the subduction zone between the Arabian and Eurasian
plates. Despite recent studies on the seismicity and structure of Makran, its active deformation is not
fully constrained. For this purpose, we installed 6 temporary GPS stations across the Makran onshore
accretionary wedge in southeast of Iran, from coastal line to the Jazmuran depression. These stations
were measured in two epochs in 2017 and 2018 with two Trimble 5700 receivers in three
consecutive sessions.
In this study we investigate the performance of two main GPS data processing strategies, i.e.
differential and Precise Point Positioning (PPP) for geodynamics applications. A differential
processing software gives the characteristics of the spatial baselines created between stations while
the PPP strategy gives directly the position of the station without any connection with other adjacent
points. This is why in PPP method one can directly estimate the velocity vector for each station.
In differential processing, two methods have been considered: the first one was to process only the
baselines between three pairs of stations giving the baseline of each session, and the second one was
to use the International GNSS Service (IGS) stations as reference points. The first method was
conducted using an available software and the second method via the online differential processing
software AUSPOS.
In PPP method we used two online processing services: CSRS-PPP and APPS. The first service is
given by the Natural Resources Canada (NRCAN) and the second one is given by Jet Propulsion
laboratory (JPL) of NASA.
The baseline length is the key parameter for geodynamical interpretations. The length obtained from
PPP method as well as from the differential processing AUSPOS service is compared by the lengths
estimated from differential processing software. The results are presented in Table below.
In Makran GPS profile conducted by Institute for Advanced Studies in Basic Sciences (IASBS) there
are six stations AZIZ, RAHM, RAMZ, TKHT, ESPK and SHMS. The measurement duration on
each station is at least 48h with 30s interval.
As it can be seen from this Table, the online service CSRS-PPP gives the nearest results to the
classical differential processing method. It can be suggested therefore that this free service can be
confidentially used for precise GPS data processing. The other advantage of this service is that it
gives the geocentric position and the corresponding error ellipse of any point at the end of
processing. One can therefore estimate the point velocity as well as its error ellipse for each point
separately.

Table. Differences of the baseline lengths estimated from different computation services with the
lengths obtained from differential GPS processing software. Measurements have been done in 2017
and 2018.
KEYWORDS: APPS; AUSPOS; CSRS-PPP; Geodynamics; GPS; Makran accretionary wedge

An investigation in the location forcasting of large earthquakes and subsequent
aftershocks using coulomb stress changes in the oblique collision zone of
arabiaeurasia tectonic plates
Rastbood, A.1, Bulghar, R.2, Ghanouni, B.3 and Ghasemzadeh, A.4 1Assistant Professor, Tabriz University, Tabriz, Iran. E-mail: [email protected] 2MsC Student, Tabriz University, Tabriz, Iran 3 MsC Student, Tabriz University, Tabriz, Iran 4 BsC Student, Tabriz University, Tabriz, Iran
Human being has been faced with destructive natural phenomenon specially earthquake for a long
time. It is essential to know the time and place of large earthquakes and their aftershocks in order to
warn of them to reduce the physical and financial damage. Maybe these days we can't predict the
earthquake occurrence exactly but the study about previous earthquakes can identify the areas with
high seismic potential and with this knowledge in building construction we can mitigate the damages
due to a large earthquake. Study of stress changes in the Earth's crust is useful for the predicting of
earthquakes probability. Analysis of Coulomb Stress Changes has been used in many seismic zones.
These studies showed that the area and the magnitude of next earthquake will affect by the static
stress changes which are the result of previous earthquakes in the region. In order to investigate the
possible location of large earthquakes, we compute cumulative co-seismic Coulomb Stress Changes
of 249 historical and instrumental earthquakes with magnitude (M > 5.5) in nine major regions in the
oblique collision zone of Arabia – Eurasia tectonic plates, in historical order, using the component of
stress associated with the fault orientation and slip direction of the next event. The results of the
earthquake interactions, show falling before or after of some next event. Also in order to know about
the area with the highest earthquake probability, we compute the cumulative Coulomb Stress Change
caused by the co-seismic deformation of historical and instrumental earthquakes on strike-slip and
reverse fault planes with optimum geometry. The results show that the hazardous areas that have the
potential for large earthquakes, could be the areas in the region of increased co-seismic Coulomb
Stress Change due to previous earthquakes and an active fault in the optimum direction of strike-slip
and reverse faults. Nine major regions of study area include: 1- NW IRAN, 2- Talesh, 3- Alborz
(Central and East Alborz), 4- Kopeh-Dagh, 5- Zagros (north and south sections), 6- Zagros-Makran
transition zone, 7- eastern region of IRAN, 8-Makran subduction zone, 9-Central region (east and
west sections). Study area is divided into 13 sections for three main reasons: (a) The regional stress
directions in different regions of IRAN are different, (b) Performing large-area computing at high
resolution will greatly increase processing time and (c) The co-seismic Coulomb Stress Changes on
next events at high spatial intervals, will be very low or zero. Also, in order to investigate the
possibility of spatial forecasting of aftershocks caused by an earthquake, we estimate the correlation
between spatial distribution of aftershocks and Coulomb
Stress Change pattern due to main-shock. The computation of Coulomb Stress Change of mainshock
was performed on strike-slip and reverse faults with optimum geometry and also on faults with
known geometry in the region. According to our calculations, most of the aftershocks occurred in the
areas of increased Columbian Stress Changes due to the main-shock.
KEYWORDS: Active Faults; Coulomb Stress Changes; Dislocation; Earthquake.

Multiresolution analysis of geodynamic network in theoblique collision zone of
arabia-eurasia tectonic plates using spherical wavelets
Rastbood, A.1, Bulghar, R.2, Ghanouni, B.3 and Ghasemzadeh, A.4 1Assistant Professor, Tabriz University, Tabriz, Iran 2MsC Student, Tabriz University, Tabriz, Iran 3 MsC Student, Tabriz University, Tabriz, Iran 4 BsC Student, Tabriz University, Tabriz, Iran
E-mail: [email protected]
In this research we present a spherical wavelet-based multiscale approach for estimating a spatial
velocity field on the sphere from a set of irregularly spaced geodetic displacement observations.
Because the adopted spherical wavelets are analytically differentiable, spatial gradient tensor
quantities such as dilatation rate, strain rate and rotation rate can be directly computed using the
same coefficients. In a series of synthetic and real examples, we illustrate the benefit of the
multiscale approach, in particular, the inherent ability of the method to localize a given deformation
field in space and scale as well as to detect outliers in the set of observations. This approach has the
added benefit of being able to locally match the smallest resolved process to the local spatial density
of observations, thereby both maximizing the amount of derived information while also allowing the
comparison of derived quantities at the same scale but in different regions. We also consider the
vertical component of the velocity field in our synthetic examples, showing that in some cases the
spatial gradients of the vertical velocity field may constitute a significant part of the deformation.
This formulation may be easily applied either regionally or globally and is ideally suited as the
spatial parametrization used in any automatic time-dependent geodetic transient detector. We have
presented both synthetic and real examples of multiscale estimations of velocity fields on the sphere.
This technique is well suited for dense geodetic networks and is straightforward to implement. First,
we estimate a two-component velocity field using spherical wavelet frame functions of multiple
scales. We then compute gradient quantities directly from the estimated field to identify potential
deformation signals. The primary control on the estimation is the spacing among the stations. Where
stations are dense, we allow for short-scale spherical wavelets in the estimation; where stations are
sparse, we allow only long-scale spherical wavelets in the estimation.
In our multiscale estimation, the residual field between the original field and estimated field may
reveal two key features. First, if there are systematic residuals in a particular region, then it is
probable that one needs to include shorter-scale wavelets in the estimation. Second, if there is a
strong residual at a single station, then the station is ‘anomalous’ and is either malfunctioning or is
capturing a signal that is not spatially resolved. The synthetic examples illustrate several basic points.
In the example with two dilatational sources, one much larger than the other, we saw the advantage
of the separation of scales in identifying subtle signals. This example also suggests that derivative
quantities based on observations from multiple sites will perform better in detecting signals than the
individual components of the velocity field and that the vertical component, if available, should be
used in estimating the velocity field, since deformation may not be predominantly in the horizontal
directions. With the real observations, we show the usefulness of separating the three-component
velocity field into constituent scales. The vertical velocity field contains spatially coherent features

with length scales typically less than those observed in the horizontal velocity field, which reveal
deformation across a broad plate boundary zone. Although some of the vertical velocity observations
are certainly influenced by non-tectonic effects, they should still be included—along with proper
uncertainty estimates—in the monitoring of signals in dense geodetic networks, especially in areas
with larger expected vertical motions, such as subduction zones. Regularization is required to obtain
a smooth estimated velocity field from the discrete observations. This is achieved through two
possible actions. First, one can cull the set of possible spherical wavelets based on the coverage of
observations. If each spherical wavelet has a sufficient number of observations constraining its
coefficient, then no regularization is needed.
Second, if all spherical wavelets are used for the inverse problem, then extensive regularization will
be needed, since most wavelets will have zero observations constraining their corresponding
coefficients. In our approach, we have chosen something in between these two ‘end-members,’
where we at the outset eliminate many candidate spherical wavelets based on data coverage, but we
still require a moderate amount of explicit regularization in the inversion. Our ultimate objective is to
monitor time-dependent signals in dense GPS networks. Because our emphasis is on continuously
recording GPS networks, our station coverage is not as dense as many published velocity fields,
which include campaign GPS measurements. In this study, we have only dealt with the spatial part of
the problem, showing that the multiscale representation is well suited to identifying and
characterizing geophysical signals of all scales. It also has the potential capability of removing scale-
specific noise. This approach is a step towards global multiscale monitoring of time-dependent GPS
displacement fields, in hopes of efficient and accurate characterization of Earth’s surface
deformation and the detection of geophysically important phenomena.
KEYWORDS: GPS Velocity Field; Spherical Wavelet; Multi-Resolution Analysis.

Influence of wavelength radar images in estimation of open-pit mine
displacements using radar interferometry technology (case study: Gol Gohar
Sirjan mine) Shami, S.1, Ghorbani, Z.2
1Faculty of Geodesy and Geomatics Engineering, K. N. Toosi University of Technology, Tehran,
Iran 1st 2 Department of Surveying Engineering, University of Zanjan (ZNU), Zanjan, Iran 2rd
E-mail: ([email protected])
The volume of minerals extracted from open-pit mines has always been of interest to mining
managers. In investigating displacement from open-pit mines and the dangers of its subsidence,
Radar interferometry with extensive ground cover, continuous and suitable temporal and spatial
resolution against methods such as alignment Leveling, Global Positioning System and UAV
photogrammetry which is generally expensive and time consuming, is an appropriate technique.
Because open-pit mines include large-scale displacement, the maximum displacement that can be
extracted through Radar interferometry technology is affected by two factors: the wavelength of the
radar images and the pixel dimensions of the Radar images. By maximising the wavelength of
images or decreasing the pixel dimensions of images, the maximum displacement obtained by Radar
interferometry technology can achieve. On the other hand, quick extraction in open-pit mines creates
a de-correlation between the images, which reduces the maximum displacement. To eliminate de-
correlation between images, selecting images with small spatial and temporal baselines can solve this
problem. In this study, the displacements of Gol Gohar Sirjan Mine No. 3 using interferograms
obtained from ENVISAT images with a wavelength of 5.5 cm and ALOS-1 images with a
wavelength of 23.5 cm and the volume extracted from No. 3 of mine calculated. The results show
that although the temporal baselines and pixel dimensions of the ENVISAT images were smaller
than the images of ALOS-1, the higher the wavelength of the images of ALOS-1 Radar, and
Detection and more extracted volume can be calculated. So that the maximum detectable
displacement of the ENVISAT images is 7.5 cm and that for the ALOS-1 images is 26 cm.
Therefore, as the Radar images wavelength increases. The amount of displacement is more
detectable, and the volume calculated from the mine will also come close to reality.
KEYWORDS: Radar Interferometry; Open-pit Mines; Wavelength Radar Images; Displacement;
Large-Scale; Gol Gohar Sirjan Mine

Application of fuzzy logic to identification planation surfaces using
Geomorphometric parameters in DEM
Latifi, S.1
1Payame Noor University of mianeh
E-mail: [email protected]
Planation surfaces characterized by slightly undulating and generally featureless topography can
result from long continued erosion and deposition in the absence of active deformation. When such
low relief surface are uplifted tectonically and intersected by erosion, they can form prominent
markers in the landscape. Since a standard identification method for preserved planation surface of
other prominent landforms has not been performed. Therefore, the use of local data and accurate
analysis of this data is important for the proper description of the geomorphology of the land surface
and has been growing at the level of current research.Therefore, the main purpose of the present
study was to identify the planation surfaces in the southern slopes of bozgush mountain range using
geomorphometric parameters using fuzzy logic method based on digital elevation model (DEM) in
geographic information system (GIS). In order to achieve this goal, four effective parameters
including: (1) curvature profile, (2) terrain ruggedness index, (3) slope and (4) surface ratio were
prepared. Each of raster layers defined and evaluated using of fuzzy membership function method.
After applying the functions, the membership degree was determined over the fuzzy overlay and the
final map was executed. The result show that planation surfaces with more then eighty percent of
membership degree is corresponds properly with field observations and geological studies. All these
indicate that they are remnants of once regionally continuous Planation surfaces which were
deformed by both the lower crust flow and the faults in upper crust, and dissected by the network of
Shahrchai River.
KEYWORDS: bozgush, DEM, fuzzy logic, geomorphometric, planation surfaces, tectonic.

Investigation of Kermanshah Aftershock Sequence using SAR Interferometry
Jafari, M1, Mousavi, Z1, Aflaki, M1, Motaghi, K1
1Institute for Advanced Studies in Basic Sciences
E-mail: [email protected]
In this study, we have investigated three aftershocks associated with the Mw 7.3 Kermanshah 2017
earthquake. On 25 August 2018, an earthquake with the magnitude of Mw 6.0 occurred in SW of
Javanrud in Kermanshah. The second one with the magnitude of Mw 6.3 occurred in SW of Sarpol-e
Zahab on 25 November 2018 and the third one occurred in SW of Halabjah (Iraq) with the
magnitude of Mw 5.2 on 11 May 2019. Data were acquired on ascending and descending Sentinel-1
satellite passes. We used GMTSAR package to process SAR data. After the interferogram
generation, ZTD and planer correction have been applied by data which is provided through Generic
Atmospheric Correction Online Service for InSAR (GACOS) website. We estimated the coseismic
displacement map related to this aftershock sequence. Then, we evaluated the causative fault plane
for the first aftershock, Javanrud, by using Okada [1985].
KEYWORDS: Aftershock, Kermanshah, Sentinel-1, GMTSAR, ZTD

Permanent GNSS Network for Crustal Deformation Monitoring in Iran
Nankali, H.1, Saadat Y-djamour, A.1, Walpersdorf A.2, hossini, S.1, khorami, F.1, Tavakoli, P.1, Tavakoli, F.1,
Mousavi, Z.3, Sedeghi, M.1
1National Cartographic Center of Iran- Tehran, Azadi Sq.Meraj Ave. Po.Box:13185-1684
2University Grenoble Alpes, CNRS, IRD, IFSTTAR, ISTerre, 38000 Grenoble, France
3Department of Earth Sciences, Institute for Advanced Studies in Basic Sciences (IASBS), Zanjan, Iran
Email: [email protected]
In 2005, National Cartographic Center of Iran (NCC) engaged to establish the Iranian Permanent
GNSS Network (IPGN) covering the whole country for continuous measurements.We present the
most extensive new unified GPS velocity field and times series, including all newly processed data
from the Iranian Permanent GNSS Network (IPGN) collected for 12 years (2006-2018). Finally, we
obtain the most comprehensive strain rate map of Iran at large scale. This new processing will bring
us more precise information on reference frame realization, crustal deformation, fault slip rate and
geophysical phenomena in Iran.

Earthquake Probability investigation by defining high risk areas in Kermanshah
and its surroundings by means of Probabilistic Seismic Hazard Assessment
Amirian, F.1, Dolatabadi, N.2, Sadidkhouy, A.3 1M.Sc. student, Institute of Geophysics, University of Tehran, Iran 2M.Sc. student, Institute of Geophysics, University of Tehran, Iran 3Assistant Professor, Institute of Geophysics, University of Tehran, Tehran, Iran.
E-mail: [email protected]
Kermanshah province is located in the Zagros seismotectonic province and has witnessed many
earthquakes throughout history due to its special position. The Zagros is located on the northern
margin of the Arabian Plateau on the Precambrian metamorphic basement. From a structural point of
view, the convergent movement of the Arabian Plate in the southwest and the central Iranian ridge in
the northeast has produced this strip. Kermanshah province has high seismic activity due to its
location in the Zagros area. One-way catalogs and fault maps for the area are needed for hazard
analysis. Using geological maps of the study area and using QGIS software, a map of faults was
prepared. Then, a catalog of historical and instrumental earthquakes of the area was prepared using
earthquake databases (USGS, IRSC, IRIS, ISC). The catalog must be on one magnitude scale to
integrate the catalog. Therefore, by using the empirical relationships obtained by drawing graphs,
these magnitudes are transformed and all are transformed and ordered in terms of unique magnitude.
A-value, b-value, Mc and other seismic parameters calculated using zmap software. Based on the
trends of earthquake faults and clusters, seismic maps were selected for the two area source and
seismic parameters and zmap diagrams were obtained for each source. The KIJKO software is used
to obtain the parameters needed to prepare hazard analysis maps. Using Campbell-Bozorgnia
attenuation relationship, CRISIS 2015 software performed hazard analysis and mapping. Given that
the buildings in the study area are with the period of the structures is 0.4 (s) and 1(s). Peak ground
acceleration and spectral acceleration is calculated for the return period of 50 years and 475 years.
KEYWORDS: Crisis, Hazard map, Kermanshah, QGIS.

Presenting Uniform Hazard Spectra maps for the probabilistic seismic hazard
assessment of Zanjan region including the 1990.06.20 Rudbar earthquake
Sirati, E.¹, Dolatabadi, N ², Sadidkhouy, A.³
¹ M.Sc. student, Institute of Geophysics, University of Tehran, Iran, [[email protected]]
² M.Sc. student, Institute of Geophysics, University of Tehran, Iran, [[email protected]]
³ Assistant Professor, Institute of Geophysics, University of Tehran, Tehran, Iran.
E-mail: [email protected]
Zanjan historical area placed in Alborz-Azerbaijan seismotectonic province has undergone many
geological changes due to seismic events and has experienced many casualties and financial losses.
The city of Rudbar survived a M=7.3 earthquake in 1990.06.20 which caused faulting and put a lot
of focuses in this area as it suffered the loss of 14000 people and many building collapsed duo to
usage of material without sufficient resistance. Therefore, a way to reduce risk (hazard) and have a
better understanding of the area and alternatively build safely, hazard assessment studies are
required. The probabilistic hazard assessment reflects a more realistic result of seismic event by
collecting, merging catalogues from Mousavi et al. For historical earthquakes from pre A.D. to 2012
and seismological institutes like ISC (International Seismological Center), IRSC (Iranian
Seismological Center) including from 2003 to 2019 and obtaining formulas based on magnitudes. To
avoid duplicated data's a Matlab plugin named Zmap was used and the catalogues were declustered
by Reasenberg method. At the end two sources were determined based on seismotectonic, fault
systems and seismicity of the area and b-value, a-value and Mc for each source was calculated as
well. With the help of KIJKO other useful parameters such as Beta, Lambda and M-max was
acquired and later on in Crisis these parameters were used plus CampellBozorgnia2008 (Campbell,
K. W., and Y. Bozorgnia (2008)) attenuation relation for soil properties compatible with Vs30 and as
a result the spectral acceleration (SA) at the period of 0.2 second and peak ground acceleration
(PGA) was also calculated. The calculated PGA for the region for return periods (probability of
exceedance) of 50, 475, 1000 and 2475 years which the values respectively are 0.4, 0.6, 0.7 and 0.9 g
were mapped and Uniform Hazard Spectra (UHS) showed the dangerous zones for the period of 0.2
s as well and the SA for these areas were between 1 to 2 g.
KEYWORDS: Crisis; Kijko; Rudbar; USH; Zanjan

A new method in Probabilistic Seismic Hazard Assessment and Site Effect
Exertion using Python Libraries in Kerman Region Dolatabadi, N.1, Amirian, F., Rahimi, M.2, Sadidkhouy, A.3 1 M.Sc. student, Institute of Geophysics, University of Tehran, Iran 2 M.Sc. student, Institute of Geophysics, University of Tehran, Iran 3Assistant Professor, Institute of Geophysics, University of Tehran, Tehran, Iran.
E-mail: [email protected]
Kerman City has been constructed and expanded on the young Quaternary alluvial deposits. Due to
geological conditions, the young and active faults of the region and old faults have been a
tremendous history in terms of seismicity. According to researchers, the main reason for the
occurrence of earthquakes in Iran is the movement and pressure of Saudi Arabia towards the north
due to the opening of the Red Sea. The probabilistic seismic hazard assessment (PSHA) is based on
homogeneous earthquake catalogue collected by merging available global catalogues (e.g.
International Seismological Center (ISC), USGC, Iranian Seismological Center (IRSC), U.S.
Geological Survey (USGS) and Incorporated Research Institutions for Seismology (IRIS)). The
catalogue time range goes from Historical Earthquakes to 2019. However, this may result in
repetitive data and dependent events, so HMTK Plugin which is implemented within OpenQuake
software were used to decluster and calculated seismicity parameters. Nevertheless, due to lack of
HMTK in Reasenberg declustering method, a python code written by Kris Vannest was used. Two
seismic source zone have been selected due to seismicity, seismotectonic, regional structural geology
and fault systems within neotectonic settings of the study area. The b-value stability is reserved
regionally and defers less than uncertainty limit. Hazard computations have been done using
OpenQuake (version 3.6). The peak ground acceleration (PGA) and spectral acceleration (SA) at
periods of 0.2, 0.8, 1.0 and 2.0 s were calculated using a ground motion prediction equations
(GMPEs) for active shallow crust, CampbellBozorgnia2008 for soil Properties corresponding to
Vs30. calculated SA and PGA for the study area in selected periods were mapped and Uniform
Hazard Spectra (UHS) indicates the value of the ground motion parameter vs. the structural periods
in a defined probability of exceedance (return period) was calculated as well.
Keyword: Crisis, Kermanshah, GMPE, Openquake, PSHA, UHS.

Evaluation of the effects of cement industries from Health, Safety and
Environment (HSE) view
Pourmajidi, P.1, Tavakoli, A.2
1Undergraduate Student in Mine Engineering, University of Zanjan 2Assistant Professor in Civil and Environmental Engineering, University of Zanjan
The concept of HSE, with a new approach toward health, safety and environment, is a critical subject
in the process of development for countries and human societies. HSE include a comprehensive
management system which try to consider different aspects of health, environment and safety in a
working place or an industry, and predict the potential hazards, accidents and disadvantages in this
regard. On the next step, HSE suggest the prevention-based approaches in order to minimize costs,
dangers and pollutions. Global development is closely linked with technology, innovation and
economic value but, on the other hand cause the pollution and environmental degradation.
Cement industry as one of the fast growing sectors in Iran, is the subject of this research but from the
HSE point of view. The current capacity of this industry in country is about 80 million tones and will
increase to the 120 million tones for the 1404 horizon. The cement industry is one out of seven
strategically selected industries which plays a critical role in country’s income, share of added value,
employment, market, and so on. The process of cement production is associated with various
environmental, biological and social damages. Air pollution, soil degradation, waste production,
noise pollution, high rate of energy consumption and GHG emissions are the most important
environmental challenges of this activity. In addition, health and safety sectors, different diseases and
health problems for workers of this industry and accidents and hazards during the process are
considered in this research and suitable solutions are suggested based on international guidelines and
successful experiences around the world.
During recent years, the concept of HSE as a mandatory sector must be considered and followed and
this attempt could help for better understanding and performance.
Keywords: Health, Safety, Environment, Cement Industry, Development.

Assessment of groundwater quality for drinking and industrial usage in
Chenaran plain in North East Iran
Sharafi, N.1, Mahmudy Gharaie, M.H*1, Makhdoumi, A.2, Ahmadzadeh, H.3 1 Department of Geology, Faculty of Science, Ferdowsi University of Mashhad, Mashhad, Iran 2 Department of Biology, Faculty of Science, Ferdowsi University of Mashhad, Mashhad, Iran 3 Chemistry Department, Faculty of Science, Ferdowsi University of Mashhad, Mashhad, Iran
E-mail: [email protected]
Quality investigation of water resources is important for suitable management and environment
protection. In this study, quality determination and classification of groundwater in Chenaran arable
plain, North East of Iran, Razavi Khorasan Province, were examined for drinking and industrial usages.
Eight groundwater samples were collected form the Chenaran plain in September 2018. Temperature, pH
and electrical conductivity were measured at the field. Major cations (Ca2+, Mg2+, Na+, K+) and anions (Cl-
, SO42-, HCO3-and CO32-) were analyzed in central chemical laboratory in Ferdowsi University of
Mashhad. Electrical conductivity (EC) value was varied from 412 to 5100 μs/cm. Dominant cations and
anions were Ca2+, Mg2+, HCO3- and Cl- in the samples. The Gibbs diagram, which is provided using
Cl/Cl+HCO3 and Na/Na+Ca vs. TDS, shows three main controlling processes such as precipitation, water-
rock interaction and evaporation. According to the diagram, the groundwater samples were affected by a
water-rock interaction and partly evaporation. Also, based on ionic ratios as Na/Na+Cl and Mg/Mg+Ca,
Na-bearing silicate minerals dissolution, ionic exchange, limestone and dolomite weathering, and rare
halite dissolution has a significant effect on water composition.
Schoeller diagram provides the quality classification based on by total hardness (TH), total solid
dissolution (TDS) and major ions. According to this diagram the water samples were classified in good to
unsuitable classes for drinking usages. Langelier saturation index was used for corrosive- scale forming of
water samples. This parameter indicated that all the water samples were scale forming. Drinking water
should not be corrosive or scale forming because it may water could have negative effects on human and
animal health, and also industrial constructions.
.
KEYWORD: Chenaran Plain, Human health, Industrial usages, Water quality

Air pollution modeling (PM10 & PM2.5) using time series Sentinel-2 images
Mozafari, S.M 1, Hasanlou, M. 1 1 School of Surveying and Geospatial Engineering, College of Engineering, University of Tehran
Email: (s.mohamadmozafari, hasanlou)@ut.ac.ir
Air pollution is one of the major human and environmental health problems in big cities and in
developing countries. Accurate monitoring and forecasting of air quality and estimation of the
amount of contaminants will reduce the risks to human and environmental health. Particulate matter
in the atmosphere is divided into two PM2.5 (particulate materials with a diameter of less than 2.5
μm) and PM10 (particulate materials with a diameter of less than 10 μm), Particulate matter can
cause illness, allergies and even death for humans. It can also harm other living things such as
animals and food products and damage the natural or artificial environment. Indoor air pollution and
poor urban air quality have been cited as two of the world's most important toxic pollution problems
in 2008. According to a 2014 World Health Organization (WHO) report, air pollution in 2012 killed
about 7 million people worldwide. Due to the availability of Sentinel-2 imagery that offers a spatial
resolution of 10 meters and using SNAP and Sen2Cor can calculate atmospheric reflectance. In this
study, an empirical relationship is established between the values of PM2.5 and PM10 with satellite
images and atmospheric reflectance extraction, and a high-precision air pollution model is produced.
Using a 18 months course (from the beginning of 2018 until the end of August 2019 from Tehran)
from Sentinel-2 images and receiving in-situ data, at the same time, air pollution rates in different
parts of Tehran have been investigated. For this purpose, 23 air quality control stations in Tehran
have been used. The study suggests that the atmospheric reflectance study from Sentinel-2, is a good
alternative to monitoring air quality on Earth. The feasibility of the proposed algorithms was
investigated based on correlation coefficient (r) and RMSE and NRMSE compared to the PM2.5 and
PM10 in-situ measurement data. A choice of our proposed multispectral model was based on the
highest value r and the lowest value of RMSE and thus the lowest value of NRMSE with PM10 in-
situ data. Models produced by Sentinel-2 satellite with PM10 and PM2.5 suspended particles
produced by correlation coefficients of 0.83 and 0.84, respectively, confirmed that the use of
atmospheric reflectance of satellite images with high spatial resolution is a good alternative to
ground air quality monitoring.
KEYWORDS: Air pollution, Particulate matter, Sentinel-2, SNAP, Sen2Cor, high spatial resolution

Seismic Hazard Assessment in Semnan region
Teymouri, E. 1, and Sadidkhouy, A. 1
1 Institute of Geophysics, University of Tehran, PO Box 14115-6466, Tehran, Iran
E-mail: [email protected]
Seismic hazard analysis is one of the most useful tool to address uncertainty in regions that are
located in an active tectonic zoneand prevent major damage or life loss. In Semnan region, Damghan
earthquake is one of the strongest historical earthquakes (M7.9) that happened in 856 AD. In this
paper, Deterministic and Probabilistic seismic hazard assessment methods have been used to
evaluate the seismic hazard potential along Semnan province, which is located between 34 to 37 N
and 52 to 55 E. For this purpose, we extracted the information from seismotectonic map using
geological maps, micro-earthquakes catalog and well-known historical earthquakes references. Then,
we divided the region in to 7 sources that gained from the same tectonic regime, and we estimated
seismicity parameters and seismicity potential, with procedure of faults and with this zoneation. For
deterministic hazard assessment, we used an hypothetical site centered in the study area and we
specified source zones that may generated a notable ground shaking. Then, we determined the
distance from each source zone to the site and Mmax. Finally, we calculated the ground motions
(PGA) at the site using a regional attenuation relationship. The result showed that Atari fault is
creating the maximum acceleration and is therefore the controlling earthquake of our site. In the
probabilistic part of our study, after all the regional information we gathered, suitable attenuation
relation for target region were used and peak ground acceleration for sources at Semnan city were
obtained and measured for return periods of 50, 100, 200 and 475 year. The results of all sources
based on probabilistic approach in return period 50, 100 and 475 years, predicts accelerations
respectively, 0.32g, 0.77g, 1.1g and when the return periods increase the acceleration value.
Response spectra curves for all sources at defined period has a peak in nearly 0.2 seconds. The
obtained seismic hazard maps obviously show more risk for potential seismic sources 1 and 6 and
these results are in a good coincidence with the deterministic method.
KEYWORDS: Deterministic method, Hazard assessment, Hazard map, Probabilistic method

Probabilistic Seismic hazard assessment and focal mechanism mapping of Minab
fault zone and the Strait of Hormoz
Tavakolizade, N.1, Sadidkhouy, A.2 1M.Sc. student, Institute of Geophysics, University of Tehran, Tehran, Iran 2 Assistant Professor, Institute of Geophysics, University of Tehran, Tehran, Iran
E-mail: [email protected]
This study focuses on probabilistic hazard assessment of Minab transition zone, its accompanied fault
zones, and the strait of Hormoz. On the one hand, different tectonic regimes and different convergence
angle (confirmed by GPS based velocity measurements), influence Minab fault zone and the strait of
Hormoz. On the other hand, this location includes a large population and is one of the main Iranian
trading harbors. Seismicity of this region are studied by mapping faults and gathering a precise and
complete earthquake data set of historical (based on Ambraseys and Melville (1982) Iran historical
earthquake records) and instrumental data based on IRIS, IRSC, ISC, and USGS data sets. Investigated
catalogue consist of 8715 earthquakes. Fault map of this area showed plenty of major and thrust faults.
The seismotectonic map accompanied by CMT focal mechanisms plotted to demonstrating earthquake
mechanisms. Strike-slip, reverse, over-thrusting, and oblique movements are dominating fault
mechanisms in the study area. Probabilistic hazard assessment is done based on four sources, elected by
fault trends, focal mechanisms, and earthquake accumulation schemes in order to assess seismic hazard
potentials. Activity rate (N), b-value, and magnitude of completeness evaluated utilizing Zmap software
and Gutenberg-Richter relation. KIJKO implemented to calculating earthquake engineering parameters
(lambda and Beta). CRISIS software used for plotting SA (Spectral Acceleration) maps for two
recurrence time (RT; 50, 475 years) and two different periods (0.2, 0.8). Maximum evaluated SA for 50
and 475 recurrence time are 0.98(g), 1.65(g) (of 0.2 Time period); and 0.38(g), 0.57(g) (of 0.8 Time
period), respectively. Uniform hazard response spectrum (UHRS) for 2, 5, 10, and 64 percent of
probability of exceedance plotted. Obtained results are in good agreement with tectonic regimes of the
study area and taking them into account while constructing infrastructures and buildings improves
location specification.
KEYWORDS: Crisis; Minab; PGA; Seismic hazard assessment; Tectonic regimes; The strait of
Hormoz.

Hybrid broadband strong-motion simulation of Malard Earthquake
Teymouri, E. 1, Sadidkhouy, A.1, Rahimi, H.1
1, Institute of Geophysics, University of Tehran, PO Box 14115-6466, Tehran, Iran
E-mail: [email protected]
In countries located in an active tectonic zone, seismology engineering and earthquake engineering
studies, such as seismic hazard analysis and strong motion simulation, contribute to the preparedness
to future seismic activities, especially when there's no reliable or proper strong motion records of the
past earthquakes. For example, the city of Tehran is built over many faults that have the potential to
produce major earthquakes. Realistic estimations of ground motions and time series can lead to PGA
and sa calculations that could help with building design and engineering. The most common method
of strong motion simulations relies on using either the low frequency or the high frequency, hence
hybrid methods are used to calculate synthetics in range of engineering interest (0-10 hz). We
referred to 'Hybrid Broadband ground simulation' method by Mai et al (2010) as a basis to simulate
the 20th December 2017 earthquake in Malard, Northern Iran, by generating broadband synthetic
seismograms. In this case, the low frequency seismograms were combined with high frequency
multiple s to s back scattering. To obtain a hybrid broadband simulation, we used compsyn package
(Spundich and Zu, 2003) to calculate the low frequency section and then combined it with the
generated high frequency by using the broad band toolbox (Mai et al, 2010).
The simulation requires site and source specific parameters. In order to obtain them, we used the
main acceleration recorded by 21 stations in less than 100 kilometers radius. The estimated value of
high frequency decay (kappa) is 0.49 and the maximum calculated PGA of time series for the closest
assumed station is 0.018 m/s^2. That is an adequate compromise with the actual data and for all
calculated station. We also compared amplitude spectra of both simulations and observation data and
the results, represent a significant coincidence between the simulation and the main event in both of
frequency and time domains.
KEYWORDS: Hybrid broadband seismograms, Kappa, Near-source ground motion, Strong motion

Realistic strong ground motion selection based on the conditional mean spectrum
in Tabriz, Iran
Bayat, F. 1, Shabani, E.2
1 Institute of Geophysics, University of Tehran, Tehran, Iran
2 Department of Seismology, Institute of Geophysics, University of Tehran, Tehran, Iran
E-mail: [email protected]
Earthquake is an inseparable part of human life; the best solution to reduce its damages is to design
structures based on the seismotectonic and geotechnical characteristics of the region (Mousavi et al.,
2015). In dynamic structural analysis, scientists predict the response of the structures subjected to
ground motions having a specified spectral acceleration at a given period and this prediction is
generally obtained by selecting strong ground motions matching a target response spectrum (Baker,
2011). The uniform hazard spectrum (UHS), that is a typical response target spectrum, is shown by
researchers to be an unsuitable target for this purpose, as it implies that large-amplitude spectral
values will occur at all periods within a single ground motion. The conditional mean spectrum
(CMS) which is a proposed alternative to the UHS is a response target spectrum that estimates the
distribution of the response spectrum, conditioned on the occurrence of a target spectral acceleration
value at the period of interest (Lin et al., 2013).
In this study, the peak ground acceleration (PGA) and the spectral acceleration Sa(1.0s) for 5%
damping ratio corresponding to 10% and 2% probability of exceedances within 50 years are
estimated. The resultant PGAs for the return period of 475 and 2475 years, indicate the maximum
value of 0.3g and 1.0 g in Tabriz, respectively. Disaggregation is also calculated in a site in the
center of Tabriz on bedrock, then it is used to compute the contributions to the mean annual rate of
exceedance (MRE) of PGA corresponding to the mean return period 475 years, 5%-damped Sa(0.2s)
and Sa(1.0s) corresponding to different mean return periods (MRPs) of 475 and 2475 years.
Moreover, as expected, the MRE of long-period spectral accelerations is usually controlled by large
magnitude earthquakes at long distances while smaller events at shorter distances dominate the PGA
and short-period spectral acceleration hazard (Shabani et al., 2013). The CMS at the site specified in
Tabriz for PGA corresponding to MRP of 475 years and the resultant 5%-damped Sa (0.2s) and
Sa(1.0s) corresponding to different MRPs of 475 and 2475years are calculated, as well. According to
the mean disaggregation results of Sa(1.0s) with the MRP of 475 years at a site in the center of
Tabriz (Fig. 1), nine response spectra of real ground motions with approximate magnitude 7 and
distance 46 km are selected from PEER Ground Motion Database center, we found that the CMS are
relatively less than the UHS and a bumpy response spectrum from real ground motions are well
captured by the CMS in Fig. 2. It is clear that at high periods, the amplitude of the UHS is higher
than the CMS one and according to dynamic structural analysis, it could intensely excite the
nonlinear response of a structure. At short periods, the amplitude of the UHS is higher than the CMS
as well, and it implies that ground motions matching the UHS will excite higher modes in the

structures to a greater extent.
As a result, the UHS is an undesirable target response spectrum to make an estimate of the expected
financial losses due to the damage following an earthquake in Tabriz. As Burks et al., (2012) stated,
using the UHS to select ground motions could lead to an over prediction of the response and
resulting loss could lead to incorrect decisions regarding insurance pricing or decision-making to
retrofit the structure.
KEYWORDS: Conditional mean spectrum; Disaggregation; Seismic hazard; Strong ground motion;
Uniform hazard spectrum.
Figure 1. Disaggregated seismic hazard for a site in Tabriz for 10% in 50 years probability of exceedance for
Sa(1.0s); bins of width 0.5 in magnitude, 10 km in distance, and 0.5 in ε are used.

Figure 2. Response spectra from real ground motions having approximately magnitudes of 6.8 and in a
distance of 45.8 km, for Tabriz, 10% in 50 years probability of exceedance for Sa(1.0s) after scaling spectra to
match the CMS over the entire considered period range. The thick brown colored spectrum is the Loma Pietà
recording for the Northridge earthquake.

Anisotropic Velocity Structure beneath the Arabia – Central Iran collision
boundary (the Zagros suture zone)
Dashti, F.1, 2, Lucente, F.2, Motaghi, K.1, Najafi, M.1, Bianchi, I.3, Shabanian, E.1 and Ghods,A. 1
1 Institute for Advanced Studies in Basic Sciences (IASBS), Zanjan 45137-66731, Iran 2 Centro Nazionale Terremoti, Rome, Italy 3 Institut für Meteorologie und Geophysik, Universität Wien, Vienna, Austria
E-mail: [email protected]
Continental collision along the Zagros suture occurred due to convergence of the Arabian plate and
the Eurasia (Fig. 1) initiated at ∼35 Ma (e.g., Mouthereau et al., 2012, and references therein) with
the main phase at ~27 Ma (e.g., Madanipour et al., 2013; Egan et al., 2009). Here, we study the
crustal structure by focusing on both the geometry and the changes in anisotropic properties of the
crust.
In this work, our main objective is to recognize dipping interfaces and/or anisotropic layers
(subsurface structures) at crustal depth. With that aim, we implement the harmonic decomposition
method is based on the derivation of the back azimuthal harmonics of an RF data set as a function of
the incoming P- wavefield direction (Girardin and Farra, 1998; Farra and Vinnik, 2000). We used
data from CIGSIP (China-Iran Geological Geophysical Survey in the Iranian Plateau) temporary
linear array of broadband seismic stations installed in NW Iran (Figure 1). We compute teleseismic
receiver functions at 45 stations and then we perform harmonic analysis of the receiver function data
set [Bianchi et al., 2008, 2010, 2016] to infer the presence of dipping interfaces and/or anisotropic
layers at crustal depth. We then focus on data from seven stations located in the near of the surface
expression of the suture zone.
Through harmonic analysis and the subsequent inversion of the receiver function data at these
stations, we obtain information on the geometry of the suture zone at depth, deformation induced in
the above and below crustal levels by the collision kinematics, and on the S velocity models of the
crust across the Zagros suture zone.
Within the receiver functions harmonics, we highlight the seismic signature of the suture zone
related to the Zagros Main Recent Fault (MRF), and through modeling we unravel the anisotropic
characteristics of the layers surrounding the suture, which is probably due to consistent foliation of
the rocky packages involved in the thrusting process.
KEYWORDS: Anisotropic characteristics; Collision boundary; Crustal structures; Harmonic
decomposition; Receiver function.

Applying WavDec, F-K and RayDec methods to decompose ambient seismic noise
wavefield and retrieving earth model at a site in the south of Tehran
Fotouhimehr, M.1, Moghadasi, N.S.1, and Shabani, E.2
1 PhD student, Department of Seismology, Institute of Geophysics, University of Tehran 2 Assistant Professor, Department of Seismology, Institute of Geophysics, University of Tehran
E-mail: [email protected]
Seismic ambient noise methods are nowadays widely used in geophysics as easy and non-destructive
techniques to study the characteristics of underground structure, which is very important in
engineering and hazard assessment purposes. It is presumed that the seismic noise wavefield is
mainly composed of surface waves with an unknown relative contribution, so deriving suitable
knowledge about noise wavefield composition is crucial in extracting more precise dispersion curves
of the carrier surface waves. Furthermore, adding additional information as constraints like Rayleigh
wave ellipticity in the inversion process of dispersion curves may improve the accuracy of deduced
subsoil structure. In this study, to analyze wavefield composition and to obtain the shear wave
velocity model at depth, we benefited the array methods of WaveDec and F-K and also single station
techniques of RayDec and H/V. WaveDec technique (Maran`o et al. 2011) as a statistical signal
processing technique, is used to decompose ambient noise wavefield and to estimate its parameters.
In this method, the measurements from all components of sensors are modeled jointly which leads to
substantial improvement in obtaining dispersion curves. Considering both Love and Rayleigh waves’
contributions in the wavefield, this method estimates wavefield parameters including amplitude,
phase, azimuth, wave number and ellipticity angle (for the Rayleigh wave only) based on the
Maximum Likelihood method. In the F-K method (Lacoss et al. 1969), signals from different sensors
are delayed and summed up. The delays are computed as a function of the angle of arrival and the
velocity of propagation. The principal of H/V spectral ratio technique (Nakamura, 1989) is
computing the ratio of the Horizontal to Vertical spectra of ambient vibration recordings of a single
seismic sensor to achieve resonance frequency of the site. In the RayDec method (Hobiger, 2009),
using the random decrement technique causes to enhance the Rayleigh wave effect and decreases the
influence of other wave types in the seismic wavefield.
The array dataset used in this paper is composed of 9 stations which are recorded at a site in the
south of Tehran by Haghshenas (2012) which are two hour length records.
In this study, first we compare the ellipticity curves deduced from the above mentioned single station
methods and also the WaveDec technique. Results show a good agreement at resonance frequency of
4.1 Hz. Also, the decomposition of the relevant noise wavefield is studied through the WaveDec
method (Figure 1). As a next step, the dispersion curves of vertical components are estimated. To
deduce the shear wave velocity model, dispersion curves of Rayleigh waves from WaveDec and F-K
methods alongside ellipticity information from different mentioned techniques are tested and
compared. Our results show that the inversion of dispersion curves deduced via WaveDec and
ellipticity from RayDec, could improve the estimation of shear wave velocity model and depth of
bedrock in the site.

Keywords: Wavefield decomposition, Ellipticity curves, dispersion curves, Shear wave velocity
model, Tehran.
Fig. 1 (Left) Rayleigh wave dispersion curve obtained using WaveDec method (the blue curve with error
bars). (Right) Rayleigh wave ellipticity angle curve (the blue curve with error bars), both bounded in array
resolution limits presented by light green lines.

Iran strong motion network
Shahvar, M.1, Farzanegan, E.1, Eshaghi, A1, Mirzaei, H. 1
1Assistant Professor, Road, housing and urban development research center (BHRC), Tehran, Iran
E-mail: [email protected]
Strong ground motion records are the main input data to earthquake engineering studies such as
dynamic structural analyses and seismic hazard evaluation, helping us to improve our understanding
of seismic hazard and risk. This data is used as basic information on the development of earthquake
building codes. The Iran strong motion network (ISMN), Road, Housing and Urban Development
Research Center (BHRC), is operating a network of about 1115 digital strong motion accelerometer.
Strong motion monitoring of earthquake activity in Iran began at the onset of the 1973, consisting of
270 analog SMA-1 stations. Since then Iran has been at the forefront of strong motion monitoring in
Middle East. In the early 1990s, after Manjil destructive earthquake, the National Strong Motion
Network was established including dial-up triggered instrumentation replaced the analog sensors.
This network, consisting of 1070 SSA-2 sensors, was installed across Iran, 547 free-field stations as
well as of 91 dam-related (see Figure 1).
About nearly 13,600 three component strong motions have been recorded from 1973 in earthquakes
between 3<Mw<7.8.
This paper describes the current status of network including instrumentation, database and ongoing
developments and renovation project for the Iran strong motion network. The renovation project
started in late 2016, and will lead to the installation
KEYWORDS: Strong Motion, Network, Iran, Accelerometer

ML Shear Wave Velocity Tomography in Turkey Plateau
Gomar, F.1, Ghods, A.2, Maheri Peyrov, M.1
1 PhD student, Institute for Advanced Studies in Basic Sciences (IASBS), Zanjan, Iran 2 Associate Professor of Geophysics, Institute for Advanced Studies in Basic Sciences (IASBS), Zanjan,
Iran
E-mail: [email protected]
The Turkey plateau is composed by several continentals’ terranes in the late tertiary. These terranes
were detached by the ocean. Pontides is a north terrane in northern Turkey which shows Laurasia
affinities. The Anatolide-Tauride terrane in the south of the Pontides shows Gondwana affinities
which was separated from Gondwana in the Triassic. The kirşehir massif is a large complex of
metamorphic and plutonic rocks in central Anatolian. The southeast Anatolia forms by north of the
Arabian platform. To study the gradient of lateral crustal variations in Turkey and to investigate
different crustal blocks, we calculated a 2D ML shear wave velocity tomography map using the
waveforms recorded by the KOERI permanent Seismic Network and the European Integrated Data
Archive (EIDA). The lateral crustal thickness variation is depended to the ML velocity that vary
between the velocity of Lg and Sn phases. If the earthquake occurs in the crust, the maximum
amplitude of the shear wave can belong to the Lg wave. According to the Lg group velocity (2.8-3.5
km/s), we can identify the blocks with variable thickness such as blocking and passing region,
because the quality of Lg wave propagation is sensitive to crustal thickness lateral variations. The
dataset includes 22584 ML velocity readings from 382 earthquakes with a location error of five
kilometers or less, a magnitude range of 4-6.5 and happened in the time interval between 2005 and
2017. We calculated the 2D ML tomography map of Turkey, by using a constrained least-squares
inversion scheme. Our results exhibit an Lg blocking region (i.e., ML velocity larger than 4 km/s,
near to Sn phase) in eastern Turkey (indicated by letter C in Figure. 1) where a thickened crust
resulted from the collision of the Arabian Plate and the Anatolian plate. The ML velocity for the
Pontides (indicated by letter B in Figure. 1) in the north of the Anatolian fault and south of the Black
Sea is in the range of 3.2 to 3.5 km/s, implying an Lg passing region. The Izmir-Ankara-Erzincan
suture zone is well resolved by the velocity map, because of the larger average velocity of the
Pontides. According to our velocity map, the Tauride area (indicated by letter E in Figure. 1) in the
southwest of Turkey is attributed to an Lg blocking region. For the Tauride area, our map shows a
region with a strong crustal thinning which is in correlation with the previous studies indicating a
tensional regime. The ML velocity for the Menderes Massif (indicated by letter D in Figure. 1) in the
western Turkey is in the range of 2.1 to 3.2 km/s, implying an Lg passing region with a distinct
pattern correlating with the boundary of the Massif. For the central part of the Anatolian plate and
the kirsehir block (indicated by letter A in Figure. 1), the ML velocity is in the range of 2.7 to 3.1
km/s, consistent with an Lg passing region with a small lateral gradient of crustal thickness. The ML
velocity for the Arabian plate is about 3.4 km/s slightly larger than the Anatolian plate. The
separation of Arabia plate from the Central Anatolian plate in the velocity map is related to the Bitlis
suture zone. We were not able to calculate the ML velocity in the north of the Black sea (indicated
by letter G in Figure. 1), because of the unavailability of the seismic data in this region. Overall, our
results show a boundary of terrane that nearly identical with calculated ML velocity for each
continental segment (Figure 1).

2. KEYWORDS: Anatolian plate; Seismic tomography; Shear wave velocity; Turkey; Wave
propagation
Figure 2. ML shear wave velocity map superimposed on topography of Turkey. The reliable answer is marked
by the pink line. Sutures are shown by heavy lines with the polarity of former subduction zones indicated by
filled triangles and the dashed lines are political borders. In the regions with high velocity (greater than
3.5km/s), there are a gradient of lateral crustal variations (C and E blocks). In the region with low velocity
(less than 3.5 km/s), there aren't lateral crustal variations (B, A, D and F blocks).

Investigation of the effects of adjacency on seismic response of two dimensional
hills
Baba Adam, N.1, Uromeihy, A.1, Sohrabi- Bidar, A.2, Maghami, Sh2
1Tarbiat Modares University 2University of Tehran
E-mail: [email protected]
It is well known that during an earthquake event, the received motion could be significantly varied in
different locations with respect to topographic characteristics of the surface. Although numerous
researches have been dedicated to the “site effects”, one of its important aspects, which is the
adjacency of topographic features, have not been paid enough, whereas a vast number of, populous
cities are located near topographic features. The aim of this paper is an investigation of the effects of
adjacent hills on the seismic responses on the surface. Previous studies have been focused on the
seismic behavior of the single features, mostly, whereas, a realistic look at the surrounding
Environment shows a high diversity and the complexity of the ground surface. To study of
adjacency, a parametric study has been performed, considering three different cases. First a two-
dimensional homogenous hill with different elevations on the half-space is subjected to vertical
incident SV riker waves and the responses have been studied at the top of the central hill. Afterward,
once again the responses of the same hill have been analyzed by considering another adjacent hill
with constant elevation (500 m). Lastly, two same hills (with 500 m elevation) have been defined on
both sides and the analysis is repeated. The analysis has been carried out employing the boundary
element method in time-domain and the responses have been analyzed in both time and frequency
domains, the incident wave has been defined with predominant frequency of 3Hz. The results show
that the responses could be greatly under the influence of the adjacent hills according to their
characteristics and in specific, the dimensions of the feature.
KEYWORDS: Site effect; seismic response; Tow dimensional; Frequency domain; time domain;
topographic features.

Investigation of the Crustal Transition in Western Alborz
Arvin, S.1, Sobouti, F.1, Priestley, K.2, Ghods, A. 1, Motaghi, K.1
1 Department of Earth Sciences, Institute for Advanced Studies in Basic Sciences (IASBS), Zanjan,Iran.
2Bullard Laboratories, University of Cambridge, Madingley Road, Cambridge CB30EZ, UK
E-mail: [email protected]
The present day kinematics of Alborz mountain, characterized by the westward extrusion of the
South Caspian Basin block, and by the right-lateral shear between the different blocks of Central
Iran. The Alborz accommodates the overall motion between the South Caspian Basin and Central
Iran (Jackson et al. 2002). The termination of the Alborz Mountain, in the western part, is
characterized by a change in strike along the Lahijan fault zone (Left lateral strike slip fault). The
South Caspian Basin is a rigid block and remnant piece of oceanic lithosphere structure with
unusually thick oceanic like crust, was formed as a remaining back arc basin related to Tethyan
subduction beneath the Iranian microcontinent and also is known as one of the thickest sedimentary
(~ 20 km) basin in the world (Mangino & Priestley (1998); Brunet et al. (2003); Knapp et al. (2004)).
Based on southwestward motion of South Caspian Basin relative to Central Iran, it is believed that
the South Caspian Basin is underthrusting beneath the Talesh and Alborz Mountain on its western
and southern margins (Jackson et al. 2002). The P tomograms obtained by Motaghi et al. (2018),
beneath a dense linear seismic array in west Alborz Mountains, show a sharp velocity contrast in the
crust and upper mantle beneath northern flank of the Alborz Mountains from that of the South
Caspian Basin and this sharp transition role as the boundary between the lithosphere structure of the
South Caspian Basin and Alborz mountain which suggest no underthrusting of the South Caspian
Basin beneath the Alborz Mountain.
The aim of this study is investigating the Moho structure and crustal discontinuity in western Alborz
in order to find a better understanding of the crustal deformation in the area, especially in two
tectonic transition zone, one from oceanic-type crust of South Caspian Basin to continental crust of
Alborz, and other transition from actively deforming Alborz to Central Iran crustal blocks.
In order to study the crustal seismic structure across the West Alborz ranges by analysis of P wave
receiver functions, we used 250 teleseismic events with magnitude greater than 5.5, located between
30◦ and 90◦ epicentral distances were recorded by 24 seismic stations belong to the temporary
seismic network in the NW Iran installed and operated by the Institute for Advanced Studies in Basic
Sciences (IASBS). This network was called Deylaman profile, has included with 16 seismic stations
along a linear profile extending from The South Caspian Basin, Western Alborz, and Ghazvin region
to Boien Zahra region located in Central Iran and there are also 8 seismic stations in surrounding the
profile. The average inter-station distance in each profile was 13 km. The stations were repositioned
during the deployment (from August 2014 until April 2016) and the recording span at individual

stations varied between 4 and 31 months.
Receiver functions are determined using the iterative deconvolution method of Ligorria and Ammon
(1999). The obtained receiver functions were migrated to the depth and the structure and geometry of
the Moho boundary beneath the network were well identified (Fig.1). The transition boundary from
the oceanic-like crust of the southern Caspian basin to the Alborz continental crust was identified.
The thickness of the sediments in central Iran is about 15 km. The thickness of the crust in central
Iran is about 40 to 48 km. in Alborz, the thickness of the crust is increased to 50 km. Coming from
Alborz to the southern Caspian Basin, there is a sharp variation in crustal thickness, which
corresponds to the Lahijan fault zone that faces the thin oceanic crust of the southern Caspian basin
to the thick continental crust of Alborz. The scattering in seismicity (Hassanzadeh, 2016) exactly in
the region of sharp change of crustal thickness is a confirmation of the location of crustal transition
between South Caspian basin and Alborz.
Figure 1. P reciever function along the profile migrated down to the depth of 100 Km. triangles show the
projection of the stations onto the profil. The black solid The black solid line refer to the Moho discontinuity
along the profil. The black circles are the seismicity of the study area.
KEYWORDS: Crustal deformation, Receiver Function, Western Alborz

Structure of the upper mantle beneath the Zagros collision zone revealed by
surface wave tomography
Zarunizadeh, Z.1, Motaghi, K.1, Abdulnaby, W.2, Aoudia, A.3, Pachhai, S.4, Ghods, A.1
1Department of Earth Sciences, Institute for Advanced Studies in Basic Sciences, Zanjan, Iran 2Researcher, Department of Geology, University of Basrah, Basrah, Iraq 3International Centre for Theoretical Physics, Trieste, Italy. 4 Institute of Geophysics and Planetary Physics, Scripps Institution of Oceanography,
University of California, San Diego, California, USA.
E-mail: [email protected]
The Zagros collision zone in western Iran is a one of the youngest and most active
continentalcontinental collision zones all over the world resulting from collision of a strong
lithosphere beneath the Arabian plate with a weak lithosphere along the margin of the Iranian
plateau. Previous studies showed great interests in studying deep structures of the Zagros collision
zone during the two last decades. Despite these, many questions remained under debate. In order to
study the upper mantel structure across the northern part of the Zagros collision zone, we analyzed
1750 teleseismic waveforms recorded from 105 events. The data were gathered by 13 permanent
stations of the Iranian National Broadband Seismological Network (INSN), 23 stations from a dense
array (CIGSIP) installed by Institute of Geophysics and Geology, Chinese Academy of Sciences in
collaboration with the Geophysical survey of Iran and Department of Earth Sciences, Institute for
Advanced Studies in Basic Sciences (IASBS), 8 stations from a temporary array operated by IASBS
in NW Iran and 6 temporary seismic stations belonging to Basra University (Iraq). We used the
twoplane-wave tomography method prepared by Forsyth and Li (2005) to carry out a teleseismic
surface wave tomography. The inversion was performed based on 2-D sensitivity kernels (Yang and
Forsyth, 2006) at a grid size of 0.5 × 0.5 degrees. Both amplitude and phase of Rayleigh waves were
employed to calculated phase velocity tomograms at period range of 33 s - 111 s. A Bayesian
Markov chain Monte-Carlo algorithm was performed to invert local dispersion data into 1D S-wave
velocity models beneath each grid.. Our 3D shear wave velocity model shows well -resolved image
for the lithosphere structure beneath the Zagros collision zone. The Moho depth variations show
lateral variations where it is thicker beneath the Zagros Mountains and thinner beneath the east of
Iraq and Central Iran. The most interesting deep feature observed in the 3D velocity model is the
high velocity anomaly beneath the Zagros Mountains at depth between 70 km and 150 km. The high
velocity anomaly extends ~100 km beneath the SSZ, probably due to underthrusting of the Arabian
lithosphere beneath SSZ across the MZT suture zone.
KEYWORDS: Surface wave tomography, Bayesian Monte-Carlo, Upper mantel structure, Zagros
collision zone.

Moment Magnitude Estimation Based on Displacement Spectral Inversion
Method using Iran Strong Motion Data
Eshaghi, A.1, Shahvar, M.2, Farzanegan, E.,3 and Mirzaee, H.4
1 Road, Housing and Urban Development Research Center, Tehran, Iran
E-mail: [email protected]
Earthquake magnitude scales are related measurements of an earthquake. The most commonly used
magnitude scales such as local magnitude or body wave magnitude are dependent on the frequency
of the recorded waves and above a certain size will saturate. To overcome the saturation problem,
moment magnitude M was introduced (Hanks and Kanamori, 1979) that is calculated from the
seismic moment, M0, which can be estimated from spectral methods (Brune, 1970), the moment
tensor inversion, or the waveform inversion. The spectral method, which is generally based on the
Brune source model, is a simple yet very efficient method. In this study, the source parameters of the
earthquake including M0, M and corners frequency (fc) were estimated using the Displacement
Spectral Inversion method based on the Brune source model in the frequency domain. In this study,
4373 three components accelerograms recorded by stations of Iran Strong Motion Network (ISMN)
across the country are used. All data were inspected with eye and the P and S-waves arrivals and the
S-wave window, were determined. Then the records were filtered using a band-pass filter and their
corrected velocity and displacement time histories were estimated (Fig1). Moment magnitude (M) is
calculated from the following equation (Hanks and Kanamuri, 1979):
M = 2/3log10 (M0) – 6.03, (1)
Where the scalar moment, M0, is the seismic moment in N.m. M0 is calculated from the following
equation based on the low-frequency plateau in displacement spectra (Ω0).
𝑀0 = 4𝜋𝜌𝛽3
𝑅𝜃𝜑𝐹𝑃𝐺(𝑅)𝛺𝑜 (2)
Where, ρ is the density, β is the shear wave velocity, and F is the free surface magnification
correction factor. Rθφ is the mean value of the radiation pattern and G(R) is the geometrical spreading
function. In the inversion of the displacement spectra, the inversion is carried out in a frequency
range that has a Signal to Noise Ratio≥3 and the three parameters of Ω0, fc and the frequency‐independent quality factor (Q) are assumed to be unknown, where they are obtained through the
nonlinear inversion. In this study, similar to Abercrombie (1995), the following general model for
fitting the displacement spectra has been selected:
(3) 𝛺(𝑓) = 𝛺0𝑒
−𝜋𝑓𝑡𝑄
[1+(𝑓
𝑓𝑐)𝛾𝑛]
1𝛾
,
Where Ω(f) is the Fourier spectrum of displacement, f is the frequency, n is the high‐frequency fall
off rate (on a log‐log plot), and γ is a constant. Here n = 2 and γ= 1, similar to the Brune spectral
shape model and t is the travel time of the considered wave. To determine the best fitting parameters,

we employ a bonded Nelder-Mead (1965) simplex algorithm. After the inversion, unknown
parameters Ω0, fc and Q are obtained. Using the obtained Ω0, the seismic moment and, ultimately, the
M are calculated. The final M0 of the earthquakes with at least three records was calculated by
averaging the values obtained at all stations and using this mean values, the final M of the
earthquakes were determined. The results show that the mean residuals is close to 0.3 and standard
deviations (σ) is about 0.2 (Table 1, Fig 2). The obtained values from the two selected windows do
not differ significantly, but the S window yields less mean residual and σ. As it can be seen, this
method estimates the final value of M slightly more than the real value. Consequently, if we want to
calculate the M of the earthquakes using this method, we would have to consider applying the
corrective relationships, which requires further studies. Using this method, M can be estimate rapidly
after the earthquake occurrences for earthquake early warning and rapid response systems.
Furthermore, just using the available records of earthquakes, the M of rather smaller events without
reported M can be calculated, which is very useful in earthquake catalog homogenization or in
forward-modeling studies of records.
Figure 1. An example of the three components of the corrected acceleration time histories (top, left), observed
and inverted spectra of the vertical component (top, right), and the signal and noise spectra (bottom) related to
the 2017 Sarpol-e Zahab earthquake, recorded at the Sarpol-e Zahab station.
Table 1. Mean and σ values for earthquakes with reported M, with at least three recorded accelerograms,
based on S-wave window (S) and whole signal widow (W).
Earthquake with at least 3 records Mean σ
M_W 0.31 0.18
M_S 0.27 0.18

Figure 2. Results based on the S window: a) Residuals for all accelerograms versus distance. b) Calculated
magnitude (M(Calculated)) versus the reported magnitudes (M(Reported)) for all accelerograms along with
the obtained σ. c) Calculated fc values for all earthquakes versus the M(Calculated). d) M(Calculated) for
each earthquake versus the M(Reported) along with the obtained σ.
KEYWORDS: Accelerograms, Brune Source model, Moment Magnitude, Source Parameters,
Spectral model

Green's Function uncertainty estimation for earthquake source inversion: a case
study of August 2012 Ahar-Varzaghan
Zeynal Kheiri, H.1, Moghtased-Azar, K.2, Sadegh Nojehdeh, P.1
1 University of Tabriz, Tabriz, Iran 2 Assistant Professor, University of Tabriz, Tabriz, Iran E-mail: [email protected]
Estimation of moment tensor parameters is one of the important tasks in seismology. In addition, the
uncertainty analysis of the estimated parameters is crucial for evaluating the quality of the solution.
In the waveform-based earthquake source inversions, two major origins of uncertainty can be
recognized. The first one is associated with the data error, which may be owing to instrumental or
ambient noise effects. The second source of uncertainty, which is almost always neglected, is related
to the uncertainty of Green’s functions (GFs) due to the inaccuracy in the crustal model considered.
The aim of this paper is the calculation of the GF uncertainty in order to improve the estimation of
the moment tensor parameters and their uncertainty.
Recent strategies in Bayesian waveform inversions rely on statistical description of the GF
uncertainty by means of a Gaussian distribution characterized by a covariance matrix. Hence, a fast
and simple method for evaluation of the covariance matrix of GFs can be introduced. In order to
estimate the GF covariance matrix, we use the method of Hallo and GalloviČ (2016). They proposed
a simplified approach to obtain approximate covariance, bypassing the numerically expensive
Monte-Carlo simulations. They derived closed-form formulae for approximate auto-covariance and
cross-covariance functions to simplify the evaluation of the GF uncertainty avoiding any demanding
computations. We use approximate auto-covariance functions (ACF) and approximate cross-
covariance functions (AXCF) for computing the GF covariance matrix of seismic waveforms 𝑓(𝑡)
and 𝑔(𝑡):
𝑐𝑜�̃�(𝑡. 𝜏) =1
𝐿1∫ 𝑓(𝑡 − 𝑙1)𝑓(𝑡 + 𝜏 − 𝑙1)
𝐿12
−𝐿12
𝑑𝑙1 − 1
𝐿1∫ 𝑓(𝑡 − 𝑙1)
𝐿12
−𝐿12
𝑑𝑙1 1
𝐿1∫ 𝑓(𝑡 + 𝜏 − 𝑙1)
𝐿12
−𝐿12
𝑑𝑙1
𝑥𝑐𝑜�̃�(𝑡. 𝜏) =1
𝐿1𝐿12∫ ∫ 𝑓(𝑡 − 𝑙1)𝑔(𝑡 + 𝜏 − 𝑙1 − 𝑙12)
𝐿122
−𝐿122
𝑑𝑙12𝑑𝑙1
𝐿12
𝐿12
− 1
𝐿1∫ 𝑓(𝑡 − 𝑙1)
𝐿12
−𝐿12
𝑑𝑙1 1
𝐿1𝐿12∫ ∫ 𝑔(𝑡 + 𝜏 − 𝑙1 − 𝑙12)
𝐿122
−𝐿122
𝑑𝑙12𝑑𝑙1
𝐿12
𝐿12
(2)
Where 𝑡 is time, 𝜏 is time lag between samples, 𝑙1 is time shift, 𝑙12 is time shift between the
waveforms and 𝐿1 and 𝐿12 is the width of the uniform time shift distribution.
This approximate approach requires a ‘mother’ GF and a statistical description of the random time
shifts of the signal as an input. The ‘mother’ GF is calculated using a mean velocity model by the
discrete wavenumber method (Bouchon 1981). It is assumed that the only effect of the velocity
model perturbations on the covariance matrix is the time shift of the signal. Moreover, it is presumed
that such representative of the true uncertainty for each time lag τ is just the covariance function’s
(CF) average over time, 1
𝑇∫ 𝑐𝑜�̃�(𝑡. 𝜏)𝑑𝑡
∞
−∞, where T is the duration of the dominant part of the signal.
(1)

By calculating the mean of the CF over time we obtain covariance dependent only on the time lag. If
this covariance function is evaluated from the ACF or AXCF, it is called stationarized approximate
covariance function (SACF or SAXCF).
We perform proposed methods on an MT inversion using waveforms recorded by a real earthquake
in Iran. The test event from 11 August 2012 (12:23 UTC) with moment magnitude 6.4 was located in
the East Azerbaijan Province at depth 14 km. Fig. 1 shows the ensemble of the solutions displayed in
terms of double couple (DC) mechanism nodal planes and histograms of DC component. The
reference solution obtained with ISOLA software (strike 83 ֯, dip 83 ֯ and rake 169֯ (in red)). It is worth
noting that we applied four covariance matrices in the inversion. The simplest case can be derived
when we consider covariance matrices with off-diagonal components obtained using ACF and
SACF. Indeed, the approximate cross-covariances between components of the same receiver are
taken into account using the AXCF and SAXCF. According to the obtained results, it can be
concluded that the most reliable estimate of the uncertainty of the MT parameters will be revealed
when employing the SACF covariance matrix. The AXCF and ACF (Fig. 1a, c) provide a good
estimate of focal mechanism uncertainty, but the uncertainty is still underestimated as it does not
fully cover the reference solution. Inversion with the SAXCF (Fig. 1g) provides the largest MT
uncertainty estimate, since receivers are usually in the far distance from the source in this case study,
and they are also placed on different soils.
KEYWORDS: Moment Tensor Inversion, Focal Mechanism, Uncertainty Estimation, Green's Function, Velocity Model
References
Figure 1. Statistical analysis of best-fitting solutions from MT. Panels show histograms of DC mechanism
nodal planes (a, c, e, g), DC component (b, f, d, h). The reference solution is plotted in red lines.
ACF
Covariance matrix
Best solution:
Strike:81 ֯
Dip: 76 ֯
Rake: 173 ֯
Covariance matrix
including AXCF Best solution: Strike:81
Dip: 56
Rake: 160
SACF
Covariance matrix Best solution:
Strike:84 ֯
Dip: 78 ֯ Rake: 184 ֯
Covariance matrix
including SAXCF Best solution:
Strike:83 ֯
Dip: 74 ֯
Rake: 191 ֯
(a) (b) (c) (d)
(e) (f) (g) (h)

Hallo, M. & Gallovič, F. (2016) Fast and cheap approximation of Green function uncertainty for waveform-
based earthquake source inversions. Geophys. J. Int., 207(2), 1012-1029
Duputel, Z., Rivera, L., Fukahata, Y., & Kanamori, H. (2012) Uncertainty estimations for seismic source
inversions. Geophys. J. Int., 190(2), 1243–1256
Shearer, P. M. (2009). Introduction to Seismology. Cambridge University Press (2nd edn)

Spatial distribution of slip for the 2010 August 27 Mw 5.8 Kuh-Zar earthquake
Bazargan, S.1, Asaadi, N.1, Shomali, Z.H.2,3 , and Rezapour, M.2
1University of Zanjan, Department of Physics
2University of Tehran, Institute of Geophysics
3Uppsala University, Department of Earth Science
E-mail: [email protected]
The slip distribution of a moderate earthquake of Iran, the 2010 August 27 Mw 5.8 Kuh-Zar
earthquake, was estimated from regional broadband seismic data using constrained non-negative
least squares linear slip inversion method. A great many inversions were carried out to determine the
optimal parameters used in the process such as rupture velocity and rise time. A rupture velocity of
2.55 km/s and rise time of 1.8 s were utilized for the event. Results show a rupture with peak slip of
15.0 cm and total seismic moment release of 2 ×1025 dyne-cm. The effect of the stations with
different epicentral distances was also analyzed using a sensitivity test. Due to the non-uniqueness of
the inversion problem, a set of solutions is presented for the Kuh-Zar earthquake. To the best of our
knowledge, this is the first time to consider constrained non-negative least squares linear finite-fault
inversion procedure to the Kuh-Zar earthquake.
KEYWORDS: seismic data, slip inversion, the 2010 Kuh-Zar earthquake
Introduction
This study is focused on acquiring spatial slip distribution of the 2010 August 27 Mw 5.8 Kuh-Zar
earthquake which occurred in Kuh-Zar, a village in Damghan county, Semnan Province. Based on
the seismic zoning of Iran by Mirzaei et al. (1998), there are five major seismotectonic provinces in
the country, that is Zagros in the southwest, Alborz-Azerbaijan in the north and northwest, Central
East Iran, Kopeh Dagh in the northeast and Makran in the southeast of Iran. The Kuh-Zar earthquake
is almost situated on the border of Alborz-Azerbaijan and Central East Iran seismotectonic provinces
which is in the proximity of the southern border of Alborz region. The epicenter of this event is
located north of the Torud fault which is the causative fault for the 1953 Torud earthquake, one of the
remarkable events of this area. The study aimed to obtain finite-fault modeling of the broadband
three-component displacement waveforms of the Kuh-Zar earthquake through a least squares
inversion method for the spatial slip distribution.
Data
The data used in this study is obtained from national broadband seismic network operated by the
International Institute of Earthquake Engineering and Seismology of Iran (IIEES,). These data
consist of 26 waveforms for the 2010 August 27 Mw 5.8 Kuh-Zar earthquake. The aftershocks of the
corresponding earthquakes were taken from the catalog of Iranian Seismological Center (IRSC). The

observed waveforms were filtered and decimated from the original 50 to 10 samples per second. The
instrument responses were removed, and the data were then converted to displacement. A band-pass
filter of 0.025-0.07 Hz was applied to the displacement waveforms.
Model Parameterization
Green’s functions were computed using the frequency-wavenumber integration code (FKRPROG)
developed by Saikia (1994). Also, the inversion algorithm applied to the observed data is based on a
stabilized constrained non-negative least-squares method introduced by Hartzell and Heaton (1983).
Non-uniqueness of the inversion problem led us to prepare a set of solutions. Therefore, we used
different hypocentral parameters and focal mechanisms. Different hypocenters reported by various
seismological agencies, i.e., ISC, GCMT, USGS, and EMSC (Table 1) were tested. Since the nodal
plane with a better fit to the data can be construed as the main fault plane (Abercrombie et al. 2001),
the focal mechanism (strike, dip, and rake) of the fault reported by GCMT and NEIC (Table 2) were
tested to find the nodal plane with the best fit. And, the resulting models helped us to determine the
fault plane from the auxiliary plane. The measure to choose the optimal result in all runs has been
total variance reduction—demonstrating the fit between observed and synthetic data—and the final
variance of the data misfit. As a result, the inversion found better fits with strike equals to 212 ̊ nodal
plane of GCMT (Table 2); thus, this plane is the fault plane, and we used it for the rest of the
investigation.
Table 1. The hypocentral parameters recorded by different agencies for Kuh-Zar earthqauke.
Agencies* Lat. (˚) Lon. (˚) Depth (km) Time
ISC 35.48 54.50 11.0 19h 23m 48s.87
GCMT 35.53 54.49 14.9 19h 23m 52s.40
USGS 35.49 54.47 7.0 19h 23m 49s.00
EMSC 35.49 54.55 10.0 19h 23m 48s.30
* Isc (http://www.isc.ac.uk), International Seismological Center; GCMT (http://www.globalcmt.org), Global Centroid
Moment Tensor; USGS (https://earthquake.usgs.gov), United States Geological Survey; EMSC (https://www.emsc-
csem.org), European-Mediterranean Seismological Center.
Table 2. The focal mechanisms reported by GCMT and NEIC.
2010 Kuh-Zar
GCMT
Nodal Plane 1
Strike(˚) Dip(˚) Rake(˚)
Nodal Plane 2
Strike(˚) Dip(˚) Rake(˚)
212 78 -2 302 88 -168
NEIC* 20 85 -10 111 80 -175
*The National Earthquake Information Center
The result of the 2010 Kuh-Zar Earthquake

The velocity model based on the study of Ashtari et al. (2005) was used for this event. We
determined several spatial slip distributions for the Kuh-Zar earthquake using different hypocentral
parameters. According to these models (not shown here), the distribution of slip is critically sensitive
to the depth of hypocenter. GCMT and USGS hypocenters (Table 1) were found to provide the best
fit to the observed data with maximum total variance reduction of about 44 % for spatial
distribution, but the variance of the data misfit obtained by GCMT is the least. Moreover, USGS
hypocenter gave a slip pattern with surface fault rupture which has not been corroborated by
Shahvar and Zare (2013). Furthermore, all of the hypocenters except GCMT provided models
which are not covering all of the slip distribution inside the given fault plane because of their lower
depths (EMSC hypocenter has the least variance reduction and its peak slip is 6 cm). Therefore, the
slip pattern acquired by GCMT hypocenter is chosen as the preferred spatial slip model of Kuh-Zar
earthquake (Figure 2). Based on the preferred model, the peak slip is almost 15 cm, and the total
seismic moment release is about 2.0×1025 dyne-cm.
The rupture velocity of 2.55 km/s provided the best fit to the data. It indicates that the rupture front
propagated with a rupture velocity as 70 percent as the shear wave velocity in the source area. Based
on lots of inversion trials, rupture velocities higher than 2.55 km/s failed to explain the rupturing
well. In accord with different inversion runs, optimum rise time was also chosen to be 1.8 sec.
Figure 1 demonstrates the observed data and synthetics. East-west component of DAMV, CHTH,
and THKV stations, and Z component of BJRD, KHMZ, SHRT, and GRMI stations were omitted
because we could not acceptably fit the waveforms due to the presence of noise.
Figure 1. Observed data (black) and synthetics (red) for the spatial slip distribution of the Kuh-Zar
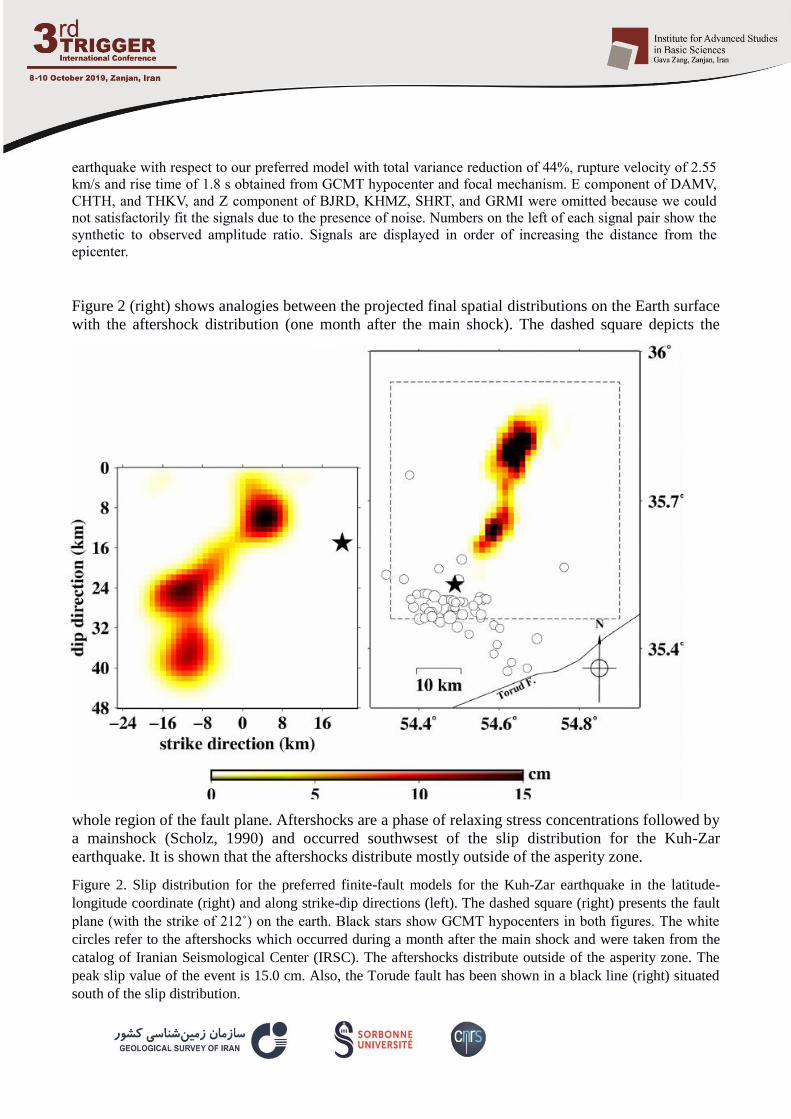
earthquake with respect to our preferred model with total variance reduction of 44%, rupture velocity of 2.55
km/s and rise time of 1.8 s obtained from GCMT hypocenter and focal mechanism. E component of DAMV,
CHTH, and THKV, and Z component of BJRD, KHMZ, SHRT, and GRMI were omitted because we could
not satisfactorily fit the signals due to the presence of noise. Numbers on the left of each signal pair show the
synthetic to observed amplitude ratio. Signals are displayed in order of increasing the distance from the
epicenter.
Figure 2 (right) shows analogies between the projected final spatial distributions on the Earth surface
with the aftershock distribution (one month after the main shock). The dashed square depicts the
whole region of the fault plane. Aftershocks are a phase of relaxing stress concentrations followed by
a mainshock (Scholz, 1990) and occurred southwsest of the slip distribution for the Kuh-Zar
earthquake. It is shown that the aftershocks distribute mostly outside of the asperity zone.
Figure 2. Slip distribution for the preferred finite-fault models for the Kuh-Zar earthquake in the latitude-
longitude coordinate (right) and along strike-dip directions (left). The dashed square (right) presents the fault
plane (with the strike of 212˚) on the earth. Black stars show GCMT hypocenters in both figures. The white
circles refer to the aftershocks which occurred during a month after the main shock and were taken from the
catalog of Iranian Seismological Center (IRSC). The aftershocks distribute outside of the asperity zone. The
peak slip value of the event is 15.0 cm. Also, the Torude fault has been shown in a black line (right) situated
south of the slip distribution.

References
Abercrombie, R.E., Bannister, S., Pancha, A., Webb, T.H. and Mori, J.J. [2001] Determination of fault
planes in a complex aftershock sequence using two-dimensional slip inversion. Geophysical Journal
International, 146, 134-142.
Ashtari, M., Hatzfeld, D. and Kamalian, N. [2005] Microseismicity in the region of Tehran.
Tectonophysics, 395, 193-208.
Hartzell, S.H. and Heaton, T.H. [1983] Inversion of strong ground motion and teleseismic waveform data for
the fault rupture history of the 1979 Imperial Valley, California, earthquake. Bulletin of the Seismological
Society of America, 73, 1553-1583.
Mirzaei, N., Mengtan, G., and Yuntai, C. [1998] Seismic source regionalization for seismic zoning of Iran:
major seismotectonic provinces. Journal of Earthquake Prediction Research, 7, 465-495.
Saikia, C.K. [1994] Modified frequency-wave-number algorithm for regional seismograms using
Filon’s quadrature–modeling of L(g) waves in eastern North America. Geophysical Journal
International, 118, 142–158.
Shahvar M.P., Zaré M. [2013] The 27 August 2010 Mw 5.7 Kuh-Zar earthquake (Iran): field investigation and
strong-motion evidence. Natural hazards, 66(2), pp.689-706.
Scholz, C.H. [1990] The mechanics of earthquakes and faulting. Cambridge University Press,
Cambridge.

S-wave quality factor tomography in NW Iran
3 M. Rezaeian,, 2 K. Motaghi,, 1 S. Andayeshgar,
1PhD student in seismology, Department of Earth Sciences, Institute for Advanced Studies in Basic
Sciences, Zanjan, Iran
2,3Assistant Professor, Department of Earth Sciences, Institute for Advanced Studies in Basic Sciences,
Zanjan, Iran
E-mail: [email protected]
Northwest Iran is one of the active tectonic regions in the Alpine Himalayan belt. This area includes
important geological structures including the North Tabriz Fault, the south Caspian basin, Sahand
and Sabalan volcanoes, Talesh Mountains and Lake Urumieh. Existence of active fault zones, the
effects of volcano magnetism and sedimentary basins affects strongly on earthquake wave
attenuation. This inspired us to investigate systematic amplitude residuals (observed amplitude –
predicted amplitude by available attenuation relations) to carry out a tomography for upper crust in
the study region in order to detect quality factor variations due to the heterogenic geological
structures. Here, we analyze 2901 seismograms from 302 small and moderate events (Mw < 5.2),
recorded by 11 permanent stations of Tabriz network (governing by Institute of Geophysics,
University of Tehran), one permanent stations of International Institute of Seismology and
Earthquake Engineering (IIEES) network and 23 temporary stations installed by Institute for
Advanced Studies in Basic Sciences (IASBS), Zanjan. We prepare a data set composed of spectral
amplitudes for different magnitudes and hypocentral distances. The difference between the logarithm
of observed amplitude and the logarithm of predicted amplitude (i.e., residual) at a frequency of 1 Hz
was considered as input data for a 2D quality factor tomography. The predicted amplitude is
calculated by spectral ground-motion equations for the NW Iran calculated by Motaghi et al. (2016).
The residuals show systematic pattern which inspire the idea that 2D attenuation coefficient
variations might be observed in the region. We assume that the 2D variations are caused by lateral
variations of quality factor and thus we perform a shear wave quality factor tomography using the
weighted damped least-squares method. Our results (figure 1) show a low (lower than average)
quality factor anomaly (marked by A) north of the NTF and low quality factor anomaly south of
Marand (marked by D). According to geological map (1:2,500,000), these are covered by thick
Neogene and Quaternary sediments. Therefore, we attribute these anomalies to sedimentary basins.
East of Marand, a high quality factor area (marked by B) is observed trending NW-SE which might
be attributed to Cretaceous volcanic rocks with an age of about 100 ±40 million years. Another
anomaly is observed with a high-quality factor in the southern mountains of Marand (marked by C).
According to the geological map, this anomaly is attributed to the Precambrian metamorphic rocks
with an age of ~540 million years. Under the Talesh Mountains (marked by E) and in east of the
Sabalan (marked by F), we observed two anomalous features with high and low quality factors,
respectively. These features are not consistent with the observable surface structures in mentioned
geology map. Instead, we found out that the features are deep (depth > 15 km) because they are
disappeared after removing rays generated by deep events (deeper than 15 km) beneath the Talesh
mountains. These anomalies are observed in gravity maps and previous seismic velocity tomography
studies (e.g., Bavali et al., 2016). We interpret the deep low quality anomaly in east of the Sabalan

(marked by F) as a hot structure remained from the Sabalan young eruption. The deep high quality
anomaly under the Talesh Mountains (marked by E) might be interpreted as a cold dense crust
probably related to an oceanic-like crust beneath the Southern Caspian basin (figure 2).
Figure 1. Quality factor tomogram for northwest Iran. Seismic stations are marked by black triangles. Black
lines show main faults (Taghipour et al., 2018). NTF: North Tabriz Fault. A–F are anomalous features
discussed in the text.
Figure 2. Quality factor tomogram for northwest Iran after deleting deep events (>15 km). Anomaly F
disappears while anomaly E weakens considerably.
KEYWORDS: Quality factor, Tomography, Attenuation, NW Iran.

A Fuzzy approach to kinematic source inversion
Kheirdast, N1, Ansari, A.1, Custodio, S.2
1International Institute of earthquake engineering and seismology (IIEES), Tehran, Iran
2Instituto Dom Luiz, Faculdade de Ciencias, Universidade de Lisboa, Lisbon, Portugal
Kinematic source inversion is to infer the spatial-temporal source function over a given fault from
seismic data. The forward formulation that comes from the representation theory of seismology (Aki
& Richards 2002) is a Fredholm integral of the first kind and the inverse problem based on which, is
inherently ill-posed. Ill-posedness refers to either no solution exists or there is not a unique solution
available. One way to control the ill-posedness is to decrease the number of parameters involving in
the inversion which comes from the model approximation method we use. One way to decrease the
number of parameters is to use adaptive methods from those we used the fuzzy function
approximation method. Fuzzy function approximation is a uniformly convergent approximation
method that can estimate every function to any degree of accuracy. The method is nowadays used in
machine learning approaches. Based on fuzzy function approximation we developed an inversion
method that can map seismic data into the slip in a stable way using the Adaptive neuro-fuzzy
inference system (ANFIS).This method controls the amount of small singular which is responsible
for ill-posedness. The method has been tested for the SIV1-benchmark problem and a comparison
between inferred source function as well as synthetic data shows proper conformity in both model
and dataspace.

Constrained magnetostratigraphic dating and tectono-stratigraphic evolution of
the Tarom Intermontane Basin, Northern Iranian Plateau
Paknia, M. 1, Ballato, P.1, Mattei, M.1, Heidarzadeh, G.2, Cifelli, F. 1, Hassanzadeh, J. 3, Vezzoli, G .4,
Mirzaie Ataabadi, M. 5*, and Ghassemi, M .6
1 Department of Science, University of Roma Tre, Rome, Italy 2 Institute of Earth and Environmental Sciences, University of Potsdam, Potsdam, Germany 3 Division of Geological & Planetary Sciences, California Institute of Technology Pasadena, USA 4 Department of Earth and Environmental Sciences, University of Milano-Bicocca, Milan, Italy 5 Department of Geology, Faculty of Science, Univesity of Zanjan, Zanjan, Iran 6 Research Institute for Earth Sciences, Geological Survey of Iran, Tehran, Iran
E-mail: [email protected]
The Tarom Basin is an elongated, NW-SE-striking, intermontane basin in northwest Iran. It is
located at the transition of the Iranian Plateau and the South Caspian Basin. Currently, the basin is
drained by the Qezel-Owzan River, however, the existence of deformed post Eocene red beds and
Quaternary terrace conglomerates suggests that it experienced several episodes of internal drainage
and limited connectivity with the Caspian foreland.
In order to decipher the origin and constrain the tectono-stratigraphic evolution of this basin, we
carried out an integrated magnetostratigraphic, geochronologic and sedimentologic study along three
stratigraphic sections. A total of 539 oriented, fine-grained (mudstone and sandstone) samples were
collected from paleomagnetic sampling sites consisting of fluvio-lacustrine, playalake and alluvial-
fan deposits. Stepwise thermal and alternating field demagnetization allowed isolating a linear
magnetization component that decays toward the origin and represents the primary magnetization
carried mostly by magnetite. Our results indicate that a first episode of uplift and deformation along
the basin margins took place after ca. 35 Ma. This was followed by a period of erosion and non-
sedimentation until ca. 16.3 Ma. By that time, basin development occurred in association with the
establishment of internal drainage conditions and uplift of the northern (Alborz Mountains) and
southern (Tarom Range) basin margins. This configuration led to the accumulation of a > 1.5-km-
thick sequence of red beds at least until ca. 7.5 Ma, implying that intrabasinal deformation and
incision must be younger than that. Sedimentation occurred at nearly uniform rates with a sharp
increase at ca.
12.3 Ma and few episodes of acceleration that may reflect thrust loading during enhanced shortening
phases along the basin margins.
KEYWORDS: Tarom basin, magnetostratigraphy, sediment accumulation rates, uplift and
subsidence.