BOOK OF ABSTRACTS - Intercoh
108
INTERCOH2021 13-17 September 2021 - Delft, The Netherlands BOOK OF ABSTRACTS
-
Upload
khangminh22 -
Category
Documents
-
view
0 -
download
0
Transcript of BOOK OF ABSTRACTS - Intercoh

INTERCOH202113-17 September 2021 - Delft, The Netherlands
BOOK OF ABSTRACTS

2
Monday 13 September
9:30-10:15 Registration and Coffee
10:15-10:30 Welcome and start of the conference
10:30-12:00 p. 11 p. 12 p. 13 p. 14 p. 15 p. 16
Estuarine Sediment Transport Models Skillfull hindcast of a decade of mud-morphodynamics in South San Francisco Bay salt pond restoration. M. van der Wegen, J. Reyns, B. Röbke, J. Nam, J. Lovering, A. Foxgrover, B. Jaffe Assessing the long term variability of suspended particulate matter from the tributaries of a large coastal lagoon. E. C. Bortolin, J. Távora, E.H. Fernandes Understanding the spatio-temporal variability of SPM dynamics from observations and model analysis. T. van Kessel, M. Fettweis, R. Verney Feedback effects of sediment suspension on estuarine turbidity maximum. C. Zhu, D.S. van Maren, L. Guo, J. Lin, Q. He, Z.B. Wang Uncovering the sediment transport processes that caused the regime shift to hyperturbid conditions in the Loire Estuary. Y.M. Dijkstra, R.J.A. de Goede Modeling the rheological behavior of high-concentrated mud suspensions in the Ems Estuary: why a yield stress model should be avoided. J. Schmidt, A. Malcherek, M. Naulin
12:00-13:30 Lunch
13:30-15:00 p. 17 p. 18 p. 19
Characterizing Sediments and Suspensions A numerical study of the flow of fluid mud in a cylinder and vane rheometer. D.S.Ch.Praveen, Erik A. Toorman Characterizing the Composition of Suspended Sand and Mud Suspensions in Coastal Environments using Combined Optical and Acoustic Measurements : Laboratory Experiments. Duc Tran, Stuart Pearson, Matthias Jacquet, Bram Van Prooijen, Romaric Verney Turbulent-laminar transitions in flows laden with Cohesive sediment. M.G.W. de Vet, R. Fernández, J.H. Baas, W.D. McCaffrey, R.M. Dorrell
Table of Contents & Program

3
p. 20 p. 21 p. 22
Characterizing the Composition of Sand and Mud Suspensions in Coastal Environments using Combined Optical and Acoustic Measurements: Field Applications. S.G. Pearson, R. Verney, H.C.M. Hendricks, D. Tran, M. Jacquet, Z.B. Wang, B.C. v. Prooijen High Resolution Echosounder Data from Water Surface to Sea Bed. M. Daugharty, J. Brinkkemper, S. Kamminga, H. Huitema, J. Van Heesen, S. Nylund Acoustic measurements of cohesive sediments suspensions, the role of flocculation and sand. Francisco Pedocchi, Rodrigo Mosquera
15:00-15:30 Coffee break
15:30-16:30 p. 23 p. 24 p. 25 p. 26
Interactions with biology A bio-morphodynamic modelling study to determine how environmental conditions control mangrove vulnerability to sea-level rise. Danghan Xie, Christian Schwarz, Maarten G. Kleinhans, Barend van Maanen Intra-annual surface elevation dynamics in a mangrove forest in New Zealand. R. Gijsman, E.M. Horstman, A. Swales, C.A. Eager, I.T. MacDonald, T.J. Bouma, K.M. Wijnberg Can the Demak Mangrove-Mud Coast Keep up With Relative Sea Level Rise? B.P. Smits, B.K. Van Wesenbeeck, M.A.de Lucas Pardo, D.S. Van Maren Key bioturbator species within benthic communities determine sediment resuspension thresholds. J.C. de Smit, M.Z.M. Brückner, K. Mesdag, M.G. Kleinhans, T.J. Bouma
16:30-17:00 Keynote presentation Peter Herman.
17:00- Icebreaker
Tuesday 14 September
8:30-10:00 p. 27 p. 28 p. 29 p. 31
High Turbidities Analytical Approach for Channel Formation in Hyperconcentrated Flows. A.M. Talmon Consolidation and desiccation of mud deposits: numerical modelling. E. Meshkati, G. Dupuits, P.J. Vardon, T. van Kessel, A. Talmon, J. Tigchelaar, L. Sittoni, W.R.L. van der Star Dynamic fluid mud layer on intertidal mudflat. Q. Zhu Dynamic Response of the Fluid Mud to a Tropical Storm. Jianzhong Ge, Changsheng Chen, Zheng Bing Wang, Pingxing Ding
4
p. 32 p. 33
Fluid mud in dune troughs: The mud-dune transition in coastal plain estuaries. Marius Becker Managing a high range turbid system at a tidal energy site: - Severn Estuary, UK. R Kirby, C Retière
10:00-10:30 Coffee break
10:30-11:30 p. 34 p. 35 p. 36 p. 37 p. 38 p. 39 p. 40 p. 41 p. 42 p. 43
Poster session Behavior of mud aggregates at the Socheongcho Ocean Research Station (SORS) in the eastern Yellow Sea. G. Lee,S.M. Figueroa, J. Chang The role of biophysical stickiness on oil contaminated mineral flocculation in seawater. L. Ye, A. J. Manning, J. Holyoke, J. A. Penaloza-Giraldo, T.-J. Hsu Study of spectral wave dissipation at the Hendijan mud coast, the Persian Gulf. M.R. Kiani, M. Soltanpour, S.A. Haghshenas Sediment stability and EPS interactions in intertidal habitats. J.M. Rounce, A.J. Manning, J.A. Hope, A.J. Blight, D.M. Paterson Distribution and Transport of Micro/Nano Plastics with Chemical Contaminants & Biological Agents in Industrial, Urban and Rural Aquatic Environments. A. Burch, A. Manning On satellite remote sensing reflectance resolutions and the implications to the assessment of Suspended Particulate Matter: study case of Patos Lagoon, Brazil. J. Tavora, E. C. Bortolin, E. H. Fernandes An investigation of sonar techniques past and present to identify objects on and beneath the seabed. T.D. Maw, A.J. Manning Spring-neap variability of tidal current velocity in the Emder Fairway (Ems Estuary) derived from moored ADCP. Anna Wünsche, Marius Becker, Christian Maushake, Christian Winter Issues relating to the disposal of muddy dredged material – A global perspective. T.J. Peters, A.J. Manning Flocs Behaviour in Fluvial to Marine Transition: A Laboratory Study. E. Abolfazli, R. Osborn, K.B.J. Dunne, J.A. Nittrouer, K. Strom
11:30-12:00 p. 44 p. 45
Geotechnics Geotechnical properties and constitutive model parameters of deep-sea sediment from the Western Mediterranean Sea. P. Kaminski, J. Grabe, M. Urlaub, T. Sager Toe scour at a vertical wall on a vegetated silt beach. Z. Peng, Q. He, X.Y. Wang

5
12:00 Announcements
12:00-13:30 Lunch
13:30-15:00 p. 46 p. 47 p. 48 p. 49 p. 50 p. 51
Field observations Sediment dynamics at an estuary mouth: detrending the impact of tides, river discharge and waves from high-frequency measurements. R. Verney, F. Grasso, C. Gaillard How are fines buried in a sandy seabed? H.C.M. Hendriks, B.C. v. Prooijen, C.H. Cheng, S.G.J. Aarninkhof, J.C. Winterwerp, K.E. Soetaert Reworking of cohesive turbiditic deposits in the Cassidaigne submarine canyon by internal and regional currents. R. Silva Jacinto, B. Dennielou, I. Pairaud, P. Garreau Feedback loops arising from sand-mud interaction cause bimodal mud contents. A. Colina Alonso, D. S. van Maren, P.M.J. Herman, R. J. A. van Weerdenburg, Y. Huismans, Z. B. Wang Regime shifts in sediment concentrations in the Changjiang Estuary. J. Lin, B.C. v. Prooijen, L. Guo, C. Zhu, Q. He, Z.B. Wang Evaluation of the Krone-Partheniades Model: Using Field Observations to Estimate Erosion and Deposition Fluxes. Zaiyang Zhou, D.S. van Maren, Jianzhong Ge, Pingxing Ding, Zheng Bing Wang
15:00-15:30 Coffee break
15:30-16:00 p. 52 p. 53
Dredging Working with nature - investigating agitation dredging as a methodology for sediment recycling in a small estuary system with a large port. J. Spearman, T. Benson, J. Taylor Mid-term effects of maintenance dredging in the physical functioning of the Seine Estuary. J.P. Lemoine, F. Grasso, B. Mengual, P. Le Hir
16:00-16:30 Keynote presentation Edward Anthony
16:30-18:00 Discussion on human interferences in muddy coasts
6
Wednesday 15 September
8:30-10:00 p. 54 p. 55 p. 56 p. 57 p. 58 p. 59
Ports and Approach Channels The forgotten ones from the ports: The filter feeders at the heart of siltation processes. V. Hamani, I. Brenon, T. Coulombier, J.R. Huguet, L. Murillo Experimental studies on the sedimentation and consolidation behaviour of fluid mud in the port of Hamburg. D. M. Nguyen, J. Grabe, N. Ohle, U. Schmekel Investigating Sedimentation in Bushehr Port Access Channel, Adopting Periodic Sonar Surveys and Numerical Simulations. A. Farhangmehr, S. A. Haghshenas, E. Zarinfar Siltation processes of dredged navigation channel at estuarine port. Y. Nakagawa, T. Kosako, T. Watanabe Spatial variability in the yield stress of mud at Port of Hamburg, Germany. A. Shakeel, A. Kirichek, C. Chassagne Detailled modelling and monitoring of WID as an efficient harbor siltation maintenance strategy. L. de Wit, K. Cronin, A. Kirichek, T. van Kessel
10:00-10:30 Coffee break
10:30-11:30 p. 60 p. 61 p. 62 p. 63 p. 64 p. 65 p. 66
Poster session Wall-slip artefact signature in rheometry of natural fluid muds. A.M. Talmon, E. Meshkati, A.P.K. Goda, A. Kirichek Response of the turbidity maximum zone to fluctuations in sediment deposition in the Wouri estuary. Y. Fossi Fotsi, I. Brenon, R. Onguene, N. Pouvreau, J. Etame When does suspended mud deposit on a relatively immobile substrate? T. Ashley, K. Strom, J. Schieber, Z. Yawar Dynamics of sand-mud mixtures in the Khuran Starit – the Persian Gulf. M. Hajibaba, M. Soltanpour, S.A. Haghshenas, A. Farhangmehr A 1DV-model for submerged density currents. H.C.M. Hendriks, T. van Kessel, T. Vijverberg, A.J. Nobel, I. Doets, M.D. Klein, L. Sittoni, R. Uittenbogaard, J.C. Winterwerp Estimation on equilibrium mudflat profiles at the mouth of the Shirakawa River using the principle of maximum information entropy. G.Tsujimoto, R. Yukimura, T.Hokamura, R.Yamaguchi Carbon Accretion in the Sediments of Estuarine Mangroves in Sri Lanka. Ahalya Suresh, Jinsoon Park, Jong Song Khim

7
p. 68 p. 69 p. 70
Flocculation in estuaries: modelling, laboratory and in-situ studies. C. Chassagne, Zeinab Safar, Zhirui Deng, Qing He, A. Manning DEXMES: A novel cylindrical device for SPM experiments. D. Tran, A. Bocher, M. Jacquet, S. Pearson, F. Floc’h, N Le Dantec, F. Dorval, G. Fromant, A. Vergne, F. Jourdin, A. Crave, H. Lintanf, R. Verney Mud profile equations and evaluation. A. Perwira, Mulia Tarigan, Hasanul Arifin Purba
11:30-12:00 p. 71 p. 72
Numerical model development Dynamic sediment flocculation: Development of a 2DH model for coastal applications. Sebastian Escobar Ramos, Qilong Bi, Samor Wongsoredjo, Erik Toorman A sensitivity study of residual transport using a 1DV model. J. Vanlede
12:00 Announcements
12:00-13:30 Lunch
13:30-15:00 p. 73 p. 74 p. 75 p. 76 p. 77
Flocculation Flocculation influenced by the presence of algae in the Changjiang Estuary. Z. Deng, C. Chassagne, Q. He, Z.B. Wang The characteristics of the organic matter in biomineral flocs. M. Fettweis, M. Schartau, X. Desmit, N. Terseleer, B.J. Lee, D. Van der Zande, R. Riethmüller Flocculation dynamics in estuarine channel and shallows. R.M. Allen, D.N. Livsey, and J.R. Lacy A quantitative examination of floc structure considering turbulence, salinity and sediment concentration. C. Guo, A.J. Manning, S. Bass, L. Guo, Q. He Long term flocculation of kaolin clay in the absence of gravity. B. Vowinckel, P. Luzzatto-Fegiz, N. Rommelfanger, F. Kleischmann, E. Meiburg
15:00-15:30 Coffee break
15:30-17:00 p. 78 p. 79
Estuaries and Tidal Flats Lateral sediment exchange mechanisms in the Ems estuary. D. S. van Maren, J. Vroom, J. van Keulen Dynamics of suspended particulate matter properties in the Maroni estuary. M. Chapalain, G. Detandt, K.A. Do, A. Gardel, N. Huybrechts, T. Maury, A. Sottolichio

8
p. 80 p. 81 p. 82 p. 83
Near bed cohesive sediment dynamics in Montevideo bay. Rodrigo Mosquera, Francisco Pedocchi The Sediment Flux in Salt marsh Tidal channel systems. J. Sun, B.C. v. Prooijen, X.Wang, Q.He, Z.Wang Intertidal mudflats can (not) survive sea level rise. F. Grasso, B. Mengual, P. Le Hir, and J.-P. Lemoine What defines the tidal flat shape? Jill Hanssen, Bram van Prooijen, Peter Herman
17:00-18:00 Mehta Award Presentation
Thursday 16 September
8:30-10:00 p. 84 p. 85 p. 86 p. 87 p. 88 p. 89
Large-scale sediment dynamics Anthropogenic effects on regime shifts in the Yangtze Estuary. Qing He Q. He, C. Zhu, J. Lin, L. Zhu, Y. Chen, Z.B. Wang, and J.C. Winterwerp Numerical modeling of suspended sediment fluxes between a macrotidal estuary and its adjacent shelf: horizontal and vertical structures. Melanie Diaz, Florent Grasso, Aldo Sottolichio, Pierre Le Hir, Benedicte Thouvenin, Mathieu Caillaud Internal tides as a major process in Amazon continental shelf fine sediment transport. E. Molinas, J. C. Carneiro, S.B. Vinzon Mud dynamics and the morphodynamic response of the Western Scheldt estuary to sea level rise. H. Elmilady, B. Röbke, M. van der Wegen, D. Roelvink, A. van der Spek, M. Taal Spring-neap variations in sediment trapping in tide-dominated estuaries: the role of the bottom pool. H.M. Schuttelaars, D.D. Bouwman, Y.M. Dijkstra Understanding multi-year and seasonal variations in SPM in the Dutch Wadden Sea using a Delft3D-FM numerical model. R.J.A. van Weerdenburg, J. Vroom, B.P. Smits, T. van Kessel, P.M.J. Herman
10:00-10:30 Coffee break
10:30-11:30 p. 90 p. 91
Poster session Sediments dynamics in a closed macrotidal estuary (Rance estuary, France): from mud to a mixture of mud-sand-gravel. R. Rtimi, A. Sottolichio, P. Tassi The origin of two-step yielding in natural mud: wall slip or structural reorganization? A. Shakeel, A. Kirichek, C. Chassagne

9
p. 92 p. 93 p. 94 p. 95 p. 96 p. 97
Mangroves direct hydrodynamics and morphology in Whitianga Estuary, New Zealand. A. Rahdarian, K.R. Bryan, M. van der Wegen Numerical simulation of hydrodynamics for morphological study around river mouth in north western Java Island, Indonesia. T. Kosako, H. Tamura, A. Bagyo Widagdo, D. C. Istiyanto, Y. Nakagawa Sediment dispersion of low-density clayey suspension turbidity currents generated by deep-sea mining. D. Enthoven, C. Chassagne, R.L.J. Helmons, J.L.J. Hanssen Field measurements and lab investigations to determine soil exchange characteristics for sediments from the Weser estuary. J. Patzke, E. Nehlsen, P. Fröhle, R. Hesse, A. Zorndt Erosion rate formula of very fine sediment bed based on turbulent entrainment. Harada D., Egashira S. Experimental and numerical study of a cylinder passing through fluidized natural mud. Marco S. Sotelo, Djahida Boucetta, Bart Brouwers, Guillaume Delefortrie
11:30-12:00 p. 98 p. 99
Microplastics A systematic study on the interaction between microplastics and cohesive sediments. Nan Wu, Kate L. Spencer, Stuart W. D. Grieve, Andrew J. Manning Flocculation of microplastic and natural sediment at environmentally realistic concentrations. T.J. Andersen, S. Rominikan, I.D. Olsen, K.H. Skinnebach, N.Z. Grube, S. Jedal, S.N. Laursen, M. Fruergaard
12:00 Announcements
12:00-13:30 Lunch
13:30-15:00 p. 100 p. 101 p. 102 p. 103
Flocculation The monitoring of flow mechanics in cohesive sediment layers. B. Brouwers E. Lataire and J. v. Beeck Modelling of Deep Sea Mining-Generated plumes. M.F.A.I. Elerian, Z. Huang, C. van Rhee, R.L.J. Helmons Examining erosional and depositional characteristics in cohesive sediment: Flocculation and microplastics in an estuary. J.M. Rounce, L. Anscomb, L. Farrington, C. Flint, E. Saunders, A.J. Manning Flocculation study with the help of a model based on logistic growth theory. W. Ali, C. Chassagne

10
p. 104 p. 105
Cohesive Sediment Fluxes in a Muddy Tidal Channel Highly Impacted by Humans. S.M. Figueroa, G. Lee, J. Chang Influence of riverine suspended sediment organic matter on particle size distribution. D. Sehgal, N. Martínez-Carreras, C. Hissler, V.F. Bense, A.J.F. Hoitink
15:00-15:30 Coffee break
15:30-16:00 p. 106 p. 107
Flocculation Vertical distributions of mud floc sizes in two reaches of the lowermost Mississippi River. Ryan Osborn, Kyle Strom, Kieran Dunne, Jeffrey A. Nittrouer, and Tom Ashley Estuarine light attenuation, scattering, and absorption as a function of suspended floc properties and other water column constitutents. C.T. Friedrichs, K.A. Fall, G.M. Massey
16:00-16:30 Keynote lecture by Kate Spencer 16:30-18:00 Discussion on future developments in flocculation research 18:00 Announcement of the Krone Award 19:30- Conference dinner

11
Skillfull hindcast of a decade of mud-morphodynamics in South San Francisco Bay salt pond restoration
M. van der Wegen1,2, J. Reyns1,2, B. Röbke2, J. Nam3, J. Lovering3, A. Foxgrover4, and B. Jaffe4
1 IHE Delft, Delft, Netherlands [email protected] 2 Deltares, Delft, Netherlands
3 Santa Clara Valley Water District, California, USA 4 Pacific Coastal and Marine Science Center, USGS, Santa Cruz, USA
1. Introduction Morphodynamic predictions in muddy environments have been a challenge due to the complex nature of mud transport mechanisms and lack of validation case studies. It appears that predictions on a longer timescale (~ decades to centuries) capture observed trends (e.g. Elmilady et al. 2019), but skillful predictions are more difficult on shorter timescales (e.g. Van der Wegen et al. 2019). Here we present the results of a modeling effort covering 2 to 7 years in a well-measured environment.
The Alviso Slough area, South San Francisco Bay, is the site of an ongoing effort to restore former salt production ponds to intertidal habitat. As restoration proceeds and the levees surrounding the former salt production ponds are breached, the increase in tidal prism and associated sediment scour in the sloughs remobilize sediments and legacy mercury deposits. We developed and validated a 2D numerical model (Delft3D FM-SWAN wave-coupled model) to assess patterns of fine sediment transport and associated morphodynamic development under (anticipated) management actions. The model included two mud fractions; one with high critical erosion shear stress to calibrate morphodynamic development and one with low critical erosion shear stress to calibrate suspended-sediment concentrations (SSC).
2. Model results Our 2D, morphodynamic model skillfully reproduces observed water levels and annual timescale erosion and sedimentation patterns of cohesive sediments (Figure 1). These include Pond A6 infill volumes after imposed breaches. The associated SSC’s are more difficult to reproduce, but are of the same order of magnitude as observations. In this system, the exchange of water and sediment at the tidal timescale far exceeds that at the subtidal or residual timescale, making residual patterns difficult to observe. The model reveals these residual flow and sediment transport patterns throughout the pond system, providing additional insight that is not readily measurable.
It is striking that our morphodynamic model captures observed trends in morphologic change while intertidal sediment concentration dynamics show limited skill. It raises questions on scales, processes and complexity required in morphodynamic modeling. We may conclude that the model reproduced the correct morphodynamic patterns based on too-limited physics, implying that calibration coefficients would account for missing processes. In contrast, we may also consider that reproducing detailed intertidal dynamic processes is not necessary for accurate prediction of morphologic change.
The model captures subtidal processes that are generally difficult to measure, but which are more relevant to restoration project managers.
Figure 1. Observed and modelled erosion (blue) and sedimentation (yellow and red) patterns over 2010-2012 (in m). Labels indicate former salt production ponds.
3. Conclusions Our 2D model shows that we can skillfully reproduce observed morphodynamic developments of fine, cohesive sediments in the Alviso Slough pond system on an annual timescale. This is of particular use to assess future pond restoration scenarios and intervention measures. Future research work may focus on exploring the impact 3D hydrodynamics and sea level rise scenarios as well as on including vegetation dynamics to forecast marsh development. References Elmilady, H., van der Wegen, M., Roelvink, D., & Jaffe,
B. E. (2019). Intertidal Area Disappears Under Sea Level Rise: 250 Years of Morphodynamic Modeling in San Pablo Bay, California. Journal of Geophysical Research: Earth Surface, 124(1), 38–59.
Van der Wegen, M., Roelvink, J. A., Jaffe, B. E. (2019). Morphodynamic resilience of intertidal mudflats on a seasonal time scale. Journal of Geophysical Research: Oceans, 124, 8290–8308.

12
Assessing the long term variability of suspended particulate matter from the tributaries of a large coastal lagoon
E. C. Bortolin1, J. Távora2 and E.H. Fernandes1
1 Instituto de Oceanografia, Universidade Federal do Rio Grande (FURG), Rio Grande, Brazil. [email protected]/ [email protected]
2 Faculty of Geo-Information Science and Earth Observation, University of Twente, Enschede, the Netherlands. [email protected]
1. Introduction Patos Lagoon covers about 10.000 km2 and receives continental contributions from Guaíba and Camaquã rivers, and São Gonçalo Channel (connecting to Mirim Lagoon). The system is connected to the Atlantic Ocean through the narrow Rio Grande inlet (700 m width), which regulates the flocculation processes (Wallner-Kersanach et al., 2009). The main forcings controlling the fine suspended sediment dynamics in the lagoon are the wind action and continental discharge variability responding to seasonal and interannual cycles (ENSO) (Bitencourt et al., 2020; Távora et al., 2019). The aim of this work is to investigate the Patos Lagoon variability in Suspended Particulate Matter (SPM) retrieved by a multi-wavelength semi-analytical method (Távora et al., 2020a) from 1984 to 2020, focusing on the tributaries input. Results will be compared to available in-situ measurements in order to validate a low-cost and versatile tool to assess SPM in coastal systems. 2. Methods SPM concentrations were estimated based on the Remote Sensing Reflectance (Rrs) from satellite scenes (LANDSAT 5, 7, and 8). The atmospheric correction was processed by the ACOLITE free software, applying the Dark Spectrum Fitting (DSF) configuration, as recommended by the Royal Belgian Institute of Natural Sciences (RBINS). This software also merged scenes to fit a box representative of the study area (Figure 1).
Figure 1: Merged scenes (swath: 29.9o to 32.5o S; 50.5o to 52.5o W) in an RGB composite generated by ACOLITE, illustrating Patos Lagoon with the main tributaries. The application of the multiple wavelength semi-analytical method algorithm requires multiple remote sensing wavelengths and temperature data, assessing the uncertainties related to the reflectance measurements or
the Inherited Optical Properties of SPM (Távora et al., 2020a). 3. Results and Discussion Results from this study represent the longest period (4 decades) of SPM retrieval by remote sensing in Patos Lagoon. Preliminary tests presented the best match between in situ and calculated SPM when compared to previous models applied to Patos Lagoon (Távora et al., 2020b). SPM concentrations and precipitation rates are strongly related to ENSO cycles, with higher (lower) rates occurring associated with El Niño (La Niña) events. These results show the influence of the tributaries on Patos Lagoon SPM, evidencing them as the main control. 4 Conclusions Results of a 36 years analysis identified variability in the SPM of Patos Lagoon related to ENSO cycles, and support the applied algorithm as a reliable universal low-cost approach, especially useful to fulfill gaps in long time series of SPM data in coastal systems with limited field SPM measurements. References Bitencourt, L. P., Fernandes, E. H., da Silva, P. D., & Möller, O. (2020).
Spatio-temporal variability of suspended sediment concentrations in a shallow and turbid lagoon. Journal of Marine Systems, 212(September). https://doi.org/10.1016/j.jmarsys.2020.103454
Távora, J., Boss, E., Doxaran, D., & Hill, P. (2020a). An algorithm to estimate suspended particulate matter concentrations and associated uncertainties from remote sensing reflectance in coastal environments. Remote Sensing, 12(13), 1–24. https://doi.org/10.3390/rs12132172
Távora, J., Fernandes, E. H., Bitencourt, L. P., & Orozco, P. M. S. (2020b). El-Niño Southern Oscillation (ENSO) effects on the variability of Patos Lagoon Suspended Particulate Matter. Regional Studies in Marine Science, 40, 101495. https://doi.org/10.1016/j.rsma.2020.101495
Távora, J., Fernandes, E. H. L., Thomas, A. C., Weatherbee, R., & Schettini, C. A. F. (2019). The influence of river discharge and wind on Patos Lagoon, Brazil, Suspended Particulate Matter. International Journal of Remote Sensing, 40(12), 4506–4525. https://doi.org/10.1080/01431161.2019.1569279
Wallner-Kersanach, M., de Andrade, C. F. F., Zhang, H., Milani, M. R., & Niencheski, L. F. H. (2009). In situ measurement of trace metals in estuarine waters of Patos Lagoon using diffusive gradients in thin films (DGT). Journal of the Brazilian Chemical Society, 20(2), 333–340. https://doi.org/10.1590/S0103-50532009000200019

13
Understanding the spatio-temporal variability of SPM dynamics from observations and model analysis
T. v. Kessel1, M. Fettweis2 and R. Verney3
1 Department of Marine and Coastal Systems, Deltares, Delft, Netherlands. [email protected] 2 RBINS, Brussels, Belgium 3 IFREMER, Brest, France
1. Introduction The dynamics of suspended particulate matter (SPM) in the coastal zone is influenced by many factors such tidal forcing, wind-induced currents, waves, horizontal and vertical density gradients, sediment supply, primary production, organic matter and flocculation. In this contribution we will show examples of the observed spatio-temporal variability of SPM concentration along the French, Belgian and Dutch coast and discuss to what extent we can understand this variability from known processes and forcing. We will try to decipher the contribution of «expected seasonal dynamics», unexpected, rare or extreme events and long-term trends. What contribution explained by hydro-meteorological forcing, continental inputs, bio-physical interactions or human activities? These questions are important for our common understanding of SPM dynamics in these coastal systems, autonomous trends and human impacts. We will provide an overview of the available observations (Figure 1) and will sketch an approach on how we can provide the best contextualized 4D evaluation of the coastal dynamics by aggregating multi-source and multi-parameter information (for example satellite, fixed stations with low- and high-frequency retrieval, ferry boxes, model results). Evaluation in space and time of data from various sources requires an extensive uncertainty analysis of the data and a discussion on how we can best estimate them (Fettweis et al., 2019).
Among these complex interactions, we will specifically discuss the interactions between the organic and mineral components of the SPM, e.g. the impact of turbidity on primary production through light limitation. We will discuss the required integration level of these processes in observation networks and SPM numerical transport models and sketch a pathway for further development of coupled hydrodynamic, sediment and ecological models for a comprehensive evaluation of the bio-physical ecosystem functioning (sediment fluxes, eutrophication, nutrient and organic matter composition). 2. Conclusions In this study we won’t provide final answers, but we will sketch the current practice in SPM and related observations and subsequent analysis. We will also make suggestions on how this current practice can be further extended and improved for critical discussion with the INTERCOH community. Acknowledgments This work is part of the Jerico-3 project and has strong links with the DANUBIUS project on land-sea continuum interactions. References Fettweis, M. et al. (2019). Uncertainties associated with
in-situ high-frequency long-term observations of suspended particulate matter concentration using optical and acoustic sensors. Progress in Oceanography 178 102162.
Figure 1: Area of interest with position of the main sampling stations within Jerico-3 from ecosystem/scientific cruises.

14
Feedback effects of sediment suspension on estuarine turbidity maximum C. Zhu1,2, D.S. van Maren2,3, L. Guo1, J. Lin1,2, Q. He1 and Z.B. Wang1,2,3
1 State Key Lab of Estuarine and Coastal Research, East China Normal University, Shanghai 200241, China.
2 Department of Hydraulic Engineering, Delft University of Technology, Delft, Netherlands. 3 Deltares, Delft, Netherlands
1. Introduction Estuarine turbidity maximum (ETM) is a region of elevated suspended sediment concentration (SSC) resulting from residual transport mechanisms driven by river flow, tides, and salinity-induced density gradients (SalDE). However, in energetic and highly turbid environments such as the Yangtze Estuary, sediment-induced density effects (SedDE) may also substantially feedback to the formation and maintenance of the ETM. Previous studies have found that the longitudinal SedDE can act in the opposite direction as the SalDE (Talke et al., 2009) whereas the vertical SedDE reduces the apparent hydraulic roughness (Winterwerp et al., 2009) and leads to more amplified tides and enhanced tidal strength. However, how does the SedDE interact with SalDE to influence the formation and maintenance of ETM is incompletely understood. In addition, the great variability in hydrodynamic and sedimentary processes determines the contribution of transport processes. It is therefore also unclear how these processes act with the SedDE to control the ETM dynamics. 2. Results In this work, we construct a three-dimensional model to explore the SedDE on tidal dynamics and sediment transport using Delft3D. By running sensitivity simulations considering SalDE and/or SedDE, we find that the longitudinal SedDE induces degeneration and landward movement of the ETM, which counteracts the salinity-driven convergence of sediment (Figure 1). Moreover, two vertical SedDE’s are identified to be responsible for sediment trapping: one by enhancing the vertical sediment concentration gradients, and another by additionally affecting basic hydrodynamics including the water levels, velocities and salinities (Figure 1). We further explore the roles of tidal asymmetries, sediment properties, water-bed exchange, and the SedDE on the contribution of transport processes. We use a schematic model reflecting the hydrodynamics and sediment dynamics of the Yangtze Estuary. Model results suggest that tidal asymmetry limitedly influences landward sediment transport without additional SedDE. Near-bottom water-bed sediment exchange is also influenced by sediment suspension, with lower sediment deposition rates under higher SSC, which may subsequently enhance the effect of estuarine circulation but reduces the effect of tidal pumping. Overall, the SedDE is as important as tidal asymmetry in controlling ETM dynamics and needs to be carefully accounted for in future studies in turbid estuaries.
Figure 1: Schematic longitudinal and vertical sediment- induced density effects (SedDE) on sediment trapping. I: longitudinal SedDE; II (a): vertical SedDE with changes only in suspended sediment concentration (SSC) (no sediment-induced changes on hydrodynamics); II (b): vertical SedDE with changes including hydrodynamics, i.e. water level, velocity and salinity. Solid and dashed lines are the situation without and with the SedDE, respectively.
3. Conclusions 1). SSC-induced longitudinal density gradients cause landward migration of the salinity-induced turbidity maximum.
2). SSC-induced vertical density gradients strengthen the salinity-induced horizontal density currents and associated sediment trapping.
3). Sediment-induced density differences affect sediment trapping by tidal asymmetry in estuaries.
References Talke, S. A., H. E. de Swart, and H. M. Schuttelaars.
(2009). Feedback between residual circulations and sediment distribution in highly turbid estuaries: An analytical model, Continental Shelf Research, 29(1), 119-135, doi:10.1016/j.csr.2007.09.002.
Winterwerp, J. C., M. Lely, and Q. He. (2009). Sediment-induced buoyancy destruction and drag reduction in estuaries, Ocean Dynamics, 59(5), 781-791, doi:10.1007/s10236-009-0237-y.

15
Uncovering the sediment transport processes that caused the regime shift to hyperturbid conditions in the Loire Estuary
Y.M. Dijkstra1, R.J.A. de Goede2
1 Department of Applied Mathematics, Delft University of Technology, Delft, Netherlands. [email protected] 2 Department of Marine and Coastal Systems, Deltares, Delft, Netherlands
1. Introduction
Suspended sediment concentrations (SSC) in the Loire Estuary (France) have increased dramatically over the last 70 years. Whereas surface concentration of the order of a few 100 mg/l were normal, in more recent decades surface concentrations over 3 g/l occur regularly (Jalon-Rojas et al., 2016). Winterwerp et al. (2013) hypothesise that this is due to deepening of the estuary. This is not unlikely, as Dijkstra et al. (2019) demonstrate that deepening in the Ems River (Germany) has likely been the cause of a similar dramatic increase in SSC there.
In this study, we followed the same approach as Dijkstra et al. (2019) to gain insight into the increased SSC in the Loire Estuary and explain how the most dominant sediment transport processes have changed over time. The greatest challenge to this study was the severe lack of historical data to calibrate the model.
2. Model
We use a width-averaged process-based idealised model within the iFlow framework. The model resolves the dominant tidal constituents and a constant river discharge. This forces a one-fraction suspended sediment model including advection, resuspension, and settling. Importantly, the model computes SSC in equilibrium, i.e. after an infinitely long time of the same (tidal and river) forcing. We focus on typical summer discharge conditions. 3. Results
The modelled average sediment distribution for summer conditions in 2010 is shown in Fig. 1a. Surface concentrations are up to 1 g/l, matching observations during neap tide (Jalon-Rojas et al., 2016). Concentrations near the bed are up to 15 g/l, and note that complex fluid mud dynamics in the near bed layer is not included in the model and hence not resolved. The model run was repeated for the same parameter settings but with a bed level representing conditions in 1900. Concentrations are much lower: of the order of 100 mg/l.
Fig 1. Modelled equilibrium tidally averaged sediment
distribution (in g/l) for neap tidal summer discharge conditions in 2010.
By linearly interpolating between the 1900 and
2010 bottom profiles, we can get an idea how the equilibrium SSC changed over time. Fig 2 shows the maximum modelled near-bed concentration as a function of this linear interpolation parameter α. For α between 0.7 and 0.95 (representing bottom profiles ~1960-2010), two stable equilibrium conditions exists: representing low and hyperturbid conditions.
Fig 2. Maximum SSC (in g/l) as a function of the depth-parameter α between 0 (year 1900) and 1 (year 2010).
The iFlow model allows identification of the
importance of individual sediment transport processes. This shows that import related to tidal asymmetry and gravitational circulation have increased dramatically due to deepening and reduction of turbulent mixing related to the elevated SSC. River-induced flushing on the other hand has not changed significantly.
To investigate the robustness of the model results, we varied four model parameters: river discharge, settling velocity, erosion parameter, and SSC at the seaward boundary. Together with variation of α, this resulted in a total of over 14,000 model experiments. It is found that every condition that leads to hyperturbidity in 2010 has low SSC in 1900. Multiple equilibria first start to appear from α=0.3 (~1920) for some model experiments and become more likely for increasing α. 3. Conclusions Our study is the first to reproduce the observed regime shift in the Loire Estuary. We confirm that deepening can indeed have triggered this regime shift and uncovered which sediment transport processes caused this. By repeatedly finding this in model runs for over 14, 000 different values of input parameters we are confident that these results are robust to uncertainty in these parameters. References Dijkstra, Y. M., Schuttelaars, H. M., and Schramkowski,
G. P. (2019). Geophysical Research Letters, 46(8):4338–4345.
Jalón-Rojas, I., Schmidt, S., Sottolichio, A., and Bertier, C. (2016). Continental Shelf Research, 117.
Winterwerp, J. C.,Wang, Z. B., Van Brackel, A., Van Holland,G., and Kösters, F. (2013). Ocean Dynamics, 63:1293–1306.
Equilibrium 1 Equilibrium 2
Year 1900 Year 2010
Max SSC (g/l)
α
SSC (g/l)
16
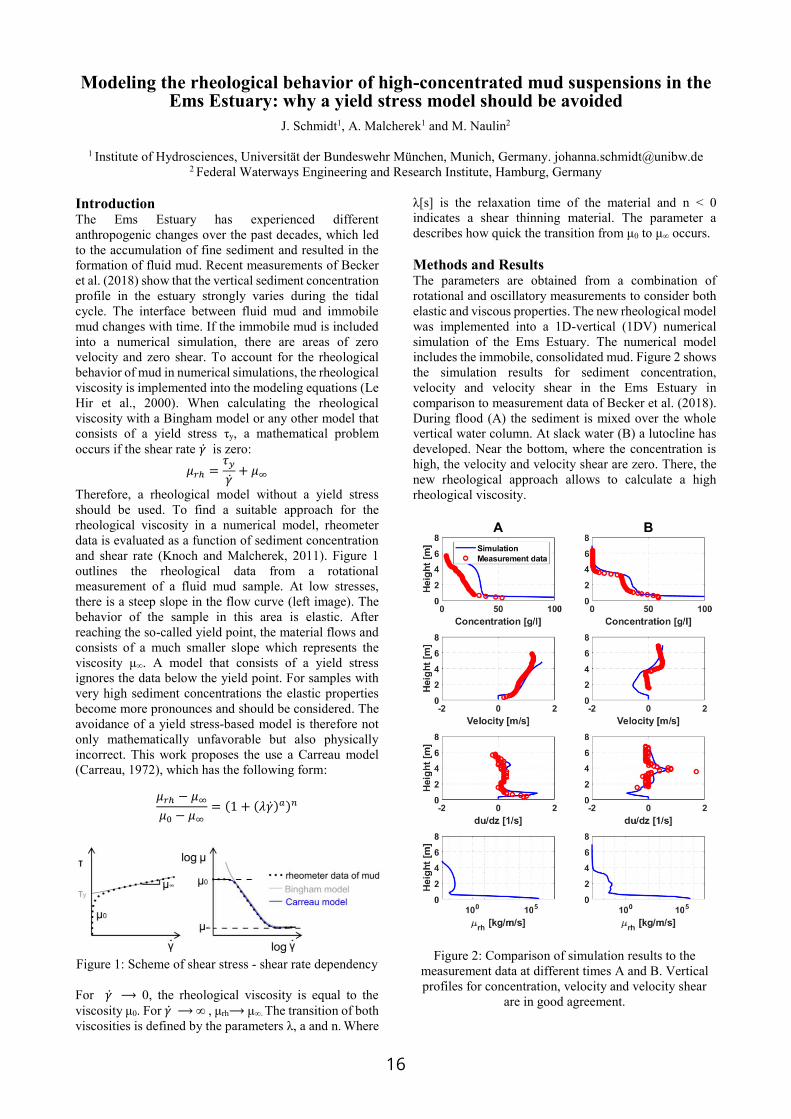
Modeling the rheological behavior of high-concentrated mud suspensions in the Ems Estuary: why a yield stress model should be avoided
J. Schmidt1, A. Malcherek1 and M. Naulin2
1 Institute of Hydrosciences, Universität der Bundeswehr München, Munich, Germany. [email protected] 2 Federal Waterways Engineering and Research Institute, Hamburg, Germany
Introduction The Ems Estuary has experienced different anthropogenic changes over the past decades, which led to the accumulation of fine sediment and resulted in the formation of fluid mud. Recent measurements of Becker et al. (2018) show that the vertical sediment concentration profile in the estuary strongly varies during the tidal cycle. The interface between fluid mud and immobile mud changes with time. If the immobile mud is included into a numerical simulation, there are areas of zero velocity and zero shear. To account for the rheological behavior of mud in numerical simulations, the rheological viscosity is implemented into the modeling equations (Le Hir et al., 2000). When calculating the rheological viscosity with a Bingham model or any other model that consists of a yield stress τy, a mathematical problem occurs if the shear rate �̇�𝛾 is zero:
𝜇𝜇𝑟𝑟ℎ =𝜏𝜏𝑦𝑦�̇�𝛾 + 𝜇𝜇∞
Therefore, a rheological model without a yield stress should be used. To find a suitable approach for the rheological viscosity in a numerical model, rheometer data is evaluated as a function of sediment concentration and shear rate (Knoch and Malcherek, 2011). Figure 1 outlines the rheological data from a rotational measurement of a fluid mud sample. At low stresses, there is a steep slope in the flow curve (left image). The behavior of the sample in this area is elastic. After reaching the so-called yield point, the material flows and consists of a much smaller slope which represents the viscosity μ∞. A model that consists of a yield stress ignores the data below the yield point. For samples with very high sediment concentrations the elastic properties become more pronounces and should be considered. The avoidance of a yield stress-based model is therefore not only mathematically unfavorable but also physically incorrect. This work proposes the use a Carreau model (Carreau, 1972), which has the following form:
𝜇𝜇𝑟𝑟ℎ − 𝜇𝜇∞𝜇𝜇0 − 𝜇𝜇∞
= (1 + (𝜆𝜆�̇�𝛾)𝑎𝑎)𝑛𝑛
Figure 1: Scheme of shear stress - shear rate dependency For �̇�𝛾 ⟶ 0, the rheological viscosity is equal to the viscosity μ0. For �̇�𝛾 ⟶ ∞ , μrh⟶ μ∞. The transition of both viscosities is defined by the parameters λ, a and n. Where
λ[s] is the relaxation time of the material and n < 0 indicates a shear thinning material. The parameter a describes how quick the transition from μ0 to μ∞ occurs. Methods and Results The parameters are obtained from a combination of rotational and oscillatory measurements to consider both elastic and viscous properties. The new rheological model was implemented into a 1D-vertical (1DV) numerical simulation of the Ems Estuary. The numerical model includes the immobile, consolidated mud. Figure 2 shows the simulation results for sediment concentration, velocity and velocity shear in the Ems Estuary in comparison to measurement data of Becker et al. (2018). During flood (A) the sediment is mixed over the whole vertical water column. At slack water (B) a lutocline has developed. Near the bottom, where the concentration is high, the velocity and velocity shear are zero. There, the new rheological approach allows to calculate a high rheological viscosity.
Figure 2: Comparison of simulation results to the measurement data at different times A and B. Vertical profiles for concentration, velocity and velocity shear
are in good agreement.

17
A numerical study of the flow of fluid mud in a cylinder and vane rheometer D.S.Ch.Praveen, Erik A. Toorman
, Hydraulics & Geotechnics Section, Department of Civil Engineering, KU Leuven,
Leuven, Belgium, [email protected]
1. Introduction Fluid mud is a dense cohesive suspension and categorized as a non-Newtonian fluid with time-dependent behaviour. The equilibrium flow curve and structural kinetics parameters describe the fluid mudflow rheology. The former articulates non-Newtonian behavior, while the latter is about thixotropy. Experiments with a concentric cylinder rheometer configuration are used to obtain the mud rheology parameters. This rheometer is based on the principle of rotating Couette flow, wherein the outer cylinder is stationary and the inner cylinder is rotating. However, the gap is usually too narrow and does not guarantee a linear flow profile. 2. Vane rheometry The cylinder rheometer may have the disadvantage of forming a thin water layer next to the rotating cylinder due to the structural breakdown of soil when shear is applied, thereby causing a slip effect on the rotating cylinder surface. Therefore, to minimize slip, a vane spindle is considered as an alternative to the inner cylinder. While the vane is rotating, the mud between the vane blades gets trapped and its volume acts as a virtual cylinder. Thus, the vane configuration is assumed to be equivalent to the cylinder configuration. However, at low rotation speeds, slip may still occur in suspensions due to network collapse when the thickness of the shear layer has become too small, i.e. < 30 particle diameters (Barnes et al., 1989), whereas the typical microfloc size is of the order 10 µm. This is indeed observed in experimental data and we discard them after computing the shear layer thickness according (Toorman, 1994). 2.1 2D simulation of flow in a vane rheometer To understand and further validate this hypothesis, the present study aims to perform a numerical investigation by modelling the rheological experiments in a two-dimensional horizontal plane in CFD using OpenFOAM as a tool. The constitutive equations to solve and setup the numerical rheology experiments includes the non-Newtonian Navier-Stokes equation and the structural kinetics equation. Furthermore, the results of equilibrium at a certain rotation speed are compared to the analytical solution for a Bingham fluid to validate the model. 2.2 3D simulation In the next step, a full 3D simulation will be carried out in order to evaluate the contributions to the total torque measurement of the top and bottom of the cylinder as well as the submerged part of the axis. This result will be used to validate the empirical end effect correction used so far (Toorman, 1995) and to fine-tune the calibration of the conversion factor from torque to shear stress.
2.3 Experiments Experiments are carried out with the Anton-Paar MCR301 rheometer in the sedimentological laboratory of Flanders Hydraulics Research (Antwerp, Belgium). The standard configuration is changed to a wide gap setting (Figure 1). An iterative method has to be applied to process the data (Toorman, 1994). Self-made extensions can be mounted on the blades to increase the diameter. Large diameters reduce the risk of slip formation at low rotation speeds as the shear layer thickness is proportional to the vane radius. Tests on the same sample with three different diameters indeed yield the same equilibrium flow curve and confirm several assumptions made. The CFD model will be used to increase the accuracy of the data processing and the resulting rheological parameters. The time-dependent behaviour however shows several deviations from the ideal theoretical model and requires further research.
Figure 1: Wide gap vane rheometer setup.
3. Conclusions Different steps have been undertaken to improve the data processing and interpretation of vane rheometry tests on fluid mud. An important tool for this purpose is the use of CFD. Once the work on the equilibrium flow curve is completed, we will further investigate the thixotropic behaviour in search of proper closure relationships for break-up and restructuring of the clay matrix. Acknowledgments This work is funded by the Flemish Science Foundation through the FWO project G0D5319N,. References Barnes, H.A., Hutton, J.K, Walters, K.. (1989). An
Introduction to Rheology., Elsevier: Amsterdam. Toorman, E.A. (1994). An analytical solution for the
velocity and shear rate distribution of non-ideal Bingham fluids in a concentric cylinder viscometer. Rheologica Acta, Vol.33:193-202.
Toorman, E.A. (1995). Controlled shear rate concentric cylinder rheometry of cohesive sediment suspensions. Report HYD148, Hydraulics Laboratory, K.U.Leuven.

18
Characterizing the Composition of Suspended Sand and Mud Suspensions in Coastal Environments using Combined Optical and Acoustic Measurements :
Laboratory Experiments
Duc Tran1, Stuart Pearson2, Matthias Jacquet1, Bram Van Prooijen2 and Romaric Verney1
1IFREMER, DYNECO/DHYSED, ZI pointe du Diable, CS10070 Plouzané, France [email protected] 2 Department of Hydraulic Engineering, Delft University of Technology, Delft, Netherlands. [email protected]
1. Introduction Long term and high-frequency monitoring of water quality is crucial to decipher the health and sustainable development of coastal ecosystems. In sand-mud environments, quantifying the variability of suspended particulate matter constituents and their concentration is essential but highly challenging. Our previous calibrations show that while optical signal is very sensitive to fine sediment, acoustic signal is more sensitive to the coarser particles. Subsequently, we hypothesize that the SPM composition and its variability can be evaluated based on these differentiated optical and acoustic sensor responses. We define a sediment composition index (SCI) such as: 𝑆𝑆𝑆𝑆𝑆𝑆 = 10 log10 𝑂𝑂𝑂𝑂𝑆𝑆 − 𝑆𝑆𝑆𝑆𝑆𝑆 (1) Where OBS is the signal measured by an optical backscatter sensor and SNR is the signal-to-noise ratio measured by an acoustic sensor. In this study, SCI is determined from a series of laboratory experiments testing various sand/mud content and concentration levels. We also investigate different combinations of optical and acoustic sensors. 2. Experimental setup DEXMES, a novel laboratory device (see Tran et al., 2021), was used to generate homogeneous suspended sediment concentration and to provide sufficient volume, ≈ 1 m3, for deploying various sensors simultaneously. To test the hypothesis, 60 experiments, consisting of 6 different total concentrations and 5 mixtures of Bentonite and fine and medium sand (d50 = 100 and 200 µm), were thoroughly investigated using three acoustics sensors (ADV, AQUAscat, LISST-ABS) and three optical sensors (Wetlabs_NTUSB, HydroScat, LISST-100X). 3. Results and Conclusions Figure 1 shows ADV (acoustic) and Wetlabs (optical) measurements. Each data point in Figure 1 is the averaged value of 10 min of recording at 32 (ADV) or 1 (Wetlabs) Hz. We observe a logarithmic relationship between acoustic and optical signals along a concentration gradient for a given sand/bentonite ratio. The derived SCI is well correlated with the sand/bentonite ratio and a similar relationship is also obtained for 200 µm sand. Hence this index can be used to estimate SPM composition. A similar approach was tested for different pairs of acoustic and optical sensors. Their performances in estimating SPM concentration and content are examined and will be discussed.
Figure 1: Comparison of ADV and OBS measurements for various SPM concentration levels and sand/bentonite fractions, the lines are to show constant SCIs (top). SCI dynamics against sand fraction (bottom). In conclusion, results show that it is possible to use pairs of optical and acoustic sensors to infer the concentration and the ratio of fine/coarse sediment in suspension with the SCI index, with limited calibration using water samples. The application of this index to in-situ observation is further developed in Pearson et al. (2021). References Pearson, S.G., Verney, R., Hendricks, H.C.M., Tran, D.,
Jacquet, M., Wang, Z.B., van Prooijen, B.C. (2021). Characterizing the composition of suspended sand and mud suspensions in coastal environments using combined optical and acoustic measurements. Submitted to INTERCOH 2021.
Tran, D., Pearson, S.G., Jacquet, M., Verney, R. (2021) Investigating suspended particulate matters from multi-wavelength optical and multi-frequency acoustic measurements. Submitted to vEGU 2021.

19
Turbulent-laminar transitions in flows laden with Cohesive sediment M.G.W. de Vet1, R. Fernández1, J.H. Baas2, W.D. McCaffrey3 and R.M. Dorrell1
1 Energy and Environment Institute, University of Hull, Hull, United Kingdom, [email protected]
2 School of Ocean Sciences, Bangor University, Menai Bridge, United Kingdom 3 School of Earth and Environment, University of Leeds, Leeds, United Kingdom
1. Introduction High concentrations of suspended sediment in fluvial and submarine environments are common due to landslides, floods, hillslope failures, and more recently due to post-wildfire erosion, phenomena that are likely to occur more frequently due to climate change (Barbero et al., 2015). Small concentrations of cohesive sediment can already enhance or supress turbulence in a flow due to the cohesive properties promoting flocculation. Baas et al. (2009) developed a phase diagram for quasi-steady cohesive sediment laden open channel flow, based on the balance between turbulent and cohesive forces (Figure 1). However, spatial and temporal scales of turbulent-laminar transitions in naturally unsteady flows are unknown, but key for understanding how fluvial environments react to changes in suspended load in catchments affected by wildfires. The aim of this research is to quantify the spatial and temporal scales of turbulent-laminar transitions in unsteady cohesive sediment laden open channel flow. 2. Methodology Mixtures of pure kaolinite and fresh water are circulated through a hydraulic flume in which the flow velocity and concentration profiles are measured for unsteady (accelerating and decelerating) flows with varying concentrations (0% - 10%). The flow velocity is adjusted with increments of 0.1 m/s, after which the adaptation time to reach the equilibrium conditions is quantified (Figure 1). 3. Expected results Flow adaptation time will be influenced by the initial flow velocity, the relative change in velocity, direction of flow
changes (acceleration or deceleration) and clay concentration. Deceleration initially enhances turbulence within a flow (Kironoto and Graf, 1995) whereas acceleration initially decreases turbulence (Cardoso et al., 1991). The formation or breakage of bonds between cohesive sediment particles is a time dependent behaviour. Therefore, cohesive sediment laden flows need more time to adjust to variations in flow velocity than clear water flows. In high concentration clay suspension flows containing a plug flow, the enhancement of turbulence might be suppressed by the cohesive forces reducing the adaptation time. Clay bonds are easier to form than to break, resulting in an expected hysteresis effect between decelerating and accelerating flows. References Baas, J.H., Best, J.L., Peakall, J., and Wang, M. (2009).
A phase diagram for turbulent, transitional, and laminar clay suspension flows. Journal of Sedimentary Research, 79, 162-183.
Barbero, R., Abatzoglou, J.T., Larkin, N.K., Kolden, C.A. and Stocks, B. (2015). Climate change presents increased potential for very large fires in the contiguous United States. International Journal of Wildland Fire, 24, 892-899.
Cardoso, A.H., Graf, W.H., and Gust, G. (1991). Steady gradually accelerating flow in a smooth open channel. Journal of Hydraulic Research, 29, 525-543.
Kironoto, B.A., and Graf, W.H. (1995). Turbulence characteristics in rough non-uniform open-channel flow. Proceedings of the institute of civil engineers water maritime and energy, 112, 336-348.
Figure 1 Schematic model of flow regimes influenced by turbulent and cohesive forces. Given an adaptation time between turbulent flow (TF) and turbulence-enhanced transitional flow (TETF) as the baseline time T, the adaptation time for changes between other flow regimes via acceleration or deceleration are expressed as a function of T. Depending on initial and final
flow regimes, the adaptation time (A) is expected to vary from the baseline time (T).

20
Characterizing the Composition of Sand and Mud Suspensions in Coastal Environments using Combined Optical and Acoustic Measurements: Field
Applications S.G. Pearson1,2, R. Verney3, H.C.M. Hendricks1,2, D. Tran3, M. Jacquet3, Z.B. Wang2,1, and B.C. v. Prooijen1
1 Department of Hydraulic Engineering, Delft University of Technology, Delft, Netherlands. [email protected]
2 Department of Marine and Coastal Systems, Deltares, Delft, Netherlands 3 IFREMER, DYNECO/DHYSED, ZI pointe du Diable, CS10070, Plouzané, France.
1. Introduction Determining the composition of suspended particulate matter (SPM) is essential to understanding and managing mixed sand-mud coastal environments. Suspended sand and mud have different signatures in optical and acoustic measurements. This makes it possible to use paired optical and acoustic instruments to discern the relative sediment composition in mixed suspensions. We establish the validity of the relative sediment composition index of mixed sand-mud suspensions through a combination of theory and laboratory experiments, then apply it to field measurements on Ameland ebb-tidal delta in the Netherlands. 2. Methodology 2.1 Theory We define a sediment composition index (SCI) based on the difference between optical and acoustic signals: 𝑆𝑆𝑆𝑆𝑆𝑆 = 10 log10 𝑂𝑂𝑂𝑂𝑆𝑆 − 𝑆𝑆𝑆𝑆𝑆𝑆𝐴𝐴𝐴𝐴𝐴𝐴 (1)
Where OBS is the signal measured by an optical backscatter sensor and SNRADV is the signal-to-noise ratio measured by an acoustic doppler velocimeter (ADV). 2.3 Laboratory Experiments We conducted a series of laboratory experiments wherein paired OBS and ADV sensors are exposed to varying sand and mud concentrations. SCI shows a strong negative correlation with increasing relative sand content, matching theoretical expectations. These experiments are described in more detail by Tran et al (2021). 2.4 Field Measurements Field measurements were obtained from August 29th to October 9th, 2017, with the goal of characterizing hydrodynamic and sediment transport processes on the ebb-tidal delta. Acoustic backscatter was measured using a Nortek Vector ADV, and optical backscatter using a Campbell OBS 3+. We then calculate SCI and compare it with concurrent hydrodynamic conditions and regional seabed sediment samples to interpret the observed values. 3. Results During calm periods (when wave influence is negligible), SCI shows an M4 (quarter-diurnal) fluctuation modulated by at M2 frequencies (semi-diurnally). It is lowest at flood tide when bed shear stress magnitudes are sufficient to resuspend local sandy bed sediment, and highest at low and high-water slack when local sand is immobile but mud remains in
suspension (Figure 1). During storms, waves generate high bed shear stresses and are capable of suspending local sand from the seabed. This results in a decrease in SCI and reduces its tidal variability. These results agree with the trends predicted by theory and observed in the laboratory experiments.
Figure 1: Variability in the sediment composition index (SCI) compared with bed shear stress and water level
during a calm period on Ameland ebb-tidal delta. 4. Conclusions We developed a sediment composition index (SCI) for mixed sand-mud suspensions using simultaneous measurements of optical and acoustic backscatter. This index can be used to estimate relative proportions of suspended sand and mud content. Although the SCI is not completely generic (due to intrinsic differences between pairs of instruments), this approach reduces the ambiguity of suspended sediment measurements in mixed-sediment environments, and may be useful in cases where calibration samples are limited. Using SCI improves our understanding of sediment dynamics on Ameland ebb-tidal delta. The sediment composition index is easily calculated from paired instruments, and so adds value to other existing measurements (e.g., from the literature). References Tran, D., Pearson, S., Jacquet, M., van Prooijen, B.,
Verney, R. (2021) Characterizing the Composition of Suspended Sand and Mud Suspensions in Coastal Environments using Combined Optical and Acoustic Measurements: Laboratory Experiments. Submitted to INTERCOH 2021.

21
High Resolution Echosounder Data from Water Surface to Sea Bed M. Daugharty1, J. Brinkkemper2, S. Kamminga1, H. Huitema1, J. Van Heesen1, S. Nylund 1
1Nortek Group BV, Badhoevedorp, Netherlands. [email protected]
2WaterProof Marine Consultancy & Services BV, Lelystad, Netherlands
1. Introduction Quantifying marine sediment in the water column is essential for environmental management of estuarine and coastal ocean systems. Acoustic echograms provide a non-contact means of tracking sediment features in the water column over vast spatial and temporal domains. When coupled with current velocity data, flux rates and trajectories can be estimated. Pairing Acoustic Doppler Current Profilers (ADCPs) and echo sounder technology, however, has historically yielded echograms with low resolution, limited dynamic range, and data gaps near the sea bed because of competing requirements for velocity output. Nortek’s Signature1000 VM ADCP was designed to address these limitations via a fifth, single-beam echo sounder that occupies dedicated pings within the velocity data stream. 2. Methods To test the success of this technology, Nortek teamed with WaterProof BV, who deployed both a vessel-mounted and bottom-mounted Signature1000 in a tidal channel in the Wadden Sea, the Netherlands in the Fall, 2019. The hydrodynamics in the tidal channel are characterized by a semidiurnal tide with ebb and flood flow velocities up to 1.5 m/s.
Figure 1: Project area (red rectangle) south of the island
Ameland in the Dutch part of the Wadden Sea. Measurements were conducted for a period of five weeks with the bottom-mounted ADCP and during 4 periods of 13 hours with the vessel-mounted system to cover a full tidal cycle on four separate days in four different locations in the channel. During these measurement periods of 13 hours, the vessel was anchored on one location. Water samples were taken each half hour at three different water depths by lowering a sampler attached to a pump on board the vessel. These samples were filtered and analyzed for suspended mud and sand content in order to calibrate the echosounder data. Suspended particles in the tidal channel consisted for 70-90% of cohesive sediments, depending on the location in the channel and the magnitude of the flow. Tidal-averaged total suspended sediment concentrations were around 200 and 800 mg/L during neap and spring tide, respectively.
Figure 2: Non-pulse compressed echogram from a
vessel-mounted Signature1000 with 5 cm pixels that extends down to the sea bed at a depth of approximately
7 m. Relative volume backscatter (dB) in color bar. Time series is approximately 17 minutes long.
Pulse compressed and non-pulse compressed echo sounder modes were deployed with 5 cm cells and 2 Hz sample rates. Echo sounder backscatter was corrected for transmission losses, the altimeter-derived sea bed delineation was filtered, and backscatter reflections under the bed were suppressed. 3. Results Echogram intensity and velocity data from both the bottom-mounted and vessel-mounted ADCP in the same location form a coupled dataset that extends from the seabed to the sea surface and reflects the hydrodynamics and sediment dynamics of the tidal cycle over the full water column. Figure 2 displays an example of the high resolution echosounder relative volume backscatter measured with the vessel-mounted ADCP. The echogram reveals coherent patterns with variability in the vertical and horizontal domains down to the bed. Higher intensity near the sea bed suggests a greater suspended sediment concentration deeper in the water column, consistent with analyzed water samples. 3. Conclusions The technology and project approach applied here have significant implications for sediment flux computations and associated dredging operations, sand nourishment activities, scour and erosion studies, and ecological restoration efforts. With the pairing of a vessel mounted and bottom-mounted Signature1000, a detailed and complete picture of the water column from bed to surface can be obtained for the first time. Acknowledgments The data used in this study were collected during a larger field campaign that was financed by Rijkswaterstaat, part of the Dutch Ministry of Infrastructure and Water Management.

22
Acoustic measurements of cohesive sediments suspensions, the role of floculation and sand
Francisco Pedocchi1 and Rodrigo Mosquera1
1 Instituto de Mecanica de los Fluidos e Ingenieria Ambiental -IMFIA-, Facultad de Ingenieria, Universidad de la Republica, Uruguay. [email protected]
1. Introduction Multifrequency acoustics is one of the most promissory techniques for the measurement of concentration and size of suspended sediment concentration in estuarine environments. Its theoretical background is well established in the literature (Thorne and Hanes, 2002). In this work we present a technique that is particularly suitable for estuarine sediments, which are predominately composed by clay and silt but have a small fraction of fine sand. We attack backscatter inversion problem with a multi-class approach that allows us to accurately determine suspended sediment concentration and silt and clay to sand fraction. Our results showed that natural flocculation had a limited impact on the acoustic properties of fine sediment suspensions of the Rio de la Plata. 2. Materials and methods 2.1 Sediment Size The fine sediments in front of the coast of Montevideo, Uruguay, are composed by clay (62,5 %), silt (37 %), and less than 0.5 % fine sand. The fine cohesive fraction dominated acoustic attenuation, while the sand fraction dominated acoustic backscatter.
Figure 1: Mixing tank, showing the sampling ports and dimensions.
2.2 Mixing tank We build a plexiglass mixing tank, which is 150 cm tall with a 60 cm by 60 cm section, it is equipped with four stainless blades that produce the mixing leaving a clear space in the middle for acoustic measurements (Figure 6). 2.3 AQUAscat R 1000R We use a dedicated multifrequency instrument (Aquascat 1000R, Aquatech, United Kingdom) equipped with 0.5, 1, 2 and 4 MHz ultrasonic transducers. The transducers where mounted downlooking from the top of the tank.
2.4 Experiments We ran experiments with raw Rio de la Plata sediment, with sieved sediment, with fresh and salty water, and with the addition of a polymeric flocculant. In each case we performed acoustic measurements and extracted direct samples to verify an homogeneous water column and a mass concentration. 3. Results and conclusions Then the acoustic properties of the suspension were completed directly form the measurements and compared with the ones obtained from the theory assuming just the presence of the primary particles. Therefore, ignoring any possible effect of flocculation on the acoustics. The results showed that primary particles were able to explain the results in all cases, with exception of the experiment with the polymeric flocculant. This last experiment showed a clear increase of the form factor f. Meanwhile the scattering cross-section χ did not change for any of the experiments, suggesting that even in the case of the dense flocs form when flocculant was added the viscous attenuation dominates over the one due to scattering.
Figure 2: Top: form factor f, middle: scattering cross-section χ, bottom: mass distribution (as primary particle radii, k sound wave number) for sieved Rio de la Plata sediments after the addition of a polymeric flocculant.
Acknowledgments Financial support from ANII and CSIC, Uruguay. Logistics Gas Sayago SA and Technodive SRL, Uruguay. Help from the LDSC of UVRJ, Brazil. References Thorne, P. D. and Hanes, D. M, (2002). A review of acoustic measurement of small-scale sediment processes. Continental Shelf Research, 22, 603-632.

23
A bio-morphodynamic modelling study to determine how environmental conditions control mangrove vulnerability to sea-level rise Danghan Xie1, Christian Schwarz2, Maarten G. Kleinhans1 and Barend van Maanen3
1 Faculty of Geosciences, Utrecht University, Utrecht, Netherlands. [email protected]
2 School of Marine Science and Policy, University of Delaware, Lewes, USA. 3 College of Life and Environmental Sciences, University of Exeter, Exeter, United Kingdom
1. Introduction Mangrove forests are valuable ecosystems along tropical and subtropical shorelines that support the livelihood and wellbeing of more than tens of millions of people (Figure 1) (Friess et al., 2019). Their future and provided services such as biodiversity conservation and coastal protection are strongly linked to their ability to cope with accelerating sea-level rise (Krauss et al., 2014). So far, mangroves have been shown to persist on muddy intertidal flats through bio-morphodynamic feedbacks between vegetation, hydrodynamics, sediment motion and morphological change (Xie et al., 2020). However, the vulnerability of mangroves under varying coastal environmental conditions remains uncertain. The aim of this study is to gain an in-depth understanding on how mangroves respond to sea-level rise in various environmental settings by conducting numerical experiments with a bio-morphodynamic model.
Figure 1: Mangrove seedlings colonizing along coastal
shorelines (credit: van Maanen Barend) 2. Methods We use a bio-morphodynamic model (Xie et al., 2020) to investigate the effects of tides, wind waves, sediment availability (mud) and coastal profile characteristics on mangrove survival under various rates of sea-level rise. We systematically explored 72 simulations based on the model by varying the above environmental conditions. 3. Results and Conclusions Our results show that mangroves in micro-tidal systems with gentle coastal slope are more vulnerable to rising sea levels, due to reduced sedimentation rates, leading to substantial landward displacement of mangroves (Figure 2a). Profile accumulation is enhanced by increasing tidal range and sediment supply. However, mangroves may exhibit larger horizontal vegetation extent in micro-tidal systems where calm conditions provide extensive habitats for mangroves to colonize. Similarly, wind waves contribute to landward sedimentation due to the increase of onshore sediment flux but also limit the seaward extent due to increased bed shear stress. Interestingly, this limitation driven by high tidal currents and waves forces
the seaward edge of mangrove forests to colonize at higher elevations with favourable inundation regimes, where rising sea levels within this century may not submerge mangroves by exceeding their inundation threshold (Figure 2b). Furthermore, model simulations indicate that sediment accretion within the forest accelerates for larger sea level rise rates, which agrees with field measurements. Our study indicates that the response of mangrove dynamics to sea-level rise are controlled by coastal environmental conditions. Future management of these coastal ecosystems in the face of global change should take into account the complex interactions between vegetation and physical environments.
Figure 2: Mangrove behaviors in response to different
rates of sea-level rise. Green dots show vegetation distribution before sea-level rise. Red, gray and blue dots indicate the locations of mangrove forests after 100-years of slow, medium and fast sea-level rise
effects, respectively. The inserts of each figure represent the temporal changes of mangrove horizontal extent over 100-year under different sea-level rise effects
(abbreviated as ‘Ext.’, unit: km). TR and SSC represent the tidal range and suspended sediment concentration
applied at the seaward boundary, respectively. References Friess, D. A., Rogers, K., Lovelock, C. E., Krauss, K. W.,
Hamilton, S. E., Lee, S. Y., Lucas, R., Primavera, J., Rajkaran, A., and Shi, S. (2019), The State of the World's Mangrove Forests: Past, Present, and Future, Annual Review of Environment and Resources, 44(1), 89-115.
Krauss, K. W., McKee, K. L., Lovelock, C. E., Cahoon, D. R., Saintilan, N., Reef, R., and Chen, L. (2014), How mangrove forests adjust to rising sea level, New Phytol, 202(1), 19-34.
Xie, D., Schwarz, C., Brückner, M. Z. M., Kleinhans, M. G., Urrego, D. H., Zhou, Z., and van Maanen, B. (2020), Mangrove diversity loss under sea-level rise triggered by bio-morphodynamic feedbacks and anthropogenic pressures, Environmental Research Letters, 15(11), 114033.

24
Intra-annual surface elevation dynamics in a mangrove forest in New Zealand R. Gijsman1, E.M. Horstman1, A. Swales2, C.A. Eager2, I.T. MacDonald2, T.J. Bouma3 and K.M. Wijnberg1
1 Marine and Fluvial Systems, University of Twente, Enschede, Netherlands. [email protected]
2 National Institute of Water and Atmospheric Research, Hamilton, New Zealand 3 NIOZ Royal Netherlands Institute for Sea Research and Utrecht University, Yerseke, Netherlands
1. Introduction Built infrastructure and rising seas squeeze mangrove ecosystems along tropical and temperate shorelines. Where landward migration is restricted, the future survival of these valuable forests largely depends on their ability to trap sediments and thereby increase their elevation to keep pace with sea-level rise (SLR). Recent studies have focused on the long-term inter-annual capacity of mangroves to keep pace with SLR by monitoring surface elevation changes with Rod Surface Elevation Tables (RSET) (Lovelock et al., 2015). However, short-term intra-annual variability in surface elevation can also be an important factor in the survival of mangroves (Sippo et al., 2018). Short-term surface elevation changes can exceed net long-term trends, since mangroves’ sediment trapping capacity responds non-linearly to storm events and seasonal variations in hydrodynamic forcing. Additionally, large intra-annual variability of the surface elevation, due to instantaneous sedimentation or erosion, can impede the survival of mangrove seedlings by their burial or uprooting (Balke et al., 2013). Despite their importance for mangrove ecosystems’ survival, little is known about intra-annual surface elevation dynamics due to the lack of high-frequency elevation measurements. 2. Methodology This study considers intra-annual and inter-annual surface elevation dynamics in a rapidly accreting fringing mangrove ecosystem in the Firth of Thames, New Zealand. Intra-annual surface elevation changes were monitored with novel Acoustic Sediment Elevation Dynamics (ASED) sensors (Figure 1). These autonomous sensors measure the surface elevation at millimeter-resolution and on an interval of minutes over periods of months to years. The ASEDs were deployed along a cross-shore transect from the unvegetated mudflat through the mangrove forest fringe and measured surface elevation dynamics for a full year. The ASEDs were positioned along with a series of established RSETs, that provided insights in seasonal and annual surface elevation changes over the past 12 years (Swales et al. 2019). Additionally, the pressure sensors of the ASEDs and supplementary wave gauges were used to identify storm events and seasonal variations in hydrodynamic forcing. 3. Results These combined measurements increase our understanding of the intra-annual surface elevation dynamics in the Firth mangroves. Firstly, the ASED and RSET data reveal how intra-annual surface elevation changes contribute to and compare with inter-annual surface elevation changes. Secondly, the hydrodynamic data helps explain how the sediment trapping capacity of
the mangroves responds to storm events and seasonal variations in hydrodynamic forcing, as well as how this response varies through the forest fringe. 4. Outlook Future work is aimed at installing time-lapse cameras to monitor mangrove seedling development. The data from the time-lapse cameras will show how the observed intra-annual surface elevation changes may affect the mangrove seedlings. Combined, these findings will provide a mechanistic understanding of surface elevation dynamics and their impact on the establishment and survival of mangrove ecosystems. This knowledge will be essential for future assessments of mangroves ecosystems’ ability to cope with rising sea levels.
Figure 1: Deployed frame with ASED sensor in the Firth of Thames mangroves. Picture taken in December 2019. References Balke, T., Webb, E. L., van der Elzen, E., Galli, D.,
Herman, P. M. J., Bouma, T. J. (2013). Seedling establishment in a dynamic sedimentary environment: a conceptual framework using mangroves. Journal of Applied Ecology, 50, 740-747.
Lovelock, C. E., Cahoon, D. R., Friess, D. et al. (2015). The vulnerability of the Indo-Pacific mangrove forests to seal-level rise. Nature, 526, 559-563.
Sippo, J. Z., Lovelock, C. E., Santos, I. S., Sanders, C. J., Maher, T. M. (2018). Mangrove mortality in a changing climate: An overview. Estuarine, Coastal and Shelf Science, 215, 241-249.
Swales, A., Reeve, G., Cahoon, D. R., Lovelock, C. E. (2019). Landscape evolution of a fluvial sediment-rich avicennia marina mangrove forest: insights from seasonal and inter-annual surface-elevation dynamics. Ecosystems, 22, 1232-1255.
25
Can the Demak Mangrove-Mud Coast Keep up With Relative Sea Level Rise? B.P. Smits1
, B.K. Van Wesenbeeck1,2, M.A.de Lucas Pardo1, D.S. Van Maren1,2
1 Department Marine & Coastal Systems, Deltares, Delft, Netherlands. [email protected] 2 Department of Hydraulic Engineering, Delft University of Technology, Delft, Netherlands
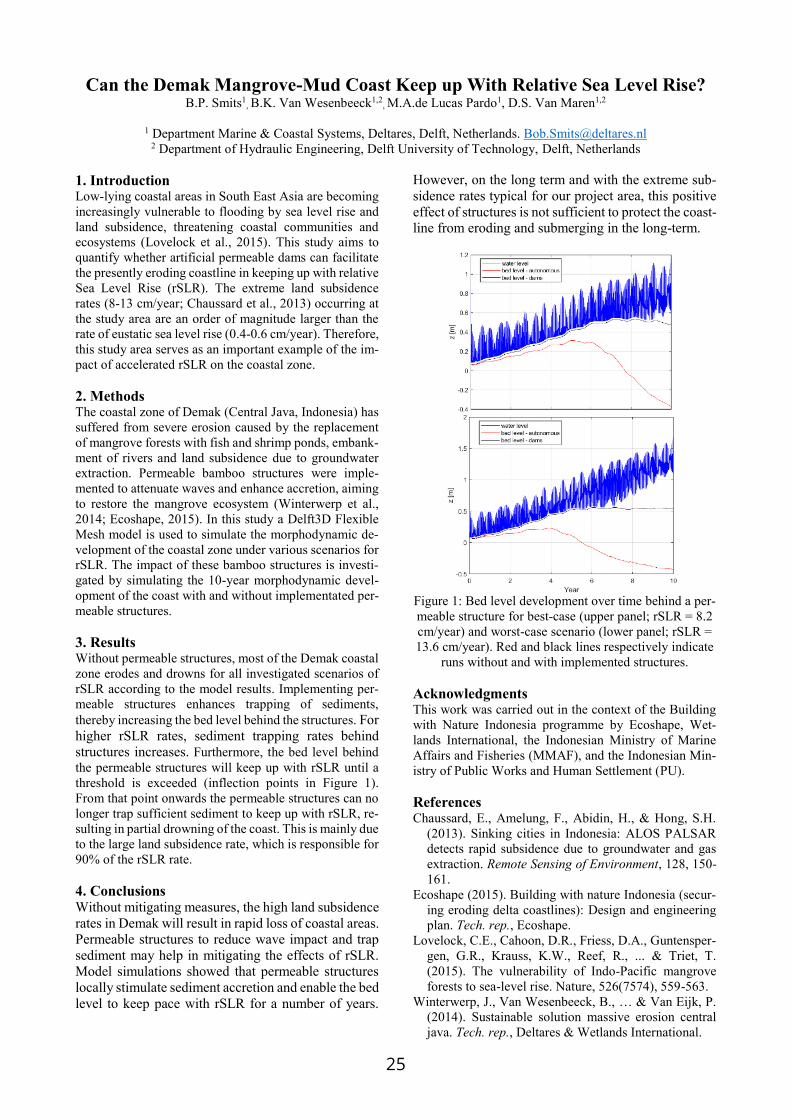
1. Introduction Low-lying coastal areas in South East Asia are becoming increasingly vulnerable to flooding by sea level rise and land subsidence, threatening coastal communities and ecosystems (Lovelock et al., 2015). This study aims to quantify whether artificial permeable dams can facilitate the presently eroding coastline in keeping up with relative Sea Level Rise (rSLR). The extreme land subsidence rates (8-13 cm/year; Chaussard et al., 2013) occurring at the study area are an order of magnitude larger than the rate of eustatic sea level rise (0.4-0.6 cm/year). Therefore, this study area serves as an important example of the im-pact of accelerated rSLR on the coastal zone. 2. Methods The coastal zone of Demak (Central Java, Indonesia) has suffered from severe erosion caused by the replacement of mangrove forests with fish and shrimp ponds, embank-ment of rivers and land subsidence due to groundwater extraction. Permeable bamboo structures were imple-mented to attenuate waves and enhance accretion, aiming to restore the mangrove ecosystem (Winterwerp et al., 2014; Ecoshape, 2015). In this study a Delft3D Flexible Mesh model is used to simulate the morphodynamic de-velopment of the coastal zone under various scenarios for rSLR. The impact of these bamboo structures is investi-gated by simulating the 10-year morphodynamic devel-opment of the coast with and without implementated per-meable structures. 3. Results Without permeable structures, most of the Demak coastal zone erodes and drowns for all investigated scenarios of rSLR according to the model results. Implementing per-meable structures enhances trapping of sediments, thereby increasing the bed level behind the structures. For higher rSLR rates, sediment trapping rates behind structures increases. Furthermore, the bed level behind the permeable structures will keep up with rSLR until a threshold is exceeded (inflection points in Figure 1). From that point onwards the permeable structures can no longer trap sufficient sediment to keep up with rSLR, re-sulting in partial drowning of the coast. This is mainly due to the large land subsidence rate, which is responsible for 90% of the rSLR rate.
4. Conclusions Without mitigating measures, the high land subsidence rates in Demak will result in rapid loss of coastal areas. Permeable structures to reduce wave impact and trap sediment may help in mitigating the effects of rSLR. Model simulations showed that permeable structures locally stimulate sediment accretion and enable the bed level to keep pace with rSLR for a number of years.
However, on the long term and with the extreme sub-sidence rates typical for our project area, this positive effect of structures is not sufficient to protect the coast-line from eroding and submerging in the long-term.
Figure 1: Bed level development over time behind a per-meable structure for best-case (upper panel; rSLR = 8.2 cm/year) and worst-case scenario (lower panel; rSLR = 13.6 cm/year). Red and black lines respectively indicate
runs without and with implemented structures.
Acknowledgments This work was carried out in the context of the Building with Nature Indonesia programme by Ecoshape, Wet-lands International, the Indonesian Ministry of Marine Affairs and Fisheries (MMAF), and the Indonesian Min-istry of Public Works and Human Settlement (PU). References Chaussard, E., Amelung, F., Abidin, H., & Hong, S.H.
(2013). Sinking cities in Indonesia: ALOS PALSAR detects rapid subsidence due to groundwater and gas extraction. Remote Sensing of Environment, 128, 150-161.
Ecoshape (2015). Building with nature Indonesia (secur-ing eroding delta coastlines): Design and engineering plan. Tech. rep., Ecoshape.
Lovelock, C.E., Cahoon, D.R., Friess, D.A., Guntensper-gen, G.R., Krauss, K.W., Reef, R., ... & Triet, T. (2015). The vulnerability of Indo-Pacific mangrove forests to sea-level rise. Nature, 526(7574), 559-563.
Winterwerp, J., Van Wesenbeeck, B., … & Van Eijk, P. (2014). Sustainable solution massive erosion central java. Tech. rep., Deltares & Wetlands International.

26
Key bioturbator species within benthic communities determine sediment resuspension thresholds
J.C. de Smit1,2, M.Z.M. Brückner2, K. Mesdag1,2, M.G. Kleinhans2, T.J. Bouma1,2
1Department of Estuarine and Delta Systems, NIOZ Royal Netherlands Institute for Sea Research, Yerseke, Netherlands 2 Department of Physical Geography, Utrecht University, Faculty of Geosciences, Utrecht, Netherlands
1. Introduction & methods Muddy tidal flats are living landscapes, inhabited by a variety of macrobenthic organisms that affect tidal flat morphodynamics through biogeomorphological feedbacks. The ability of bioturbating macrobenthic species to increase sediment erodibility through bioturbation is well-studied at the level of individual species (Willows et al., 1998; de Deckere et al., 2000; Widdows et al., 2009; Cozzoli et al., 2019), but we still lack fundamental insight in how to translate such species effects to the influence of bioturbator communities. Total metabolic rate has been proposed as a method to integrate across species (Cozzoli et al., 2018), and may therefore also be used to interpret benthic community effects of sediment resuspension. Hence, in this study we assessed the isolated and combined effects of three distinct macrobenthic species (Corophium volutator, Hediste diversicolor and Limecola balthica) on the critical bed shear stress for sediment resuspension (τcr). We used a muddy sediment (D50 = 45 µm, 86 % mud content), which we exposed to bioturbator activity for a period of 48 hours. We measured the isolated species effect on τcr for a range of typical densities, community experiments were done with the low densities of individual species to retain similar total metabolic rates.
Figure 1: Effect of total metabolic rate (Itot) on τcr for the
single species.
C. volutator L. balthica H. diversicolor a 0.61 0.5 0.23 b 0.1 0.07 0.28 Table 1: coefficients a and b for the fits in Figure 1:
𝜏𝜏𝑐𝑐𝑐𝑐 = 𝜏𝜏𝑐𝑐𝑐𝑐,𝐼𝐼𝑡𝑡𝑡𝑡𝑡𝑡=0 − 𝑎𝑎𝐼𝐼𝑡𝑡𝑡𝑡𝑡𝑡𝑏𝑏 2. Results & discussion Sediment erodibility measurements with individual species (Figure 1, Table 1) indicate that a small number of bioturbator individuals may already have a large effect on sediment erodibility, causing a 40-70 % decrease in τcr. The additional effect of their total metabolic rate is much smaller. Other studies have however shown large increases in suspended sediment concentrations with increasing bioturbator metabolic rate. Hence, total
metabolic rate may determine the availability of erodible sediments, but the critical shear stress of these sediments is determined by the species present. Sediment erodibility measurements with combinations of the studied species agree with the observed effects of individual species on τcr, in that τcr is mainly determined by the species present. The effect of bioturbator communities on τcr is governed by the species that has the largest individual effect, rather than the dominance of a certain species in term of metabolic rate (Figure 2).
Figure 2: Reduction in τcr for benthic communities with our without a certain species compared to the individual species effect. Asterisks indicate statistical similarity. 3. Conclusions Results of both individual species and benthic communities indicate that sediment erodibility is mainly determined by the presence of a species, rather than individual density or dominance in terms of metabolic rate. These findings should be considered when implementing bioturbation as an effect on τcr and active layer thickness in modelling studies. References Cozzoli, F., Bouma, T.J., Ottolander, P., Lluch, M.S., Ysebaert, T.,
Herman, P.M.J. (2018). The combined influence of body size and density on cohesive sediment resuspension by bioturbators. Scientific Reports, 8, 3831.
Cozzoli, F., Gjoni, V., Del Pasqua, M., Hu, Z., Ysebaert, T., Herman, P.M.J., Bouma, T.J. (2019). A process based model of cohesive sediment resuspension under bioturbators’ influence. Science of the Total Environment, 670, 18-30.
de Deckere, E.M.G.T., van de Koppel, J., Heip, C.H.R. (2000). The influence of Corophium volutator abundance on resuspension. Hydrobiologia, 426, 37-42.
Widdows, J. Brinsley, M.D., Pope, N.D. (2009). Effect of Nereis diversicolor density on the erodibility of estuarine sediment. Marine Ecology Progress Series, 378, 135-143.
Willows, R.I.J., Widdows, J., Wood, R.G. (1998). Influence of an infaunal bivalve on the erosion of an intertidal sediment: A flume and modeling study. Limnology and Oceanography, 43, 1332-1343.

27
Analytical Approach for Channel Formation in Hyperconcentrated Flows A.M. Talmon1,2
1 Department of Dredging Engineering, Delft University of Technology, Delft, Netherlands.
2 Department of Marine and Coastal Systems, Deltares, Delft, Netherlands, [email protected]
1. Introduction Braiding and channelization are typical morphological features of erosion dominated hyperconcentrated river flow. An earlier numerical study showed that these morphological features can be replicated by Delft3D when density stratification effects are accounted for (van Maren, 2007). Deltares is developing a Delft3D version for non-Newtonian fluids in which in prototype channel formation and lobe formation is occurring. In the course of this development the analogy with hyperconcentrated flow was memorized. The author therefore felt the need to understand and quantify the morphological interaction in hyperconcentrated flow in order to see if the same interaction of the physics can be expected for laminar non-Newtonian conditions. Utilising an earlier developed method, the current contribution only concerns the analytical treatment of pattern formation in hyperconcentrated flow originating from the interaction between 2D flow and bed. 2. Morphodynamic analytical model Two-dimensional depth-averaged gradual flow equations with an embedded erosion-deposition equation for bed formation are linearized and the stability of double harmonic pattern is evaluated to identify amplifying conditions, Figure 1. The approach is similar as in Struiksma et al. (1985), except that bed-load gradient-transport-theory is replaced by direct mass-exchange between the bed and suspension. Double harmonic pattern with greatest amplification rate will prevail, forming channels. The theory is originally developed for laminar flow with shear settling of sand in a clay based carrier fluid (Talmon 2020), some of the nomenclature stems from there.
Figure 1: Double harmonic perturbation of alluvial bed level (similar for velocities and free surface).
3. Results Principal typical dimensionless parameters of the prototype, from van Maren (2007), are listed in Table 1.
parameters symbol value ground slope i 0.00022
normalised wave length normalised wave width
bed friction horizontal eddy visc.
Froude number deposition rate
Lx/h Ly/h
n υ F D
~2500 ~500
<2 (strat.) not specified
0.22 erosion func.
Table 1: Parameters and conditions in prototype.
The strongest amplifications occurred for 10:1 to 20:1 length/width ratio (the left hand side branch stems from horizontal friction). The largest sized pattern has the greatest amplification rate by virtue of inertia of the flow and is most prominent at lower bed friction, n (for F=0 curves tend to collapse onto one curve for same n). Hence, pattern with different size can be developed, all with a preferent width to length ratio. Boundary conditions such as river banks, length of river stretches and variation or self-sorting of bed material may limit the development of the largest patterns.
Figure 2: Dimensionless amplification rate as a function
of width to length ratio of pattern and typical size of pattern in legend, υ=0.1 m2/s, (a=2π/Lx).
In a laminar flow, where the deposition rate of sand is enhanced with velocity (shear settling), and where there is no erosion capacity, only a negative relation between velocity and bed shear stress will enable channel formation. Thixotropy may facilitate such a combination, but also eventual inhomogeneities from shear settling of sand could play a role. 4. Conclusions Channel formation arises naturally in fines dominated system by virtue of direct solids exchange with the bed. It enhances when the bed shear stress varies less with flow velocity. Horizontal eddy viscosity determines width to length ratio of pattern, but is an external parameter to the Delft3D suite of software. Inertia favours bigger pattern. Acknowledgement Ebi Meshkati for high level discussions. References Struiksma, N., Olesen, K.W., Flokstra, C., de Vriend,
H.J., 1985, Bed deformation in alluvial channel bends, J. Hydr. Res., 23(1), 57-79.
Talmon A.M., 2020, Bed pattern initiation in non-Newtonian laminar deposition flow, 21st Int. Conf. on Hydrotransport, Edmonton (submitted, conference. postponed).
Van Maren, D.S., Grain size and sediment concentration effect on channel patterns in silt-laden rivers, Sedimentary Geology 202, 297-316.
u

28
Consolidation and desiccation of mud deposits: numerical modelling E. Meshkati1, G. Dupuits2, P.J. Vardon3, T. van Kessel1, A. Talmon1,3,
J. Tigchelaar2, L. Sittoni1, W.R.L. van der Star1
1Deltares, Delft, Netherlands. [email protected] 2 HKV, Delft, Netherlands; 3 Delft University of Technology, Delft, Netherlands
1. Introduction A one-dimensional large-strain consolidation and drying model (Vardon et al., 2014) was used to model the consolidation and desiccation of dredged deposits. This abstract describes the calibration and validation of the consolidation and ripening model using field data from Clay Ripener Pilot Project (Kleirijperij), the Netherlands. Additionally, the calibrated model is used to hindcast different ripening scenarios (e.g. with varying deposit thickness) under different climate conditions. The theoretical basis of the model is provided in Kim et al. (1992). The model is based on the conservation law for water in which water flow is driven by pore pressure gradients induced by gravity, self-weight and evaporation. The mechanical behavior is governed by the material shrinkage curve, i.e. the void ratio as a function of water content ratio, which covers the saturated to unsaturated range. Hydraulic conductivity is both density and saturation dependent, and is composed of the hydraulic conductivity in fully saturated conditions multiplied by correction factors for partially saturated condition and the desiccated top surface. Desiccation is included by means of net precipitation/evaporation (or outflow from consolidation) as the upper boundary condition. A conventional soil water retention curve is used to relate matric suction to effective saturation. 2. Case study The Clay Ripening Pilot (Kleirijperij) is conducted at two different locations in the North East of the Netherlands. In this pilot project, starting April 2018, about 300000 m3 of dredged fluid mud from the Ems-Dollard estuary is being transformed into soil for dyke reinforcement. Plot D15 in Delfzijl was selected for the calibration modelling, where 1.65m of dredged mud with an initial density of 1190 kg/m3 was deposited in a plot (basin) of approximately 100m × 100m. Validation of the model was conducted using plot D10, in which 1.59m of fresh mud with the same initial density was introduced. 3. Results Figure 1 shows water content ratio (Vw/Vs) profiles along the depth of the deposit in D15 at 4 different times (with 9-4-2018 as T0). The two solids squares in this figure are measured after core sampling. The error bar indicates the uncertainty in the depth of the samples. The calibrated model results and measured Vw/Vs values are in good agreement even though the model was calibrated for the settlement only (not shown). Figure 2 depicts the settlement in D10 during the first 192 days of the pilot. The settlement lines are numerical model results. The fluctuations in the settlement lines are due to effect of the net precipitation-evaporation. The solid squares are measured heights (from drone DEM measurements),
which is accompanied by a bar indicating standard deviation of variation in heights in the plot. The measured heights and model results are in a good agreement with the model (albeit a slight overestimation in settlement), thereby validating the model.
Figure 1 Measured versus modelled Vw/Vs (D15).
Figure 2 Measured versus modelled settlement (D10).
4. Conclusions The model can adequately predict the behavior of mud deposits under consolidation and desiccation process. The calibrated model has allowed the numerical investigation of different ripening scenarios (not presented in this abstract), which can be used for design and optimization of future clay ripening projects. Acknowledgments This project is supported by EcoShape and its partners, Province of Groningen, Stichting het Groninger Landschap, Waterschap Hunze en Aa’s, Rijkswaterstaat, Waddenfonds and HWBP. References Kim, D. J., Diels, J., Feyen, J. (1992). Water movement
associated with overburden potential in a shrinkage marine clay soil. Journal of Hydrology, 133:179–200.
Vardon, P.J., Nijssen, T., Yao, Y. and van Tol, A.F. (2014). Numerical simulation of fine oil sand tailings drying in test cells. IOSTC 2014, 59-69.

29
Dynamic fluid mud layer on intertidal mudflat Q. Zhu1
1 Institute of Environmental and Ecological Engineering, Guangdong University of Technology, Guangzhou 510006,
China
1. Introduction Fluid mud (sediment concentration > 10 kg/m3) is commonly formed in the environments with rich fine sediment supply, for instance in estuaries, bays and lakes. This is a crucial topic for waterways, ports, harbours, because fluid mud process is closely related to channel siltation (Ge et al., 2020). Besides, fluid mud is sometimes reported on tidal flats (van Leussen, 1991; Zhu et al., 2014). Such a system, which is sensitive to hydrodynamic forces, provides the advantage to carry out high resolution measurements of the formation and disappearance of fluid mud. With the development of turbidity profiler (ASM, Argus surface meter produced by Argus Environmental Instrument, Germany), continuous turbidity measurements with high spatial resolution (1 cm) can provide great insight into the degeneration, development and disappearance of near-bed fluid mud layers. To deepening the understanding of the fluid mud dynamics, we conducted in situ observation on an intertidal mudflat in Yangtze Estuary, China. Bottom boundary dynamics, including sediment concentration profile, bed level changes, tidal currents and waves were measured. Three types of bottom track With echo sound bottom track, ADV (Acoustic Doppler Velocity meter, Nortek B.V., Norway) obtained three kinds of ‘bottom’:
Clear boundary with elevation similar to buried-plate measurement. This refers to that ADV detects the solid boundary, i.e., the surface of consolidated sediment bed.
Clear boundary with elevation higher than buried-plate measurements. It shows a sudden change in the time series of bottom surface elevation measured by ADV. It indicates that there is a fluid mud layer floating above consolidated sediment bed with a relative sharp lutocline.
Failure to provide effective data during submergence. It means that there is a fluid mud layer without clear up-boundary.
Fluid mud layer during storm events The fluid mud layer occurred favourably during storm periods. Especially during slack water, turbulence was strong enough to keep the settling sediment aggregate near bed without settling down towards the bed. Another reason for this significant resuspension was that liquefaction, which often occurs during storms and hurricanes (Teisson et al., 1993; van Kessel and Kranenburg, 1998; Jaramillo et al., 2009), might have occurred, which would have decreased the strength of the surface sediment (van Kessel and Kranenburg, 1998). The surface sediment contains more water and is easily and quickly entrained by the increasing hydrodynamic forces, leading to a near-bed fluid mud layer (van Kessel and Kranenburg, 1998).
Occurrence of fluid mud layer resulted in high transport rates during the storm event. Multiplying sediment concentration and velocity profiles reflected the maximum sediment transport area in the water column. Under calm conditions, the maximum sediment transport area was within 0.3 m above the bed, typically ranging from 0.1 m to 0.25 m. The position of the maximum transport area was lifted up to 0.33 m above the bed because of the increase in the thickness of the near-bed fluid mud layer (Figure 1).
Figure 1: Near-bed sediment transport rate profile.
Fluid mud layer during tidal cycle The mechanisms of the generation of this fluid mud layer under high slack water and in the flood/ebb peak stages were different. Low bed shear stress and high sediment concentration in upper water column lead to the generation of fluid mud during slack water, while resuspension of freshly deposited mud caused by high bed shear stress from flood/ebb flow results in fluid mud layer during flood/ebb stages. Higher bed shear stress causes diffusion of the sediment in fluid mud layer. Meanwhile, the exposed bed sediment is well-consolidated. Depth-limited (or supply-limited) erosion, which is described as Type I erosion (Mehta and Partheniades, 1982), takes place. In this condition, fluid mud layer disappears (Figure 3).
Figure 2: Fluid mud dynamics during a tidal cycle.
30
The above findings can be broadened to other systems, such as subtidal zone, shelf, navigation channels, etc. They provide insights into the sediment transport in shallow water environments, and the coastal management related to the issue of fluid mud, e.g., dredging, maintaining depth of waterways and harbours. References Ge, J. Z., Chen, C. S., Wang, Z. B., Ke, K. T., Yi, J. X.,
and Ding, P. X. (2020). Dynamic Response of the Fluid Mud to a Tropical Storm. Journal of Geophysical Research-Oceans: 125(3), 27.
Jaramillo, S., Sheremet, A., Allison, M. A., Reed, A. H., and Holland, K. T. (2009). Wave-mud interactions over the muddy Atchafalaya subaqueous clinoform, Louisiana, United States: Wave-supported sediment transport. Journal of Geophysical Research-Oceans: 114.
Mehta, A. J., and Partheniades, E. (1982). Resuspension of deposited cohesive sediment beds. Coastal Engineering Proceedings: 1(18).
Teisson, C., Ockenden, M., Le Hir, P., Kranenburg, C., and Hamm, L. (1993). Special Issue Coastal Morphodynamics: Processes and Modelling Cohesive sediment transport processes. Coastal Engineering: 21(1), 129-162.
van Kessel, T., and Kranenburg, C. (1998). Wave-induced liquefaction and flow of subaqueous mud layers. Coastal Engineering: 34(1-2), 109-127.
van Leussen, W. (1991). Fine sediment transport under tidal action. Geo-Marine Letters: 11(3-4): 119-126.
Zhu, Q., Yang, S., and Ma, Y. (2014). Intra-tidal sedimentary processes associated with combined wave–current action on an exposed, erosional mudflat, southeastern Yangtze River Delta, China. Marine Geology: 347, 95-106.

31
Dynamic Response of the Fluid Mud to a Tropical Storm Jianzhong Ge1, Changsheng Chen2, Zheng Bing Wang3, Pingxing Ding1
1SKLEC, East China Normal University, Shanghai, China, [email protected]
2SMAST, University of Massachusetts-Dartmouth, New Bedford, MA 02744, United States 3Faculty of Civil Engineering and Geosciences, Delft University of Technology, The Netherlands
1. Introduction Fluid mud (FM) is a unique sedimentary feature in high-turbidity estuaries, where it can make a rapid contribution to morphodynamics (Winterwerp and Van Kesteren, 2004). To investigate the formation and transport dynamics of the FM in a high-turbidity estuarine environment under an extreme weather condition, we designed a rapid-response field measurement plan for the Changjiang River Estuary. Then a two-layer FM sediment model, which was coupled with the latest version of the three-dimensional Finite-Volume Community Ocean Model (FVCOM), was used to examine the dynamics attributing to the formation and transport processes of the observed FM. 2. Study site and Measurement The Changjiang River Estuary (Fig. 1) is a high-turbidity estuary connecting to the inner shelf of the East China Sea, with an abundant sediment supply from the upstream region. The North Passage is the major shipping channel in the Changjiang River Estuary. One day after the typhoon passed, a field survey was conducted around the mouth of the Changjiang River Estuary (Fig. 1). A series of cross-estuarine sections were selected near the North Passage navigation channel, including CS9, CS2, CSW, CS3, CS7, CS4, and CS10. There were two or three ship-anchored sites on each section.
Figure 1: Bathymetry of the Changjiang Estuary and
sampling sites 3. Model and Results To understand the behavioral life cycle of the FM during and after the typhoon had made landfall, FVCOM was configured to simulate the relevant physical processes. In addition to the original hydrodynamics, sediment, and dike-groyne modules, a two-layer FM model (Wang and Winterwerp, 1992) was developed and implemented into the sediment module with the aim of resolving and simulating the FM and upper suspension in an estuary. The tidal current, waves, suspended sediment, saltwater intrusion, and mixing via stratification were major physical processes nonlinearly interacted with each other and mutually led to the formation, extension, and breakdown of the FM (Fig. 2).
Figure 2: Spatial distribution of the FM thickness
The stratification was estimated based on the salinity front in the water column. Along the channel section, the vertical distribution of the FM and corresponding salinity indicated that there was a strong saltwater intrusion into the North Passage (Fig. 3). The typhoon wind strongly enhanced the saltwater intrusion and thus intensified the degree of stratification. Therefore, the stratification was the key physical process producing the massive formation of the FM.
Figure 3: Vertical distributions of the currents and
salinity and FM along the navigation channel. 4. Conclusion The results indicated that the initial appearance of the FM was the result of a typhoon-intensified, salinity-induced stratification in the outlet region. The landward propagation of the FM was driven by the combined effects of the FM-induced mud-surface pressure gradient force and saltwater intrusion near the bottom. Weak mixing during the subsequent neap tidal period sustained the FM as it rapidly extended into the middle region of the North Passage. References Wang, Z. B. and J. C. Winterwerp, (1992). A model to
simulate the transport of fluid mud. Tech. Rep. Z163, WL | Delft Hydraulics, Delft, The Netherlands.
Winterwerp, J. and W. Van Kesteren, (2004). Introduction to the physics of cohesive sediment in the marine environment, Developments in sedimentology 56. Series editor: T. Van Loon
121 122 123 124Longitude (ϒE)
28.8
29.2
29.6
30
30.4
30.8
31.2
31.6
32
32.4
32.8
Latit
ude
(ϒ N)
0
10
20
30
40
50
60
70
80
Aug 7 23:00Aug 8 0:00
Aug 8 1:00Aug 8 2:00Aug 8 3:00
Aug 8 4:00Aug 8 5:00Aug 8 6:00Aug 8 7:00
Aug 8 8:00Aug 8 9:00
Aug 8 10:00Aug 8 11:00
Aug 8 12:00Aug 8 13:00Aug 8 14:00
Aug 8 15:00ug 8 16:00 17:0000
(a)
East
Chi
na S
ea
Hangzhou Bay
ChangjiangEstuary
NPJCJK
NCDShanghai
Zhejiang
Depth (m)
Iwo Jima
121.6 121.8 122 122.2 122.4Longitude (ϒE)
31.2
31.4
Latit
ude
(ϒ N)
02468101214161820
Sections
Phase-2 (Aug 2005)
Phase-1 (Jun 2001)
Navigation channel
N1 N2 N3 N4N5
N6
N7N8
N9N10
S1 S2 S3 S4S5
S6S7
S8S9
NPJ
NCD
N1-N10: North groynes
S1-S9 : South groynes
NGN4
CS0
CS9 CS2 CS6CSW
CS3
CS7
CS4
CS10
Survey site
Buoy
Bed-sed site
Hengsha Shoal
Jiuduandsha Shoal
South Passage
North Channel
North Passage
(b)
Fig.1
Depth (m)

32
Fluid mud in dune troughs: The mud-dune transition in coastal plain estuaries M. Becker1
1 Institute of Geosciences, Christian-Albrechts-Universität zu Kiel, Germany, [email protected]
1. Introduction In tide-controlled, coastal plain estuaries, the location of the turbidity maximum is linked to the occurrence of es-tuarine mud, while tidal channels further up- and down-stream are naturally sandy. The sedimentary bed compo-sition is therefore heterogeneous on the estuarine scale, with different depositional regimes located in close vicin-ity. One example is the transition between mud and large dunes, for example observed upstream of the turbidity zone in the Weser Estuary, Germany (Fig. 1). We propose a mechanism, possibly contributing to the configuration of the mud-dune transition, in particular defining the small spatial scale on which the transitions occurs. 2. Ephemeral fluid mud deposits Due to the rapid formation of large mud flocs, the settling flux of cohesive sediments is strongly increased during slack water. Hindered settling leads to the formation of distinct near-bed density stratification, which effectively dampens turbulence and delays entrainment after slack water. In the Weser estuary, low-concentrated, ephemeral fluid mud (max. 70 g/l, below the gelling concentration) occurs all along the extent of the turbidity zone, during slack water (Becker et al., 2013).
Figure 1. Sediment echo sounder profile of fluid mud during accelerating currents after flood slack water.
By along-channel displacement of the turbidity zone, the tidal excursion causes fluid mud to be formed not only in the mud reach but further upstream after the flood (and further downstream after the ebb) over the sandy river bed, outside the mud reach. Fluid mud deposited in the mud reach is only partly entrained during one tidal phase and possibly dragged downstream by tidal currents in form of a mobile mud layer. The sandy channel parts upstream of the mud reach are covered by large, ebb directed dunes (see Fig. 1). Com-pared to slack water deposits in the mud reach, fluid mud deposited in dune troughs is entrained at an earlier point in time after slack water, during accelerating currents, which is related to the dune specific flow field, character-ized by high turbulent stresses in the wake behind the dune crest (Becker et al., 2013). As described, the residence time of fluid mud in dune troughs is shorter and dune specific turbulence prevents mud deposition. By contrast, the same stratification may function as a buffer layer for fine sediments over a flat river bed, promoting consolidation and mud deposition:
If the along-channel extent of the turbidity zone exceeds the tidal excursion, the mud reach is subject to two slack water settling events per tidal cycle. And, if fluid mud survives one tidal phase, the next settling phase adds sed-iment to a pre-existing fluid mud layer. This quasi-con-tinuous sediment supply might introduce a positive feed-back regarding the persistence of fluid mud to entrain-ment, as higher stratification increases the effect of turbu-lence damping at the lutocline. 3. Mud-dune transition In summary, both bed configurations are associated with processes, acting to sustain their respective state of the river bed. The flat bed in presence of mud supports the persistence of near-bed stratification. Dune crests, acting as roughness elements, prevent deposition of mud in dune fields. These differences in fluid mud entrainment should contribute to the observed sharp transition between mud and dunes, on longer times scales. Related processes and stratification are sketched in Fig. 2.
Figure 2. Settling and entrainment of fluid mud up-stream and downstream of the mud-dune transition,
In reality, dunes fade downstream into mud by rapidly de-creasing in size and length over a distance of much less than 500 m. The processes controlling dune dimensions in the transition zone are unknown, but recent studies in-dicate a limiting effect of (near-bed) density stratification on dune growth. The story here is purely conceptual, stressing aspects of self-organization and the importance of the tidal time scale. A proper analysis will have to prove the effectiveness of the small scale processes in-volved, in view of the (neglected) large scale (boundary) conditions, e.g. variations in channel cross-section, ongo-ing maintenance work, the overall sediment supply, and estuarine dynamics in general. References Becker. M., Schrottke, K., Bartholomä, A., Ernstsen, V.,
Winter, C., Hebbeln, D. (2013). Formation and entrain-ment of fluid mud layers in troughs of subtidal dunes in an estuarine turbidity zone. Journal of Geophysical Research: Oceans, 118, 2175-2187.

33
Managing a high range turbid system at a tidal energy site: - Severn Estuary, UK
R Kirby, Senior Visiting Fellow, National Oceanography Centre, Liverpool, UK C Retière, Director, (ret’d), Laboratoire Maritime, Museum National d'Histoire Naturelle, Dinard, Fr.
Plans to build a barrage (length 15.9km) on a "Cardiff-Weston" alignment in the Severn, UK, offer the best tidal power prospect in the entire world, but have in the past been thwarted by falacial environmental objection. Three independent lines of evidence disprove this. Scientific data from the Rance in Brittany, a data set now spanning 140 years, shows that its tidal power barrage (built 1963-66) has actually enhanced the local environment, whereas, when data from south west UK estuaries plotted on a generic biological graph is considered, Rance experience is confirmed. Neither of the above are intrinsic cohesive sediment issues. Physical and chemical oceanographic, plus marine biological evidence for the dynamic and turbid Severn, prior to and after barrage construction, unambiguously show beneficial shifts, in line with these two, above cases, is also inevitable. The Severn is hyper-tidal (14.7m HAT), with MSR 12.3m and MNR 6.5m. This large variation determines the currents such that large scale fortnightly cycling of mud between water body and bed routinely occurs. This, in turn, suppresses system biology to an extreme degree. The presentation will focus on these interacting physical, chemical and biological scientific disciplines. On Neap tides mud settles to form extensive anaerobic fluid mud zones, so preventing bed colonisation by organisms. Dewatering mud layers expel deoxygenated pore water up into the waterbody, which further inhibits the biota. On the succeeding Neap-Spring cycle entrainment of anoxic fluid mud imposes a further
Dissolved Oxygen burden on the waterbody. Whilst fine sediment is entrained in this way daylight is unable to penetrate, implying absence of photosynthesis and thus a lack of phytoplankton. Inhibition propagates upwards through the food chain. By this stress both the underlying bed and the waterbody are entirely or virtually abiotic. The eroding mud foreshore is further characterised by a high degree of invertebrate faunal suppression, as reflected in the dwarf and juvenile infauna, these not meriting the term "communities". Extensive data bases illustrating this provide proof. The words "defaunated", "depauperate", "vestigial " and "barren" are variously applicable. A further undesirable aspect to emerge is the long-term diminution in, for example, shorebirds. This can be explained as an effect of climate change, which building a barrage is intended to offset. Installing a "Cardiff-Weston" barrage would reduce tidal extremes into the high macrotidal range. On closure a substantial fraction of the currently mobile fine cohesive sediment population would permanently settle but now consolidate. Biodiverse and abundant faunal communities typical of equivalent muddy estuaries would develop from spat advected in from the Bristol Channel to seaward and would colonise the zone landward of the barrage. Such a scheme would generate >17 Terra Watt hr/yr of electricity or 7% of UK electricity need. As above, the three streams of evidence indicate a parallel but much larger environmental enhancement to that seen at Rance and in the generic model. As clear from Rance, such tidal power schemes have multiple non-power benefits and a lifespan beyond that of a human life.
Figure 1 Rance tidal power barrage
Figure 2 Artists impression Cardiff-Weston barrage

34
Behavior of mud aggregates at the Socheongcho Ocean Research Station (SORS) in the eastern Yellow Sea
G. Lee1, S.M. Figueroa1 and J. Chang1
1 Department of Oceanography, Inha University, Incheon, Republic of Korea. [email protected]
1. Introduction Continental shelf seas, such as the North Sea, Persian Gulf, and Argentine Sea are economically significant sources of aggregates, hydrocarbons, shellfish, finfish, and so forth. These environments generally feature fine, cohesive sediments. Understanding the behaviour of cohesive sediment in continental shelf seas is important in its own right and also as a basis for understanding human impacts on the shelf, for example aggregate extraction or the laying of subaqueous pipelines. Here are presented measurements of in-situ cohesive sediment size distribution, floc images collected by floc camera, and suspended sediment concentration (SSC) at a site in the eastern Yellow Sea at 50 m depth. These data are supplemented with flow and stratification data. This study helps to improve our understanding of cohesive sediment dynamics on continental shelves both locally, such as neap-spring variations in SSC, as well as regionally, with respect to advection of fine, cohesive sediments by coastal currents. 2. Methods and Results 2.1 Study Area Data was collected at Socheongcho Ocean Research Station (SORS) in the eastern Yellow Sea. 2.2 Data Collection Data was collected during 2018. LISST and CTD casting data was collected on May and November 2018, while ADCP, waves, and wind data were collected throughout the year. In addition to surface elevation and currents, the ADCP collected bottom temperature and acoustic backscatter profiles. 2.3 Data Processing Casting data was processed to understand the variation of cohesive sediment size and concentration with tides and thermal stratification at SORS. Floc camera data was processed to produce alternative measurements of floc size, along with additional floc density and settling velocity. The ADCP acoustic backscatter was calibrated to SSC to consider the variation of SSC and the flux of SSC in other hydrodynamic conditions. 2.4 Results The data indicated several processes affecting the dynamics of fine cohesive sediment on the continental shelf sea. They included the neap-spring cycle of tides as well as the seasonal coastal currents. Annual variations of thermal stratification, wave activity, typhoons, and biological activity were also found to influence the cohesive sediment behaviour.
Figure 1: Selected cast collected at Socheongcho Ocean
Research Station (SORS) in May 2018. A) Salinity (psu), temperature (°C), density (kg m-3). B) Sediment
mass concentration (mg L-1), sediment volume concentration (μL L-1), mean floc size (μm).
Figure 2: Estimated floc effective density (kg m-3)
versus mean floc size (μm) 3. Conclusions This study establishes that the tides act to resuspend fine cohesive sediment on shelves, and coastal currents advect them along-shelf. Therefore, cohesive sediment transport on continental shelves should consider along-shelf sediment transport pathways.

35
The role of biophysical stickiness on oil contaminated mineral flocculation in seawater
L. Ye1,2*, A. J. Manning2,3,4, J. Holyoke2,5, J. A. Penaloza-Giraldo2, T.-J. Hsu2
1School of Marine Sciences, Sun Yat-sen University, Zhuhai, China. [email protected] 2Center for Applied Coastal Research, Department of Civil and Environmental Engineering, University of Delaware,
Newark DE, United States. 3HR Wallingford Ltd., Coasts and Oceans Group, Wallingford, United Kingdom.
4School of Biological and Marine Sciences, University of Plymouth, Plymouth, United Kingdom. 5Department of Civil, Architectural & Environmental Engineering, University of Texas at Austin, Austin TX, United
States.
Abstract Biophysical cohesive particles in aquatic systems,
such as extracellular polymeric substances (EPS) and clay minerals, play an important role in determining the transport of spilled oil contamination and its eventual fate, particularly given that suspended sediment and microbial activities are often prevalent and diverse in natural environments.
A series of stirring jar tests have been conducted to understand the multiple structures characteristics of the oil-mineral aggregates (OMAs) and EPS-oil-mineral aggregates (EPS-OMAs). OMAs and EPS-OMAs have been successfully generated in the laboratory within artificial seawater using: Texas crude oil (Dynamic viscosity: 7.27×10⁻³ Pa ·s at 20 ℃), two natural clay minerals (Bentonite and Kaolin clay), and Xanthan gum powder (a proxy of natural EPS). A magnetic stirrer produced a homogeneous turbulent flow with a high turbulence level similar to that under natural breaking waves. High-resolution microscopy results show that EPS, kaolinite, and bentonite lead to distinguished oil floc structures because of the different stickiness character of EPS and mineral clay particles. With relatively low stickiness, kaolinite particles tend to attach to an oil droplets surface (droplet OMAs) and become dominant in small-sized flocs in the mixture sample. In contrast, the more cohesive bentonite particles stickiness could adsorb with oil droplets and are thus dominated by larger sized flocs. Biological EPS, with the highest stickiness, demonstrated that it could bond multiple small oil droplets and form a web structure trapping oil and minerals. Generally, adding EPS leads to flake/solid OMAs formation, and individual oil droplets are rarely observed. The inclusion of ESP within the matrix, also reduced the dependence of settling velocity on floc size and mineral type. Implications and conclusions
In this study, we utilized a high-resolution microscope and a LabSFLOC-2 system to investigate the structures and characteristics of EPS-OMA, and the unique effect of biological stickiness on the OMA formation. The experimental results quantitatively reveal that the inclusion of EPS in the suspension matrix (not generally considered in previous OMA studies), leads to flake/solid OMAs formation and this has a dramatic effect on both the trapping and stabilization of oil droplets in OMAs. Both EPS-oil-kaolinite aggregates and EPS- oil-bentonite aggregates show a similar mixed flaky
structure in lieu of droplets OMAs. However, the bentonite cases show larger sized EPS-OMAs (~900 microns) than those of equivalent kaolinite cases (~400 microns). The EPS-OMA density and settling velocity show an increase in smaller sized microflocs and a corresponding reduction in larger sized flocs for all the pure mineral samples.
Overall, the addition of EPS reduces the variability of settling velocity as a function of floc size and clay mineral type. Since EPS is ubiquitous in natural marine environments, and it is one of the most important biologically cohesive materials in the aquatic system, it’s role in absorbing oil, attaching minerals, forming EPS-OMAs and influencing the fate of oil, all needs to be incorporated in future spill modeling approaches.
To expand the study for oil spill mitigation, the effect of chemical dispersants would require further investigated. More scenarios representative of combinations of lower levels of cohesive sediment concentrations, less EPS, and lower turbulent energy, should all be also studied in order to improve oil spill modeling predictions within those natural aquatic zones. References Ye, L., Manning, A. J., Holyoke, J., Penaloza-Giraldo, J.
A., Hsu,T.-J. (2021). The Role of Biophysical Stickiness on Oil-Mineral Flocculation and Settling in Seawater. Frontiers in Marine Science, 8: 628827.
Ye, L., Manning, A.J., Hsu, T.-J. (2020). Oil-Mineral Flocculation and Settling Velocity in Saline Water. Water Research, 173: 115569.
Ye, L., Manning, A.J., Hsu T.-J., Morey S., Chassignet E.P. and Tracy A. Ippolito T.A. (2018). Novel Application of Laboratory Instrumentation Characterizes Mass Settling Dynamics of Oil-Mineral Aggregates (OMAs) and Oil-Mineral-Microbial Interactions. Marine Technology Society Journal 52(6):87-90.

36
Study of spectral wave dissipation at the Hendijan mud coast, the Persian Gulf M.R. Kiani1, M. Soltanpour2 and S.A. Haghshenas3
1 Formerly, Department of Civil Engineering, K.N. Toosi University of Technology, Tehran, Iran
2 Department of Civil Engineering, K.N. Toosi University of Technology, Tehran, Iran. [email protected] 3 Institute of Geophysics, University of Tehran, Tehran, Iran. [email protected]
1. Introduction In soft muddy coasts, wave-mud interaction at intermediate and shallow water depths results in the wave attenuation and reduced wave breaking. Assuming viscoelastic rheological behaviour of fluid mud, the dissipation of wave energy on muddy beds is introduced into the SWAN wave model in this study. The performance of the developed spectral wave model at different wave frequencies is evaluated at Hendijan muddy coast, where the offshore and nearshore wave measurements, respectively at 10 m and 2.5 m water depths, are available from 20th of February to 28th of March, 2007 (Figure 1). The effect of the energy dissipation on nonlinear wave-wave interaction, in the form of quadruplets and triads, is also studied.
Figure 1: Hendijan muddy coast at the northwest of the
Persian Gulf. 2. Numerical modelling The third-generation Simulating WAves Nearshore (SWAN) model (Booij et al., 1999) was modified to include the dissipative effects of the non-rigid bed on wave propagation. Based on the proposed theoretical formula of Ng (2000), SWAN-NG modifies the wave transformation by introducing the dissipation wave number kd , which depends on water depth and kinematic viscosity and density of fluid mud, into the action balance governing equation. Employing the multi-layers Viscoelastic (VE) model of Haghshenas and Soltanpour (2010), the kd value is substituted in the proposed model, (SWAN-VE).
3. Results and discussion Figure 2 shows the higher rate of wave energy dissipation at lower frequencies, where the maximum dissipation values correspond to the wave periods of about 5 to 7 seconds. Figure 3 presents the comparisons between the numerical results of two models and the measured wave heights. It is observed that SWAN-VE model slightly improves the prediction accuracy of nearshore wave heights, in comparison to SWAN-NG model.
Figure 2: Wave-fluid mud dissipation spectra for various water depths (large and small wave frequencies of wave
spectra were ignored).
Figure 3: Comparisons of results of SWAN-NG and
SWAN-VE models with field data.
References Booij N., Ris R.C., Holthuijsen L.H. (1999). A third-
generation wave model for coastal regions: 1. Model description and validation. Journal of Geophysical Research: Oceans, 104, 7649–7666.
Haghshenas, S. A., Soltanpour, M. (2010). Analysis and modeling of dissipative waves at Hendijan mud coast, the Persian Gulf, Ocean Dynamics, 61, 217-232.
Ng, C.O. (2000). Water waves over a muddy bed: a two-layer Stokes boundary layer model, Coastal Engineering, 40 (3), 221-242.
-0.0003
-0.00025
-0.0002
-0.00015
-0.0001
-0.00005
00 0.2 0.4 0.6 0.8 1
Smud
(f)/E
(f) (H
Z)
frequency (Hz)
SWAN-VE
2.5m
3m
3.5m
4m
4.5m
5m
5.5m
6m
0
20
40
60
80
100
120
140
0 50 100 150
Sim
ulat
ed S
igni
fican
t Wav
e He
ight
(c
m)
Measured Significant Wave Height (cm)
SWAN-NG
SWAN-VE

37
Sediment stability and EPS interactions in intertidal habitats J.M. Rounce1, A.J. Manning1,2, J.A. Hope3, A.J. Blight4 and D.M. Paterson4
1 School of Biological and Marine Sciences, University of Plymouth, Plymouth, UK. [email protected]
2 HR Wallingford, Howbery Park, Wallingford, Oxfordshire, UK 3 Energy and Environmental Institute, University of Hull, Hull, UK
4 Sediment Ecology Research Group, Scottish Oceans Institute, School of Biology, University of St Andrews, St Andrews, UK
Ecosystem function and corresponding services
should underpin management plans in intertidal ecosystems. The cohesive sediments dominating these environments reveal complex interactions involving various biophysical processes. Sediments constitute combinations of mud, sand and organic substances, thus influencing erodibility across habitats. Due to these biophysical characteristics, muddy sediments flocculate; a process affected by local turbulent shear and suspended particulate matter concentration. Additionally, the biological and mineralogical composition of suspended particles also varies cohesion, impacting the potential for particles to flocculate. Improvement of models for accurate prediction of sediment transport and erosion processes must therefore include biological and chemical influences, as well as physical (Paterson et al., 2018).
Extracellular polymeric substances (EPS) are secreted by microphytobenthic organisms in intertidal habitats. This coats sediment grains; promoting sediment stabilisation. Consequently, microphytobenthos diversity, biomass and EPS carbohydrates have been identified as key predictors of sediment stability in intertidal sediment (e.g. Hope et al., 2020).
The CBESS (Coastal Biodiversity and Ecosystem
Service Sustainability) programme collected large-scale datasets investigating biodiversity and the related ecosystem service provision in intertidal ecosystems from Essex and Morecambe Bay, UK, 2012-2016. Here, in-situ sediment stability measurements from the Cohesive Strength Meter and EPS colloidal carbohydrate concentrations have been utilised to address interactions between erodibility and biophysical sediment properties (Paterson et al., 2015). The focus of this study was to investigate the relative influences of site, habitat (saltmarsh/mudflat) and seasonal characteristics on sediment stability and EPS in intertidal sediments. Sites varied in vegetation coverage and sediment compositions. To address this, multivariate statistics were employed to visualise and assess spatial and seasonal variability across six sites in the two estuaries.
Initial results identified the highest sediment stability in saltmarsh habitats, while lower sediment stability occurred in Morecambe Bay mudflat samples (Figure 1).
This research augments the understanding of natural
intertidal sediment erodibility. It highlights interactions between sediment characteristics within various sedimentary and dynamical contexts, by providing quantitative insight into sediment stability via large-scale field-derived datasets. This information is critical for improving the reliability and accuracy of predictive models.
Acknowledgments The CBESS dataset was obtained from the NERC Coastal Biodiversity and Ecosystem Service Sustainability programme (Grant Ref: NE/J015644/1). References Hope, J.A., Malarkey, J., Baas, J.H., Peakall, J., Parsons,
D.R., Manning, A.J., Bass, S.J., Lichtman, I.D., Thorne, P.D., Ye, L. and Paterson, D.M. (2020). Interactions between sediment microbial ecology and physical dynamics drive heterogeneity in contextually similar depositional systems. Limnol. Oceanogr. 9999, 1-17. doi: 10.1002/lno.11461
Paterson, D.M., Hope, J.A., Kenworthy, J., Biles, C.L. and Gerbersdorf, S.U. (2018). Form, function and physics: the ecology of biogenic stabilization. J. Soils Sed. 18, 3044-3054. Doi:10.1007/s11368-018- 2005-4
Paterson, D.M, Hope, J.A, Wade, K, Kenworthy, J, Defew, E.C, Weeks, R.J, Wyness, A. (2015). Coastal Biodiversity and Ecosystem Service Sustainability (CBESS) sediment stability by Cohesive Strength Meter (CSM) in salt marsh and mud flat habitats. NERC Environmental Information Data Centre. Available at: https://doi.org/10.5285/64d64b2c-5f80-4dd5-b778- 41c048f96caf (Accessed: 10/06/2020).
Rounce, J.M. (2021) Examining the erosional and depositional behaviour of cohesive sediments. MSc dissertation, University of Plymouth, UK.
Figure 1 Erosion threshold across six UK sites: a) saltmarsh b) mudflat in summer (S, light) and winter
(W, dark). Essex: Tillingham Marsh (TM), Abbotts Hall (AH), Fingringhoe Wick (FW); Morecambe Bay:
Cartmel Sands (CS), West Plain (WP), Warton Sands (WS). From Rounce (2021), data: Paterson et al. (2015).
a)
b)

38
Distribution and Transport of Micro/Nano Plastics with Chemical Contaminants & Biological Agents in Industrial, Urban and Rural Aquatic Environments
A. Burch and A. Manning
1. Introduction Cohesive fine-grained sediments have the potential to flocculate in marine environments, and these flocs have the ability to adsorb a range of pollutants. The motivation for this research was to examine and assess with the magnitude, distribution and transport of micro/nano plastics, chemicals and biological contaminants across a range of aquatic environments, sediment types and levels/types of human activity. Relevant data sets (of varying degrees of detail and spatial/temporal coverage) were compiled from a range of existing repositories and available studies. 2. Formatting: figures, tables, equations, items, references 2.1 Figures
Figure 1: Plymouth Sound satellite image with Sample
Site Locations
Figure 2: Microscope Images
Figure 3: Microplastics Abundance Graph 2.2 Tables
Table 1: Microplastics Type/Colour Distribution 2.3 Equations
Using the floc size (D) and settling velocity (Ws) we can determine the effective density (ρe) by using stokes law for each floc captured where g is the gravitational constant. 2.4 Items N/A 3. Conclusions From the experiments that have taken place we can see that when looking at the results the primary conclusion to draw would be that it appears the exact type of human activity is less important when compared to the size of the human presence nearby as there were smaller differences in microplastic density between the areas of industrial and recreational activity when compared to the difference between the urbanized and more rural sites/feeder locations. Acknowledgments Big thank you to project supervisor D Andrew Manning for support during the work and technician Jonathan Coe for field work help. References

39
On satellite remote sensing reflectance resolutions and the implications to the assessment of Suspended Particulate Matter: study case of Patos Lagoon, Brazil
J. Tavora1, E. C. Bortolin2, E. H. Fernandes2
1 Faculty of Geo-Information Science and Earth Observation, University of Twente, Enschede, the Netherlands. [email protected]
2 Instituto de Oceanografia – Universidade Federal do Rio Grande (FURG), Rio Grande, Brazil
1. Introduction Coastal waters are complex ecosystems with a strong relationship with the ocean, the continent, and the atmosphere. Besides, they have high biological productivity and diversity and are sites of intense and often conflicting economic activities. In the past decades, monitoring and assessing changes in coastal environments highly increased with the use of remote sensors. Among sensors with potential application in coastal waters are: MODIS-aqua, VIIRS, MERIS, LANDSAT, and SENTINEL 2 (respectively 1000m, 750m, 300m, 30m, 10-60m spatial resolution). These different satellite sensors currently provide about 40 years of coastal observation, allowing for both high temporal and spatial assessment of coastal dynamics, particularly if combined. The use of such sensors has the potential to improve long-term assessment of changes in water quality especially in developing countries where field sampling is economically limited. However, these sensors have been used either individually or interchangeably combined without a clearer understanding of their unique limitations and what these limitations imply on water quality studies. We understand that it is necessary that the limitations in the assessment of water quality parameters through the use of different satellite sensors need to be well assessed in each environment it is applied. Our focus here is on the assessment of Suspended Particulate Matter, hereon called SPM, in the Patos Lagoon (Brazil) using the multiple sensors applied to a multi-wavelength algorithm (Tavora et al., 2020). The overall goal is to analyse the differences (limitations and/or advantages) in the assessment of SPM given each satellite sensor characteristic (e.g., spatial, temporal and spectral resolution). Once the comparison and differences are established, a SPM multi-proxy time series dating from 1984 to 2020 will be established. Our foremost goal is to clarify to the local community the best ways of maximizing accurate data acquisition for coastal studies in the Patos Lagoon, Brazil. 2. Methods For the period between 1984-2020, SPM sampled in situ at a number of stations will be compared to the multiple satellite-derived SPM concentrations. All available scenes from MODIS-aqua, VIIRS, MERIS, LANDSAT, and SENTINEL 2 will be atmospherically corrected and SPM will be retrieved from about 40 years of satellite reflectance data. This requires: 1) selection and acquisition of scenes from each satellite data provider, 2) applying a suitable atmospheric correction and masking of clouds. This pre-processing of images is executed using the ACOLITE and the SEADAS software packages. With the consistently mapped time series of
remote sensing reflectance, a suitable algorithm (Távora et al., 2020) will be applied to retrieve SPM concentrations. This algorithm uses a semi-analytical approach for turbid coastal waters based on SPM measurements collected worldwide and can be applied to any satellite sensor. Subsample areas will then be chosen along the waters of Patos Lagoon, Brazil (Figure 1). Each subsampled area will be averaged to be later on compared to SPM at the in-situ stations for accuracy assessment. Every satellite specific time-series of satellite-derived SPM, and field-measured SPM will be analysed. Once limitations are well established and understood, a multi-proxy time-series will be established to study the SPM dynamics in the Patos Lagoon. Finally, monthly, seasonal, and yearly composites will be generated. 3. Preliminary results Remote sensing data of SPM are highly variable in the Patos Lagoon over the studied period. Preliminary results show improved SPM retrievals for high spatial resolution sensors in narrower areas (e.g., LANDSAT, and SENTINEL). On the other hand, higher spatial resolution sensors lack assessment of temporal variability of SPM given that their temporal resolution is usually lower (or in the case of SENTINEL, relatively recent sensors which do not provide yet long term monitoring).
Figure 1: Patos Lagoon, Brazil
4. Preliminary conclusions This study contributes to the understanding of sedimentary exchange and possibly processes driven by climatic oscillation events. Furthermore, a SPM multi-proxy time series dating from 1984 to 2020 is been established for the first time in Patos Lagoon. The main limitations of this work are related to intense cloudiness present in the region. References Távora, J., Boss, E., Doxaran, D., & Hill, P. (2020). An algorithm to estimate suspended particulate matter concentrations and associated uncertainties from remote sensing reflectance in coastal environments. Remote Sensing, 12(13), 1–24. https://doi.org/10.3390/rs12132172

40
16th International Conference on Cohesive Sediments Transport – INTERCOH 21, 14-17 September 2021, Delft, Netherlands.
Fig. 1. MBES survey encompassing Plymouth Sound, UK.
An investigation of sonar techniques past and present to identify objects on and beneath the seabed
T.D. Maw1 and A.J. Manning1,2,3,4
1 School of Biological & Marine Sciences, University of Plymouth, Plymouth, Devon, PL4 8AA UK. [email protected] 2 Coasts & Oceans Group, HR Wallingford, Howbery Park, Wallingford, Oxon, OX10 8BA UK; 3 Department of Hydraulic Engineering, Delft University of Technology, Delft, Netherlands; 4 Energy
& Environment Institute, University of Hull, Hull, East Riding of Yorkshire, HU6 7RX UK. 1. Introduction Seafloor mapping has been prevalent since the first bathymetric map created in 1853 Maury in collaboration with the U.S. Navy of the North Atlantic using weighted hemp or flax rope (Dierssen et al., 2014). Today, SONAR (Sound Navigation and Ranging) techniques have been developed to provide accurate, time efficient and non-intrusive methods to gain knowledge of the seafloor. As technology advances, SONAR has adapted to incorporate sediment size and classification under survey capabilities (Manik, 2012). A key question is: how do different sonar techniques compare, in terms of efficiency, reliability and accuracy, when operating in predominantly muddy waterways? This paper demonstrates and explains the various technologies and methods which allow highly accurate seabed surveys to be carried out (e.g. Jones et al., 2017). Secondly, the water column and sediment on, above and below the seafloor has been investigated to understand how environmental influences affect the signal transmitted during surveys. 2. Methodology This study will draw on both field and laboratory data, together with selected case studies, with a focus on application in predominantly cohesive sedimentary aquatic environments. By analysis of Side scan sonar, Multibeam Echo Sounder (MBES) (Fig. 1), Sub-bottom Profilers, and an Acoustic Sonar Trainer (AST), a broad picture of modern-day sonar capabilities can be met. This is combined with investigating water column properties such as density / salinity / temperature / depth profiles alongside suspended sediments and flocculation properties which may interfere with sonar surveys. 3. Sedimentary and water column factors Environments where sediment composition has mixed minerology can utilise backscatter as each mineral produces differing backscatter (Moate & Thorne, 2012). Secondly, flocculation behaviour is primarily important due to the change of size, density and settling velocities which directly impacts the level of suspension in mixed
sediments (Manning et al., 2010). Stratification is an influencing factor which can create lutoclines. Estuaries, with emphasised stratification due to mixing of salt and freshwater, trap sediments in the lower water column, leaving a region of muddy water controlled by buoyancy-influenced Richardson numbers and the collapse of turbulence within fluid-mud (Ross & Mehta, 1989). 4. Conclusions Sonar, such as MBES was found to struggle interpreting bathymetric properties when faced with suspended sediment. The ‘false bottom’ was recorded at its most intense when either higher amounts of sediment was suspended, or when the sediment itself had dense properties such as sand whose returning signal was upwards of 10 dB higher than that of clay. Using Dual frequency (e.g., 12 kHz and 300 kHz) allowed for the true bottom to be inferred by using low frequency whilst the high frequency recorded the starting depth of intense suspended sediment. This allowed the extent of suspended sediments to be recorded. Sediment analysis measurements discovered the placement of turbidity maximum zones in areas located in upper estuary regions, whereby MBES surveys displayed possible errors when bathymetric data was collected. This study allowed for the recent advancements in sonar technology to be highlighted, enabling predictions of future developments. Acknowledgments AM’s contribution towards this research was partly supported by National Science Foundation grants OCE-1924532 & OCE-1736668, TKI-MUSA project, and HR Wallingford comp. res. FineScale proj. (ACK3013_62). References Dierssen, H. and Theberge, A. (2014). Bathymetry:
History of Seafloor Mapping. 10.1081/E-ENRW-120047531.
Jones, G.E., Abbott, V.A., Manning, A.J., & Jakt, M. (2017). Acoustic Seabed Survey Methods, Analysis and Applications. In: R.J. Uncles and S. Mitchell (Eds), ECSA practical handbooks on survey and analysis methods: Estuarine & Coastal Hydrography & Sedimentology, pp.54-91,Pub:Cam.Uni.Pr., doi 10.1017/9781139644426.
Manik, H., (2012). Seabed Identification and Characterization Using Sonar. Adv Acou.Vibr., pp.1-5.
Manning, A.J., Baugh, J.V., Spearman, J. & Whitehouse, R.J.S. (2010). Flocculation Settling Characteristics of Mud:Sand Mixtures. Oc.Dyn, doi:10.1007/s10236-009-0251-0.
Moate, B.D. & Thorne, P.D. (2012). Interpreting acoustic backscatter from suspended sediments of different and mixed mineralogical composition. Cont. Shelf Res., 46, pp. 67-82, doi:10.1016/j.csr.2011.10.007.
Ross, M., & Mehta, A. (1989). On the Mechanics of Lutoclines and Fluid Mud. J. Coastal Research, 51-62.

41
Spring-neap variability of tidal current velocity in the Emder Fairway (Ems Estuary) derived from moored ADCP
Anna Wünsche1, Marius Becker2, Christian Maushake1, Christian Winter2
1 Federal Waterways Engineering and Research Institute, Hamburg, Germany, [email protected] 2 Department of Geosciences, 2 Kiel University, Kiel, Germany
1. Introduction In the last decades increases in tidal range and suspended sediment concentration were observed in the Ems Estuary (Winterwerp and Wang, 2013). Several approaches, which aim to explain upstream suspended sediment transport, are based on the distortion of the tidal wave (Friedrichs and Aubrey, 1988), thus, on tidal asymmetry. For instance, peak current asymmetry is typically evaluated to describe (fine) suspended sediment transport (Dronkers, 1986). Here, we present spring-neap variability of maximum and depth-averaged velocity magnitudes from one location in the Ems Estuary and, based on that, compare the duration of high velocity magnitudes with peak current asymmetry. 2. Data and Methods Within the scope of the Ems Dollard Measurement campaign a large data set was collected during August 2018 and January 2019. Moored ADCP in the Emder Fairway cover a period of one spring neap cycle (Spring A, Neap) and an additional spring phase (Spring B) in August. Periods of four consecutive days are analyzed to represent a phase, respectively. Each phase provides eight cycles, where one cycle covers a flood current and its subsequent ebb current. We evaluated time series of depth-averaged velocity magnitudes and maximum velocity magnitudes and computed means in each phase. The impact of discharge is neglected in this study.
Figure 1: Depth-averaged velocity magnitudes 𝑢𝑢𝑎𝑎𝑎𝑎 (light
blue line), their mean ⟨𝑢𝑢𝑎𝑎𝑎𝑎⟩ (dark blue, bold line) and maximum velocity magnitudes 𝑢𝑢𝑚𝑚𝑎𝑎𝑚𝑚 (light red line), and
their mean ⟨𝑢𝑢𝑚𝑚𝑎𝑎𝑚𝑚⟩ (dark red, bold line) in m/s of the phases Spring A, Neap and Spring B, derived from
moored ADCP data in the Emder Fairway in August 2018. Labels at the x-axis indicate durations in minutes. 3. Results Velocity magnitudes in the Emder Fairway, displayed in Figure 1, show higher magnitudes during spring than
during neap. In addition, comparing single time series and their means shows that phase-internal variability is highest at high values of velocity magnitudes, e.g. larger than 0.6 m/s, which is confirmed by standard deviations (not shown here). Further comparison of the two spring phases depicts larger magnitudes during Spring A. The differences reach up to 0.15 m/s for the mean maximum velocity magnitudes ⟨𝑢𝑢𝑚𝑚𝑎𝑎𝑚𝑚⟩ during ebb. The velocity structure of the means ⟨⋅⟩ over the duration of a tide reveals similar characteristics for all phases. While flood currents display one distinctive peak after slack, ebb currents exhibit rather two to three smaller peaks on similar magnitudes. The most striking feature is that even though (mean) maximum ebb current magnitudes are smaller than (mean) maximum flood current magnitudes, they roughly last twice as long as those during flood, at very high magnitudes such as 1.15 m/s (Spring A), 1 m/s (Neap) or 1.05 m/s (Spring B). Note that these thresholds could also be determined due to the mean velocity magnitude ⟨𝑢𝑢𝑎𝑎𝑎𝑎⟩, respectively. Moreover, at a lower threshold, e.g. 0.8 m/s, durations of ebb current magnitudes exceed those of flood, generally. 4. Conclusions The presented analysis illustrates spring-neap variability of current velocity in the Emder Fairway. Characteristic structures of velocity magnitudes vary from flood to ebb currents and from spring to neap. Therefore, we conclude that a general classification of an estuary based on current velocity from short time series (e.g. one tidal cycle) is inapplicable. In fact, additional stations should be analyzed, too. In this study we have neglected the influence of discharge, which potentially accelerates the ebb current. Furthermore, we show that ratios of peak currents underestimate the impact of durations of high current velocities (𝑢𝑢 > ⟨𝑢𝑢𝑎𝑎𝑎𝑎⟩), especially during ebb, and, hence, consider this combined parameter non-neglectable. Future research could evaluate this parameter against other tidal asymmetry parameters, compare its behavior to periods of higher discharge and assess its impact regarding sediment transport. References Winterwerp, J. C.; Wang, Z. B. (2013). Man-induced
regime shifts in small estuaries—I. Theory. Ocean Dynamics 63 (11-12).
Dronkers, J. (1986). Tidal asymmetry and estuarine morphology. Theory. Netherlands Journal of Sea Research 20 (2).
Friedrichs, C. T.; Aubrey, D. G. (1988). Non-linear tidal distortion in shallow well-mixed estuaries. A syn-thesis. Theory. Estuarine, Coastal and Shelf Science 27 (5).
42
16th International Conference on Cohesive Sediments Transport – INTERCOH 21, 14-17 September 2021, Delft, Netherlands. Issues relating to the disposal of muddy dredged material – A global perspective
T.J. Peters1 and A.J. Manning1,2,3,4
1 School of Biological & Marine Sciences, University of Plymouth, Plymouth, Devon, PL4 8AA UK. [email protected] 2 Coasts & Oceans Group, HR Wallingford, Howbery Park, Wallingford, Oxon, OX10 8BA
UK; 3 Department of Hydraulic Engineering, Delft University of Technology, Delft, Netherlands; 4 Energy & Environment Institute, University of Hull, Hull, East Riding of Yorkshire, HU6 7RX UK.
1. Introduction Disposal of dredged sediments is a very delicate, yet vitally important process carried out globally for a variety of economic and environmental reasons. If done incorrectly, or without due consideration to the actions undertaken, effects of disposal could be catastrophic. A key question is which disposal solution is best suited to a particular dredging approach. This study aims to examine and assess a range of disposal approaches for predominantly muddy dredged sediments. Both field & laboratory data, together with case studies from around the world, will be utilised. 2. Surveying and monitoring issues Sinking process of sediments during disposal is defined as having 3 stages: convective phase, concerning sediments from 1st disposal to time of ocean floor contact. Next phase is dynamic collapse, which illustrates time the material spends spreading across the sea floor. Final phase is passive diffusive phase, whereby sediment spreads across the seabed until this energy is expended, and it settles (Svahnström, 2008). Environmental impact surveys and monitoring are both of utmost importance throughout disposal operations, due to the multitude of ecological and economic issues that could arise. These issues can arise due to any number of variables. This tiered flow chart (below) shows the general monitoring approach recommended by Environment Canada, which aims to ensure monitoring is conducted efficiently and dependably with suitable care given to the environment surrounding the disposal site (Tay et al., 2013): 3. Sediment Type Types of dredged sediments being disposed of will often be the main cause for concern during a disposal operation. The variations in sediment particle sizes can lead to big differences in deposition velocity, leading to a higher possibility of sediments drifting in the water column and effecting other more volatile areas. Cohesive nature of the spoil will impact dispersion rates (Bokuniewicz & Gordon, 1980). Fine-grained cohesive sediments pose problems, as they can both adsorb pollutants and flocculate; the latter altering their depositional and transport characteristics (Manning et al., 2017). E.g., it can re-circulate contaminants in the sediment and finer, looser sediments can move with the currents leading to deposition in protected areas where it may coat reefs and cause die backs with large-scale ecological repercussions.
4. Biological and chemical impacts Disposal operations can, if improperly planned & undertaken, cause biological & chemical issues for marine environments. Biological impacts can be both positive & negative, with both increases & decreases in benthic species abundance across multiple disposal sites in U.K. waters alone, often owing to the type of sediment being disposed (Bolam et al., 2006). Changes in levels of extra-cellular polymeric substances, through bioactivity, can directly affect the cohesivity of sediments. Chemical impacts can stem from a variety of sources: mining and agricultural pesticides to oil leaks. Pollutants and lax marine policies on vessel upkeep, all can lead to toxic anti-fouling paints and other liquids being used to protect vessels. These can leak/flake into marine environments, leading to widespread eutrophication or dangerous toxicity levels, all affecting benthic and epibenthic communities around disposal sites. 3. Summary Study shows that although there are many variables when disposing of sediments, following correct procedures can prevent large scale, long term damage in the environment. Secondly, it shows further research is required to thoroughly quantify the stresses that different sediments (from disposal) can put onto marine ecosystems and the communities that may depend upon them. Acknowledgments AM’s contribution towards this research was partly supported by National Science Foundation grants OCE-1924532 & OCE-1736668, TKI-MUSA project, and HR Wallingford comp. res. FineScale proj. (ACK3013_62). References Bolam, S.G., Rees, H.L., Somerfield, P., Smith, R.,
Clarke, K.R., Warwick, R.M., Atkins, M., & Garnacho, E. (2006). Ecological consequences of dredged material disposal in the marine environment: A holistic assessment of activities around the England and Wales coastline. Mar. Poll. Bull., 52,415–426, doi.org/10.1016/j.marpolbul.2005.09.02
Bokuniewicz, H.J., & Gordon, R.B. (1980). Deposition of dredged sediment at open water sites. Est.Co.Mar. Sci.,10(3),289-303,doi:org/10.1016/s0302-3524(80)80102-2
Manning, A.J., Whitehouse, R.J.S. and Uncles, R.J. (2017). Suspended particulate matter: the measurements of flocs. In: R.J. Uncles and S. Mitchell (Eds), ECSA practical handbooks on survey and analysis methods: Estuarine and coastal hydrography and sedimentology, pp. 211-260, Pub. Cam. Uni. Press, DOI: 10.1017/9781139644426.
Svahnström, E (2008). Dredged material disposal in open water - the physical process and short-term modelling. MSc Thesis, Uppsala Uni., Denmark, 36p.
Tay, K-L., Parrott, R., Doe, K. MacDonald, A. & Hung, Y-T. (2013). Environmental monitoring of nearshore dredged material ocean disposal sites. In: Hbk Env. Waste Man. doi:10.1142/9789814449175_0015

43
Flocs Behaviour in Fluvial to Marine Transition: A Laboratory Study E. Abolfazli¹, R. Osborn¹, K.B.J. Dunne², J.A. Nittrouer², K. Strom¹
1Department of Civil and Environmental Engineering, Virginia Tech, Blacksburg, VA, USA. [email protected]
2Department of Earth, Environmental, and Planetary Sciences, Rice University, Houston, TX, USA
1. Introduction Cohesive mud is a major part of the sediment carried by rivers and deposited in estuarine and marine environments. An important behaviour of cohesive sediment that separates it from its non-cohesive counterpart is its potential to form aggregates known as flocs. Many chemical, biological, and hydrodynamic factors drive size and shape of flocs (e.g., Mietta et al., 2009), making it difficult to calculate their settling velocity and ultimately predict their fate. Here, we aimed to study the effects of salinity and turbulence on floc properties in the lower Mississippi River. 2. Study Site and Experimental Setup The sediment suspended in the water column at the main channel of the lower Mississippi River at Venice, LA, USA was studied in January 2021. Water samples were transported to an experimental setup comprising a mixing tank, a camera system, and an optical backscatter sensor (Figure 1). The camera system captured floc images while in suspension. Floc images were then processed using an automated Python code to obtain floc size distribution and calculate a representative floc median size (d50).
Figure 1: Experimental setup and a sample floc image.
3. Results and Discussion 3.1 Equilibrium Size and Time to Equilibrium The d50 time series indicted that floc size reaches an equilibrium at a given turbulent shear rate (G) and salinity (S) in a matter of hours (Figures 2 and 3), longer than observed for flocs in kaolinite/bentonite mixtures (e.g., Kuprenas et al. 2018, Strom & Abolfazli, 2019). 3.2 Turbulence Shear Rate To study how flocs respond to decreased turbulence due to transition from the riverine environment to the marine environment, G was varied after the equilibrium phase during 2-hour steps. Shorter time to equilibrium was observed at higher G, likely due to the higher frequency of inter-particle collisions that promote aggregation.
Figure 2: d50 time series in the G-variable experiment
3.3 Salinity Flocs are also exposed to higher salinity when the river freshwater mixes with saline marine water. Increased ionic strength in floc suspension promotes flocculation due to shrinking of the double layer surrounding the clay particles. Sea salt substitute was added in increments to the mixing tank to study flocs response. Increasing salinity did not have a considerable effect on floc size, suggesting the presence of other ions in the freshwater and the role of biomatter acting as a binder.
Figure 3: d50 time series in the S-variable experiment
4. Conclusions Turbulent shear rate was found to affect the equilibrium size and time to equilibrium of flocs. Flocs were larger at lower shear rates but reached the equilibrium at a slower pace. Salinity variations did not strongly affect the flocs pointing to the importance of other chemical and biological factors in flocculation. Acknowledgments This project was funded by the National Science Foundation (NSF) award number GLD-1801142. References Kuprenas, R., Tran, D., & Strom, K. (2018). A shear-
limited flocculation model for dynamically predicting average floc size. Journal of Geophysical Research: Oceans, 123(9), 6736–6752.
Mietta, F., Chassagne, C., Manning, A. J., & Winterwerp, J. C. (2009). Influence of shear rate, organic matter content, pH and salinity on mud flocculation. Ocean Dynamics, 59(5), 751–763.
Strom, K., & Abolfazli, E. (2019). Flocculation of mud in water progressing from salinities of 0 to 10 psu. AGU Fall Meeting 2019.

44
Geotechnical properties and constitutive model parameters of deep-sea sediment from the Western Mediterranean Sea
P. Kaminski1, J. Grabe1, M. Urlaub2, T. Sager2
1 Institute of Geotechnical Engineering and Construction Management, Hamburg University of Technology, Hamburg, Germany. [email protected]
2 GEOMAR Helmholtz Centre for Ocean Research, Kiel, Germany
1. Introduction Submarine slopes worldwide have been investigated ex-tensively in order to establish potential causes of failure, for oil and gas exploitation, or in the context of offshore infrastructure projects, e.g. pipeline construction. How-ever, a deeper understanding of the geotechnical bound-ary conditions at the continental slopes with the aim of numerical investigations has been of secondary interest in scientific studies, or the knowledge is not made available due to economic or geopolitical considerations. There-fore, extensive geotechnical testing was performed on a gravity core from the Western Mediterranean Sea. The particularities of marine sediment, such as the occurrence of microfossils, lead to an uncommon soil behaviour that the conventional approaches are not necessarily able to reproduce. Nonetheless, the insights provide for an eval-uation of constitutive model parameters which allow the numerical investigation of large-scale submarine bound-ary value problems. 2. Index Properties The investigated core was taken off the Western coast of Mallorca at 39°09.497’N 2°33.800’E in 492 m water depth during the M69 cruise and extends to 2,95 mbsf. A homogenous clayey silt with a low content of sand in a greyish colour is present along the full core length. The sand and medium to coarse silt fractions are of biogenic origin and thus contain calcareous shells and shell frag-ments of microfossils with an intra-skeletal pore space. The carbonate content of the samples varies between 40-70 %. The high carbonate contents correlate with water contents above the liquid limit due to entrapment of pore water in intra-skeletal pores of intact shells (Tanaka and Locat, 1999). The hollow grains significantly alter the sedimentation behaviour of the particles, posing limita-tions to conventional geotechnical analysis procedures. Furthermore, the permeability of the soil is decreased at a high porosity due to the intra-particular voids, which are not accessible for pore water flow. 3. Consolidation and Compression Behaviour Oedometric testing confirmed a state of normal consoli-dation and the oedometric compression behaviour is not typical for cemented soil despite the high carbonate con-tent. According to Volpi et at. (2003), particle breakage, subsequent expulsion of intra-skeletal water and the for-mation of a more rigid soil structure in the presence of shell shards hinder the consolidation process. As the sam-ples showed a tendency for tertiary compression a more detailed analysis of particle crushing and a stress depend-ency of the grain size distribution is conceived. 4. Shear Strength Drained and undrained triaxial tests were performed at
different consolidation stresses. All samples were sheared to the critical state to allow for the derivation of critical state model parameters. With a critical friction angle φc of 34° this clayey silt shows a high shear strength, which would rather be anticipated in sand. As the oedometric test results show, the high shear strength is not a conse-quence of cementation but rather a result of the rough and interlocking surfaces of the microfossils and particle breakage leading to sharp edged fragments (Rajasekaran, 2005). 5. Constitutive Modelling With the objective of investigating large-scale submarine boundary value problems, initially model parameters for the critical state elasto-plastic Modified Cam Clay model were derived from the test data, being aware that this model – like any established constitutive model –is not able to capture the unique soil mechanical behaviour ex-plained above. Nevertheless, the results of numerically simulated triaxial tests show acceptable agreement. 6. Conclusions Deep-sea marine soils show extraordinary mechanical be-haviour compared to soils occurring in the areas of pre-dominant interest for geotechnical engineering research, and are thus not well described yet. In order to further in-vestigate research questions like slope stability at the con-tinental margins, more sophisticated numerical simula-tions can provide the key to further insights on submarine landslides, for which the first step has been taken with the analysis of model parameters in this study. Acknowledgments This work is part of a DFG-funded (GR 1024/35-1 and UR 226/3-1), cooperative project at Hamburg University of Technology and GEOMAR Helmholtz Centre for Ocean Research and we thank Christian Betzler (Institute for Geology, Hamburg University) for allocating the de-scribed soil samples to our research. References Rajasekaran, G. (2005). Influence of microfossils and py-
rites on the behavior of oceanbed sediments. Ocean Engineering, 33, 517-529.
Tanaka, H., Locat, J. (1999). A microstructural investiga-tion of Osaka Bay clay: the impact of microfossils on its mechanical. Canadian Geotechnical Journal, 36, 493–508.
Volpi, V., Camerlenghi, A., Hillenbrand, C.-D., Rebesco, M., Ivaldi, R. (2003). Effects of biogenic silica on sed-iment compaction and slope stability on the Pacific margin of the Antarctic Peninsula. Basin Research, 15, 339-363.
45
Toe scour at a vertical wall on a vegetated silt beach Z. Peng1,2, Q. He1,2 and X.Y. Wang1,2
1 State Key Laboratory of Estuarine and Coastal Research, East China Normal University, Shanghai, China
2 Institution of Estuarine and Coastal Research, East China Normal University, Shanghai, China [email protected]
1. Introduction Global climate change causes the sea level rise and intensified storms, consequently brings challenges to the traditional coastal defences which lack sustainability and adaptivity. As an alternative, the ecosystem-based coastal defence attracts more attention (Temmerman et al., 2013). Considering that the ecosystem-based coastal defence often requires the combination of vegetation and seawalls, this raises an interesting question ‘how does vegetation impact on toe scour at a vertical wall’, as toe scour is one of the major failure mechanisms of seawalls (Jayaratne et al., 2016). The toe scour at a vertical wall was studied through laboratory tests by Sutherland et al. (2006) over a sandy beach with a 1:30 slope, and by Tsai et al. (2009) over a steeper seabed with a slope of 1:5. The mechanism of toe scour under breaking waves was revealed by Peng et al. (2018) and Ahmad et al. (2019) through numerical modelling. They both found that the partial standing wave and wave breaking are the critical processes of toe scour. Moreover, the maximum toe scour location was affected by anti-clockwise vortex (Peng et al., 2018) and the seawall location (Ahmad et al., 2019). While above work studied the toe scour on a natural beach without consideration of vegetation, previous work discovered that the vegetation could attenuate incoming wave energy (Anderson & Smith, 2013) and accelerate the local sediment deposition (Chen et al., 2012). Hu et al. (2018) further studied the wake structure and sediment deposition behind the vegetation, while Tang et al. (2019) studied wave-driven resuspension in the presence of vegetation. However, those studies focused on the local vegetation area and did not account for toe scour at a seawall behind the vegetation. The vegetation increases the sediment deposition over the vegetation area, thus, reduces the sediment supply in front of the seawall and decreases the local water depth. It is anticipated that the vegetation modifies the local hydrodynamics in front of the seawall and consequently varies the toe scour process at a vertical seawall. Therefore, this study would carry out laboratory tests and numerical simulation, to study the impact of vegetation on toe scour at a vertical seawall. 2. Methodologies This study would employ the coupled wave and sediment transport model developed by Peng et al. (2018) to simulate toe scour at the seawall on a vegetated beach. The flexible vegetation motion is described by a slender rod theory and solved by a Finite Element Method on a Lagrangian grid. The numerical model would be validated against the laboratory tests carried out in wave flume of Hohai University, China. The wave flume is 40
m long, 0.5 m wide and 1.2 m deep. It can accommodate both wave and current simultaneously, together with a silt bed. This study uses the silt (Dn50=0.06 mm) to study the sediment transport, and a set of flexible cylinders to represent Spartina Alterniflora in the tests. Figure 1 shows the setup up of the numerical model and laboratory test.
Figure 1: Set up of numerical model and laboratory tests
Figure 2: Illustration of the impact of sediment deposition on turbulence kinetic energy (TKE) in front of a vertical wall. 3. Data analysis This study would record the characteristic length of scour hole after 100 waves, 500 waves and 1000 waves. The validated numerical model would be used to investigate the effect of vegetation density, width, relative height on the characteristic length of toe scour at a vertical wall. On the other hand, the sediment deposition in a vegetated area likely causes more wave breaking (Figure 2). Subsequently, it causes more bedload transport by plunge wave tongue and more suspended sediment transport by turbulence. Hence, this study would examine the impact of wave breaking over vegetation on toe scour. Ultimately this study would derive a set of relationships in terms of toe scour characteristics, incoming wave conditions and vegetation properties. References Ahmad, N., Bihs, H., Myrhaug, D., Kamath, A., &
Arntsen, Ø. A. (2019). Numerical modeling of breaking wave induced seawall scour. https://doi.org/10.1016/j.coastaleng.2019.03.010
Anderson, M. E. E., & Smith, J. M. M. (2013). Wave attenuation by flexible, idealized salt marsh vegetation. Coastal Engineering, 83, 82–92. https://doi.org/10.1016/j.coastaleng.2013.10.004

46
Sediment dynamics at an estuary mouth: detrending the impact of tides, river discharge and waves from high-frequency measurements.
R. Verney1, F. Grasso1 and C. Gaillard1
1 DYNECO/DHYSED, Ifremer, CS10070 29280 Plouzané, France. [email protected]
1. Introduction Sediment fluxes at the mouth of estuaries are driven by complex 3D processes, e.g. tidal pumping and density circulation. These fluxes can be significantly modulated in presence of waves. The present study investigates the impact of the main hydrological, meteorological and hydrodynamic forcing on the sediment dynamics and fluxes at the mouth of the macrotidal Seine Estuary from in situ high-frequency observation. 2. Methods Two benthic stations were deployed at the mouth of the Seine Estuary, representative of the southern (1) and northern (2) areas (Figure 1). Station 2 is a permanent coastal observatory, deployed since October 2017 and Station 1 is a study-specific deployment, conducted from December 2018 to March 2019. These stations are equipped with Nortek 1MHz upward-looking ADCP and an optical Wetlabs turbidity meter. These sensors record current velocity profiles and turbidity measurements every 10min at station 1 and 30min at station 2, and waves every 30min and 60min respectively. First turbidity measurements (calibrated against samples) are analysed to discriminate the respective impact of tides, waves and river discharge on suspended sediment concentration. Next, sediment bottom fluxes (and 1DV fluxes at station 3) are calculated and discussed.
Figure 1: Location of in situ measurements in the Seine
Estuary mouth. 3. Results Turbidity signals are decomposed by tidal periods, between two consecutive low tides. Each event is then characterized by a tidal range, a river discharge and a statistical proxy of wave conditions over the tidal cycle (90th percentile of wave shear stress). Tidal patterns of turbidity are then evaluated for calm conditions, and for given tidal range/river discharge ranges: every 0.5m from 2m to 8m and every 200m3/s from 0 to 1600m3/s, respectively. These patterns emphasize the importance of tidal currents on sediment resuspension and the impact of river
discharge that shifts the estuarine turbidity maximum downward in the mouth (during high river flow), hence increasing the mass of sediment in suspension for similar tidal ranges. These patterns are then used to reconstruct a tidal/river discharge-driven turbidity signal. This signal is compared to the raw measurements to generate a detrended turbidity signal and evaluate anomalies. This method better illustrates the influence of waves and provides estimation of the inertial effect of waves on sediment in suspension (Figure 2). It also emphasizes the hysteresis in sediment suspension along fortnightly cycles.
Figure 2: Turbidity anomalies from tidal-detrended
signal at station 1 Bottom sediment fluxes are observed to be mainly landward at both stations, while fluxes are significantly (x4) larger at station 1 than at station 2. Fluxes are the strongest during spring tides, but also observed to be high during high river discharge, due to reinforced baroclinic circulation. Wave events contribute to reduce landward fluxes or generate an export of sediment toward the bay. These observations confirm 3D model results examined in Schulz et al., 2018. 4. Conclusions Long-term high-frequency observations provide crucial knowledge to discriminate the relative impact of physical forcing on sediment dynamics. They can further be used to identify hydro-meteorological extreme events and their consequences on sediment exchange along the land-sea continuum. 5. References Schulz, E., Grasso, F., Le Hir, P., Verney, R. and
Thouvenin, B. (2018). Suspended sediment dynamics in the macrotidal Seine estuary (France) - Part 2: Numerical modelling of sediment fluxes and budgets under typical hydrological and meteorological conditions. J. Geophys. Res.: Oceans. 123 :578–600

47
How are fines buried in a sandy seabed? H.C.M. Hendriks1,2, B.C. v. Prooijen1, C.H. Cheng3, S.G.J. Aarninkhof1, J.C. Winterwerp1 and K.E. Soetaert3
1 Department of Hydraulic Engineering, Delft University of Technology, Delft, Netherlands. [email protected]
2 Department of Marine and Coastal Systems, Deltares, Delft, Netherlands 3 Department of Estuarine and Delta Systems, Royal NIOZ, Yerseke, Netherlands
1. Introduction Fine cohesive sediments play an important role in the ecological functioning of coastal ecosystems, even when the seabed is predominantly sandy. Once fines are mobilized from the seabed, for instance by human activities or during storms, turbidity increases. The associated negative effects on pelagic fauna are often estimated by using water quality models coupled to sediment transport models (Sanford, 2008; Kessel et al., 2011). Crucial in these models is the quantification of the fluxes of fines into and from the sandy seabed. The processes governing these fluxes are largely unknown, thereby hampering the ability of these models to predict the residence time of fines in the system and thus the area affected by human activities. Therefore, this study aims to determine the mechanisms behind the flux of fines into the seabed, referred to as burial. Based on these mechanisms, we aim to improve model formulations. 2. Methods We conducted two field campaigns in 2017, situated at a 9-kilometre long cross-shore transect, offshore of Egmond aan Zee (The Netherlands). These consisted of a combination of seabed sampling, hydrodynamic measurements and bathymetric surveying. For the seabed sampling, two different methods were used: multicore sediment sampling and Sediment Profiling Imagery (SPI). The multicore device allows to collect multiple sediment cores within a meter distance, while the SPI images provide images of the upper seabed structure. Hydrodynamic measurements were done with a lander equipped with an ADV and ADCP. Turbidity was measured with OBSes and a LISST. Bathymetry was mapped using sidescan sonar and multibeam echo sounding. Wave conditions are provided by a nearby wave buoy. 3. Results The seabed samples show that the presence of fines in the seabed varies greatly, both in space and time. The spatial variation is not only present on a large scale (kilometres), but also on a small scale. The multicore sediment samples reveal that fines percentage in the upper 10 cm of the seabed can vary up to a factor 3 within a metre. Over the vertical, fines are present in the seabed as distinct patches. The vertical patchiness is quantified by dividing the sediment samples into 1- to 2-cm thick slices. These results are further supported by Sediment Profiling Imagery (SPI). Figure 1 clearly shows the variability in seabed structure in the upper seabed. The patches of fines are distinguishable from the sandy substrate as they have another colour and texture.
Figure 1: (left) grayscale SPI image taken 2.5 km offshore of Egmond aan Zee in June 2017. It shows two patches of fines in an otherwise predominantly sandy seabed. (right) false-color of grayscale image, highlighting the patches of fines in the seabed (in gray and red).
Figure 2: Hm0 and SSC at Egmond aan Zee in June 2017 4. Interpretation Our observations indicate that fines are trapped in patches in the sandy seabed. Local bedforms play a crucial role. In the wake of storms, the reconfiguration of storm-induced mega-ripples back to current-induced ripples is the main mechanism of burying fines within a sandy seabed. This reconfiguration takes place within several days after a storm. The timescale of this mechanism corresponds with the observations of the sediment concentration in the water column. These observations indicate that suspended sediment concentrations return to pre-storm values within several days to a week (Figure 2). The reconfiguration of bedforms explains the large variability in fines percentage in the seabed, both vertically and horizontally. Combined with the distinct patches of fines we observed, it advances our knowledge on the exchange of fines with a sandy seabed. References van Kessel, T., Winterwerp, J. C., van Prooijen, B.C., van
Ledden, M., Borst, W. (2011). Modelling the seasonal dynamics of SPM with a simple algorithm for the buffering of fines in a sandy seabed, Continental Shelf Research, 31 (10), S124-S134.
Sanford, L. P. (2008). Modeling a dynamically varying mixed sediment bed with erosion, deposition, bioturbation, consolidation, and armoring. Computers and Geosciences, 34(10), 1263–1283.

48
Reworking of cohesive turbiditic deposits in the Cassidaigne submarine canyonby internal and regional currents
R. Silva Jacinto1, B. Dennielou1 I. Pairaud2 and P. Garreau2
1 Géologie Marine and 2 Laboratoire d’Océanographie Physique et Spatiale, Ifremer Centre de Bretagne, France.
1. IntroductionSubmarine canyons are common morphological features
incising continental slopes. They may start from shallow
waters (i.e. submitted to wave action), littoral settings
(i.e. submitted to rivers plumes) or even estuaries (i.e.
exposed to turbidity maximum). They link continental
platforms to the deep sea and are the major pathway for
turbidity currents and hence sediment transport. These
sediment-laden gravity flows are able to sculpt the
continental margins, submarine canyons (Guiastrennec-
Faugas et al., 2020) and eventually produce the largest
sediment accumulations of the planet. They determine,
beside the transported sediment, the transfer to the deep
sea of globally relevant amounts of organic carbon,
oxygen, nutrients and pollutants (Kane et al. 2020).
The study of turbidity flows, much based on their
deposits and sediment archives, have been neglecting
the interaction with the highly dynamic ocean they are
flowing through (Miramontes et al., 2020). The physical
investigation of the way gravity-driven flows and along-
slope (i.e. contour) currents interact is an opening
research field. Beside regional contour currents, canyons
may locally trap energy and momentum: internal tides,
quasi-inertial waves and upwellings are canyon-specific
flows that may modulate the sediment transfer to the
deep sea.
Here, we are presenting monitoring data from the
Cassidaigne submarine canyon (Gulf of Lions, French
Mediterrannean) in order to identify how ocean flows
may remobilise sediment previously brought by gravity-
driven turbidity currents. The Cassidaigne canyon is
used as a field-scale laboratory. From 1967 to 2015,
exogenous residual red mud from the industrial
treatment of bauxite ore was rejected in the canyon at
320 m of water depth. The estimated 35 mega-tonnes of
red mud outflow generated an extended turbiditic system
with characteristic deposits.
These red muds are now used as a proxy of how
hydrodynamics in a submarine canyon, induced by
regional ocean circulation and meteorological events,
may eventually affect turbiditic systems and their
deposits.
2. Field work and monitoringThe CassiSed cruise was carried out in 2019. Three
moorings were deployed at 420, 1628 and 1906 m of
water depth, from March to August. Moorings were
mounted with downward listening ADCPs at least 100
m above the sea bed, sediment traps 30 m above the sea
bed and turbidimetres. A fourth ADCP, listening
upwards was deployed on the platform close to the
canyon head.
In April and August, cores (piston and multicorer) were
obtained on canyon’s thalweg, terraces and sedimentary
ridge. Using an AUV-mounted multibeam echo sounder
and chirp, a detailed bathymetry, backscatter imagery
and seismic profiles were obtained in order to estimate
the extension of the turbiditic systems generated by the
rejected red muds.
3. ResultsThe red muds rejected in the Cassidaigne submarine
canyon for nearly 50 years have generated an artificial
turbiditic system that mimics usual features and
morphologies in natural gravity fed systems. The
turbidity currents have generated knickpoints, low
terraces and overspilled to upper terraces and above the
sedimentary ridge.
Nevertheless, probably after 2015 and the end of red
mud rejections, transport towards the canyon from the
platform, where bottom currents are stronger (Fabri et
al., 2017), have fed newly dominant gullies and
modulate the main channel. Showing that local oceanic
circulation on the continental platform may contribute
to, and overwrite, the canyon’s gravity-generated
morphologies.
During recorded energetic periods in the canyon, as
upwellings induced by meteorological events, fluxes on
the sediment traps are much larger than on the open
slope and are rich in red sediments.
The obtained data will be used to improve gravity-
driven and 3D numerical models in the canyon which
should provide a horizontally extended interpretation of
the observed sedimentary dynamics induced by regional
circulation within turbidity systems.
ReferencesFabri M.-C., Bargain, A., Pairaud I., Pedel L. , Taupier-
Letage, I, (2017). Cold-water coral ecosystems in
Cassidaigne Canyon: An assessment of their
environmental living conditions, Deep Sea Research
Part II, 137, 436–453.
Kane I.A., Clare M.A., Miramontes E., Wogelius R.,
Rothwell J.J. Garreau P., Pohl F. (2020) Seafloor
microplastics hotspots controlled by deep-sea
circulation. Science 5 Jun 2020 Vol.368 Issue 6495,
pp. 1140-1145.
Guiastrennec-Faugas L., Gillet H., Peakall J., Dennielou
B., Gaillot A., Silva Jacinto R. (2020). Initiation and
evolution of knickpoints and their role in cut-and-fill
processes in active submarine channels. Geology
(2020) doi: https://doi.org/10.1130/G48369.1
Miramontes E., Eggenhuisen J.T., Silva Jacinto R.,
Poneti G., Pohl F., Normandeau A., Calvin Campbell
D., Javier Hernandez-Molina F. (2020) Channel-levee
evolution in combined contour current-turbidity
current flows from flume-tank experiments. Geology
(2020) 48(4):353-357.

49
Feedback loops arising from sand-mud interaction cause bimodal mud contents A. Colina Alonso1,2, D. S. van Maren3,1,2, P.M.J. Herman1,2, R. J. A. van Weerdenburg2, Y. Huismans2, Z. B. Wang1,2
1 Delft University of Technology, Delft, the [email protected]
2 Deltares, Delft, the Netherlands 3State Key Lab of Estuarine and Coastal Research, East China Normal University, Shanghai, China
1. Sand-mud systems Bed sediments in estuaries and tidal basins often consist of a mixture of sand and mud. The sediment composition governs sediment mobility, hence sediment transport and morphological evolution. Besides, interactions introduce complex feedback loops between the sediment composition and morphology. The substrate for instance, influences biological activity in the bed, which in turn also influences bed level morphodynamics. Moreover, mud particles influence the erodibility of sand, and sand particles the erodibility of mud. In this research, we explore the complex interaction processes resulting from these latter abiotic feedbacks in more detail, using data from the Wadden Sea and a numerical model. 2. Two equilibrium states The mud content of the Wadden Sea tidal flats is bimodally distributed, showing that bed sediments tend to be either mud-dominated or sand-dominated (Figure 1). This bimodal distribution has remained remarkedly stable over the past decades. Bimodality is also found in other systems, such as for the flats of the Western Scheldt. Beds with a mean mud content close to one of the two peaks are relatively stable in time, whereas observations with a mean mud content in-between the peaks have a higher standard deviation. This suggests that the system is bi-stable with two stable equilibrium conditions, and an unstable state in between. We hypothesize that these stable and unstable conditions result from feedback loops. 3. Feedback loops by sand-mud interaction We study two physical mechanisms related to sand-mud interaction that may act as feedback loops and enhance the observed bimodality of the mud content. These are
investigated by means of numerical simulations with a schematized Delft3D model of a tidal basin. The first mechanism is related to the erodibility of sediment mixtures, based on the theory of van Ledden (2003). Sand-mud mixtures can be cohesive or non-cohesive, depending on the clay content (2 regimes). Erosion of sand and mud are interdependent within each regime. Maximum erosion rates occur at the transition between the two regimes, promoting either low or high mud contents in the bed. The second mechanism is related to the hydraulic roughness of the bed: muddy beds are smoother, leading to lower bed shear stresses and therefore promoting less erosion of mud. Model results show that both mechanisms can cause a bimodal distribution of the mud content, which is not obtained without accounting for sand-mud interaction. This bimodality is most pronounced for the second mechanism, which also strongly promotes mudflat growth. Transitions between sandy and muddy areas are also more abrupt because of sand-mud interaction. 4. Concluding remarks Feedback loops induced by sand-mud interaction influence the morphodynamic development and sediment composition of tidal basins. Understanding the evolution of estuaries and tidal basins, and the spatial segregation of sand and mud, therefore requires accounting for these feedback loops. References Van Ledden, M. (2003). Sand-mud segregation in estuaries and tidal basins (PhD thesis). Delft University of Technology, Delft.
Figure 1: Left panels: location and bathymetries of the Wadden Sea, the Western Scheldt and the modelled tidal inlet. Right panels: distribution of the mud content in the bed, after log-transformation. Only models with sand-mud
interaction reproduce a bimodal mud distribution.

50
Regime shifts in sediment concentrations in the Changjiang Estuary J. Lin1, 2, B.C. v. Prooijen2, L. Guo1, C. Zhu1, 2, Q. He1, Z.B. Wang1, 2, 3
1 State Key Laboratory of Estuarine and Coastal Research, East China Normal University, Shanghai 200241, China.
2 Faculty of Civil Engineering and Geosciences, Delft University of Technology, Delft, Netherlands 3 Deltares, Delft, Netherlands
[email protected] 1. Introduction Many estuaries were deepened to accommodate larger ships. After the deepening, a regime shift from low- to hyper-turbid states was observed, e.g., in the Ems Estuary (Netherlands, Germany) and Loire Estuary (France) (Winterwerp et al., 2013). Winterwerp and Wang (2013) attributed this transition to the positive feedback between tidal deformation, sediment import and drag reduction. Their hypothesis has been validated by numerical modelling (van Maren et al., 2015; Dijkstra et al., 2019). However, the regime shift to date was mainly observed in tide-dominated estuaries, where the sediment import is driven by tidal pumping (Winterwerp and Wang, 2013). It remains unclear whether the regime shift will occur in estuaries with large runoffs, the underlying process for its sediment import, and how the imported sediment is maintained in suspension. 2. Results In this study, we focus on the Changjiang Estuary (with a mean river discharge of 28,000 m3/s), where the channel was deepened from 8.5 m in 1997 to 12.5 m in 2010. 2.1 Transition in SSC profile Historical observations (1988-2015) show a shift of regime in suspended sediment concentrations (SSC) in the Changjiang Estuary, with increasing SSC near the bottom and decreasing SSC in upper water columns (Figure 1). Our observations suggest a constant and minimal friction/drag coefficient within SSC of 10-80 kg/m3.
Figure 1: Schematic diagrams show entrainment/erosion and settling before (a) and after (b) deepening, explaining the transition in profiles of suspended sediment concentration (red lines). 2.2 Response of sediment transport By sediment flux decomposition, enhanced estuarine circulation and increasing near-bed SSC are identified as the controlling mechanisms driving the sediment import
after the deepening in the Changjiang Estuary (Figure 2).
Figure 2: Tidally averaged sediment fluxes by residual flow (blue) and tidal pumping (red) before (a) and after (b) the Deep Waterway Project. 3. Conclusions 1) A regime shift was observed in the Changjiang
Estuary, decreasing SSC in upper water columns and increasing one near the bed.
2) The friction/drag coefficient is constant and minimum within SSC of 10-80 kg/m3, with a drag reduction of 60-80%.
3) Estuarine circulation controls the sediment import in the Changjiang Estuary.
4) Tidal pumping facilitates the extension/separation of estuarine turbidity maximum.
Acknowledgements This work is supported by the PSA project between China (2016YFE0133700) and Netherlands (PSA-SA-E-02). References Dijkstra, Y.M., Schuttelaars, H.M., Schramkowski, G.P.,
Brouwer, R.L. (2019). Modeling the transition to high sediment concentrations as a response to channel deepening in the Ems River Estuary. Journal of Geophysical Research: Oceans, 124, 1–17.
van Maren, D.S., Winterwerp, J.C., Vroom, J., 2015. Fine sediment transport into the hyper-turbid lower Ems River: the role of channel deepening and sediment-induced drag reduction. Ocean Dynamics, 65, 589–605.
Winterwerp, J.C., Wang, Z.B., 2013. Man-induced regime shifts in small estuaries - I: theory. Ocean Dynamics, 63, 1279–1292.
Winterwerp, J.C., Wang, Z.B., van Braeckel, A., van Holland, G., Kösters, F., 2013. Man-induced regime shifts in small estuaries - II: a comparison of rivers. Ocean Dynamics, 63, 1293–1306.

51
Evaluation of the Krone-Partheniades Model: Using Field Observations to Estimate Erosion and Deposition Fluxes
Zaiyang Zhou1,2, D.S. van Maren1,2,3, Jianzhong Ge1, Pingxing Ding1 and Zheng Bing Wang2,3
1 State Key Laboratory of Estuarine and Coastal Research, East China Normal University, Shanghai, China. [email protected]
2 Department of Hydraulic Engineering, Delft University of Technology, Delft, Netherlands. 3 Department of Marine and Coastal Systems, Deltares, Delft, Netherlands
1. Introduction The well-known Krone-Partheniades (K-P) bed level change model (Ariathurai, 1974; Krone, University of California, & University of California, 1962; Partheniades, 1965) and its varied versions are widely applied in cohesive sediment environments to simulate bed level changes. Currently, most morphodynamic models apply the K-P framework with constant parameters. This may cause several problems. First, constant parameters cannot reflect the variability of sediment properties which is important in short term simulations of bed level changes. Second, there is a non-uniqueness problem, i.e. multiple parameter sets can result in equally good results. This will reduce the capacity of prediction and the liability of models. This study provides a methodology to estimate erosion and deposition fluxes based on in-situ observations. Moreover, a visualization method is proposed to find all possible parameter sets of K-P model. 2. Method In-situ observations with a tripod system (Figure 1) were conducted.
Figure 1: Top view and side view of the tripod system. By fitting the predicted bed level changes with the measured values, constant and time-varying parameters can be obtained, therefore erosion and deposition fluxes can be estimated. 3 Results
Figure 2: (a) SSC, (b) bed shear stress, and (c) relative
bed level (RBL, left y-axis) and erosion/deposition rates (right y-axis, in yellow bars).
Compared to spring tidal conditions, bed shear stress was very low (< 0.5 N/m2) in neap tidal conditions (Figure 2). During the whole observation, the erosion rate was about 5 - 10 mm/hour, the deposition rate was about 7 - 15 mm/hour.
Figure 3: (a) Simulated RBL with constant parameters and time-varying parameters, and measured RBL in 2017, (b) erosion and (c) deposition fluxes. Differences between erosion and deposition fluxes calculated with constant or time-varying parameters were not very obvious (Figure 3b and 3c). 3. Summary
A unified methodology for erosion and deposition fluxes estimation is proposed.
The validity of constant parameters in short term simulation of bed level changes is evaluated.
A visualization method is proposed to improve the parameterization of the K-P model.
References Ariathurai, C. R. (1974). A finite element model for
sediment transport in estuaries. University of California, Davis.
Krone, R. B., University of California, B. H. E. L., & University of California, B. S. E. R. L. (1962). Flume Studies of the Transport of Sediment in Estuarial Shoaling Processes: Final Report. Hydraulic Engineering Laboratory and Sanitary Engineering Research Laboratory, University of California. Retrieved from https://books.google.nl/books?id=-IkLAQAAIAAJ
Partheniades, E. A. (1965). Erosion and Deposition of Cohesive Soils. Jour of the Hydraulics Div, 1(4), 190–192.

52
Working with nature - investigating agitation dredging as a methodology for sediment recycling in a small estuary system with a large port
J. Spearman1, T. Benson1 and J. Taylor1
1 HR Wallingford, Wallingford, UK. [email protected]
1. Introduction The Stour and Orwell Estuaries in the South-East of the UK are Special Protection Areas and Ramsar sites and converge at Harwich Harbour, where the Port of Felixstowe is located (Figure 1). The previous deepening of the berths and approaches to the Port of Felixstowe in 1998/2000 resulted in regulatory agreements for a proportion of the maintenance dredge material to be recycled within the estuaries to offset the potential effects of the deepening on sediment supply to the local intertidal areas. This sediment recycling has been found to be effective in promoting the net increase in intertidal area in the estuary system (Spearman et al., 2014,2015).
Figure 1: Harwich Harbour and the Port of Felixstowe
The present sediment recycling methodology consists of the release into the water column of around 50,000 tonnes/yr of fine sediment from small (1,500 m3 capacity) trailer suction hopper dredgers, releasing on the flood tide in a number of campaigns throughout the year. Though shown to be effective, this methodology may not be optimal. The vast majority of the sediment that is dredged from the approaches is still placed offshore, rather than kept within the estuary system, and the use of a small TSHD is not economically efficient With the idea of improving the efficiency of sediment recycling within the estuary system, Harwich Haven Authority, who are responsible for the maintenance of the approaches to the Port of Felixstowe, undertook a trial of an agitation dredging approach in October/November 2021. These trials investigated the effectiveness of agitation dredging for maintaining depths but also involved detailed monitoring of currents, sediment and dredging plumes to enable the effectiveness of the new dredging method for sediment recycling to be identified. This paper is concerned with the latter and will describe the modelling and monitoring studies undertaken with respect to the sediment recycling. 2. Monitoring Studies The monitoring undertaken during the trial included:
Transect measurements of currents and suspended sediment concentrations using ADCP. Concentrations were measured by converting the ADCP backscatter using SEDIVIEW software.
Characterisation monitoring of the plumes from the agitation dredger using sediment profiling, water
samples and by taking transects of ADCP backscatter and converting these to suspended sediment using SEDIVIEW.
3. Modelling The numerical modelling undertaken built on the 3D TELEMAC3D morphological model developed by HR Wallingford to investigate the effects of the proposed new deepening of the approaches to the Port of Felixstowe, and to investigate the effects of sediment recycling (HR Wallingford, 2019a, 2019b). This model has been validated against a variety of datasets including 10 years of morphological change in the Stour and Orwell. The model was re-validated against the 2020 ADCP transect measurements and water levels and then adapted to represent the plumes from the agitation dredger. The validated model was then used to re-evaluate the decadal impact of the sediment recycling using the agitation methodology. 4. Conclusions The most important conclusion from these studies is that detailed modelling and monitoring can be used to inform estuary management decisions about long term effects which may not otherwise be identifiable for many years. Modelling and analysis of the effects of the agitation dredging are ongoing. The paper will present the results and conclusions of the modelling together with a comparison of the long term effects of sediment recycling from the trialled agitation dredging with that of the present sediment recycling methodology. Acknowledgments The authors would like to acknowledge the kind cooperation of Harwich Haven Authority in the writing of this paper. References HR Wallingford (2019a) Improve geomorphological
modelling for Harwich Haven, Phase 3: Effect of sediment recycling on estuary morphology, Report DER5779-RT007-R03-00, August 2019.
HR Wallingford (2019b) Harwich Approach Channel Deepening, Impact of approach channel deepening on estuary morphology, Report DER5779-RT006-R02-00, March 2019.
Spearman, J., Baugh, J., Feates, N., Dearnaley, M., Eccles, D. (2014). Small Estuary Big Port - Progress in the management of the Stour-Orwell Estuary system, Estuary Coastal and Shelf Science, 150: 299-311
Spearman, J., and Baugh, J.V. (2015). Sediment recycling to mitigate the effects of harbour deepening on habitat and what happened over the following 15 years. In: CEDA Dredging days 2015, 5-6 November 2015, Rotterdam, The Netherlands.

53
54
The forgotten ones from the ports: The filter feeders at the heart of siltation processes.
V. Hamani1, I. Brenon1, T. Coulombier1, J.R. Huguet1, L. Murillo1
1LIENSs UMR 7266, CNRS-La Rochelle Université, 2 Rue Olympe de Gouges, 17000, La Rochelle, France. [email protected]
1. Introduction Siltation is a major concern in the dynamic and complex socio-ecosystems which are the ports. The mud must be regularly dredged to avoid disturbing navigation. The sediments are carried by the waters entering in the port and are partially trapped by the structures that make up this port. The siltation is conditioned by many environmental factors, widely described in the literature: sediment inputs, internal and external hydrodynamics, weather, salinity etc. (Van Maren et al., 2009, Van Rijn, 2016, Huguet et al., 2020). Numerous studies have been carried out on the physical factors that condition siltation in port areas. However, few are interested in the roles of biotic factors in the formation of mud. Though, research in other contexts shows that organisms, abundant under pontoons, such as bivalves and tunicates could play an important role in this siltation process (Forrest et al,. 2007, McKindsey et al,. 2009). These organisms all belong to the filter feeders’ group: they are suspension feeders. They are characterized by the fact that they filter the water to collect their food. The sediments sucked in by the filter feeders are grouped during digestion in the feces or upstream, by the mucus, in the pseudo-feces. These rejections, called bioproducts, settle more efficiently and are involved in the composition of the mud. The aims of this study are to highlight the role of filter feeders in the siltation process in port areas and to try to know the factors that influence their production in bioproducts. 2. Experimental design To study the role of the filter feeders in siltation processes, an experimental analysis was carried out in the largest marina in Europe. It is divided into four basins with distinct filter feeders’ communities and environmental conditions, which allows a detailed study of the environmental factors that influence the production of bioproducts. This analysis consisted in recovering and studying the bioproducts of the filter feeders using sediment traps fixed under the pontoons. In order to know precisely the evolution of this biological production sixteen campaigns were carried out from January to March 2020 and May to July 2020. For each campaign 50 sediment traps were deployed. To understand what influences the quantity of bioproducts formed, a precis census of the filter feeders present under each pontoon was carried out. Meteorological and hydrodynamic data were also collected for all the campaigns. In parallel, a laboratory experiment was set up. This study consists of keeping individuals of this marina’ most common species (oyster, scallop, ascidia and mussel) in aquariums and studying their bioproducts. Firstly, the
structure and the sedimentation rate of the bioproducts is studied by image analysis. These bioproducts are recovered to study their composition. This second step will focus on the carbohydrates and proteins that are involved in the structure and texture of these bioproducts and consequently affect those of the mud. 3. Results The total amount of dry matter (dried bioproducts) produced is constant between seasons and is approximately 140 g/m2/d. On the scale of this marina, this would represent a total daily production of 3.4 tons. However, there is a variation in the amount of dry matter produced between pontoons and between campaigns. This is closely correlated to the hydrodynamics of the port but is also influenced by factors such as salinity. 4. Conclusions Understanding the factors that govern the production of mud is a major issue in ports. In these hyper-anthropic environments where life seems to have no place, the roles of the organisms that live there are often ignored. However, significant communities grow, out of sight, protected by the pontoons and some, as highlighted here, seem play an important role in siltation processes: the filter feeders. Acknowledgments This work was supported from bodies such as la Rochelle's marina, French Ministry of Higher Education and Research, Musée Mer Marine to Bordeaux, European Regional Development Fund, regional state plan, National Centre for Scientific Research. References Forrest, B., Elmetri, I. (2007). Review of the Ecological
Effects of Intertidal Oyster Aquaculture Review of the Ecological Effects of Intertidal Oyster Aquaculture. Prepared for Northland Regional Council, Cawthron Report No. 1275, (1275), 25 pp.
Huguet, J. R., Brenon, I., Coulombier, T., Hamani, V. (2020). Dynamics and management of siltation in a macro-tidal marina: The case of La rochelle marina, France. Ocean and Coastal Management, 198(September).
McKindsey, C. W., Lecuona, M., Huot, M., & Weise, A. M. (2009). Biodeposit production and benthic loading by farmed mussels and associated tunicate epifauna in Prince Edward Island. Aquaculture.
Van Maren, D. S., Winterwerp, J. C., Sas, M., Vanlede, J. (2009). The effect of dock length on harbour siltation. Continental Shelf Research, 29(11–12), 1410–1425.
Van Rijn, L. C. (2016). Harbour siltation and control measures. Online, (May), 1–25.

55
Experimental studies on the sedimentation and consolidation behaviour of fluid mud in the port of Hamburg
D. M. Nguyen1, J. Grabe1, N. Ohle2 and U. Schmekel2
1 Institute of Geotechnical Engineering and Construction Management, Hamburg University of Technology, Hamburg, Germany. [email protected]
2 Department of Waterside Port Infrastructure, HPA Hamburg Port Authority, Hamburg, Germany
1. Introduction Due to the world’s increase of ship traffic and the demand for the logistics of goods, the size of ship vessels is growing rapidly. This leads to the necessity of expanding the nautical bottom for both fairways and the berth areas in ports and harbours of the Elbe estuary. The consequence is more frequent and more intensive maintenance dredging, which causes immense financial and environmental impacts on the local port. Fluid mud is a highly concentrated mixture of clay minerals, organic matter, water, silt and sand, and therefore behaves as a (non-Newtonian) fluid (Shakeel et al., 2019). Constant sonic depth sounding has shown that, over time, a fluid mud layer forms over a solid sediment bed. As navigability is normally bounded by the nautical bottom, predicting the extent to which a ship vessel can enter the fluid mud layer without losing its buoyancy or stability could reduce the need for and optimise extremely costly and invasive dredging procedures. This requires that the fluid mud retains its fluid character and neither settles nor consolidates. The aim of this experimental study is to predict the formation of a solid sediment bed, especially considering the load impact of ship vessels, and outline the key parameters that influence the process of consolidation and sedimentation. Therefore, a series of experimental test on the sedimentation and consolidation of fluid mud were conducted in a newly designed column oedometer (e.g. Figure 1). 2. Material In total, 20 different fluid mud samples with = 1.12 – 1.25 g/cm3 and 8.71 – 12.57 % in loss on ignition were studied, mainly taken from the Köhlfleet harbour (Hamburg, Germany) over a period of 1 year. The conducted rheometer tests confirmed that fluid mud has complex rheological characteristics and shows viscoelastic and thixotropic behaviour. Depending on the composition of the fluid mud yield stresses 0 = 3.0 – 60 Pa were determined. 3 Methodology Figure 1 shows the experimental setup. In order to achieve the aforementioned goals an oedometer cell of 1.0 m height and a diameter of 0.24 m is designed as a modified settling column, where different boundary conditions, e.g. oedometric compression, water depth and drainage conditions, can be manipulated. The column oedometer is able to apply different stress levels u(t) (= pressure related to the actual water level) in the fluid mud sample in order to simulate different hydrodynamic conditions of the Elbe estuary. To quantify the formation of a solid sediment bed, effective stresses were obtained by measuring total and pore water stresses in the fluid mud column. Once fluid mud settles, a mechanical soil
structure should be built up and an increase in effective stress should be observed.
3. Conclusions Depending on the composition of fluid mud (density, organic matter, viscosity), soil genesis was detected in a small area at the bottom of the column after several hours. Eventually, a uniform change in the state of aggregation, from fluidised to solid, can be observed, considering the accumulation of effective stresses. The sedimentation and the simultaneous consolidation of fluid mud happen rather naturally with time and cannot be expedited by external loading (e.g. by a ship vessel). The latter only leads to a significant increase of excess pore pressure in the oedometer cell, which cannot realistically occur under natural conditions. Moreover, experimental tests have shown that sedimentation processes of cohesive sediments are mainly affected by rheological mud behaviour and flocculation processes. These results represent the first steps towards a potential use of the fluid mud layers for navigation purposes. Acknowledgments This study is part of the project Nautical Depth in the Port of Hamburg, coordinated and funded by the HPA Hamburg Port Authority. References Shakeel, A., Kirichek, A. & Chassagne, C. (2019).
Rheological analysis of mud from Port of Hamburg, Germany. Journal of Soils and Sediments, 1-10.
PIANC (2014). Harbour Approach Channels - Design Guidelines, Report 121, PIANC, Brussels.
Figure 1: Column Oedometer test stand: (1) Load plate, (2) Oedometer cell, (3) Total Stress
transducer, (4) Pore water pressure transducer, (5) Filter bed, (6) Backpressure controller, (7) Tidal
curve

56
Investigating Sedimentation in Bushehr Port Access Channel, Adopting Periodic Sonar Surveys and Numerical Simulations
A. Farhangmehr1, S. A. Haghshenas2* and E. Zarinfar2
1 Oceans Research, University of Tehran Science and Technology Park, Tehran, Iran. [email protected] 2 Institute of Geophysics, University of Tehran, Tehran, Iran. [email protected] and [email protected]
* Corresponding Author
1. Introduction Bushehr Port is located in south of Bushehr Bay, which is covered by a consequence of sand and muddy deposits (Figure 1). The unique L-shaped access channel of the port with a length of 16 km is highly affected by heavy sedimentation with an approximate rate of 800,000 m3/year. The channel was dredged to the depth of -11 m (CD) in 2008. Since the trapping efficiency increases immediately after capital dredging, the annual maintenance dredging requirement for the navigation channel exceeds one million cubic meters per year. The tidal range is about 3 m with diurnal pattern and the highest current speed in the internal channel may reach 1.5 to 2.0 m/sec, during ebb and flood conditions. The power of wind usually reaches to 6 in Beaufort scale, but it may rarely border on 8.
Figure 1: Bushehr Port and the access channel.
This study concentrates on lessons learned from investigating a comprehensive set of periodic sonar datasets from the channel as a sediment trap in a sandy/muddy environment and numerical simulations are employed to generalize the captured trends. 2. Periodic Hydrography Survey Analysis Periodic hydrography surveys from 2008 to 2019 were collected and analysed to obtain a better understanding of the channel morphodynamics. Figure 2 (a) shows a selected bed profile along the alignment of the access channel. It shows relatively high sedimentation, with approximate bed level change of 4 meters in the outer channel; however, the interior channel has experienced erosion in the study period. Double frequency echogram and comparison against high frequency (200 kHz) hydrography in 2008 (immediately after dredging) and low frequency (33 kHz) hydrography in 2017 are shown in Figure 2 (b). As two single frequency profiles coincide, and the high frequency ray easily penetrated in fine muddy sediment, the black shaded area in echogram is the muddy material which has been collected during the 10-year period. The combination of in-situ observation, core sampling and periodic sonar investigations provide a realistic estimation of sedimentation in the study area.
Figure 2: (a – top) a depth profile along the access
channel (2008 – 2019); (b – bottom) sample double frequency survey echogram.
3. Numerical Modelling In this study, the process based numerical finite volume model, Delft3D (Deltares, 2014), is used for simulation of the siltation process. By using the online hydrodynamic model of waves and currents of Delft3D software, 2DH wave-induced currents and tidal currents are introduced to the model. The simulated bed level change in Bushehr Bay is depicted in Figure 3. The sediment transport model was validated against the rates obtained from periodic hydrography survey analysis.
Figure 3: Bed level change simulation.
3. Conclusions The model is well capable of predicting sedimentation rates in the access channel. It is concluded that both suspended load and bed load contribute to the sedimentation process under different environmental conditions. References Deltares (2014). Delft 3D-Flow User Manual, Delft
Hydraulic, 684 p.

57
Siltation processes of dredged navigation channel at estuarine port Y. Nakagawa1, T. Kosako1 , and T. Watanabe2
1 Coastal and Estuarine Sediment Dynamics Research Group, Port and Airport Research Institute, Yokosuka, Japan.
[email protected] 2 Niigata Port and Airport Office, Hokuriku Regional Development Bureau, Ministry of Land, Infrastructure, Transport
and Tourism, Niigata, Japan
1. Introduction The present study focused on the siltation process at the navigation channel for the Port of Niigata in Japan, where the discharged sediments through the river causes regular maintenance dredging. One of the specific features of sedimentary process along the dredged channel in the port is summarised as the suspended sediment flow over the pycnocline and fluid mud accumulation under the sea water layer (Nakagawa et al. 2016). In the present study, several field measurements including bathymetric survey with a multi-beam system and in-situ bulk density measurement were carried out and the sedimentary process has been discussed through the data analysis. 2. Study site and field monitoring 2.1 Study site The port of Niigata is located at the estuary of the Shinano river (Fig.1(a)), which is flowing through the Japan sea at the west coast of the Japanese main island. Dredged channel for the ship navigations in the port area (Fig.1(b)) suffers from the siltation by the discharged sediment through the river and they need frequent maintenance dredging to keep the required depth from -5.5 to -12 m.
(a) (b)
Figure 1: (a) Location of study site and (b) typical bottom topography along channel in the port.
(Modified from Nakagawa et al. 2016) 2.2 Field measurements and data analysis Field survey was carried out in January and February in 2020 to obtain topographic and sediment data. For bathymetric surveys we used a multi-beam sonar, which allow us to measure the water depth of a target area with the higher spatial resolution. Core samples were taken at several points and analysed for sediment properties such as particle size, water contents and so on. An in-situ bulk densimeter, Mud Bug of Hydramotion Ltd., was also applied to get information on the vertical profiles of mud density near the bed.
2.3 Measurement results A perspective view of the bathymetry in the target area is shown in Fig.2 as an example based on the data on February 8, 2020, viewing from the downstream into the upstream side. Temporal change of the bed level from the previous survey on January 17 is presented in Fig.3, which represent the deposition area by red and the erosion by blue, respectively. The deep blue area along the left bank means the dredging works during the monitoring period. On the other adjacent side, where dredging works finished already before the present survey, there are observed slight deposition with the thickness of around 20 cm and rapid siltation over 1 m at the upstream border or slope of dredged area even in the three weeks.
Figure 2: Perspective view of the bathymetry based on the survey on Feb. 8 in 2020. The deeper/shallower area is indicated by the darker/lighter grey scale.
Figure 3: Temporal variation of the bathymetry for three weeks. (Deep blue area is due to dredging works during
the monitoring period.) 3. Conclusions Based on the bathymetry survey with multi beam sonar, temporal variation of bathymetry has been studied and the data shows rapid siltation around the dredged channel in the estuarine port. The sedimentation process will be further discussed and described in the presentation considering the other data set of bottom sediments measured in the deposition area. References Nakagawa, Y., Takashima N., Gotoh Y. and Nagai I.
(2016). Fluid mud dynamics around dredged navigation channel at river mouth port, Proc. for the PIANC-COPEDEC 9th Conference.
0
-4
-8
-12
Bed
leve
l fro
m D
.L.(m
)
(m)
L-1 L-2 L-3 L-4
0 500 1000 1500 25002000 3000
Target area of the present study

58
Spatial variability in the yield stress of mud at Port of Hamburg, Germany A. Shakeel1, A. Kirichek1,2 and C. Chassagne1
1 Department of Hydraulic Engineering, Delft University of Technology, Delft, Netherlands. [email protected]
2 Deltares, Delft, Netherlands
1. Introduction Natural mud typically consists of clay minerals, water, sand, silt, and a small amount of organic matter of different origin and composition. For practical reasons, the nautical bottom was until recently defined as a critical fluid density (McAnally et al., 2007). However, there is another criterion (i.e., yield point) which is quite important for the ports where the organic matter content is significantly varying as a function of location within the port. For these ports, only density is not enough to predict the rheological characteristics of mud and the nautical bottom ought to be defined on the basis of yield stresses of mud (Wurpts and Torn 2005; Shakeel et al., 2019; Shakeel et al., 2020). The objective of the present study is to analyse the spatial variability in yield stress of mud from Port of Hamburg, Germany and to define a nautical bottom based on yield stress. 2. Experimental Natural mud samples were collected from different locations (Figure 1a) and depths of Port of Hamburg, Germany using 1 m core sampler (Figure 1b). The obtained samples were then subsampled into different layers on the basis of their consolidation stage. The bulk density of the mud samples was estimated by the oven drying method. The organic matter content (TOC) of mud samples was determined using an ISO standard 10694:1996–08. The Thermo Scientific HAAKE MARS I rheometer with concentric cylinder geometry was used to perform the rheological measurements. Stress ramp-up test, at a sweep rate of 1 Pa/s, was carried out to analyse the yield stress of mud samples.
Figure 1: (a) Selected locations in the Port of Hamburg, Germany for collecting mud samples, (b) sample collector (Frahmlot). 3. Results and discussion The correlation between the density and yield stress of mud for different locations of Port of Hamburg is shown in Figure 2. It is clear from Figure 2 that the yield stress vs density curve is a strong function of sampling location. A modified power law was used to fit the experimental data of yield stress as a function of density for different locations, given as:
𝜏𝜏 = 𝑎𝑎 ∙ ((𝜌𝜌 − 𝜌𝜌𝑤𝑤) 𝜌𝜌𝑤𝑤⁄ )𝑏𝑏 (1)
where ‘a’ and ‘b’ are two fitting parameters. It was found that the parameter ‘b’ was not varying significantly and, therefore, a fixed value of 2.4 was used for parameter ‘b’. The power law fitting was performed with just one fitting parameter ‘a’, as shown in Figure 2.
Figure 2: Yield stress as a function of excess density for different locations of Port of Hamburg, Germany. The solid lines represent the power law fitting (Eq. 1) with one fitting parameter ‘a’ and the fixed value of parameter ‘b’ (2.4). 𝜌𝜌𝑤𝑤 represents the density of water. In order to further analyse the effect of organic matter content on the yield stress of mud samples, the fitting parameter ‘a’ was correlated with the TOC content (data not shown). The result showed a strong correlation between the fitting parameter ‘a’ and the TOC for different locations. 4. Conclusions This study confirms that the yield stress of mud samples from Port of Hamburg, Germany is significantly varying along the port, due to the variation in organic matter content. It is also identified that the yield stress value of 50 Pa can be used as a criterion for nautical bottom for the considered port. References McAnally, W. H., Teeter, A., Schoellhamer, D., Friedrichs, C., Hamilton, D.,
Hayter, E., ... & ASCE Task Committee on Management of Fluid Mud. (2007). Management of fluid mud in estuaries, bays, and lakes. II: Measurement, modeling, and management. Journal of Hydraulic Engineering, 133(1), 23-38.
Wurpts, R., & Torn, P. (2005). 15 years experience with fluid mud: Definition of the nautical bottom with rheological parameters. Terra et Aqua, 99, 22-32.
Shakeel, A., Kirichek, A., & Chassagne, C. (2019). Is density enough to predict the rheology of natural sediments?. Geo-Marine Letters, 39(5), 427-434.
Shakeel, A., Kirichek, A., & Chassagne, C. (2020). Rheological analysis of mud from Port of Hamburg, Germany. Journal of Soils and Sediments, 20, 2553–2562.

59
Detailled modelling and monitoring of WID as an efficient harbor siltation maintenance strategy
L. de Wit1, K. Cronin1, A. Kirichek1,2, T. van Kessel1
1Department of Marine and Coastal Systems, Deltares, Delft, Netherlands. [email protected] 2Department of Hydraulic Engineering, Delft University of Technology, Delft, Netherlands.
1. Introduction Water Injection Dredging (WID) can be used as an efficient maintenance dredging technique. The technique consists of fluidizing mud with jets close to the bed injecting water into the bed (PIANC 2013, Winterwerp et al. 2002). The fluidized layer will act as a density current moving in horizontal direction by forces of nature. The fluidized layer remains close to the bed and surface turbidity is limited. We present detailed near and far field modelling and monitoring results for WID in the Port of Rotterdam. 2. Near field modelling In the near field modelling the flow of the fluidized mud layer in the first few hundred metres from the WID dredge is simulated. A CFD model is used to capture the flow details in the near field in great detail (De Wit 2015). The WID dredge is simulated by a moving sediment and fluid source term working along the same line six times in a row. The simulated WID density current after the sixth pass is shown in Figure 1 where the WID worked along a 300m stretch indicated by a black dashed line. The WID density current does not move in the direction of the dashed line but mainly moves in lateral direction down a weak slope in the bathymetry.
Figure 1: Near field simulation WID density current.
3. Far field modelling Far field simulations for the Rhine Meuse Delta including the entire Port of Rotterdam area have been conducted with Delft3D including density feedback and WID plume input from the near field model.
Figure 2: Far field plume spreading of WID at HW-1h.
The moment of carrying out WID with respect to the tidal phase turns out to be an important factor for the WID plume flow direction and area of deposition. When 8 hours of WID work starts 1h before high water (HW) the WID near bed plume mainly moves in seaward direction, see Figure 2. When WID starts 1h before low water (LW) it moves into the harbor basin. These insights are used to optimize the WID strategy.
4. Monitoring An example of in-situ monitoring of density and strength profiles in a sediment trap filled with mud fluidized by WID is given in Figure 3. Initially a rather weak fluidized mud layer is generated by WID which in the following weeks consolidates reducing layer thickness and increasing density and strength. These measurements illustrate the potential to apply WID in combination with a yield stress criterium of for example 100 Pa for defining the nautical bottom instead of a density of 1200 kg/m3 criterium which is now used in Rotterdam and in other ports (Kirichek et al 2018, McAnally 2007). A density of 1200 kg/m3 is reached in 2 weeks after WID is finished but building up a yield stress of 100 Pa takes ~11 weeks.
Figure 3. Rheotune density and yield stress profiles
3. Conclusions Detailed near and far field modelling and monitoring of WID fluid mud layers have been carried out to increase our knowledge of the movement and rheological behaviour of WID fluidized layers and to optimize WID operations as an efficient maintenance dredging strategy. Acknowledgments
The work in this study is funded by the Port of Rotterdam and by Topconsortium voor Kennis en Innovatie (TKI) Deltatechnologie subsidy. The research is carried out within the framework of the MUDNET academic network https://www.tudelft.nl/mudnet/ References PIANC, Injection Dredging, PIANC Report 120,
Brussels, 2013. Kirichek A, Chassagne C, Winterwerp H, Vellinga T.
How navigable are fluid mud layers? Terra et Aqua. 2018; 151: 6-18.
McAnally WH, et al. Management of Fluid Mud in Estuaries, Bays, and Lakes, Part 2: Measurement, Modeling, and Management. J. Hydraul. Eng. 2007. 133 (1).
Winterwerp JC, Wang ZB, van Kester JATM, Verweij JF. Far-field impact of water injection dredging in the Crouch River. Proc. of the Institution of Civ. Eng. Water&Maritime Eng. 2002; 154 (4), 285-296.
de Wit L. 3D CFD modelling of overflow dredging plumes. PhD thesis Delft University of Technology; 2015. https://doi.org/10.4233/uuid:ef743dff-6196-4c7b-8213-fd28684d3a58

60
Wall-slip artefact signature in rheometry of natural fluid muds A.M. Talmon1,2, E. Meshkati2, A.P.K. Goda1 A. Kirichek2
1 Department of Dredging Engineering, Delft University of Technology, Delft, Netherlands.
2 Department of Marine and Coastal Systems, Deltares, Delft, Netherlands, [email protected].
1. Introduction The yield stress of natural fluid muds is considered decisive for navigation depth in ports and water ways. Two yield stresses i.e. static and dynamic are discussed; the former, is defined as the point of initiation of flow in a material under stress. The latter is the minimum stress required for maintaining the material in flow. Rheometery is an established way to measure these yield stresses. However, wall-slip particularly at low shear rates is often an issue which is overlooked. This study sheds light on a typical wall-slip artefact signature encountered in rheometery of natural fluid mud. Moreover, a measurement approach is proposed to properly quantify the static and dynamic yield stresses. 2. Importance of configuration Configurations with well-defined shear rates such as bob-cup (BC) are preferred in rheometery. However, a BC system is prone to slippage due to formation of a large velocity gradient in a thin region adjacent to the wall. In contrary to a BC, slippage is radically prevented in a vane-cup (VC) configuration (Boger 2009) as the velocity gradient in a VC is distributed across a larger region. The shear rates in a VC, on the other hand, has to be defined. 2.1 Material and methods Two common rheometery methods namely, controlled shear rate (CR) and controlled shear stress (CS) are compared to investigate the occurrence of wall-slip in both BC and VC configurations. Mud from Beerkanaal, the port of Rotterdam, with an initial density of 1263 kg/m3 (DMA 35) is used. Table 1 provides the applied testing protocols. Tests are conducted by Haake Mars 1.
Configuration CR CS
bob-cup CC25 Din 0 to 100 [1/s] 0 to 120 [Pa] vane (FL22)-cup 0 to 116 [1/s] 0 to 120 [Pa]
Table 1: Protocol: 180 s up, 60 s constant, 180 s down. 3. Results and discussion Wall-slip signature in a bob-cup (BC) configuration A definite difference is found between tests conducted in BC and VC. Figure 1a depicts the result of CR and CS tests in a BC configuration. At low shear rates (< 10 [1/s]), the ramp down part of the curve crosses the ramp up part in both CR and CS test. This is because the measured shear stress during the initial part of ramp up are underestimated; a typical wall slip signature in a BC configuration. Some researchers describe this phenomenon as two-step yielding (e.g. Shakeel et al. 2019). Figure 1b shows the result of CR and CS tests in a VC configuration, in which no wall-slip is observed. Moreover, the stress-rate relationship over the ramp down (remoulded) phase are in an excellent agreement.
Quantification of static and dynamic yield stress Static yield stress is retrieved from CS tests in the VC configuration: shear stress of the point where the linear part of the ramp up curve leaves the vertical axis and deflects to the nonlinear part (at 45 Pa, Figure 1b). At this point, the wall-slip also stops (Figure 1a): the shear stress has reached the yield stress of the un-sheared material in the middle of the gap. The dynamic yield stress can be obtained from both CR and CS method in the VC configuration: the intercept of ramp down curve and the vertical axis. In the BC configuration, the dynamic yield stress is underestimated by factor 3 (Figure 1a,b).
Figure 1a,b: PoR fluid mud rheometric testing
4. Conclusions Dedicated testing with different configurations and protocols can only reveal the full rheological properties of natural fluid mud. Other type of measurements are being conducted to reveal the cause of wall-slip in rheometry of natural fluid muds (not shown here). Acknowledgements Port of Rotterdam for support. References Boger D.V. (2009). Rheology and the resource industries,
Chemical Engineering Science, 64, 4525-4536. Shakeel, A., Kirichek, A., Chassagne, C. (2019)
Rheological analysis of mud from Port of Hamburg, Germany, Journal of Soils and Sediments, https://doi.org/10.1007/s11368-019-02448-7.
wall slip signature
(true) static yield stress
dynamic yield stress
a
b

61
Response of the turbidity maximum zone to fluctuations in sediment deposition in the Wouri estuary (Cameroon)
Y. Fossi Fotsi1,2*, I. Brenon1, R. Onguene2, N. Pouvreau3, J. Etame2
1 UMR 7266 LIENSs, Institut du Littoral et de l’Environnement, CNRS – Université de Rochelle, 17000 La Rochelle (France). [email protected]
2 Ufd bio-geosciences and environment, University of Douala, BP: 24157 Douala (Cameroun) 3 Shom-French Hydrographic and Oceanographic Service, 29200 Brest (France)
1. Introduction An accumulation of suspended particles, called "maximum turbidity", often appears in estuaries (Allen et al., 1980) and can be a major source of sediment supply and responsible for the rapid silting of navigation channels. This is the case of the Wouri estuary, which is home to the Autonomous Port of Douala. An access channel is permanently dredged because it is subject to heavy sedimentation. Like any mesotidal estuary, the Wouri estuary presents a zone of maximum turbidity, of fluvial and marine origin. In order to understand the fluctuations of suspensions and deposits in the Wouri Estuary, this study aims to simulate turbidity at different river and tidal regimes to assess the vertical variation of the bottom on the circulation, current velocity and also to estimate how tidal transport and flows influence the maximum turbidity zone and the control of deposits. Changes in its structure are also investigated numerically to delineate the processes controlling sediment escape in the mangroves. Very few studies describe the variations of sediment parameters in equatorial estuaries (Asp et al., 2018). 2. The 3D hydro-sedimentary model Hydrodynamics is simulated using a 3D hydrodynamic model TELEMAC , and then fed to a sediment transport model implemented in SEDI3D. Cohesive sediment transport is modeled using a two-layer bottom model, as described in (Van Kessel et al., 2011) The model starts to operate without prescribed initial sediment, neither in the bed nor in the water column. The sediment supply comes from the model boundaries and the model gradually builds up to a dynamic equilibrium. This modeling approach is suitable for the study of coastal water turbidity because the resulting maximum turbidity is not forced by the initial prescribed condition, but is an internal solution to the system. 3. Results The variations in maximum turbidity observed in the Wouri estuary are mainly controlled by the tide and the river flows (fig). The turbidity show high values in spring tide, demonstrates that SSC is mainly driven by deposition/resuspension processes. During neap tide, SSC are low during the two periods (low water level and small flood). According to seasonal variations, the river regime shows a longitudinal migration of the position of the zone of maximum turbidity, and thus by the upstream (low water period) and downstream (high water period) tilting with consequence of a massive export of sediments. Sediment can be entrapped in adjacent mangrove forests, inducing a diminution of turbidity during the dry season
and transitional periods. The consequences of channel dredging on the estuary morphology and on the SSC variations are evaluated.
4. Conclusions The large morphology of the estuary induces a convergence locating the ZTM between upstream-directed rising tidal currents and downstream-directed ebb tidal currents. The lower the river's flow, the more intense the currents induce a maximum turbidity essentially linked to the tide and therefore migrating upstream. During flood periods, the ZTM is essentially linked to the flow and therefore expelled by advection downstream.
Acknowledgments The authors would like to thank the Service of the French Embassy in Cameroon (SCAC), the LIENSs laboratory (CNRS/La Rochelle University) and Shom (Brest), the University of Douala for their support in making this work. References Allen, G. P., Salomon, J. C., Bassoullet, P., Du Penhoat,Y., &
de Grandpré, C. (1980). Effects of tides on mixing and suspended sediment transport in macrotidal estuaries. Sedimentary Geology, 26(1), 69–90. https://doi.org/10.1016/0037-0738(80)90006-8
Asp, N. E., Gomes, V. J. C., Schettini, C. A. F., Souza-Filho, P. W. M., Siegle, E., Ogston, A. S., Nittrouer, C. A., Silva, J. N. S., Nascimento, W. R., Souza, S. R., Pereira, L. C. C., & Queiroz, M. C. (2018). Sediment dynamics of a tropical tide-dominated estuary: Turbidity maximum, mangroves and the role of the Amazon River sediment load. Estuarine, Coastal and Shelf Science, 214, 10–24. https://doi.org/10.1016/j.ecss.2018.09.004
Van Kessel, T., Winterwerp, H., Van Prooijen, B., Van Ledden, M., & Borst, W. (2011). Modelling the seasonal dynamics of SPM with a simple algorithm for the buffering of fines in a sandy seabed. Continental Shelf Research, 31(10, Supplement), S124–S134. https://doi.org/10.1016/j.csr.2010.04.008

62
When does suspended mud deposit on a relatively immobile substrate? T. Ashley1, K. Strom1, J. Schieber2, Z. Yawar2
1 Department of Civil and Environmental Engineering, Virginia Tech, Blacksburg, VA, USA
[email protected] 2 Department of Earth and Atmospheric Sciences, Indiana University Bloomington, Bloomington, IN, USA
1. Introduction Mud is often the primary bed material in quiescent environments like lakes, estuaries, and floodplains. However, it can also be found on the bed in appreciable quantities in more energetic settings like river channels, deltas, and oceanic boundary currents. Small amounts of mud can have an outsized geomorphic impact by reducing the mobility of coarser material. The mud fraction is also one of the few quantities that can be reliably measured in the sedimentary record and may contain information about past flow conditions. We present a series of laboratory experiments designed to clarify how the balance between erosion and deposition limits the mud fraction on the bed surface in fluid-driven sediment transport systems.
Figure 1: Racetrack flume used for this study
2. Experiments Mud deposition and erosion are thought to be controlled by (a) the flow strength, (b) the concentration of mud in suspension, (c) the flocculation and settling properties of mud in suspension, and (d) the availability and erodibility of mud on the bed. Our experimental objective was to quantify changes in bed coverage associated with changes in these factors. Experiments were conducted in a “racetrack” style flume to allow the formation and equilibration of flocs. Each experimental condition is characterized by the boundary stress, turbulent shear rate, the total volume of kaolinite sediment in the flume, and the antecedent conditions. We report time series measurements of bed coverage, suspended sediment concentration, and floc size (Figure 2) following an initial perturbation driven by either (a) a change in flow conditions or (b) a change in the total volume of sediment in the flume. 3. Hypothesis Our primary hypothesis is that changes in the mud fraction on a relatively immobile substrate can mediate the balance between erosion and deposition when deposition rates are low. This occurs because increases in mud availability cause a proportional change in the spatially averaged mud erosion rate. Once the bed is fully covered in mud, increases in mud deposition can no longer be balanced by changes in bed coverage. Instead,
aggradation begins to occur. This hypothesis is compatible with classic theories that predict mud aggradation below a critical threshold stress but explains observations of muddy bed material in energetic flows.
Figure 2: Example image used to measure floc size

63
Dynamics of sand-mud mixtures in the Khuran Starit – the Persian Gulf M. Hajibaba1, M. Soltanpour2, S.A. Haghshenas3 and A. Farhangmehr4
1 Dept. of Civil Engineering, K. N. Toosi University of Technology, Tehran, Iran. [email protected] 2 Dept. of Civil Engineering, K. N. Toosi University of Technology, Tehran, Iran. [email protected]
3 Institute of Geophysics, University of Tehran, Tehran, Iran. [email protected] 4 Oceans Research, University of Tehran Science and Technology Park, Tehran, Iran. [email protected]
1. Introduction The Khuran Strait (KS) (or Tang-e-Khuran) is located in the Persian Gulf between Qeshm Island and the Iranian motherland (Figure 1). The hydrodynamics of the sheltered narrow strait, with a minimum width of about two kilometers, is dominated by short crested small waves and strong tidal currents, i.e. up to 2 m/sec, which is also affected by the mangrove coverage next to its narrowest part. It is believed that the strong currents at the middle part of the KS result in the movements of underwater sand dunes and a dynamic morphology. The present paper studies the dynamics of sand-mud mixtures in the KS. The research is important to manage the protected mangrove areas and the designs of future planned infrastructures, e.g. the Persian Gulf Bridge.
2. Field Measurements The existing data includes periodic hydrographic survey and the results of geotechnical boreholes. A comprehensive set of measurements was also carried out in 2013 to investigate the morphodynamics of the study area. The measurements consist of the vertical current profiling (6 stations), directional waves (4 stations), water levels (6 stations), wind (1 station), and sediment grab samplings at 100 points (Haghshenas et al., 2014).
Figure 1: Study Area.
3. Numerical Modelling Delft3D–Flow was employed for the numerical modelling (Deltares, 2014). Water elevation at the Strait of Hormuz, i.e. open boundary of the Persian Gulf global model, was extracted from OSU Tidal Prediction Software (OTPS). The outputs of the global model were applied at the boundaries of the local model in the north of the Qeshm Island. Generating unstructured grid by using RGFGRID and QUICKIN, the outputs of the flow model, i.e. water levels and depth averaged velocities, were calibrated and validated with existing data. Special care needs to be taken for the modelling of the mangrove area in order to get the accurate current field. The sediment transport model, including 75% sand and 25%
fine particles, was then set up to study the mixed sediment transport in the KS and the probability of movements of the existing sand dunes (particles between 0.3-0.6 mm with a median size of 0.5 mm) in the middle part.
4. Results and Discussion Figure 2 shows a sample of favorable comparisons of measured and modelled water levels at Laft station (See Figure 1). Figure 3 shows the simulated strong tidal currents in KS, up to 1.8 m/s, which seems to be able to mobilize sand dunes in the middle parts of the KS strait.
Figure 2. Comparison between the simulated and measured water levels.
Figure 3. Current speed in the KS during a spring tide event.
The simulated sediment fluxes during ebb and flood events show differences of about 5% for both muddy and sandy sediments. The results reveal that although the net sediment transport is small, the gross values are large enough to move the sand dunes.
References Haghshenas S. A., Dibajnia, M., Bakhtiari, A., D. Emami,
A., Razavi Arab A., Hosseini` Bandarabadi, S. M., Safaian, A. R. (2014). Field Measurements in Support of the Design of the Persian Gulf Bridge. 11th International Conference on Coasts, Ports & Marine Structures, ICOPMAS, Tehran, Iran.
Deltares (2014). Delft 3D-Flow User Manual, Delft Hydraulic, 684 p.

64
A 1DV-model for submerged density currents H.C.M. Hendriks1,2, T. van Kessel1, T. Vijverberg3, A.J. Nobel3, I. Doets3, M.D. Klein3
, L. Sittoni1, R. Uittenbogaard1 and J.C. Winterwerp2
1 Department of Marine and Coastal Systems, Deltares, Delft, Netherlands. [email protected]
2 Department of Hydraulic Engineering, Delft University of Technology, Delft, Netherlands 3 Royal Boskalis Westminster, Papendrecht, Netherlands
1. Introduction Submerged sediment-induced density currents occur throughout the aquatic environment, for instance along the slopes of continental shelves, and in lakes and reservoirs. Also the flow of fluid mud into harbour basins and navigation channels is a manifestation of density currents. Next to these naturally occurring density currents, they also occur in industrial processes, when fluids of different densities are brought together in process tanks. Also a dredging technique, known as water injection dredging, induces density currents. Today, advanced three-dimensional models exist to analyse and predict the transport and fate of density currents. However, these models require large computer capacity and running times, well-trained operators, and a variety of input parameters parameterizing the various physical processes. Hence, there is a need for a rapid assessment tool enabling a zero-order evaluation of transport and fate of density currents. In this study, we develop such a tool and validate it with laboratory data and a three-dimensional model. 2. Methods The rapid assessment tool is essentially a one-dimensional vertical model (1DV), operating in a Lagrangian framework. This tool is based on the 1DV POINT MODEL by Winterwerp and Uittenbogaard (1997). We refer to this model as the 1DV-slurry model. It solves the momentum and sediment continuity equation over the vertical, including processes such as turbulent mixing, (hindered) settling and both barotropic and baroclinic pressure gradients. The 1DV-slurry approach is valid for modelling density currents under several assumptions. We assume the density current does not spread laterally but only longitudinally. Furthermore, we can follow the turbidity current through space assuming stationarity in the Lagrangian framework. If such is the case, we can approximate the density current celerity (uc) through the following expression:
𝑢𝑢𝑢𝑢𝑐𝑐𝑐𝑐 =∫ 𝑢𝑢𝑢𝑢𝑢𝑢𝑢𝑢 dz𝜁𝜁𝜁𝜁−𝑑𝑑𝑑𝑑
∫ 𝑢𝑢𝑢𝑢 dz𝜁𝜁𝜁𝜁−𝑑𝑑𝑑𝑑
where z is the vertical coordinate – with z = –d at the bed and z =ζ at the free surface –, u is the velocity in m/s and c is the mass concentration in kg/m3. Using this velocity, we estimate the distance travelled by the slurry xc for every model time step t. We compared this approach with experimental data of Parker et al. (1987). Also we run the 1DV model for a number of schematic cases, and compared the results with Delft3D simulations on the same configurations.
3. Results Typical results from the 1DV-slurry model are shown in Figure 1. At every point in space, a vertical profile of sediment concentration, flow velocity and turbulent energy is computed. These can be combined into contour maps. The results compare well with the Delft3D output, as long as the defined density current celerity (uc) is representative for the actual density current celerity.
Figure 1 Output of 1DV-slurry model, for a density current moving along a 1:20 slope. Top panel: horizontal flow velocity, bottom panel: sediment concentration 4. Conclusions The 1DV-slurry model is a novel tool to model submerged sediment-induced density currents. As model setup is relatively easy and computational effort is small, this model is particularly suited to get a first impression of transport and fate of density currents. When the assumptions underlying the model are correct for a given case, the model results closely match with experimental and 3D model data. References Parker, G., Garcia, M.H., Fukushima, Y. and W. Yu (1987), Experiments on turbidity currents over an erodible bed, Journal of Hydraulic Research, 25:1, 123-147 Winterwerp, J.C. and Uittenbogaard, R.E. (1997) Set-up of a POINTMUD MODEL; SILTMAN. WL|Delft Hydraulics, report Z2005
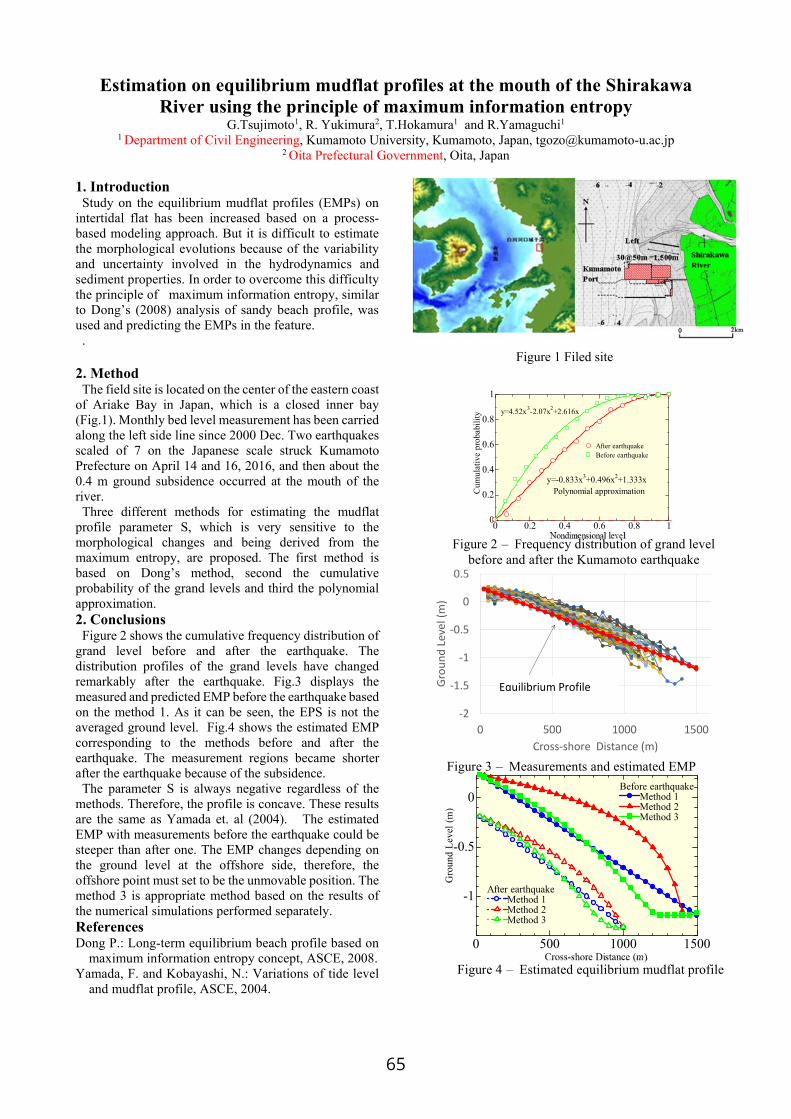
65
Estimation on equilibrium mudflat profiles at the mouth of the Shirakawa River using the principle of maximum information entropy
G.Tsujimoto1, R. Yukimura2, T.Hokamura1 and R.Yamaguchi1 1 Department of Civil Engineering, Kumamoto University, Kumamoto, Japan, [email protected]
2 Oita Prefectural Government, Oita, Japan
1. Introduction Study on the equilibrium mudflat profiles (EMPs) on
intertidal flat has been increased based on a process-based modeling approach. But it is difficult to estimate the morphological evolutions because of the variability and uncertainty involved in the hydrodynamics and sediment properties. In order to overcome this difficulty the principle of maximum information entropy, similar to Dong’s (2008) analysis of sandy beach profile, was used and predicting the EMPs in the feature. .
2. Method The field site is located on the center of the eastern coast
of Ariake Bay in Japan, which is a closed inner bay (Fig.1). Monthly bed level measurement has been carried along the left side line since 2000 Dec. Two earthquakes scaled of 7 on the Japanese scale struck Kumamoto Prefecture on April 14 and 16, 2016, and then about the 0.4 m ground subsidence occurred at the mouth of the river. Three different methods for estimating the mudflat
profile parameter S, which is very sensitive to the morphological changes and being derived from the maximum entropy, are proposed. The first method is based on Dong’s method, second the cumulative probability of the grand levels and third the polynomial approximation. 2. Conclusions Figure 2 shows the cumulative frequency distribution of
grand level before and after the earthquake. The distribution profiles of the grand levels have changed remarkably after the earthquake. Fig.3 displays the measured and predicted EMP before the earthquake based on the method 1. As it can be seen, the EPS is not the averaged ground level. Fig.4 shows the estimated EMP corresponding to the methods before and after the earthquake. The measurement regions became shorter after the earthquake because of the subsidence. The parameter S is always negative regardless of the
methods. Therefore, the profile is concave. These results are the same as Yamada et. al (2004). The estimated EMP with measurements before the earthquake could be steeper than after one. The EMP changes depending on the ground level at the offshore side, therefore, the offshore point must set to be the unmovable position. The method 3 is appropriate method based on the results of the numerical simulations performed separately. References Dong P.: Long-term equilibrium beach profile based on
maximum information entropy concept, ASCE, 2008. Yamada, F. and Kobayashi, N.: Variations of tide level
and mudflat profile, ASCE, 2004.
Figure 1 Filed site
‐2
‐1.5
‐1
‐0.5
0
0.5
0 500 1000 1500
Grou
nd Le
vel (m)
Cross‐shore Distance (m)
Equilibrium Profile
Figure 3 – Measurements and estimated EMP
0 0.2 0.4 0.6 0.8 10
0.2
0.4
0.6
0.8
1
y=-0.833x3+0.496x2+1.333x
After earthquake
Polynomial approximation
Nondimensional level
Cum
ulat
ive
prob
abili
ty
Before earthquake
y=4.52x3-2.07x2+2.616x
Figure 2 – Frequency distribution of grand level before and after the Kumamoto earthquake
0 500 1000 1500
-1
-0.5
0
Cross-shore Distance (m)
Gro
und
Leve
l (m
)
Before earthquakeMethod 1Method 2Method 3
After earthquakeMethod 1Method 2Method 3
Figure 4 – Estimated equilibrium mudflat profile

66
Carbon Accretion in the Sediments of Estuarine Mangroves in Sri Lanka Ahalya Suresh1, Jinsoon Park1 and Jong Song Khim2
1 Department of Convergence study on the Ocean Science and Technology, Korea Maritime and Ocean University, Republic of Korea
[email protected] 2 School of Earth and Environmental Sciences & Research Institute of Oceanography, Seoul National University,
Republic of Korea 1. Introduction Mangroves are the most carbon-rich biomes, facilitating accumulation of fine particles and promoting rapid rates of sediment accretion and carbon burial. Larger proportions of the ecosystem carbon is stored in the pools of sediments (Alongi, 2012) beneath mangrove rhizosphere; lasting for millennia if kept undisturbed (Phillips, Kumara, Jayatissa, Krauss, & Huxham, 2017). 2. Methodology The present study intends to evaluate the sediment organic carbon (SOC) capacity of the mangrove sediments. Eight chief mangrove forests spanning over three climatic zones chosen for study. Six transects laid at each site across the water-land margin. Sediment coring done to 45cm deep and subsampled at 15cm intervals (0-15, 15-30 and 30-45 cm). Sediments samples were brought to the laboratory where they oven dried up to constant weight (for 48 hours) at a temperature of 60oC for bulk density and 105oC for organic carbon determination. Bulk density was then determined according to the following equation:(C.A.Black, 1965) 𝑆𝑆𝑆𝑆𝑆𝑆𝑆𝑆 𝑏𝑏𝑏𝑏𝑆𝑆𝑏𝑏 𝑑𝑑𝑑𝑑𝑑𝑑𝑑𝑑𝑆𝑆𝑑𝑑𝑑𝑑 (𝑔𝑔 𝑐𝑐𝑚𝑚−3)
= 𝑀𝑀𝑀𝑀𝑑𝑑𝑑𝑑 𝑆𝑆𝑜𝑜 𝑆𝑆𝑜𝑜𝑑𝑑𝑑𝑑 − 𝑑𝑑𝑑𝑑𝑆𝑆𝑑𝑑𝑑𝑑 𝑑𝑑𝑆𝑆𝑆𝑆𝑆𝑆 (𝑔𝑔)𝑂𝑂𝑑𝑑𝑆𝑆𝑔𝑔𝑆𝑆𝑑𝑑𝑀𝑀𝑆𝑆 𝑜𝑜𝑆𝑆𝑆𝑆𝑏𝑏𝑚𝑚𝑑𝑑 𝑑𝑑𝑀𝑀𝑚𝑚𝑠𝑠𝑆𝑆𝑑𝑑𝑑𝑑 (𝑐𝑐𝑚𝑚3)
To determine the organic carbon Thermo scientific Flash 2000 analyzer was used. After burning the sample at extremely high temperatures with an automated elemental analyzer, the burned carbon and nitrogen are detected by the TCD detector. The sediment organic carbon was then quantified using the following equation according to Kauffman & Donato, 2012;
𝑆𝑆𝑑𝑑𝑑𝑑𝑆𝑆𝑚𝑚𝑑𝑑𝑑𝑑𝑑𝑑 𝑐𝑐𝑀𝑀𝑑𝑑𝑏𝑏𝑆𝑆𝑑𝑑 (𝑀𝑀𝑔𝑔 ℎ𝑀𝑀−1 )= 𝐵𝐵𝑏𝑏𝑆𝑆𝑏𝑏 𝑑𝑑𝑑𝑑𝑑𝑑𝑑𝑑𝑆𝑆𝑑𝑑𝑑𝑑 (𝑔𝑔 𝑐𝑐𝑚𝑚−3)∗ 𝑑𝑑𝑆𝑆𝑆𝑆𝑆𝑆 𝑑𝑑𝑑𝑑𝑠𝑠𝑑𝑑ℎ 𝑆𝑆𝑑𝑑𝑑𝑑𝑑𝑑𝑑𝑑𝑜𝑜𝑀𝑀𝑆𝑆 (𝑐𝑐𝑚𝑚) ∗ %𝐶𝐶
3. Results and Discussion Soil bulk density and organic carbon content revealed to be in the range of 0.13 to 0.80 g cm-3 and 0.14 to 1.45 percentages, respectively. Sediment carbon varied significantly across the sites (p=0.049). The carbon accretion capacity of the mangrove soils ranged from 1432.65 to 5001.68 MgC ha-
1. Utmost and nethermost carbon capacity recorded in Rekawa of intermediate zone and Mannar of dry zone, respectively. The percentage of SOC was high in the
bottommost layer (30-45cm) across all sites and observed gradually increasing along the depth profile (Figure 1). The witnessed high variability in sediment organic carbon is thought to have a major influence on overall carbon dynamics in intertidal mangroves in Sri Lanka. 4. Conclusion Mangrove forests from Intermediate and Wet zones showed high tendency to accrete more carbon in sediments than of dry zone. Rekawa holds large pools of sediment carbon (5001.65 MgC ha-1). Higher proportion of carbon reported in sediments from lower most layers and in the seaward zone. The role of Sri Lankan mangrove forests in climate mitigation as carbon sink is well addressed by the results of the present study. This aids to specific actions obligatory for concerted protection. Acknowledgments This study was supported by supported by a project entitled “Development of Blue Carbon Information System and Its Assessment for Management [grant number 20170318]” funded by the Ministry of Oceans and Fisheries of Korea (MOF) and the Basic Science Research Program through the National Research Foundation of Korea (NRF) funded by the Ministry of Education (NRF-2020R1I1A2066477). References Alongi, D. M. (2012). Carbon sequestration in mangrove
forests. Carbon Management, 3(3), 313–322. https://doi.org/10.4155/cmt.12.20
C.A.Black. (1965). Methods of soil analysis. AMERICAN SOCIETY OF AGRONOMY and AMERICAN SOCIETY FOR TESTING AND MATERIALS.
Kauffman, B., & Donato, D. (2012). Protocols for the measurement, monitoring and reporting of structure, biomass and carbon stocks in mangrove forests. Center for International Forestry Research.
Phillips, D. H., Kumara, M. P., Jayatissa, L. P., Krauss, K. W., & Huxham, M. (2017). Impacts of Mangrove Density on Surface Sediment Accretion, Belowground Biomass and Biogeochemistry in Puttalam Lagoon, Sri Lanka. Wetlands, 37(3), 471–483. https://doi.org/10.1007/s13157-017-0883-7

67
Figure 1: Illustration of the results related to carbon accretion in mangrove sediments showing (A) the study map and the
variations of sediment properties such as (B) Bulk density, (C) TOC(%), (D) SOC (MgC ha-1) and spatial variation of SOC (E) along the High Tide Line and (F) across the sites.

68
Flocculation in estuaries: modelling, laboratory and in-situ studies C. Chassagne1, Zeinab Safar1, Zhirui Deng1,2, Qing He2 and A. Manning1,3,4,5
1 Department of Hydraulic Engineering, Delft University of Technology, Delft, Netherlands. [email protected]
2 State Key Laboratory of Estuarine and Coastal Research, East China Normal University, Shanghai 200062, People's Republic of China. 3 Coasts & Oceans Group, HR Wallingford, Howbery Park, Wallingford, Oxon, OX10 8BA UK.
4 Energy & Environment Institute, University of Hull, Hull, East Riding of Yorkshire, HU6 7RX UK. 5 School of Biological & Marine Sciences, University of Plymouth, Plymouth, Devon, PL4 8AA UK
1. Introduction In the context of sediment transport modelling, several open questions remain to be addressed. The fact that particles do not interact is for instance questionable in estuarine regions, where clay particles are known to be in the form of flocs. Flocs are aggregates of mineral sediment particles, most often combined with organic matter. The underlying question, in terms of (numerical) modelling is related to flocculation dynamics. Which equations, representing the flocculation process, should be implemented in a numerical model? 2. Flocculation models Traditionally, flocculation is modelled using population balance equations (PBE) (Chassagne, 2020). These equations represent the change in concentration of classes of particles over time, whereby a class is defined as a collection of identical particles. Recently, we propose a simple model for flocculation based on logistic growth theory (Chassagne, 2020b) which can be used to model changes in concentrations as well as changes in particle sizes over time:
𝑛𝑛(𝑡𝑡) = 𝑛𝑛∞
1 + 𝑎𝑎𝑑𝑑exp (− 𝑡𝑡𝑡𝑡𝑑𝑑
)
1 + 𝑎𝑎𝑏𝑏 exp (− 𝑡𝑡𝑡𝑡𝑏𝑏
) (1)
Where 𝑛𝑛 is either concentration 𝑛𝑛=c(g/L) or particle size 𝑛𝑛=L(µm), 𝑛𝑛∞ (g/L or µm) 𝑎𝑎𝑏𝑏, 𝑎𝑎𝑑𝑑, 𝑡𝑡𝑏𝑏(s) and 𝑡𝑡𝑑𝑑(s) are adjustable parameters. The main advantage of Eq.(1) is that each class can be studied independently of another: for instance the class corresponding to the most abundant type of particles found in the water column (D50) can then be modelled without requiring input from other classes. 3. Laboratory and in-situ studies From both extensive laboratory studies, whereby the influence of individual parameters on flocculation have been probed, and detailed in-situ surveys, in the Yangtse and Rhine estuaries, whereby the size of flocs have been monitored as function of time and space, the following mechanisms have been identified:
3. Conclusions From the laboratory and in-situ studies 3 classes of particles have been found and are summarized here:
Class 1 2 3 Type Mineral clay Clay + OM Clay + OM
Size (µm) < 20 [20-200] >200 Mass of mineral
clay
𝑚𝑚1(𝑡𝑡) = mass
mineral clay - not
flocculated
𝑚𝑚2(𝑡𝑡) = mass mineral clay inside
flocs 𝑑𝑑𝑚𝑚2𝑑𝑑𝑡𝑡 = − 𝑑𝑑𝑚𝑚1
𝑑𝑑𝑡𝑡
Density and
Settling velocity range
2.6 kg/L
[0 – 0.5] mm/s
[2.6 − 1.16] kg/L
[0.5 – 10] mm/s
[1.16 − 1.0] kg/L
[0.5 – 10] mm/s
Two types of flocculation have been identified: “Microflocculation” whereby Class 1 is aggregating with organic matter, creating a Class 2 or Class 3 floc. This flocculation can be very fast in a marine environment, where environmental conditions favour aggregation. A numerical procedure to account for this flocculation is proposed. “Macroflocculation” whereby a Class 2 or Class 3 is aggregating with another Class 2 or Class 3. It is found to be a minor process in the water column. More information can be found in (Deng et al., 2019), (Deng et al., 2020), (Safar, 2020). Acknowledgments This work has been performed in the frame of the grant NWO 869.15.011, and the MUDNET academic network (https://www.tudelft.nl/mudnet/). References Chassagne, C. (2020). Introduction to Colloid Science,
Delft Academic Press, ISBN 9789065624376 Chassagne, C. and Safar, Z. (2020b). Modelling
flocculation: Towards an integration in large-scale sediment transport models. Marine Geology 430, 106361.
Deng, Z., et al. (2019) "The role of algae in fine sediment flocculation: In-situ and laboratory measurements." Marine Geology 413 : 71-84.
Deng, Z. et al. (2020) Seasonal variation of floc population influenced by the presence of algae in the Changjiang Estuary, submitted to Marine Geology
Safar, Z. (2021) PhD thesis Flocs and Fluff in the Delta, TU Delft

69
DEXMES: A novel cylindrical device for SPM experiments D. Tran*, A. Bocher, M. Jacquet, S. Pearson, F. Floc’h, N Le Dantec, F. Dorval,
G. Fromant, A. Vergne, F. Jourdin, A. Crave, H. Lintanf, R. Verney
* : IFREMER, DYNECO/DHYSED, ZI pointe du Diable, CS10070, Plouzané, France. [email protected]
1. Introduction A novel laboratory device was developed to generate homogeneous suspended sediment concentration and to provide sufficient volume, ≈ 1 m3, for several sensors functioning simultaneously. The hydrodynamic characteristics and the functionalities of the new device were evaluated. Experiments using four types of sediments were also conducted to investigate the capability of the device in maintaining a homogeneous suspension under different flow conditions. 2. The DEXMES device The DEXMES device (dispositif expérimental de quantification des matières en suspension) consists of two main components. The upper part is a cylindrical tank with an inner diameter of 0.96 m and 1.4 m high. In order to break up the large vortexes and mitigate the vortex-induced bubbles, e.g., generated by the impeller, four evenly-spaced baffles with dimensions of 0.09 x 1.31 m are attached to the inner side of the tank (Figure 1). The bottom part of the DEXMES device is a convex, elliptical-shape Plexiglas bed. An impeller with a diameter of 0.36 m placed approximately 1 m below the water surface generates a turbulent flow in the tank. The speed of the impeller, ranging from 0 to 235 rpm, is regulated by a controller box. 3. Hydrodynamics and SPM experiments The mean velocity structure of the DEXMES was quantified based on ADV measurements of the three velocity components, i.e., U, V, W, at frequency 32 Hz over a 5 min burst for each measurement (Figure 1). Measurements were collected over a grid of 8 x 5 points within a radial plane of the tank, with 10 x 10 cm grid size. The velocity profiles and turbulence distributions, eg., TKE and turbulent energy dissipation, throughout the tank then were extracted accordingly. Four different types of particles, i.e., kaolinite, polystyrene beads, natural mud and bentonite, fine (d50 = 100 µm) and medium (d50 = 200 µm) sands were tested. At impeller speed of 175 rpm and for 6 concentrations ranging from 15 to 200 mg/L, 1 L water samples were collected at different positions or coordinates, e.g., nozzle 2 (35,25), nozzle 4 (35,65), bucket water sample (0,25) (Figure 2). 4. Results and Conclusions Figure 1 shows that the tank can be virtually divided into two zones, i.e., above and below row 4 (about 40 cm above the impeller), due to the flow structure. In the upper zone, the flow velocity was relatively low, reducing from row 4 to the water surface at the center of the tank, e.g., light blue color, w ≈ 0 cm/s (top right panel, Figure 1). Whereas the lower zone has higher velocities, by almost two orders of magnitude, e.g., dark blue color, w ≈ 73 cm/s. Applying energy spectrum in the inertial subrange
Figure 2. DEXMES provides homogeneous suspension for mud and fine sand (left). Vertical gradient in concentration and deposition occur for medium sand (right).
to calculate turbulence dissipation rate, and hence shear stress profile, G, shows that depending on the impeller speed and positions inside DEXMES, G varies from 1 to 140 s-1. Visual observation during the experiments and detailed data analysis also reveal that there are strong upward current bursts raising from the bottom and along the tank wall, particularly close to the baffles. The SPM experiments show that DEXMES efficiently maintains homogeneous conditions for bentonite, natural mud, and fine sand. There are deposition and vertical gradients in concentration for medium sand, which can be mitigated by increasing the flow turbulence i.e., increasing the impeller speed up to 235 rpm. However, a stronger current might introduce unwanted bubbles, influencing acoustic sensors’ performance. The stratification for medium sand and the impact of bubbles are under further investigation.
Figure 1. DEXMES device with 8 by 5 grid of ADV measurement positions and the velocity field obtained from ADV. Impeller speed is 175 rpm.

70
Mud profile equations and evaluation A. Perwira Mulia Tarigan1 and Hasanul Arifin Purba2
1 Graduate Program of Civil Engineering, Universitas Sumatera Utara, [email protected]
2 Graduate Student of Civil Engineering, Universitas Sumatera Utara
1. Introduction The shape of shore profile is influenced by several factors including sedimentary properties and wave characters. Mud profiles are generally located on low laying coastal areas, especially in the vicinities of estuaries where abundant fine sediments are suspended and dispersed toward the coastal waters. The muddy coasts with soft sediment bottom are typically broad, flat and shallow, forming mild profiles (Tarigan and Nurzanah, 2016). 2. Basic Theory, Method and Results 2.1 Basic Theory Using the argument of wave energy dissipation per unit bed area per unit time, Lee (1995) initially obtained the form for the mud profile geometry which was discussed by Mehta (2014).
ℎ = 𝐹𝐹𝐹𝐹𝑒𝑒−𝛽𝛽𝛽𝛽 + (ℎ0 − 𝐹𝐹𝐹𝐹𝑒𝑒−𝛽𝛽𝛽𝛽)𝑒𝑒4𝑘𝑘�̅�𝑖 (𝛽𝛽𝑜𝑜−𝛽𝛽)( 𝛽𝛽𝛽𝛽𝑜𝑜
)2 (1) Lately Tarigan and Purba (2020) suggested a revised version to deal with the foreshore part of the profile as follows
ℎ = 𝐹𝐹(1 − 𝑒𝑒−𝛽𝛽𝛽𝛽) + (ℎ0 − 𝐹𝐹𝐹𝐹𝑒𝑒−𝛽𝛽𝛽𝛽)𝑒𝑒4𝑘𝑘�̅�𝑖 (𝛽𝛽𝑜𝑜−𝛽𝛽)( 𝛽𝛽𝛽𝛽𝑜𝑜
)2 (2)
2.2 Method The field site is on the muddy coast of Pantai Cermin, located on the northen coast of North Sumatera Province, fronting the Strait of Malacca (Figure 1). Shore profilings were made in several years using geodetic GPS and echosounder.
Figure 1: Location of the field site
2.3 Results The observed data are fitted to the profile equations based on the least square principles using nonlinear regression and iteration methods. The profile data were measured in several years and best fitting were attempted to seek for the valid ranges of the values of parameters of the equations. It is found that the revised version suggested
by Tarigan and Purba (2020) yields the best fitting for all the data.
Figure 2: Mud profile fitting
Figure 2 displays one of the profile fitting using data taken in 2019. The parameter values obtained for F, 𝛽𝛽 dan 𝑘𝑘�̅�𝑖 are respectively 1.0236, 0.21831 and 2.273 x 10⁻⁵. 3. Conclusion Mud profile equations in this study were formulated based on the argument of wave energy dissipation per unit bed area per unit time. Mud profile data obtained from the profile measurements were fitted to the mud profile equations. The study has shown the efficacy of the revised mud profile equation in characterizing the observed data. Acknowledgement The authors acknowledge the support of fund given by Universitas Sumatera Utara through the scheme of Penelitian Talenta in 2019. References Lee, S. C. 1995. Response of Mud Shore Profiles to
Waves [Dissertation]. Florida: University of Florida. Mehta, A. J., 2014. An Introduction to Hydraulics of Fine
Sediment Transport. World Scientific, Singapore. Tarigan, A. P. M. and Nurzanah, W., 2016. The Shoreline
Retreat and Spatial Analysis over the Coastal Water of Belawan. INSIST. Vol.(1)1: 65-69.
Tarigan, A. P. M. and Purba, H. A., 2020. Best Fitting Methods for The Mud Profile Equations. Journal of the Civil Engineering Forum. 6. 2: 135-144.
Profile review line

71
Dynamic sediment flocculation: Development of a 2DH model for coastal applications
Sebastian Escobar1, Qilong Bi1,2, Samor Wongsoredjo1, Erik Toorman1
1 Department of Civil Engineering, KU Leuven, Leuven, Belgium, juansebastian.escobarramos @kuleuven.be 2 Flanders Hydraulics Research, Antwerp, Belgium
1. Introduction Winterwerp’s (1998) flocculation model has been adapted to improve the modelling of cohesive sediment suspension transport by a conventional 2DH model. The new parametrizations include new terms accounting for turbulent inertia and floc particles drift and introduces data-based modifications of breaking, aggregation and fractal dimension terms. 2. Methodology The original one-point kinetic model of (Winterwerp, 1998) is extended with advection by currents and waves (Stokes drift) and a turbulent drift velocity 𝑢𝑢𝐷𝐷 (derived from the sediment mass balance equation):
𝜕𝜕𝜕𝜕𝜕𝜕𝜕𝜕 + (𝑢𝑢𝑖𝑖 + 𝑢𝑢𝐷𝐷) 𝜕𝜕𝜕𝜕
𝜕𝜕𝑥𝑥𝑖𝑖= 𝐴𝐴 − 𝐵𝐵 (1)
𝐴𝐴 = 𝑘𝑘𝑎𝑎𝜙𝜙𝜕𝜕4−𝑛𝑛𝐹𝐹𝐺𝐺 (2)
𝐵𝐵 = 𝑘𝑘𝑏𝑏𝜙𝜙(𝜕𝜕 − 𝜕𝜕1)3−𝑛𝑛𝐹𝐹𝜕𝜕2𝐺𝐺3 2⁄ (3)
𝑢𝑢𝐷𝐷 = 1𝐶𝐶
𝜈𝜈𝑡𝑡𝜎𝜎𝑡𝑡
𝜕𝜕𝐶𝐶𝜕𝜕𝑥𝑥𝑖𝑖
(4)
with 𝜕𝜕 the floc size, 𝑢𝑢 the flow velocity, 𝑢𝑢𝐷𝐷 the turbulent drift velocity, 𝐴𝐴 and 𝐵𝐵 the aggregation and breakup source terms. 𝑘𝑘𝑎𝑎 and 𝑘𝑘𝑏𝑏 empirical constants (calibrated to 1600 and 30 respectively), 𝜕𝜕1 the primary particle size. 𝜙𝜙 the volumetric floc concentration, 𝑛𝑛𝐹𝐹 the fractal dimension of the sediment particles’ population (varying with floc density), 𝐺𝐺 the root mean square turbulent shear rate. The source terms have been adjusted to measurements in the Belgian Coast, and the breaking is now a function of the sediment concentration. Also, to calculate the settling velocity, we use a modified version of the empirical Dietrich formula, proposed by (Toorman, 2020):
𝑙𝑙𝑙𝑙𝑙𝑙 𝑤𝑤𝑤𝑤𝑠𝑠
= 𝑏𝑏2(log(1 + 𝜕𝜕∗))2 + 𝑏𝑏3(log(1 + 𝜕𝜕∗))3
+ 𝑏𝑏4(log(1 + 𝜕𝜕∗))4 (5)
𝐶𝐶 the mass concentration of sediment and 𝜎𝜎𝑠𝑠 is a turbulent Schmidt number, likely the same as in the 𝑤𝑤 is the particle settling velocity, 𝑤𝑤𝑠𝑠 the Stokes settling velocity, 𝜕𝜕∗ =((𝜌𝜌𝑓𝑓/𝜌𝜌𝑤𝑤 − 1)𝑙𝑙/𝜈𝜈2)
1 3⁄𝜕𝜕, the non-dimensional diameter,
and 𝑏𝑏2, 𝑏𝑏3 and 𝑏𝑏4 empirical constants. A turbulence inertia correction is also applied to the shear rate. This emulates the memory effect caused by inertia of the flow (e.g. tide reversal).
𝐺𝐺𝑡𝑡 = 𝐺𝐺𝑒𝑒𝑒𝑒 + (𝐺𝐺(𝑡𝑡−Δ𝑡𝑡)−𝐺𝐺𝑒𝑒𝑒𝑒) exp(−𝛥𝛥𝜕𝜕 𝑇𝑇𝑟𝑟⁄ ) (6)
with 𝛥𝛥𝜕𝜕 is the model time-step and 𝑇𝑇𝑟𝑟 the relaxation time, a tuning parameter. 3. Results Equations (1) to (6) were implemented in a combined TELEMAC-TOMAWAC-GAIA model, and validated in
a 2DH model of the Belgian Coast and the Western Scheldt. Modelled variables are in agreement, both in time and magnitude with measurements (see figure 1). Except for the suspended sediment concentration, likely because the measurements and the depth-averaged model results are in a different datum. These results are also in agreement with patterns analysed in the literature of the study area. Maximum floc diameters coincide with slack waters and the maximum concentrations with ebb and flood tides (Baeye et al., 2011). 4. Conclusion A new kinetic formulation of the flocculation process is proposed, implemented and assessed. This set-up is successfully validated in a realistic coastal model, vs measurements.
Figure 1. Time series of mean floc size (d50), suspended concentration (C), and hydrodynamics (h, Hw and U). References Baeye, M., Fettweis, M., Voulgaris, G., Van Lancker, V.
(2011). Sediment mobility in response to tidal and wind-driven flows along the Belgian inner shelf, southern North Sea. Ocean Dynamics, 61(5), 611–622.
Toorman, E.A. (2020). Background on the development and testing of a 2DH flocculation model [Internal Note]. Hydraulics Section, Dept. of Civil Eng., KU Leuven.
Winterwerp, J.C. (1998). A simple model for turbulence induced flocculation of cohesive sediment. Journal of Hydraulic Research, 36(3), 309–326.

72
A sensitivity study of residual transport using a 1DV model J. Vanlede1,2
1 Flanders Hydraulics Research, Antwerp, Belgium. [email protected]
2 Department of Hydraulic Engineering, Delft University of Technology, Delft, Netherlands.
1. Introduction A lot of work has already been done on residual transport of fine sediments. Groen (1967) studies the residual transport in an Eulerian frame of reference, and describes the concentration with a time-relaxation around an equilibrium concentration that varies with U². The model shows that an asymmetry in slack periods can cause residual transport. Gatto et al. (2017) adapt the model of Groen by expressing the time-relaxed depth-averaged concentration in terms of the erosion and deposition fluxes. Their erosion flux is not supply-limited, however. In this paper, we study Eulerian residual transport using a 1DV point model. By introducing a bottom model in the description of the vertical sediment concentration profile (essentially making the description supply-limited), we explicitly include the intratidal variation of the sediment availability in the computation of residual transport. 2. 1DV model The 1DV (vertical) advection-diffusion equation for suspended sediment concentration is given in equation 1:
𝜕𝜕𝜕𝜕𝜕𝜕𝜕𝜕 = −𝑤𝑤𝑠𝑠
𝜕𝜕𝜕𝜕𝜕𝜕𝜕𝜕 +
∂𝜕𝜕𝜕𝜕 (𝐷𝐷𝑣𝑣
𝜕𝜕𝜕𝜕𝜕𝜕𝜕𝜕) + 𝐸𝐸 − 𝐷𝐷 (1)
The source and sink terms are the erosion and deposition flux [kg/m²s]:
E = 𝑚𝑚M(τ−τ𝑐𝑐τ𝑐𝑐) (2)
D = 𝑤𝑤𝑠𝑠C𝑃𝑃𝑠𝑠𝑠𝑠𝑠𝑠 (3) 𝑃𝑃𝑠𝑠𝑠𝑠𝑠𝑠 is the sedimentation probability, which was introduced by van Kessel and Vanlede (2010) and represents a reduction in deposition by parameterizing effects that are not modeled explicitly. Erosion is modeled as a first order process, scaling with the amount of mud in the bottom m. Erosion is supply-limited. The vertical advective and diffusive term are treated implicitly, whereas the source terms E and D are treated explicitly. A central scheme is used for the diffusive flux. The eddy viscosity, and the horizontal velocity (u,v) are read in from a Delft3D model. 3. Application to the Belgian Coastal Zone (BCZ) Both 𝑤𝑤𝑠𝑠 and 𝑃𝑃𝑠𝑠𝑠𝑠𝑠𝑠 influence the vertical sediment distribution. The 1DV model is used in a sensitivity analysis, to study the influence of changing 𝑤𝑤𝑠𝑠 and 𝑃𝑃𝑠𝑠𝑠𝑠𝑠𝑠 on residual transport. The 1DV model is forced with one month of hydrodynamics (12 vertical layers) in station MOW1 in the Belgian Coastal Zone (BCZ). Figure 1 shows an example result for one tidal cycle. The sensitivity analysis shows the strong influence both 𝑃𝑃𝑠𝑠𝑠𝑠𝑠𝑠 and 𝑤𝑤𝑠𝑠 have on the sediment availability in the water column. Increasing 𝑃𝑃𝑠𝑠𝑠𝑠𝑠𝑠 and 𝑤𝑤𝑠𝑠 decreases the sediment mass in the water column and increases the amount stored in the bed (see also bottom right panel in figure 1).
Figure 1: Selected tidal cycle from the 1DV model. Concentration on a tidal ellipse (top), depth averaged velocity and concentration (bottom left) and mass in
bottom and water column (bottom right) Naturally, any parameter that influences when sediment is available in the water column for horizontal advection, also has an impact on the residual transport. This is shown in figure 2 (flood dominance in red).
Figure 2: Residual Transport projected along the Belgian
coastline. Positive is flood dominant
3. Conclusions For the same hydrodynamics, flood or ebb dominance can depend on the choice of the settling velocity and 𝑃𝑃𝑠𝑠𝑠𝑠𝑠𝑠. Furthermore, the sensitivity of the modeled residual transport on 𝑃𝑃𝑠𝑠𝑠𝑠𝑠𝑠 decreases for higher settling velocities. References Gatto, V.M.; van Prooijen, B.C.; Wang, Z.B. (2017). Net
sediment transport in tidal basins: quantifying the tidal barotropic mechanisms in a unified framework. Ocean Dyn. ISBN 1023601710993 67(11): 1385–1406.
Groen, P. (1967). On the residual transport of suspended matter by an alternating tidal current. Netherlands J. Sea Res. 3: 564–574.
van Kessel, T.; Vanlede, J. (2010). Impact of harbour basins on mud dynamics Scheldt estuary: Delft. 35 pp.

73
Flocculation influenced by the presence of algae in the Changjiang Estuary Z. Deng1, 2, C. Chassagne2, Q. He1, Z.B. Wang1, 2, 3
1 State Key Laboratory of Estuarine and Coastal Research, East China Normal University, Shanghai 200241, China.
2 Faculty of Civil Engineering and Geosciences, Delft University of Technology, Delft, Netherlands 3 Deltares, Delft, Netherlands
[email protected] 1. Introduction Flocculation of fine sediment particles, resulting in time and space-dependent settling velocities, plays an important role in the fine sediment dynamics in estuaries (van Leussen, 1988). A large number of studies have been devoted to study flocculation, by field observations, laboratory measurements and modeling (Manning and Dyer, 1999; Winterwerp, 1998). Recent key research confirms the important role of bio-cohesion, especially extracellular products can increase the stability of sediments, due to their stronger interparticle bonding (Paterson et al., 1990; Schindler et al., 2015). Much research has been performed on the flocculation of mixed sediments taking into consideration biological effects. These studies focus on laboratory experiment and modeling (Manning et al., 2010), while in-situ biological effects on suspended sediment flocculation and the mechanisms are still poorly understood. In the present study, we show how the floc properties such as effect density and settling velocity are changing. Furthermore, we would like to compare the dependence of CC/SSC ratio on shear, particle size and position in the water column in winter and in summer, thus the algae role on sediment transport processes will be discussed. 2. Results In this study, we focus on the in-situ observation in Changjiang (Yangtze River) Estuary (with a mean river discharge of 28,000 m3/s and mean suspended sediment D50 of 7–11 μm), and the laboratory measurements with Skeletonema (a representative algae species in Changjiang Estuary). 2.1 The algae effects on floc population
Figure 1: Comparison between in-situ and laboratory flocs particle size distribution.
2.2 Algae-Sediment flocculation processes in esturay
Figure 2: Sketch of the algae-sediment flocculation process in estuary. 3. Conclusions 1. Algae play a major role in particle size distribution and could flocculate with sediment flocs in a different way in different shear condition. 2. The ratio of sediment and algae is the key parameter that influences algae-sediment flocculation particle size distribution. 3. A good correlation is found between the presence of algae and the presence of large, buoyant flocs at the top of the water column in summer. Acknowledgements This work is supported by the PSA project between China (2016YFE0133700) and Netherlands (PSA-SA-E-02). References Manning, A.J., Dyer, K.R., 1999. A laboratory
examination of floc characteristics with regard to turbulent shearing. Marine Geology 160, 147–170.
Manning, A.J., Langston, W.J., Jonas, P.J.C., 2010. A review of sediment dynamics in the Severn Estuary: Influence of flocculation. Marine Pollution Bulletin 61, 37–51.
Paterson, D.M., Crawford, R.M., Little, C., 1990. Subaerial exposure and changes in the stability of intertidal estuarine sediments. Estuarine, Coastal and Shelf Science 30, 541–556.
Schindler, R.J., Parsons, D.R., Ye, L., Hope, J.A., Baas, J.H., Peakall, J., Manning, A.J., Aspden, R.J., Malarkey, J., Simmons, S., Paterson, D.M., Lichtman, I.D., Davies, A.G., Thorne, P.D., Bass, S.J., 2015. Sticky stuff: Redefining bedform prediction in modern and ancient environments. Geology 43, 399–402.
van Leussen, W., 1988. Aggregation of Particles, Settling Velocity of Mud Flocs A Review, in: Dronkers, J., van Leussen, W. (Eds.), Physical Processes in Estuaries. Springer Berlin Heidelberg, Berlin, Heidelberg, pp. 347–403.
Winterwerp, J.C., 1998. A simple model for turbulence induced flocculation of cohesive sediment. Journal of Hydraulic Research 36, 309–326.

74
The characteristics of the organic matter in biomineral flocs M. Fettweis1, M. Schartau2, X. Desmit1, N. Terseleer1, B.J. Lee3, D. Van der Zande1 and R. Riethmüller4
1 ODNature, Royal Belgian Institute of Natural Sciences, Brussels, Belgium. [email protected]
2 GEOMAR Helmholtz Centre for Ocean Research Kiel, Germany 3 Dep.of Advanced Science and Technology Convergence, Kyungpook National University, Gyeongsang-daero, Korea
4 Institute for Coastal Research, Helmholtz-Zentrum, Geesthacht, Germany
1. Introduction Micro-biological processes influence flocculation and thus the transport of the suspended particulate matter (SPM), through the production of polysaccharides such as transparent exopolymer particles (TEP; e.g. Alldredge et al., 1993). The interactions between TEP and SPM have often been studied in open oceans displaying low mineral concentrations, where TEP concentrations are correlated with the rise and decline of phytoplankton blooms (Fukao et al. 2010). In the shallow nearshore areas SPM dynamics and composition is complex due to strong hydrodynamical forces that disturb the bottom sediments and change the floc sizes continuously. However, comprehensive observations are scarce. For the Belgium nearshore and other areas, they show that in winter, when SPM concentration is highest, TEP concentration also has a maximum, while floc sizes are small (e.g. Morelle et al., 2018 and our data). This apparent contradiction indicates that total TEP concentration alone cannot sufficiently explain biophysical flocculation and that a distinction between a more labile or fresh and a more recalcitrant fraction of the OM parameters should be envisaged. The latter fraction is incorporated in the minerals where it is particularly bound to the phyllosilicates (Mayer, 1994), the former one is correlated with phytoplankton blooms. The aim of the study is to discuss the temporal and spatial variation of SPM concentration and floc size in the Belgian part of the North Sea and to relate it to variations of the Particulate Organic Matter (POM) composition and concentration. 2. Methods The composition of the POM was assessed by analysing particulate organic carbon (POC), nitrogen (PON) and TEP concentration together with SPM concentration from water samples collected in the Belgian nearshore. Time series of floc-sizes were measured with a LISST 100X (Agrawal and Pottsmith, 2000). The differentiation between fresh and mineral-associated POM follows the approach of Schartau et al. (2019), who considered Loss-on-Ignition measurements to describe the POM:SPM ratio as a function of SPM concentration. We applied this model to the concentrations of POC, PON, and TEP and related them to the corresponding SPM concentrations. 3. Results Based on all data, the statistical model separated the POM into fresh and mineral associated POC, PON and TEP. The model estimates showed that a large part of the POC, PON and TEP is associated with the mineral fractions throughout the year and that mainly in spring and summer fresh TEP, POC and PON is formed. The dominance of fresh TEP over this part of the year corresponds well with the observed seasonal floc-size (Figure 1).
Figure 1: Floc size (grey) and model estimates of the
fresh (red) and mineral associated (blue) TEP fractions. 4. Conclusions The statistical model approach for TEP, POC, PON results in a set of bulk parameters that separate fresh and mineral associated OM fractions. This approach carves out that the median floc size increases when fresh TEP dominates. This is the case in spring and summer. The mineral associated TEP that dominates over the rest of the year seems to have minor influence. This resolves the above mention contradiction and indicates that fresh TEP is one important control of particle settling in coastal waters. References Agrawal, Y., Pottsmith, H., 2000. Instruments for particle
size and settling velocity observations in sediment transport. Marine Geology 168, 89–114.
Alldredge, A.L., Passow, U., Logan, B.E. (1993). The abundance and significance of a class of large, transparent organic particles in the ocean. Deep-Sea Research ,40,1131–1140.
Fukao, T., Kimoto, K., Kotani, Y. (2010). Production of transparent exopolymer particles by four diatom species. Fishery Science ,76, 755–760.
Mayer, L.M., 1994. Relationships between mineral surfaces and organic carbon concentrations in soils and sediments. Chemical Geology 114, 347-363.
Morelle, J., Schapira, M., Françoise, S., Courtay, G., Orvain, F., Claquin, P. (2018). Dynamics of exopolymeric carbon pools in relation with phytoplankton succession along the salinity gradient of a temperate estuary (France). Estuarine Coastal & Shelf Science 209, 18-29.
Schartau, M., Riethmüller, R., Flöser, G., van Beusekom, J.E.E., Krasemann, H., Hofmeister, R., Wirtz, K. (2019). On the separation between inorganic and organic fractions of suspended matter in a marine coastal environment. Progress in Oceanography, 171, 231-250.

75
Flocculation dynamics in estuarine channel and shallows R.M. Allen 1,2, D.N. Livsey3, and J.R. Lacy2
1 Civil and Environmental Engineering, University of California, Berkeley, CA, USA. [email protected]
2 Pacific Coastal and Marine Science Center, U.S. Geological Survey, Santa Cruz, CA, USA 3 School of Biology & Environmental Science, Queensland University of Technology, Brisbane, Australia
1. Introduction Studies of settling velocity (ws) in San Francisco Estuary (SFE) have yielded conflicting conclusions: work in northern regions of SFE shows that flocs are larger during slack water (Huang 2017). Meanwhile, work in South SFE reveals that flocs are larger during flood and ebb (Manning and Schoellhamer 2013; Livsey et al 2020). We hypothesize that this apparent geographic disparity is in fact related to total water depth: in shallow regions floc breakup through the full water column is driven by bottom-generated turbulence, while deeper channels allow for larger particles to settle during slack water, yielding an apparent decrease in particle size at slack. 2. Methods We collected data at a channel and a shallows site in South SFE during a 2-week period in July 2020. At each site, bottom-mounted frames with upward-looking ADCPs collected current and turbulence information, high-frequency sensors collected wave statistics, and near-bed CTDs, ADVs, and LISSTs collected salinity, temperature, high-frequency near-bed velocity, and suspended particle size information. We also collected profiles of salinity, temperature, and suspended particle size at the two sites over four 6-hour periods during the deployment, as well as grab samples for visual analysis of suspended particle size with a FlocCam. 3. Results We collected profiles in the channel during strong flood and at high slack (figure 1). LISST profiles show two dominant peaks in particle size: near 80 µm and 300 µm (figure 2). Grain size analysis of disaggregated bed material shows that both the channel and shallows have dominant peaks at 5.5 and 26 µm, while the channel has an additional peak at 125 µm. Particle size distributions of suspended material is therefore not driven solely by sediment locally available on the bed.
Figure 1: Total water depth (m) and near-bed along-channel velocity (flood positive, m/s) collected at the
channel site. Time periods of profiles shown in figure 2 are marked with vertical lines.
Figure 2: Volume concentration in µL/L (color) of
particles of size 10-400 µm (x-axis) at water depths 1-13 m below surface (y-axis). (a) Profile collected mid-flood at 20:10 on 21 Jul 2020; (o) mean size at each
depth. (b) Profile collected near high slack at 22:01 on 21 Jul 2020; (x) mean size. Mean floc size at each depth
from (b) is marked in (a), and vice versa. Sediment concentration is much lower through the water column at high slack (figure 2b) than mid-flood (figure 2a), and depth averaged mean particle size is larger during slack (b) than mid-flood (a). Preliminary interpretations suggest that particles are aggregating and settling during slack water in the channel. Additional analyses investigate particle size results generated by LISST and by FlocCam instrumentation, compare turbulence through the water column with suspended particle size, and probe the influence of waves on suspended particle size distributions. This detailed analysis of particle flocculation and 𝑤𝑤𝑠𝑠 can support numerical model development in SFE and in estuarine systems around the world as the models attempt to address the role of flocculation and breakup in sediment fluxes. References Huang, I.B. (2017). Cohesive sediment flocculation in a
partially-stratified estuary. Stanford University PhD Dissertation.
Livsey, D.N., Downing-Kunz, M.A., Schoellhamer, D.H., Manning, A. (2020). Suspended Sediment Flux in the San Francisco Estuary: Part I-Changes in the Vertical Distribution of Suspended Sediment and Bias in Estuarine Sediment Flux Measurements. Estuaries and Coasts, 43.
Manning, A.J., Schoellhamer, D.H. (2013). Factors controlling floc settling velocity along a longitudinal estuarine transect. Marine Geology, 345.

76
A quantitative examination of floc structure considering turbulence, salinity and sediment concentration
C. Guo1, 2, A.J. Manning3, S. Bass3, L. Guo2, Q. He2 1Department of River Research, Changjiang River Scientific Research Institute of Changjiang Water Resources
Commission, Wuhan 430010, China. [email protected] 2State Key Laboratory of Estuarine and Coastal Research, East China Normal University, Shanghai 200241, China 3School of Biological and Marine Sciences, University of Plymouth, Plymouth, Devon PL4 8AA, United Kingdom
1. Introduction Different from the primary particles or non-cohesive sediment, the floc structure is multi-branched and it was highly variable during floc aggregation and break up processes (Maggi, 2007; Moruzzi et al., 2017). However, it remains an open question how environmental conditions, flocculation processes and floc sizes may affect floc structures and floc fractal dimensions (Nf). To improve understanding of the controls on floc structure and fractal dimensions, a series of controlled laboratory experiments were conducted with measurements of floc size and settling velocity under various levels of turbulent shearing (G), salinity and suspended sediment concentration (SSC). The aim was to further explore how floc structure evolved in response to varying environmental conditions, which would improve the prediction in the transportation of cohesive sediment as well as adherent contaminants and nutrients. 2. Laboratory experiments Laboratory experiments were conducted in an annular flume (Fig. 1). Floc properties were obtained by the LabSFLOC-2 instrument (Manning et al., 2010). The sediment used in the experiments were samples from the turbidity maxima zone of the Yangtze Estuary, China. The D50 of the sediment samples was 11.7 μm. The laboratory experiments included 18 runs (Tab. 1).
Figure 1: Schematic diagram of experimental setup
Table 1: Summary of experimental cases
3. Results and discussion A total of 5963 flocs were measured in 18 experiments. Results showed that the single point floc size D ranged
between 20 μm and 413 μm, 45.7% of which were over 120 μm. Ws varied from 0.2 mm s-1 to 10.0 mm s-1, with the median Ws of 1.2 mm s-1. The estimated minimum and maximum floc effective densities 𝜌𝜌𝑒𝑒 were 3.6 kg m-3 and 1691 kg m-3, respectively. Based on the experimental results, effects of key factors on floc size development, variations of floc fractal dimension, and implication of fractal dimension for floc density were discussed. 4. Conclusions As G increased, floc size showed a trend of increasing first and then decreasing, with the peak value in the medium shear rate of G=40 s-1 and G=20-30 s-1 for freshwater and saltwater, respectively. As floc grow in size, Nf decreased and the variation scatter of Nf presented a decreasing tendency. Turbulent shear rate played an important role in controlling floc structure. The mean Nf under freshwater and 7‰ saltwater conditions increased by approximately 37% and 28% from the low turbulent shear rate of G=10 s-1 to the high value at G=65 s-1, respectively. Nf in freshwater was greater than in saltwater, in particular under the moderate to strong turbulence (G=30-65 s-1). SSC had showed no significant effects on the variation of Nf, but further studies in terms of higher SSC should be conducted before conclusions can be made. An improved simulation method with variable characteristic floc fractal dimension Fc was proposed and it was more effective in the simulation of variation of floc effective density with floc size compared to the Kranenburg (1994) method and the original Khelifa and Hill (2006) method. References Khelifa, A., Hill, P. S. (2006). Models for effective density
and settling velocity of flocs. Journal of Hydraulic Research, 44, 390-401.
Kranenburg, C. (1994). The fractal structure of cohesive sediment aggregates. Estuarine, Coastal and Shelf Science, 39, 451-460.
Maggi, F. (2007). Variable fractal dimension: A major control for floc structure and flocculation kinematics of suspended cohesive sediment. Journal of Geophysical Research: Ocean, 112, 1-12.
Manning, A. J., Baugh, J. V., Spearman, J.R., Whitehouse, R.J.S. (2010). Flocculation settling characteristics of mud: sand mixtures. Ocean Dynamics, 60, 237-253.
Moruzzi, R.B., Oliveira, A.L., Conceicao, F.T., Gregory, J., Campos, L.C. (2017). Fractal dimension of large aggregates under different flocculation conditions. Science of the Total Environment, 609, 807-814.

77
Long term flocculation of kaolin clay in the absence of gravity B. Vowinckel1,2, P. Luzzatto-Fegiz2, N. Rommelfanger2,3, F. Kleischmann1, and E. Meiburg2
1 Leichtweiß-Institute for Hydraulic Engineering and Water Resources, Technische Universität Braunschweig,
Braunschweig, Germany. [email protected] 2 Department of Mechanical Engineering, University of California Santa Barbara, Santa Barbara, USA.
3 Department of Physics, University of California, Santa Barbara, CA 93106
1. Introduction Earth-bound experiments of clay flocculation are usually influenced by the effects of settling due to gravity (Lick et al, 1993), which does not allow to investigate the effects of cohesive forces in isolation. This setup severely limits our understanding of flocculation processes over longer time scales that are more common in the ocean (Meiburg and Kneller, 2010). To address this issue, we performed a campaign of microgravity experiments onboard the International Space Station (ISS) combined with particle-resolved Direct Numerical Simulations (pr-DNS) to study the flocculation behaviour of kaolin suspension in the absence of gravity and shear. 2. Microgravity experiments We built upon a previous experimental campaign to investigate the settling of kaolin in saline water (Rommelfanger et al., 2020). Cuvettes that hold a volume of [10 × 45 × 4]mm of saline water with 35 PSU (NaCl, Sigma-Aldrich 746398) were prepared in an earth-bound laboratory with a clay suspension of 8 ppt kaolin (Sigma-Aldrich 18616). The cuvette was stored for as short a period of time as possible before they were flown to the ISS. At the ISS, the cuvette was placed in the Binary Colloidal Alloy Test (BCAT) apparatus (Sabin et al., 2012), which comprises a rack holding the cuvette at a fixed distance to a camera (Nikon D2Xs with 60 mm lens). At the start of the experiment, the suspension was stirred to a homogenous suspension with a magnetic bar that was placed inside upon the initial preparation.
Figure 1: Flocculation over time for the ISS
experiments. The insets show pictures of the initial and final suspension configuration
The suspension was monitored by taking pictures at regular time intervals over a period of more than 100 days. The flocculation process was analysed by computing a correlation length that quantifies the emergence of larger aggregates (Figure 1). The average aggregate diameter grows as 𝑑𝑑~𝑡𝑡1/2, which is more
rapidly than would have been expected from Brownian motion. We, hence, hypothesize that the aggregation growth is partly due to the jitter onboard the ISS. 3. Particle-resolved direct numerical simulations We performed corresponding pr-DNS following the scheme proposed by Vowinckel et al. (2019) to reproduce the growth of clay aggregates in a more controlled setting. To this end, spherical primary particles of diameter 𝑑𝑑𝑝𝑝 were randomly placed in a triple-periodic box and exposed to an oscillatory flow to mimic jittering motion. A snapshot of a preliminary simulation is shown in Figure 2. Larger simulations that will reveal the governing mechanisms of enhanced aggregate growth are underway.
Figure 2: Preliminary simulation result with 52 particles
in a horizontally oscillating flow. Top: initial configuration; bottom: after 100 oscillation periods.
Acknowledgments This work was supported by NSF ENG CBET Fluid Dynamics award #1638156 and the German Research Foundation (DFG) grant VO2413/2-1. References Lick, W., Huang, H., & Jepsen, R. (1993). Flocculation
of fine‐grained sediments due to differential settling. Journal of Geophysical Research: Oceans, 98(C6), 10279-10288.
Meiburg, E., & Kneller, B. (2010). Turbidity currents and their deposits. Annual Review of Fluid Mechanics, 42, 135-156.
Rommelfanger, N., Vowinckel, B., Wang, Z., Meiburg, E., & Luzzatto-Fegiz, P (2020). A simple theory and experiments for onset of flocculation in kaolin clay suspensions. In River Flow 2020 (pp. 820-822). CRC Press.
Sabin, J., Bailey, A. E., Espinosa, G., & Frisken, B. J. (2012). Crystal-arrested phase separation. Physical Review Letters, 109(19), 195701.
Vowinckel, B., Withers, J., Luzzatto-Fegiz, P., & Meiburg, E. (2019b). Settling of cohesive sediment: particle-resolved simulations. Journal of Fluid Mechanics, 858, 5-44.

78
Lateral sediment exchange mechanisms in the Ems estuary D. S. van Maren1,2,3*, J. Vroom1, and D. van Keulen1,4
1 Deltares, Delft, the Netherlands
2 State Key Laboratory for Estuarine and Coastal Research, ECNU, China 3 Delft University of Technology, Delft, the Netherlands
4 Department of Environmental Sciences, Wageningen University and Research, Wageningen, the Netherlands
Figure 1: Sediment fluxes (in million ton/year) in the Ems estuary (3.5 million ton/year) and towards the lower Ems river (0.8 million ton/year), with an anticlockwise horizontal circulation cell in the transition zone suggesting sediment transport over the Geise dam (black line). Orange fluxes are based on dredging volumes, red fluxes on observations, and blue fluxes are estimated.
1. The Ems estuary The Ems estuary is the transition zone of the lower Ems river and the Wadden Sea and is located on the Dutch-German border. The lower Ems river and estuary are connected through the Emden fairway and separated from the Dollard basin in the south by muddy tidal flats on which a training wall is constructed (the so-called Geise dam). The estuarine suspended sediment concentration has increased in the past decades, which negatively impacts its ecological value and leads to high maintenance dredging costs (e.g. de Jonge et al., 2014). The sediment concentrations in the tidal river increased several orders of magnitude in response to channel deepening. The sediment concentrations in the outer estuary also increased, albeit much less pronounced than the tidal river and for reasons which are still not completely understood. This uncertainty partly arises from the complex sediment exchange mechanisms between the tidal river and the estuary. 2. Longitudinal exchange mechanisms The tidal river becomes progressively flood dominant in the upstream direction, efficiently trapping sediments and leading to sediment concentrations of several 10’s of g/l. Sediment is primarily of marine origin, and has therefore been supplied by the Ems estuary. However, the Emden fairway is ebb-dominant (Pein et al., 2014). A classic salinity-driven gravitational circulation is present in the fairway, providing the main potential longitudinal landward transport mechanism. Numerical model simulations suggested that this mechanism is too weak to counterbalance the seaward diffusive flux resulting from tidal currents and the steep longitudinal sediment concentration gradient. This fueled the setup of a large-scale measurement campaign in and around the Emden
fairway in 2018 and 2019, involving 8 simultaneously operating research vessels and 10 measurement frames. Measurements within the fairway confirmed that salinity-driven currents are indeed weak, and that the residual transport is directed seaward. Apparently, sediment transport towards the Ems river is not the result of longitudinal sediment exchange mechanisms. 3. Lateral exchange mechanisms The observations also revealed a landward residual flux into the Dollard, of comparable magnitude to the seaward-directed residual sediment flux in the fairway. The Geise dam in its current neglected state is semi-permeable, and partly overflown at high water. Flow velocity observations over the Geise dam suggest a substantial residual water flux from the Dollard to the fairway, which in combination with more energetic wave conditions leads to sediment transport from the Dollard into the fairway. Apparently, an anti-clockwise circulation cell exists which drives sediment exchange between the estuary and the tidal river in which the Dollard plays an important role. These new insights are crucial for understanding estuarine sediment dynamics, and for design of sustainable solutions for improving the ecological state of the estuary. References De Jonge, V. N. et al. (2014). The influence of channel deepening on estuarine turbidity levels and dynamics, as exemplified by the Ems estuary. Estuarine Coastal and Shelf Science, 139, 46–59. Pein, J.U., et al. (2014). The tidal asymmetries and residual flows in Ems Estuary. Ocean Dynamics (2014) 64:1719–1741.

79
Dynamics of suspended particulate matter properties in the Maroni estuary M. Chapalain1,2, G. Detandt2, K.A. Do1,3, A. Gardel1, N. Huybrechts3, T. Maury1 and A. Sottolichio2
1 URS 3456 LEEISA, CNRS, University of Guyane, IFREMER, Cayenne, French Guiana. [email protected]
2 UMR 5805 EPOC, University of Bordeaux, Pessac, France 3 CEREMA, HA Research Team, Margny-lès-Compiègne, France
1. Introduction Unlike their temperate counterparts, tropical estuaries and their related hydro-sedimentary processes are still less documented as it is the case for estuaries along the Guiana coast. They present the original feature of being influenced by the migration of large coastal mud banks originating from the Amazon river. These latter are an important source of fine sediments entering in the estuarine system whereas riverine contributions characterized by low suspended particulate matter concentrations (SPMC) are minor (Jouanneau and Pujos, 1987; Jouanneau and Pujos, 1988; Sondag et al., 2010). In estuaries, SPM characteristics such as settling velocity, of key importance for modelling sediment transport, can be highly variable in relation with natural forcings. Studying sediment properties is thus crucial to understand and predict their fate. The case of the Maroni estuary, a preserved tropical estuary characterized by two sediment sources, is of particular interest. The aim of this work is to study the dynamics of SPM and their characteristics in order to complete the preliminary observations on hydro-sedimentary processes of the Maroni estuary. 2. Field measurements Based on a combination of previous field campaigns and a future one planned on April 2021, this study is focusing on investigating SPM dynamics in terms of concentration, size, density, settling velocity through in situ deployments of turbidimeter and LISST-100X. 2.1 Previous field campaigns Previous field campaigns were conducted from 2016 to 2019 within the Maroni estuary. During these surveys, measurements in the water column were carried out simultaneously at 3 fixed stations through vertical profiles of salinity (CTD), direction and velocity of tidal currents (Aquadopp or ADCP) and turbidity (OBS-5+ or MPx) at 30-min intervals along the 12-h tidal cycle. Vertical profiles of sanility and turbidity were also realized in the main navigation channel through along-channel transects around high tide and low tide. 2.2 Future survey A complementary survey is planned on April in order to investigate dynamics of SPM characteristics, by adding a LISST-100X probe to measure the particle size distribution during the wet season. 3. Laboratory analysis In parallel of in situ measurements, water samples will be collected from a horizontal Niskin bottle sampler for quantifying SPM concentration and particulate organic matter (loss on ignition method). Some of the samples will be dedicated for measuring primary particle size after chemical deflocculation using a laboratory particle size
analyzer and mineral composition using X-ray fluorescence (major elements) and X-Ray diffraction (clay mineralogy). 4. First results and perspectives One along channel transect conducted at high tide during the wet season is shown in Figure 1. Two water masses featuring contrasted values of turbidity and salinity are observed: a turbidity maximum zone exceeding 2 g.l-1 with a strong vertical gradient is located at bottom and corresponds to the marine waters while a freshwater layer with a low SPM concentration around 0.15 g.l-1 is spreading above the saline waters. These results suggest the presence of two sediment stocks, one mineral-enriched behaving like an estuarine turbidity maximum, oscillating along the estuary with the tide and the river discharge, and one more recent and less turbid with riverine SPM provided during high river discharge episodes. Further measurements including SPM characteristics analysis are of particular interest to complete these first observations.
Figure 1: Salinity gradient (a) and SPM concentration (b) in the Maroni estuary along the main navigation
channel at high tide during the wet season (June 2017). References Jouanneau, J.M., Pujos, M. (1987). Suspended matter and
bottom deposits in the mahury estuarine system (French Guiana): environmental consequences. Netherlands Journal of Sea Research, 21 (3), 191-202.
Jouanneau, J.M., Pujos, M. (1988). Suspended matter and bottom deposits in the maroni estuarine system (French Guiana). Netherlands Journal of Sea Research, 22 (2), 99-108.
Sondag, F., Guyot, J.L., Moquet, J.S., Laraque, A., Adele, G., Cochonneau, G., Doudou, J.C., Lagane, C., Vauchel, P. (2010). Suspended sediment and dissolved load budgets of two Amazonian rivers from the Guiana Shield: Maroni River at Langa Tabiki and Oyapock River at Saut Maripa (French Guiana). Hydrological Processes. 24, 1433–1445.

80
Near bed cohesive sediment dynamics in Montevideo bay Rodrigo Mosquera1 and Francisco Pedocchi1
1 Instituto de Mecanica de los Fluidos e Ingenieria Ambiental -IMFIA-, Facultad de Ingenieria, Universidad de la
Republica, Uruguay. [email protected] 1. Introduction The Montevideo bay hosts the main Uruguayan port in the Río de la Plata fluvial-estuarine system. With siltation rates of approximately 1 m/year (or higher when traffic is reduced), sub-aquatic sedimentation and associated dredging is one of the main operational costs of the Montevideo Port. Previous studies by IMFIA have proposed that the observed siltation rates could be associated to a high concentrated fluid mud layer transported close to the bed. 2. Methods A mooring structure specially designed to study the near bed sediment dynamics over muddy bottoms was deployed for over five months in front of Montevideo. The mooring structure included: a Vector Acoustic Doppler Velocimeter (ADV) placed 30 cm above the seabed; a downward looking AQUAscat 1000R multi-frequency Acoustic Backscatter Sensors (ABS) placed 40 cm above the seabed and two Turbidimeters placed 20 cm and 50 cm above the bed. The deployment site was selected due to its proximity to an oceanographic buoy instrumented with an Acoustic Doppler Current Profiler (ADCP) and Conductivity and Temperature Sensors (CT). To avoid any biases on the ABS sediment concentration estimations, laboratory calibrations were performed. The laboratory conditions reproduced calm and storm events, fresh and saline waters, and consolidation-resuspension cycles. It was found that the entrainment formula of Smith and McLean (1977) performed very well in this environment. The near bed sediment concentrations were obtained from the ABS field data under equilibrium conditions, and the bed shear stresses were computed from the ADV field data combined with the hydrodynamic model of Madsen (1994). The calibrated entrainment formula allowed to implement an analytical model of Styles and Glenn (2000), which accounts for self-stratification effects under combine wave-current flow, and allowed accurately predict the near bed sediment transport in a 30 cm thick layer close to the bed. 3. Results After three days of calm weather conditions, a wave dominated event can be observed in Figure 1. During the first displayed hours, current velocities 𝑈𝑈𝑐𝑐 (first panel), wave orbital velocities 𝑈𝑈𝑜𝑜𝑜𝑜𝑜𝑜 and shear stress |�̃�𝜏𝑜𝑜| (second panel) presented small increments. Then, from 4 AM to 9 AM, 𝑈𝑈𝑐𝑐 became weaker but both 𝑈𝑈𝑜𝑜𝑜𝑜𝑜𝑜 and |�̃�𝜏𝑜𝑜| increased. The acoustical estimation of the averaged sediment concentration �̅�𝑀 (third panel) increased, as sediment was entrained into suspension, forming a concentrated sediment layer (fluid mud) with concentrations above 50 kg/m3. The top of the fluid mud layer 𝛿𝛿𝐿𝐿 (third panel) reached 7 cm above the bed. As the currents became stronger, the maximum near bed
sediment transport 𝑄𝑄𝑠𝑠𝑜𝑜 predicted by Styles and Glenn (2000) reached almost 0.2 kg/(ms) (lower panel).
Figure 1: Wave dominated event during June 7-8, 2018. 4. Conclusions The data collected during the whole field experiment showed that the mixing due to high waves was confined to the lower region of the water column, with the eroded sediment remaining close to the bed. This generated strong concentration and density gradient that resulted in stratification. This sediment generated stratification was able to inhibit the turbulent mix towards the entire water column that the coexisting currents would have produced. Sediment generated stratification enabled the formation of fluid mud layers with concentrations above 100 kg/m3 and stable lutoclines at up to 10 cm high above the bed. This high concentrated layer could be easily transported by currents, which can regularly reach more than 1 m/s. The computed sediment transport using the Styles and Glenn (2000) model for the whole five months dataset was able to explain the averaged sedimentation rates observed by the Montevideo port’s authorities in the access channel. Acknowledgments The authors want to thank the financial support of ANII and CSIC, Uruguay. Thanks also to the IMFIA’s workshop, and Technodive SRL for their priceless help. References Madsen, O. S. (1994). Spectral wave-current bottom
boundary layer flows. Coastal Engineering 1994, volume 24, pages 384–398.
Smith, J. D. and McLean, S. R. (1977). Spatially averaged flow over a wavy surface. Journal of Geophysical Research, 82(12):1735–1746.
Styles, R. and Glenn, S. M. (2000). Modeling stratified wave and current bottom boundary layers on the continental shelf. Journal of Geophysical Research: Oceans, 105(C10):24119–24139.

81
The Sediment Flux in Salt marsh Tidal channel systems J.Sun1,2, B.C. v. Prooijen1, X.Wang2, Q.He2, Z.Wang1,3
1 Department of Hydraulic Engineering, Delft University of Technology, Delft, Netherlands
2 State Key Laboratory of Estuarine and Coastal Research, East China Normal University, Shanghai, China 3Department of Marine and Coastal Systems, Deltares, Delft, Netherlands
1. Introduction The potential of salt marshes to keep pace with sea level rise depends on the flux of sediment towards the salt marshes. Seasonal and the effects of inundation on the process of sediment transport in creeks are both significant. The objective of the current study is to investigate the role of salt marsh tidal channel systems in delivering sediment and to identify the mechanisms that lead to net fluxes. We distinguish the contribution of the main channel and the secondary channel. Previous research stated that flood-ebb SSC differential is an indicator of the direction of sediment flux in salt marshes (Nowacki and Ganju, 2019). In this paper, we verify this statement and explore the influence of net water discharge on the net sediment flux direction and magnitude. 2. Methods Field campaigns were conducted at a salt marsh within the Yangtze Estuary, see Figure 1. Measurements were conducted in a main channel and in a secondary channel in summer (flood season) and in winter (dry season). Underbank flow and overbank flow conditions were measured. Water depths, velocities and suspended sediment concentration data were collected by using ADCPs and OBSs.
Figure 1: (a) Map of the Yangtze Estuary; (b) Map of
the southern salt marshes of eastern Chongming Island; (c) Map of the study area showing locations of
measurement site in the main channel and secondary channel (Red triangles represent the measuring
locations). 3. Results The sediment flux was estimated by using the measured depth, velocity profile and sediment concentration. For each tidal cycle, the net flux of water (ΔQ) and the net sediment (ΔF) were subsequently determined. Furthermore, the differential of SSC (ΔC) between flood and ebb was defined per tide. These tide-averaged quantities provide the possibility to identify the dominant mechanisms, see Figure 2. Generally, a net inflow of water is found for underbank flow and a net outflow is found for overbank flow. This
is the case for the main channel and for the secondary channel. For almost all tides, the concentration during flood is higher than the concentration during ebb. This implies an abundance of sediment outside the salt marsh system on the mud flats. A sediment import through the main channel was found for both underbank flow and overbank flow, despite of the season. A large import was found for a high concentration or for a high net water discharge. It is noted that a combination of a high positive net discharge and a high concentration difference between ebb and flood was not measured. Export was measured in the secondary channel during conditions with higher concentrations during flood than during ebb. For those conditions, a net export of water was found. For larger concentration differences between flood and ebb, the flux turns positive, implying a net import of sediment, even for export of water. 4. Conclusion Our measurements largely confirm the hypothesis of Nowacki&Ganju (2019): the sediment concentration differential indicates the direction of the flux. However, we found several tides, for which the export of water was large enough to lead to export of sediment for a positive concentration differential, falsifying the hypothesis.
Figure 2: The relationship among ΔC (differential of
SSC between flood and ebb), ΔQ (net discharge) and ΔF (net sediment flux) for each tide cycle. (Points with
edges represent overbank tides) Acknowledgments This study is conducted in the framework of the project ‘Coping with deltas in transition’ within the Programme of Strategic Scientific Alliances between China and the Netherlands (PSA), financed by the Chinese Ministry of Science and Technology (MOST) and the Royal Netherlands Academy of Arts and Sciences (KNAW). References Nowacki, D. J., & Ganju, N. K. (2019). Simple metrics
predict salt-marsh sediment fluxes. Geophysical Research Letters, 46(21), 12250-12257.

82
Intertidal mudflats can (not) survive sea level rise F. Grasso1, B. Mengual1†, P. Le Hir1 and J.-P. Lemoine2
1 Ifremer – DYNECO/DHYSED, Centre de Bretagne, CS 10070, F-29280 Plouzané, France. [email protected]
2 GIP Seine-Aval, Hangar C - Espace des Marégraphes, Quai de Boisguilbert, F-76000 Rouen, France. †Now at SAS Benoit Waeles – Consultant Génie Côtier, 53 rue du Commandant Groix, F-29200 Brest, France.
1. Introduction In the context of global changes, i.e. climatic and anthropogenic changes, estuarine environments are subject to severe pressures. Mean sea level rise (MSLR) is expected to affect estuarine morphodynamics, inducing potential modifications of physical habitats. Among the most biodiverse and productive estuarine areas, intertidal mudflats are particularly sensitive to hydro-meteorological forcing. However, their response to MSLR strongly differs between estuaries. It is not clearly understood yet if such mudflats would keep pace with the different forecasts of MSLR. Based on the numerical modelling of a macrotidal estuary over 50 years, this work aims at understanding why some intertidal mudflats can adapt to MSLR and why others do not. The study outcomes should provide more insights into the effects of climate change on estuarine habitats. 2. Methods The numerical modelling strategy is based on the curvilinear hydrostatic model (MARS3D) of the Seine Estuary (NW France), forced by realistic wind, tidal components and river supplies. It is coupled to a wave model (WAVEWATCH III®) and an advection-diffusion multi-layer sediment module (MUSTANG) for mud and sand mixtures (Mengual et al., 2020). Maintenance dredging and dumping activities are also taken into account. The simulation of the estuarine morphodynamics over 50 years results from ten successive simulations of the year 2016 with a morphological acceleration factor of 5. Two contrasted MSLR scenarios were considered based on RCP 2.6 (+3 mm/year) and RCP 8.5 (+24 mm/year). MSLR was incremented every five years. 2. Results 50-year simulations with both MSLR scenarios (i.e. +0.135 m for RCP 2.6 and +1.08 m for RCP 8.5) present similar results in terms of final hypsometry. Intertidal areas are essentially maintained: upper intertidal areas increase for both scenarios (+5%), but a slight decrease of lower intertidal areas is observed for the high MSLR scenario (-2%). This behaviour is balanced by a significant loss of the shallowest subtidal flats (-30%). At the mouth, the estuary morphodynamics is associated with an accretion of the banks and their progradation seaward. Following typical cross-shore mudflats within the estuary (Figure 1), the morphological evolution is characterized by channel deepening and intertidal flat accretion. These results illustrate a global morphological adaptation of the estuary along with the MSLR. However, intertidal mudflats do not keep pace at the same rate, even under the moderate MSLR scenario, suggesting that mudflat adaptation also depends on local morphodynamic equilibrium.
3. Conclusions This study highlights that over 50 years a high MSLR is not necessarily associated with a loss of intertidal areas, as an estuarine system can adapt if sufficient sediment is available. However, the results also reveal that even with a moderate MSLR, some intertidal mudflats cannot keep pace and are likely to recede. Such a behaviour would mainly result from an equilibrium adjustment rather than a MSLR consequence. Acknowledgments This study was conducted in the framework of the MORPHOSEINE and MEANDRES projects, funded by the Seine-Aval 6 scientific research programme. References Mengual, B., Le Hir, P., Rivier, A., Caillaud, M., Grasso,
F. (2020). Numerical modeling of bedload and suspended load contributions to morphological evolution of the Seine Estuary (France). International Journal of Sediment Research.
Figure 1. (Top panel) Initial morphology of the Seine Estuary mouth (elevation z above mean sea level at ‘y0’). Morphological evolution over 50 years of the cross-shore transect ‘AB’ (see top panel) with a MSLR of (middle panel) +3 mm/year ‘RCP 2.6’, and (bottom panel) +24 mm/year ‘RCP 8.5’. Horizontal lines represent (blue) initial ‘y0’ and (brown) final ‘y50’ high water ‘HW’, mean water ‘MW’ and ‘low water ‘LW’ levels.
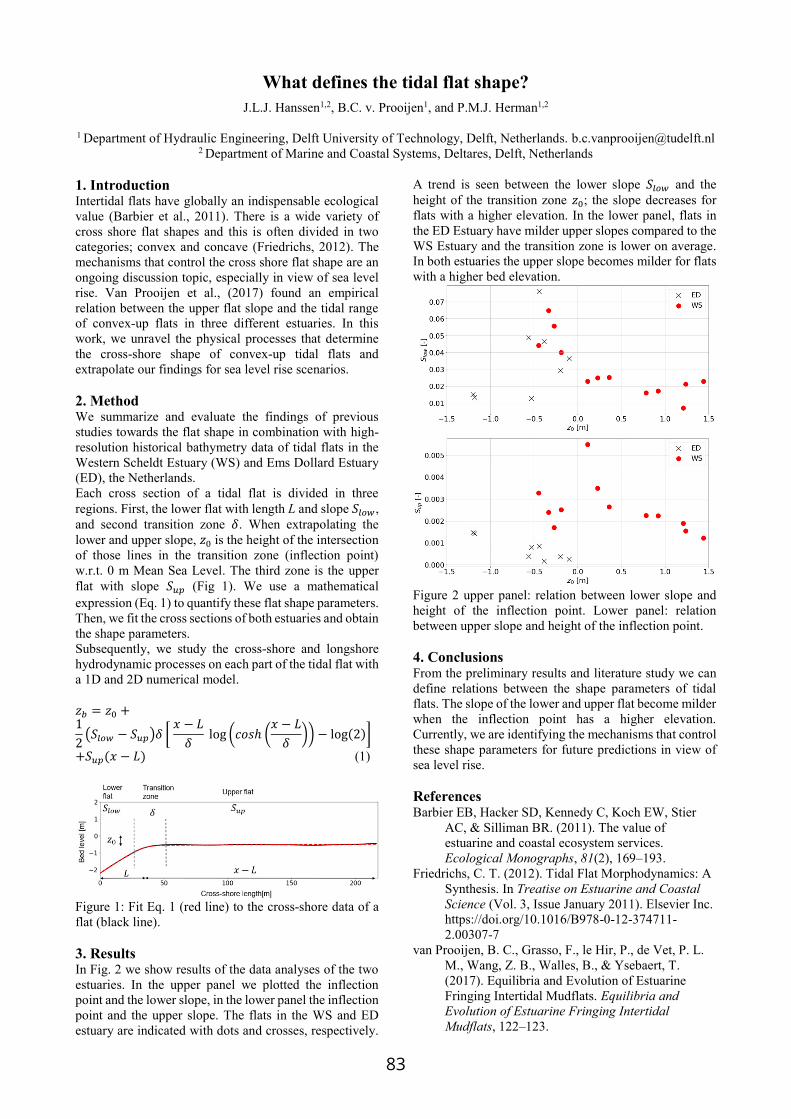
83
What defines the tidal flat shape? J.L.J. Hanssen1,2, B.C. v. Prooijen1, and P.M.J. Herman1,2
1 Department of Hydraulic Engineering, Delft University of Technology, Delft, Netherlands. [email protected]
2 Department of Marine and Coastal Systems, Deltares, Delft, Netherlands
1. Introduction Intertidal flats have globally an indispensable ecological value (Barbier et al., 2011). There is a wide variety of cross shore flat shapes and this is often divided in two categories; convex and concave (Friedrichs, 2012). The mechanisms that control the cross shore flat shape are an ongoing discussion topic, especially in view of sea level rise. Van Prooijen et al., (2017) found an empirical relation between the upper flat slope and the tidal range of convex-up flats in three different estuaries. In this work, we unravel the physical processes that determine the cross-shore shape of convex-up tidal flats and extrapolate our findings for sea level rise scenarios. 2. Method We summarize and evaluate the findings of previous studies towards the flat shape in combination with high-resolution historical bathymetry data of tidal flats in the Western Scheldt Estuary (WS) and Ems Dollard Estuary (ED), the Netherlands. Each cross section of a tidal flat is divided in three regions. First, the lower flat with length L and slope 𝑆𝑆𝑙𝑙𝑙𝑙𝑙𝑙 , and second transition zone 𝛿𝛿. When extrapolating the lower and upper slope, 𝑧𝑧0 is the height of the intersection of those lines in the transition zone (inflection point) w.r.t. 0 m Mean Sea Level. The third zone is the upper flat with slope 𝑆𝑆𝑢𝑢𝑢𝑢 (Fig 1). We use a mathematical expression (Eq. 1) to quantify these flat shape parameters. Then, we fit the cross sections of both estuaries and obtain the shape parameters. Subsequently, we study the cross-shore and longshore hydrodynamic processes on each part of the tidal flat with a 1D and 2D numerical model. 𝑧𝑧𝑏𝑏 = 𝑧𝑧0 + 12 (𝑆𝑆𝑙𝑙𝑙𝑙𝑙𝑙 − 𝑆𝑆𝑢𝑢𝑢𝑢)𝛿𝛿 [ 𝑥𝑥 − 𝐿𝐿
𝛿𝛿 log (𝑐𝑐𝑐𝑐𝑐𝑐ℎ (𝑥𝑥 − 𝐿𝐿𝛿𝛿 )) − log(2)]
+𝑆𝑆𝑢𝑢𝑢𝑢(𝑥𝑥 − 𝐿𝐿) (1)
Figure 1: Fit Eq. 1 (red line) to the cross-shore data of a flat (black line). 3. Results In Fig. 2 we show results of the data analyses of the two estuaries. In the upper panel we plotted the inflection point and the lower slope, in the lower panel the inflection point and the upper slope. The flats in the WS and ED estuary are indicated with dots and crosses, respectively.
A trend is seen between the lower slope 𝑆𝑆𝑙𝑙𝑙𝑙𝑙𝑙 and the height of the transition zone 𝑧𝑧0; the slope decreases for flats with a higher elevation. In the lower panel, flats in the ED Estuary have milder upper slopes compared to the WS Estuary and the transition zone is lower on average. In both estuaries the upper slope becomes milder for flats with a higher bed elevation.
Figure 2 upper panel: relation between lower slope and height of the inflection point. Lower panel: relation between upper slope and height of the inflection point. 4. Conclusions From the preliminary results and literature study we can define relations between the shape parameters of tidal flats. The slope of the lower and upper flat become milder when the inflection point has a higher elevation. Currently, we are identifying the mechanisms that control these shape parameters for future predictions in view of sea level rise. References Barbier EB, Hacker SD, Kennedy C, Koch EW, Stier
AC, & Silliman BR. (2011). The value of estuarine and coastal ecosystem services. Ecological Monographs, 81(2), 169–193.
Friedrichs, C. T. (2012). Tidal Flat Morphodynamics: A Synthesis. In Treatise on Estuarine and Coastal Science (Vol. 3, Issue January 2011). Elsevier Inc. https://doi.org/10.1016/B978-0-12-374711-2.00307-7
van Prooijen, B. C., Grasso, F., le Hir, P., de Vet, P. L. M., Wang, Z. B., Walles, B., & Ysebaert, T. (2017). Equilibria and Evolution of Estuarine Fringing Intertidal Mudflats. Equilibria and Evolution of Estuarine Fringing Intertidal Mudflats, 122–123.

84
Anthropogenic effects on regime shifts in the Yangtze Estuary Q. He1, C. Zhu1,2, J. Lin1,2, L. Zhu1,3, Y. Chen1,4, Z.B. Wang1,2,5, and J.C. Winterwerp2,5
1 State Key Lab of Estuarine and Coastal Research, East China Normal University, Shanghai 200241, China.
2 Department of Hydraulic Engineering, Delft University of Technology, Delft, Netherlands. 3 School of Marine Science, Sun Yat-sen University, Guangzhou, China
4 Shanghai Waterway Survey and Design Institute Co., Shanghai 200120, China 5 Deltares, Delft, Netherlands [email protected]
1. Introduction Many estuaries in the world are suffering from sediment decline, sinking deltas and wetland loss due to anthropogenic effects, potentially leading to regime shifts (Syvitski et al., 2009; Winterwerp and Wang, 2013; Talke and Jay, 2020). In recent 50 years, the Yangtze Estuary, as a typical estuary strongly driven by extensive human activities, has been identified regime shifts in hydrodynamics and suspended sediment concentrations (SSC) as well as morphodynamics. 2. Results The Yangtze Estuary has mainly experienced sediment decline and local engineering works, resulting in regime shifts varying in space. The regime shift in hydrodynamics is pronounced in changes in tidal damping and flow structures. Tidal damping was weakened in the South Branch mainly due to reduced sediment supply whereas it was enhanced in the mouth zone mainly caused by the local engineering works. Lateral flow structures were also modified in the mouth zone due to the deepening and narrowing. Riverine sediment discharges initially decreased gradually since the mid-1980s but accelerated to the present-day amount of ~70% since 2003. Subsequently, the decrease in the SSC occurred shortly after the accelerated sediment decline in the South Branch but until ~2015 in the mouth zone (Figure 1). The regime shifts in the morphology of the Yangtze Estuary include the deepening and narrowing in the main channels, a shift from accretion to erosion in the subaqueous delta (a net loss of 50 million m3), and a shift from fast to slower accretion and even erosion in the tidal flats (Figure 2). Moreover, the regime shifts indicate time lags, particularly in the mouth zone where the morphological response time lag to sediment decline is 20-30 years.
Figure 1: Tidal and depth averaged suspended sediment concentrations (SSC) during the wet season in 2003,
2007, 2013, 2019 and 2020.
Figure 2: Overview of the evolution of the Hengsha flat and Jiuduan shoal and changes in suspended sediment
load at Datong, with time markers of major human interventions and important morphological changes. The shoal volume refers to the sediment volume of the area
with elevation higher than 6 m below the theoretical lowest water level; DCNP: Deep Channel Navigation
Project; TGD: Three Gorges Dam.
3. Conclusions In conclusion, regime shifts are systematically explored in terms of hydrodynamics, SSC and morphodynamics in the Yangtze Estuary, which enriches our knowledge on understanding estuarine responses driven by anthropogenic effects. References Syvitski, J. P., Kettner, A. J., Overeem, I., Hutton, E. W.,
Hannon, M. T., Brakenridge, G. R., . . . Nicholls, R. J. (2009). Sinking deltas due to human activities. Nature Geoscience, 2(10), 681-686.
Talke, S.A., Jay, D.A., 2020. Changing tides: the role of natural and anthropogenic factors. Annual review of marine science, 12: 121-151.
Winterwerp, J.C., Wang, Z.B., 2013. Man-induced regime shifts in small estuaries—I: theory. Ocean Dynamics, 63(11-12): 1279-1292. DOI:10.1007/s10236-013-0662-9

85
Numerical modeling of suspended sediment fluxes between a macrotidal estuary and its adjacent shelf: horizontal and vertical structures
Melanie Diaz1,2, Florent Grasso2, Aldo Sottolichio1, Pierre Le Hir2, Benedicte Thouvenin2 and Mathieu Caillaud2
1 University of Bordeaux, EPOC, UMR 5805, 33600 Pessac, France. [email protected] 2 IFREMER – DYNECO/DHYSED, Centre de Bretagne, CS 10070, 29280 Plouzané, France
1. Introduction Coastal environments are directly influenced by terrigenous inputs coming from rivers through estuaries. The complexity of the intra-estuarine dynamics associated with the strong variability of meteorological forcing makes it difficult to quantify the sediment exchanges and the fate of fine particles at the estuarine mouth. Based on a realistic 3D process-based numerical model, the aim of this work is to investigate the horizontal and vertical structures of residual sediment fluxes between a macrotidal estuary and the ocean. To do so, this study focuses on the macrotidal Gironde Estuary (France) and its adjacent continental shelf. It is one of the largest estuary of Western Europe with the most developed ETM in Europe. The surficial sediment map established by former studies exhibited the presence of subtidal mudflats on the continental shelf known to trap particles coming from estuary. Thus, studying the 3D structure of residual sediment fluxes at the estuarine mouth is crucial to provide insight into the spatio-temporal variability of fine sediment supply to the ocean and better understand the sediment transport on the adjacent continental shelf. 2. Methods A 3D sediment transport model was developed and applied on this estuarine-shelf environment (Diaz et al., 2020). It is based on the hydrodynamic numerical model MARS3D coupled with the multi-layer sediment transport module MUSTANG (Le Hir et al., 2011). Based on a curvilinear grid, the model is forced by the main tidal components, realistic wind conditions, meteorological surges and river discharges. Waves are simulated using the WAVE WATCH III® model. The sediment transport model is accounting for erosion, suspension, deposition and consolidation processes for sand and mud mixtures. Five classes of particles are considered: one mud with a varying settling velocity, 3 sands with a diameter d=100, 250 and 400µm and one gravel (d=3mm). Diaz et al. (2020) validated the simulated hydrodynamics and hydrology and conducted a sensitivity analysis of the sediment transport parameterisation on sediment fluxes at the estuarine mouth. Moreover, the sediment model was validated with local measurements of Suspended Sediment Concentration (SSC) within the estuary and seaward of the mouth. 3. Results The model outputs exhibited a strong variability of residual sediment fluxes at the scale of the estuarine mouth both horizontally (Figure 1) and vertically. Over the whole water column, there is a strong export of mud through the Passe Ouest (northern channel, Figure 1), where the transport of particles is clearly dominant compared to the Passe Sud (southern channel). Moreover, the sediment transport at the estuarine mouth is driven by
strong recirculating flows due to both the longitudinal variation of estuarine width and the lateral change in bathymetry. The mud residual fluxes also exhibited strong vertical variations between the surface and the bottom. Between high and low river flow, the vertical structure of sediment transport was highly contrasted whereas the depth-averaged fluxes tend to be similar. It was found that this is due to the enhanced density-induced circulation during high river flow. It tends to strengthen sediment transport both at the surface and at the bottom, which results in similar vertically integrated fluxes. In summary, river discharge changes do not significantly affect residual mud fluxes at the estuarine mouth. However, the flux horizontal variability can strongly impact the location of mud export in the adjacent continental shelf.
Figure 1: Depth-averaged residual fluxes of mud over a
spring-neap tidal cycle (a) during high river flow and (b) during low river flow. Red fluxes are directed upstream and blue fluxes are directed downstream. Grey contours
represent isobaths every 10m. References Diaz M., Grasso F., Le Hir P., Sottolichio A., Caillaud
M., Thouvenin B. (2020). Modeling mud and sand transfers between a macrotidal estuary and the continental shelf: influence of the sediment-transport parameterization. J. Geophys. Res.-Oceans, 125(4), e2019JC015643 (37p.).
Le Hir P., Cayocca F., and Waeles B. (2011). Dynamics of sand and mud mixtures: A multiprocess-based modelling strategy. Cont. Shelf Res., 31(10): S135-S149.

86
Internal tides as a major process in Amazon continental shelf fine sediment transport
E. Molinas1, J. C. Carneiro1 and S.B. Vinzon2 1 Ocean Engineering Program, COPPE, Federal University of Rio de Janeiro, Brazil
2Water Resource and Environmental Eng. Department, Polytechnic School, Federal University of Rio de Janeiro, Brazil
1. Introduction The description of hydrodynamics associated with the extensive reef system on the shelf break adjacent to the Amazon River is still a challenge for ocean sciences. Despite the discharge of more than one billion tons of cohesive sediment per year, the outer continental shelf of the world’s largest river presents very low concentrations of suspended sediment near the bottom and an absence of modern fine sediment deposits nearly one hundred kilometres before the shelf break. The offshore limit of the subaqueous delta consists of a sigmoidal clinoform standing between 20 and 70 m in depth, a depositional feature that cannot be explained solely by estuarine-like gravitational circulation (Fig. 1).
Fig. 1: Bathymetric cross-section representing the
sigmoidal clinoform of the Amazon submerged delta.
The present study proposes the hypothesis that the action of internal tides (ITs) over the Amazon outer continental shelf (AOCS) has a fundamental role in the fate of terrigenous sediments originated at the Amazon River basin, “blocking” the seaward progradation of the subaqueous delta, and allowing the existence of low bottom suspended sediment concentrations at the AOCS. To test this hypothesis, we developed a set of numerical experiments to characterize the local physics associated with ITs and their spatial and temporal variability. The adopted methodology aims to (i) identify the main factors associated with the generation of ITs at the shelf break and their shoreward propagation; (ii) quantitatively describe the dynamical patterns of fine sediment transport under the effect of ITs, thereby disregarding other forces often highlighted in the Amazon shelf literature, such as river plume buoyancy, wind drag, surface waves, and the North Brazil Current; and (iii) decompose barotropic and baroclinic effects over the shelf. 2. Results The experiments showed that the exclusive interaction between barotropic tidal currents, bathymetry, and the stratification structure of the ocean is capable of generating asymmetrical current patterns compatible with modern deposition (Fig. 2). The maximum shelf slope and the relative depth between the outer shelf and the pycnocline represent the main factors influencing the
generation and shoreward propagation of internal tides. Over time, spring-neap cycles are eventually capable of reverting cross-shore subtidal transport tendencies, while seasonal variability in ocean stratification modulates the intensity of baroclinic processes.
Fig. 2: Map of the modelled bottom nonlinear residual
velocity (NLRV) pattern induced by ITs on the Amazon shelf during the climatological month of May.
3. Conclusions The present study made use of computational modeling as an exploratory tool, revealing for the first time in literature the relevance of internal tides in Amazon continental shelf fine sediment transport. Despite not having specific data to confirm the precise magnitude and spatial distribution of ITs effects over de AOCS, modeling results presented good coherence with several literature processes. Specifically addressing the relevance of ITs over the Amazon reef system, we highlight that the width of the outer shelf zones with shoreward transport tendencies agrees with the width of the reef distribution, both varying from 100 km, close to de Amazon fan region (northwestern portion of modeling domain), to less than 40 km in the regions of the steepest continental slopes (southeastern portion of modeling domain). The findings of the present study are promising and still can be significantly improved with additional calibration and validation data. We hope that the information here provided will encourage future oceanographic surveys aimed specifically at the study of internal tides, serving as a relevant tool for their planning. Acknowledgments The authors would like to thank CAPES and FAPERJ for doctorate fellowships (first and second authors), and CNPq for research productivity scholarship (grant 31029/2015-0 for the third author). The first author thanks the professors Ian Townend and Johan Winterwerp, whose lectures inspired this work.

87
Mud dynamics and the morphodynamic response of the Western Scheldt estuary to sea level rise
H. Elmilady1,2,3, B. Röbke2, M. van der Wegen 1,2, D. Roelvink 1,2,3, A. van der Spek 2,4, and M. Taal 2
1 Department of Coastal and Urban Risk and Resilience, IHE Delft, Delft, Netherlands. [email protected] 2 Deltares, Delft, Netherlands.
3 Faculty of Civil Engineering and Geosciences, TU Delft, Delft, Netherlands. 4 Faculty of Geosciences, Utrecht University, Utrecht, Netherlands.
Intertidal area is an essential component of estuaries worldwide. They provide a natural barrier against wave attack and flooding and serve as habitat and feeding grounds for several species. Sea level rise (SLR) will impact the morphodynamic evolution of estuaries (e.g. Elmilady et al., 2019; van der Wegen et al., 2017). It is questioned whether the intertidal morphology can keep up with the anticipated SLR. Insight into the factors that drive its adaptation is hence crucial. The objective of this study is to gain insight into potential morphodynamic effects of SLR on the channel-shoal system of the Western Scheldt (WS) estuary in the Netherlands, with the main focus on the role of mud in the intertidal shoals' adaptation. We apply a process-based modeling approach (Delft 3D) to model the long-term morphodynamic evolution of the WS estuary including a hindcast (1964-2012), and a forecast (2020-2100) with different SLR scenarios. The model domain (Figure 1) covers the WS system with a 3D unstructured grid (7 vertical layers). Tidal forcing and riverine discharges are implemented at the seaward and landward boundaries, respectively. We simulate sand transport along with the marine and fluvial mud input to the system. The SWAN wave model is used to simulate offshore wave propagation and local wind-wave generation.
Figure 1: The model grid together with the 2012
measured bathymetry. The black lines and circles show the seaward, and riverine model boundaries,
respectively.
Model results match observed sedimentation/erosion patterns and the sediment budget during the hindcast period (1964-2012). A reference, 80-year, forecast situation without SLR shows an estuary that is slightly exporting sand and importing marine mud at its mouth. Adding SLR we observe a change in hydrodynamics
favoring ebb dominance. This shifts the sediment balance towards export (or less import) for both sand and mud fractions (Figure 2). Sand transport experiences a larger impact.
Figure 2: Sediment transport through the estuary’s
mouth for the different SLR scenarios.
The intertidal area accretes in response to SLR, however, accretion rates are less than the SLR rate leading to intertidal area drowning. Taking mud into account has a limited impact on the morphological behavior under SLR. This impact is different at individual shoals. At fringed, low-energy locations, mud enhances the accretion of shoals under SLR. At other shoals, SLR decreases wave impact at increased water depths, while flow velocities over the shoals increase. This leads to higher shear stresses hindering mud accretion. Our work shows the vulnerability of the Western Scheldt intertidal environment to SLR. SLR induced changes in the system’s hydrodynamics can limit the potential of the mud supply to contribute towards the intertidal area adaptation by creating non-favorable conditions for mud deposition. References Elmilady, H., van der Wegen, M., Roelvink, D., & Jaffe,
B. E. (2019). Intertidal Area Disappears Under Sea Level Rise: 250 Years of Morphodynamic Modeling in San Pablo Bay, California. Journal of Geophysical Research: Earth Surface, 124(1), 38–59.
van der Wegen, M., Jaffe, B., Foxgrover, A., & Roelvink, D. (2017). Mudflat Morphodynamics and the Impact of Sea Level Rise in South San Francisco Bay. Estuaries and Coasts, 40(1), 37–49. doi:10.1007/s12237-016-0129-6
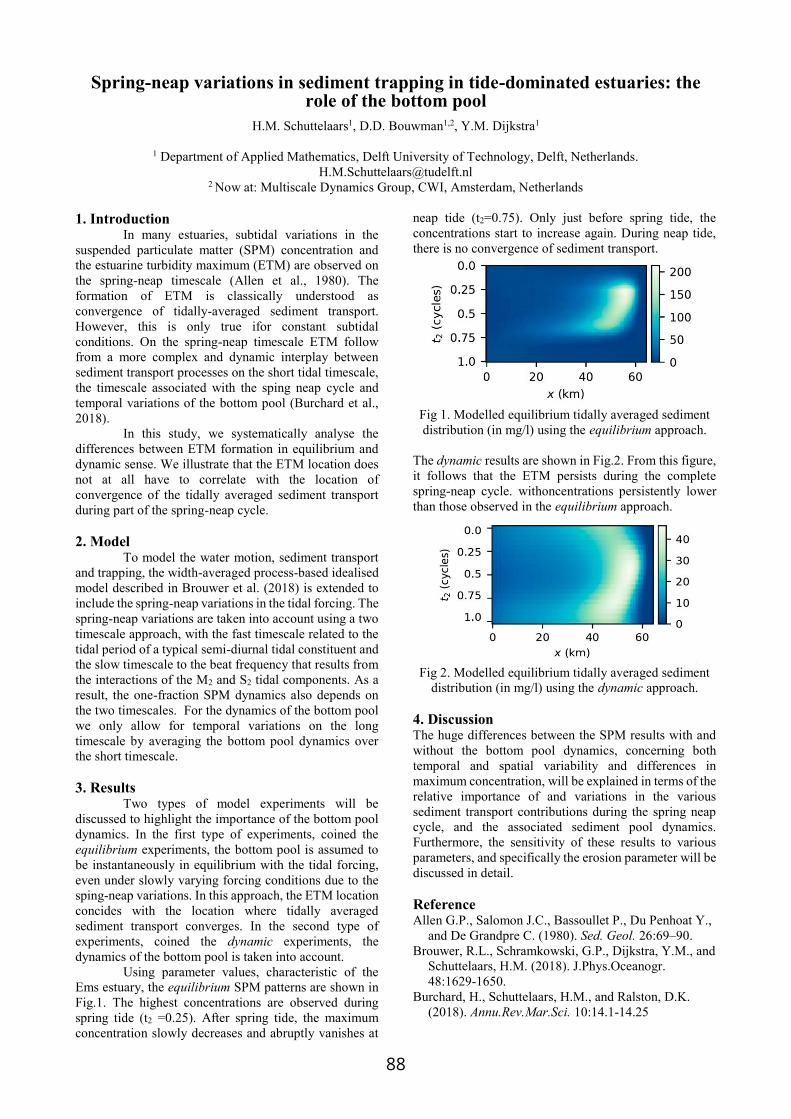
88
Spring-neap variations in sediment trapping in tide-dominated estuaries: the role of the bottom pool
H.M. Schuttelaars1, D.D. Bouwman1,2, Y.M. Dijkstra1
1 Department of Applied Mathematics, Delft University of Technology, Delft, Netherlands. [email protected]
2 Now at: Multiscale Dynamics Group, CWI, Amsterdam, Netherlands
1. Introduction In many estuaries, subtidal variations in the
suspended particulate matter (SPM) concentration and the estuarine turbidity maximum (ETM) are observed on the spring-neap timescale (Allen et al., 1980). The formation of ETM is classically understood as convergence of tidally-averaged sediment transport. However, this is only true ifor constant subtidal conditions. On the spring-neap timescale ETM follow from a more complex and dynamic interplay between sediment transport processes on the short tidal timescale, the timescale associated with the sping neap cycle and temporal variations of the bottom pool (Burchard et al., 2018).
In this study, we systematically analyse the differences between ETM formation in equilibrium and dynamic sense. We illustrate that the ETM location does not at all have to correlate with the location of convergence of the tidally averaged sediment transport during part of the spring-neap cycle.
2. Model
To model the water motion, sediment transport and trapping, the width-averaged process-based idealised model described in Brouwer et al. (2018) is extended to include the spring-neap variations in the tidal forcing. The spring-neap variations are taken into account using a two timescale approach, with the fast timescale related to the tidal period of a typical semi-diurnal tidal constituent and the slow timescale to the beat frequency that results from the interactions of the M2 and S2 tidal components. As a result, the one-fraction SPM dynamics also depends on the two timescales. For the dynamics of the bottom pool we only allow for temporal variations on the long timescale by averaging the bottom pool dynamics over the short timescale. 3. Results
Two types of model experiments will be discussed to highlight the importance of the bottom pool dynamics. In the first type of experiments, coined the equilibrium experiments, the bottom pool is assumed to be instantaneously in equilibrium with the tidal forcing, even under slowly varying forcing conditions due to the sping-neap variations. In this approach, the ETM location concides with the location where tidally averaged sediment transport converges. In the second type of experiments, coined the dynamic experiments, the dynamics of the bottom pool is taken into account.
Using parameter values, characteristic of the Ems estuary, the equilibrium SPM patterns are shown in Fig.1. The highest concentrations are observed during spring tide (t2 =0.25). After spring tide, the maximum concentration slowly decreases and abruptly vanishes at
neap tide (t2=0.75). Only just before spring tide, the concentrations start to increase again. During neap tide, there is no convergence of sediment transport.
Fig 1. Modelled equilibrium tidally averaged sediment distribution (in mg/l) using the equilibrium approach.
The dynamic results are shown in Fig.2. From this figure, it follows that the ETM persists during the complete spring-neap cycle. withoncentrations persistently lower than those observed in the equilibrium approach.
Fig 2. Modelled equilibrium tidally averaged sediment
distribution (in mg/l) using the dynamic approach. 4. Discussion The huge differences between the SPM results with and without the bottom pool dynamics, concerning both temporal and spatial variability and differences in maximum concentration, will be explained in terms of the relative importance of and variations in the various sediment transport contributions during the spring neap cycle, and the associated sediment pool dynamics. Furthermore, the sensitivity of these results to various parameters, and specifically the erosion parameter will be discussed in detail. Reference Allen G.P., Salomon J.C., Bassoullet P., Du Penhoat Y.,
and De Grandpre C. (1980). Sed. Geol. 26:69–90. Brouwer, R.L., Schramkowski, G.P., Dijkstra, Y.M., and
Schuttelaars, H.M. (2018). J.Phys.Oceanogr. 48:1629-1650.
Burchard, H., Schuttelaars, H.M., and Ralston, D.K. (2018). Annu.Rev.Mar.Sci. 10:14.1-14.25

89
Understanding multi-year and seasonal variations in SPM in the Dutch Wadden Sea using a Delft3D-FM numerical model
R.J.A. v. Weerdenburg1, J. Vroom1, B.P. Smits1, T. v. Kessel1 and P.M.J. Herman1,2
1 Department of Marine and Coastal Systems, Deltares, Delft, Netherlands. [email protected] 2 Department of Hydraulic Engineering, Delft University of Technology, Delft, Netherlands
1. Introduction Understanding the dynamics of fine sediments in the Dutch Wadden Sea is important because it influences ecology and geomorphology and relates to several issues for the management of this UNESCO World-Heritage site (i.e. dredging, local high turbidity). Recent analysis of field observations revealed (i) multi-year variations in mean Suspended Particulate Matter (SPM) and (ii) seasonal variations relative to the yearly mean SPM that have the same relative magnitude for many observation points in Dutch coastal waters (Herman et al., 2018). We aim to understand the physical and biological mechanisms responsible for these variations by using a process-based modelling approach. 2. Modelling approach A three-dimensional numerical model was set-up in Delft3D-FM to simulate hydrodynamics (i.e. tide, surge, waves, salinity, water temperature and meteorological effects). We use an online coupling with Delft3D-Water Quality (WAQ) software to simulate fine sediment dynamics. Two cohesive sediment fractions are included and the bed is schematized in two layers: one easily erodible layer and one more consolidated ‘buffer’ layer (Van Kessel et al., 2011). The settings of the sediment transport model were calibrated using field measurements of SPM and the observed spatial distribution of mud content in the bed.
3. Results and discussion The calibrated model has been used to investigate the effect of individual processes (e.g. salinity, dredging, meteorological forcing) by switching them on or off. The resuspension of mud from the seabed by waves is the most important cause of seasonal variations in SPM. While storm events increase SPM for a couple of days at maximum, higher waves during daily conditions
Figure 1: Cumulative transport of mud through tidal
inlets Marsdiep and Ameland Inlet for meteorological conditions of 2016 and 2017, based on model results.
resuspend larger amounts of mud from the bed in fall and winter, leading to higher mud concentrations in the water column both in the shallow Wadden Sea as well as in the North Sea. We found a large effect of meteorological forcing on the residual transport of mud and hence the sediment balance of the Dutch Wadden Sea, which is in agreement with earlier work by Sassi et al. (2015). Residual transports over the tidal divides are large, some even larger than through the individual inlets. Meteorological conditions of two different years lead to different residual transport rates of mud through tidal inlets (see Figure 1) and at tidal divides. The nett sedimentation rate of mud in tidal basins therefore varies between years with a factor 2 to 3. We hypothesize that successive years with higher sedimentation rates may lead to accumulation of mud in dynamic buffers and ultimately to higher SPM, resulting in multi-year variations. 4. Concluding remarks In this project several hypotheses were formulated based on a thorough analysis of field data. However, field data were too sparse in space and time to further advance our knowledge. A numerical model was set-up and applied to bridge this gap and to test hypotheses, which enhanced our understanding of processes that drive multi-year and seasonal variations in mud dynamics in the Dutch Wadden Sea. New field data can be used to further improve the numerical model. Acknowledgments This work has been carried out as part of the research project Kaderrichtlijn Water Waddenzee. H. Mulder, E. Lofvers and A. de Swaaf (Rijkswaterstaat), J. Cleveringa (Arcadis) and P. Dankers (Royal HaskoningDHV) are thankfully acknowledged for their contribution. References Herman, P.M.J., van Kessel, T., Vroom, J., Dankers,
P.J.T., Cleveringa, J., de Vries, B., Villars, N. (2018). Mud dynamics in the Wadden Sea – Towards a conceptual model. Report 11202177-000-ZKS-0011, Deltares, The Netherlands.
Sassi, M., Duran-Matute, M., van Kessel, T., Gerkema, T. (2015). Variability of residual fluxes of suspended sediment in a multiple tidal-inlet system: the Dutch Wadden Sea, Ocean Dynamics, 65, 1321-1333.
van Kessel, T., Winterwerp, J. C., van Prooijen, B.C., van Ledden, M., Borst, W. (2011). Modelling the seasonal dynamics of SPM with a simple algorithm for the buffering of fines in a sandy seabed, Continental Shelf Research, 31 (10), S124-S134.

90
Sediments dynamics in a closed macrotidal estuary (Rance estuary, France): from mud to a mixture of mud-sand-gravel
R. Rtimi1,2, A. Sottolichio2 and P. Tassi1,3
1 Department of Hydraulics and Environment, Electricité de France, Chatou, France. [email protected]
2 EPOC Laboratory, Bordeaux University, Pessac, France. [email protected] 3 Saint-Venant Hydraulic Laboratory, Chatou, France. [email protected]
1. Introduction The sediment transport and bed evolution module GAIA of the TELEMAC MASCARET system has been introduced recently to replace the historical module SISYPHE (Audouin et al., 2019). This new module deals efficiently with both 2D and 3D sediment transport processes, and improves the treatment of graded and mixed sediments. By taking advantage of these functionalities, 3D sediment transport processes are studied in the Rance estuary. Located on the Brittany coast of northern France, this estuary presents a complex hydrodynamics (Rtimi et al., 2021) and sediment distribution (Bonnot-Courtois et al., 2002) and is strongly influenced by a tidal power station (TPS) located at its mouth. 2. Material and methods A 3D hydro-sedimentary model of the Rance estuary has been developed by coupling the module TELEMAC-3D with GAIA (Audouin et al., 2019). TELEMAC-3D solves the 3D incompressible Reynolds-averaged Navier-Stokes equations and handles the transport of coarse and fine particles within the water column, while the near-bed, bedload and processes in the bottom layer (e.g. consolidation) are managed by GAIA.
The model is forced at its downstream boundary by oceanic tides provided by the TPXO model (Egbert and Svetlana, 2002), and by freshwater discharge at the upstream limit, located at the Chatelier Lock. One of the strengths of the model is the simulation of the TPS by sources and sinks terms, where the flow exchange between the estuary and the sea through the plant’s components is explicitly computed (Rtimi et al., 2021).
The solid discharge at the oceanic and river boundaries are set to zero and all sediments classes are transported by suspension. Based on the map of surficial sediments assessed in the Rance in 1994 by Bonnot-Courtois et al., (2002), four configurations are set up to evaluate the performance of GAIA on modelling the sediment dynamics in a closed macrotidal estuary:
C1: 100% mud in the whole domain C2: 60% mud and 40% sand in the whole domain C3: 100% gravel in zones 2 and 5 (see Figure 1.a for
zone location), 100% mud elsewhere C4: 100% mud in zones 1 and 3, 100% gravel in
zones 2 and 5, 60% mud and 40% sand in zone 4, 100% sand in zone 6 (Figure 1.a)
3. Results The four simulated scenarios capture correctly the position of the estuarine turbidity maximum (ETM), as observed by Bonnot-Courtois et al., (2002). However, the ETM concentration is more precisely captured for scenario C4 as it approaches the most the real surficial sediments distribution. The model reveals significant deposition and erosion fluxes mainly noticed in the upper estuary (~5 km from the Chatelier Lock, Figure 1.b). 4. Conclusions This study assesses the capability of GAIA to model and correctly reproduce dynamics of complex distributions of sediments classes in a macrotidal estuary, and helps to understand the particular case of an estuary influenced by the presence of a tidal power plant. References Audouin, Y., Benson, T., Delinares, M., Fontaine, J.,
Glander, B., Huybrechts, N., Kopmann, R., Leroy, A., Pavan, S., Pham, C.T., Taccone, F., Tassi, P., Walther, R. (2019). Introducing GAIA, the brand new sediment transport module of the TELEMAC-MASCARET system. TELEMAC User Conference.
Bonnot-Courtois, C., Caline, B., L’Homer, A., Le Vol, M. (2002). La Baie du Mont-Saint-Michel et l'Estuaire de la Rance. Environnement sédimentaires, aménagements et évolution récente. Bull. Centre Rech. Elf Explor. Prod., Mém. 26, 256p.
Egbert, G., Svetlana, Y. (2002). Efficient inverse modeling of barotropic ocean tides. J. Atmos. Ocean. Technologie, 19, 183–204.
Rtimi, R., Sottolichio, A., Tassi, P. (2021). Hydrodynamics of a hyper-tidal estuary influenced by the world’s second largest tidal power station (Rance estuary, France). Estuarine, Coastal and Shelf Science, 250, 107143.
Figure 1: (a) Distribution of surficial sediments in the Rance estuary for configuration C4. (b) Zoom of bed evolution in the
upper estuary (zone 1) for configuration C4.

91
The origin of two-step yielding in natural mud: wall slip or structural reorganization?
A. Shakeel1, A. Kirichek1,2 and C. Chassagne1
1 Department of Hydraulic Engineering, Delft University of Technology, Delft, Netherlands. [email protected] 2 Deltares, Delft, Netherlands
1. Introduction Natural mud typically consists of clay minerals, water, sand, silt, and a small amount of organic matter of different origin and composition. Yield stress has been found to be an important parameter to define navigable fluid mud layers for ports and waterways. Recently, (Shakeel et al., 2020) examined the rheological characteristics of mud samples collected from different locations and depths of Port of Hamburg, Germany. From the extensive study, a two-step yielding phenomenon was found for the mud samples collected at the top of the water/bed interface. A similar two-step yielding for mud samples was reported by other researchers as well (Nie et al. 2020, Mehta et al. 2014). In literature, this two-step yielding has been correlated either to the structural rearrangements (Nie et al., 2020) during shearing or to the wall slip artefact (Barnes, 1995). Therefore, the objective of the present study is to explain the origin of this two-step yielding in mud. 2. Experimental Natural mud samples were collected from Port of Hamburg, Germany using 1 m core sampler. The Thermo Scientific HAAKE MARS I rheometer was used to perform the rheological measurements. Three different geometries, including smooth and grooved concentric cylinders (Couette & Couette-G), parallel plates (PP), and vane were used to perform rheological tests. Stress ramp-up and amplitude sweep tests were carried out to analyse the two-step yielding behaviour of mud samples. Modified form of RheOptiCAD was used to analyse the structural changes during shearing action. 3. Results and discussion Different methodologies are reported in literature, in order to investigate the wall slip artefact, such as (i) by varying the gap, (ii) by using roughened or grooved geometry and (iii) by using vane-in-cup geometry.
Figure 1: Apparent viscosity as a function of stress for (a) PP with varying gap, (b) Couette and Couette-G, and (c) Couette,
PP and vane, (d) storage (filled symbols) and loss (empty symbols) moduli as a function of amplitude for Couette, PP and vane. The outcome of different methodologies, mentioned before, is shown in Figure 1. It is quite clear from Fig. 1a-1c that all these approaches with different geometries verify the existence of two-step yielding (i.e., two declines in viscosity) for mud samples. Furthermore, in literature, the two-step yielding behaviour is typically investigated by performing amplitude sweep tests and the outcome of this test for mud sample is shown in Fig. 1d. This result again verifies the existence of two-step yielding (i.e., two declines in moduli) for mud. In order to identify the origin of this two-step yielding behaviour in mud, rheo-optical analysis of samples was performed. This analysis confirmed the reorganization of mud flocs during shearing as: (i) breakage of interconnected network of flocs (first yield point), (ii) formation of cylinder-like structures (plateau after first yield point) and (iii) breakage of these cylinder-like structures (second yield point) (Fig. 2).
Figure 2: Schematics of the two-step yielding observed by amplitude sweep tests for mud samples, verified by RheOptiCAD analysis. 4. Conclusions This study confirms that the two-step yielding in mud samples is not because of wall slip but due to the structural reorganization during shearing action. However, this rearrangement is because of the presence of narrow gap between the geometry and cup wall. Therefore, the existence of the first yield point may not be observed in in-situ conditions.
References Shakeel, A., Kirichek, A., & Chassagne, C. (2020). Yield stress measurements of
mud sediments using different rheological methods and geometries: An evidence of two-step yielding. Marine Geology, 427, 106247.
Nie, S., Jiang, Q., Cui, L., & Zhang, C. (2020). Investigation on solid-liquid transition of soft mud under steady and oscillatory shear loads. Sedimentary Geology, 397, 105570.
Mehta, A. J., Samsami, F., Khare, Y. P., & Sahin, C. (2014). Fluid mud properties in nautical depth estimation. Journal of waterway, port, coastal, and ocean engineering, 140(2), 210-222.
Barnes, H. A. (1995). A review of the slip (wall depletion) of polymer solutions, emulsions and particle suspensions in viscometers: its cause, character, and cure. Journal of Non-Newtonian Fluid Mechanics, 56(3), 221-251.

92
Mangroves direct hydrodynamics and morphology in Whitianga Estuary, New Zealand
A. Rahdarian1, K.R. Bryan1 and M. van der Wegen2,3
1 School of Science, Fac. of Science and Eng., Un. of Waikato, Hamilton, New Zealand. [email protected] 2 IHE-Delft Institute for Water Education, Delft, Netherlands
3Deltares, Delft Netherlands
1. Introduction Mangrove forests contain valuable ecosystems and protect coasts by expanding low-energy environments. With the expected sea-level-rise, understanding the role and resilience of mangrove systems is critical considering the fate of estuarine systems (Horstman et al., 2013; Montgomery et al., 2019). We hypothesize that vegetation dynamics play a dominant role in shaping the morphology of estuarine systems, because vegetation growth directs the hydrodynamics and associated sediment transports and morphology. To that end we carried out measurements in Whitianga Estuary, New Zealand. The mangrove forest consists of three parts; the inner area of the forest that developed more than 100 years ago; the edge of the forest that started growing in the 1940s; and a newly grown mangrove island that emerged around 2002. Multiple creeks with different widths and directions within the forest make a complex morphology. Historical aerial images available so that vegetation expansion dynamics can be captured. By measuring the dynamics and physical characteristics of a 0.6 km2 mangrove “island”, the results can give a good insight about flow patterns, vegetation parameters and sediments variety within mangroves of different ages.
Figure 1- map of study site with deployment stations
Figure 2 - historical aerial images of Whitianga Estuary,
New Zealand (from RetroLens website)
2. Data Collection Hydrodynamic data were collected between 14th and 18th of December 2020 during spring tides. A set of five Acoustic Doppler Current Profilers, four single-point current meters with three C.T.Ds were deployed to measure water velocities, water depth, temperature, salinity and turbidity during five tidal cycles. Sediment samples from twelve cross sections starting from inside the forest to the river were collected. The depth of a recent mud layer was measured in transects. This set of data enabled us to create a comprehensive small scale sediment type and flow pattern map of our site. 3. Results and Conclusion Figure 3 shows an example of measured water level during one spring tide for 3 points (showed on Figure 1) located in the mangrove creek, river channel and on the shoal, respectively. Results show that hydrodynamics are highly variable within 200 meters and a low water slack due to water drainage through the forest can be observed. Asymmetries and water levels are similar in the river channel and on the shoal (both points are 0.8 m below mean sea level).
Figure 3- measured water level during a spring tide
Higher velocities are observed in the river channels compared to mangrove creeks and water velocities did not exceed 0.5 m/s within the mangroves. There is high variability in sediment type and mud layer thickness along transects. River channel beds and the edge of the forest contain more coarse sand sediment while more fine sediments were observed within the mangroves (up to 53 cm of mud layer thickness).
Acknowledgments We would like to thank Ben Stewart, Wager Costa, Ted Conroy and Christopher Morcom for their assistance during field work. References Horstman, E.M., Dohmen-Janssen, C.M., Hulscher, S.J.M.H., 2013.
Flow routing in mangrove forests: A field study in Trang province, Thailand. Continental Shelf Research, 71: 52-67.
Montgomery, J.M., Bryan, K.R., Mullarney, J.C., Horstman, E.M., 2019. Attenuation of Storm Surges by Coastal Mangroves. Geophysical Research Letters, 46(5): 2680-2689.

93
Numerical simulation of hydrodynamics for morphological study around river mouth in north western Java Island, Indonesia
T. Kosako1, H. Tamura2, A. Bagyo Widagdo3, D. C. Istiyanto3, Y. Nakagawa1 1 Coastal and Estuarine Sediment Dynamics Group, Port and Airport Research Institute, Yokosuka, Japan.
[email protected] 2 Marine Information Group, Port and Airport Research Institute, Yokosuka, Japan.
3Agency for the Assessment and Application of Technology (BPPT), Yogyakarta, Indonesia 1. Introduction For better prediction of bathymetric evolution in estuarine environments and coastal zones, and siltation in ports and harbour areas, it is important to simulate accurately hydrodynamics and sediment transport processes in these areas. The coastal regions of north western Java Island have several characteristics of tropical climate and marine weather (winds, rains and waves) driven by monsoon and sedimentary processes with cohesive sediments. In the present study, we carry out sediment transport simulations around the Patimban coast in Indonesia, where the field surveys were carried out by the authors (Nakagawa et al., 2019), considering the wind and wave conditions unique to the Tropics, and investigate the impacts of the forcing factors on current fields and sediment transport processes in this area. 2. Methods The Patimban coast is located in north western Java Island, Indonesia (Figure 1), where seabed sediments consist of mainly silt and clay slightly containing sand. We carry out a 3-D numerical simulation of coastal currents and sediment transport processes around the target area. The outermost computational domain with the space resolution of 𝛥𝛥x = 900 m covers the coastal area of north western Java Island, and the innermost one (𝛥𝛥x = 100 m) includes the target area of the Patimban coast (Figure 1b). To investigate the impacts of seasonal variation of the forcing factors on currents and sediment transport processes around the coast, the computational conditions are set for rainy and dry seasons. The field data of currents, water quality, bed properties are applied for parameter setting and validation of the model. Tides, waves and surface winds are considered as external forces in the simulation of currents and sediment transport. Wave fields are simulated using the WAVEWATCH III (e.g., Tolman, 2014) with NCEP CFSv2 hourly products of surface winds. The sediment transport model used in this study (Kosako and Nakagawa, 2020) considers the characteristics of mud and sand mixtures, such as temporal variation of mud content due to erosion/deposition of sediments and erodibility depending on mud content (van Ledden, 2003). 3. Results and conclusions The simulation results show the characteristics of the tide-induced longshore currents measured around the coast with the maximum velocity of about 0.3 m/s (Figure 1b), and the semidiurnal fluctuation of the tide-induced bottom shear stress are dominant there (Figure 2a). The wave fields in the target area are strongly affected by seasonal and diurnal variations of the sea surface winds. As an example, the temporal variations of the significant wave height and the wave-induced bottom shear stress
during dry season are shown in Figure 2b. We are also carrying out the sediment transport simulations considering the above variations of the current and wave conditions, and will discuss sediment transport patterns and the resultant bathymetric change around the coast.
Figure 1: (a) Location of the Patimban coast, and (b)
bathymetry (color) and example of the simulated tidal current vectors (arrows) around the coast. The red dot indicates the site used for the time series plots in Figure 2.
Figure 2: Time series plots of the simulated (a) tide level
and bottom shear stress by currents, and (b) significant wave height and bottom shear stress by waves near the Cipunagara river mouth.
References Kosako, T. and N., Nakagawa (2020). Sand-mud mixture
transport model for prediction of morphological change in estuaries. Technical Note of the Port and Airport Research Institute (in Japanese).
Nakagawa, Y., A. Bagyo Widagdo, M. Banno, G. A. Gumbira, T. Kosako, H. Tamura, and D. C. Istiyanto (2019). Seasonal variation of fluid mud thickness around river mouth in north western Java island, Indonesia. Abstract of INTERCOH2019.
Tolman, H. L. and the WAVEWATCH III ® Development Group (2014). User manual and system documentation of WAVEWATCH III® version 4.18. Technical Note 316.
van Ledden, M. (2003). Sand-mud segregation in estuaries and tidal basins. Doctoral thesis, Delft University of Civil Engineering.

94
Sediment dispersion of low-density clayey suspension turbidity currents generated by deep-sea mining.
D. Enthoven1, C. Chassagne2 and R.L.J. Helmons1 and J.L.J. Hanssen1,2 1 Department of Maritime and Transport Technology, Delft University of Technology, Delft, Netherlands,
[email protected] 2 Department of Hydraulic Engineering, Delft University of Technology, Delft, Netherlands.
1. Introduction Due to the increased demand for critical raw materials like cobalt and nickel, there is an interest to mine polymetallic nodules from the deep sea. These nodules are abundantly distributed along the abyssal plains in e.g. the Clarion Clipperton Fracture Zone (CCFZ) in the North East Pacific. These nodules lay distributed on top of a seabed that consists of a very fine clayey sediment. These nodules will be collected by a seafloor mining tool (SMT). During the operation, the seabed will be disturbed, resulting in a suspended sediment plume that will be discharged by the SMT. This plume can have a significant environmental impact, through a blanketing effect on the abyssal fauna. Hence, identification of the critical processes and quantification of the dispersion of the sediment plume is of great importance to better predict the potential environmental impact and to identify what technologies would enable a lower environmental impact. 2. Research Spearman et al.,(2020) investigated turbidity plumes generated by deep sea mining experiments, and discovered faster settling velocity than the theory described. Their hypothesis is that this is due to flocculation. The settling velocity depends on the density, concentration, shape and the cohesive properties of the sediment. Flocculation in the deep-sea can occur two ways, by salinity or by organic matter. As there is a low organic matter content in the deep-sea from the CCFZ, the flocculation by organic matter is expected to be minimal. Gillard et al (2019) showed that the flocculation response of CCFZ sediment strongly depends on the concentration and applied shear rate. In order to analyse to what extent aggregation could be of influence on the plume dispersion, experiments are to be conducted in which the effect of aggregation can be adjusted selectively. Considering the fact that it might not be desirable to introduce flocculants deep sea, a first attempt will be made to asses to what extent aggregation could already occur in a saline environment. Lock-exchange experiments will be used to analyse the effect of aggregation by comparing results based on fresh and saltwater. To prove that the settling velocity is increasing in salt water, settling velocity test have been performed. Test were done in settling columns. These tests were done with Bentonite and Illite suspensions. For both clay minerals, an increase in settling velocity is observed due to the increase of salinity, which corresponds to the observations of Gorakhki, M and Bareither, C (2015).
Lock exchange experiments are performed to mimic the particle driven currents. Baker et al., (2017) found that at low volume concentration C <10%, the dominant turbulent forces prevent electrochemical binding and frictional interaction between bentonite particles. The head velocity and shape of these turbidity currents can be expected the same at C <10%. Baker et al.,(2017) predominantly investigated the heads of the sediment gravity flows. They investigated the shape and velocity, but did not present an analysis of the deposit shape, the body behaviour, the concentration profiles and the settling velocity. Maybe looking at these parts of the lock-exchange experiments will give a good inside if the flocculation process described by Spearman et al.,(2020) and Gillard et al.,(2019) due to the flocculation by salinity. A state-of-the-art of the dispersion of low concentration clayey suspension turbidity current will be presented.
References Spearman, J., Taylor, J., Crossouard, N. et al (2020).
Measurements and modelling of deep sea sediment plumes and implications for deep sea mining. Sci Rep 10, 5075 (2020)
Gillard, B., Purkiani, K., Chatzievangelou, D., Vink, A.,
Iversen, H., Thomsen, L (2019). Physical and hydrodynamic properties of deep sea mining-generated, abyssal sediment plumes in the Clarion
Figure 1 Concentration profile for 1% initial volumetric concentration of quartz flour in range of 4-60 µm. Time intervals at 4.9, 9.7, 15.3, 21.2 and 28.3 s. Bedon Vasquez (2020) II for initial concentration of 1.0%
t =
𝟏𝟏. 𝟎𝟎%

95
Field measurements and lab investigations to determine soil exchange characteristics for sediments from the Weser estuary
J. Patzke1, E. Nehlsen1, P. Fröhle1, R. Hesse2 and A. Zorndt2
1 Institute for River and Coastal Engineering (IWB), Hamburg University of Technology (TUHH), Hamburg, Germany, [email protected]
2 Federal Waterways and Engineering Institute (BAW), Hamburg, Germany, [email protected]
1. Introduction Sedimentation of fine grained sediments is a natural physical phenomenon influenced by bio-geochemical processes which occurs in rivers, channels and estuaries. The deepening of waterways in estuaries to enhance the navigability intensifies this effect. Even in the centre of the channel, where high flow velocities favour sediment transport and erosion, net sedimentation and accumulation occurs. Maintenance dredging is the main method to maintain the navigational channel which requires large financial investments and has potential negative impacts on the environment as well. The research project FAUST (For an improved understanding of estuarine sediment transport) addresses the challenge of net sedimentation and accumulation by investigating the transport properties of sediments in field (primarily in the Weser estuary) and in laboratory studies to advance the development of large scale 3D morphodynamic-numerical models. The conceptual design of the project FAUST has been presented in Patzke et al. (2019). 2. Investigations This contribution focusses on results from measurements conducted in the field and in laboratory experiments, mainly related to erosion processes. Field experiments: During field investigations sediment cores are collected from accumulation-prone sites in the (centre of the) channel of the Weser estuary in depths of up to 14 m. Vertical density profiles are measured immediately after sampling using Anton Paar’s DM-35 density meter. The sediments are further characterised in layers by grain size distribution as well as water and organic content. Density profiles: In the lab we prepare sediment samples to investigate time dependent density profiles. Homogeneously mixed samples with various initial concentrations are prepared in cylinders of 1.2 m height and 20 cm diameter. Deposition and settling are observed by measuring density profiles and lutocline evolution.
Figure 1: Lutocline and density evolution (24 h) of
Weser sediments at an initial density of 𝜌𝜌0 = 1100 𝑘𝑘𝑘𝑘𝑚𝑚3.
Erodibility experiments: We investigate the erodibility of the sediments by using a gust erosion microcosm system (gems) (Gust & Müller, 1997) with an updated experimental procedure.
Figure 2: SSC evolution eroding a sample with initial concentration of 𝐶𝐶0~100 𝑘𝑘
𝑙𝑙 and a settling time of 18 h for erosion rates r.
The critical shear stress for erosion is obtained by gradually increasing the stress on the sediment-water interface. Erosion rates are determined by measuring turbidity and density in the suspension. Erosion depth is determined by measuring the evolution of the lutocline during the experiments. Figure 1 shows a typical result of the erodibility experiments, where the initiation of erosion and the equilibrium between shear-stresses and shear-stress-resistance of the material are indicated. Microcosm: The gems itself is under investigation. The microcosm is a widely used device, but its generated velocity field has not yet been described with sufficient precision. In order to characterize and investigate the velocity field, direct velocity measurements were carried out and a 3D numerical model is under development. 3. Conclusions As a basis for the erodibility experiments, the lutocline and density profiles shown in Fig. 1 could be reproducibly generated. The onset of erosion and the shear stress-dependent development of erosion could be determined, e.g. see Fig. 2. Initial erosion occurs at approx. 𝜏𝜏 = 0,05 𝑁𝑁/𝑚𝑚² and is independent of the previous settling time. The erosion rate, on the other hand, decreases with increased settling times. Acknowledgments The IWB would like to thank the Federal Waterways and Engineering Institute, BAW, for funding and supporting the project with their experience and the Federal Waterways and Shipping Agency Bremerhaven, WSA, for providing data and supporting the field investigations.
References Gust, G., & Müller, V. (1997). Interfacial
hydrodynamics and entrainment functions of currently used erosion devices. Cohesive Sediments, 149–174.
Patzke, J., Hesse, R., Zorndt, A., Nehlsen, E., & Fröhle, P. (2019). Conceptual design for investigations on natural cohesive sediments from the Weser estuary. Turkey. Institute for River and Coastal Engineering; TU Hamburg.
0.0
0.2
0.4
0.6
0.8
1.0
1000 1050 1100 1150 1200 1250 1300
h/h 0
[-]
density ρ [kg/m³]
0,25 [h] 0,5 [h] 1 [h]1,5 [h] 2 [h] 4 [h]8 [h] 12 [h] 24 [h]
0.0
0.2
0.4
0.6
0.8
1.0
0 6 12 18 24
h/h 0
[-]
time [h]
Lutocline
Initiation of erosion
Equilibrium

96
Erosion rate formula of very fine sediment bed based on turbulent entrainment Harada D.1 and Egashira S.1
1 International Centre for Water Hazard and Risk Management (ICHARM), Public Works Research Institute (PWRI),
Ibaraki, Japan, [email protected]
1. Introduction In an estuary bed composed of very fine sediment material, tidal currents cause active sediment transportation, bar morphology changes, and severe bank erosion. In this study, we apply the concept of entrainment, developed for density stratified flows, to the erosion process of very fine sediment, based on the results of flume tests, and propose an erosion rate formula that employs the entrainment velocity to evaluate the mixing process occurring in density stratified flows. 2. Bed load rate and entrainment Equation 1 is derived by considering the bed shear stress acting on the bed surface and the shear stress distribution in the bed surface layer, assuming that the laminar flow is formed inside the bedload layer.
𝑞𝑞𝑏𝑏 = 𝑐𝑐𝑠𝑠6
𝑢𝑢∗ℎ𝑠𝑠𝜈𝜈 𝑢𝑢∗ℎ𝑠𝑠 (1)
where 𝑐𝑐𝑠𝑠 is the depth-averaged concentration of sediment in the bedload layer, 𝑢𝑢∗ is the shear velocity, and ℎ𝑠𝑠 is the thickness of bedload layer (Egashira and Ashida, 1992). Suspended sediment concentration 𝑐𝑐 is described as follows: ∂𝑐𝑐∂𝑡𝑡 + 𝑢𝑢 ∂𝑐𝑐
∂𝑥𝑥 = 1ℎ
∂∂𝑥𝑥 (𝜀𝜀ℎ 𝜕𝜕𝑐𝑐
𝜕𝜕𝑥𝑥) + 1ℎ (1 − 𝑐𝑐
𝑐𝑐𝑠𝑠 ) (𝑊𝑊𝑒𝑒𝑐𝑐𝑠𝑠 − 𝑤𝑤0𝑐𝑐) (2)
Sediment is entrained form the bedload layer to the upper flow layer. In case that the sediment erosion is evaluated by the concept of entrainment, entrainment velocity 𝑊𝑊𝑒𝑒 is evaluated by the following relationships:
𝑊𝑊𝑒𝑒𝑢𝑢 (= 𝑒𝑒 ) = 𝐾𝐾
𝑅𝑅𝑖𝑖∗ (𝑅𝑅𝑖𝑖∗ = ∆𝜌𝜌
𝜌𝜌 𝑔𝑔ℎ/𝑢𝑢2) (3)
where 𝑅𝑅𝑖𝑖∗ is the overall Richardson number, 𝑒𝑒 is the entrainment coefficient, and ∆𝜌𝜌 is the difference in mass density between the water layer and the bedload layer in the case of Figure 2. According to Egashira and Ashida (1980), 𝐾𝐾 = 1.5 × 10⁻³. 3. Experiment The relationship described in equation (3) is based on the results of studies in which the Boussinesq approximation is fulfilled between two density layers. Since the present study applies this relationship between the bedload layer and the upper flow layer with suspended sediment, the applicability of the relationship in equation (3) to the present layers should be investigated. Therefore, a series of flume experiments were conducted. A flume, 11m long and 0.2m wide, was prepared. A space was created around the longitudinal center of the flume to store a mixture of water and sediment. We conducted 40 cases of experiment with different discharge, sediment size, and concentration of the mixture. The results are shown in Figure 1, in which the entrainment coefficients obtained from the experiments are compared with the results of previous studies concerning density stratified flow. According to Figure 1, the majority of experimental
data in the present study are plotted around the lines obtained from the previous studies, which shows the applicability of the relationship in equation (3) to the layers between the bedload layer and the upper flow layer with suspended sediment. 4. Conclusions The present study tried to apply the concept of turbulent entrainment to the layers between the bedload layer and the upper flow layer with suspended sediment. The experiment results shows the applicability of the method. Acknowledgments This work was supported by JSPS KAKENHI Grant Number 18K13842 and Public/Private RandD Investment Strategic Expansion PrograM:PRISM. References Egashira, S., and Ashira, K. (1980). Studies on the
Structures of Density Stratified Flows., Bulletin of the Disaster Prevention Research Institute, Kyoto University, 29(4), pp.165-198.
Egashira, S. and Ashida, K. (1992). Unified view of the mechanics of debris flow and bed-load. In Studies in Applied Mechanics, Vol. 31, pp. 391-400.
Harada, D., and Egashira, S. (2020). Method to analyze suspended sediment by means of entrainment velocity, Journal of Japan Society of Civil Engineers. Ser. B1, Hydraulic engineering, vol.65, pp.1111-1116. (In Japanese)
Figure 1: Comparison between the present experimental
results and the results by previous studies.
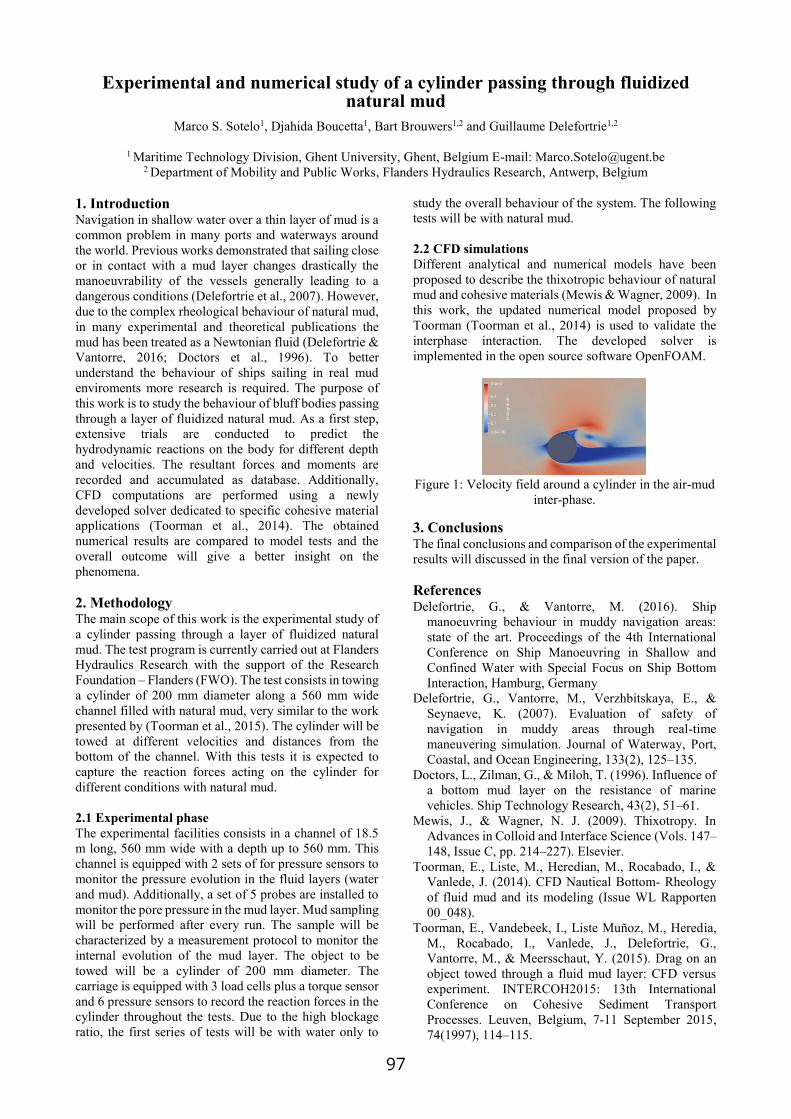
97
Experimental and numerical study of a cylinder passing through fluidized natural mud
Marco S. Sotelo1, Djahida Boucetta1, Bart Brouwers1,2 and Guillaume Delefortrie1,2
1 Maritime Technology Division, Ghent University, Ghent, Belgium E-mail: [email protected] 2 Department of Mobility and Public Works, Flanders Hydraulics Research, Antwerp, Belgium
1. Introduction Navigation in shallow water over a thin layer of mud is a common problem in many ports and waterways around the world. Previous works demonstrated that sailing close or in contact with a mud layer changes drastically the manoeuvrability of the vessels generally leading to a dangerous conditions (Delefortrie et al., 2007). However, due to the complex rheological behaviour of natural mud, in many experimental and theoretical publications the mud has been treated as a Newtonian fluid (Delefortrie & Vantorre, 2016; Doctors et al., 1996). To better understand the behaviour of ships sailing in real mud enviroments more research is required. The purpose of this work is to study the behaviour of bluff bodies passing through a layer of fluidized natural mud. As a first step, extensive trials are conducted to predict the hydrodynamic reactions on the body for different depth and velocities. The resultant forces and moments are recorded and accumulated as database. Additionally, CFD computations are performed using a newly developed solver dedicated to specific cohesive material applications (Toorman et al., 2014). The obtained numerical results are compared to model tests and the overall outcome will give a better insight on the phenomena. 2. Methodology The main scope of this work is the experimental study of a cylinder passing through a layer of fluidized natural mud. The test program is currently carried out at Flanders Hydraulics Research with the support of the Research Foundation – Flanders (FWO). The test consists in towing a cylinder of 200 mm diameter along a 560 mm wide channel filled with natural mud, very similar to the work presented by (Toorman et al., 2015). The cylinder will be towed at different velocities and distances from the bottom of the channel. With this tests it is expected to capture the reaction forces acting on the cylinder for different conditions with natural mud. 2.1 Experimental phase The experimental facilities consists in a channel of 18.5 m long, 560 mm wide with a depth up to 560 mm. This channel is equipped with 2 sets of for pressure sensors to monitor the pressure evolution in the fluid layers (water and mud). Additionally, a set of 5 probes are installed to monitor the pore pressure in the mud layer. Mud sampling will be performed after every run. The sample will be characterized by a measurement protocol to monitor the internal evolution of the mud layer. The object to be towed will be a cylinder of 200 mm diameter. The carriage is equipped with 3 load cells plus a torque sensor and 6 pressure sensors to record the reaction forces in the cylinder throughout the tests. Due to the high blockage ratio, the first series of tests will be with water only to
study the overall behaviour of the system. The following tests will be with natural mud. 2.2 CFD simulations Different analytical and numerical models have been proposed to describe the thixotropic behaviour of natural mud and cohesive materials (Mewis & Wagner, 2009). In this work, the updated numerical model proposed by Toorman (Toorman et al., 2014) is used to validate the interphase interaction. The developed solver is implemented in the open source software OpenFOAM.
Figure 1: Velocity field around a cylinder in the air-mud
inter-phase. 3. Conclusions The final conclusions and comparison of the experimental results will discussed in the final version of the paper. References Delefortrie, G., & Vantorre, M. (2016). Ship
manoeuvring behaviour in muddy navigation areas: state of the art. Proceedings of the 4th International Conference on Ship Manoeuvring in Shallow and Confined Water with Special Focus on Ship Bottom Interaction, Hamburg, Germany
Delefortrie, G., Vantorre, M., Verzhbitskaya, E., & Seynaeve, K. (2007). Evaluation of safety of navigation in muddy areas through real-time maneuvering simulation. Journal of Waterway, Port, Coastal, and Ocean Engineering, 133(2), 125–135.
Doctors, L., Zilman, G., & Miloh, T. (1996). Influence of a bottom mud layer on the resistance of marine vehicles. Ship Technology Research, 43(2), 51–61.
Mewis, J., & Wagner, N. J. (2009). Thixotropy. In Advances in Colloid and Interface Science (Vols. 147–148, Issue C, pp. 214–227). Elsevier.
Toorman, E., Liste, M., Heredian, M., Rocabado, I., & Vanlede, J. (2014). CFD Nautical Bottom- Rheology of fluid mud and its modeling (Issue WL Rapporten 00_048).
Toorman, E., Vandebeek, I., Liste Muñoz, M., Heredia, M., Rocabado, I., Vanlede, J., Delefortrie, G., Vantorre, M., & Meersschaut, Y. (2015). Drag on an object towed through a fluid mud layer: CFD versus experiment. INTERCOH2015: 13th International Conference on Cohesive Sediment Transport Processes. Leuven, Belgium, 7-11 September 2015, 74(1997), 114–115.

98
A systematic study on the interaction between microplastics and cohesive sediments
Nan Wu1, Kate L. Spencer1, Stuart W. D. Grieve1 and Andrew J. Manning2,3
1 School of Geography, Queen Mary University of London, Mile End Road, London E1 4NS, UK. [email protected] 2 HR Wallingford, Howbery Park, Wallingford, Oxfordshire OX10 8BA, UK
3 School of Marine Science & Engineering, University of Plymouth, Drake Circus, Plymouth, Devon PL4 8AA, UK
1. Introduction Estuaries are considered to be an important pathway to transport microplastics (MPs) from land to the sea (Lebreton et al., 2017). MPs are a global environmental issue and have been found in every corner of the earth, drawing increasing attention from both science and society. Plenty of studies have investigated the occurrence and distribution of MPs in global estuaries, the hot spot of MPs pollution (Browne et al., 2011). However, the fate and transport of MPs in these transitional systems are not well understood. 2. Research Progress 2.1 Microplastics Large-sized MPs (>1 mm), are transported as single particles and follow Stokes Law according to their density, size and shape. Settling velocity of large-sized MPs under the influence of biofilm or biofouling is a common focus of research (Möhlenkamp et al., 2018). However, study of small-sized MPs (< 300 μm), the dominant type of MPs (accounting for over 50% of total MPs in most studies) in the natural environment is rare. The small-sized MPs, especially clay- and silt-size (0.1-63 μm) can show a strong potential to aggregate with natural suspended sediment, which hitherto dominates estuarine settings (Andersen et al., 2021). If the MPs in the size range of cohesive sediments flocculate, they will lose the initiative of movement, and subsequently transport with flocs. The higher settling velocity of flocs will make MPs settle quicker than individual particles, increase the flux of MPs into the bottom of estuaries, and decrease the transport efficiency of MPs to the sea from the land. 2.2 Flocs Previous studies have shown that the incorporation of MPs can significantly reduce the settling speed and change the structure of natural aggregates (Cole et al., 2016 and Möhlenkamp et al., 2018). The inclusion of MPs in flocs could considered in a similar manner to the formation of mixed sediment flocs between clay, sand and organic matter (Manning et al., 2010). Therefore, we have a reason to believe that the flocculation of MPs may change the properties of flocs because flocs are loosely bound and fragile (Manning et al., 2017), which are easily altered by other materials, such as nanomaterials. The transport of flocs will subsequently be changed in estuarine settings due to their alteration by MPs. 3. Research Content To better understand flocculation of MPs and cohesive sediments, the wide size, shape and also the polymer type range will be explored under different salinity, shear rate, organic material and pH. In addition to measurements of the 2D geometry of flocs containing MPs, 3D measurements (micro-computed tomography and FIB nano-tomography) will be employed to help us get a
better view to understand how MPs interact with cohesive sediments. This series of studies will help to fully quantify the interactions between MPs and cohesive sediments in estuaries to explain: (1) The behaviours and transport of microplastics with different types, sizes, shapes and surface properties in estuarine areas under the influence of flocculation with cohesive sediments in different conditions (shear rate, salinity and EPS); (2) The properties (2D geometry and 3D micro-structure) and settling behavior of flocs influencing by adding microplastic with different concentrations and types in different conditions (shear rate, salinity and EPS). 4. Conclusions Study of the flocculation of MPs is essential to predict the their fate and behaviour in estuaries. This can also eluciadate the role of estuaries as MP sinks, as well as the missing budget of plastic wastes in the ocean. Acknowlegements The authors acknowledge financial support from the Lloyds Register Foundation and Queen Mary University of London. References Andersen, T.J., Rominikan, S., Olsen, I.S., Skinnebach,
K.H., Fruergaard, M., 2021. Flocculation of PVC Microplastic and Fine-Grained Cohesive Sediment at Environmentally Realistic Concentrations. The Biological Bulletin, 000-000.
Browne, M.A., Crump, P., Niven, S.J., Teuten, E., Tonkin, A., Galloway, T., Thompson, R., 2011. Accumulation of Microplastic on Shorelines Woldwide: Sources and Sinks. Environ. Sci. Technol. 45(21), 9175-9179.
Cole, M., Lindeque, P.K., Fileman, E., Clark, J., Lewis, C., Halsband, C., Galloway, T.S., 2016. Microplastics Alter the Properties and Sinking Rates of Zooplankton Faecal Pellets. Environ. Sci. Technol. 50(6), 3239-3246.
Lebreton, L.C.M., van der Zwet, J., Damsteeg, J., Slat, B., Andrady, A., Reisser, J., 2017. River plastic emissions to the world's oceans. Nat. Commun. 8(1).
Manning, A.J., Baugh, J.V., Spearman, J.R., Whitehouse, R.J.S., 2010. Flocculation settling characteristics of mud: sand mixtures. Ocean Dynam. 60(2), 237-253.
Manning, A.J., Whitehouse, R.J.S. and Uncles, R.J., 2017. Suspended particulate matter: the measurements of flocs. In: R.J. Uncles and S. Mitchell (Eds), ECSA practical handbooks on survey and analysis methods: Estuarine and coastal hydrography and sedimentology, Chapter 8, pp. 211-260.
Möhlenkamp, P., Purser, A., Thomsen, L., 2018. Plastic microbeads from cosmetic products: an experimental study of theirhydrodynamic behaviour, vertical transport and resuspension in phytoplanktonand sediment aggregates. Elem Sci Anth 6(1), 61.

99
Flocculation of microplastic and natural sediment at environmentally realistic concentrations
T.J. Andersen1, S. Rominikan1, I.D. Olsen1, K.H. Skinnebach1, N.Z. Grube1, S. Jedal1, S.N. Laursen1, M. Fruergaard1
1 Department of Geosciences and Natural Resource Management, University of Copenhagen, Copenhagen, Denmark. [email protected]
1. Introduction Microplastic particles (MP, plastic particles smaller than 5 mm) are ubiquitous in the aquatic environment and observations range from fluvial environments to the deep ocean and the Arctic to the tropics. The transport and deposition of these particles are of interest to the broader community as this will have an impact on the loading of MP in various environments and also to some extent determine the ultimate sinks for MP in nature. Small MP have been shown to interact with other suspended particles and flocculate (e.g. Long et al., 2017) but most studies have been conducted using spherical micro-beads at high concentrations (e.g. Möhlenkamp et al 2018). In contrast, most MP in nature show very irregular fragmented or thread-like shapes and the concentrations are still mostly very low compared to concentrations of natural sediment. The present study set out to determine and quantify if flocculation between PVC microplastic with very irregular shapes will take place at environmentally realistically low concentrations of MP. 2. Methods Various types of plastic (PVC, LDPE, HDPE, PET, Nylon) were grinded on a Sheppach Tiger 2000S rotating wet-stone to produce fragmented and threadlike particles. MP in the size range 63 – 125 µm were used for the experiments. The particles were suspended in local, untreated seawater and natural fine-grained sediment with a grain size smaller than 20 µm were added to give a mass concentration of 1 mg l-1 MP and 100 mg l-1 natural sediment. The relative particle number concentration of MP relative to natural particles was in the order of 0.01 %. Settling experiments using Owen tubes were performed after gentle rolling of the tubes for two hours prior to the settling phase and grain size analysis were performed on selected subsamples from the experiment. 3. Results and Discussion The suspensions showed visible flocculation after incubation for less than an hour and analysis of the subsamples form the settling experiments showed uniform relative content of MP versus natural sediment, indicating that MP was incorporated in the flocs and not settling as individual particles. Figure 1 illustrates the difference in settling velocity by about and order of magnitude between un-flocculated MP particles and flocculated natural sediment containing MP. The flocculation of MP in the size-range 63 – 125 µm indicates that MP of this relatively large size may behave
as cohesive sediment with regards to flocculation and settling behaviour and our preliminary data on MP up to 500 µm indicates that this can also be the case for even such large MP particles. The reason may be related to generally lower density and more irregular shape of MP compared to natural sediment which is normally only considered to be cohesive when in the size-range of silt and clay.
Figure 1: Settling velocity distributions of individual
(green) and flocculated (blue) PVC microplastic. Modified after Andersen et al., 2021.
3. Conclusions MP in the size-range 63 – 125 µm readily flocculates with natural suspended sediment, increasing the settling velocity of MP by about and order of magnitude. Even larger MP does also appear to flocculate, suggesting that also MP larger than the silt- and clay-range may be considered to behave as cohesive sediment. Acknowledgments The study was supported by Villum-experiment grant 17668 by the Villum Foundation. References Andersen, T.J., Rominikan, S., Olsen, I.S., Skinnebach,
K.H., Fruergaard, M., 2021. Flocculation of PVC microplastic and fine-grained cohesive sediment at environmentally realistic concentrations. Biological Bulletin 240, DOI:10.1086/712929.
Long, M., I. Paul-Pont, H. Hégaret, B. Moriceau, C. Lambert, A. Huvet, and P. Soudant. 2017. Interactions between polystyrene microplastics and marine phytoplankton lead to species-specific hetero-aggregation. Environ. Pollut. 228, 454-463.
Möhlenkamp, P., A. Purser, and L. Thomsen. 2018. Plastic microbeads from cosmetic products: an experimental study of their hydrodynamic behaviour, vertical transport and resuspension in phy-toplankton and sediment aggregates. Elementa 6(1). DOI: 10.1525/elementa.317.

100
The monitoring of flow mechanics in cohesive sediment layers B. Brouwers1,2, E. Lataire2 and J. v. Beeck3
1 Flanders Hydraulics Research, Antwerp, Belgium. [email protected]
2 Department of Civil Engineering, Maritime Technology Division, Ghent University, Ghent, Belgium 3 Environmental and Applied Fluid Dynamics Department, von Karman Institute for Fluid Dynamics, Sint-Genesius-
Rode, Belgium
1. Introduction Nautical research on the influence of a mud layer on the manoeuvrability of a ship is typically conducted by means of Computational Fluid Dynamics (CFD) models (Delefortrie and Vantorre, 2016). Physical laboratory tests are required to validate these mathematical models. Preferably these tests are carried out with real natural cohesive sediment. The lack of techniques capable of visualizing fluid dynamics and measuring velocities up to 2 m/s in such mud layers adds to the complexity of these model tests. Nowadays, Particle Image Velocimetry (PIV) is considered to be the state-of-the-art technique for flow visualization and flow velocity measurement in laboratory experiments (Raffel et al, 2007). Conventionally a laser is used to visualize particles in the fluid, enabling the recording of their displacement over time. However, even at low densities, mud is highly opaque which renders the use of any optical illumination source useless. Present paper discusses the evaluation of alternative non-intrusive techniques to acquire sequential images of particles in mud at an adequate frame rate and of sufficient quality to allow for the application of the powerful signal processing tools of PIV. 2. Flow visualization in mud In search for useful techniques, inspiration was found in the medical sector because of similar implications such as opacity of human tissue and the preferred avoidance of intrusive probing. Radiography and ultrasonography were retained as potential techniques after a first high level evaluation. The main difference between both is related to the propagation path of the applied energy through the mud layer, as depicted in Figure 1.
Figure 1: (a) setup for radiography requiring full
penetration; (b) setup for ultrasonography based on the reflection of signals
2.1 Radiography Visualization with radiography is based on the difference in absorption of electromagnetic radiation. Therefore full transmission through the mud layer is required. By means of a chemical element analysis, the different compounds of mud and their respective weight fractions were determined, allowing to estimate the attenuation capacity of electromagnetic radiation by mud. Together with a
minimum required intensity level of the remaining radiation for creation of diagnostic images, X-ray and Gamma-ray sources were evaluated by determining the maximum mud layer thickness and flow velocities for each type of radiation source. 2.2 Ultrasonography Ultrasonography is based on the reflection of ultrasound waves and typically generates grayscale images. Acoustic properties of mud are not available in literature to estimate the penetration depth in mud. From an acoustic device used on-site to measure mud density, some properties could however be retrieved, which showed great similarities with the acoustic properties of human tissue. Hence, it is reasonable to assume penetration depths of 10 to 20cm, similar to medical applications. A small-scale test using a standard medical scanner to scan mud, resulted in so-called speckle pattern images (Szabo, 2004). Such images are used in medical applications to record muscle tissue movement or blood flow. This technique is called “speckle tracking” and is similar to standard PIV. While inducing flows in the mud, the same standard medical scanner proved to be able to record the flows with the use of this speckle tracking application. 3. Conclusions Both radiography and ultrasonography are well suited for visualization of particles in mud. The maximum mud layer thickness and flow velocities for radiography are however too limited. Ultrasonography has more potential as it does not require full transmission of the mud layer and with the creation of speckle pattern images, it allows the application of PIV without the addition of seeding particles. Additional small-scale experiments to determine the acoustic properties of mud and to define the ideal ultrasound frequency are required for further customization of this technique for the intended application on mud. References Delefortrie, G., & Vantorre, M. (2016). Ship
manoeuvring behaviour in muddy navigation areas : state of the art. In K. Uliczka, C.-U. Böttner, M. Kastens, K. Eloot, G. Delefortrie, M. Vantorre, … E. Lataire (Eds.) (pp. 26–36). Presented at the 4th MASHCON, Germany: Bundesanstalt für Wasserbau
Raffel, M., Willert, C. E., Wereley, S. T., & Kompenhans, J. (2007). Particle Image Velocimetry: A Practical Guide (Experimental Fluid Mechanics) (2nd ed.). Springer.
Szabo, T. (2004). Diagnostic Ultrasound Imaging: Inside Out (New ed.). Amsterdam University Press.
101
Modelling of Deep Sea Mining-Generated plumes
M.F.A.I. ELerian1, Z. Huang1 and C. van Rhee1 and R.L.J. Helmons1 1 Department of Maritime and Transport Engineering, Delft University of Technology, Delft, Netherlands.
1. Introduction Different fields of industry such as electric automotive, wind energy, telecommunications, etc are in a need for rare earth metals (Wu et al., 2017; Hein et al., 2020). However, these minerals are characterized with shortage in supply and excess in demand. Such materials can be found in polymetallic nodules located in the deep sea. These nodules, which are typically of size and shape comparable to potatoes, lie distributed on top of the seabed.
Polymetallic nodules will be picked up from the seabed by a Seafloor Mining Tool (SMT). While doing so, it also picks up the fine sediment on top of the seabed. The majority of the water used in the pick-up and separation process will be discharged as a turbidity plume behind the SMT. Our focus is the discharged sediment plumes from the SMT, as these are expected to have a major impact on deep sea fauna (Corliss, 1985; Thiel, 2003).
2. Objective The main purpose of the DSM research is to mitigate the plume intensity by controlling the discharge parameters in the near field area. It is expected that flocculation mechanism will increase the settling potential of the particles by increasing the particle mass. Our main focus is to model the flocculation process using CFD tools to create a framework of discharging parameters.
3. Methodology
OpenFOAM is used as simulation tool to solve the equations. DriftFLuxFOAM solver is chosen to be the base solver for further development. Drift- Flux approach is a multi-phase model based on a mixture approach. The solid-liquid mixture is considered as a single phase, but corrections are applied to correct for the drift of particles with respect to the mixture, e.g., settling. The model consists of.
Mixture contnuity equation,
𝜕𝜕𝜌𝜌𝑚𝑚𝜕𝜕𝜕𝜕 + ∇. (𝜌𝜌𝑚𝑚 𝑣𝑣𝑚𝑚) = 0
Mixture momentum equation
𝜕𝜕𝜌𝜌𝑚𝑚 𝑣𝑣𝑚𝑚𝜕𝜕𝜕𝜕 + ∇. (𝜌𝜌𝑚𝑚 𝑣𝑣𝑚𝑚 𝑣𝑣𝑚𝑚)
= ∇. 𝑝𝑝𝑚𝑚
+ ∇. [𝜏𝜏 + 𝜏𝜏𝑡𝑡 + ∑ 𝛼𝛼𝑘𝑘𝜌𝜌𝑘𝑘𝑣𝑣𝑘𝑘𝑚𝑚𝑣𝑣;𝑚𝑚]+ 𝜌𝜌𝑚𝑚𝑔𝑔 + 𝑀𝑀𝐾𝐾
Phase transport equation
𝜕𝜕𝛼𝛼𝑘𝑘𝜌𝜌𝑘𝑘𝜕𝜕𝜕𝜕 + ∇. (𝜌𝜌𝑘𝑘 𝑣𝑣𝑘𝑘) = Γ
Where 𝜌𝜌𝑚𝑚is the mixture density, 𝑣𝑣𝑚𝑚is the mixture velocity, 𝛼𝛼𝑘𝑘 is the phase concentration, 𝜌𝜌𝑘𝑘 is the phase density, 𝜏𝜏, 𝜏𝜏𝑡𝑡are the viscous and turbulence diffusion respectively, 𝑣𝑣𝑘𝑘 is the solid phase velocity, 𝑣𝑣𝑘𝑘𝑚𝑚 is the relative velocity between the phase and the mixture and Γ is the turbulence diffusion source term.
MutliphaseDriftFluxFOAM is developed to account for many particle phases (e.g., different particle sizes or species). Finally, a source terms is added to incorporate the effect of aggregation. Sensitivity analysis will be conducted to test the flocculation source term. The validation process will take place using settling column experiments and lock exchange experiments. A state of the art of the research will be presented. References B. H. Corliss. foraminifera within deep-sea sediments F-1. 314(April):4–7, 1985. J. C. Goeree. Drift-flux modeling of hyper-concentrated solid-liquid flows indredging applications. PhD thesis, 2016. J. R. Hein, A. Koschinsky, and T. Kuhn. Deep-ocean polymetallic nodules asa resource for critical materials. Nature Reviews Earth & Environment, 1(3):158–169, 2020. ISSN 2662-138X. doi: 10.1038/s43017-020-0027-0. H. Thiel. Anthropogenic impacts on the deep sea. Ecosystems of the Deep Oceans, pages 427–471, 2003. ISSN 0167-4579. doi: 10.1002/cmdc.201300301. R. Wu, Y. Geng, and W. Liu. Trends of natural resource footprints in the BRIC (Brazil, Russia, India and China) countries. Journal of Cleaner Production,142:775–782, 2017. ISSN 09596526. doi: 10.1016/j.jclepro.2016.03.130.2

102
Examining erosional and depositional characteristics in cohesive sediment: Flocculation and microplastics in an estuary
J.M. Rounce1, L. Anscomb1, L. Farrington1, C. Flint1, E. Saunders1 and A.J. Manning1,2
1 School of Biological and Marine Sciences, University of Plymouth, Plymouth, UK. [email protected] 2 HR Wallingford, Howbery Park, Wallingford, Oxfordshire, UK
1. Estuarine sediment
Estuarine sediments exhibit complex erosional and depositional behaviours, affected by the interdependence of biochemical and physical / sedimentological processes (Dyer, 1989). These interactions impact flocculation processes and floc characteristics (e.g. diameter, effective density, ρe), which in turn, are key to understanding settling velocities (Ws) – a crucial element in sediment transport modelling for estuarine management. The extent of flocculation in muddy sediments found in estuaries is governed by the balance between forces of bonding cohesion, influenced by suspended particulate matter and turbulence. These processes determine floc formation and break-up (e.g. Manning et al., 2010). Biochemical composition also impacts flocculation extent, thus varying microbial communities along the estuary are important. Due to interactions between contaminant inputs and particle surfaces, and the impact this has on flocculation, this research is crucial in understanding transport of contaminants (Dyer, 1989). 2. Microplastics
Increasing demand for durable materials in society has resulted in an accumulation of microplastics in aquatic environments. Key sources include land-based inputs, such as wastewater treatment, transported via rivers (e.g. Blumenröder et al., 2017; Gallagher et al., 2016). Secondary microplastics also arise from degradation and fragmentation of larger plastic materials. Since plastic debris does not biodegrade and microplastics are easily ingested by marine organisms, these contaminants may cause harm to biological communities. This has generated increasing concern in recent years.
Additionally, microplastics incorporate into floc structures, interacting with sediment surfaces and altering the behaviour of both the sediment and contaminant particles (Lowry et al., 2012). As such, contaminant transport pathways are not well understood, giving rise to a need for research on contaminant interactions with cohesive sediments, particularly regarding flocculation. 3. Aim
This study utilises field- and laboratory-derived data to investigate flocculation and microplastic abundance in muddy and mixed cohesive sediments along the Tamar Estuary, UK. The focus of this study is to examine floc settling and size characteristics, using the LabSFLOC-2 instrument, relating this to microplastic distributions. 4. Results
Initial results indicate larger and faster settling flocs in muddy sediment (Ws = 4.1-5.2 mm.s-1; ρe = 317-352 kg.m-3; Rounce, 2021). Smaller, slower settling flocs were observed in mixed sediment (Ws = 3.8-4.0 mm.s-1;
ρe = 288-508 kg.m-3). Microplastics were most abundant, in the surface sediment, furthest seaward in the estuary, suggesting net downstream transport (Flint, 2020; Figure 1). A higher abundance was also observed near potential sources, such as the River Tavy, in the upper estuary.
Figure 1: Microplastic abundance in sediment from the
upper Tamar Estuary to the mouth (St. 1-6). Layers (top, middle, bottom) represent equal sections within 15-20
cm cores. From Flint (2020). 5. Application
This research provides a quantitative insight into floc properties and their interaction with contaminants. Sediment characteristics within varying sedimentary and dynamical conditions promote further understanding of sedimentary transport processes. This information may therefore be applied to improve the reliability of predictive numerical models. References Blumenröder, J., Sechet, P., Kakkonen, J.E. and Hartl,
M.G.J. (2017) Microplastic contamination of intertidal sediments of Scapa Flow, Orkney: A first assessment. Mar. Pol. Bul. 124, 112-120.
Dyer, K.R., (1989) Sediment processes in estuaries: future research requirements. J. Geophys. Res., 94 (C10), 14, 327-14,339.
Flint, C. (2020) Spatial distributions of micro-plastics and their interactions with sediments throughout the Tamar Estuary System. BSc dissertation, University of Plymouth, UK.
Gallagher, A., Rees, A., Rowe, R., Stevens, J. and Wright, P. (2016) Microplastics in the Solent estuarine complex, UK: An initial assessment. Mar. Pol. Bul. 102, 243-249.
Lowry, G., Gregory, K., Apte, S. and Lead, J. (2012) Transformations of Nanomaterials in the Environment - Focus Issue. Chem. Eng. News Arch., 90(45), 30.
Manning, A.J., Langston, W.J. and Jonas, P.J.C. (2010) A review of sediment dynamics in the Severn Estuary: Influence of flocculation. Mar. Pol. Bul., 61, 37-51. Doi: 10.1016/j.marpolbul.2009.12.012
Rounce, J.M. (2021) Examining the erosional and depositional behaviour of cohesive sediments. MSc dissertation, University of Plymouth, UK.

103
Flocculation study with the help of a model based on logistic growth theory W. Ali 1, C. Chassagne1
1 Environmental Fluid Mechanics, Faculty of Civil Engineering and Geosciences, Delft University of Technology, 2600
GA Delft, The Netherlands. [email protected]
1. Introduction In this work, we use a model based on logistic growth theory (Chassagne & Zainab, 2020) to study clay's flocculation. With this model, the time evolution of either the size of the particle or the concentration of particles of a given size can be fitted for the whole experiment. In the following sections, we summarise the model together and present some results. 2. Model In this section, we briefly present the formulation of the model based on the logistic growth theory. One class of particles is considered and thus n is defined as the number of particles in that class. The rate of change over time in n can be defined as:
[ ( ) ( )]dn b t d t ndt
(1)
Where birth ( )b t and decay ( )d t functions are given as:
exp( / )( )1 exp( / )
b b
b b b
a t tb tt a t t
(2)
exp( / )( )1 exp( / )
d d
d d d
a t td tt a t t
(3)
Where ba , bt , da , dt are coefficients to be parameterized. The analytical solution of Eq. 1 can be given as:
1 exp( / )( )1 exp( / )
d d
b b
a t tn t na t t
(4)
3. Experimental methods Flocculation experiments are conducted with clay referred to as K-10.000, bought from the VE-KA company. Zetag 4110 Polyelectrolyte is used as a flocculant and provided as dry powder by the company BASF. Particle/Floc's size distribution is measured by a Malvern Mastersizer 2000. For measuring particle (floc) size distribution, various clay concentrations were used ranging from 0.2g/l to 1.6 g/l. The measurements were recorded every 30 s. 4. Results Fig. 1 shows the mean hydrodynamic diameter evolution over time. The experimental data is fitted with eq. (4) over whole experiment with 0da . By increasing the clay concentration, the flocculation rate increased, which can be seen from the steepness of the hydrodynamic radius curve. The slopes presented in Figure 1 were estimated from fitting the first 5 minutes of each flocculation experiment. A linear relation between particle concentration and flocculation rate was found, in line with established theories.
Figure 1: Hydrodynamic diameter as a function of time for the various clay concentrations indicated in the legend. The solid
lines correspond to the fit of data between 0 to 3500 s using eq. 4. Standard deviation is represented by bars where the mean
was calculated by averaging over five experimental measurements.
Figure 2: The slopes were estimated from the size measurements over time from the first 5 minutes of each flocculation experiment. Error bar represents the standard deviation of three experiments. 3. Conclusions In this work, we apply a logistic growth theory to study the flocculation of clay with Zetag 4110. It can be seen that this model is very efficient for fitting an extensive range of data for the whole experimental duration. Our future work will show the further application of this model for different types of flocculation processes. References Chassagne, C., Safar, Z. (2020). Modelling flocculation:
Towards an integration in large-scale sediment transport models. Marine Geology 430 (2020): 106361.

104
Cohesive Sediment Fluxes in a Muddy Tidal Channel Highly Impacted by Humans
S.M. Figueroa1, G. Lee1, and J. Chang1
1 Department of Oceanography, Inha University, Incheon, Republic of Korea. [email protected]
1. Introduction Wetlands and intertidal flats are important sites for fisheries and migratory birds, and also function as recreational areas. At the same time intertidal areas and wetlands are increasingly important residential, agricultural, and industrial sites as increasing population and economic development continue to drive land development projects and put anthropogenic pressure on coastal ecosystems. One such project is the development of the Songdo International Business District (SIBD) in Incheon, Korea (Figure 1). SIBD was built on more than 40 km2 of reclaimed land along Incheon’s waterfront, 30 km southwest of Seoul. Further land reclamation and development of artificial channels are planned, known as the Songdo Waterfront Development Project. However, the cohesive sediment dynamics of these highly impacted, muddy tidal channels is not well understood. Therefore, flow and cohesive sediment transport were measured along two points along a highly altered muddy tidal channel. This study helps to improve our understanding of cohesive sediment dynamics in these environments and their potential management. 2. Methods and Results 2.1 Data Collection Mooring data was collected by a Signature 1000 at the channel mouth and an Aquadopp-HR and Vector in the inner channel for one month during July and August 2019. Casting data was collected for one tidal cycle at both locations from bridges (Figure 1, red points). 2.2 Data Analysis Conventional analysis was performed on flow, stratification, and suspended sediment concentration in the tidal channel. The mooring data was used extend the casting data. The results of both points were correlated. 2.3 Results The depth was significantly deeper and currents were stronger at the mouth than further up the channel, where it was intertidal. The flood tide was found to be relatively rapid in the inner channel station. Waves were found to be negligible in the inner channel. Measurements of suspended sediment concentration (concentrations reaching 30 mg L-1) confirmed a significant bidirectional flux of fine, cohesive sediment.
Figure 1: Satellite imaged of land reclamation for
Songdo International Business District (SIBD). A) A-am channel in 2/5/2003; B) A-am channel in 3/8/2019. Red
points in B indicate instrument mooring and casting locations.
3. Conclusions This study established that the muddy tidal channel exhibits active sediment dynamics. These observations provide a link between the observed increased depositional rates in the channel and the cohesive sediment processes, such as change in the sediment settling and scour lag mechanism.

105
Influence of riverine suspended sediment organic matter on particle size distribution
D. Sehgal1,2, N. Martínez-Carreras1, C. Hissler1, V.F. Bense2 and A.J.F. Hoitink2
1 Catchment and Eco-Hydrology Research Group, Luxembourg Institute of Science and Technology, Belvaux, Luxembourg. [email protected]
2 Hydrology and Quantitative Water Management Group, Wageningen University and Research, Wageningen, The Netherlands
Introduction The presence or absence of organic matter (OM) in suspended sediment (SS) can result in larger or lower aggregation efficiency (Fettweis et al., 2006). This can be due to complex local interactions between SS organic and mineral phases having adhesive and cohesive properties (Droppo, 2001; Gerbersdorf and Wieprecht, 2015). For example, Maggi and Tang (2015) found a nonlinear relationship between SS fractions (organic and mineral), sediment density and floc size. Knowledge on SS carbon content (proxy for SS OM) and particle size is thus important to better understand the aggregated form of SS (i.e. floc) that directly affect sediment transport and other sediment properties (e.g. settling velocity and density). SS carbon content and particle size also exert an impact on the readings of the optical sensors traditionally used to measure turbidity, affecting local calibrations to estimate SS concentration. In that respect, a better understanding of local relations between SS carbon content and particle size could eventually help us to move towards ‘global’ dependencies based on in-situ SS properties. In this study, we aim to investigate the relationship between particle size distribution and SS carbon content by means of (i) a laboratory experiment, and (ii) in-situ and high frequency SS characterization. Here, high frequency measurements provide more insight on SS processes, which can be unseen in the laboratory. Methods We collected sediments from 6 sites in Luxembourg with contrasting composition representing different land use types and geological settings. The sampled sediments were wet sieved into 3 size classes and one part of the sieved samples were oxidised with hydrogen peroxide to clearly recognize the effect of particle size on carbon content. To this end, we first tested our approach under controlled conditions with an experimental laboratory setup (Figure 1) consisting of a cylindrical tank (40-L) with an open top. A stirrer facilitated the homogeneous mixing of SS and prevented settling of heavy particles. Here, a submerged UV-VIS spectrolyser was used to estimate SS carbon content and a LISST-200X sensor to measure particle size distribution. Carbon content was measured in the laboratory with a CHNS Elemental analyser to calibrate the spectrometer readings, and Mastersizer 3000 to measure particle size distribution. Laboratory results were then validated using field data from two instrumented sites in Luxembourg (Alzette River at Huncherange and Attert River at Useldange).
Figure 1: Laboratory setup with three installed sensors: a LISST-200X particle size analyser (Sequoia Scientific,
Inc.), a UV-VIS V2 spectro::lyser (s::can GmbH) and an EXO turbidity sensor (YSI Inc./Xylem Inc.).
Results Figure 2 shows the relation between carbon content and median particle size (D50) at Huncherange during a storm runoff event. D50 increases with carbon content, and decreases with discharge (data not shown). Ongoing analysis with riverine SS using both laboratory and in-situ field data will be discussed.
Figure 2: Scatter plot between carbon content (%) and
median particle size, D50 (µm). Acknowledgments Study supported by the Luxembourg National Research Fund (FNR; PRIDE15/10623093/HYDRO-CSI). References Droppo, I. G. (2001). Rethinking what constitutes
suspended sediment. Hydrological Processes, 15(9), 1551–1564.
Fettweis, M., Francken, F., Pison, V., & Eynde, D. Van Den. (2006). Suspended particulate matter dynamics and aggregate sizes in a high turbidity area. Marine Geology, 235, 63–74.
Gerbersdorf, S., & Wieprecht, S. (2015). Biostabilization of cohesive sediments : revisiting the role of abiotic conditions , physiology and diversity of microbes , polymeric secretion , and biofilm architecture. Geobiology, 13, 68–97.
Maggi, F., & Tang, F. H. M. (2015). Analysis of the effect of organic matter content on the architecture and sinking of sediment aggregates. Marine Geology, 363, 102–111.

106
Vertical distributions of mud floc sizes in two reaches of the lowermost Mississippi River
Ryan Osborn1, Kyle Strom1, Kieran Dunne2, Jeffrey A. Nittrouer2, and Tom Ashley1
1 Department of Civil and Environmental Engineering, Virginia Tech, Blacksburg, VA, USA. [email protected] 2 Department of Earth, Environmental and Planetary Sciences, Rice University, Houston, TX, USA
1. Introduction Predicting mud transport and deposition patterns requires knowledge of the settling velocity of the suspended sediment. For muds, the settling velocity is an outcome of the size and density of the mud aggregates, or flocs that can grow or shrink in size depending on turbulence levels and the salinity, biological content, and amount and type of sediment in the water. The flocculation process has been most studied in coastal regions where large volumes of mud are delivered and seawater is available to enhance the ion concentration of the water; a condition that has long been linked with the onset of mud flocculation. While studies have pointed out that flocs do form in freshwater as well, little effort has been made to systematically measure floc size in freshwater rivers for the purposes of understanding sediment transport dynamics.
As part of a broader project to understand the movement of mud in the fluvial to marine transition, we herein present the vertical distribution of floc sizes in two sections of the lowermost Mississippi River. The first section is the pure freshwater reach near Venice, LA. The second is a section of Southwest Pass where the presence of a marine salt wedge produced vertical stratification in salinity, temperature, suspended sediment, and dissolved organic matter. The specific research questions we investigate are (1) what impact does the presence of flocs have on the vertical distribution of mud concentration in the freshwater reach; and (2) how are floc sizes impacted by the presence of the salt wedge over the vertical. 2. Methods Our research questions are investigated through a field study in which distributions of floc sizes are collected in situ over the vertical, in summer and winter, using a waterproofed camera system referred to as the FLOC AReA and siZing Instrument, or FLOCARAZI (Figure1).
Figure 1: the FLOC AReA and siZing Instrument
(FLOCARAZI).
The FLOCARAZI consists of a camera mounted to a stepper motor driven linear guide slide rail, and an LED for backlight illuminating of the camera field of view. The camera, stepper motor, and LED are powered and controlled from the surface by two 60-meter-long weatherproof Cat6 ethernet cables. This allows for a real-time camera feed and in-situ adjustment of the camera focus and LED brightness. The camera is a monochrome 4000x3000 pixel FLIR, OR, USA, Blackfly S GigE with a CMOS Sony IMX226 sensor that has a pixel size of 1.85 microns. The len assembly produces a 2X effective magnification, resulting in an image pixel size of 0.9 microns and a nominal field of view of 3.7x2.8mm. Other measurements collected along with the floc images included: velocity, salinity, temperature, suspended sediment concentration, and organic content all sampled over the vertical. In this presentation we provide results from sampling trips conducted in June 2020 and January 2021. 3. Results Flocs were present in all images captured during the two sampling trips (Figure 2). This was true for both the freshwater reach and the salt wedge reach. Floc sizes were fairly uniform over most of the depth in the freshwater sections with a slight increase in floc size near the free surface and a slight decrease in floc size near the bed. Within the salt wedge reach, floc sizes peaked near the top of the mixing zone between the cool upper freshwater and the warmer marine water.
Figure 2: Example image from the freshwater reach
during June 2020. 4. Conclusions Mud existed in a flocculated state in all of the sampled regions of the river regardless of season or salt levels. In this presentation we discuss the nature of the size distribution over the vertical.

107
Estuarine light attenuation, scattering, and absorption as a function of suspended floc properties and other water column constitutents
C.T. Friedrichs1, K.A. Fall2, and G.M. Massey1
1 Virginia Institute of Marine Science, Gloucester Point, VA, USA. [email protected] 2 U.S. Army Engineer Research and Development Center, Vicksburg, MS, USA
Extended Abstract Observations of suspended floc characteristics, commonly measured water quality parameters (total suspended solids (TSS), total organic solids (OSS), chlorophyll a concentration (chl a), and absorbance of color dissolved organic matter (CDOM)) and optical properties (diffuse light attenuation (Kd) and scattering (b)) were collected on 20 cruises from 2014-2016 at various stations along the York River estuary and associated absorption (a) was estimated via model inversion. The response of scattering (b) and absorption (a) to estuarine flocs of varying size, density, and composition then was investigated. Systematic trends in the relative contributions of organic and inorganic solids (OSS and ISS) along with other water quality parameters to b, a, and Kd as an overall function of TSS concentration revealed that the contribution of non-algal suspended solids on Kd may be smaller than originally assumed, especially compared to other water quality constituents.
Simple expressions describing scattering and absorption due to non-algal particulate matter (bNAP and aNAP) averaged over photosynthetically active radiation (PAR) (400-700 nm) were determined, with efforts taken to account for the influence of algal particles (i.e., phytoplankton). Expressions from the literature relating phytoplankton scattering, absorption, biomass, and composition to observed chl a concentrations for estuarine conditions similar to the York were used to isolate contributions from phytoplankton cells and estimate OSS and ISS due to non-algal particulate matter (OSSNAP, ISSNAP).
Total scattering was measured directly in situ using a Laser In-Situ Scattering and Transmissometry instrument (LISST-100X). Scattering due to phytoplankton (balg) was subtracted, and a relationship in the form of a power law was derived to represent scattering by non-algal particulate matter (bNAP). Combined with a literature-based relationship for balg, a simple model for total b was developed (Figure 1, top). A similar approach was taken for absorption. First, total absorption was estimated by applying the non-linear model of Kirk (1994) to in situ observations of Kd and b. Then, observation-based estimates of absorption by CDOM (aCDOM), combined with literature-based relations for absorption due to water (aw) and chl a, were subtracted from a to estimate absorption due to non-algal particulate matter (aNAP). A simple best-fit empirical relationship, consistent with the assumption that organic solids absorb two-times that compared to inorganic solids was found. The expression for aNAP was combined with the other constituents to produce a model for total a (Figure 1, bottom).
A model based on Kirk (1994) for Kd over PAR was constructed from the above models for b and a as a
function of commonly observed water quality parameters, such that measurements of a and b were no longer required as inputs. The model-data fit for Kd exhibited r = 0.90 with a mean error of 16.6%.
This study provided new insights into the influence on scattering and absorption of estuarine flocs that are composed of a mixture of inorganic solids, organic solids, and water. In the York, scattering and absorption were related to the nature of the flocs in the system. Floc scattering, which is proportional to floc cross-sectional area, increased faster than TSS because of strongly decreasing floc density. In contrast, absorption by flocs increased more slowly than TSS. This may be due to both that (i) organic solids, which form a greater fraction of floc content at low TSS, absorb about twice as much light per mass than inorganic solids, and (ii) the increased water relative to solids content of larger flocs may make them less opaque. The effects of varying organic and water content with changing TSS within the flocs notably alter the otherwise expected trends for optical response based on floc fractal theory.
Figure 1: Comparison between observed and modeled
scattering (top) and absorption (bottom) of light. References Kirk, J.T.O., 1994. Light and Photosynthesis in Aquatic
Ecosystems. Cambridge University Press.
1 0 0 1 0 1 1 0 2
b (1 /m ) = 0 .2 0 *c h la 0 .7 5 1 + 0 .1 0 * (O S SN A P + IS S N A P )1 .3 9
1 0 0
1 0 1
1 0 2
b (1
/m)
r = 0 .9 2
0 .3 1 2 3a (1 /m ) = a w + 0 .0 1 *c h la + a C D O M + 0 .0 2 * (2 O S S N A P + IS S N A P ) 0 .8 7
0 .3
1
2
3
a (1
/m)
r= 0 .8 2
108