BOLD and CBV-weighted functional magnetic resonance imaging of the rat somatosensory system
9
BOLD and CBV-Weighted Functional Magnetic Resonance Imaging of the Rat Somatosensory System Shella D. Keilholz, 1 Afonso C. Silva, 2 Mira Raman, 3 Hellmut Merkle, 2 and Alan P. Koretsky 2 * A multislice spin echo EPI sequence was used to obtain func- tional MR images of the entire rat brain with blood oxygenation level dependent (BOLD) and cerebral blood volume (CBV) con- trast at 11.7 T. Maps of activation incidence were created by warping each image to the Paxinos rat brain atlas and marking the extent of the activated area. Incidence maps for BOLD and CBV were similar, but activation in draining veins was more prominent in the BOLD images than in the CBV images. Cere- bellar activation was observed along the surface in BOLD im- ages, but in deeper regions in the CBV images. Both effects may be explained by increased signal dropout and distortion in the EPI images after administration of the ferumoxtran-10 con- trast agent for CBV fMRI. CBV-weighted incidence maps were also created for 10, 20, and 30 mg Fe/kg doses of ferumoxtran- 10. The magnitude of the average percentage change during stimulation increased from 4.9% with the 10 mg Fe/kg dose to 8.7% with the 30-mg Fe/kg dose. Incidence of activation fol- lowed a similar trend. Magn Reson Med 55:316 –324, 2006. Published 2005 Wiley-Liss, Inc. † Key words: fMRI; BOLD; cerebral blood volume; somatosensory stimulation; 11.7 Tesla MRI Rodents play an important role in neuroscience research. The development of robust whole-brain functional imag- ing of the rodent should have application to problems in learning, plasticity, and cortical organization. Much of the original development of functional MRI techniques was done in rodents (1–3), and many subsequent studies have examined activation in the primary sensory cortex during somatosensory stimulation (3–11). These studies have been important for understanding the basis of fMRI. Whole-brain fMRI to study an entire neural network has rarely been used in rodents even though it is routine for human fMRI. This is due in part to the need for high spatial resolution to resolve the small secondary areas in the brain. The progressive development of high-field ani- mal scanners with strong gradients and short rise times has increased imaging speed and resolution, making high-res- olution functional imaging of the whole brain feasible (12). Despite these advances, there are few studies that have examined learning or plasticity using fMRI in small ani- mals (13,14). There are many problems yet to be addressed in making whole-brain rodent fMRI a robust technique for neuro- science. Sensitivity is an important issue. Areas outside the primary sensory cortex (SI) may activate less strongly, and in small areas activation is further diluted by partial volume effects. In our previous work with blood oxygen- ation level dependent (BOLD) contrast, the incidence of activation in the thalamus, cerebellum, and secondary so- matosensory cortex (SII) was 30 –70% of the incidence rate in the primary somatosensory cortex (12). A functional imaging method with greater sensitivity could improve our ability to detect activation in these areas. It is also possible that the regional hemodynamic coupling is differ- ent in the secondary areas and that cerebral blood volume (CBV) or perfusion-weighted fMRI may give better results than BOLD. CBV-weighted fMRI has been shown to increase func- tional contrast to noise compared to BOLD at low field strengths, which has led to its use in small animal studies and in applications of fMRI to nonhuman primates 3,15– 19. As field strength increases, this advantage decreases (3). However, previous work has shown that CBV- weighted fMRI at 11.7 T can achieve activation similar to that of BOLD in the primary somatosensory cortex (20). Several experiments have shown that BOLD and CBV- weighted fMRI have different spatial and temporal re- sponses. Mandeville et al. determined that during a 30-s stimulation, the CBV signal is slower to reach its peak after onset and slower to return to baseline at the end of stim- ulation (3). Interestingly, the initial rise in CBV occurs faster than the BOLD signal (3,21). Activation seen along draining veins in the BOLD images was not apparent in the CBV-weighted images (3,21). Draining veins have long caused localization problems in BOLD fMRI, and eliminat- ing them is particularly attractive for whole-brain imaging. However, the susceptibility gradient produced by ultras- mall superparamagnetic iron oxide (USPIO) particles in- jected into the blood to provide CBV weighting may cause signal dropout and image distortion, especially at high fields with fast imaging sequences such as echo planar imaging (EPI). In this study, we compared BOLD functional imaging and CBV-weighted functional imaging for whole-brain fMRI of the rat during forepaw stimulation. Specifically, the contrast agent dose dependence for incidence of acti- vation in different areas of the brain was studied. The presence of draining veins and the effect of image distor- tion were also examined. 1 Emory University, Atlanta, Georgia, USA. 2 National Institutes of Health, Bethesda, Maryland, USA. 3 Stanford University, Palo Alto, California, USA. Grant sponsor: NIH, NINDS intramural research program. *Correspondence to: Alan P. Koretsky, Laboratory of Functional and Molec- ular Imaging, National Institute of Neurological Disorders and Stroke, National Institutes of Health, 10 Center Drive, 10/B1D728, MSC 1065, Bethesda, MD 20892, USA. E-mail: [email protected] Received 8 March 2005; revised 24 August 2005; accepted 31 August 2005. DOI 10.1002/mrm.20744 Published online 21 December 2005 in Wiley InterScience (www.interscience. wiley.com). Magnetic Resonance in Medicine 55:316 –324 (2006) Published 2005 Wiley-Liss, Inc. † This article is a US Government work and, as such, is in the public domain in the United States of America. 316
-
Upload
independent -
Category
Documents
-
view
5 -
download
0
Transcript of BOLD and CBV-weighted functional magnetic resonance imaging of the rat somatosensory system

BOLD and CBV-Weighted Functional Magnetic ResonanceImaging of the Rat Somatosensory System
Shella D. Keilholz,1 Afonso C. Silva,2 Mira Raman,3 Hellmut Merkle,2 andAlan P. Koretsky2*
A multislice spin echo EPI sequence was used to obtain func-tional MR images of the entire rat brain with blood oxygenationlevel dependent (BOLD) and cerebral blood volume (CBV) con-trast at 11.7 T. Maps of activation incidence were created bywarping each image to the Paxinos rat brain atlas and markingthe extent of the activated area. Incidence maps for BOLD andCBV were similar, but activation in draining veins was moreprominent in the BOLD images than in the CBV images. Cere-bellar activation was observed along the surface in BOLD im-ages, but in deeper regions in the CBV images. Both effectsmay be explained by increased signal dropout and distortion inthe EPI images after administration of the ferumoxtran-10 con-trast agent for CBV fMRI. CBV-weighted incidence maps werealso created for 10, 20, and 30 mg Fe/kg doses of ferumoxtran-10. The magnitude of the average percentage change duringstimulation increased from 4.9% with the 10 mg Fe/kg dose to8.7% with the 30-mg Fe/kg dose. Incidence of activation fol-lowed a similar trend. Magn Reson Med 55:316–324, 2006.Published 2005 Wiley-Liss, Inc.†
Key words: fMRI; BOLD; cerebral blood volume; somatosensorystimulation; 11.7 Tesla MRI
Rodents play an important role in neuroscience research.The development of robust whole-brain functional imag-ing of the rodent should have application to problems inlearning, plasticity, and cortical organization. Much of theoriginal development of functional MRI techniques wasdone in rodents (1–3), and many subsequent studies haveexamined activation in the primary sensory cortex duringsomatosensory stimulation (3–11). These studies havebeen important for understanding the basis of fMRI.Whole-brain fMRI to study an entire neural network hasrarely been used in rodents even though it is routine forhuman fMRI. This is due in part to the need for highspatial resolution to resolve the small secondary areas inthe brain. The progressive development of high-field ani-mal scanners with strong gradients and short rise times hasincreased imaging speed and resolution, making high-res-olution functional imaging of the whole brain feasible (12).Despite these advances, there are few studies that have
examined learning or plasticity using fMRI in small ani-mals (13,14).
There are many problems yet to be addressed in makingwhole-brain rodent fMRI a robust technique for neuro-science. Sensitivity is an important issue. Areas outsidethe primary sensory cortex (SI) may activate less strongly,and in small areas activation is further diluted by partialvolume effects. In our previous work with blood oxygen-ation level dependent (BOLD) contrast, the incidence ofactivation in the thalamus, cerebellum, and secondary so-matosensory cortex (SII) was 30–70% of the incidence ratein the primary somatosensory cortex (12). A functionalimaging method with greater sensitivity could improveour ability to detect activation in these areas. It is alsopossible that the regional hemodynamic coupling is differ-ent in the secondary areas and that cerebral blood volume(CBV) or perfusion-weighted fMRI may give better resultsthan BOLD.
CBV-weighted fMRI has been shown to increase func-tional contrast to noise compared to BOLD at low fieldstrengths, which has led to its use in small animal studiesand in applications of fMRI to nonhuman primates 3,15–19. As field strength increases, this advantage decreases(3). However, previous work has shown that CBV-weighted fMRI at 11.7 T can achieve activation similar tothat of BOLD in the primary somatosensory cortex (20).
Several experiments have shown that BOLD and CBV-weighted fMRI have different spatial and temporal re-sponses. Mandeville et al. determined that during a 30-sstimulation, the CBV signal is slower to reach its peak afteronset and slower to return to baseline at the end of stim-ulation (3). Interestingly, the initial rise in CBV occursfaster than the BOLD signal (3,21). Activation seen alongdraining veins in the BOLD images was not apparent in theCBV-weighted images (3,21). Draining veins have longcaused localization problems in BOLD fMRI, and eliminat-ing them is particularly attractive for whole-brain imaging.However, the susceptibility gradient produced by ultras-mall superparamagnetic iron oxide (USPIO) particles in-jected into the blood to provide CBV weighting may causesignal dropout and image distortion, especially at highfields with fast imaging sequences such as echo planarimaging (EPI).
In this study, we compared BOLD functional imagingand CBV-weighted functional imaging for whole-brainfMRI of the rat during forepaw stimulation. Specifically,the contrast agent dose dependence for incidence of acti-vation in different areas of the brain was studied. Thepresence of draining veins and the effect of image distor-tion were also examined.
1Emory University, Atlanta, Georgia, USA.2National Institutes of Health, Bethesda, Maryland, USA.3Stanford University, Palo Alto, California, USA.Grant sponsor: NIH, NINDS intramural research program.*Correspondence to: Alan P. Koretsky, Laboratory of Functional and Molec-ular Imaging, National Institute of Neurological Disorders and Stroke, NationalInstitutes of Health, 10 Center Drive, 10/B1D728, MSC 1065, Bethesda, MD20892, USA. E-mail: [email protected] 8 March 2005; revised 24 August 2005; accepted 31 August 2005.DOI 10.1002/mrm.20744Published online 21 December 2005 in Wiley InterScience (www.interscience.wiley.com).
Magnetic Resonance in Medicine 55:316–324 (2006)
Published 2005 Wiley-Liss, Inc. † This article is a US Governmentwork and, as such, is in the public domain in the United States of America.
316
METHODS
Animal Preparation
All experiments were performed in compliance withguidelines set by the National Institutes of NeurologicDisorders and Stroke ACUC. Twenty-four adult male Spra-gue–Dawley rats (150–311 g) were initially anesthetizedwith 5% halothane and maintained at 1.5% halothaneduring the following surgical procedures. Each rat wasorally intubated and placed on a mechanical ventilatorthroughout the surgery and the experiment. Polyethylenecatheters were inserted into the right femoral artery andvein to allow monitoring of arterial blood gases and ad-ministration of drugs. Two needle electrodes were insertedjust under the skin of each forepaw, one between digits 1and 2 and the other between digits 3 and 4. After surgery,the rat was given an i.v. bolus of �-chloralose (80 mg/kg)and halothane was discontinued. Anesthesia was main-tained with a constant �-chloralose infusion (27 mg/kg/hr)(9).
The rat was placed on a heated water pad to maintainrectal temperature at approximately 37°C while in themagnet. Each animal was secured in a head holder withear bars and a bite bar to prevent head motion and wasstrapped to a plastic cradle. End-tidal CO2, rectal temper-ature, tidal pressure of ventilation, heart rate, and arterialblood pressure were continuously monitored during theexperiment. Arterial blood gas levels were checked peri-odically and corrections were made by adjusting respira-tory volume or administering sodium bicarbonate to main-tain normal levels when required. An i.v. injection ofpancuronium bromide (4 mg/kg) was given once per hourto prevent motion. After BOLD fMRI studies were finished,the rats were i.v.: either given 10 mg Fe/kg (6 rats), 20 mgFe/kg (10 rats), or 30 mg Fe/kg (10 rats) of ferumoxtran-10,a dextran-coated superparamagnetic iron oxide particlewith a long blood half-life (Combidex, AMI-227, gift ofAdvanced Magnetics, Inc., Cambridge, MA, USA). Tworats were given 10 mg Fe/kg followed by 20 mg Fe/kg andare included in both the 10- and the 30-mg groups.
MRI
All images were acquired with an 11.7 T/31 cm horizontalbore magnet (Magnex, Abingdon, UK), interfaced to anAVANCE console (Bruker, Billerica, MA, USA) andequipped with a 9-cm gradient set, capable of providing45 G/cm with a rise time of 75 �s. Shimming was per-formed with a custom-built shim set and high power shimsupply (Resonance Research Inc; Billerica, MA, USA). Ex-citation was provided by a homebuilt 70-mm inner diam-eter birdcage coil. A contoured rectangular surface coil(2 � 3 cm) that attached to the head holder was used toreceive the MR signal. Scout images were acquired in threeplanes with a fast spin echo sequence to determine appro-priate positioning for the functional study.
A spin echo EPI sequence was used for the fMRI studies.Setup included shimming, adjustments to echo spacingand symmetry, and B0 compensation. For BOLD fMRIstudies, a single-shot sequence with a 64 � 64 matrix wasrun with the following parameters: effective echo time30 ms, repetition time 1.5 s, bandwidth 200 kHz, field of
view 1.92 � 1.92 cm. Whole-brain coverage was obtainedwith ten to eleven 2-mm-thick slices, spaced 0.2 mm apart.For the CBV-weighted studies, the bandwidth was in-creased to 250 kHz, allowing the effective echo time to beshortened to 20 ms.
Anatomic images were also obtained from one rat todepict the surface vasculature of the rat brain, which maycontribute to the BOLD signal. A 3D FLASH sequence withthe following parameters was used: TE 5 ms, TR 20 ms, flipangle (FA) 15°, matrix size 384 � 192 � 256. This gave anisotropic resolution of 100 �m.
Somatosensory Stimulation Paradigm
A World Precision Instruments stimulator (WPI, Sarasota,FL, USA) supplied 2-mA, 300-�s pulses repeated at 3 Hz toboth forepaws upon demand. The paradigm consisted of10 dummy scans to reach steady state, followed by 60scans during rest, 30 scans during forepaw stimulation,and a final 60 scans during rest, for a total experiment timeof 4 min. The animal was allowed to rest for approximately3 to 5 min, and then the stimulation paradigm was re-peated.
Data Analysis
Analysis of the time series was performed using STIMU-LATE (University of Minnesota). A correlation coefficientwas calculated from cross-correlation of the unfilteredtime series with a boxcar waveform representing the stim-ulation period. The activation threshold was set at 0.2, andonly groups that included at least four activated pixelswere considered significant. One to three fMRI series fromeach animal were analyzed, depending on the physiologicstability of the animal. Time courses from activated pixelsin SI, SII, thalamus, and cerebellum were recorded andaveraged to form a representative response for each region.A linear baseline correction was performed on all timecourses.
Using a customized program developed in-house, thePaxinos rat brain atlas (22) was digitized so it could bewarped to each MRI slice containing a specific region ofinterest. The location of the activated pixels of that slice inrelation to the atlas could be saved. The same program wasthen used to read in the atlas images with activated pixelsfrom each rat and add them together to display the relativeincidence of activation in each region in the atlas coordi-nate system.
For the dose-dependent CBV-weighted studies, the inci-dence of activation in each area for each dose was re-corded. Time courses were measured for a 3 � 3 pixel areain SI for each dose.
RESULTS
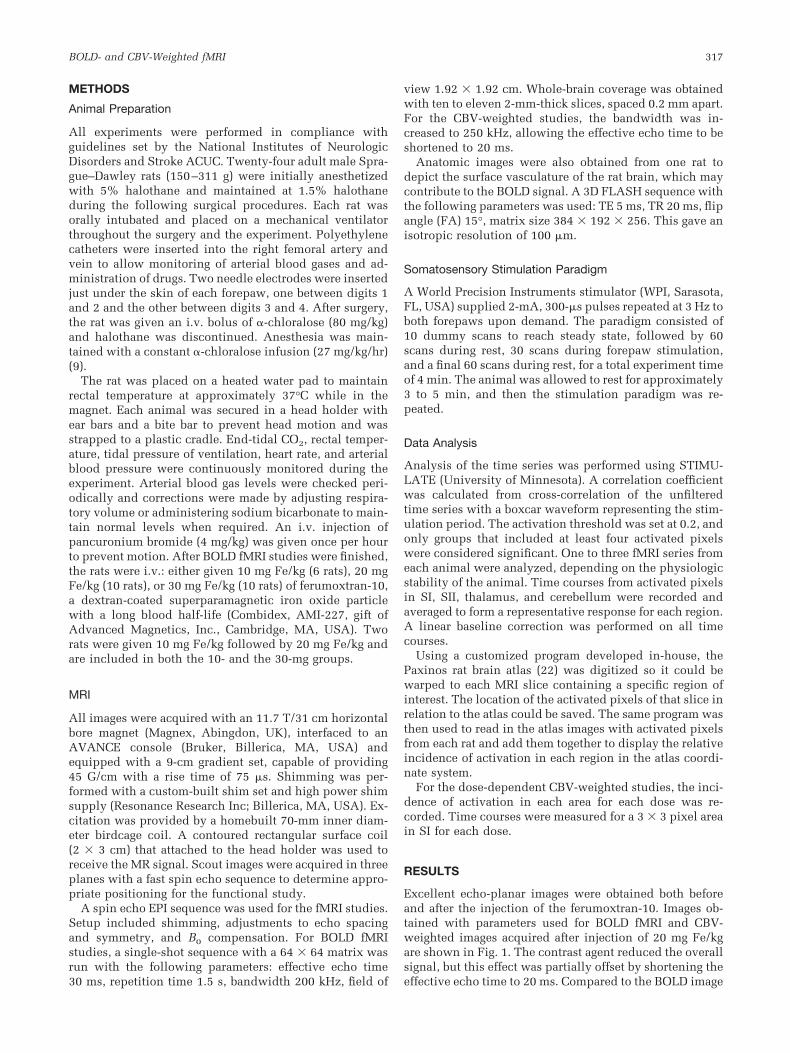
Excellent echo-planar images were obtained both beforeand after the injection of the ferumoxtran-10. Images ob-tained with parameters used for BOLD fMRI and CBV-weighted images acquired after injection of 20 mg Fe/kgare shown in Fig. 1. The contrast agent reduced the overallsignal, but this effect was partially offset by shortening theeffective echo time to 20 ms. Compared to the BOLD image
BOLD- and CBV-Weighted fMRI 317
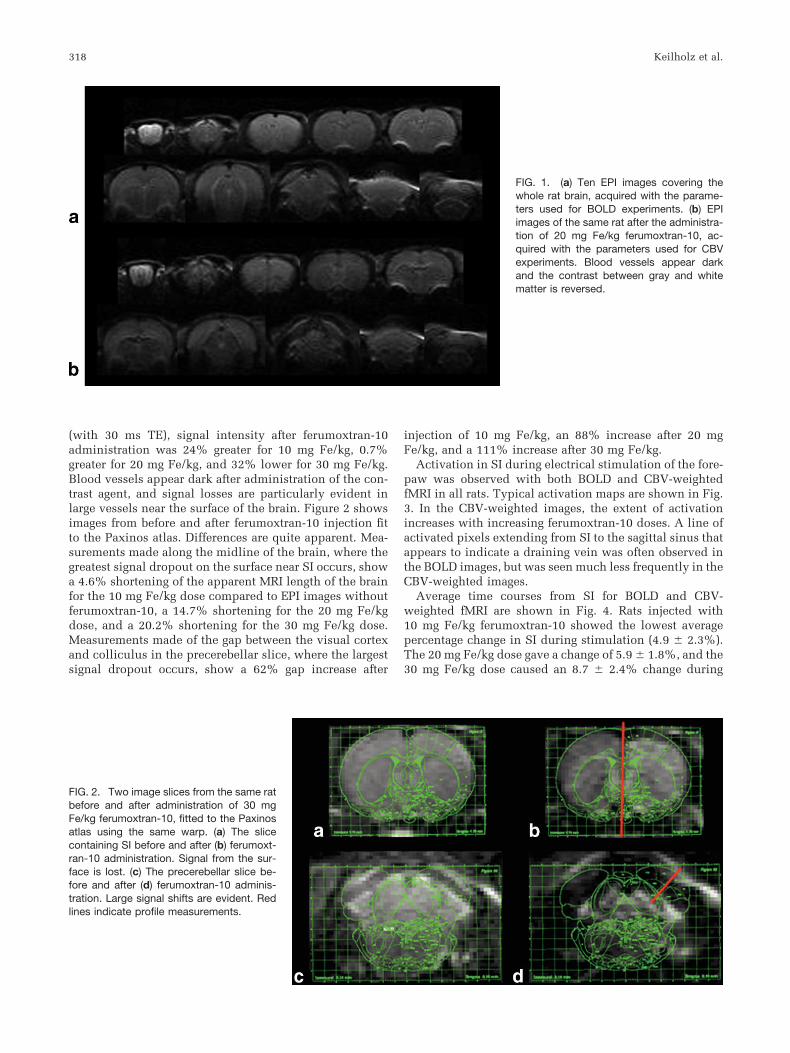
(with 30 ms TE), signal intensity after ferumoxtran-10administration was 24% greater for 10 mg Fe/kg, 0.7%greater for 20 mg Fe/kg, and 32% lower for 30 mg Fe/kg.Blood vessels appear dark after administration of the con-trast agent, and signal losses are particularly evident inlarge vessels near the surface of the brain. Figure 2 showsimages from before and after ferumoxtran-10 injection fitto the Paxinos atlas. Differences are quite apparent. Mea-surements made along the midline of the brain, where thegreatest signal dropout on the surface near SI occurs, showa 4.6% shortening of the apparent MRI length of the brainfor the 10 mg Fe/kg dose compared to EPI images withoutferumoxtran-10, a 14.7% shortening for the 20 mg Fe/kgdose, and a 20.2% shortening for the 30 mg Fe/kg dose.Measurements made of the gap between the visual cortexand colliculus in the precerebellar slice, where the largestsignal dropout occurs, show a 62% gap increase after
injection of 10 mg Fe/kg, an 88% increase after 20 mgFe/kg, and a 111% increase after 30 mg Fe/kg.
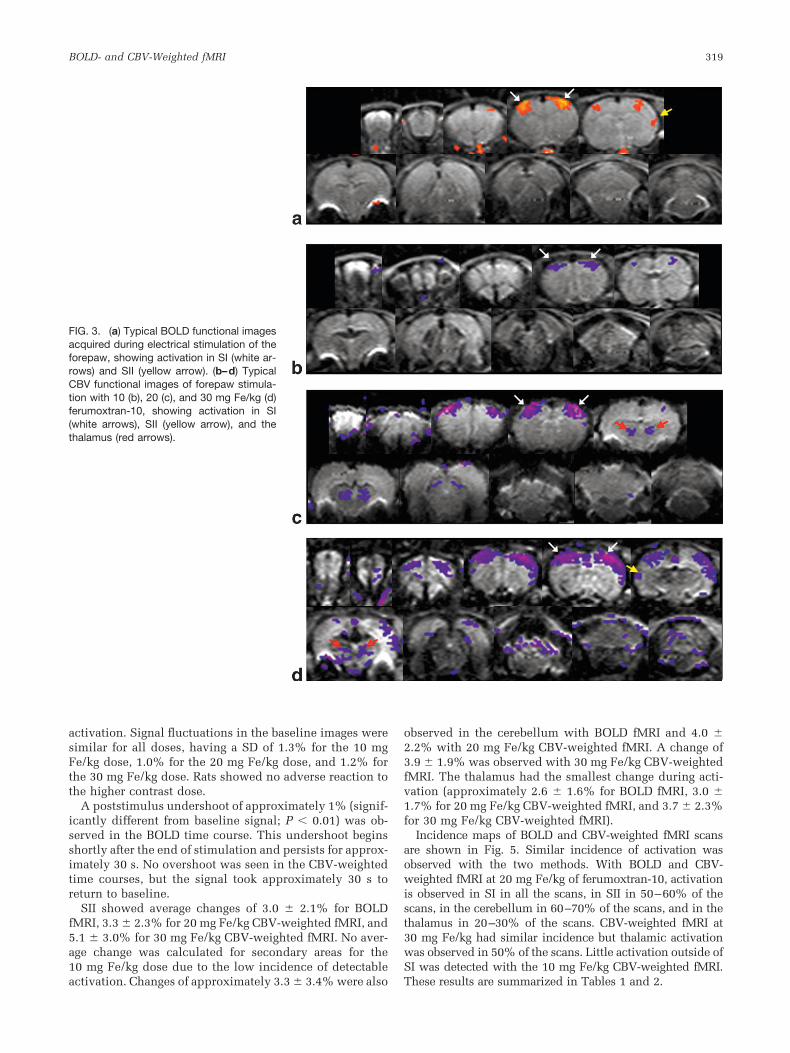
Activation in SI during electrical stimulation of the fore-paw was observed with both BOLD and CBV-weightedfMRI in all rats. Typical activation maps are shown in Fig.3. In the CBV-weighted images, the extent of activationincreases with increasing ferumoxtran-10 doses. A line ofactivated pixels extending from SI to the sagittal sinus thatappears to indicate a draining vein was often observed inthe BOLD images, but was seen much less frequently in theCBV-weighted images.
Average time courses from SI for BOLD and CBV-weighted fMRI are shown in Fig. 4. Rats injected with10 mg Fe/kg ferumoxtran-10 showed the lowest averagepercentage change in SI during stimulation (4.9 � 2.3%).The 20 mg Fe/kg dose gave a change of 5.9 � 1.8%, and the30 mg Fe/kg dose caused an 8.7 � 2.4% change during
FIG. 1. (a) Ten EPI images covering thewhole rat brain, acquired with the parame-ters used for BOLD experiments. (b) EPIimages of the same rat after the administra-tion of 20 mg Fe/kg ferumoxtran-10, ac-quired with the parameters used for CBVexperiments. Blood vessels appear darkand the contrast between gray and whitematter is reversed.
FIG. 2. Two image slices from the same ratbefore and after administration of 30 mgFe/kg ferumoxtran-10, fitted to the Paxinosatlas using the same warp. (a) The slicecontaining SI before and after (b) ferumoxt-ran-10 administration. Signal from the sur-face is lost. (c) The precerebellar slice be-fore and after (d) ferumoxtran-10 adminis-tration. Large signal shifts are evident. Redlines indicate profile measurements.
318 Keilholz et al.
activation. Signal fluctuations in the baseline images weresimilar for all doses, having a SD of 1.3% for the 10 mgFe/kg dose, 1.0% for the 20 mg Fe/kg dose, and 1.2% forthe 30 mg Fe/kg dose. Rats showed no adverse reaction tothe higher contrast dose.
A poststimulus undershoot of approximately 1% (signif-icantly different from baseline signal; P � 0.01) was ob-served in the BOLD time course. This undershoot beginsshortly after the end of stimulation and persists for approx-imately 30 s. No overshoot was seen in the CBV-weightedtime courses, but the signal took approximately 30 s toreturn to baseline.
SII showed average changes of 3.0 � 2.1% for BOLDfMRI, 3.3 � 2.3% for 20 mg Fe/kg CBV-weighted fMRI, and5.1 � 3.0% for 30 mg Fe/kg CBV-weighted fMRI. No aver-age change was calculated for secondary areas for the10 mg Fe/kg dose due to the low incidence of detectableactivation. Changes of approximately 3.3 � 3.4% were also
observed in the cerebellum with BOLD fMRI and 4.0 �2.2% with 20 mg Fe/kg CBV-weighted fMRI. A change of3.9 � 1.9% was observed with 30 mg Fe/kg CBV-weightedfMRI. The thalamus had the smallest change during acti-vation (approximately 2.6 � 1.6% for BOLD fMRI, 3.0 �1.7% for 20 mg Fe/kg CBV-weighted fMRI, and 3.7 � 2.3%for 30 mg Fe/kg CBV-weighted fMRI).
Incidence maps of BOLD and CBV-weighted fMRI scansare shown in Fig. 5. Similar incidence of activation wasobserved with the two methods. With BOLD and CBV-weighted fMRI at 20 mg Fe/kg of ferumoxtran-10, activationis observed in SI in all the scans, in SII in 50–60% of thescans, in the cerebellum in 60–70% of the scans, and in thethalamus in 20–30% of the scans. CBV-weighted fMRI at30 mg Fe/kg had similar incidence but thalamic activationwas observed in 50% of the scans. Little activation outside ofSI was detected with the 10 mg Fe/kg CBV-weighted fMRI.These results are summarized in Tables 1 and 2.
FIG. 3. (a) Typical BOLD functional imagesacquired during electrical stimulation of theforepaw, showing activation in SI (white ar-rows) and SII (yellow arrow). (b–d) TypicalCBV functional images of forepaw stimula-tion with 10 (b), 20 (c), and 30 mg Fe/kg (d)ferumoxtran-10, showing activation in SI(white arrows), SII (yellow arrow), and thethalamus (red arrows).
BOLD- and CBV-Weighted fMRI 319
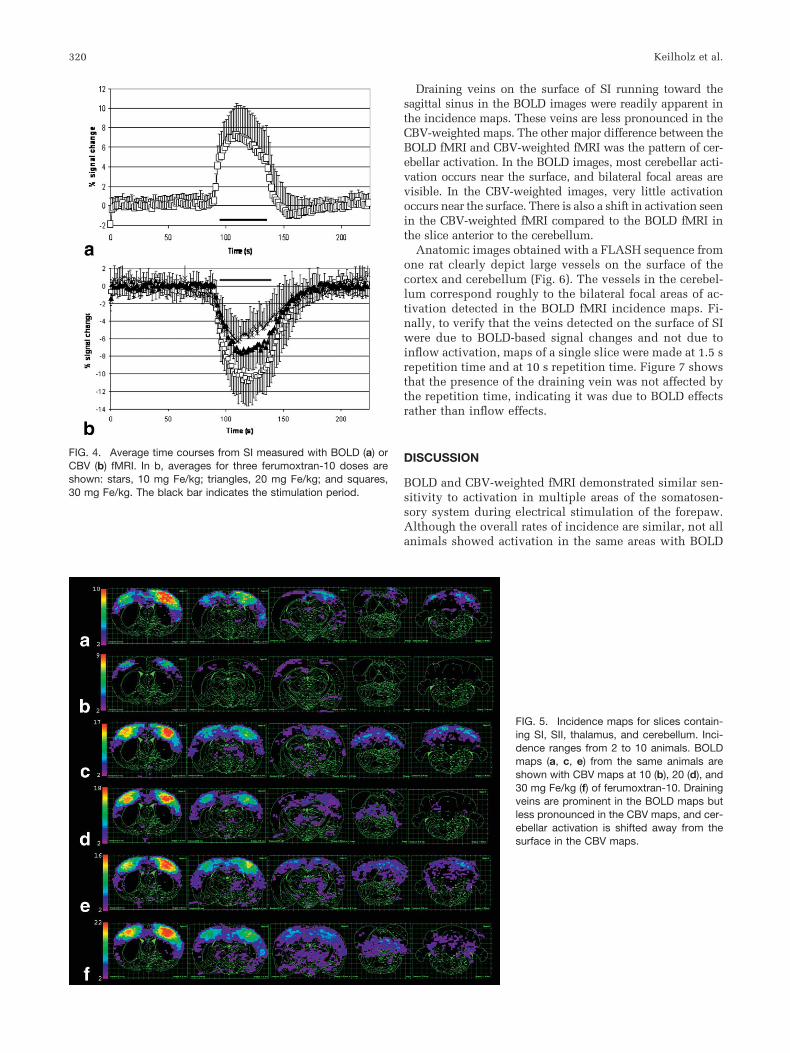
Draining veins on the surface of SI running toward thesagittal sinus in the BOLD images were readily apparent inthe incidence maps. These veins are less pronounced in theCBV-weighted maps. The other major difference between theBOLD fMRI and CBV-weighted fMRI was the pattern of cer-ebellar activation. In the BOLD images, most cerebellar acti-vation occurs near the surface, and bilateral focal areas arevisible. In the CBV-weighted images, very little activationoccurs near the surface. There is also a shift in activation seenin the CBV-weighted fMRI compared to the BOLD fMRI inthe slice anterior to the cerebellum.
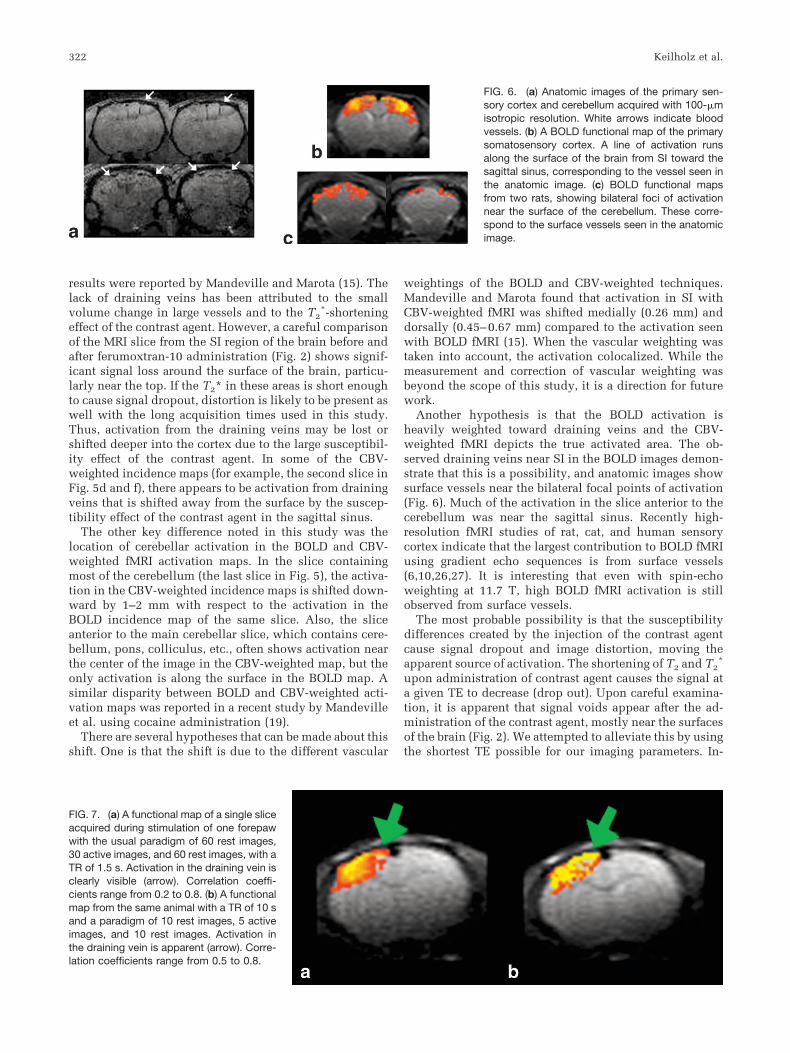
Anatomic images obtained with a FLASH sequence fromone rat clearly depict large vessels on the surface of thecortex and cerebellum (Fig. 6). The vessels in the cerebel-lum correspond roughly to the bilateral focal areas of ac-tivation detected in the BOLD fMRI incidence maps. Fi-nally, to verify that the veins detected on the surface of SIwere due to BOLD-based signal changes and not due toinflow activation, maps of a single slice were made at 1.5 srepetition time and at 10 s repetition time. Figure 7 showsthat the presence of the draining vein was not affected bythe repetition time, indicating it was due to BOLD effectsrather than inflow effects.
DISCUSSION
BOLD and CBV-weighted fMRI demonstrated similar sen-sitivity to activation in multiple areas of the somatosen-sory system during electrical stimulation of the forepaw.Although the overall rates of incidence are similar, not allanimals showed activation in the same areas with BOLD
FIG. 4. Average time courses from SI measured with BOLD (a) orCBV (b) fMRI. In b, averages for three ferumoxtran-10 doses areshown: stars, 10 mg Fe/kg; triangles, 20 mg Fe/kg; and squares,30 mg Fe/kg. The black bar indicates the stimulation period.
FIG. 5. Incidence maps for slices contain-ing SI, SII, thalamus, and cerebellum. Inci-dence ranges from 2 to 10 animals. BOLDmaps (a, c, e) from the same animals areshown with CBV maps at 10 (b), 20 (d), and30 mg Fe/kg (f) of ferumoxtran-10. Drainingveins are prominent in the BOLD maps butless pronounced in the CBV maps, and cer-ebellar activation is shifted away from thesurface in the CBV maps.
320 Keilholz et al.

and CBV-weighted fMRI. For example, in some animals SIIwould show activation in CBV-weighted maps but not inBOLD maps, or vice versa. This is probably due to the factthat areas outside of SI showed lower incidences of acti-vation than SI and therefore it was sometimes the case thatan area activated during BOLD detection but not CBVdetection. We previously suggested that partial volumeeffects could account in part for the variation in the num-ber of areas that activate from rat to rat (12). However,since the imaging geometry was identical for both CBV-weighted and BOLD fMRI, the differences in incidence ofactivation seen between the two techniques cannot beattributed to partial volume effects alone, and regionalhemodynamics may contribute to the variation. Anotherfactor is that CBV-weighted and BOLD fMRI have differentdependences upon resting blood volume, which couldinfluence their sensitivities to activation in different areas(15).
The amount of change during stimulation observed withCBV-weighted fMRI in this study was reasonable com-pared to that previously reported. Van Bruggen et al. andPalmer et al. measured average signal changes of 9 and13.5%, respectively, with gradient echo sequences at 4.7T, a contrast dose of 6 mg/kg, and a TE of 12–17 ms (17,18).The differences in our imaging parameters and the use ofspin echo rather than gradient echo EPI do not permit adirect comparison, but the average 8% signal change wemeasured during stimulation is within the range expected.
While we did not attempt to quantify the change in CBVduring stimulation in this experiment, a rough estimatecan be made using a T2 value for the rat cortex at 11.7 T of38 ms measured previously (unpublished). FollowingMandeville’s method, the percentage change during stim-ulation then corresponds to an absolute CBV change ofapproximately 23% for the 20 mg Fe/kg dose, similar tothe 24% reported by Mandeville et al. (3). Using the sameT2 to calculate the drop in signal intensity after ferumox-tran-10 administration gives a signal loss of 7% for the10 mg Fe/kg dose, 32% for the 20 mg Fe/kg dose, and 62%for the 30 mg Fe/kg dose. As the optimal dose for a givenTE should reduce signal by about 60%, the 30 mg Fe/kgdose should provide the maximum contrast to noise forthese parameters. We expect no observable contribution ofthe BOLD effect to the CBV-weighted signal change be-cause of the extremely short T2
* of blood at this fieldstrength with ferumoxtran-10. The T2
* of arterial bloodwas measured at 0.85 ms after the rat was injected with11 mg Fe/kg (23).
One of the major differences between the functionalimages obtained with BOLD and CBV-weighted fMRI is theprominence of draining veins in the BOLD fMRI maps. Therelative contributions of vessels of different sizes havebeen a long-standing issue in BOLD fMRI (6,24,25). TheBOLD signal comes from both large and small vessels, andeach vessel can contribute from both intravascular andextravascular compartments. The extravascular signalfrom small vessels is generally considered the most local-ized to neuronal activity, but it can easily be overwhelmedby large signal from inside vessels and around large drain-ing veins. Spin-echo imaging as used in the present workis expected to reduce the signal from around large drainingveins compared to gradient echo imaging, because of therefocusing effect of the 180° pulse (24,25). Simulations andexperiments have argued that the intravascular contribu-tion to spin-echo BOLD imaging is small at high fields, dueto the short T2 and T2
* of venous blood (6). Nevertheless,activation along what appear to be draining veins, stretch-ing from SI across the cerebral surface to the sagittal sinus,have been observed both in this study and in previouswork at 11.7 T (10,12). This activation is not due to infloweffects, as it was unaffected when the repetition time wasincreased from 1.5 to 10 s (Fig. 7). The signal may arisefrom incomplete suppression of the extravascular spinssurrounding large vessels or from residual intravascularsignal. Although we used a spin-echo EPI sequence, thereis significant T2
* weighting during the readout, which cancontribute to the BOLD fMRI map.
In contrast to the BOLD fMRI, few distinct drainingveins were observed with the CBV-weighted fMRI. Similar
Table 1Summary of Incidence for BOLD and CBV Scans.
BOLDrats
BOLDscans
10 mg/kgCBV rats
10 mg/kgCBV scans
20 mg/kgCBV rats
20 mg/kgCBV scans
30 mg/kgCBV rats
30 mg/kgCBV scans
SI 24/24 43/43 6/6 9/9 10/10 20/20 10/10 21/21SII 13/24 20/43 1/6 1/9 5/10 9/20 7/10 13/21Thalamus 7/24 9/43 0/6 0/9 2/10 3/20 8/10 10/21Cerebellum 18/24 29/43 0/6 0/9 7/10 11/20 6/10 11/21
Table 2.Incidence and Dose-Dependence for USPIO Compared withBOLD in the Same Rats.
10 mg/kgCBV
BOLD
SI 6/6 6/6SII 1/6 4/6Thalamus 0/6 2/6Cerebellum 0/6 3/6
20 mg/kgCBV
BOLD
SI 10/10 10/10SII 5/10 7/10Thalamus 2/10 2/10Cerebellum 7/10 8/10
30 mg/kgCBV
BOLD
SI 10/10 10/10SII 7/10 6/10Thalamus 8/10 3/10Cerebellum 6/10 7/10
BOLD- and CBV-Weighted fMRI 321
results were reported by Mandeville and Marota (15). Thelack of draining veins has been attributed to the smallvolume change in large vessels and to the T2
*-shorteningeffect of the contrast agent. However, a careful comparisonof the MRI slice from the SI region of the brain before andafter ferumoxtran-10 administration (Fig. 2) shows signif-icant signal loss around the surface of the brain, particu-larly near the top. If the T2* in these areas is short enoughto cause signal dropout, distortion is likely to be present aswell with the long acquisition times used in this study.Thus, activation from the draining veins may be lost orshifted deeper into the cortex due to the large susceptibil-ity effect of the contrast agent. In some of the CBV-weighted incidence maps (for example, the second slice inFig. 5d and f), there appears to be activation from drainingveins that is shifted away from the surface by the suscep-tibility effect of the contrast agent in the sagittal sinus.
The other key difference noted in this study was thelocation of cerebellar activation in the BOLD and CBV-weighted fMRI activation maps. In the slice containingmost of the cerebellum (the last slice in Fig. 5), the activa-tion in the CBV-weighted incidence maps is shifted down-ward by 1–2 mm with respect to the activation in theBOLD incidence map of the same slice. Also, the sliceanterior to the main cerebellar slice, which contains cere-bellum, pons, colliculus, etc., often shows activation nearthe center of the image in the CBV-weighted map, but theonly activation is along the surface in the BOLD map. Asimilar disparity between BOLD and CBV-weighted acti-vation maps was reported in a recent study by Mandevilleet al. using cocaine administration (19).
There are several hypotheses that can be made about thisshift. One is that the shift is due to the different vascular
weightings of the BOLD and CBV-weighted techniques.Mandeville and Marota found that activation in SI withCBV-weighted fMRI was shifted medially (0.26 mm) anddorsally (0.45–0.67 mm) compared to the activation seenwith BOLD fMRI (15). When the vascular weighting wastaken into account, the activation colocalized. While themeasurement and correction of vascular weighting wasbeyond the scope of this study, it is a direction for futurework.
Another hypothesis is that the BOLD activation isheavily weighted toward draining veins and the CBV-weighted fMRI depicts the true activated area. The ob-served draining veins near SI in the BOLD images demon-strate that this is a possibility, and anatomic images showsurface vessels near the bilateral focal points of activation(Fig. 6). Much of the activation in the slice anterior to thecerebellum was near the sagittal sinus. Recently high-resolution fMRI studies of rat, cat, and human sensorycortex indicate that the largest contribution to BOLD fMRIusing gradient echo sequences is from surface vessels(6,10,26,27). It is interesting that even with spin-echoweighting at 11.7 T, high BOLD fMRI activation is stillobserved from surface vessels.
The most probable possibility is that the susceptibilitydifferences created by the injection of the contrast agentcause signal dropout and image distortion, moving theapparent source of activation. The shortening of T2 and T2
*
upon administration of contrast agent causes the signal ata given TE to decrease (drop out). Upon careful examina-tion, it is apparent that signal voids appear after the ad-ministration of the contrast agent, mostly near the surfacesof the brain (Fig. 2). We attempted to alleviate this by usingthe shortest TE possible for our imaging parameters. In-
FIG. 6. (a) Anatomic images of the primary sen-sory cortex and cerebellum acquired with 100-�misotropic resolution. White arrows indicate bloodvessels. (b) A BOLD functional map of the primarysomatosensory cortex. A line of activation runsalong the surface of the brain from SI toward thesagittal sinus, corresponding to the vessel seen inthe anatomic image. (c) BOLD functional mapsfrom two rats, showing bilateral foci of activationnear the surface of the cerebellum. These corre-spond to the surface vessels seen in the anatomicimage.
FIG. 7. (a) A functional map of a single sliceacquired during stimulation of one forepawwith the usual paradigm of 60 rest images,30 active images, and 60 rest images, with aTR of 1.5 s. Activation in the draining vein isclearly visible (arrow). Correlation coeffi-cients range from 0.2 to 0.8. (b) A functionalmap from the same animal with a TR of 10 sand a paradigm of 10 rest images, 5 activeimages, and 10 rest images. Activation inthe draining vein is apparent (arrow). Corre-lation coefficients range from 0.5 to 0.8.
322 Keilholz et al.
deed, the SNR of the post-ferumoxtran-10 images at TE �20 ms was better than the SNR of the preinjection BOLDimages at TE � 30 ms. However, the reduced relaxationtimes after ferumoxtran-10 administration also cause geo-metric distortions, due to the long acquisition time of theEPI sequence. In order to keep our spatial resolution be-tween BOLD and CBV-weighted images the same, we didnot decrease the acquisition time for the CBV-weightedexperiments. Therefore, significant distortions should bepresent, especially in the slice anterior to the cerebellum,where the signal appears to be shifted both upward anddownward from the vascular region near the center of theimage. Other problematic areas include the olfactory bulbsand along the cortical surface (compare Figs. 1b and 2b,after contrast injection, with Figs. 1a and 2a, respectively,before contrast injection). These distortions could accountfor much of the dislocation between the BOLD and CBV-weighted maps. Nevertheless, vascular weighting and sen-sitivity to draining veins may contribute as well. Withoutsacrificing spatial resolution, it may be necessary toshorten the EPI acquisition time, either by using strongergradients or by resorting to parallel imaging techniques, inorder to minimize the distortion effects. However, at typ-ically used parameters, it is clear that the doses of feru-moxtran-10 used can significantly affect the images.
There has been much interest in comparing the detailedlocalization and extent of activation detected by BOLDcompared to perfusion or CBV-based fMRI techniques inboth humans and SI cortex in animals (28–30). Thesecomparisons have been made over the entire extent ofactivation as well as the subcortical extent of activation,for example, in ocular dominance columns (31). In almostall of these cases, significant differences were detected,with either the perfusion or the CBV-based fMRI appearingto localize better. There is no quantitative explanation forthis but all of the factors that might affect the presentresults, such as differential sensitivity to draining veins,differential effects on image distortion, and differences inneurovascular coupling, could be responsible.
The dose-dependent studies in this experiment indi-cated that 10 mg Fe/kg ferumoxtran-10, commonly used atlower field strengths, is insufficient to detect activation insecondary areas with spin-echo EPI at 11.7 T. A dose of20 mg Fe/kg gives an incidence of activation similar toBOLD. While a larger change was observed in SI with30 mg Fe/kg ferumoxtran-10, the high contrast dose leadsto greater signal dropout. It may also increase the inci-dence of observable activation in the thalamus, but morestudies must be performed to determine whether this ef-fect is significant.
In general, CBV-weighted fMRI demonstrates sensitivityto activation outside of SI similar to that of BOLD, but withapparently less contamination from large vessels. How-ever, the signal dropout caused by the ferumoxtran-10particles may explain the apparent loss of large vesselcontamination and makes CBV-weighted fMRI a poorchoice for imaging certain regions, like the cerebellumwhere signal droupout significantly distorts the image.Developing strategies to minimize the signal dropout en-countered with CBV-weighted fMRI will be important forrobust application of rodent whole-brain CBV-weightedfMRI to the study of learning and plasticity. BOLD has the
advantage in that no exogenous contrast agent is needed,and the incidence maps generated are of similar quality tothe maps generated with ferumoxtran-10. The disadvan-tage of BOLD continues to be the presence of drainingveins that might cause mislocalization even in the rat brainusing spin-echo EPI at 11.7 T.
ACKNOWLEDGMENTS
The authors thank Torri Wilson for animal preparationand physiology and Piotr Starewicz of Resonance Re-search, Inc., for the custom-built shim set.
REFERENCES
1. Williams DS, Detre JA, Leigh JS, Koretsky AP. Magnetic resonanceimaging of perfusion using spin inversion of arterial water. Proc NatlAcad Sci USA 1992;89:212–216.
2. Ogawa S, Lee TM, Kay AR, Tank DW. Brain magnetic resonance imag-ing with contrast dependent on blood oxygenation. Proc Natl Acad SciUSA 1990;87:9868–9872.
3. Mandeville JB, Marota JJ, Kosofsky BE, Keltner JR, Weissleder R, RosenBR, Weisskoff RM. Dynamic functional imaging of relative cerebralblood volume during rat forepaw stimulation. Magn Reson Med 1998;39:615–624.
4. Bock C, Krep H, Brinker G, Hoehn-Berlage M. Brainmapping of alpha-chloralose anesthetized rats with T2*-weighted imaging: distinctionbetween the representation of the forepaw and hindpaw in the somato-sensory cortex. NMR Biomed 1998;11:115–119.
5. Hyder F, Behar KL, Martin MA, Blamire AM, Shulman RG. Dynamicmagnetic resonance imaging of the rat brain during forepaw stimula-tion. J Cereb Blood Flow Metab 1994;14:649–655.
6. Lee SP, Silva AC, Ugurbil K, Kim SG. Diffusion-weighted spin-echofMRI at 9.4 T: microvascular/tissue contribution to BOLD signalchanges. Magn Reson Med 1999;42:919–928.
7. Marota JJ, Ayata C, Moskowitz MA, Weisskoff RM, Rosen BR, Mandev-ille JB. Investigation of the early response to rat forepaw stimulation.Magn Reson Med 1999;41:247–252.
8. Ogawa S, Lee TM, Stepnoski R, Chen W, Zhu XH, Ugurbil K. Anapproach to probe some neural systems interaction by functional MRIat neural time scale down to milliseconds. Proc Natl Acad Sci USA2000;97:11026–11031.
9. Silva AC, Lee SP, Yang G, Iadecola C, Kim SG. Simultaneous bloodoxygenation level-dependent and cerebral blood flow functional mag-netic resonance imaging during forepaw stimulation in the rat. J CerebBlood Flow Metab 1999;19:871–879.
10. Silva AC, Koretsky AP. Laminar specificity of functional MRI onsettimes during somatosensory stimulation in rat. Proc Natl Acad Sci USA2002;99:15182–15187.
11. Spenger C, Josephson A, Klason T, Hoehn-Berlage M, Schwindt M,Ingvar M, Olson L. Functional MRI at 4.7 tesla of the rat brain duringelectric stimulation of forepaw, hindpaw, or tail in single- and multi-slice experiments. Exp Neurol 2000;166:246–253.
12. Keilholz SD, Silva AC, Raman M, Merkle H, Koretsky AP. FunctionalMRI of the rodent somatosensory pathway using multislice echo planarimaging. Magn Reson Med 2004;52:89–99.
13. Dijkhuizen RM, Ren JM, Mandeville JB, Wu O, Ozdag FM, MoskowitzMA, Rosen BR, Finklestein SP. Functional magnetic resonance imagingof reorganization in rat brain after stroke. Proc Natl Acad Sci USA2001;98:12766–12771.
14. Miller MJ, Chen N, Limin L, Tom B, Weiss C, Disterhoft JF, WyrwiczAM. fMRI of the conscious rabbit during unilateral classical eyeblinkconditioning reveals bilateral cerebellar activation. J Neurosci 2003;23:11753–11758.
15. Mandeville JB, Marota JJ. Vascular filters of functional MRI: spatiallocalization using BOLD and CBV contrast. Magn Reson Med 1999;42:591–598.
16. Mandeville JB, Jenkins BG, Kosofsky BE, Moskowitz MA, Rosen BR,Marota JJ. Regional sensitivity and coupling of BOLD and CBV changesduring stimulation of rat brain. Magn Reson Med 2001;45:443–447.
BOLD- and CBV-Weighted fMRI 323

17. Palmer JT, de Crespigny AJ, Williams S, Busch E, van Bruggen N.High-resolution mapping of discrete representational areas in rat so-matosensory cortex using blood volume-dependent functional MRI.Neuroimage 1999;9:383–392.
18. van Bruggen N, Busch E, Palmer JT, Williams SP, de Crespigny AJ.High-resolution functional magnetic resonance imaging of the rat brain:mapping changes in cerebral blood volume using iron oxide contrastmedia. J Cereb Blood Flow Metab 1998;18:1178–1183.
19. Mandeville JB, Jenkins BG, Chen YC, Choi JK, Kim YR, Belen D, Liu C,Kosofsky BE, Marota JJ. Exogenous contrast agent improves sensitivityof gradient-echo functional magnetic resonance imaging at 9.4 T. MagnReson Med 2004;52:1272–1281.
20. Silva AC, Koretsky AP, Kellman P, Duyn JH. fMRI impulse response forBOLD and CBV contrast in rat somatosensory cortex. In: Proceedings ofthe 12th Annual Meeting of ISMRM, Kyoto, Japan, 2004. p 277.
21. Leite FP, Tsao D, Vanduffel W, Fize D, Sasaki Y, Wald LL, Dale AM,Kwong KK, Orban GA, Rosen BR, Tootell RB, Mandeville JB. RepeatedfMRI using iron oxide contrast agent in awake, behaving macaques at 3Tesla. Neuroimage 2002;16:283–294.
22. Paxinos G, Watson C. The rat brain in stereotaxic coordinates. SanDiego: Academic Press, 1998.
23. Barbier EL, St Lawrence KS, Grillon E, Koretsky AP, Decorps M. Amodel of blood-brain barrier permeability to water: accounting forblood inflow and longitudinal relaxation effects. Magn Reson Med2002;47:1100–1109.
24. Ogawa S, Menon RS, Tank DW, Kim S-G, Merkle H, Ellermann JM,Ugurbil K. Functional brain mapping by blood oxygenation level-
dependent contrast magnetic resonance imaging. A comparison ofsignal characteristics with a biophysical model. Biophys J 1993;64:803– 812.
25. Weisskoff RM, Zuo CS, Boxerman JL, Rosen BR. Microscopic suscep-tibility variation and transverse relaxation: theory and experiment.Magn Reson Med 1994;31:601–610.
26. Zhao F, Wang P, Kim S-G. Cortical depth-dependent gradient-echo andspin-echoBOLD fMRI at 9.4T. Magn Reson Med 2004;51:518–524.
27. Pfeuffer J, Adriany G, Shmuel A, Yacoub E, Van De Moortele, P-F, HuX, Ugurbil K. Perfusion-based high-resolution functional imaging inthe human brain at 7 tesla. Magn Reson Med 2002;47:903–911.
28. Luh WM, Wong EC, Bandettini PA, Ward BD, Hyde JS. Comparison ofsimultaneously measured perfusion and BOLD signal increases duringbrain activation with T(1)-based tissue identification. Magn Reson Med2000;44:137–143.
29. Lu H, Golay X, Pekar JJ, Van Zijl PC. Functional magnetic resonanceimaging based on changes in vascular space occupancy. Magn ResonMed 2003;50:263–274.
30. Schwindt W, Burke M, Hoehn M. Activated areas found by BOLD, CBF,CBV and changes in CMRO2 during somatosensory stimulation do notco-localize in rat cortex. In: Proceedings of the Symposium on BrainActivation and CBF Control, International Congress Series 1235,Elsevier, 2002. p. 49–56.
31. Duong TQ, Kim D-S, Ugurbil K, Kim S-G. Localized cerebral blood flowresponse at submillimeter columnar resolution. Proc Natl Acad SciUSA 2001;98:10904–10909.
324 Keilholz et al.