Body size preference and body weight perception among two migrant groups of non-Western origin
10
Public Health Nutrition: 11(12), 1332–1341 doi:10.1017/S1368980008002966 Body size preference and body weight perception among two migrant groups of non-Western origin Mary Nicolaou 1,2, *, Colleen Doak 2 , Rob van Dam 2,3 , Karen Hosper 1 , Jaap Seidell 2 and Karien Stronks 1 1 Department of Social Medicine, Academic Medical Centre, University of Amsterdam, PO Box 22660, 1100 DD Amsterdam, The Netherlands: 2 Department of Nutrition and Health, Institute for Health Sciences, VU University, Amsterdam, The Netherlands: 3 Department of Nutrition, Harvard School of Public Health, Boston, MA, USA Submitted 7 December 2007: Accepted 2 May 2008: First published online 11 July 2008 Abstract Objectives: To evaluate body size preference, body weight perception and their relationship with actual weight in two migrant groups of non-Western origin, Turks and Moroccans; additionally, to study the association between body size preference and acculturation. Design: Cross-sectional study. Setting: Amsterdam, The Netherlands. Subjects and methods: Males and females (18–30 years) were randomly selected from the population registry (n 451); participants, or at least one of their parents, were born in Turkey or Morocco. Body size preference was assessed using seven silhouette drawings and body weight perception was assessed by asking parti- cipants’ opinion of own weight. Acculturation variables were generation status and two scale measures, cultural orientation and social contacts. Results: Participants showed preference for a thin body size. The discrepancy between ideal and current size was significant in women but not men (P , 0?001). Perceived current body size was correlated with BMI (Spearman’s correlation coefficient 0?60, P , 0?001 (men) and 0?73, P , 0?001 (women)). Among over- weight participants (BMI 5 25?0–29?9 kg/m 2 ), 63–82 % of men and 35 % of women perceived themselves as ‘average’. Paying attention to own body weight was associated with a discrepancy between ideal and current size among women and with perceiving oneself as ‘overweight’ among men. Body size preference was not significantly associated with the three acculturation variables. Conclusion: We did not observe a preference for large body sizes in these two non-Western migrant groups. Similar to Western populations, most women wished to be thinner than they were. This was not the case among men, the majority of whom were also unaware of being overweight. Keywords Migrants Turkish Moroccan Weight perception Obesity Overweight Body mass index Overweight and obesity are a major public health pro- blem and are associated with increased risk for type 2 diabetes, CVD and several types of cancer (1) . Their pre- valence is reaching epidemic proportions, with an esti- mated 1 billion overweight and 300 million obese adults worldwide (2) . Among non-Western migrants, which represent an increasing proportion of many Western populations (3) , the prevalence of overweight and obesity is often higher than that of host populations (4–6) . In The Netherlands more than half of the general adult population is either overweight (51 % of males, 42 % of females) or obese (10 % of males, 12 % of females) (7) . In two of the main migrant groups of non-Western origin, Turks and Moroccans, it is estimated that 25–32 % of women and 37–44 % of men are overweight while 39–40 % of women and 13–16 % of men are obese (8,9) . Public health promotion efforts aimed at overweight prevention often proceed from the assumption that most individuals prefer to be thin and that the first step in motivating individuals to lose weight is to raise awareness of weight status among those with overweight (10) . This approach is justified for Western populations that value thinness in women and lean, muscular physiques in men (11–13) , but where awareness of overweight among those with overweight is often low (14,15) . However, this assumption might not hold for non-Western migrant groups among whom body size preference may differ. For example, in many traditional non-Western cultures *Corresponding author: Email [email protected] r The Authors 2008
-
Upload
independent -
Category
Documents
-
view
5 -
download
0
Transcript of Body size preference and body weight perception among two migrant groups of non-Western origin
Public Health Nutrition: 11(12), 1332–1341 doi:10.1017/S1368980008002966
Body size preference and body weight perception among twomigrant groups of non-Western origin
Mary Nicolaou1,2,*, Colleen Doak2, Rob van Dam2,3, Karen Hosper1, Jaap Seidell2
and Karien Stronks1
1Department of Social Medicine, Academic Medical Centre, University of Amsterdam, PO Box 22660, 1100DD Amsterdam, The Netherlands: 2Department of Nutrition and Health, Institute for Health Sciences,VU University, Amsterdam, The Netherlands: 3Department of Nutrition, Harvard School of Public Health,Boston, MA, USA
Submitted 7 December 2007: Accepted 2 May 2008: First published online 11 July 2008
Abstract
Objectives: To evaluate body size preference, body weight perception and theirrelationship with actual weight in two migrant groups of non-Western origin,Turks and Moroccans; additionally, to study the association between body sizepreference and acculturation.Design: Cross-sectional study.Setting: Amsterdam, The Netherlands.Subjects and methods: Males and females (18–30 years) were randomly selectedfrom the population registry (n 451); participants, or at least one of their parents,were born in Turkey or Morocco. Body size preference was assessed using sevensilhouette drawings and body weight perception was assessed by asking parti-cipants’ opinion of own weight. Acculturation variables were generation statusand two scale measures, cultural orientation and social contacts.Results: Participants showed preference for a thin body size. The discrepancybetween ideal and current size was significant in women but not men (P , 0?001).Perceived current body size was correlated with BMI (Spearman’s correlationcoefficient 0?60, P , 0?001 (men) and 0?73, P , 0?001 (women)). Among over-weight participants (BMI 5 25?0–29?9 kg/m2), 63–82 % of men and 35 % of womenperceived themselves as ‘average’. Paying attention to own body weight wasassociated with a discrepancy between ideal and current size among women andwith perceiving oneself as ‘overweight’ among men. Body size preference wasnot significantly associated with the three acculturation variables.Conclusion: We did not observe a preference for large body sizes in thesetwo non-Western migrant groups. Similar to Western populations, most womenwished to be thinner than they were. This was not the case among men, themajority of whom were also unaware of being overweight.
KeywordsMigrants
TurkishMoroccan
Weight perceptionObesity
OverweightBody mass index
Overweight and obesity are a major public health pro-
blem and are associated with increased risk for type 2
diabetes, CVD and several types of cancer(1). Their pre-
valence is reaching epidemic proportions, with an esti-
mated 1 billion overweight and 300 million obese adults
worldwide(2). Among non-Western migrants, which
represent an increasing proportion of many Western
populations(3), the prevalence of overweight and obesity
is often higher than that of host populations(4–6).
In The Netherlands more than half of the general adult
population is either overweight (51 % of males, 42 % of
females) or obese (10 % of males, 12 % of females)(7). In
two of the main migrant groups of non-Western origin,
Turks and Moroccans, it is estimated that 25–32 % of
women and 37–44 % of men are overweight while
39–40 % of women and 13–16 % of men are obese(8,9).
Public health promotion efforts aimed at overweight
prevention often proceed from the assumption that most
individuals prefer to be thin and that the first step in
motivating individuals to lose weight is to raise awareness
of weight status among those with overweight(10). This
approach is justified for Western populations that value
thinness in women and lean, muscular physiques in
men(11–13), but where awareness of overweight among
those with overweight is often low(14,15). However, this
assumption might not hold for non-Western migrant
groups among whom body size preference may differ.
For example, in many traditional non-Western cultures
*Corresponding author: Email [email protected] r The Authors 2008
large bodies in both males and females are associated
with prosperity and health(16–21). Migrants originating
from non-Western societies may adhere to the ideals from
their traditional cultures. Although this may protect them
from experiencing dissatisfaction with their body size, it
may also negatively influence the motivation for weight
control or weight loss.
On the other hand, living in a Western society is also
likely to influence the preferred body size of migrants
through the process of acculturation(22). Acculturation is
a concept that ‘comprehends those phenomena which
result when groups of individuals having different cultures
come into continuous first-hand contact with subsequent
changes in the original culture patterns of either or both
groups’(23), usually with a greater change taking place in
the ‘minority’ group(24). The expectation is that migrants
are likely to adopt the body size ideals of their ‘host’ peers.
Thus, highly acculturated migrants to Western societies
would develop a preference for thinner figures.
That culture influences body size preference has been
the rationale of many studies researching this topic
among different ethnic groups. However, many of the
studies of this topic have either focused on non-Western
populations in their country of origin(19,20,25–28) or have
been conducted among US ethnic minority groups(29–32).
Few studies have considered this issue among non-
Western migrants to European countries(33–36). Likewise,
the association between body size preference and
acculturation among ethnic minorities has seldom been
studied in Europe. We found two UK studies, one that
reported similar attitudes to body size among second-
generation Asian women and white British women(34)
and another where Kenyan Asians residing in the UK
were more similar to white British women in their body
size preferences than to women still living in Kenya(36).
Considering that body size preference may be an
important factor in motivating individuals to lose weight,
information about this determinant among European
migrants is necessary.
Two of the largest non-Western migrant groups in
Western Europe originate from Turkey (The Netherlands,
Germany, Denmark, Sweden) and Morocco (The Neth-
erlands, Belgium, France, Spain). Migration from Turkey
and Morocco was encouraged in the 1970s in order to fill
labour shortages, particularly for lower manual positions.
The initial migrants came from particularly deprived areas
of their home country. Since that time further migration
has occurred due to family reunification and formation,
with many young Turkish and Moroccan adults choosing
partners from their country of origin(37). In The Netherlands
many reside in the larger cities; in Amsterdam, persons of
Turkish or Moroccan origin form respectively 5% and 9%
of the total population(38).
Literature from Morocco indicates that overweight and
obesity prevalence, particularly among women, is on the
increase and that this may be partly due to a tradition that
values plumpness(16,17,39). Although we found literature
that indicates high overweight and obesity prevalence in
Turkey(40,41), we found no studies of body size pre-
ference among Turkish adults. Anecdotal evidence indi-
cates that, also in Turkey, there is a tradition of preference
for large figures.
As already mentioned, the prevalence of overweight
and obesity among Turkish and Moroccan migrants to
The Netherlands is high. However, there is little infor-
mation about body size preference (the body size con-
sidered to be ‘ideal’) or the perception of overweight
(whether individuals classify their body weight correctly)
among these two migrant populations. It may be that
a preference for larger figures and/or the misperception
of overweight is highly prevalent in these groups, which
would have important implications for intervention
development. Therefore the present study aimed to:
1. Evaluate body size preference and body weight
perception among young men and women of Turkish
and Moroccan origin.
2. Investigate whether preference and perception are
related to actual body weight and to whether
individuals pay attention to their body weight.
3. Examine the association between body size prefer-
ence and acculturation level.
Methods
Study population
Participants for the present study were 18–30-year-olds
who took part in LASER, a study of health behaviour
among Turks and Moroccans aged 10 to 30 years living in
Amsterdam, The Netherlands. In the LASER study a ran-
dom sample of people born in Turkey or Morocco or with
at least one parent born in Turkey or Morocco was drawn
from the Amsterdam municipal population register.
Participants born in Turkey or Morocco were classified
as first-generation migrants. Second-generation migrants
were those born in The Netherlands and who had at least
one parent born in either Turkey or Morocco. As men-
tioned earlier, migration to the Netherlands from Turkey
and Morocco began in the 1970s. Therefore, the majority
of adult Turks and Moroccans are of the first generation,
as has been observed in studies that have included
adults(42). The LASER study focused on younger partici-
pants in order to ensure more equal representation of the
second generation.
The total Turkish sample consisted of 1556 persons.
Approximately 13 % of the sample could not be traced
because of incorrect address information. Of the 1354
respondents who could be traced, 768 participated in the
study (57 %). Most cases of ‘non-response’ were due to
refusals to participate (32 %) or not being able to contact
potential participants after three attempts (12 %). The
Body size preference in non-Western migrants 1333
Moroccan sample consisted of 995 individuals of whom
12 % had incorrect address information. Of the 872 per-
sons who could be traced, 476 participated in the study
(55 %). Within the non-response group, 26 % refused to
participate and approximately 19 % could not be reached
after three attempts. The study population is similar to
the Turkish and Moroccan population aged 10–30 years
living in Amsterdam, according to sex, generational
status (country of birth) and city district; except for the
Moroccan male population, among whom the age cate-
gory 20–30 years is under-represented, and participants
from one city district being slightly over-represented.
For the current study we analysed participants aged
18–30 years (n 567). We excluded respondents with
missing information on body weight perception (n 50)
and BMI (n 66) to end with a total sample size of 451.
Data collection
Face-to-face interviews were held from April 2003 until
December 2004, by trained interviewers of the same
ethnic background and sex. A structured questionnaire
was used; this was available in Dutch, Turkish or
Moroccan Arabic so that the interview could be held in
the participants’ language of preference. Included were
questions about demographics, socio-economic status
and migration status. Acculturation was evaluated using a
proxy measure, place of birth (generation), as well as
scale measures of the level of social contact with ethnic
Dutch (three questions on social contacts in leisure time)
and orientation towards Dutch society (ten items mea-
suring language and media use, shopping preference and
emancipation as examples of Western norms and values).
The data collection strategy, the questionnaire design and
the acculturation measures have been fully described
elsewhere(42).
Body size preference and body weight perception
Body size preference was evaluated using seven silhou-
ette drawings developed by Collins(43). Respondents were
asked to select the silhouette that most corresponded to
they way they currently look and also to select the ideal
silhouette for themselves. A discrepancy score was cal-
culated by subtracting the ideal from the current silhou-
ette as was done by Fallon and Rozin(44). Participants
were also asked to select ideals for members of the same
sex and opposite sex.
Body weight perception was evaluated by how parti-
cipants described their body weight; answer categories
included ‘thin’, ‘average’ or ‘overweight’. Participants
received no specific instructions relating to this question,
therefore the answers obtained are not standardised but
reflect individuals’ personal evaluations. Finally, we
asked ‘Do you pay attention to your weight?’ Possible
answers were either ‘yes’ or ‘no’. We formulated this
question in a neutral way to avoid the association with
dieting to lose weight.
Measurement of body weight
Participants were weighed and measured during the
home visit. Weight was measured using an electronic
scale to the nearest 0?1 kg after removal of shoes, jackets,
heavier clothing and pocket contents. Height was mea-
sured twice without shoes in an upright position with
a measuring tape and ruler to the nearest 0?1 cm. We
calculated BMI as weight divided by the square of height
(kg/m2). Underweight was classified as having a BMI
lower than 18?5 kg/m2. There were six participants
who fell into this category (two Moroccan women, two
Turkish women, one Moroccan man and one Turkish
man). We chose to include them together with the normal-
weight group for the analyses. Due to logistic problems
not all participants could be weighed during the inter-
view. In these cases (40 % of all participants) weight and
height were based on self-report. We performed addi-
tional analyses to explore the impact on our results. We
found no difference in the prevalence of overweight
between self-reporters and the weighed group. We also
tested mean BMI between the two groups using the
Mann–Whitney test and found no differences in BMI
between them, with the exception of Moroccan women
where median BMI was 22?3 kg/m2 in the self-reporters v.
24?1 kg/m2 in the measured group (P 5 0?05). Finally,
we stratified according to self-report and compared
on the basis of demographics, socio-economic status,
acculturation variables and perception variables, but
found no significant differences between them. We
therefore decided to include the self-reporters in the
analyses in order to maximise our sample size.
Statistical analyses
We analysed data using the Statistical Package for the
Social Sciences statistical software package version 12
(SPSS Inc., Chicago, IL, USA). The sample was stratified
according to sex and ethnicity for all analyses. For cate-
gorical variables we applied the x2 test. Differences in
body size preference and weight awareness between
groups of respondents were tested using the Mann–
Whitney test. Differences within groups were tested using
the Wilcoxon signed-rank test. Spearman’s rank correla-
tions were calculated for the relationships of current
and ideal silhouettes (body size preference) and BMI.
In order to explore the association with acculturation
we performed the analyses with the ‘ideal’ silhouette as
dependent variable.
Results
Table 1 summarises the participants’ characteristics. There
were some statistically significant differences between the
groups. Fewer Moroccan men were married or had chil-
dren compared with the other groups. Within the ethnic
groups, more women were married, had children and
1334 M Nicolaou et al.
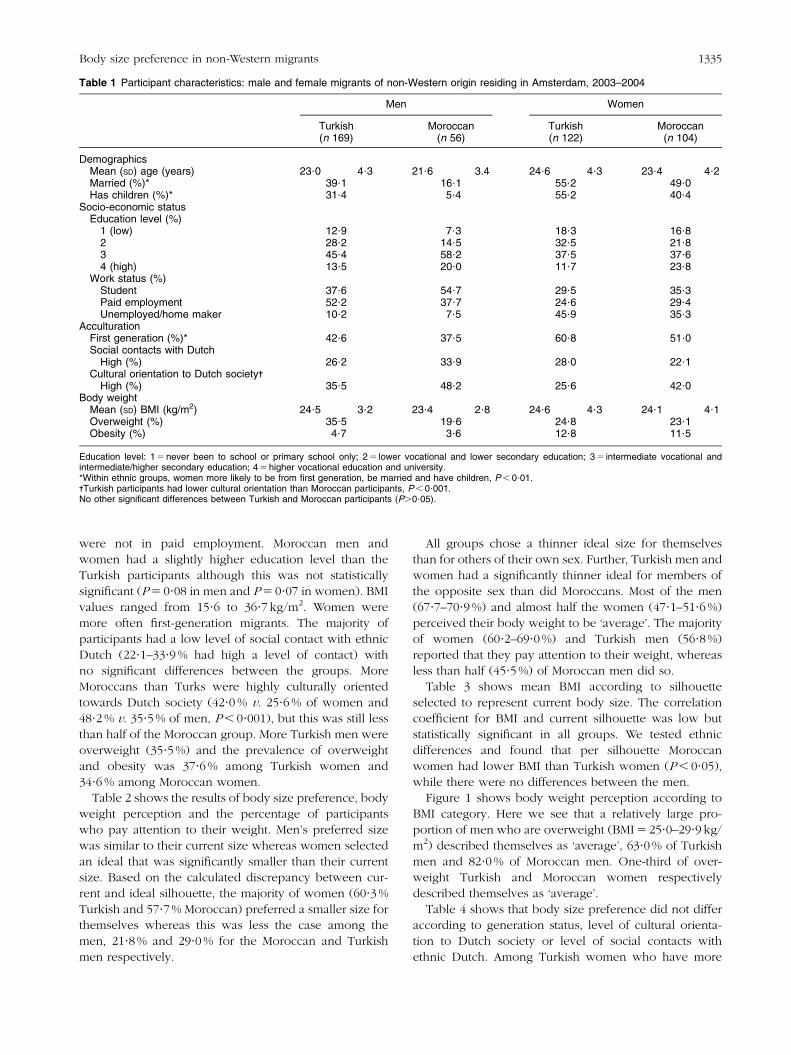
were not in paid employment. Moroccan men and
women had a slightly higher education level than the
Turkish participants although this was not statistically
significant (P 5 0?08 in men and P 5 0?07 in women). BMI
values ranged from 15?6 to 36?7 kg/m2. Women were
more often first-generation migrants. The majority of
participants had a low level of social contact with ethnic
Dutch (22?1–33?9 % had high a level of contact) with
no significant differences between the groups. More
Moroccans than Turks were highly culturally oriented
towards Dutch society (42?0 % v. 25?6 % of women and
48?2 % v. 35?5 % of men, P , 0?001), but this was still less
than half of the Moroccan group. More Turkish men were
overweight (35?5 %) and the prevalence of overweight
and obesity was 37?6 % among Turkish women and
34?6 % among Moroccan women.
Table 2 shows the results of body size preference, body
weight perception and the percentage of participants
who pay attention to their weight. Men’s preferred size
was similar to their current size whereas women selected
an ideal that was significantly smaller than their current
size. Based on the calculated discrepancy between cur-
rent and ideal silhouette, the majority of women (60?3 %
Turkish and 57?7 % Moroccan) preferred a smaller size for
themselves whereas this was less the case among the
men, 21?8 % and 29?0 % for the Moroccan and Turkish
men respectively.
All groups chose a thinner ideal size for themselves
than for others of their own sex. Further, Turkish men and
women had a significantly thinner ideal for members of
the opposite sex than did Moroccans. Most of the men
(67?7–70?9 %) and almost half the women (47?1–51?6 %)
perceived their body weight to be ‘average’. The majority
of women (60?2–69?0 %) and Turkish men (56?8 %)
reported that they pay attention to their weight, whereas
less than half (45?5 %) of Moroccan men did so.
Table 3 shows mean BMI according to silhouette
selected to represent current body size. The correlation
coefficient for BMI and current silhouette was low but
statistically significant in all groups. We tested ethnic
differences and found that per silhouette Moroccan
women had lower BMI than Turkish women (P , 0?05),
while there were no differences between the men.
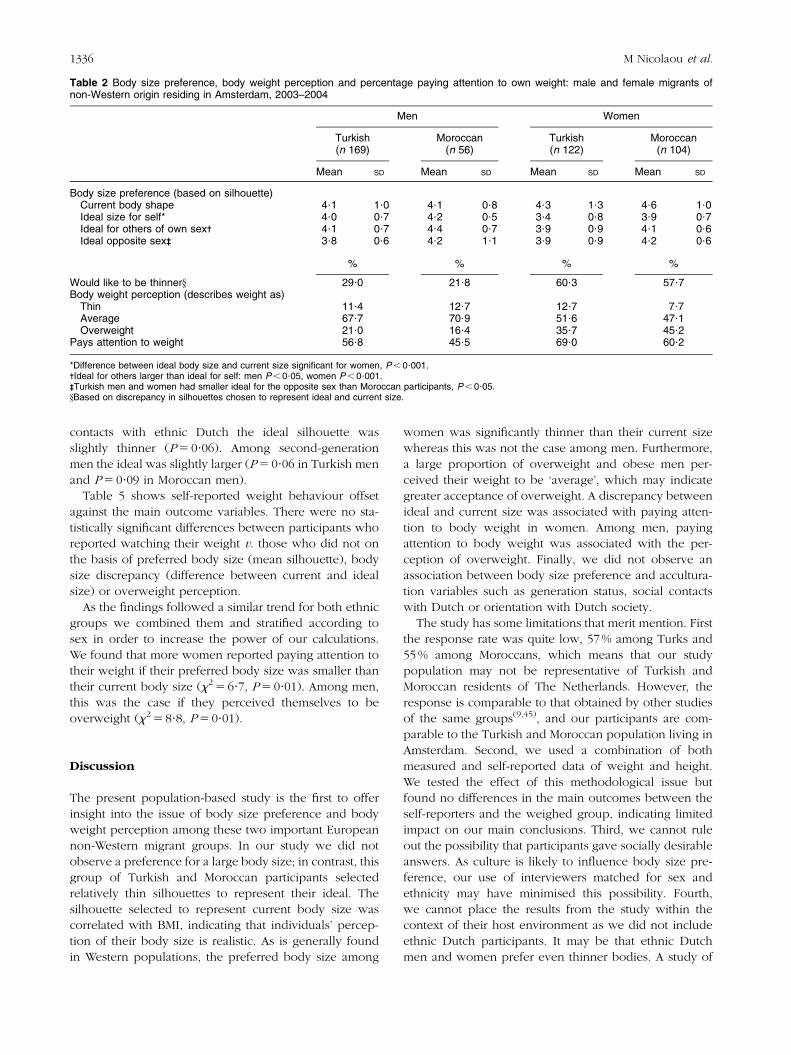
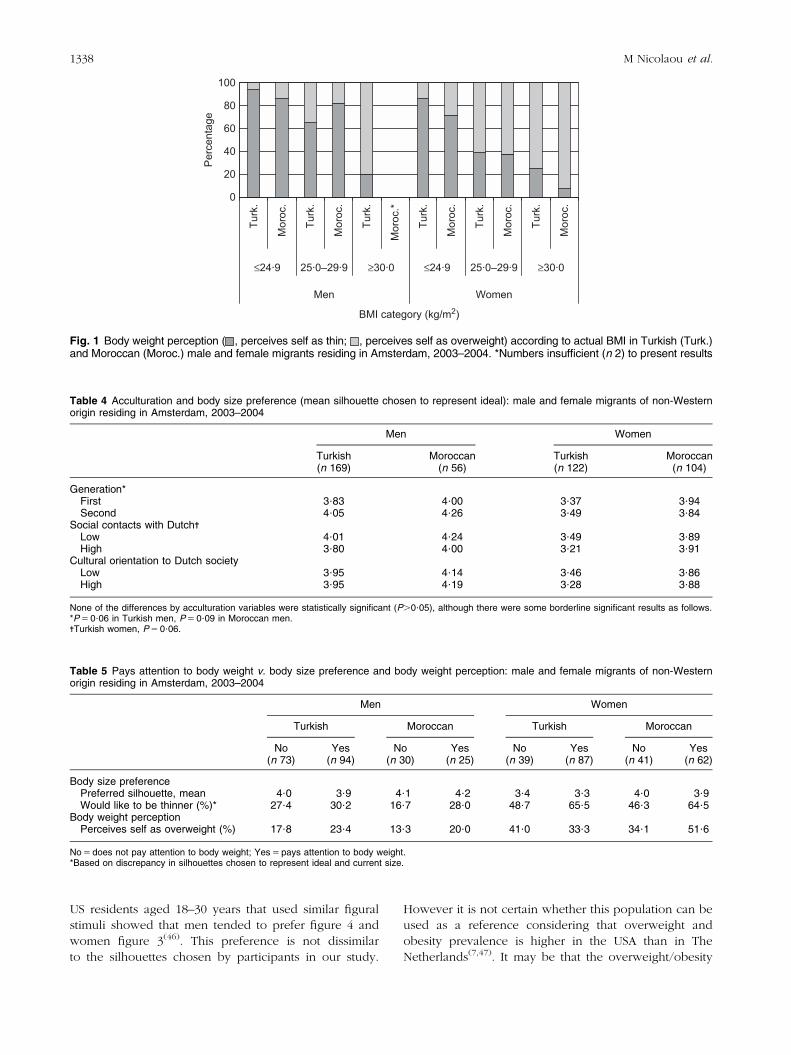
Figure 1 shows body weight perception according to
BMI category. Here we see that a relatively large pro-
portion of men who are overweight (BMI 5 25?0–29?9 kg/
m2) described themselves as ‘average’, 63?0 % of Turkish
men and 82?0 % of Moroccan men. One-third of over-
weight Turkish and Moroccan women respectively
described themselves as ‘average’.
Table 4 shows that body size preference did not differ
according to generation status, level of cultural orienta-
tion to Dutch society or level of social contacts with
ethnic Dutch. Among Turkish women who have more
Table 1 Participant characteristics: male and female migrants of non-Western origin residing in Amsterdam, 2003–2004
Men Women
Turkish Moroccan Turkish Moroccan(n 169) (n 56) (n 122) (n 104)
DemographicsMean (SD) age (years) 23?0 4?3 21?6 3.4 24?6 4?3 23?4 4?2Married (%)* 39?1 16?1 55?2 49?0Has children (%)* 31?4 5?4 55?2 40?4
Socio-economic statusEducation level (%)
1 (low) 12?9 7?3 18?3 16?82 28?2 14?5 32?5 21?83 45?4 58?2 37?5 37?64 (high) 13?5 20?0 11?7 23?8
Work status (%)Student 37?6 54?7 29?5 35?3Paid employment 52?2 37?7 24?6 29?4Unemployed/home maker 10?2 7?5 45?9 35?3
AcculturationFirst generation (%)* 42?6 37?5 60?8 51?0Social contacts with Dutch
High (%) 26?2 33?9 28?0 22?1Cultural orientation to Dutch society-
High (%) 35?5 48?2 25?6 42?0Body weight
Mean (SD) BMI (kg/m2) 24?5 3?2 23?4 2?8 24?6 4?3 24?1 4?1Overweight (%) 35?5 19?6 24?8 23?1Obesity (%) 4?7 3?6 12?8 11?5
Education level: 1 5 never been to school or primary school only; 2 5 lower vocational and lower secondary education; 3 5 intermediate vocational andintermediate/higher secondary education; 4 5 higher vocational education and university.*Within ethnic groups, women more likely to be from first generation, be married and have children, P , 0?01.-Turkish participants had lower cultural orientation than Moroccan participants, P , 0?001.No other significant differences between Turkish and Moroccan participants (P.0?05).
Body size preference in non-Western migrants 1335
contacts with ethnic Dutch the ideal silhouette was
slightly thinner (P 5 0?06). Among second-generation
men the ideal was slightly larger (P 5 0?06 in Turkish men
and P 5 0?09 in Moroccan men).
Table 5 shows self-reported weight behaviour offset
against the main outcome variables. There were no sta-
tistically significant differences between participants who
reported watching their weight v. those who did not on
the basis of preferred body size (mean silhouette), body
size discrepancy (difference between current and ideal
size) or overweight perception.
As the findings followed a similar trend for both ethnic
groups we combined them and stratified according to
sex in order to increase the power of our calculations.
We found that more women reported paying attention to
their weight if their preferred body size was smaller than
their current body size (x2 5 6?7, P 5 0?01). Among men,
this was the case if they perceived themselves to be
overweight (x2 5 8?8, P 5 0?01).
Discussion
The present population-based study is the first to offer
insight into the issue of body size preference and body
weight perception among these two important European
non-Western migrant groups. In our study we did not
observe a preference for a large body size; in contrast, this
group of Turkish and Moroccan participants selected
relatively thin silhouettes to represent their ideal. The
silhouette selected to represent current body size was
correlated with BMI, indicating that individuals’ percep-
tion of their body size is realistic. As is generally found
in Western populations, the preferred body size among
women was significantly thinner than their current size
whereas this was not the case among men. Furthermore,
a large proportion of overweight and obese men per-
ceived their weight to be ‘average’, which may indicate
greater acceptance of overweight. A discrepancy between
ideal and current size was associated with paying atten-
tion to body weight in women. Among men, paying
attention to body weight was associated with the per-
ception of overweight. Finally, we did not observe an
association between body size preference and accultura-
tion variables such as generation status, social contacts
with Dutch or orientation with Dutch society.
The study has some limitations that merit mention. First
the response rate was quite low, 57 % among Turks and
55 % among Moroccans, which means that our study
population may not be representative of Turkish and
Moroccan residents of The Netherlands. However, the
response is comparable to that obtained by other studies
of the same groups(9,45), and our participants are com-
parable to the Turkish and Moroccan population living in
Amsterdam. Second, we used a combination of both
measured and self-reported data of weight and height.
We tested the effect of this methodological issue but
found no differences in the main outcomes between the
self-reporters and the weighed group, indicating limited
impact on our main conclusions. Third, we cannot rule
out the possibility that participants gave socially desirable
answers. As culture is likely to influence body size pre-
ference, our use of interviewers matched for sex and
ethnicity may have minimised this possibility. Fourth,
we cannot place the results from the study within the
context of their host environment as we did not include
ethnic Dutch participants. It may be that ethnic Dutch
men and women prefer even thinner bodies. A study of
Table 2 Body size preference, body weight perception and percentage paying attention to own weight: male and female migrants ofnon-Western origin residing in Amsterdam, 2003–2004
Men Women
Turkish Moroccan Turkish Moroccan(n 169) (n 56) (n 122) (n 104)
Mean SD Mean SD Mean SD Mean SD
Body size preference (based on silhouette)Current body shape 4?1 1?0 4?1 0?8 4?3 1?3 4?6 1?0Ideal size for self* 4?0 0?7 4?2 0?5 3?4 0?8 3?9 0?7Ideal for others of own sex- 4?1 0?7 4?4 0?7 3?9 0?9 4?1 0?6Ideal opposite sex-
-
3?8 0?6 4?2 1?1 3?9 0?9 4?2 0?6
% % % %
Would like to be thinnery 29?0 21?8 60?3 57?7Body weight perception (describes weight as)
Thin 11?4 12?7 12?7 7?7Average 67?7 70?9 51?6 47?1Overweight 21?0 16?4 35?7 45?2
Pays attention to weight 56?8 45?5 69?0 60?2
*Difference between ideal body size and current size significant for women, P , 0?001.-Ideal for others larger than ideal for self: men P , 0?05, women P , 0?001.-
-
Turkish men and women had smaller ideal for the opposite sex than Moroccan participants, P , 0?05.yBased on discrepancy in silhouettes chosen to represent ideal and current size.
1336 M Nicolaou et al.
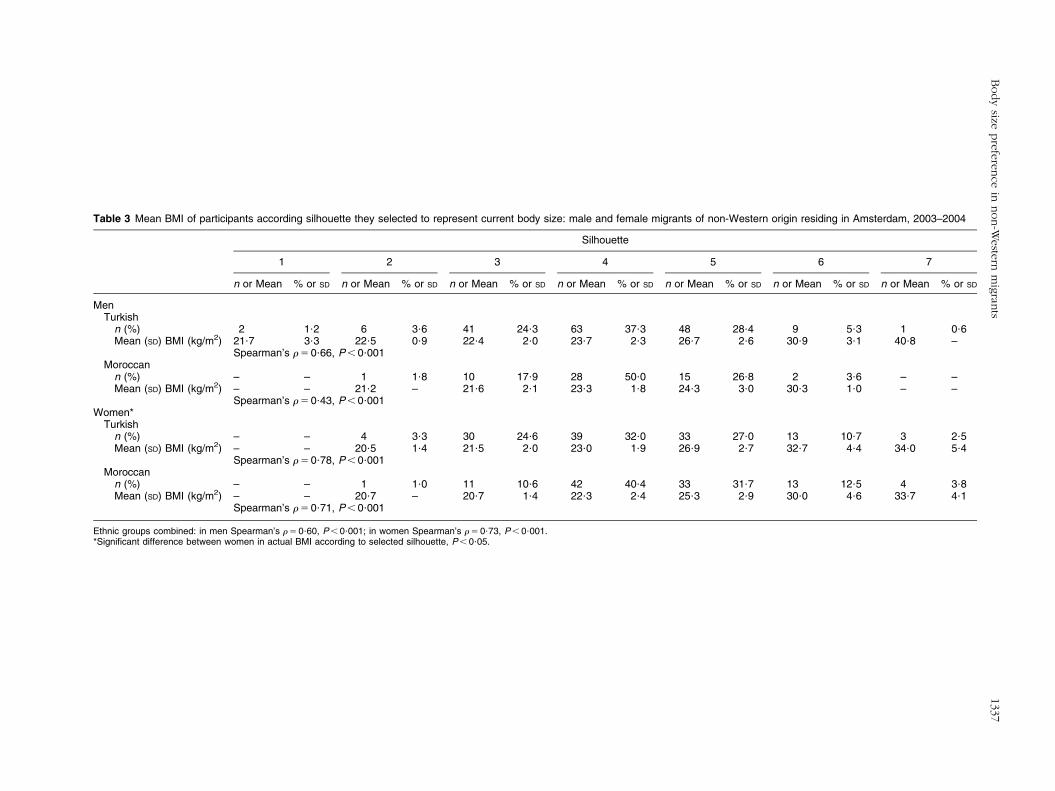
Table 3 Mean BMI of participants according silhouette they selected to represent current body size: male and female migrants of non-Western origin residing in Amsterdam, 2003–2004
Silhouette
1 2 3 4 5 6 7
n or Mean % or SD n or Mean % or SD n or Mean % or SD n or Mean % or SD n or Mean % or SD n or Mean % or SD n or Mean % or SD
MenTurkish
n (%) 2 1?2 6 3?6 41 24?3 63 37?3 48 28?4 9 5?3 1 0?6Mean (SD) BMI (kg/m2) 21?7 3?3 22?5 0?9 22?4 2?0 23?7 2?3 26?7 2?6 30?9 3?1 40?8 –
Spearman’s r 5 0?66, P , 0?001Moroccan
n (%) – – 1 1?8 10 17?9 28 50?0 15 26?8 2 3?6 – –Mean (SD) BMI (kg/m2) – – 21?2 – 21?6 2?1 23?3 1?8 24?3 3?0 30?3 1?0 – –
Spearman’s r 5 0?43, P , 0?001Women*
Turkishn (%) – – 4 3?3 30 24?6 39 32?0 33 27?0 13 10?7 3 2?5Mean (SD) BMI (kg/m2) – – 20?5 1?4 21?5 2?0 23?0 1?9 26?9 2?7 32?7 4?4 34?0 5?4
Spearman’s r 5 0?78, P , 0?001Moroccan
n (%) – – 1 1?0 11 10?6 42 40?4 33 31?7 13 12?5 4 3?8Mean (SD) BMI (kg/m2) – – 20?7 – 20?7 1?4 22?3 2?4 25?3 2?9 30?0 4?6 33?7 4?1
Spearman’s r 5 0?71, P , 0?001
Ethnic groups combined: in men Spearman’s r 5 0?60, P , 0?001; in women Spearman’s r 5 0?73, P , 0?001.*Significant difference between women in actual BMI according to selected silhouette, P , 0?05.
Body
sizepre
fere
nce
innon-W
este
rnm
igran
ts1337
US residents aged 18–30 years that used similar figural
stimuli showed that men tended to prefer figure 4 and
women figure 3(46). This preference is not dissimilar
to the silhouettes chosen by participants in our study.
However it is not certain whether this population can be
used as a reference considering that overweight and
obesity prevalence is higher in the USA than in The
Netherlands(7,47). It may be that the overweight/obesity
0
20
40
60
80
100
Turk
.
Moro
c.
Turk
.
Moro
c.
Turk
.
Moro
c.*
Turk
.
Moro
c.
Turk
.
Moro
c.
Turk
.
Moro
c.
≤24·9 ≥30·0
WomenMen
BMI category (kg/m2)
Perc
enta
ge
25·0–29·9 ≤24·9 ≥30·025·0–29·9
Fig. 1 Body weight perception ( , perceives self as thin; , perceives self as overweight) according to actual BMI in Turkish (Turk.)and Moroccan (Moroc.) male and female migrants residing in Amsterdam, 2003–2004. *Numbers insufficient (n 2) to present results
Table 4 Acculturation and body size preference (mean silhouette chosen to represent ideal): male and female migrants of non-Westernorigin residing in Amsterdam, 2003–2004
Men Women
Turkish Moroccan Turkish Moroccan(n 169) (n 56) (n 122) (n 104)
Generation*First 3?83 4?00 3?37 3?94Second 4?05 4?26 3?49 3?84
Social contacts with Dutch-Low 4?01 4?24 3?49 3?89High 3?80 4?00 3?21 3?91
Cultural orientation to Dutch societyLow 3?95 4?14 3?46 3?86High 3?95 4?19 3?28 3?88
None of the differences by acculturation variables were statistically significant (P.0?05), although there were some borderline significant results as follows.*P 5 0?06 in Turkish men, P 5 0?09 in Moroccan men.-Turkish women, P 5 0?06.
Table 5 Pays attention to body weight v. body size preference and body weight perception: male and female migrants of non-Westernorigin residing in Amsterdam, 2003–2004
Men Women
Turkish Moroccan Turkish Moroccan
No Yes No Yes No Yes No Yes(n 73) (n 94) (n 30) (n 25) (n 39) (n 87) (n 41) (n 62)
Body size preferencePreferred silhouette, mean 4?0 3?9 4?1 4?2 3?4 3?3 4?0 3?9Would like to be thinner (%)* 27?4 30?2 16?7 28?0 48?7 65?5 46?3 64?5
Body weight perceptionPerceives self as overweight (%) 17?8 23?4 13?3 20?0 41?0 33?3 34?1 51?6
No 5 does not pay attention to body weight; Yes 5 pays attention to body weight.*Based on discrepancy in silhouettes chosen to represent ideal and current size.
1338 M Nicolaou et al.
prevalence in the general population may influence body
size preference as speculated by Cash et al. in their study of
changes of body image among US college students(48) and
by Bennett et al. in a study of attitudes towards overweight
in African Americans(49). Finally, although the figural stimuli
used in our study have not been validated for the Turkish
and Moroccan populations, similar instruments have been
widely used in various study populations which lends
support to our choice of instrument(19,20,25,50).
Much of the research conducted in this area originates in
the USA and compares white American, African American,
Hispanic and Asian groups. The results and conclusions
have been mixed but two recent meta-analyses have
shown that ethnic differences seem to be diminishing:
Roberts et al. found that differences in body dissatisfaction
between African American and white women were con-
verging(51); Grabe and Hyde found that ethnic differences
in the perception of body weight between women were
small(30). Our finding that that these groups of Turkish and
Moroccan origin have a preference for thinner body size is
consistent with the idea that a preference for thinness is
common, particularly among women.
In addition, our study indicates that this preference is
not related to acculturation, as might have been expected
based on the findings of others(22,34,36,52). However the
comparison of these findings with ours is problematic
due to differences in the measurement of acculturation.
Furthermore, we measured a limited number of indicators
of acculturation; it may be that other dimensions of
acculturation (e.g. ethnic identity) and migration-related
issues (e.g. acculturative stress) are more relevant for
body size preference and the associated consequences
thereof(53,54). The issue of methodology has been high-
lighted by others and remains a barrier to understanding
the relationships between acculturation, body size pre-
ference and body dissatisfaction(55,56).
Our finding that a large proportion of women of non-
Western origin experience a discrepancy between desired
and actual body size is similar to those among Western
populations(14,15). Interestingly, although the majority of
women chose a thinner ideal body size for themselves
(57?7–60?3 %), fewer women perceived themselves as
‘overweight’ (35?7–45?2 %), which implies that wanting to
be thinner is not always related to the belief that one is
overweight. Fitzgibbon et al.(32) argue that these are two
distinct issues, the discrepancy between the ideal and
current body size is more likely to reflect body dis-
satisfaction and may be a factor that stimulates attention
to weight-loss activities. Our observation that a larger
majority of women pay attention to their weight if their
perceived size is larger than their desired size supports
this idea. Body dissatisfaction, whether appropriate or
not, may be a stimulus for weight-watching behaviour
among women and may contribute to reduced quality of
life(57) as well as to eating pathology(15,31). The latter does
not appear to differ for women of non-Western origin(32).
Further research of this issue among these population
groups is warranted. But in the meantime, interventions
should be sensitive for potentially negative effects on
women’s dieting practices.
Two studies in Europe have shown a lower awareness of
overweight among migrant-origin groups(33), including
South Asian groups(35). Within our populations we observed
that a high proportion of overweight men (63–82%) and
overweight women (35%) perceived themselves as average.
Although we cannot compare our group to the general
population, the finding that more men than women are
unaware of their overweight is consistent with that of
others(14,58). As mentioned previously, in a setting where
overweight and obesity are common, overweight indivi-
duals may be more likely to experience themselves as being
‘average’. This effect may be stronger among men whereas
among women the socio-cultural stigma associated with
overweight may dominate. Considering that paying atten-
tion to body weight is more prevalent among men who
perceive themselves as overweight, it appears that raising
awareness of weight status may be an important stimulus for
weight-watching behaviour among men, including those of
non-Western origin.
Although we did not aim to compare Turks and Mor-
occans with each other, we did observe some differences
between these groups. Per silhouette selected to repre-
sent current body size Moroccan women had lower BMI
levels. In other words, they viewed themselves as ‘larger’
than did Turkish women. In addition, Turkish women
preferred a smaller ideal silhouette than did Moroccan
women and both Turkish men and women preferred
smaller sizes in members of the opposite sex. This
apparently stronger preference for thinner body sizes
among Turkish participants could be reflected in their
more ‘optimistic’ choice of silhouette to represent them-
selves. Our finding of a thin body size ideal among this
group is in line with a study in Turkey which showed that
the desire to be thinner in Turkish adolescents is similar to
that among adolescents in developed countries(59). Among
Moroccans there may be a greater acceptance for larger
body sizes. As literature from Morocco indicates that adi-
posity in women is associated with higher social status(16,17),
it may be that Moroccans may be less concerned with
thinness as an ideal. However, this is not entirely con-
sistent with our finding that 45 % of Moroccan women
perceived themselves as ‘overweight’ even though the
prevalence of overweight and obesity in this group was
36?6 % and that the majority of women, 57?7 %, preferred
a smaller body size. Comparable data from Turkey and
Morocco would help in understanding these results.
Conclusions
In this first exploration of body size preference and
body weight perception in young adults of Turkish and
Body size preference in non-Western migrants 1339
Moroccan origin, we did not observe a preference for
large body sizes. Similar to Western populations, most
women wished to be thinner than they were whereas this
was less the case among men, the majority of whom were
also unaware of being overweight.
Among the majority of men raising awareness of
overweight appears to be an important intervention goal.
However, caution is advisable when targeting women.
Although a third do not perceive themselves to be over-
weight, the majority exhibit dissatisfaction with their body
size which may make them susceptible to inappropriate
dieting practices.
Acknowledgements
The LASER study was funded by The Netherlands Heart
Foundation and The Netherlands Organisation for Health
Research and Development (NWO, ZonMw). We declare
no conflict of interests.
Authors’ contributions: M.N., K.S. and K.H. designed
the study. M.N. conducted the analysis and wrote the
original draft with input from all the other authors.
References
1. Visscher TL & Seidell JC (2001) The public health impact ofobesity. Annu Rev Public Health 22, 355–375.
2. World Health Organization (2004) Obesity and overweight.In Global Strategy on Diet, Physical Activity and Health.Geneva: WHO.
3. International Organization for Migration (2004) WorldMigration 2005: Costs and Benefits of InternationalMigration. Geneva: IOM.
4. Kumar BN, Meyer HE, Wandel M, Dalen I & Holmboe-Ottesen G (2006) Ethnic differences in obesity amongimmigrants from developing countries, in Oslo, Norway.Int J Obes (Lond) 30, 684–690.
5. Tremblay MS, Perez CE, Ardern CI, Bryan SN & KatzmarzykPT (2005) Obesity, overweight and ethnicity. Health Rep16, 23–34.
6. Wandell PE, Hjorleifsdottir SK & Johansson SE (2003)Diabetes mellitus in Turkish immigrants in Sweden.Diabetes Metab 29, 435–439.
7. Schokker DF, Visscher TL, Nooyens AC, van Baak MA &Seidell JC (2007) Prevalence of overweight and obesity inthe Netherlands. Obes Rev 8, 101–107.
8. Brussaard JH, van Erp-Baart MA, Brants HA, Hulshof KF &Lowik MR (2001) Nutrition and health among migrants inThe Netherlands. Public Health Nutr 4, 659–664.
9. Dijkshoorn H, Uitenbroek DG & Middelkoop BJ (2003)[Prevalence of diabetes mellitus and cardiovascular diseaseamong immigrants from Turkey and Morocco and theindigenous Dutch population]. Ned Tijdschr Geneeskd 147,1362–1366.
10. Wammes B, Breedveld B, Looman C & Brug J (2005) Theimpact of a national mass media campaign in TheNetherlands on the prevention of weight gain. PublicHealth Nutr 8, 1250–1257.
11. Rodin J (1993) Cultural and psychosocial determinants ofweight concerns. Ann Intern Med 119, 643–645.
12. Stice E (1994) Review of the evidence for a socioculturalmodel of bulimia-nervosa and an exploration of themechanisms of action. Clin Psychol Rev 14, 633–661.
13. Pope Jr HG, Olivardia R, Gruber A & Borowiecki J (1999)Evolving ideals of male body image as seen through actiontoys. Int J Eat Disord 26, 65–72.
14. Blokstra A, Burns CM & Seidell JC (1999) Perception ofweight status and dieting behaviour in Dutch men andwomen. Int J Obes Relat Metab Disord 23, 7–17.
15. Madrigal H, Sanchez-Villegas A, Martinez-Gonzalez MA,Kearney J, Gibney MJ, Irala J & Martı́nez JA (2000)Underestimation of body mass index through perceivedbody image as compared to self-reported body mass indexin the European Union. Public Health 114, 468–473.
16. Benjelloun S (2002) Nutrition transition in Morocco. PublicHealth Nutr 5, 135–140.
17. Mokhtar N, Elati J, Chabir R, Bour A, Elkari K, SchlossmanNP, Caballero B & Aguenaou H (2001) Diet culture andobesity in northern Africa. J Nutr 131, 887S–892S.
18. Becker AE, Gilman SE & Burwell RA (2005) Changes inprevalence of overweight and in body image among Fijianwomen between 1989 and 1998. Obes Res 13, 110–117.
19. Al-Sendi AM, Shetty P & Musaiger AO (2004) Body weightperception among Bahraini adolescents. Child Care HealthDev 30, 369–376.
20. Jackson RT, Rashed M & Saad-Eldin R (2003) Rural urbandifferences in weight, body image, and dieting behavioramong adolescent Egyptian schoolgirls. Int J Food Sci Nutr54, 1–11.
21. Simeon DT, Rattan RD, Panchoo K, Kungeesingh KV,Ali AC & Abdool PS (2003) Body image of adolescents in amulti-ethnic Caribbean population. Eur J Clin Nutr 57,157–162.
22. Cachelin FM, Monreal TK & Juarez LC (2006) Body imageand size perceptions of Mexican American women.Body Image 3, 67–75.
23. Redfield R, Linton R & Heskovitz MJ (1935) Outline for thestudy of acculturation. Am Anthropol N Series 9, 149–152.
24. Berry JW (1997) Immigration, acculturation and adaptation.Appl Psychol 46, 5–68.
25. Mciza Z, Goedecke JH, Steyn NP, Charlton K, Puoane T,Meltzer S, Levitt NS & Lambert EV (2005) Development andvalidation of instruments measuring body image and bodyweight dissatisfaction in South African mothers and theirdaughters. Public Health Nutr 8, 509–519.
26. Rasheed P (1998) Perception of body weight and self-reported eating and exercise behaviour among obese andnon-obese women in Saudi Arabia. Public Health 112,409–414.
27. Siervo M, Grey P, Nyan OA & Prentice AM (2006) A pilotstudy on body image, attractiveness and body size inGambians living in an urban community. Eat Weight Disord11, 100–109.
28. Shih MY & Kubo C (2005) Body shape preference andbody satisfaction of Taiwanese and Japanese femalecollege students. Psychiatry Res 133, 263–271.
29. Cachelin FM, Rebeck RM, Chung GH & Pelayo E (2002)Does ethnicity influence body-size preference? A compar-ison of body image and body size. Obes Res 10, 158–166.
30. Grabe S & Hyde JS (2006) Ethnicity and body dissatisfactionamong women in the United States: a meta-analysis.Psychol Bull 132, 622–640.
31. Bennett GG & Wolin KY (2006) Satisfied or unaware? Racialdifferences in perceived weight status. Int J Behav NutrPhys Act 3, 40.
32. Fitzgibbon ML, Blackman LR & Avellone ME (2000) Therelationship between body image discrepancy and bodymass index across ethnic groups. Obes Res 8, 582–589.
33. Brug J, Wammes B, Kremers S, Giskes K & Oenema A(2006) Underestimation and overestimation of personalweight status: associations with socio-demographic char-acteristics and weight maintenance intentions. J Hum NutrDiet 19, 253–262.
1340 M Nicolaou et al.
34. Bush HM, Williams RG, Lean ME & Anderson AS (2001)Body image and weight consciousness among South Asian,Italian and general population women in Britain. Appetite37, 207–215.
35. Patel S, Bhopal R, Unwin N, White M, Alberti KG & Yallop J(2001) Mismatch between perceived and actual overweightin diabetic and non-diabetic populations: a comparativestudy of South Asian and European women. J EpidemiolCommunity Health 55, 332–333.
36. Furnham A & Alibhai N (1983) Cross-cultural differences inthe perception of female body shapes. Psychol Med 13,829–837.
37. de Beer J & Harmsen C (2003) Ethnic marriages. http://www.cbs.nl/ (accessed January 2008).
38. Research and Statistics (2007) Population of Amsterdamaccording to ethnic origin. http://www.os.amsterdam.nl/(accessed January 2008).
39. Rguibi M & Belahsen R (2006) Body size preferences andsociocultural influences on attitudes towards obesity amongMoroccan Sahraoui women. Body Image 3, 395–400.
40. Yumuk VD (2005) Prevalence of obesity in Turkey. ObesRev 6, 9–10.
41. Ertem M, Bahceci M, Tuzcu A, Saka G, Ozturk U & GokalpD (2008) The association between high parity and obesityin women living in South-eastern Turkey. Eat WeightDisord 13, e4–e7.
42. Hosper K, Klazinga NS & Stronks K (2007) Acculturation doesnot necessarily lead to increased physical activity duringleisure time: a cross-sectional study among Turkish youngpeople in the Netherlands. BMC Public Health 7, 230.
43. Collins ME (1991) Body figure perceptions and preferencesamong preadolescent children. Int J Eat Disord 10,199–208.
44. Fallon AE & Rozin P (1985) Sex differences in perceptionsof desirable body shape. J Abnorm Psychol 94, 102–105.
45. Agyemang C, Ujcic-Voortman J, Uitenbroek D, Foets M &Droomers M (2006) Prevalence and management of hyper-tension among Turkish, Moroccan and native Dutch ethnicgroups in Amsterdam, the Netherlands: The AmsterdamHealth Monitor Survey. J Hypertens 24, 2169–2176.
46. Bulik CM, Wade TD, Heath AC, Martin NG, Stunkard AJ &Eaves LJ (2001) Relating body mass index to figural stimuli:population-based normative data for Caucasians. Int J ObesRelat Metab Disord 25, 1517–1524.
47. Ogden CL, Carroll MD, Curtin LR, McDowell MA, Tabak CJ& Flegal KM (2006) Prevalence of overweight and obesityin the United States, 1999–2004. JAMA 295, 1549–1555.
48. Cash TF, Morrow JA, Hrabosky JI & Perry AA (2004) Howhas body image changed? A cross-sectional investigation ofcollege women and men from 1983 to 2001. J Consult ClinPsychol 72, 1081–1089.
49. Bennett GG, Wolin KY, Goodman M, Samplin-Salgado M,Carter P, Dutton S, Hill R & Emmons K (2006)Attitudes regarding overweight, exercise, and healthamong blacks (United States). Cancer Causes Control 17,95–101.
50. Cachelin FM, Striegel-Moore RH & Elder KA (1998)Realistic weight perception and body size assessment in aracially diverse community sample of dieters. Obes Res 6,62–68.
51. Roberts A, Cash TF, Feingold A & Johnson BT (2006) Areblack–white differences in females’ body dissatisfactiondecreasing? A meta-analytic review. J Consult Clin Psychol74, 1121–1131.
52. Olvera N, Suminski R & Power TG (2005) Intergenerationalperceptions of body image in Hispanics: role of BMI,gender, and acculturation. Obes Res 13, 1970–1979.
53. Perez M, Voelz ZR, Pettit JW & Joiner TE Jr (2002) The roleof acculturative stress and body dissatisfaction in predictingbulimic symptomatology across ethnic groups. Int J EatDisord 31, 442–454.
54. Reddy SD & Crowther JH (2007) Teasing, acculturation,and cultural conflict: psychosocial correlates of body imageand eating attitudes among South Asian women. CulturDivers Ethnic Minor Psychol 13, 45–53.
55. Soh NL, Touyz SW & Surgenor LJ (2006) Eating and bodyimage disturbances across cultures: a review. Eur EatDisord Rev 14, 54–65.
56. Wildes JE, Emery RE & Simons AD (2001) The roles ofethnicity and culture in the development of eatingdisturbance and body dissatisfaction: a meta-analyticreview. Clin Psychol Rev 21, 521–551.
57. Burns CM, Tijhuis MA & Seidell JC (2001) The relationshipbetween quality of life and perceived body weight anddieting history in Dutch men and women. Int J Obes RelatMetab Disord 25, 1386–1392.
58. Paeratakul S, White MA, Williamson DA, Ryan DH & BrayGA (2002) Sex, race/ethnicity, socioeconomic status, andBMI in relation to self-perception of overweight. Obes Res10, 345–350.
59. Canpolat BI, Orsel S, Akdemir A & Ozbay MH (2005)The relationship between dieting and body image, bodyideal, self-perception, and body mass index in Turkishadolescents. Int J Eat Disord 37, 150–155.
Body size preference in non-Western migrants 1341