Body composition, bone mass and microstructural analysis in GH-transgenic mice reveals that skeletal...
10
Growth Hormone & IGF Research 2002, 12, 116–125 doi:10.1054/ghir.2002.0272, available online at http://www.idealibrary.com on Body composition, bone mass and microstructural analysis in GH-transgenic mice reveals that skeletal changes are specific to bone compartment and gender F. Eckstein 1 , E.-M. Lochm ¨ uller 2 , B. Koller 3 , U. Wehr 4 , A. Weusten 1,2 , W. Rambeck 4 , A. Hoeflich 5 and E. Wolf 5 1 Musculoskeletal Research Group, Institute of Anatomy, Ludwig-Maximilians-Universit¨ at M ¨ unchen, Pettenkoferstr. 11, D-80336 M ¨ unchen, Germany, 2 I. Frauenklinik der Ludwig-Maximilians-Universit ¨ at M ¨ unchen, Maistr. 11, D-80337 M ¨ unchen, Germany, 3 Scanco Medical, Bassersdorf, Switzerland, 4 Institute of Physiology, Physiological Chemistry, and Animal Nutrition, Ludwig-Maximilians-Universit¨ at M ¨ unchen, Veterin ¨ arstr. 13, D-80539 M ¨ unchen, Germany and 5 Institute of Molecular Animal Breeding and Biotechnology, Gene Center, Ludwig-Maximilians-Universit¨ at M ¨ unchen, Feodor-Lynen-Str. 25, D-81377 M ¨ unchen, Germany Summary Experimental and clinical studies suggest that high serum levels of growth hormone (GH) increase cortical but not trabecular bone. We studied body composition and bone structure in transgenic mice (MT-bGH) with systemic overexpression of GH. Body composition was examined with dual-energy X-ray absorptiometry (DXA), ashing, and chemical analysis, and the femora with DXA and micro computerized tomography. The ab- solute fat and bone tissue contents were significantly higher in GH transgenic mice vs controls ( P < 0.05), but no significant difference was noted when normalizing the values to body weight. Male transgenics displayed no change in apparent (volumetric) femoral bone density, relative cortical area and trabecular bone volume fraction. Female transgenic mice demonstrated an increase in apparent femoral density and in trabecular bone volume fraction (+130%; P < 0.01). The mineralized tissue matrix density was decreased in male and female transgenic mice ( P <0.05). The results show that chronic GH excess affects trabecular bone in a gender-specific manner and that bone changes depend on the compartment investigated. C 2002 Published by Elsevier Science Ltd. Key words: growth hormone, transgenic animal model, mouse, dual-energy X-ray absorptiometry, bone microstructure, trabecular bone. INTRODUCTION Growth hormone (GH) is known to play a crucial role in the postnatal development and maintenance of the Received 12 July 2001 Revised 4 December 2001 Accepted 25 January 2002 Correspondence to: PD Dr. med. Felix Eckstein, Anatomische Anstalt, Pettenkoferstr. 11, D-80336 M ¨ unchen, Germany. Tel: +49 89 5160 4847; Fax: +49 89 5160 4802; E-mail: [email protected] skeleton. 1–4 Lack of GH has been shown to cause a re- duction in longitudinal bone growth and bone mineral content (BMC) and to increase the rate of fractures. 5–7 Treatment with GH has been demonstrated to increase bone mass and density in adult animals and humans through an increase in bone formation. 1,8–10 As this increase in modelling has also been observed under weightless conditions during space flight, 11 it has be- come evident that the impact on bone formation is not through increased mechanical strain due to weight 1096–6374/02/$ – see front matter C 2002 Published by Elsevier Science Ltd.
-
Upload
independent -
Category
Documents
-
view
3 -
download
0
Transcript of Body composition, bone mass and microstructural analysis in GH-transgenic mice reveals that skeletal...

Growth Hormone & IGF Research 2002, 12, 116–125doi:10.1054/ghir.2002.0272, available online at http://www.idealibrary.com on
Body composition, bone massand microstructural analysis inGH-transgenic mice reveals thatskeletal changes are specific tobone compartment and gender
F. Eckstein1, E.-M. Lochmuller2, B. Koller3, U. Wehr4, A. Weusten1,2,W. Rambeck4, A. Hoeflich5 and E. Wolf5
1Musculoskeletal Research Group, Institute of Anatomy, Ludwig-Maximilians-Universitat Munchen, Pettenkoferstr. 11, D-80336 Munchen, Germany,2I. Frauenklinik der Ludwig-Maximilians-Universitat Munchen, Maistr. 11, D-80337 Munchen, Germany, 3Scanco Medical, Bassersdorf, Switzerland,4Institute of Physiology, Physiological Chemistry, and Animal Nutrition, Ludwig-Maximilians-Universitat Munchen, Veterinarstr. 13, D-80539 Munchen,Germany and 5Institute of Molecular Animal Breeding and Biotechnology, Gene Center, Ludwig-Maximilians-Universitat Munchen, Feodor-Lynen-Str.25, D-81377 Munchen, Germany
Summary Experimental and clinical studies suggest that high serum levels of growth hormone (GH) increasecortical but not trabecular bone. We studied body composition and bone structure in transgenic mice (MT-bGH)with systemic overexpression of GH. Body composition was examined with dual-energy X-ray absorptiometry(DXA), ashing, and chemical analysis, and the femora with DXA and micro computerized tomography. The ab-solute fat and bone tissue contents were significantly higher in GH transgenic mice vs controls (P < 0.05), butno significant difference was noted when normalizing the values to body weight. Male transgenics displayed nochange in apparent (volumetric) femoral bone density, relative cortical area and trabecular bone volume fraction.Female transgenic mice demonstrated an increase in apparent femoral density and in trabecular bone volumefraction (+130%; P < 0.01). The mineralized tissue matrix density was decreased in male and female transgenicmice (P < 0.05). The results show that chronic GH excess affects trabecular bone in a gender-specific mannerand that bone changes depend on the compartment investigated.
C© 2002 Published by Elsevier Science Ltd.
Key words: growth hormone, transgenic animal model, mouse, dual-energy X-ray absorptiometry,bone microstructure, trabecular bone.
INTRODUCTION
Growth hormone (GH) is known to play a crucial rolein the postnatal development and maintenance of the
Received 12 July 2001Revised 4 December 2001Accepted 25 January 2002
Correspondence to: PD Dr. med. Felix Eckstein, Anatomische Anstalt,Pettenkoferstr. 11, D-80336 Munchen, Germany. Tel: +49 89 5160 4847;Fax: +49 89 5160 4802; E-mail: [email protected]
1096–6374/02/$ – see front matter
skeleton.1–4 Lack of GH has been shown to cause a re-duction in longitudinal bone growth and bone mineralcontent (BMC) and to increase the rate of fractures.5–7
Treatment with GH has been demonstrated to increasebone mass and density in adult animals and humansthrough an increase in bone formation.1,8–10 As thisincrease in modelling has also been observed underweightless conditions during space flight,11 it has be-come evident that the impact on bone formation isnot through increased mechanical strain due to weight
C© 2002 Published by Elsevier Science Ltd.

Skeletal changes in GH-transgenic mice 117
gain. When GH was administered to aged rats withnormal GH secretion, it induced subperiostal boneformation in cortical bone12 but did not affect trabecu-lar bone density or bone surface/bone volume.13 Theseresults have indicated that GH may exert stronger an-abolic effects in the cortical than in the trabecular bonecompartment.1
Reports on skeletal changes in patients withacromegaly have been inconsistent, with some investi-gators reporting increases and some decreases of bonemass and density at various skeletal sites.14–20 Dis-crepant results between studies may have occurredas a result of confounding with variable degrees ofhypogonadism, different study samples, and varia-tions of measurement location and technique. Somestudies have focused on skeletal sites with predom-inantly cortical bone (e.g. shaft of the distal radius)and some on those with predominantly trabecularbone (e.g. vertebral bodies). As most of these stud-ies have suggested that cortical bone mass was in-creased in acromegaly, whereas trabecular bone wasunaffected,1 it may be that the particular choice ofmeasurement site has influenced the results. Most ofthese studies have employed dual-energy X-ray ab-sorptiometry (DXA); it should therefore be kept inmind that density values (BMD given in g/cm2) con-stitute an integral measure of cortical and trabecu-lar bone and are confounded by variations in bonesize.21,22
Changes in the GH–insulin-like growth factor (IGF)axis have also been suggested to play a role inosteoporosis,23–25 and – in contrast to most currentlyavailable antiosteoporotic drugs – GH has the potentialto increase bone formation.26,27 However, it is stillunclear whether administration of GH in osteo-porotic patients is beneficial to bone mineral statusand strength and how it affects different compart-ments (cortical/trabecular) of the bone tissue in agedindividuals.1,2,4,10,26–28
To study the effect of supraphysiological serum lev-els of GH on various organ systems in vivo, transgenicexpression of GH has been achieved in mice with vari-ous promoter systems.29,30 With metallothionein (MT)–promoter systems, serum levels were increased byseveral orders of magnitude over baseline levels in con-trol animals.31 Transgenic mice with systemic expres-sion of human GH under the control of this promoterhave been shown to exhibit dysproportionate skeletalgigantism32; however, there has so far been no system-atic analysis of the body composition, bone mineral sta-tus and bone microarchitecture in GH-overexpressingmice. Specifically, there has been no study on changesin trabecular bone microstructure in GH transgenicmice.
The current study uses state-of-the-art micro-imaging technology to analyse the gender-specific ef-fects of elevated GH levels on body composition, bonemineral status and skeletal microstructure of trans-genic animals with systemic overexpression of GH. Thestudy was designed to characterize (and validate) skele-tal changes on all hierarchical levels of potential pheno-typic expression (body composition, total body skeletalmineral content, single bone mineral content, appar-ent bone density, cortical and trabecular compartmentchanges, trabecular microarchitecture and mineralizedtissue density), in order to provide a comprehensiveanalysis of skeletal changes in this model system.
MATERIALS AND METHODS
Animals
We studied 28 mice aged 12 weeks, 14 male and 14 fe-male, on an NMRI background. Seven animals in eachgroup carried bovine (b) GH fusion genes under thetranscriptional control of a mouse metallothionein I(MT) promoter,31 and the other seven were control lit-termates. Hemizygous MT-bGH transgenic mice wereprovided by Dr T.E. Wagner, Edison Biotechnology Cen-ter (Ohio University, Athens, Ohio, USA) and then se-quentially crossed with NMRI outbred mice (CharlesRiver-Wiga, Sulzfeld, Germany). Animals investigated inthe present study were from the 14th generation. Inte-gration of the transgene was identified by polymerasechain reaction analysis of tail biopsies. Serum bGH lev-els of MT-bGH transgenic mice were observed to bein the range 100–200 ng/mL, whereas baseline valueswere less than 10 ng/mL in control animals.31 SerumIGF values have also been reported to be elevatedin pregnant MT-bGH transgenic mice vs controls.33
Serum IGF-I concentrations of the mouse strain usedin the present study were determined by an enzymeimmunoassay specific for rat and mouse IGF-I (DSL,Sinsheim, Germany). They were significantly (P < 0.05)increased in male MT-bGH transgenic mice vs con-trols (835±139 ng/mL vs 551±118 ng/mL; n =8) aswell as in female transgenic mice (699±126 ng/mL vs525±70 ng/mL; n =4). The mice were kept under non-barrier conditions and had free access to tap water anda standard rodent diet (Ssniff V1126, Soest, Germany).They were sacrificed by cervical dislocation, the ex-periments being carried out according to the GermanAnimal Protection Law.
Body composition and bone mineral analysis
The body composition and bone mineral analysis wasfirst performed with a peripheral DXA scanner (pDEXASabre, Norland/Stratec, Pforzheim, Germany) with a
118 F. Eckstein et al.
50 µm×150 µm focal spot X-ray tube. The scanner hasbeen specifically adapted to the non-invasive study ofsmall animals.34 The mice were examined in a supineposition at a spatial resolution of 0.5 mm×1.0 mm, theBMC and fat tissue content (FTC) being analysed. Theprecision (reproducibility) in mice with body weightsabove 30 g has been previously reported to be approx-imately 4% (coefficient of variation of repeated mea-surements) for total body BMC and 13% for the FTCwith this system.34 The relative BMC and FTC were de-termined by dividing these values by the body weightof each animal, as determined on a laboratory scale.
To validate the BMC and FTC measurements, thecadavers were dried at 103 ◦C (T 12 drying oven,Heraeus, Hanau, Germany) after removal of the left fe-mur, and they were homogenized with an universalgrinder (Ultra-Turrax T 25, IKA-Labortechnik, Staufen,Germany). Aliquots were taken for assessing the ashweight (in comparison with the BMC) and FTC in eachanimal. To determine ash weight and calcium, the ho-mogenized tissue was dried at 80 ◦C for 48 h, andsamples were heated to 580 ◦C for 48 h in a mufflefurnace (MR 170, Heraeus). The ash was finally dis-solved in a solution of 50 mL 10% hydrochloric acidto provide a stock solution. An aliquot from this stockwas diluted with 1% lithium solution and burned to-gether with acetylene. The intensity of the flame wasmeasured with a photometer (ELEX 636, Eppendorf,Hamburg, Germany), results being proportional to thecalcium content. To determine the FTC, a definedamount (5 g) of the aliquot was weighed and the fat ex-tracted with petroleum ether for 6 h (Soxhlet FSEU/1/6,Isopad, Siegen, Germany). After extraction, the solutionwas distilled and the residue dried for 90 min at 103 ◦C.Finally, the material was weighed in the exsiccator andthe FTC calculated. Again, relative BMC and FTC val-ues were determined by dividing these values by thebody weight of each animal.
Microstructural analysis
The left femur of each of the 28 mice was first ex-amined with the high resolution mode of the DXAscanner (0.1×0.1 mm2, scan speed 1 mm/s), to deter-mine femoral BMC. The femora were then analyzedusing a micro computerized tomography system (µCT20, Scanco Medical AG, Bassersdorf, Switzerland). Amicrofocus X-ray tube with a focal spot of 7 µm wasused as a source. 570 projections were taken over 204◦
(180◦ plus half the fan angle on either side), and aconvolution–backprojection procedure with a Sheppand Logan filter was employed to reconstruct imagesin a 1024×1024 pixel matrix. Multislice images werestored in three-dimensional (3D) image arrays. In a
first step, the total femur was scanned with an isotropicresolution of 34 µm (Fig. 1), including an average of750 transverse slices. The bone tissue was segmentedfrom non-bone tissue by applying a Gaussian filterand a fixed threshold procedure. The threshold wasdetermined by means of a histogram evaluation ofthe grey level data sets. The outer contours of thefemur were determined by segmentation, to calculatethe volume and the apparent volumetric bone densityon the total organ level (femoral BMC divided bythe entire femoral volume). The linear attenuationcoefficient (µ) of the original dataset, masked by thesegmented object, provided a measure of mineralizedtissue density (mineralization and porosity). In a nextstep, high resolution scans were obtained in the distalfemur with an isotropic voxel size of 9 µm (technicalresolution 20 µm), scanning approximately 400 slicesproximal to the growth plate (Fig. 1). This 3D data setwas used to determine architectural parameters of thetrabecular compartment.35 The microstructural analy-sis involved the determination of trabecular thickness,trabecular number, trabecular spacing, connectivitydensity, structure model index (SMI) (a measure ofplate- or rod-like trabecular structure) and trabecularanisotropy.35 Three isotropic high resolution slices(9 µm voxel size) were obtained at the diaphysis
Fig. 1 µCT scan of the total femur at isotropic 34 µm resolution,displaying the hierarchical levels of analysis and the regions ofinterest of the compartment analyses.

Skeletal changes in GH-transgenic mice 119
(45%, 50% and 55% of femoral bone length – Fig. 1)to determine the total cross-sectional area of the shaft,the cortical area and the relative cortical area (corticalarea/total cross-sectional area). These slices were thentransferred to a workstation (SGI Octane Duo, SiliconGraphics, Mountainview, CA) to determine the mean,minimum, maximum and standard deviation of corticalthickness by Euclidean distance transformation.36
Statistical analysis
Comparison between techniques was performed bycomputing pairwise differences directly and by linearregression analysis (correlation coefficient and stan-dard error of the estimate (SEE)). Results betweengroups (male vs female controls, and male transgenic
Table 1 Mean values± standard deviations in groups
Female Female Male Malecontrols transgenics controls transgenics
Total body analysis
BW (g) 34.2± 3.4 55.7± 3.3 40.8± 1.9 68.2± 7.0
Ash BMC (mg) 1380± 164 2270± 441 1310± 166 2260± 168
DXA BMC (mg) 997± 161 1710± 314 991± 66 1600± 217
Ash BMC/BW (%) 4.0± 0.16 4.1± 0.66 3.2± 0.34 3.3± 0.16
DXA BMC/BW (%) 2.9± 0.29 3.1± 0.47 2.4± 0.11 2.3± 0.17
Chem FTC/BW (%) 41± 14 43± 15 35± 5.7 32± 5.7
DXA FTC/BW (%) 33± 19 38± 21 28± 6 21± 8
Total femur
BMC µCT (BV×µ) 136± 14.1 206± 34.0 129± 14.6 191± 18.4
BMC DXA (mg) 30.9 ± 4.63 51.1± 8.86 29.6± 4.54 48.4± 4.86
Volume (mm3) 50.0± 5.5 71.8± 6.7 52.2± 4.8 86.6± 7.6
Apparent density (mg/cm3) 616± 40.8 709± 72.8 564± 39.3 560± 44.9
Cortical compartment
Total area (mm2) 1.91± 0.24 2.30± 0.35 2.16± 0.41 2.94± 0.26
Cortical area (mm2) 1.11± 0.14 1.47± 0.31 1.23± 0.27 1.66± 0.14
Cortical area/total area (%) 58± 2.5 64± 7.8 57± 2.5 57± 5.0
Mean cortical thickness (µm) 255± 20 297± 42 258± 37 291± 32
Minimum cortical thickness (µm) 189± 25 201± 29 198± 49 192± 19
Maximum cortical thickness (µm) 324± 33 409± 78 382± 80 410± 69
Trabecular compartment
BV/TV (%) 16.1± 4.7 38.1± 11.9 16.6± 3.0 17.6± 1.6
Trabecular thickness (µm) 61± 4 70± 11 51± 2 44± 4
Trabecular spacing (µm) 270± 37 151± 31 235± 50 180± 13
Trabecular number 3.76± 0.55 6.16± 1.08 4.33± 0.77 5.27± 0.34
Connectivity density 78.4± 28.0 180± 48.4 134± 43.1 222± 43.4
SMI 1.88± 0.51 −0.25± 1.41 1.67± 0.29 1.57± 0.19
Anisotropy 1.79± 0.13 1.81± 0.11 1.71± 0.11 1.66± 0.11
Tissue level
Tissue density (µ) 4.04± 0.10 3.93± 0.08 3.99± 0.08 3.83± 0.07
BV, bone volume; BW, body weight; chem, chemical analysis; TV, total volume; µ, absorption coefficient of mineralized bone tissue.
vs male controls and female transgenic vs female con-trols, giving three pairwise comparisons) were evalu-ated for significant differences using a non-parametrictest (Mann–Whitney U test) using Statview 4.5 (AbacusConcepts, Berkely, CA). The levels of significance wereset as follows: ∗, P < 0.05 in a single comparison; ∗∗,P < 0.0166 in a single comparison, achieving a globalsignificance level of P < 0.05 for three pairwise compar-isons; ∗∗∗, P < 0.0033, to indicate a global significancelevel of P < 0.01 for three pairwise comparisons.
RESULTS
Descriptive results for all parameters and groups aregiven in Table 1, and the differences between groupsare reported in Table 2.

120 F. Eckstein et al.
Table 2 Percentage differences and significance of bone properties between groups
Normals: Female transgenic Male transgenicmale vs female vs control vs control
Total body analysis
BW +19%∗∗ +63%∗∗ +67%∗∗
Ash BMC −4.7% +65%∗∗ +72%∗∗
DXA BMC −0.6% +71%∗∗ +62%∗∗
Ash BMC/BW −20%∗∗∗ +1.0% +3.3%
DXA BMC/BW −17%∗∗∗ +4.9% −4.1%
Chem FTC/BW −14% +5.0% −9.0%
DXA FTC/BW −15% +13% −24%
Total femur
BMC µCT −4.9% +52%∗∗∗ +48%∗∗∗
BMC DXA −4.2% +65%∗∗∗ +64%∗∗∗
Volume +4.5% +44%∗∗∗ +66%∗∗∗
Apparent density −8.2%∗ +15%∗ −0.7%
Cortical compartment
Total area +13% +20%∗ +36%∗∗
Cortical area +11% +32%∗ +35%∗∗
Cortical area/total area −2.3% +9.4% ±0.0%
Mean cortical thickness +1.2% +17% +13%
Minimum cortical thickness +4.5% +6.0% −2.7%
Maximum cortical thickness +18% +26%∗ +7.3%
Trabecular compartment
BV/TV +3.5% +137%∗∗∗ +5.8%
Trabecular thickness −16%∗∗∗ +16%∗ −13%∗∗∗
Trabecular spacing −13% −44%∗∗∗ −23%∗
Trabecular number +15% +64%∗∗∗ +22%∗
Connectivity density +71%∗ +130%∗∗∗ +66%∗∗
SMI −11% −113%∗∗ −6.1%
Anisotropy −4.7% +0.8% −3.1%
Tissue level
Tissue density (µ) −1.1% −2.7%∗ −3.9%∗∗
BV, bone volume; BW, body weight; chem, chemical analysis; TV, total volume.∗P < 0.05 in single Mann–Whitney U test; ∗∗P < 0.05 at global level (P < 0.0166 in single Mann–WhitneyU test); ∗∗∗P < 0.01 at global level (P < 0.0033 in single Mann–Whitney U test).
The male control animals were significantly heavierthan female controls (P < 0.05) but displayed no signif-icant difference in total body BMC. Male controls thusdisplayed a significantly lower relative BMC (percent-age of body weight) compared with females (P < 0.01;Table 2). There was a trend in male controls to have alower relative FTC than females, but this did not reachstatistical significance. Male controls also displayed asignificantly lower apparent bone density of the fe-mur (P < 0.05 in single Mann–Whitney U test), a lowertrabecular thickness in the distal femur (P < 0.01) anda higher connectivity density (P < 0.05 in single test)but no significant changes in the other structural boneparameters (Table 2).
Female transgenic animals were significantly heav-ier than female controls (P < 0.05) and displayed aproportional increase in total body BMC (P < 0.05;Table 2). The relative BMC and the relative FTCwere unchanged. The femur displayed a higher in-crease in bone mass (+65%; P < 0.01) than volume(+44%; P < 0.01), with a small, but significant, gainin apparent volumetric bone density (P < 0.05 in sin-gle test). Female transgenics displayed a significantlylarger cortical area and a larger total cross-sectionalarea at the femoral shaft (P < 0.05 in single test).There were small increases in the relative cortical area,mean and minimal cortical thickness, but these didnot reach statistical significance. Only the maximal
Skeletal changes in GH-transgenic mice 121
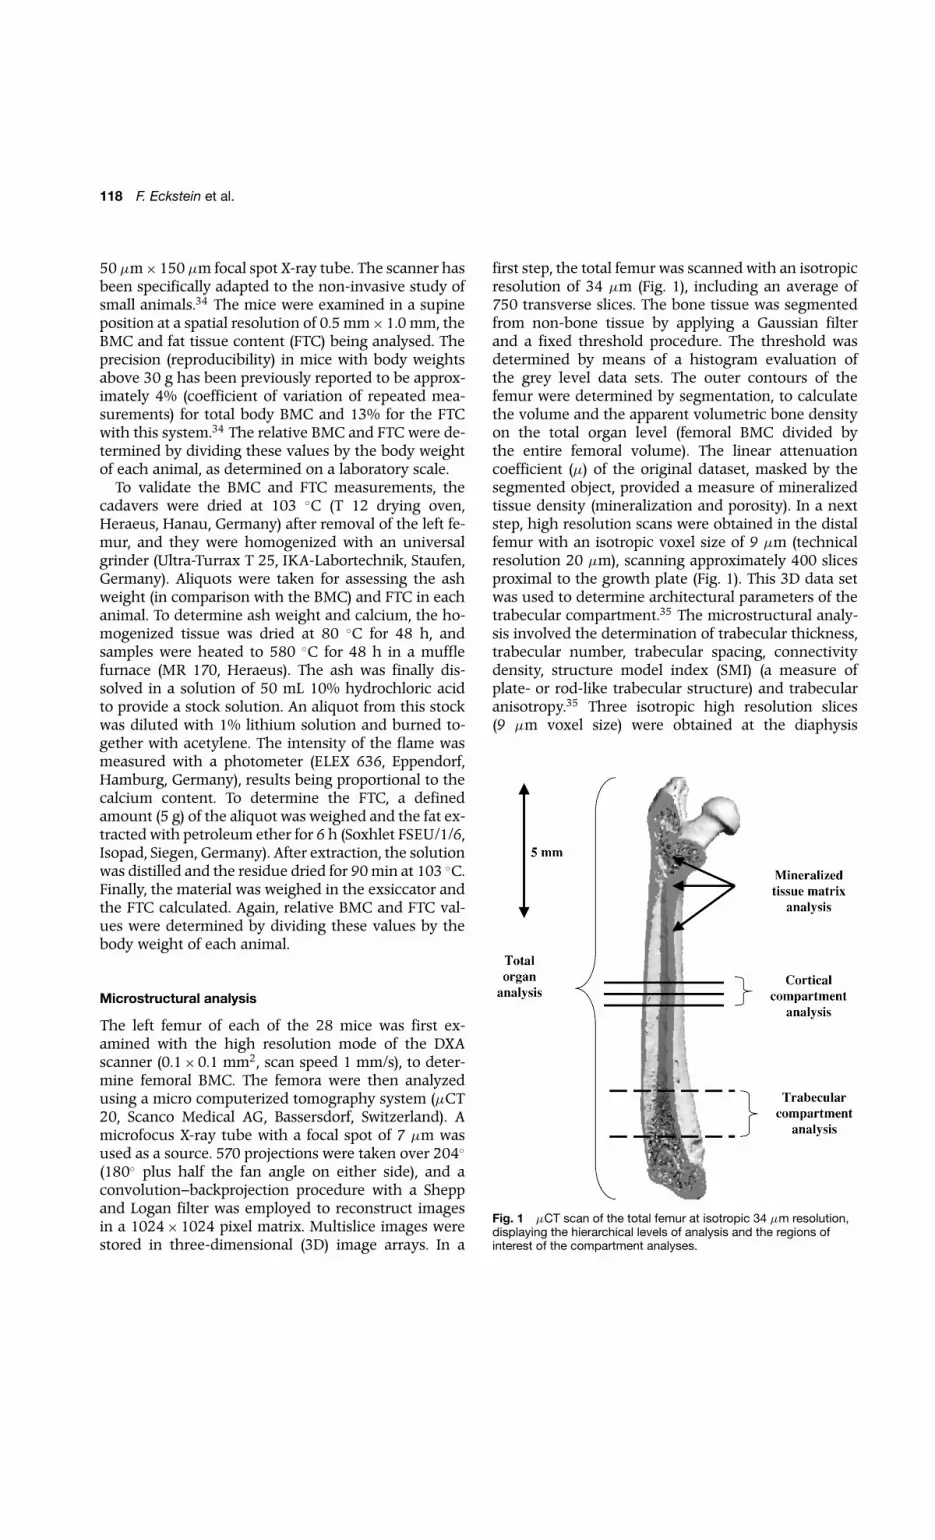
cortical thickness was significantly larger in trans-genic females (P < 0.05 in single test; Table 2). Femaletransgenics displayed a striking increase in trabecu-lar density (bone volume fraction) from 16.1%±4.7%in controls to 38%±11.9% (+137%; P < 0.01; Fig. 2;Table 2). This increase resulted primarily from an in-crease in trabecular number (+64%; P < 0.01) and areduction in trabecular spacing (−44%; P < 0.01) and,to a smaller extent, from an increase in trabecularthickness (+16%; P < 0.05 in single test). The con-nectivity density was also largely increased (+130%;P < 0.01) and the SMI decreased (P < 0.05), indicat-ing a predominance of plate-like trabecular structure(Fig. 2; Table 2). The anisotropy index was unchanged,indicating that changes in trabecular structure dis-played no preferential spatial direction. Despite theseanabolic effects in the trabecular and cortical compart-ment, the mineralized tissue density was significantlydecreased in transgenic animals (P < 0.05 in single test;Table 2).
Male transgenic animals displayed proportional in-creases (P < 0.05) in body weight and bone mass(BMC), with no change in the relative BMC (percent-age of body weight) or relative FTC (Table 2). The in-crease in femoral volume (P < 0.01) was larger than infemale transgenics (+66% vs+44%) and was propor-tional to the gain (P < 0.01) in femoral BMC. In contrastto the females, the apparent femoral bone density wasunchanged in male transgenics (Table 2). The total cor-tical area and total cross-sectional area were increased
Fig. 2 µCT scan of the trabecular compartment of the distalfemur. The reconstructions show the dramatic increase oftrabecular density in GH transgenic females. Male transgenic micedisplay changes in trabecular microarchitecture but not intrabecular density (bone volume fraction).
to similar extents in the femoral shaft (P < 0.05). Nochanges were observed in relative cortical area and cor-tical thickness. In contrast to female mice, male trans-genics did not show a significant change in trabeculardensity at the distal femur but nevertheless displayedchanges in trabecular microstructure (Fig. 2). The tra-beculae were thinner (P < 0.01) but at the same time in-creased in number (P < 0.05 in single test), with smallerspacing between them (P < 0.05 in single test). Theconnectivity density was increased in male transgenics(P < 0.05), but the SMI and anisotropy index were notdifferent (Table 2). The mineralized tissue density wassignificantly decreased in transgenic males (P < 0.05),the effect being stronger than in females.
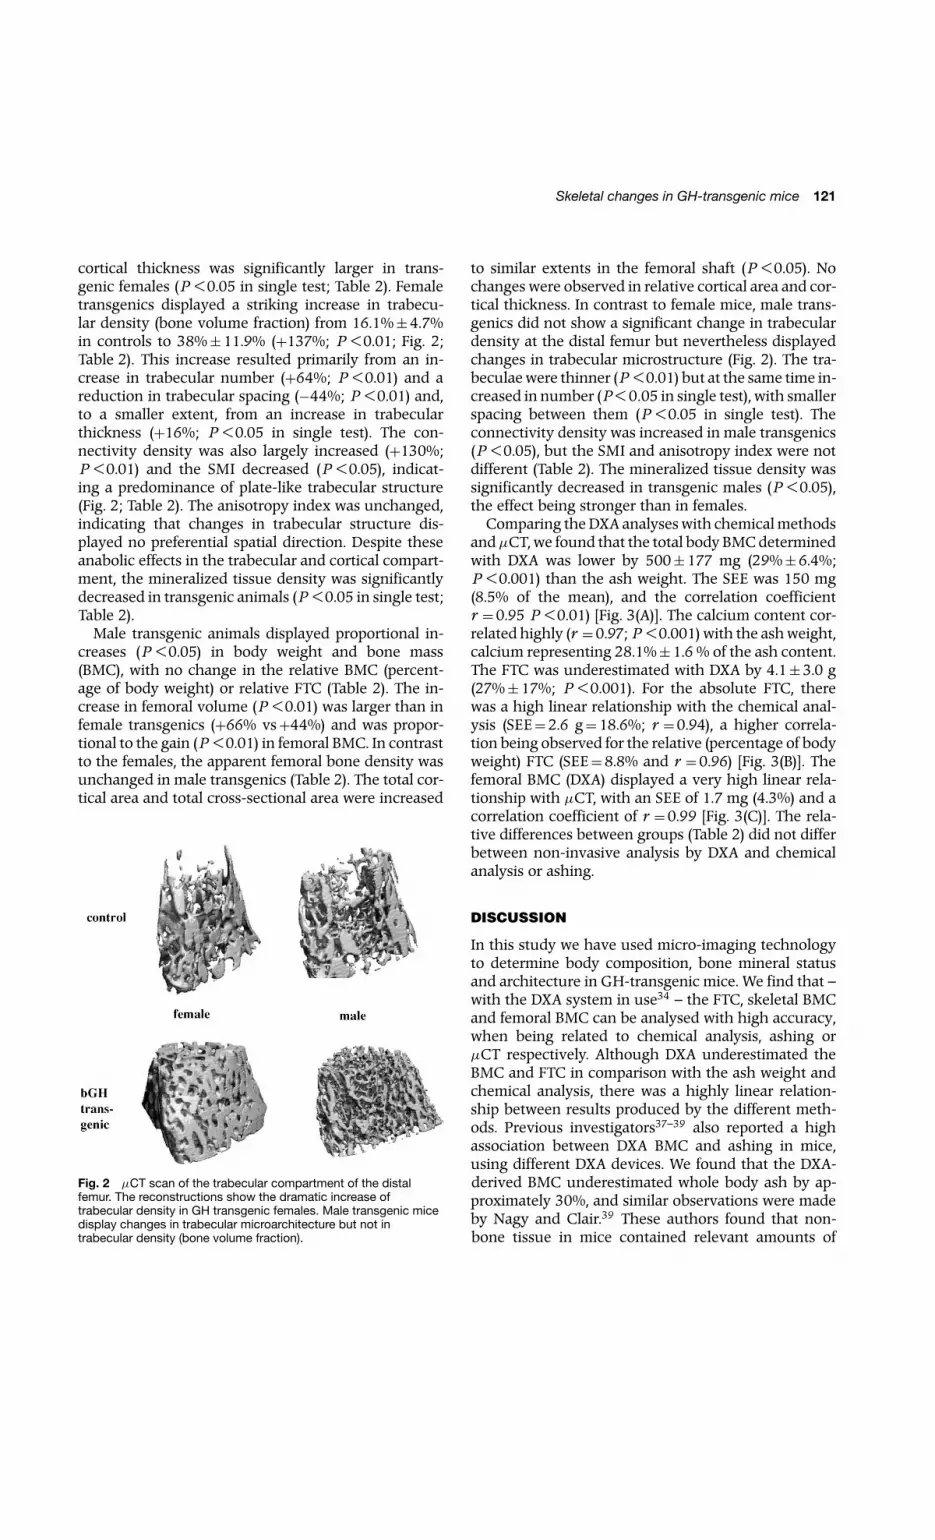
Comparing the DXA analyses with chemical methodsandµCT, we found that the total body BMC determinedwith DXA was lower by 500±177 mg (29%±6.4%;P < 0.001) than the ash weight. The SEE was 150 mg(8.5% of the mean), and the correlation coefficientr =0.95 P < 0.01) [Fig. 3(A)]. The calcium content cor-related highly (r =0.97; P < 0.001) with the ash weight,calcium representing 28.1%±1.6 % of the ash content.The FTC was underestimated with DXA by 4.1±3.0 g(27%±17%; P < 0.001). For the absolute FTC, therewas a high linear relationship with the chemical anal-ysis (SEE=2.6 g=18.6%; r =0.94), a higher correla-tion being observed for the relative (percentage of bodyweight) FTC (SEE=8.8% and r =0.96) [Fig. 3(B)]. Thefemoral BMC (DXA) displayed a very high linear rela-tionship with µCT, with an SEE of 1.7 mg (4.3%) and acorrelation coefficient of r =0.99 [Fig. 3(C)]. The rela-tive differences between groups (Table 2) did not differbetween non-invasive analysis by DXA and chemicalanalysis or ashing.
DISCUSSION
In this study we have used micro-imaging technologyto determine body composition, bone mineral statusand architecture in GH-transgenic mice. We find that –with the DXA system in use34 – the FTC, skeletal BMCand femoral BMC can be analysed with high accuracy,when being related to chemical analysis, ashing orµCT respectively. Although DXA underestimated theBMC and FTC in comparison with the ash weight andchemical analysis, there was a highly linear relation-ship between results produced by the different meth-ods. Previous investigators37–39 also reported a highassociation between DXA BMC and ashing in mice,using different DXA devices. We found that the DXA-derived BMC underestimated whole body ash by ap-proximately 30%, and similar observations were madeby Nagy and Clair.39 These authors found that non-bone tissue in mice contained relevant amounts of

122 F. Eckstein et al.
Fig. 3 Accuracy of non-invasive analysis with DXA: (A) correlationbetween total body in situ DXA BMC and ashing; (B) correlationbetween total body in situ DXA FTC and chemical analysis; (C)correlation between femoral ex situ DXA BMC and µCT. f, female;m, male; con, control; tg, bGH transgenic.
minerals (ash) and that DXA accurately deter-mined bone ash, whereas total body ash wasunderestimated.39 The deviations from linearity be-tween DXA and ashing of mice in previous and ourstudies were, however, smaller than reported for clin-ical DXA instruments.40,41 One previous study has
compared fat tissue mass (FTM) measured in DXA withchemically derived values in mice39: whereas signifi-cant overestimation of FTM by DXA was reported,39
we found the opposite in our current study. We haveno explanation for the different outcomes, but therewas a high linear correlation between both methodsin the two studies. This shows that chemically de-rived body composition can be accurately predictedfrom DXA.µCT has been recently developed for high resolution
analysis of cortical or trabecular bone, and it has beenshown to produce results that are consistent with his-tomorphometry in humans and in small animals.42,43
The advantage of µCT vs histology is that it is non-destructive and that – as a virtue of its 3D approach –microstructural parameters can be computed withoutthe model assumption required for conventional(sectional) histomorphometry.35 Nevertheless, the cur-rent findings should be verified by histomorphomet-ric analysis in future studies. The comparison betweenex situ DXA on the femur and µCT confirms high con-sistency between these methods, this being in agree-ment with the high correlations observed between DXAand ashing of small murine bones.37
It is interesting to note that GH-transgenic micedid not display significant changes in relative FTC incomparison with control animals, although a lipolyticfunction of GH has been reported previously.10,44–46
Analysis of the total skeleton BMC displayed a sub-stantial increase in bone mass in males and femalesand was proportional to the gain in body weight. Thebalance between body weight and total bone massdid therefore not show a perturbation in this modelsystem.
Wolf et al 32 have previously reported a dispropor-tionate skeletal gigantism in transgenic animals withsystemic GH overexpression, with some bones beingmore affected than others.32 In the current study, thegain in femoral BMC was proportional to that in to-tal body BMC and was similar in male and femalemice. The effect of GH overexpression on femoral bonesize (volume and cross-sectional area) was, however,weaker in females, with a net increase in apparent bonedensity. Rosen et al 21observed an increase in bone sizeand BMC, but a decrease in density, in growing rats af-ter treatment with hGH and IGF-I. The advantage ofthe current transgenic model is, however, that long-term effects of elevated GH and IGF-I levels can bestudied without immunological reactions of the organ-ism to foreign proteins. Our results suggest that theGH-induced elevation of bone mass (and potentiallyalso bone strength) is by different mechanisms in maleand female mice: a higher increase in bone diameter inmale and a higher increase in density in female mice.

Skeletal changes in GH-transgenic mice 123
Sandstedt et al 47,48 reported in MT-bGH transgenicmice (also systemic overexpression) that BMC was sub-stantially elevated in female GH-transgenic mice whenoestrogen was present but not in ovarectomized ani-mals. It therefore seems likely that differential effectsof GH on bone structure of male and female GH-transgenic mice are dependent on the interaction withmale and female sex steroids.
Although clear anabolic effects of GH overexpres-sion were seen on cortical bone in both genders, therewas only a gain in absolute, not in relative, cortical area(cortical/total area). This shows that the increase in cor-tical bone in this model is not stronger than the gain inoverall bone size. The most striking result of the currentstudy is the drastic increase in trabecular bone densityin female, but not in male, transgenic mice. In a pilotstudy of female mice, we have seen increases in tra-becular bone density also in vertebral bone of PEPCKpromoter–bGH-transgenic mice.49 This suggests thatthe effects described here appear to be independentof skeletal site and the promoter system in use. Theseresults are, however, surprising, in view of previousstudies in aged rat.12,13 These have reported changesin cortical, but not in trabecular, bone on GH adminis-tration, but these studies were performed in male ani-mals. Our results are also interesting in the context ofclinical studies in acromegaly which have so far sug-gested stronger effects on cortical than on trabecularmeasurement sites.1 With regard to trabecular microar-chitecture, the high serum levels of GH exerted dif-ferent effects on the thickness of trabeculae in bothgenders, an elevation in females and a reduction inmales. The decrease of trabecular spacing and the in-crease in trabecular number were stronger in females,leading to a drastic increase in trabecular bone vol-ume fraction in female, but not in male, animals. Futurestudies will have to show by which mechanism thesechanges occur in male and female mice carrying thebGH construct.
At the level of the mineralized tissue, GH led to adecrease in density in female and, in particular, in maletransgenic animals. This has been previously reportedby ash analyses of tibial cortical bone in mice with sys-temic GH overexpression47 (MT-bGH transgenic mice),and with µCT in the femora of male transgenic animalswith osteoblast-specific (local) GH overexpression50
(osteocalcin promoter–hGH transgenic mice). The lat-ter authors found a higher porosity of cortical bone byhistomorphometry and a decrease in tissue-level me-chanical properties by biomechanical testing in smallsamples of cortical bone. In a subsequent study,51
the authors observed that an initial boost in bonemass in male GH transgenic mice (9–16 weeks of age)was later (24–30 weeks) followed by bone resorption,
leading to thinner cortices with inferior tissue me-chanical properties. They postulated that the primarybiological perturbation in GH-transgenic mice was theincrease in bone diameter (transverse bone growth),which was then followed by endo- and intracorticalbone resorption due to functional adaptation, lead-ing to a decrease in mid-diaphyseal bone strain. Ourresults extend these findings by showing that thedecrease in mineralized tissue density is presentthroughout the entire mineralized matrix of the bone.It is interesting to note that the decrease in tissue levelproperties was stronger in male transgenic mice, whichdisplayed larger increases in bone cross-sectional areaand volume. It is, however, difficult to dissect thecomplex skeletal changes observed with overexpres-sion of GH into primary (biological) perturbations andsecondary (mechanical) consequences, given the dif-ferences in reaction in male and female mice andthe complex alterations on different hierarchical levelsof the skeletal tissue. Our data suggest that trans-genic analyses of the GH–IGF system should beperformed in both genders, because of possible inter-actions with sex steroids, and at all hierarchical levelsof bone tissue. This will avoid confusion with re-gard to effects on bone density, which can be de-fined at different levels: organ, compartment, tissue andmaterial.52
In conclusion we find that systemic overexpres-sion of GH has no effect on the relative (percent-age of body weight) fat and bone mineral content(total body level). In female mice, GH exerts an-abolic effects on apparent femoral density (organlevel) and, in particular, on trabecular bone density(compartment level), with an increase in bone vol-ume fraction by more than 100%. Structurally, thetrabeculae are thickened in female mice, and theirnumber is increased. Mineralized tissue density, how-ever, is negatively affected both in female and inmale transgenic mice (tissue level). In male animals,there is no net change of apparent and trabecularbone density, with trabecular number being slightlyincreased, but the trabeculae being thinner. Our re-sults show that GH overexpression exerts complexchanges in bone structure that depend on genderand on the hierarchical level of skeletal tissue be-ing investigated. The results are surprising, becauseprevious experimental and clinical studies have sug-gested that high serum levels of GH increase corticalbut not trabecular bone. The inconsistency in bonechanges reported in acromegaly14–19 may be poten-tially caused by variations in measurement location(bones with predominantly trabecular or cortical bone)and by different proportions of both genders in studysamples.

124 F. Eckstein et al.
ACKNOWLEDGEMENTS
We would like to thank Petra Renner for excellent ani-mal care taking and the Medical Faculty of the Ludwig-Maximilians-Universitat, Munich, for funding the highresolution DXA scanner.
REFERENCES
1. Ohlsson C, Bengtsson BA, Isaksson OG, Andreassen TT, SlootwegMC. Growth hormone and bone. Endocr Rev 1998; 19: 55–79.
2. Ohlsson C, Jansson JO, Isaksson O. Effects of growth hormoneand insulin-like growth factor-I on body growth and adult bonemetabolism. Curr Opin Rheumatol 2000; 12: 346–348.
3. Beamer WG, Donahue LR, Rosen CJ. Insulin-like growth factor-Iand bone: from mouse to man. Growth Horm IGF Res 2000; 10(Suppl B): 103–105.
4. Lissett CA, Shalet SM. Effects of growth hormone on bone andmuscle. Growth Horm IGF Res 2000; 10 (Suppl B): 95–101.
5. Johannsson G, Bengtsson BA. Growth hormone and theacquisition of bone mass. Horm Res 1997; 48 (Suppl 5):72–77.
6. Wuster C. Fracture rates in patients with growth hormonedeficiency. Horm Res 2000; 54 (Suppl 1): 31–35.
7. Wuster C, Abs R, Bengtsson BA, et al. The influence of growthhormone deficiency, growth hormone replacement therapy, andother aspects of hypopituitarism on fracture rate and bonemineral density. J Bone Miner Res 2001; 16: 398–405.
8. Harris WH, Heaney RP. Effect of growth hormone on skeletalmass in adult dogs. Nature 1969; 26: 403–404.
9. Inzucchi SE, Robbins RJ. Clinical review: effects of growthhormone on human bone biology. J Clin Endocrinol Metab1994; 79: 691–694.
10. Murray RD, Shalet SM. Growth hormone: current and futuretherapeutic applications. Expert Opin Pharmacother 2000; 1:975–990.
11. Turner RT. Effects of short-term spaceflight and recombinanthuman growth hormone (rhGH) on bone growth in young rats.Aviat Space Environ Med 1995; 66: 763–769.
12. Andreassen TT, Jorgensen PH, Flyvbjerg A, Orskov H, Oxlund H.Growth hormone stimulates bone formation and strength ofcortical bone in aged rats. J Bone Miner Res 1995; 10:1057–1067.
13. Andreassen TT, Melsen F, Oxlund H. The influence of growthhormone on cancellous and cortical bone of the vertebral bodyin aged rats. J Bone Miner Res 1996; 11: 1094–1102.
14. Halse J, Melsen F, Mosekilde L. Iliac crest bone mass andremodelling in acromegaly. Acta Endocrinol 1981; 97:18–22.
15. Ho PJ, Fig LM, Barkan AL, Shapiro B. Bone mineral density of theaxial skeleton in acromegaly. J Nucl Med 1992; 33:1608–1612.
16. Hubsch P, Kotzmann H, Svoboda T, Kainberger FM, Bankier A,Seidl G. Bone density of the lumbar spine and femur inacromegaly. Radiologe 1993; 33: 457–461.
17. Kotzmann H, Bernecker P, Hubsch P, et al. Bone mineral densityand parameters of bone metabolism in patients with acromegaly.J Bone Miner Res 1993; 8: 459–465.
18. Jockenhovel F, Rohrbach S, Deggerich S, Reinwein D, Reiners C.Differential presentation of cortical and trabecular peripheralbone mineral density in acromegaly. Eur J Med Res 1996; 24:377–382.
19. Kayath MJ, Vieira JG. Osteopenia occurs in a minority of patients
with acromegaly and is predominant in the spine. OsteoporosisInt 1997; 7: 226–230.
20. Bolanowski M, Wielgus W, Milewicz A, Marciniak R. Axial bonemineral density in patients with acromegaly. Acad Radiol 2000;7: 592–594.
21. Rosen HN, Chen V, Citadini A, et al. Treatment with growthhormone and IGF-1 in growing rats increases bone mineralcontent but not bone mineral density. J Bone Miner Res 1995;10: 1352–1358.
22. Lochmuller EM, Miller P, Burklein D, Wehr U, Rambeck W,Eckstein F. In situ femoral dual-energy X-ray absorptiometryrelated to ash weight, bone size and density, and its relationshipwith mechanical failure loads of the proximal femur.Osteoporosis Int 2000; 11: 361–367.
23. Rudman D, Kutner MH, Rogers CM, Lubin MF, Fleming GA,Bain RP. Impaired growth hormone secretion in the adultpopulation: relation to age and adiposity. J Clin Invest 1981; 67:1361–1369.
24. Wuster C, Harle U, Rehn U, et al. Benefits of growth hormonetreatment on bone metabolism, bone density and bone strengthin growth hormone deficiency and osteoporosis. Growth HormIGF Res 1998; 8 (Suppl A): 87–94.
25. Rosen CJ. Pathophysiology of osteoporosis. Clin Lab Med 2000;20: 455–468.
26. Marcus R. Anabolic therapies. Clin Lab Med 2000; 20:623–637.
27. Rosen CJ, Bilezikian JP. Clinical review 123: anabolic therapy forosteoporosis. J Clin Endocrinol Metab 2001; 86: 957–964.
28. Bengtsson BA, Johannsson G. The use of growth hormone inadults: a review of the last 10 years, the present and aperspective for the future. Growth Horm IGF Res 1998;8 (Suppl B): 27–35.
29. Palmiter RD, Brinster RL, Hammer RE, et al. Dramatic growth ofmice that develop from eggs microinjected with metallothioneingrowth hormone fusion genes. Nature 1982; 300:611–615.
30. Brem G, Wanke R, Wolf E, et al. Multiple consequences of humangrowth hormone expression in transgenic mice. Mol Biol Med1989; 6: 531–554.
31. Wolf E, Kahnt E, Ehrlein J, Hermanns W, Brem G, Wanke R.Effects of long-term elevated serum levels of growth hormoneon life expectancy of mice: lessons from transgenic animalmodels. Mech Ageing Dev 1993; 68: 71–87.
32. Wolf E, Rapp K, Wanke R, et al. Growth characteristics ofmetallothionein-human growth hormone transgenic mice ascompared to mice selected for high eight-week body weight andunselected controls. II. Skeleton. Growth Dev Aging 1991; 55:237–248.
33. Naar EM, Bartke A, Majumdar SS, et al. Fertility of transgenicfemale mice expressing bovine growth hormone or humangrowth hormone variant genes. Biol Reprod 1991; 45:178–187.
34. Lochmuller E-M, JungV, Weusten A, WehrU, Wolf E, Eckstein F.Precision of high-resolution dual energy X-ray absorptiometrymeasurements of bone mineral status and body composition insmall animal models. Eur Cells Mater 2001; 1: 43–51.
35. Hildebrand T, Laib A, Muller R, Dequeker J, Ruegsegger P. Directthree-dimensional morphometric analysis of human cancellousbone: microstructural data from spine, femur, iliac crest, andcalcaneus. J Bone Miner Res 1999; 14: 1167–1174.
36. Stammberger T, Eckstein F, Englmeier K-H, Reiser M.Determination of 3D cartilage thickness data from MRimaging – computational method and reproducibility in theliving. Magn Reson Med 1999; 41: 529–536.
Skeletal changes in GH-transgenic mice 125
37. Jilka RL, Weinstein RS, Takahashi K, Parfitt AM, Manolagas SC.Linkage of decreased bone mass with impairedosteoblastogenesis in a murine model of accelerated senescence.J Clin Invest 1996; 97: 1732–1740.
38. Klein RF, Mitschell SR, Phillips TJ, Belknap JK, Orwell ES.Quantitative trait loci affecting peak bone mineral density inmice. J Bone Miner Res 1998; 13: 1648–1656.
39. Nagy TR, Clair A-L. Precision and accuracy of dual-energy X-rayabsoprtiometry for determining in vivo body composition ofmice. Obes Res 2000; 8: 392–398.
40. Svendsen OL, Hassager C, Skodt V, Christiansen C. Impact of softtissue on in vivo accuracy of bone mineral measurements in thespine, hip, and forearm: a human cadaver study. J Bone MinerRes 1995; 10: 868–873.
41. Lochmuller EM, Krefting N, Burklein D, Eckstein F. Effect offixation, soft-tissues and scan projection on bone mineralmeasurements with dual energy X-ray absorptiometry (DXA).Calcif Tissue Int 2001; 68: 140–145.
42. Muller R, Van Campenhout H, Van Damme B, et al.Morphometric analysis of human bone biopsies: a quantitativestructural comparison of histological sections andmicro-computed tomography. Bone 1998; 23: 59–66.
43. Li XJ, Muller R, Stevens ML, Golden J, Seeherman H,Bouxsein ML. Evaluation of trabecular bone morphometry:comparison of micro-computed tomography andhistomorphometry. Bone 1998; 23: 59–66.
44. Asada N, Takahashi Y, Honjo M. Effects of 22K or 20K humangrowth hormone on lipolysis, leptin production in adipocytes inthe presence and absence of human growth hormone bindingprotein. Horm Res 2000; 54: 203–207.
45. Ng FM, Sun J, Sharma L, Libinaka R, Jiang WJ, Gianello R.Metabolic studies of a synthetic lipolytic domain (AOD9604) ofhuman growth hormone. Horm Res 2000; 53: 274–278.
46. Carrel AL, Allen DB. Effects of growth hormone on bodycomposition and bone metabolism. Endocrine 2000; 12:163–172.
47. Sandstedt J, Tornell J, Norjavaara E, Isaksson OG, Ohlsson C.Elevated levels of growth hormone increase bone mineralcontent in normal young mice, but not in ovariectomized mice.Endocrinology 1996; 137: 3368–3374.
48. Sandstedt J, Ohlsson C, Norjavaara E, Nilsson J, Tornell J.Disproportional bone growth and reduced weight gain ingonadectomized male bovine growth hormone transgenic andnormal mice. Endocrinology 1994; 135: 2574–2580.
49. Graichen H, Lochmuller EM, Wolf E, et al. A non-destructivetechnique for 3-D microstructural phenotypic characterisationof bones in genetically altered mice – preliminary data in growthhormone transgenic animals and normal controls. Anat Embryol1999; 199: 239–248.
50. Tseng KF, Bonadio JF, Stewart TA, Baker AR, Goldstein SA. Localexpression of human growth hormone in bone results inimpaired mechanical integrity in the skeletal tissue oftransgenic mice. J Orthop Res 1996; 14: 598–604.
51. Tseng KF, Goldstein SA. Systemic over-secretion of growthhormone in transgenic mice results in a specific pattern ofskeletal modeling and adaptation. J Bone Miner Res 1998; 13:706–715.
52. Rauch F, Schoenau E. Changes in bone density during childhoodand adolescence: an approach based on bone’s biologicalorganization. J Bone Miner Res 2001; 16: 597–604.