BODY AND LIMB SIZE DISSOCIATION AT THE ORIGIN OF BIRDS: UNCOUPLING ALLOMETRIC CONSTRAINTS ACROSS A...
12
ORIGINAL ARTICLE doi:10.1111/evo.12150 BODY AND LIMB SIZE DISSOCIATION AT THE ORIGIN OF BIRDS: UNCOUPLING ALLOMETRIC CONSTRAINTS ACROSS A MACROEVOLUTIONARY TRANSITION T. Alexander Dececchi 1,2 and Hans C. E. Larsson 3 1 Biology Department, University of South Dakota, 414 E Clark Street, Vermillion, South Dakota 57069 2 E-mail: [email protected] 3 Redpath Museum, McGill University, 859 Sherbrooke Street West, Montreal, Quebec H3A 2K6 089457 Received May 30, 2012 Accepted April 17, 2013 The origin of birds and powered flight is a classic major evolutionary transition. Research on their origin often focuses on the evolution of the wing with trends of forelimb elongation traced back through many nonavian maniraptoran dinosaurs. We present evidence that the relative forelimb elongation within avian antecedents is primarily due to allometry and is instead driven by a reduction in body size. Once body size is factored out, there is no trend of increasing forelimb length until the origin of birds. We report that early birds and nonavian theropods have significantly different scaling relationships within the forelimb and hindlimb skeleton. Ancestral forelimb and hindlimb allometric scaling to body size is rapidly decoupled at the origin of birds, when wings significantly elongate, by evolving a positive allometric relationship with body size from an ancestrally negative allometric pattern and legs significantly shorten by keeping a similar, near isometric relationship but with a reduced intercept. These results have implications for the evolution of powered flight and early diversification of birds. They suggest that their limb lengths first had to be dissociated from general body size scaling before expanding to the wide range of fore and hindlimb shapes and sizes present in today’s birds. KEY WORDS: Allometry, aves, constraint, macroevolution, theropoda.. The history of vertebrates is marked by several major evolution- ary transitions where the generation of novel functions and/or ecologies are due to large-scale alterations of the limb skeleton (e.g., origin of tetrapods, whales, snakes; Hall 2007). Plesiomor- phically tetrapods are suspected to have had their limb evolv- ability restricted by developmental constraints linking the entire fore and hindlimbs and individual segments (stylo-, zeugo-, and autopodium) to one another and across each limb (Capdevila and Izpis ´ ua Belmonte 2000; Young and Hallgr´ ımsson 2005). De- coupling these modules is central to dramatically altering limb phenotypes and permitting functional specialization and diversi- fication (Schmidt and Fischer 2009; Young et al. 2010; Bell and Goswami 2011). The origin of birds and powered flight presents a case where a lineage evolved a novel locomotory mode with di- vergent functional demands that may have been strong enough to break ancestral developmental covariation patterns in the limbs. Extant birds have remarkable variation in limb proportions (Zeffer et al. 2003). This variation has been suggested to be the result of its dissociation from the tail (Gatesy and Middleton 1997) and its reorientation to support an anteriorly shifted center of mass (Gatesy 2002), whereas forelimb variation is associated with different flight locomotory modes and relaxed selection in flightless birds (Middleton and Gatesy 2000). Bird ancestry lies in theropod dinosaurs and the fossil record of this transition has expanded greatly in recent years (Padian and Chiappe 1998; Xu et al. 2010a). Nonavian theropods spanned 1 C 2013 The Author(s). Evolution
-
Upload
independent -
Category
Documents
-
view
6 -
download
0
Transcript of BODY AND LIMB SIZE DISSOCIATION AT THE ORIGIN OF BIRDS: UNCOUPLING ALLOMETRIC CONSTRAINTS ACROSS A...

ORIGINAL ARTICLE
doi:10.1111/evo.12150
BODY AND LIMB SIZE DISSOCIATION AT THEORIGIN OF BIRDS: UNCOUPLING ALLOMETRICCONSTRAINTS ACROSS AMACROEVOLUTIONARY TRANSITIONT. Alexander Dececchi1,2 and Hans C. E. Larsson3
1Biology Department, University of South Dakota, 414 E Clark Street, Vermillion, South Dakota 570692E-mail: [email protected]
3Redpath Museum, McGill University, 859 Sherbrooke Street West, Montreal, Quebec H3A 2K6 089457
Received May 30, 2012
Accepted April 17, 2013
The origin of birds and powered flight is a classic major evolutionary transition. Research on their origin often focuses on the
evolution of the wing with trends of forelimb elongation traced back through many nonavian maniraptoran dinosaurs. We present
evidence that the relative forelimb elongation within avian antecedents is primarily due to allometry and is instead driven by a
reduction in body size. Once body size is factored out, there is no trend of increasing forelimb length until the origin of birds. We
report that early birds and nonavian theropods have significantly different scaling relationships within the forelimb and hindlimb
skeleton. Ancestral forelimb and hindlimb allometric scaling to body size is rapidly decoupled at the origin of birds, when wings
significantly elongate, by evolving a positive allometric relationship with body size from an ancestrally negative allometric pattern
and legs significantly shorten by keeping a similar, near isometric relationship but with a reduced intercept. These results have
implications for the evolution of powered flight and early diversification of birds. They suggest that their limb lengths first had to
be dissociated from general body size scaling before expanding to the wide range of fore and hindlimb shapes and sizes present
in today’s birds.
KEY WORDS: Allometry, aves, constraint, macroevolution, theropoda..
The history of vertebrates is marked by several major evolution-
ary transitions where the generation of novel functions and/or
ecologies are due to large-scale alterations of the limb skeleton
(e.g., origin of tetrapods, whales, snakes; Hall 2007). Plesiomor-
phically tetrapods are suspected to have had their limb evolv-
ability restricted by developmental constraints linking the entire
fore and hindlimbs and individual segments (stylo-, zeugo-, and
autopodium) to one another and across each limb (Capdevila
and Izpisua Belmonte 2000; Young and Hallgrımsson 2005). De-
coupling these modules is central to dramatically altering limb
phenotypes and permitting functional specialization and diversi-
fication (Schmidt and Fischer 2009; Young et al. 2010; Bell and
Goswami 2011). The origin of birds and powered flight presents
a case where a lineage evolved a novel locomotory mode with di-
vergent functional demands that may have been strong enough to
break ancestral developmental covariation patterns in the limbs.
Extant birds have remarkable variation in limb proportions
(Zeffer et al. 2003). This variation has been suggested to be the
result of its dissociation from the tail (Gatesy and Middleton
1997) and its reorientation to support an anteriorly shifted center
of mass (Gatesy 2002), whereas forelimb variation is associated
with different flight locomotory modes and relaxed selection in
flightless birds (Middleton and Gatesy 2000).
Bird ancestry lies in theropod dinosaurs and the fossil record
of this transition has expanded greatly in recent years (Padian
and Chiappe 1998; Xu et al. 2010a). Nonavian theropods spanned
1C© 2013 The Author(s).Evolution

T. A. DECECCHI AND H. C. E. LARSSON
6000
5000
4000
3000
2000
1000
Sau
richi
a
Ther
opod
a
Neo
ther
opod
a
Neo
ther
opod
a I
Neo
ther
opod
a II
Aver
ostra
Teta
nura
e
Avet
hero
poda
Coe
luro
saur
ia
Coe
luro
saur
ia I
Coe
luro
saur
ia II
Mai
rapt
orifo
rmes
Man
irapt
ora
Man
irapt
ora
I
Man
irapt
ora
II
Man
irapt
ora
III
Par
aves
A via
lae
Aves
Aves
I
A ves
II
Pyg
osty
lia
Orn
ithur
omor
pha
Aves
III
SV
L (m
m)
clades
Figure 1. Evolution of body size in Theropoda. SVLs for individual theropod lineages (boxplots) and nodes (dashed line, closed circles
for nonavian theropod clades, open circles for avian clades) between Theropoda and Aves are plotted along the phylogenetic backbone
from Theropoda to Ornithuromorpha. Data are given in Table 1 and Table S1 and the phylogeny is based on Figure S1(B). Silhouettes of
Allosaurus, Citipati, and Archaeopteryx are shown to relative scale.
four orders of magnitude in body size, with species masses es-
timated to range from less than 1 kg to greater than 5000 kg
(Turner et al. 2007; Hutchinson et al. 2011; Fig. 1). A pattern
of body size reduction has been described within coelurosaurian
theropods preceding the origin of birds (Carrano 2006; Turner et
al. 2007). Coincident with this size, reduction is an apparent trend
of forelimb elongation within maniraptoran theropods (Chatterjee
and Templin 2004; Bybee and Lee 2006; Novas et al. 2009; Xu
et al. 2011) that continued into the earliest avians, which had rel-
atively longer and more robust forelimbs than nonavian theropod
antecedents (Zhou and Zhang 2003; Xu et al. 2011). Prey capture
has been suggested to have been the adaptive driver of forelimb
elongation within the clade (Ostrom 1969; Carpenter 2002; Senter
2006), with the flight stroke ultimately derived from this function
(Padian and Chiappe 1998). Arboreality has also been proposed
as a driver for forelimb elongation (Chatterjee and Templin 2004;
Xu et al. 2010a), although no evidence for arboriality is present
in the hindlimbs (Dececchi and Larsson 2011). Regardless of the
favored scenario, all maintain that directed selection drove fore-
limb elongation in avian antecedents and was later exapted to
perform as a sufficiently sized aerofoil, permitting the evolution
of powered flight (Chatterjee and Templin 2004).
Given the degree body size influences estimates of extant
systematic and functional relationships (Schmidt-Nielsen 1984;
Gilbert et al. 2009), allometry must be examined and accounted
for before any long-term adaptive trends across the origin of birds
are proposed. This is not to say that allometric relationships are
not adaptive (Bertram and Biewener 1990), but rather that sig-
nificant divergences from a historical allometry imply a focused
evolutionary change (e.g., Thorington and Santana 2007; Young
et al. 2010). Understanding the allometric biases of limb propor-
tions is fundamental to creating testable hypothesis to determine
the evolutionary drivers of the nonavian theropod to bird transi-
tion. We use a large compilation of new fossil data to examine the
evolution of limb lengths and body size across the origin of birds
to identify significant nonallometric evolutionary changes that
2 EVOLUTION 2013
BODY AND LIMB SIZE DISSOCIATION AT THE ORIGIN OF BIRDS
could be associated with the decoupling of the ancestral theropod
developmental and functional regimes.
Materials and MethodsMEASUREMENTS
Two datasets of fossil measurements were used. The first included
67 nonavian theropods and basal birds’ specimens representing
53 different genera. Complete skull and precaudal vertebral series
were obtained from the literature, personal communications, and
personal measurements (see electronic Supporting Information).
All but 17 are considered adults. The avian Dalianraptor was not
included with the phylogenetic analysis, because its relationship
within Aves is uncertain (O’Connor et al. 2011). Representative
taxa from all major clades, with the exception of Therizinosauria,
were included. Therizinosaurs were excluded due to the lack of
any sufficiently complete single individual specimens. Individual
bone lengths and four composite measurements were used: snout–
vent lengths (SVLs) (skull plus cervical plus trunk lengths), trunk
length (dorsal vertebral series plus sacral series lengths), total
forelimb (humerus plus radius plus metacarpal II lengths), and to-
tal hindlimb (femur plus tibia plus metatarsal III lengths). The sec-
ond dataset of 132 species including incomplete specimens was
used to increase sampling within Theropoda (see electronic Sup-
porting Information). This taxon set included six therizinosaurs
to completely survey all major nonavian theropod clades. SVLs
for specimens without completely preserved precaudal vertebral
series in our larger dataset were estimated using the four lengths
that had the strongest correlation with body size or through com-
parisons to related taxa with known measurements (see Results
section and electronic Supporting Information).
TAXONOMY OF BIRDS
We use the taxonomic terms Aves and Avialae as per Zhang
et al. (2008). Avialae includes all maniraptoran theropods closer
to modern birds than Deinonychus antirrhopus, whereas Aves is
the clade containing the last common ancestor of Archaeopteryx
lithographica and Vultur gryphus.
JUSTIFICATION OF SVL
Snout–vent length was used to standardize body size in our analy-
sis to avoid the confounding effects of nonallometric adaptations
in limb lengths associated with functional differences (Norberg
1979; Thorington and Heaney 1981; Kohlsdorf et al. 2001; Zef-
fer et al. 2003; Samuels and van Valkenburgh 2008; Bell and
Chiappe 2011; Dececchi and Larsson 2011). In neontological
studies, these differences are assessed after the limb has been
standardized against a measure of body size, either body mass or
a body length, such as SVL, which are highly correlated to each
other (Thorington and Heaney 1981; Hutton 1987; Deichmann
et al. 2008; Meiri 2010).
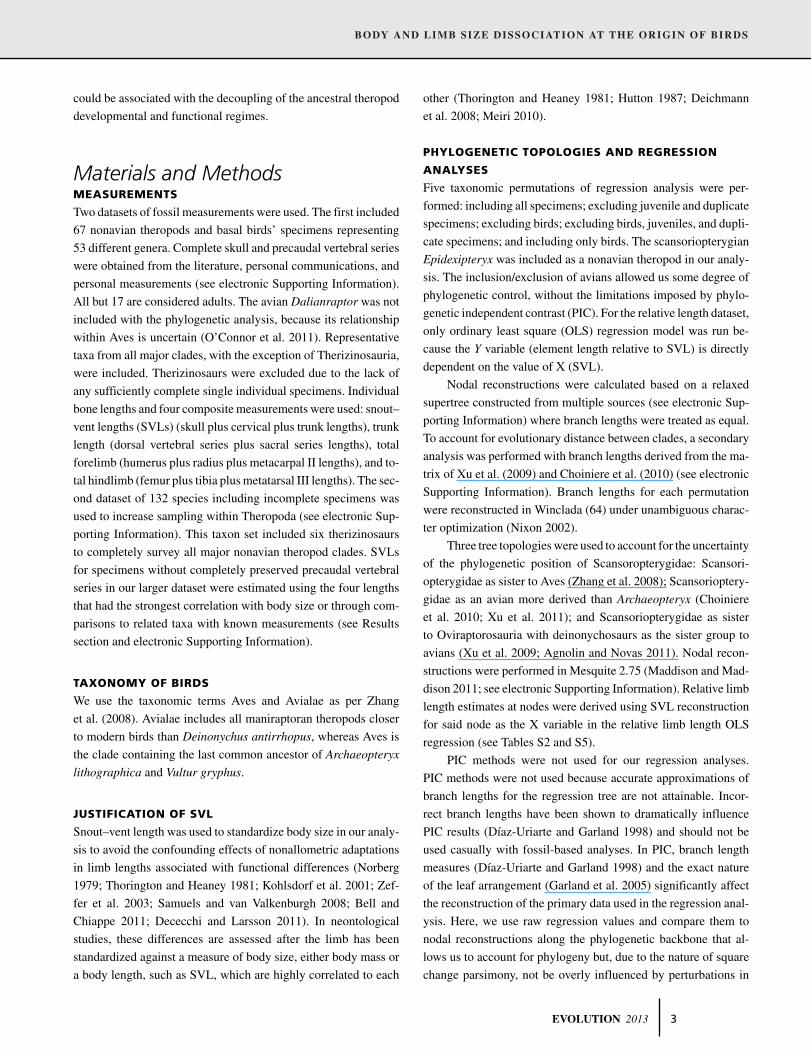
PHYLOGENETIC TOPOLOGIES AND REGRESSION
ANALYSES
Five taxonomic permutations of regression analysis were per-
formed: including all specimens; excluding juvenile and duplicate
specimens; excluding birds; excluding birds, juveniles, and dupli-
cate specimens; and including only birds. The scansoriopterygian
Epidexipteryx was included as a nonavian theropod in our analy-
sis. The inclusion/exclusion of avians allowed us some degree of
phylogenetic control, without the limitations imposed by phylo-
genetic independent contrast (PIC). For the relative length dataset,
only ordinary least square (OLS) regression model was run be-
cause the Y variable (element length relative to SVL) is directly
dependent on the value of X (SVL).
Nodal reconstructions were calculated based on a relaxed
supertree constructed from multiple sources (see electronic Sup-
porting Information) where branch lengths were treated as equal.
To account for evolutionary distance between clades, a secondary
analysis was performed with branch lengths derived from the ma-
trix of Xu et al. (2009) and Choiniere et al. (2010) (see electronic
Supporting Information). Branch lengths for each permutation
were reconstructed in Winclada (64) under unambiguous charac-
ter optimization (Nixon 2002).
Three tree topologies were used to account for the uncertainty
of the phylogenetic position of Scansoropterygidae: Scansori-
opterygidae as sister to Aves (Zhang et al. 2008); Scansorioptery-
gidae as an avian more derived than Archaeopteryx (Choiniere
et al. 2010; Xu et al. 2011); and Scansoriopterygidae as sister
to Oviraptorosauria with deinonychosaurs as the sister group to
avians (Xu et al. 2009; Agnolin and Novas 2011). Nodal recon-
structions were performed in Mesquite 2.75 (Maddison and Mad-
dison 2011; see electronic Supporting Information). Relative limb
length estimates at nodes were derived using SVL reconstruction
for said node as the X variable in the relative limb length OLS
regression (see Tables S2 and S5).
PIC methods were not used for our regression analyses.
PIC methods were not used because accurate approximations of
branch lengths for the regression tree are not attainable. Incor-
rect branch lengths have been shown to dramatically influence
PIC results (Dıaz-Uriarte and Garland 1998) and should not be
used casually with fossil-based analyses. In PIC, branch length
measures (Dıaz-Uriarte and Garland 1998) and the exact nature
of the leaf arrangement (Garland et al. 2005) significantly affect
the reconstruction of the primary data used in the regression anal-
ysis. Here, we use raw regression values and compare them to
nodal reconstructions along the phylogenetic backbone that al-
lows us to account for phylogeny but, due to the nature of square
change parsimony, not be overly influenced by perturbations in
EVOLUTION 2013 3

T. A. DECECCHI AND H. C. E. LARSSON
distal branch while reducing the “averaging” effect that may di-
lute a signal in ancestor-descendant pairs along a tree (Carrano
2006). As our trend analysis concentrated on the backbone nodes,
inconsistencies in branch lengths of tips or perturbations of leaf
arrangement were not a significant factor in influencing the clade
to clade relationships that are the core of our results (see Support-
ing Information for comparison of nodal reconstructions under all
branch length models).
Although the use of morphological character changes as a
proxy for branch length is controversial (given the problems of in-
dependence, large degrees of missing data, and unequal sampling
through the taxon set), we use them here on nodal reconstruc-
tions only to provide a range of values and to insure that specific
topologies do not constrain the implication of our results. In a
PIC regression, these challenges to the character count as branch
length provide not just a series of hypothesis to test against regres-
sion values, but a potentially highly significant bias to regression
values (Dıaz-Uriarte and Garland 1998).
Other methods of obtaining branch lengths for PIC such as
stratigraphic distances are hindered by the fact that most of the
taxa included here come from only four localities, due to preserva-
tion biases. In addition, the oldest coelurosaurian theropod, Epi-
dexipteryx at approximately 162–168 million years old (Zhang
et al. 2008), is also one of the most derived and single handedly
collapses all major branches within Coelurosauria to this age. A
final possible solution to the PIC branch length challenge is us-
ing all branch lengths equal to 1, yet this too has its own severe
problems. For example, branches to each of the two species of Mi-
croraptor, which are from the same geological formation, would
be equivalent to the branch leading to Buitreraptor, a taxon sep-
arated from its sister group in this analysis by at least 90 million
years, based on the Laurasian–Gondwana split dates (Torsvik et
al. 2012) as stated in Makovicky et al. (2005). Another compli-
cation is the underlying trend in body size reduction toward node
Aves, which potentially biases the results of a PIC analysis (Gar-
land et al. 2005). Evidence for this is a nonzero slope of absolute
values of standardized contrasts versus their standard deviations
in the main dataset when both missing taxa and polytomies are
accounted for in the analysis (results not shown).
ResultsCORRELATIONS
In general, limb lengths are strongly and significantly correlated
with SVL (Fig. 2; Table 1; electronic Supporting Information).
With the sole exception of the metatarsus in the avian only anal-
ysis, all hindlimb elements have higher coefficients of determi-
nation (r2 of 0.9 or greater) than any in the forelimb (r2 of 0.55
or greater). There is a decrease in correlation proximodistally
in the forelimb, and between the femur and metatarsus in the
hindlimb. Overall, avian forelimb lengths show a positive allo-
metric scaling value versus SVL (slope = 1.28) and are signif-
icantly higher than that of nonavian theropods (slope = 0.70;
Fig. 2C). In the hindlimb, avian and the total nonavian theropod
datasets have scaling values that are similar (slope = 0.96 and
0.88, respectively). When only similar-sized avian and nonavian
theropods are compared (∼350 mm SVL and smaller), the latter
shows a much higher slope (LogHL = 1.1267 [±0.2418] LogSVL
−0.38045 [±0.33125], n = 12, r2 = 0.54). Using the total nona-
vian theropod dataset, the marked lower than expected values in
most avian taxa (average difference −24%) is likely due to the
difference in the intercept between the two regressions (nonavian
theropods = 0.1974 ± 0.007, avians = −0.0712 ± 0.023).
As suggested in previous studies (Farina and Christiansen
2004; Therrien and Henderson 2007), femur and skull lengths are
significantly correlated with body size. In addition, the scapula
and ilium both show r2 values of 0.93 or greater under all per-
mutations, except in the avian only dataset (Table 1; electronic
Supporting Information). The strong correlation between scapu-
lar length and SVL is not due to passive effects of the scapula
being bound to the forelimb as under all five permutations the
scapula records higher correlation coefficients. Partial correlation
analysis found that scapular length shows a stronger association to
SVL or femur length than either humeral of total forelimb length
in theropods, including or excluding birds (Table 2; electronic
Supporting Information).
RELATIVE LIMB LENGTHS
Relative measurements of the forelimb against SVL show higher
correlation values, and significantly higher slopes than the
hindlimb (Table 1; electronic Supporting Information). When
avians are excluded, regression analysis shows stronger correla-
tions than when avians are included. Direct comparisons between
avian and Deinonychosauria of similar SVL indicate that the latter
have significantly longer hindlimbs, both in relative and absolute
terms. Small-bodied paravians had relative hindlimb lengths (83–
104% SVL, mean 94%) that were significantly longer than those
of avians of a similar body size (59–86% mean = 68%; uneq var.
T-test = 8.839, P(same) < 0.0001). Other small-bodied (SVL
less than 500 mm) nonparavian theropods did not have similarly
elongated hindlimbs. Both Microraptor sp. and Anchiornis had
relative levels of forelimb elongation (60–72% of SVL) equal to
those present in the basal birds Archaeopteryx and Confuciusor-
nis (see electronic Supporting Information). These paravian taxa
show level of forelimb elongation that is not significantly different
from the avian dataset.
To account for the possibility that there were errors in our
SVL reconstructions, we ran a complimentary analysis using
humeral to femur ratios (H:F) and residuals from regression of
4 EVOLUTION 2013

BODY AND LIMB SIZE DISSOCIATION AT THE ORIGIN OF BIRDS
Log SVL
Log
Hin
dlim
b
1.75 2.00 2.25 2.50 2.75 3.00 3.25 3.50 3.751.50
1.75
2.00
2.25
2.50
2.75
3.00
3.25
3.50
3.75
Log
Fore
limb
1.75 2.00 2.25 2.50 2.75 3.00 3.25 3.50 3.75
1.60
1.76
1.92
2.08
2.24
2.40
2.56
2.72
2.88
Log SVL
1.2 1.5 1.8 2.1 2.4 2.7 3 3.3 3.6 3.9
1.2
1.5
1.8
2.1
2.4
2.7
3.3
3.6
3.9
1.2 1.5 1.8 2.1 2.4 2.7 3 3.3 3.6 3.9
Log SVL
1.2
1.5
1.8
2.1
2.4
2.7
3
3.3
3.6
3.9
Log
Ele
men
t len
gth
B
1.2 1.5 1.8 2.1 2.4 2.7 3 3.3 3.6 3.91
1.25
1.5
1.75
2
2.25
2.5
2.75
3
3.25
Log SVL
Log
Ele
men
t len
gth
A C
D
Figure 2. Regressions of theropod forelimb and hindlimb bones against SVL. Log-log reduced major axis regressions of limb bone length
versus SVL for all specimens used here, forelimb data are presented in (A) and hindlimb data in (B). Red denotes the stylopodial element
(humerus and femur), blue the entire limb length, and black the girdle elements (scapula and ilium). Open squares denote birds, triangles
represent paravians (deinonychosaurs), and all other nonavian theropods are circles. Due to its uncertain affinities, Epidexipteryx is
denoted by a filled circle. (C) and (D) compare nonavian (solid line) versus avian (dashed line) forelimb (C) and hindlimb (D) regressions
using all measured individuals for each category. Open squares denote avians specimens, while closed circles nonavian theropods.
H on F length for 95 nonjuvenile taxa (see electronic Supporting
Information). These scores were mapped onto the larger uniform
dataset (Fig. 3; electronic Supporting Information). Although the
H:F ratio analysis shows a trend of increasing values within Mani-
raptora (Fig. 3A), the residual value shows no pattern until Aves
(Fig. 3B).
PHYLOGENETIC RECONSTRUCTIONS
All permutations and branch length settings revealed a strong sig-
nal of body size reduction within Coelurosauria (see electronic
Supporting Information). Nodal reconstructions are broadly sim-
ilar across topologies and datasets. The SVL of node Paraves
is reconstructed at approximately 350 and 500 mm, and node
EVOLUTION 2013 5
T. A. DECECCHI AND H. C. E. LARSSON
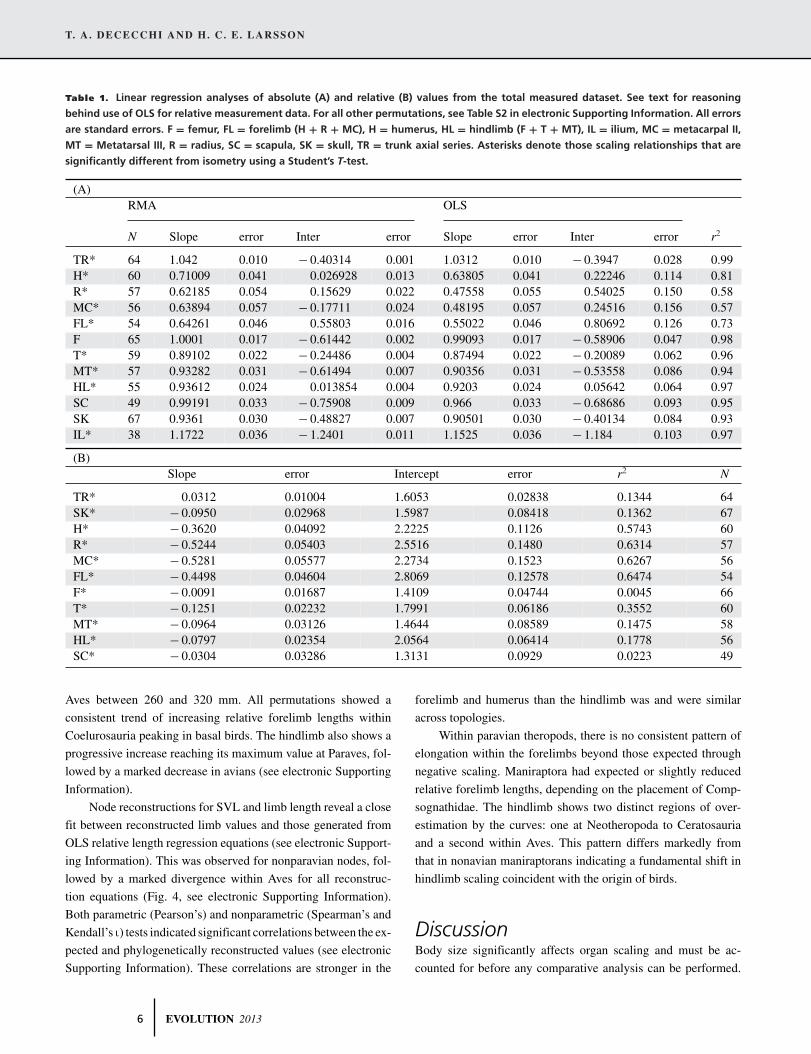
Table 1. Linear regression analyses of absolute (A) and relative (B) values from the total measured dataset. See text for reasoning
behind use of OLS for relative measurement data. For all other permutations, see Table S2 in electronic Supporting Information. All errors
are standard errors. F = femur, FL = forelimb (H + R + MC), H = humerus, HL = hindlimb (F + T + MT), IL = ilium, MC = metacarpal II,
MT = Metatarsal III, R = radius, SC = scapula, SK = skull, TR = trunk axial series. Asterisks denote those scaling relationships that are
significantly different from isometry using a Student’s T-test.
(A)RMA OLS
N Slope error Inter error Slope error Inter error r2
TR* 64 1.042 0.010 − 0.40314 0.001 1.0312 0.010 − 0.3947 0.028 0.99H* 60 0.71009 0.041 0.026928 0.013 0.63805 0.041 0.22246 0.114 0.81R* 57 0.62185 0.054 0.15629 0.022 0.47558 0.055 0.54025 0.150 0.58MC* 56 0.63894 0.057 − 0.17711 0.024 0.48195 0.057 0.24516 0.156 0.57FL* 54 0.64261 0.046 0.55803 0.016 0.55022 0.046 0.80692 0.126 0.73F 65 1.0001 0.017 − 0.61442 0.002 0.99093 0.017 − 0.58906 0.047 0.98T* 59 0.89102 0.022 − 0.24486 0.004 0.87494 0.022 − 0.20089 0.062 0.96MT* 57 0.93282 0.031 − 0.61494 0.007 0.90356 0.031 − 0.53558 0.086 0.94HL* 55 0.93612 0.024 0.013854 0.004 0.9203 0.024 0.05642 0.064 0.97SC 49 0.99191 0.033 − 0.75908 0.009 0.966 0.033 − 0.68686 0.093 0.95SK 67 0.9361 0.030 − 0.48827 0.007 0.90501 0.030 − 0.40134 0.084 0.93IL* 38 1.1722 0.036 − 1.2401 0.011 1.1525 0.036 − 1.184 0.103 0.97
(B)Slope error Intercept error r2 N
TR* 0.0312 0.01004 1.6053 0.02838 0.1344 64SK* − 0.0950 0.02968 1.5987 0.08418 0.1362 67H* − 0.3620 0.04092 2.2225 0.1126 0.5743 60R* − 0.5244 0.05403 2.5516 0.1480 0.6314 57MC* − 0.5281 0.05577 2.2734 0.1523 0.6267 56FL* − 0.4498 0.04604 2.8069 0.12578 0.6474 54F* − 0.0091 0.01687 1.4109 0.04744 0.0045 66T* − 0.1251 0.02232 1.7991 0.06186 0.3552 60MT* − 0.0964 0.03126 1.4644 0.08589 0.1475 58HL* − 0.0797 0.02354 2.0564 0.06414 0.1778 56SC* − 0.0304 0.03286 1.3131 0.0929 0.0223 49
Aves between 260 and 320 mm. All permutations showed a
consistent trend of increasing relative forelimb lengths within
Coelurosauria peaking in basal birds. The hindlimb also shows a
progressive increase reaching its maximum value at Paraves, fol-
lowed by a marked decrease in avians (see electronic Supporting
Information).
Node reconstructions for SVL and limb length reveal a close
fit between reconstructed limb values and those generated from
OLS relative length regression equations (see electronic Support-
ing Information). This was observed for nonparavian nodes, fol-
lowed by a marked divergence within Aves for all reconstruc-
tion equations (Fig. 4, see electronic Supporting Information).
Both parametric (Pearson’s) and nonparametric (Spearman’s and
Kendall’s ι) tests indicated significant correlations between the ex-
pected and phylogenetically reconstructed values (see electronic
Supporting Information). These correlations are stronger in the
forelimb and humerus than the hindlimb was and were similar
across topologies.
Within paravian theropods, there is no consistent pattern of
elongation within the forelimbs beyond those expected through
negative scaling. Maniraptora had expected or slightly reduced
relative forelimb lengths, depending on the placement of Comp-
sognathidae. The hindlimb shows two distinct regions of over-
estimation by the curves: one at Neotheropoda to Ceratosauria
and a second within Aves. This pattern differs markedly from
that in nonavian maniraptorans indicating a fundamental shift in
hindlimb scaling coincident with the origin of birds.
DiscussionBody size significantly affects organ scaling and must be ac-
counted for before any comparative analysis can be performed.
6 EVOLUTION 2013

BODY AND LIMB SIZE DISSOCIATION AT THE ORIGIN OF BIRDS
Table 2. Partial correlation scores comparing strength of corre-
lation of the scapula (SC) to body size as represented by SVL(A)
or F(B), Humerus (H), and Forelimb (FL) for all specimen database
(N = 4). All data were logged before analysis was performed. Verti-
cal values below the X denote r score, and horizontal values above
the X denote probability that two elements are not correlated. For
all other permutations, see Table S3 in electronic Supporting Infor-
mation.
(A)SVL SC H FL
SVL X 0.0000 0.0012 0.0002SC 0.7518 X 0.7133 0.447H 0.5009 0.0608 X 0.0000FL −0.5675 0.1254 0.9642 X
(B)F SC H FL
F X 0.0000 0.0033 0.0004SC 0.8085 X 0.8875 0.299H 0.4645 0.0237 X 0.0000FL −0.5482 0.1729 0.9597 X
Although we are not discounting the role of adaptation, we sug-
gest that other nonadaptive factors play a larger role than generally
appreciated. Femoral length remains an accurate proxy of SVL in
many nonavian theropods; however, there are some notable ex-
ceptions (e.g., small-bodied basal deinonychosaurs and avians).
Our results support previous findings that skull length can be
an effective body size proxy across Theropoda (Therrien and
Henderson 2007), with some caveats. Although skull length did
demonstrate a strong relationship with body size, other skeletal
elements (femur, scapula) showed higher correlations and these
elements may be less susceptible to phylogenetic biases within
nonavian theropods than the skull (Brusatte et al. 2012). Hindlimb
segmental and total lengths are strongly correlated with SVL in
nonavian theropods, whereas forelimb values are less so, although
they remain statistically significant. We suggest that this pattern
is the result of the bipedal, terrestrial locomotory constraints on
the hindlimb, and differential selection on forelimb functions in
these taxa. Our results support earlier hypotheses that the non-
locomotory function of nonavian theropod forelimbs may have
been a driver for higher forelimb variation in these taxa due to
relaxed functional constraints (Gatesy and Dial 1996; Gatesy and
Middleton 1997).
THE SCAPULA
The robust correlation between scapular length and body length,
especially in nonavian taxa, was unexpected (but see Dececchi
et al. 2012). Within nonavian theropods, scapula lengths are
more tightly correlated to SVL (or F) than forelimb length (see
-0.5
-0.4
-0.3
-0.2
-0.1
0
0.1
0.2
0.3
0.4
H R
esid
uals
0
0.2
0.4
0.6
0.8
1
1.2
1.4
1.6
1.8
2
H/F
Sau
risch
iaTh
erop
oda
Neo
ther
opod
aN
eoth
erop
oda
IN
eoth
erop
oda
II
Teta
nura
eAv
ethe
ropo
daC
oelu
rosa
uria
Coe
luro
saur
ia I
Coe
luro
saur
ia II
Man
irapt
orifo
rmes
Man
irapt
ora
Man
irapt
ora
IM
anira
ptor
a II
Man
irapt
ora
IIIP
arav
esAv
iala
eAv
esB
asal
Avi
ans
Orn
ithur
omor
pha
Pyg
osty
lia
A
B
Neo
ther
opod
a III
Figure 3. Plots of individual clades (boxplots) and nodal recon-
structions along the phylogenetic trajectory through the origin of
birds (dashed line) for the humerus to femur ratio (A) and humerus
to SVL residuals (B) using the largest dataset topology. The gray
box highlights Aves. The solid horizontal line represents the av-
erage value for noncolurosaurian theropods. When corrected for
body size, humeral lengths in maniraptorans deviate in herbivo-
rous (lengthening) and myrmecophagous (shortening) clades.
electronic Supporting Information). We suggest that the close as-
sociation between scapula length and SVL may be due to the
developmental origins of the scapula. The avian scapula de-
velops from two separate condensations. The scapular blade is
EVOLUTION 2013 7

T. A. DECECCHI AND H. C. E. LARSSON
0.00
0.15
0.30
0.45
0.60
0.75
0.90
FL/S
VL
Ther
opod
aN
eoth
erop
oda
Neo
ther
opod
a I
Neo
ther
opod
a II
Ave
rost
ra
Ave
s
Ave
ther
opod
aC
oelu
rosa
uria
Coe
luro
saur
ia I
Man
irapt
orfo
rms
Man
irapt
ora
Man
irapt
ora
IP
arav
es
Ave
s I
Ave
s II
Ave
s III
Pyg
osty
liaO
rnith
urom
orph
a
Avi
alae
Ave
s
Ther
opod
aN
eoth
erop
oda
Neo
ther
opod
a I
Neo
ther
opod
a II
Ave
rost
raTe
tanu
rae
Ave
ther
opod
aC
oelu
rosa
uria
Coe
luro
saur
ia I
Man
irapt
orfo
rms
Man
irapt
ora
Man
irapt
ora
IP
arav
es
Ave
s I
Ave
s II
Ave
s III
Pyg
osty
liaO
rnith
urom
orph
a
Avi
alae
HL/
SV
L
A
B
10 cm
0.00
0.15
0.30
0.45
0.60
0.75
0.90
Microraptor Archaeopteryx Sapeornis
B
10 10101010 cmcmcmcmc
Figure 4. Evolution of forelimb and hindlimb lengths corrected for body size across the nonavian theropod to bird transition. (A)
Nodal reconstructions (solid line) for relative forelimb (FL) and hindlimb (HL) lengths to SVL using the measured taxon dataset and
Epidexipteryx as the sister taxon to Aves tree topology. Estimated expected lengths are derived from linear regressions (dashed lines)
with corresponding 95% error bounds (shaded region) using the adult nonavian theropod dataset. Nonavian thereopod nodes are
closed circles and avian nodes are open circles. See electronic Supporting Information for other phylogenetic permutations. (B) Direct
comparison of fore and hindlimbs across similar sized paravian and avian taxa. Silhouette reconstructions are based on Microraptor
zhaoianus, Archaeopteryx lithographica, and Sapeornis angustus to illustrate each limb bone in the same orientation. Fore and hindlimbs
are positioned in the paraxial plane for comparison, although this orientation would not have been permissible in life in the former two
taxa. Despite that all three have similar SVL values (240, 231, and 247 mm, respectively), the origin of birds corresponds with a significant
lengthening of the forelimb and shortening of the hindlimb.
derived primarily from the sclerotome of somites 17–24, whereas
the glenoid region and coracoid are derived from the lateral plate
mesoderm (Huang et al. 2000, 2006; Valask et al. 2011). Thus,
the close association between axial column and scapular blade
length may be due, in part, to their common somitic origins. As
both SVL and femur length are strongly correlated to body size,
they are also highly correlated to scapula length. Integration be-
tween scapula length and SVL becomes weaker, whereas that
between the forelimb and scapula and the relative scapular length
increases in birds (mean value of scapula length/SVL for nonavian
theropods = 15.6%, avians = 22.2%) (unequal var. T-test =−4.0216, P (same mean) = 0.0001). Although the scapula blade
is derived from largely somitic tissue, the girdle’s musculature
is influenced by factors in the forelimb (Kuijper et al. 2005;
Valask et al. 2011). Superficial forelimb muscles (e.g., pectoralis
and latissimus dorsi) in birds develop from lateral plate meso-
derm, whereas the deeper girdle musculature is derived from
somites by the forelimb field (Valask et al. 2011). This linkage
8 EVOLUTION 2013

BODY AND LIMB SIZE DISSOCIATION AT THE ORIGIN OF BIRDS
may help explain the differences in integration between the fore-
limb and scapula in birds. Pectoral and forelimb musculature
becomes increasingly hypertrophied within birds, with pectoral
depressor muscles averaging 10–13% of extant bird body mass
(Biewener 2011). Scapula lengthening and pectoral muscle mass
enlargement are probably initiated during avian embryogenesis
because both systems are well developed in ovo (Nakane and
Tsudzuki 1999). In ovo muscle size and activity significantly af-
fect both scapula and forelimb development, including scapula
length (Nowlan et al. 2010a, b) and the enlargement of the flight-
related musculature may have lead to a more integrated pectoral-
forelimb system with these muscles inducing novel biomechanical
stress on the developing embryo.
ALLOMETRY AND THEROPOD LIMBS
Given the close association of limb length and body size, it is not
unexpected that the trend of body size decrease in coelurosaurs is
associated with an elongation of their appendicular skeleton, most
notably in the forelimb (Figs. 3 and 4). The phylogenetic axis from
node Theropoda to node Aves does not deviate from the 95% con-
fidence bounds of the expected fore and hindlimb lengths using
the nonavian theropod allometric regression. Although perhaps
not surprising, this pattern indicates that the relative lengthening
of the forelimb through maniraptoran evolution is coupled with an
evolution of body size reduction. This pattern is significantly dis-
rupted at node Aves, suggesting that scaling factors have changed
for limb growth in this clade.
Our findings do not support an evolutionary trend in increas-
ing forelimb length throughout Coelurosauria to Aves. We stress
that our findings do not suggest that individual lineages did not de-
viate from this general trend. For example, the ornithomimosaurs
show significantly elongated forelimbs (Fig. 3). What our find-
ings do challenge is the notion that there is a trend of forelimb
elongation within coelurosaurs beyond what is expected due to
concurrent body size decrease in this lineage. Individual elon-
gation (and reduction) events within derived nonavian theropods
were likely driven by lineage specific adaptive scenarios, rather
than an overarching single clade wide evolutionary or allometric
driver. Of note is the level of elongation present in the herbivo-
rous (Zanno and Makovicky 2011), terrestrial (Makovicky et al.
2004; Kirkland et al. 2005) coelurosaurian clades the Ornithomi-
mosauria and Therizinosauria (Fig. 3B), among the highest for
nonavian theropods.
Our use of humerus to femur (H:F) residuals should not be
taken as support for the use of raw H:F ratios as a determination
of relative forelimb length (Chatterjee and Templin 2004; Bybee
and Lee 2006; Zhang et al. 2008; Novas et al. 2009). We caution
against the use of this metric because of the significant allomet-
ric nature of both bones and the dramatic deviations in specific
clades, including Aves. As illustration, compare three nonavian
taxa (Citipati, Coelophysis, and Coelurus) with identical H:F val-
ues (0.57), despite having radically different forelimb lengths
relative to SVL (Citipati 117%, Coelurus 100%, and Coelophysis
73% of expected).
PARAVIANS
Basal deinonychosaurs have hindlimb elongations equal to or
greater than those in highly cursorial taxa such as ornithomi-
mosaurs and parvicursorines (Makovicky et al. 2004; Xu et al.
2010b). Although basal deinonychosaurians do not have the
extremely elevated metatarsal to femoral (Mt:F) length ratios
preset in parvicursorines, they do posses values similar to or-
nithomimids, Caudipteryx or Limusaurus. In either case, total
hindlimb length is a stronger correlate with running ability and
speed than Mt:F (Garland and Janis 1993; Christiansen 2002)
and elongation of the metatarsals is more closely linked to home
range size (Garland and Janis 1993). The presence of elongate
metatarsals in parvicursorines may be due to the unique require-
ments of their suspected myrmecophagy (Xu et al. 2010b). Like
equivalent sized extant mammalian carnivores (Carbonne et al.
2007), basal deinonychosaurs likely did not partake in long pursuit
hunts that favor the evolution of elongate distal limb segments, but
relied primarily on ambush or low-cost hunts techniques (Fowler
et al. 2012).
The level of hindlimb elongation in this clade affects mass
estimate calculations that reconstruct paravians as significantly
heavier than similar size avians (Turner et al. 2007). Microraptor
zhaoianus or Mei long are estimated to be 320% and 410% larger,
respectively, than the Berlin example of Archaeopteryx although
all three animals differ by less than 5% in SVL. Similar distortions
are seen when comparing Mei long to the other basal troodontids
in this analysis (Anchiornis and Jinfengopteryx). Reconstructions
for Archaeopteryx and small deinonychosaurians show similar
outline and body volume (Hu et al. 2009), and they likely had
similar tissue density (Hutchinson et al. 2007). We find no plau-
sible explanation for this proposed difference in body mass, and
believe it to be solely caused by overestimations due to femoral
length differences.
AVES
Avians break the theropod appendicular scaling pattern in the
forelimb and hindlimb. The forelimb scaling to SVL changes from
negative to a positive allometry in birds. In Archaeopteryx, the
most basal bird, this difference is not as pronounced, as it shares
similar forelimb proportions to similar sized deinonychosaurians
such as Microraptor (Fig. 4), although its hindlimbs are relatively
shorter (Figs. 2, D, 4B). This may be linked to the limited flight
capacity, if any, of Archaeopteryx compared to more derived basal
avians such as Sapeornis (see Wang et al. 2011 and references
therein). In volant basal avians, the extreme size of the forelimb
EVOLUTION 2013 9

T. A. DECECCHI AND H. C. E. LARSSON
may have been driven by the need to compensate for their large
body size, relatively short primaries and unrefined flight anatomy
(Clarke and Middleton 2008; Wang et al. 2011).
Avians also show a reduction in their hindlimbs compared
to expected theropod values at that body size. Birds achieved this
by retaining a near-isometric hindlimb to SVL scaling relation-
ship but with a reduced intercept. All avians in our dataset show
hindlimb lengths that are at least 30% smaller than a comparable
sized paravian. As early avians are reconstructed as having simi-
lar limb mechanics as nonavian theropods (Hutchinson and Allen
2009), it begs the question: why do they not retain the paravian
hindlimb scaling factor?
One possible solution is that long limbs would hinder perch-
ing and movement along tree branches. Basal birds, such as Ar-
chaeopteryx, and the origin of birds are hypothesized to have been
terrestrial (Bell and Chiappe 2011; Dececchi and Larsson 2011).
However, birds rapidly evolved adaptations for perching in trees,
with taxa such as Jeholornis and Sinornis having a fully reversed
hallux for small-diameter branch grasping (Dececchi and Lars-
son 2011). By reducing hindlimb length, arboreal taxa decrease
torsional forces when perching or moving along thin diameter
perches (Cartmill 1985), a useful trait if avians spent more time
within the canopy. Reducing limb length would also likely de-
crease total mass and facilitate the tucking of hindlimbs when
flying. Tucking smooths the profile and reduces the amount of
parasitic drag experienced during flight by more than four times
(Pennycuick 1971; Tucker 1988).
ConclusionInterlimb length ratios are widely used as the basis for phylo-
genetic characters and to derive evolutionary scenarios (Padian
and Chiappe 1998; Chatterjee and Templin 2004; Bybee and Lee
2006; Novas et al. 2009; Xu et al. 2009; Choiniere et al. 2010;
Xu et al. 2010a) without accounting for potential allometric ef-
fects. However, we show that it is necessary to establish a pre-
transition baseline for appendicular evolution before examining
limb evolution through the nonavian theropod to avian transi-
tion. Here, we have demonstrated that the previously reported
trend of forelimb lengthening in maniraptorans is an allometric
consequence of reduced body size, and not a size-independent
pattern. Additionally, we have demonstrated that early birds di-
verged radically from both the forelimb and hindlimb bauplan of
nonavian theropods. The first birds have a marked elongation and
integration of the forelimb and pectoral unit that is not present in
nonavian theropods. These results signal a fundamental shift in
the appendicular skeletal development between avian and nona-
vian theropods and suggest significant behavioral and ecological
divergence between these clades.
Our results reinforce previous findings of a disintegration
of the ancestral forelimb and hindlimb system within theropods
(Gatesy and Dial 1996; Gatesy 2002), although we suggest
that there remained a significant degree of integration mediated
through allometry until the origin of birds. Although nonavian
theropods were terrestrial cursors (Gatesy and Middleton 1997;
Dececchi and Larsson 2011), birds rapidly diversified ecologi-
cally (i.e., swimming, perching, wading, etc.) and show evidence
for a further decoupling of within limb modules (Gatesy and Mid-
dleton 1997; Middleton and Gatesy 2000; Gatesy 2002; Zeffer
et al. 2003). This decoupling began with the freeing of the limbs
from the ancestral scaling relationship of nonavian theropods, al-
lowing each limb module a new degree of selective freedom. This
result suggests a more independent control of limb development
evolved at the origin of birds to dissociate forelimb and hindlimb
lengths from body size. This dissociation, followed by similar
breaks in intralimb integration, may be fundamental to the initial
diversification of birds.
ACKNOWLEDGMENTSThe authors thank the members of the Larsson laboratory as well as D.Evans, N. Campione, D. Hone, and C. Sullivan for their discussions andinput. The authors would also like to thank all those who provided uswith measurements including: A. Balanoff, D. Brinkman, P. Makovicky,J. Choiniere, P. Currie, C. D. Sasso, S. Hwang, B. Roach, X. Xing, andL. Zanno. Additional improvements to the manuscript follow suggestionsfrom V. Allen and two anonymous reviewers. Funding for this projectwas provided by a Fonds de Recherche du Quebec Nature et TechnologieGraduate Scholarship (PhD) (to TAD), a Canada Research Chair (toHCEL), and by National Sciences and Engineering Research CouncilDiscovery Grant (to HCEL).
LITTERATURE CITEDAgnolin, F. L., and F. E. Novas. 2011. Unenlagiid theropods: Are they members
of the Dromaeosauridae (Theropoda, Maniraptora)? An. Acad. Bras.Cienc. 83:117–162.
Bell, A., and L. M. Chiappe. 2011. Statistical approach for inferring ecologyof Mesozoic birds. J. Syst. Palaeontol. 9:119–133.
Bell, A., and A. Goswami. 2011. Integration and dissociation of limb elementsin flying vertebrates: A comparison of pterosaurs, birds and bats. J. Evol.Biol. 24:2586–2599.
Bertram, J. E. A., and A. Biewener. 1990. Differential scaling of the long bonesin the terrestrial carnivores and other mammals. J. Morph. 204:157–169.
Biewener, A. 2011. Muscle function in avian flight: achieving power andcontrol. Philos. Trans. R. Soc. Lond. B 366:1496–1506.
Brusatte, S. L., M. Sakamoto, S. Montanari, and W. E. H. H. Smith. 2012. Theevolution of cranial form and function in theropod dinosaurs: Insightsfrom geometric morphometrics. J. Evol. Biol. 25:365–377.
Bybee, P. J., and A. H. Lee. 2006. Sizing the Jurassic theropod dinosaur. J.Morph. 359:347–359.
Capdevila, J., and J. C. I. Belmonte. 2000. Perspectives on the evolutionaryorigin of tetrapod limbs. J. Exp. Zool. 288:287–303.
Carpenter, K. 2002. Forelimb biomechanics of nonavian theropod dinosaursin predation. Senckenbergiana Lethaea 82:59–76.
Carbone, C., A. Teacher, and J. M. Rowcliffe. 2007. The costs of carnivory.PLoS Biol. 5:e22.
1 0 EVOLUTION 2013

BODY AND LIMB SIZE DISSOCIATION AT THE ORIGIN OF BIRDS
Carrano, M. T. 2006. Body size evolution in the Dinosauria. Pp 225–257in M. T. Carrano, T. J. Gaudin, R. W. Blob, and J. R. Wible, eds.Amniote paleobiology: perspectives on the evolution of mammals, birdsand reptiles. The University of Chicago Press, Chicago.
Cartmill, M. 1985. Climbing. Pp. 73–88 in M. Hildebrand, D. Bramble, K. F.Liem, and D. B. Wake, eds. Functional vertebrate morphology. HarvardUniv. Press, Cambridge, U.K.
Chatterjee, S., and R. J. Templin. 2004. Feathered coelurosaurs from China:New light on the arboreal origin of avain flight. Pp. 251–281 in
P. J. Currie, M. A. Koppelhaus, M. A. Shugar, and J. L. Wright, eds.Feathered dragons. Studies on the transition from dinosaurs to birds.Indiana Univ. Press, Bloomington.
Choiniere, J. N., X. Xu, J. M. Clark, C. A. Forster, Y. Gou, and F. Han. 2010. Abasal alvarezsauroid theropod from the Early Late Jurassic of Xinjiang,China. Science 327:571–574.
Christiansen, P. E. R. 2002. Locomotion in terrestrial mammals: The influenceof body mass, limb length and bone proportions on speed. Zool. J. LinnSoc. 136:685–714.
Clarke, J. A., and K. M. Middleton. 2008. Mosaicism, modules, and the evolu-tion of birds: results from a Bayesian approach to the study of morpho-logical evolution using discrete character data. Syst. Biol. 57:185–201.
Dececchi, T. A., and H. C. E. Larsson. 2011. Assessing arboreal adaptationsof bird antecedents: Testing the ecological setting of the origin of theavian flight stroke. PloS One 6:e22292.
Dececchi, T. A., H. C. E. Larsson, and H. W. E. Hone. 2012. Yixianosauruslongimanus (Theropoda: Dinosauria) and its bearing on the evolution ofManiraptora and ecology of the Jehol fauna. Vert. PalAsia 50:111–139.
Deichmann, J. L., W. E. Duellman, and G. B. Williamson. 2008. Predict-ing biomass from snout–vent length in New World frogs. J. Herpetol.42:238–245.
Dıaz-Uriarte, R., and T. Garland. 1998. Effects of branch length errors onthe performance of phylogenetically independent contrasts. Syst. Biol.47:654–672.
Farina, R. A., and P. E. R. Christiansen. 2004. Mass prediction in theropoddinosaurs. Historical Biol. 16:85–92.
Fowler, D. W., E. A. Freedman, J. B Scannella, and R. E. Kambric. 2011. Thepredatory ecology of Deinonychus and the origin of flapping in birds.PLoS One 6: e28964.
Garland, T., A. F. Bennett, and E. L. Rezende. 2005. Phylogenetic approachesin comparative physiology. J. Exp. Biol. 208:3015–3035.
Gatesy, S. M. 2002. Locomotor evolution on the line to modern birds.Pp. 432–448 in L. M. Chiappe and L. M. Witmer, eds. Mesozoicbirds: Above the head of dinosaurs. University of California Press,Berkeley.
———, and K. P. Dial. 1996. Locomotor modules and the evolution of avianflight. Evolution 50:331–340.
Gatesy, S. M., and K. M. Middleton.1997. Bipedalism, flight, and the evolutionof theropod locomotor diversity. J. Vert. Paleontol. 17:308–329.
Garland, T., and C. M. Janis. 1993. Does metatarsal/ femur ratio predictsmaximal running speed in cursorial mammals. J. Zool. 229:133–151.
Gilbert, C. C., S. R. Frost, and D. S. Strait. 2009. Allometry, sexual dimor-phism, and phylogeny: A cladistic analysis of extant African papioninsusing craniodental data. J. Hum. Evol. 57:298–320.
Hall, B. K., ed. 2007. Fins into limbs: Evolution, development, and transfor-mation. University of Chicago Press, Chicago.
Hu, D., L. Hou, L. Zhang, and X. Xu. 2009. A pre-Archaeopteryx troodon-tid theropod from China with long feathers on the metatarsus. Nature461:640–643.
Huang, R., Q. Zhi, K. Patel, J. Wilting, and B. Christ. 2000. Dual origin andsegmental organization of the avian scapula. Development 127:3789–3794.
Huang, R., Christ, B., and K. Patel. 2006. Regulation of scapula development.Anat. Embryo. 211(Suppl.):65–71.
Hutchinson, J. R., and V. Allen. 2009. The evolutionary continuum of limbfunction from early theropods to birds. Naturwissenschaften 96:423–448.
Hutchinson, J. R., V. Ng-Thow-Hing, and F. C. Anderson. 2007. A 3D in-teractive method for estimating body segmental parameters in animals:application to the turning and running performance of Tyrannosaurusrex. J. Theor. Biol. 246:660–680.
Hutchinson, J. R., K. T. Bates, K.T., J. Molnar, V. Allen, and P. J. Makovicky.2011. A computational analysis of limb and body dimensions in Tyran-nosaurus rex with implications for locomotion, ontogeny, and growth.PLoS ONE 6:e26037.
Hutton, J. M. 1987. Morphometrics and field estimation of the size of the Nilecrocodile. Afr. J. Ecol. 25:225–230.
Kirkland, J. I., L. E. Zanno, S. D. Sampson, J. M. Clark, and D. D. Deblieux.2005. A primitive therizinosauroid dinosaur from the Early Cretaceousof Utah. Nature 435:3–6.
Kohlsdorf, T., T. Garland, and C. A. Navas. 2001. Limb and tail lengths inrelation to substrate usage in Tropidurus lizards. J. Morph. 248:151–164.
Kuijper, S., A. Beverdam, C. Kroon, A. Brouwer, S. Candille, G. Barsh, and F.Meijlink. 2005. Genetics of shoulder girdle formation: Roles of Tbx15and aristaless-like genes. Development 132:1601–1610.
Maddison, W. P., and D. R. Maddison. 2011. Mesquite: a modular system forevolutionary analysis. Version 2.73. Available at http://mesquiteproject.org.
Makovicky, P. J., Y. Kobayashi, and P. J. Currie. 2004. Ornithomimosauria.Pp 137–150 in D. B. Weishampel, P. Dodson, and H. Osmolska, eds.The Dinosauria. 2nd ed. University of California Press, Berkeley.
Makovicky, P. J., S. Apesteguia, and F. L. Agnolin. 2005. The earliest dro-maeosaurid theropod from South America. Nature. 437:1007–1011.
Meiri, S. 2010. Length-weight allometries in lizards. J. Zool. 281:218–226.
Middleton, K. M., and S. M. Gatesy. 2000. Theropod forelimb design andevolution. Zool. J. Linn. Soc. 128:149–187.
Nakane, Y., and M. Tsudzuki. 1999. Development of the skeleton in Japanesequail embryos. Develop. Growth Differ. 41:523–534.
Nixon, K. C. 1999–2002. WinClada ver. 1.0000 Published by the author,Ithaca, NY.
Norberg, U. M. 1979. Morphology of the wings, legs and tail of three conifer-ous forest tits, the goldcreast and the treecreeper in relation to locomotorpattern and feeding station selection. Philos. Trans. R. Soc. Lond. B287:131–165.
Nowlan, N. C., C. Bourdon, G. Dumas, S. Tajbakhsh, P. J. Prendergast, andP. Murphy. 2010a. Developing bones are differentially affected by com-promised skeletal muscle formation. Bone 46:1275–1285.
Nowlan, N. C., J. Sharpe, K. Roddy, P. J. Prendergast, and P. Murphy. 2010b.Mechanobiology of embryonic skeletal development: Insights from an-imal models. Birth Defects Res. C Embryo Today Rev. 90:203–213.
Novas, F. E., D. Pol, J. I. Canale, J. D. Porfiri, and J. O. Calvo. 2009. Abizarre Cretaceous theropod dinosaur from Patagonia and the evolutionof Gondwanan dromaeosaurids. Proc. R. Soc. B 276:1101–1107.
O’Connor, J. K., L. M. Chiappe, and A. K. Bell. 2011. Pre-modern birds:Avian divergences in the Mesozoic. Pp 39–115 in G. J. Dyke and G.Kaiser, eds. Living Dinosaurs: the evolutionary history of modern birds.London, Wiley-Blackwell.
Ostrom, J. H. 1969. Osteology of Deinonychus antirrhopus, an unusual thero-pod from the Lower Cretaceous of Montana. Peabody Mus. Nat. Hist.Bull. 30:1–165.
Padian, K., and L. M. Chiappe.1998. The origin and early evolution of birds.Biol. Rev. 73:1–42.
EVOLUTION 2013 1 1

T. A. DECECCHI AND H. C. E. LARSSON
Pennycuick, B. Y. C. J. 1971. Control of gliding angle in Ruppell’s Griffonvulture, Gyps ruppellii. J. Exp. Biol. 55:39–46.
Samuels, J. X., and B. van Valkenburgh. 2008. Skeletal indicators of locomotoradaptations in living and extinct rodents. J. Morph. 269:1387–1411.
Schmidt, M., and M. S. Fischer. 2009. Morphological integration in mam-malian limb proportions: dissociation between function and develop-ment. Evolution 63:749–766.
Schmidt-Nielsen, K. 1984. Scaling: why animal size is so important. Cam-bridge Univ. Press, Cambridge, UK.
Senter, P. 2006. Comparison of forelimb function between Deinonychus andBambiraptor (Theropoda: Dromaeosauridae). J. Vert. Paleontol. 26:897–906.
Therrien, F., and D. M. Henderson. 2007. My theropod is bigger thanyours . . . or not: Estimating body size from skull length in theropods. J.Vert. Paleontol. 27:108–115.
Thorington Jr., R. W., and L. R. Heaney. 1981. Body proportions and glid-ing adaptations of flying squirrels (Petauristinae). J. Mammal. 62:101–114.
Thorington Jr., R. W., and E. M. Santana. 2007. How to make a flyingsquirrel: Glaucomys anatomy in phylogenetic perspective. J. Mammal.88:882–896.
Torsvik, T. H., R. Van der Voo, R. Preeden, C. Mac Niocaill, B. Steinberger,P. V. Doubrovine, D. J. J. van Hinsbergen, M. Domeier, C. Gaina, E.Tohver, et al. 2012. Phanerozoic polar wander, palaeogeography anddynamics. Earth Sci. Rev. 114:325–368.
Tucker, V. A. 1988. Gliding birds: Descending flight of the white-backedvulture, Gyps africanus. J. Exp. Biol. 344:325–344.
Turner, A. H., D. Pol, J. A. Clarke, G. M. Erickson, and M. A. Norell. 2007. Abasal dromaeosaurid and size evolution preceding avian flight. Science317:1378–1381.
Valasek, P., S. Theis, A. DeLaurier, Y. Hinits, G. N. Luke, A. M. Otto, J.Minchin, L. He, B. Christ, G. Brooks, et al. 2011. Cellular and molecularinvestigations into the development of the pectoral girdle. Develop. Biol.357:108–116.
Wang, X., R. L. Nudds, and G. J. Dyke. 2011. The primary feather lengthsof early birds with respect to avian wing shape evolution. J. Evol. Biol.24:1226–1231.
Xu, X., J. M. Clark, J. Mo, J. Choiniere, C. A. Forster, G. M. Erickson, D. W.E. Hone, C. Sullivan, D. A. Eberth, S. Nesbitt, et al. 2009. A Jurassicceratosaur from China helps clarify avian digital homologies. Nature459:940–944.
Xu, X., Q. Ma, and D. Hu. 2010a. Pre-Archaeopteryx coelurosaurian dinosaursand their implications. Chin. Sci. Bull. 55:3971–3977.
Xu, X., D. Wang, C. Sullivan, D. W. E. Hone, F. Han, R. Yan, and F. Du.2010b. A basal parvicursorine (Theropoda: Alvarezsauridae) from theUpper Cretaceous of China. Zootaxa 19:1–19.
Xu, X., H. You, K. Du, and F. Han. 2011. An Archaeopteryx-like theropodfrom China and the origin of Avialae. Nature 475:465–470.
Young, N. M., and B. Hallgrımsson. 2005. Serial homology and the evo-lution of mammalian limb covariation structure. Evolution 59:2691–2704.
Young, N. M., G. P. Wagner, and B. Hallgrımsson. 2010. Development andthe evolvability of human limbs. Proc. Natl. Acad. Sci. 107:3400–3405.
Zanno, L. E., and P. J. Makovicky. 2011. Herbivorous ecomorphology andspecialization patterns in theropod dinosaur evolution. PNAS 108:232–237.
Zeffer, A., L. C. Johansson, and A. Marmebro. 2003. Functional correlationbetween habitat use and leg morphology in birds (Aves). Biol. J. Linn.Soc. 79:461–484.
Zhang, F., Z. Zhou, X. Xu, X. Wang, and C. Sullivan. 2008. A bizarre Jurassicmaniraptoran from China with elongate ribbon-like feathers. Nature455:1105–1108.
Zhou, Z., and F. Zhang. 2003. Anatomy of the primitive bird Sapeornis
chaoyangensis from the Early Cretaceous of Liaoning, China. Can. J.Earth Sci. 40:731–747.
Associate Editor: C. Farmer
Supporting InformationAdditional Supporting Information may be found in the online version of this article at the publisher’s website:
Table S1. Linear measurements of theropods elements used in “measured” dataset analysis.
Table S2. Linear regression analyses of absolute (A–E) and relative (F–I) values from measured dataset.
Table S3. Partial correlation scores comparing strength of correlation of the scapula length (SC) to body size (as represented by
SVL or F), Humerus (H), or Forelimb (FL) length.
Table S4. Nodal reconstructions, SVL (in mm) has been logged, all other measurements expressed as a fraction of SVL.
Table S5. Nodal reconstructions of relative element length (element length/SVL) compared to values estimated based on OLS
regression at reconstructed nodal body size (based on SVL).
Table S6. Parametric (Pearson’s) and nonparametric (Spearman’s D and Kendall’s ι) correlation comparisons between nodal
reconstructed values for and those estimated through allometric regression.
Table S7. (A) Comparison of H:F ratio and residual produced by regressing log humeral length on log femoral length. logH =0.77368(±+/− 0.0305) × logF + 0.32768 (± 0.0054), n = 95, r2 = 0.855. (B) Nodal humeral residual reconstructions using the
larger dataset length topology.
1 2 EVOLUTION 2013