Avian herbivory: an experiment, a field test, and an allometric comparison with mammals
10
Ecology, 88(11), 2007, pp. 2926–2935 Ó 2007 by the Ecological Society of America AVIAN HERBIVORY: AN EXPERIMENT, A FIELD TEST, AND AN ALLOMETRIC COMPARISON WITH MAMMALS JAN A. VAN GILS, 1 ABEL GYIMESI, AND BART VAN LITH Department of Plant–Animal Interactions, Centre for Limnology, Netherlands Institute of Ecology (NIOO-KNAW), Rijksstraatweg 6, 3631 AC Nieuwersluis, The Netherlands Abstract. Mechanistic studies on herbivore functional responses have largely taken place in mammals; very little has been done in herbivorous birds so far. Here we aim to fill that gap by experimentally quantifying the (short-term) functional response of a large avian herbivore, the Bewick’s Swan (Cygnus columbianus bewickii). We explicitly distinguish between encounter-limited and handling-limited foraging by analyzing the results in the framework of the models of D. E. Spalinger and N. T. Hobbs, originally developed for mammalian herbivory. Bite size in captive swans was experimentally manipulated by varying sward height. The time interval between two bites increased with bite size, which supports the handling- limited model (process 3) and rejects the encounter-limited models (processes 1 and 2). Subsequently, we took the obtained functional response parameters into the field in order to predict, from measurements of sward height, (1) bite sizes, (2) handling times, and (3) short- term intake rates in free-ranging swans. Indeed, for all three variables, the observed values closely matched the experimentally based predictions. Finally, we review functional response parameters available in the literature on avian herbivores and scale them allometrically in relation to mammals. This analysis revealed that maximum bite sizes, and therefore maximum intake rates, in herbivorous birds are smaller than in herbivorous mammals. We hypothesize and provide evidence that birds compensate by longer daily foraging times. Key words: allometry; Bewick’s Swan; bite size; chewing; cropping; Cygnus columbianus bewickii; foraging; functional response; grazing; handling time; herbivory; intake rate. INTRODUCTION The relation between a forager’s intake rate and its food supply (i.e., the functional response) plays a central role in population ecology (e.g., Vandermeer and Goldberg 2003). Therefore, a basic understanding of factors controlling a forager’s intake rate seems critical for progress in this field of science. Over the past decades, Holling’s disk equation (Holling 1959) has been most influential in this respect (Jeschke et al. 2002). In this short-term functional response model (i.e., dealing explicitly with the constraints acting while foraging; Bergman et al. 2001), a forager alternates between searching for food and handling food (two mutually exclusive activities), yielding a Type II functional response (Holling 1966) in which intake rate increases asymptotically with food abundance. In spite of such simplified assumptions that seem to be specific for true predators feeding on discrete prey items, the model not only fits intake rates of predators (e.g., Piersma et al. 1995), but often fits short-term intake rates of herbiv- orous consumers as well (e.g., Augustine et al. 1998, Nolet et al. 2001). However, as pointed out and explored by Spalinger and Hobbs (1992), several alternative mechanisms, other than the trade-off between searching and handling, could account for Type II functional responses seen so often in herbivores. Central in the herbivore models developed by Spalinger and Hobbs (1992) is the decomposition of handling time into two sequential stages that are typical for herbivorous foraging: cropping (i.e., the act biting off plant tissue) and chewing (i.e., the act of processing the bite in the mouth until swallowing it). These authors further assume that (1) cropping and chewing are mutually exclusive (a mouth can only perform one function at any given time; but see Ginnett and Demment 1995), (2) cropping slows down searching (but does not exclude it), and (3) chewing and searching are entirely non-mutually exclusive. Based on spatial and morphological characteristics of plants, these assumptions enabled Spalinger and Hobbs to distinguish three possible mechanisms applying to herbivore forag- ing. In process 1, herbivores feed on spatially dispersed, hidden plants and are therefore either searching or Manuscript received 31 May 2006; revised 8 February 2007; accepted 20 February 2007. Corresponding Editor: B. P. Kotler. 1 Present addresses: Department of Plant–Animal Interac- tions, Centre for Limnology, Netherlands Institute of Ecology (NIOO-KNAW), Rijksstraatweg 6, 3631 AC Nieu- wersluis, The Netherlands; School of Biological Sciences, University of Bristol, Woodland Road, Bristol BS8 1UG UK; Royal Netherlands Institute for Sea Research (NIOZ), PO Box 59, 1790 AB Den Burg, The Netherlands. E-mail: [email protected] 2926
Transcript of Avian herbivory: an experiment, a field test, and an allometric comparison with mammals
Ecology, 88(11), 2007, pp. 2926–2935� 2007 by the Ecological Society of America
AVIAN HERBIVORY: AN EXPERIMENT, A FIELD TEST, AND ANALLOMETRIC COMPARISON WITH MAMMALS
JAN A. VAN GILS,1 ABEL GYIMESI, AND BART VAN LITH
Department of Plant–Animal Interactions, Centre for Limnology, Netherlands Institute of Ecology (NIOO-KNAW),Rijksstraatweg 6, 3631 AC Nieuwersluis, The Netherlands
Abstract. Mechanistic studies on herbivore functional responses have largely taken placein mammals; very little has been done in herbivorous birds so far. Here we aim to fill that gapby experimentally quantifying the (short-term) functional response of a large avian herbivore,the Bewick’s Swan (Cygnus columbianus bewickii). We explicitly distinguish betweenencounter-limited and handling-limited foraging by analyzing the results in the frameworkof the models of D. E. Spalinger and N. T. Hobbs, originally developed for mammalianherbivory. Bite size in captive swans was experimentally manipulated by varying sward height.The time interval between two bites increased with bite size, which supports the handling-limited model (process 3) and rejects the encounter-limited models (processes 1 and 2).Subsequently, we took the obtained functional response parameters into the field in order topredict, from measurements of sward height, (1) bite sizes, (2) handling times, and (3) short-term intake rates in free-ranging swans. Indeed, for all three variables, the observed valuesclosely matched the experimentally based predictions. Finally, we review functional responseparameters available in the literature on avian herbivores and scale them allometrically inrelation to mammals. This analysis revealed that maximum bite sizes, and therefore maximumintake rates, in herbivorous birds are smaller than in herbivorous mammals. We hypothesizeand provide evidence that birds compensate by longer daily foraging times.
Key words: allometry; Bewick’s Swan; bite size; chewing; cropping; Cygnus columbianus bewickii;foraging; functional response; grazing; handling time; herbivory; intake rate.
INTRODUCTION
The relation between a forager’s intake rate and its
food supply (i.e., the functional response) plays a central
role in population ecology (e.g., Vandermeer and
Goldberg 2003). Therefore, a basic understanding of
factors controlling a forager’s intake rate seems critical
for progress in this field of science. Over the past
decades, Holling’s disk equation (Holling 1959) has been
most influential in this respect (Jeschke et al. 2002). In
this short-term functional response model (i.e., dealing
explicitly with the constraints acting while foraging;
Bergman et al. 2001), a forager alternates between
searching for food and handling food (two mutually
exclusive activities), yielding a Type II functional
response (Holling 1966) in which intake rate increases
asymptotically with food abundance. In spite of such
simplified assumptions that seem to be specific for true
predators feeding on discrete prey items, the model not
only fits intake rates of predators (e.g., Piersma et al.
1995), but often fits short-term intake rates of herbiv-
orous consumers as well (e.g., Augustine et al. 1998,
Nolet et al. 2001). However, as pointed out and explored
by Spalinger and Hobbs (1992), several alternative
mechanisms, other than the trade-off between searching
and handling, could account for Type II functional
responses seen so often in herbivores.
Central in the herbivore models developed by
Spalinger and Hobbs (1992) is the decomposition of
handling time into two sequential stages that are typical
for herbivorous foraging: cropping (i.e., the act biting
off plant tissue) and chewing (i.e., the act of processing
the bite in the mouth until swallowing it). These authors
further assume that (1) cropping and chewing are
mutually exclusive (a mouth can only perform one
function at any given time; but see Ginnett and
Demment 1995), (2) cropping slows down searching
(but does not exclude it), and (3) chewing and searching
are entirely non-mutually exclusive. Based on spatial
and morphological characteristics of plants, these
assumptions enabled Spalinger and Hobbs to distinguish
three possible mechanisms applying to herbivore forag-
ing. In process 1, herbivores feed on spatially dispersed,
hidden plants and are therefore either searching or
Manuscript received 31 May 2006; revised 8 February 2007;accepted 20 February 2007. Corresponding Editor: B. P.Kotler.
1 Present addresses: Department of Plant–Animal Interac-tions, Centre for Limnology, Netherlands Institute ofEcology (NIOO-KNAW), Rijksstraatweg 6, 3631 AC Nieu-wersluis, The Netherlands; School of Biological Sciences,University of Bristol, Woodland Road, Bristol BS8 1UGUK; Royal Netherlands Institute for Sea Research (NIOZ),PO Box 59, 1790 AB Den Burg, The Netherlands.
E-mail: [email protected]
2926
handling or doing both at the same time (due to this
latter activity this process differs from Holling’s disk
equation). In process 2, herbivores feed on spatially
dispersed, apparent plants and are therefore either
moving toward a new bite or handling or doing both
at the same time. In process 3, herbivores feed on
spatially concentrated, apparent plants and are therefore
always handling their bites.
Up to now, the models developed by Spalinger and
Hobbs have mainly been tested and verified in mamma-
lian herbivores, for which they were originally developed
(e.g., Gross et al. 1993, Bradbury et al. 1996, Illius et al.
2002, Hobbs et al. 2003, Searle et al. 2005). However, as
shown by Hewitt and Kirkpatrick (1996) and Durant et
al. (2003), the models seem to apply to avian herbivory
under experimental conditions as well. Whether they
apply to free-ranging avian herbivores remains as yet
untested, but seems highly probable. For example, free-
ranging Brent Geese (Branta bernicla) feeding on
respectively Zostera and Plantago showed Type II
functional responses (Charman 1979, Prop 1991), which
is highly suggestive. By mechanistically unraveling such
responses, models on population dynamics of avian
herbivores and their food resources, which in the past
were often based on phenomenological asymptotic
functional responses (Lang et al. 1998, Pettifor et al.
2000), could produce more realistic predictions. In
addition, deviations from a Type II response, such as
the ‘‘dome-shaped’’ functional response recently report-
ed in a range of relatively small avian herbivores (Van
der Wal et al. 1998, Therkildsen and Madsen 2000, Lang
and Black 2001, Bos et al. 2004), may be better
understood in the light of the proposed competition
between cropping and chewing on the one hand and
between cropping and searching on the other.
In this paper, we focus on short-term or so-called
instantaneous intake rates by explicitly distinguishing
between the encounter-limited (process 1 and 2) and the
handling-limited (process 3) Spalinger and Hobbs
models in a large grass-eating avian herbivore, the
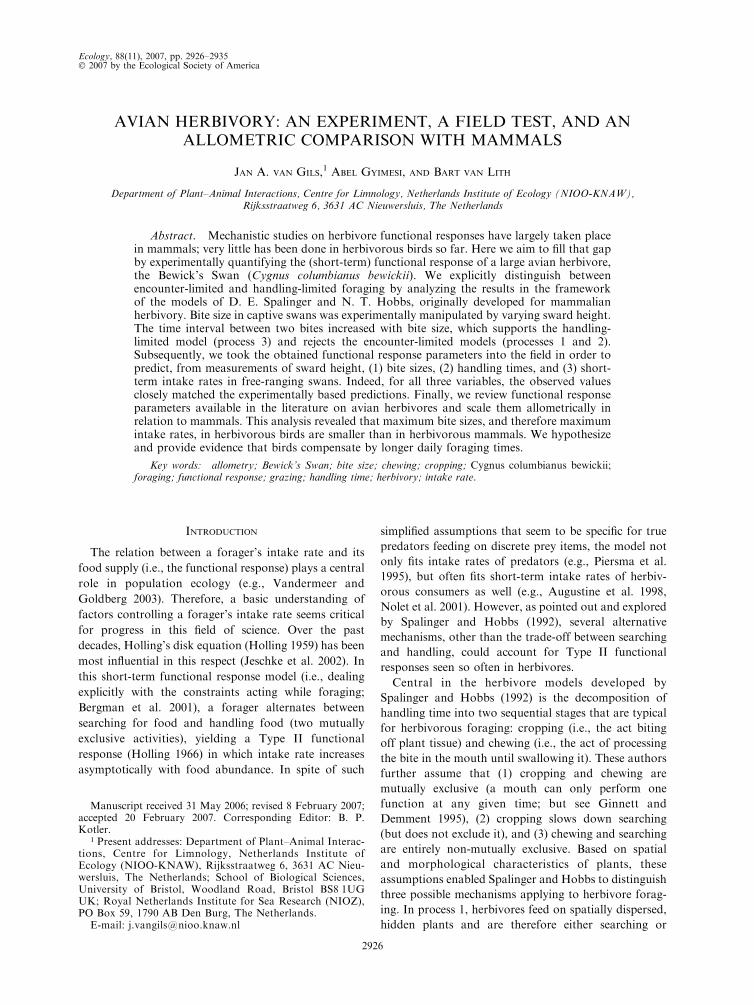
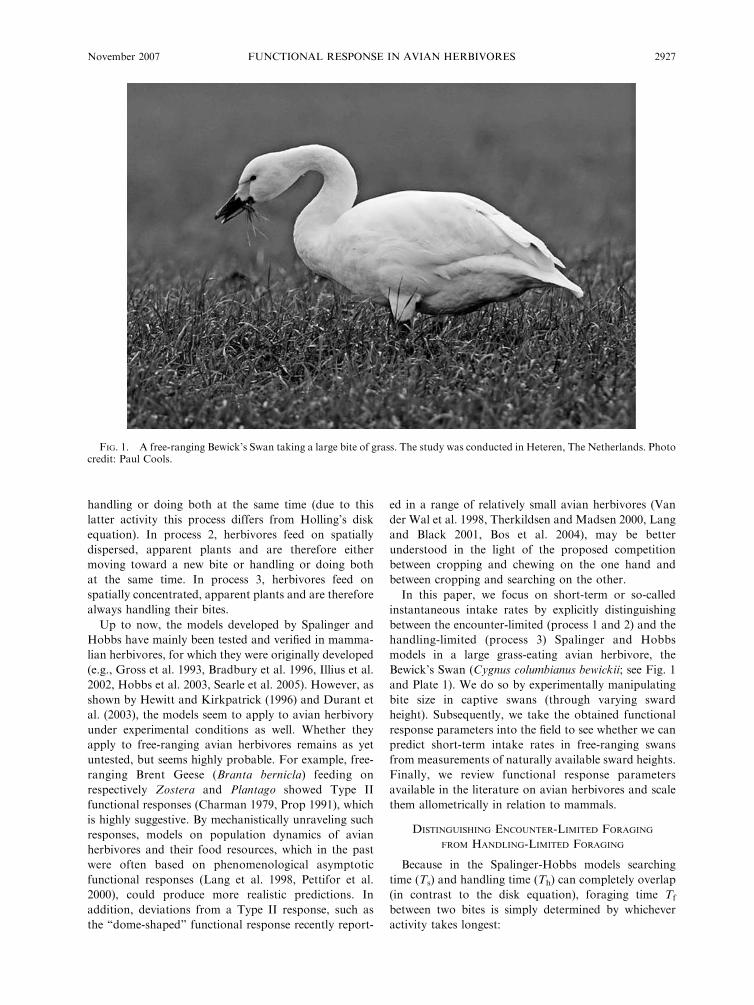
Bewick’s Swan (Cygnus columbianus bewickii; see Fig. 1
and Plate 1). We do so by experimentally manipulating
bite size in captive swans (through varying sward
height). Subsequently, we take the obtained functional
response parameters into the field to see whether we can
predict short-term intake rates in free-ranging swans
from measurements of naturally available sward heights.
Finally, we review functional response parameters
available in the literature on avian herbivores and scale
them allometrically in relation to mammals.
DISTINGUISHING ENCOUNTER-LIMITED FORAGING
FROM HANDLING-LIMITED FORAGING
Because in the Spalinger-Hobbs models searching
time (Ts) and handling time (Th) can completely overlap
(in contrast to the disk equation), foraging time Tf
between two bites is simply determined by whichever
activity takes longest:
FIG. 1. A free-ranging Bewick’s Swan taking a large bite of grass. The study was conducted in Heteren, The Netherlands. Photocredit: Paul Cools.
November 2007 2927FUNCTIONAL RESPONSE IN AVIAN HERBIVORES
Tf ¼ maxðTs; ThÞ: ð1Þ
An increase in bite size S increases handling time
linearly, but does not affect searching time. Therefore, a
positive (and linear) correlation between Tf and S is
diagnostic for process 3 foraging. According to Spa-
linger and Hobbs, handling time Th is affected by S in
the following manner:
Th ¼ Tc þ Tp ¼ Tc þS
Rmax
ð2Þ
where Tc is cropping time, Tp is processing (chewing)
time, and Rmax is the maximum rate of chewing (which
would occur in the absence of cropping). Therefore, if
process 3 holds, plotting Tf as a function of S yields an
estimate of Tc (intercept) and Rmax (inverse of the slope).
MATERIAL AND METHODS
Experimental design
In a grassland field at the Centre for Terrestrial
Ecology, Netherlands Institute of Ecology, Heteren, The
Netherlands, we created a mosaic of 24 plots (103 10 m
each), in which we manipulated sward height into six
categories, leading to a one-factor design with four
replicates. Going from short to tall grass, a plot was
used 1, 4, 8, 12, 16, or 20 days after it was mowed (Fig.
2). The spatial alignment of this mowing scheme
followed a randomized block design, with four blocks
of each six plots. Each plot was only used for a single
trial, leading to 24 trials in total.
Six captive Bewick’s Swans were used in this
experiment (all adults; three of them were wild-caught
[two males, one female]; the other three were born in
captivity [one male, two females]). In each trial, the birds
were grouped into three pairs (pair 1, containing
individuals AN and BD; pair 2, AP and AT; pair 3,
BA and BB), each pair feeding at a fenced quarter of an
experimental plot (leading to four subplots per plot, of
which one served as a control subplot). Two pairs
adjusted well to the daily protocol and fed normally
within the experimental plots (pairs 1 and 3). Although
pair 2 occasionally seemed less motivated to participate,
we nevertheless maintained it in the analyses (but we will
compare the results both with and without this pair).
Furthermore, during one trial one of the pairs escaped
(pair 3), causing anxiety among the other individuals,
which is why this single trial was omitted from the
analyses. Therefore, 23 trials remained for the analyses.
We performed one trial per day, and each trial was
recorded on video (digital video camera NV-GS15;
Panasonic, Secaucus, New Jersey, USA).
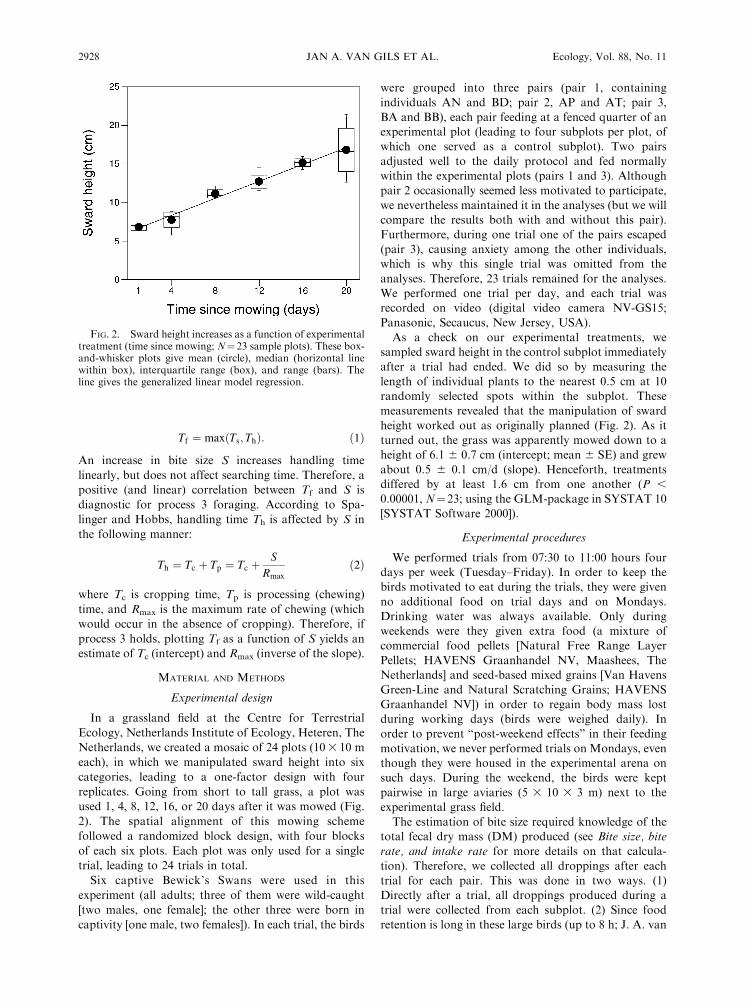
As a check on our experimental treatments, we
sampled sward height in the control subplot immediately
after a trial had ended. We did so by measuring the
length of individual plants to the nearest 0.5 cm at 10
randomly selected spots within the subplot. These
measurements revealed that the manipulation of sward
height worked out as originally planned (Fig. 2). As it
turned out, the grass was apparently mowed down to a
height of 6.1 6 0.7 cm (intercept; mean 6 SE) and grew
about 0.5 6 0.1 cm/d (slope). Henceforth, treatments
differed by at least 1.6 cm from one another (P ,
0.00001, N¼23; using the GLM-package in SYSTAT 10
[SYSTAT Software 2000]).
Experimental procedures
We performed trials from 07:30 to 11:00 hours four
days per week (Tuesday–Friday). In order to keep the
birds motivated to eat during the trials, they were given
no additional food on trial days and on Mondays.
Drinking water was always available. Only during
weekends were they given extra food (a mixture of
commercial food pellets [Natural Free Range Layer
Pellets; HAVENS Graanhandel NV, Maashees, The
Netherlands] and seed-based mixed grains [Van Havens
Green-Line and Natural Scratching Grains; HAVENS
Graanhandel NV]) in order to regain body mass lost
during working days (birds were weighed daily). In
order to prevent ‘‘post-weekend effects’’ in their feeding
motivation, we never performed trials on Mondays, even
though they were housed in the experimental arena on
such days. During the weekend, the birds were kept
pairwise in large aviaries (5 3 10 3 3 m) next to the
experimental grass field.
The estimation of bite size required knowledge of the
total fecal dry mass (DM) produced (see Bite size, bite
rate, and intake rate for more details on that calcula-
tion). Therefore, we collected all droppings after each
trial for each pair. This was done in two ways. (1)
Directly after a trial, all droppings produced during a
trial were collected from each subplot. (2) Since food
retention is long in these large birds (up to 8 h; J. A. van
FIG. 2. Sward height increases as a function of experimentaltreatment (time since mowing; N¼ 23 sample plots). These box-and-whisker plots give mean (circle), median (horizontal linewithin box), interquartile range (box), and range (bars). Theline gives the generalized linear model regression.
JAN A. VAN GILS ET AL.2928 Ecology, Vol. 88, No. 11
Gils and A. Gyimesi, unpublished data), the birds were
kept pairwise without food for 10 h in small chambers
(1.5 3 1 3 1 m), where droppings would fall through a
wide mesh, allowing us to collect all droppings produced
after each trial (but originating from the food intake
during the trial). In spite of contending with such long
retention times, we were sure all droppings originated
from food intake during the 3.5-h trials only as the birds
were given no other food on trial days.
Video analyses
In order to estimate interbite interval Tf, we timed
each bite of each bird by replaying the videotapes using
The Observer (Noldus Information Technology 1997).
As we were interested in short-term intake rates during
foraging bouts only, we discarded intervals between two
successive bites that were due to non-feeding activities
such as resting, preening, drinking, vigilance, or having
social interactions. Because of the amount of video
material to analyze (23 trials with six birds each trial,
leading to 483 h of observations), we only analyzed one
quarter of each trial. In order to spread this selection
across the entire trial, we analyzed each first minute in a
block of four minutes. On average, we obtained
estimates for 1381 6 89 (mean 6 SE) suitable interbite
intervals per pair per trial.
Field observations
During three winters (2003–2004, 2004–2005, and
2005–2006), from mid-November to mid-March, we
observed foraging behavior of free-living Bewick’s
Swans in grasslands just north of Amersfoort, The
Netherlands (Polder Arkemheen and Polder Zeldert;
528140 N and 58250 E). Observations were made from a
car at a distance of 40–300 m using a 20–603 spotting
scope (Kowa, Chuo-Ku Tokyo, Japan) and a 603
optolite (Meade Instruments, Irvine, California, USA).
By means of focal sampling during a full hour (Martin
and Bateson 1993), one observer counted each bite
taken by a haphazardly selected individual (first two
winters) or by a known individual carrying a neck collar
(third winter; see van Gils et al. 2007 for more details).
In order to estimate short-term bite rate, 1/Tf, during
foraging only, we needed to correct the total bite counts
for non-feeding bouts. Therefore, we additionally scored
the focal bird’s behavior (i.e., foraging or not foraging)
at the beginning of each minute. Short-term bite rate
could then be calculated as the number of bites taken
during the full hour divided by the proportion of time
spent actively feeding. During the very same hour,
another observer kept track of the number of fecal
droppings produced. As it turned out to be hard to keep
track of the same individual during a full hour (except
during the third winter and during all bite scans), we
applied the ‘‘hourly block method’’ (Bedard and
Gauthier 1986) during the first two winters. This
involves observing a single, haphazardly selected indi-
vidual until losing contact, after which the observer
immediately switches to another haphazardly selected
individual. This goes on until a full hour has passed. At
the end of the day we collected dropping and grass
samples at the site of observation in order to assess bite
size and sward height. Each day we collected ;15
droppings (14.3 6 0.4 [mean 6 SE] droppings) and
;0.2 kg fresh mass of grass (taking intact aboveground
leaves only). In the laboratory, length of individual
plants was measured to the nearest millimeter in order
to assess a sample’s sward height (measuring 356 6 114
[mean 6 SE] leaves per sample). We observed 4.1 6 0.4
h/d during 30 different days, spread evenly across all
three field seasons (SE ¼ 1.7 days/winter).
Bite size, bite rate, and intake rate
Bite size, S (in grams), was calculated as U/B, where U
is the total amount of ingested grass dry mass (in grams)
and B is the total number of bites taken. Both U and B
were calculated per pair per trial (experiment) or per
individual per hour (field). U was calculated as
F(100/[100 � E ]), where F is the total amount of fecal
dry matter and E is the (apparent) digestive efficiency (as
a percentage). The total amount of fecal dry matter was
either measured directly per pair per trial (experiment)
or calculated per capita per hour (field) as the hourly
defecation rate times the daily mean fecal dry mass per
dropping. The digestive efficiency was calculated as (1�[ADFg/ADFf])100%, where ADFg is the concentration
(as a percentage) of acid detergent fiber (ADF; cellulose
and lignin) in the grass and ADFf is the ADF
concentration (as a percentage) in the feces. Generally,
ADF cannot be digested by herbivorous waterfowl (van
Soest 1982, Prop and Vulink 1992) and is therefore often
used as a marker (Durant 2003). We measured ADF in a
subset of samples using the ANKOM220 Fiber Analyzer
(ANKOM Technology, Macedon, New York, USA). In
addition, we used near infrared spectroscopy (NIRS;
multipurpose analyzer, Bruker Optics, Ettlingen, Ger-
many) to predict ADF concentrations in the remaining
samples (i.e., most samples collected in the experiment,
all samples collected in the 2003–2004 winter and about
half of the samples from the 2005–2006 winter;
calibration for grass, R2 ¼ 99.6%, root mean square
error of estimation [RMSEE] ¼ 0.4; feces, R2 ¼ 99.1%,
RMSEE ¼ 0.4; cross-validation for grass, R2 ¼ 74.9%,
root mean square error of cross-validation [RMSECV]¼1.7; feces, R2 ¼ 87.6, RMSECV ¼ 0.8; calibrations and
cross-validations were based on the subset of samples
just described; see Agnew et al. [2004] for an application
of NIRS to predict ADF concentrations in grass).
Estimating bite size from fecal dry mass and bite counts
is an established method in waterfowl ecology (Owen et
al. 1992, Durant et al. 2003). It works well when all
droppings originating from the bites observed can be
collected (such as in the experiment) or when bite and
dropping rate are more or less constant throughout the
day (such as in the field 2–3 h after the initiation of
feeding [J. A. van Gils and P. P. de Vries, unpublished
November 2007 2929FUNCTIONAL RESPONSE IN AVIAN HERBIVORES

data], which is why nearly all field observations started
after 11:00 hours).
In short vegetation, bite size is presumably limited by
height of the vegetation, while in taller vegetation bill
size may set the limits (Durant et al. 2003, Cope et al.
2005). Therefore, when modeling bite size, S, as a
function of sward height, L, we applied two regression
models (using the linear and nonlinear mixed-effects
models [NLME] package in R [R Development Core
Team 2005]), one in which we ignored the constraints by
bill size,
S ¼ aLþ b ð3Þ
and one in which we included an asymptote (cf. Durant
et al. 2003),
S ¼ aL
1þ bL: ð4Þ
In both models, a and b are regression coefficients. We
compared Akaike Information Criterion (AIC) values
(Burnham and Anderson 1998) to detect the most
parsimonious model (using the ANOVA function in R).
Following Kohlmann et al. (1999), gamma distribu-
tions were fitted to the experimentally obtained distri-
butions of intervals Tf (in seconds) between subsequent
bites. We applied Kohlmann et al.’s model 1 using the
NLME package in R (step sizes in the distributions were
set at 0.1 s). This yielded an estimated Tf per pair per
trial. This enabled the expression of the short-term bite
rate (per second) as 1/Tf and the instantaneous intake
rate (in grams per second) as S/Tf (note that this
contrasts with the calculation of long-term bite rate,
which would simply be the total number of bites divided
by total time [including non-feeding bouts]).
RESULTS
Distinguishing encounter-limited foraging
from handling-limited foraging
In the experiment, interbite interval, Tf, increased
linearly with bite size, S (Fig. 3; hierarchical linear model
[HLM]:P, 0.05,N¼3 level 2 observations and 69 level 1observations using the unit of a pair as the identifier;
reduced major axis [RMA] regression of Tf [in seconds]
vs. S [in grams] yielded Tf¼ 1.13þ 16.66S; this positive
effect remains with a similar slope and intercept, but at P
, 0.00001, with reanalysis excluding the less-motivated
pair [2]: Tf¼ 1.05þ 16.57S). Therefore, this result rejects
processes 1 and 2 as potential candidate functional
responses and supports the process 3 mechanism.
Additionally, there was no sign for a mixture of processes
operating at the same time. If the smallest bites would be
so small that they would impose an encounter constraint
rather than a handling constraint, then the relation
plotted in Fig. 3 would be accelerating rather than linear
(given Eq. 1), and this is obviously not the case. For this
reason, interbite interval, Tf, can be interpreted as
handling time, Th, composed of a fixed cropping time,
Tc, of 1.13 s (¼ 0.02 min) and a bite-size-dependent
processing time, Tp, of 16.66 s/g DM (Fig. 3; equivalent
to an Rmax of 3.60 g DM/min).
Modeling bite size, handling time, and intake rate
as a function of sward height
We modeled bite size as a function of sward height.
This enabled us to predict handling time and thus intake
rate from relatively simple measurements of sward
height rather than from more difficult measurements
of bite size.
When relating bite size to the experimentally manip-
ulated sward height, regression parameter b did not
differ from 0 in either the linear model (Eq. 3; P . 0.95,
AIC¼�436.01) or the asymptotic model (Eq. 4; P . 0.6,
AIC ¼�435.89). Therefore, a linear model without an
intercept is the most parsimonious and therefore most
preferred model (Fig. 4A; AIC¼�441.89). This allowedus to estimate the common slope (mean 6 SE): 1.38 6
0.09 mg DM/cm sward height (Fig. 4A; P , 0.00001, N
¼ 3 level 2 observations and 69 level 1 observations; this
result remains unaltered, at a similar P value, if we
exclude pair 2: 1.39 6 0.07 mg DM/cm).
Combining the latter parameter estimate with the
observed relation between handling time, Th (in
minutes), and bite size, S (in grams) (Th ¼ 0.02 þ[S/3.60]; Fig. 3) enabled us to predict S (in grams) (S¼1.383 10�3L; solid line in Fig. 4B), Th (in minutes; Th¼0.02þf[1.383 10�3L]/3.60g; Fig. 4C), and subsequently
instantaneous intake rate I¼S/Th (in grams per minute)
(I¼ [3.60 3 1.38 3 10�3 L]/[3.60 3 0.02þ 1.38 3 10�3L];
Fig. 4D) as a function of sward height, L (in
centimeters). While doing so, we took into account the
error around each estimate (dashed lines in Fig. 4). Note
that, as expected under process 3 foraging, the observed
FIG. 3. Interbite interval, Tf, increases with bite size, S(DM, dry mass). Each data point gives an estimate per pair pertrial, and each line gives a pair-specific regression. For each paira positive correlation is found, which is support for theSpalinger and Hobbs (1992) process 3 model. Henceforth, theintervals can be interpreted as handling times (Th), composed ofa cropping time and a bite-size-dependent processing time.
JAN A. VAN GILS ET AL.2930 Ecology, Vol. 88, No. 11
linear relationship between bite size and sward height
leads to an asymptotic relationship between intake rate,
I, and sward height.
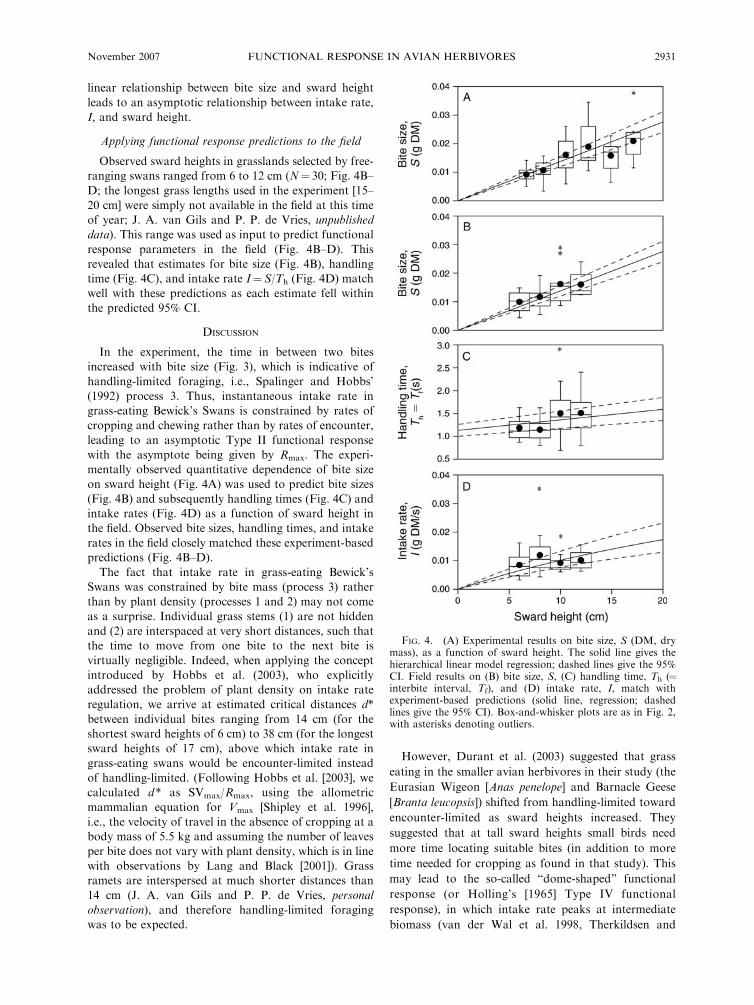
Applying functional response predictions to the field
Observed sward heights in grasslands selected by free-
ranging swans ranged from 6 to 12 cm (N¼ 30; Fig. 4B–
D; the longest grass lengths used in the experiment [15–
20 cm] were simply not available in the field at this time
of year; J. A. van Gils and P. P. de Vries, unpublished
data). This range was used as input to predict functional
response parameters in the field (Fig. 4B–D). This
revealed that estimates for bite size (Fig. 4B), handling
time (Fig. 4C), and intake rate I¼S/Th (Fig. 4D) match
well with these predictions as each estimate fell within
the predicted 95% CI.
DISCUSSION
In the experiment, the time in between two bites
increased with bite size (Fig. 3), which is indicative of
handling-limited foraging, i.e., Spalinger and Hobbs’
(1992) process 3. Thus, instantaneous intake rate in
grass-eating Bewick’s Swans is constrained by rates of
cropping and chewing rather than by rates of encounter,
leading to an asymptotic Type II functional response
with the asymptote being given by Rmax. The experi-
mentally observed quantitative dependence of bite size
on sward height (Fig. 4A) was used to predict bite sizes
(Fig. 4B) and subsequently handling times (Fig. 4C) and
intake rates (Fig. 4D) as a function of sward height in
the field. Observed bite sizes, handling times, and intake
rates in the field closely matched these experiment-based
predictions (Fig. 4B–D).
The fact that intake rate in grass-eating Bewick’s
Swans was constrained by bite mass (process 3) rather
than by plant density (processes 1 and 2) may not come
as a surprise. Individual grass stems (1) are not hidden
and (2) are interspaced at very short distances, such that
the time to move from one bite to the next bite is
virtually negligible. Indeed, when applying the concept
introduced by Hobbs et al. (2003), who explicitly
addressed the problem of plant density on intake rate
regulation, we arrive at estimated critical distances d*
between individual bites ranging from 14 cm (for the
shortest sward heights of 6 cm) to 38 cm (for the longest
sward heights of 17 cm), above which intake rate in
grass-eating swans would be encounter-limited instead
of handling-limited. (Following Hobbs et al. [2003], we
calculated d* as SVmax/Rmax, using the allometric
mammalian equation for Vmax [Shipley et al. 1996],
i.e., the velocity of travel in the absence of cropping at a
body mass of 5.5 kg and assuming the number of leaves
per bite does not vary with plant density, which is in line
with observations by Lang and Black [2001]). Grass
ramets are interspersed at much shorter distances than
14 cm (J. A. van Gils and P. P. de Vries, personal
observation), and therefore handling-limited foraging
was to be expected.
However, Durant et al. (2003) suggested that grass
eating in the smaller avian herbivores in their study (the
Eurasian Wigeon [Anas penelope] and Barnacle Geese
[Branta leucopsis]) shifted from handling-limited toward
encounter-limited as sward heights increased. They
suggested that at tall sward heights small birds need
more time locating suitable bites (in addition to more
time needed for cropping as found in that study). This
may lead to the so-called ‘‘dome-shaped’’ functional
response (or Holling’s [1965] Type IV functional
response), in which intake rate peaks at intermediate
biomass (van der Wal et al. 1998, Therkildsen and
FIG. 4. (A) Experimental results on bite size, S (DM, drymass), as a function of sward height. The solid line gives thehierarchical linear model regression; dashed lines give the 95%CI. Field results on (B) bite size, S, (C) handling time, Th (¼interbite interval, Tf), and (D) intake rate, I, match withexperiment-based predictions (solid line, regression; dashedlines give the 95% CI). Box-and-whisker plots are as in Fig. 2,with asterisks denoting outliers.
November 2007 2931FUNCTIONAL RESPONSE IN AVIAN HERBIVORES
Madsen 2000, Lang and Black 2001, Bos et al. 2004).
Smaller grazers may need to be more selective as the
morphology of their bills seems to be a compromise
between conflicting functional demands of grazing on
the one hand and filter-feeding on the other (van der
Leeuw et al. 2003). Larger avian herbivores, such as the
Greylag Goose (Anser anser) and the Bewick’s Swan
(this study), do not seem to have such problems and
therefore obey the process 3 equation across all sward
heights studied.
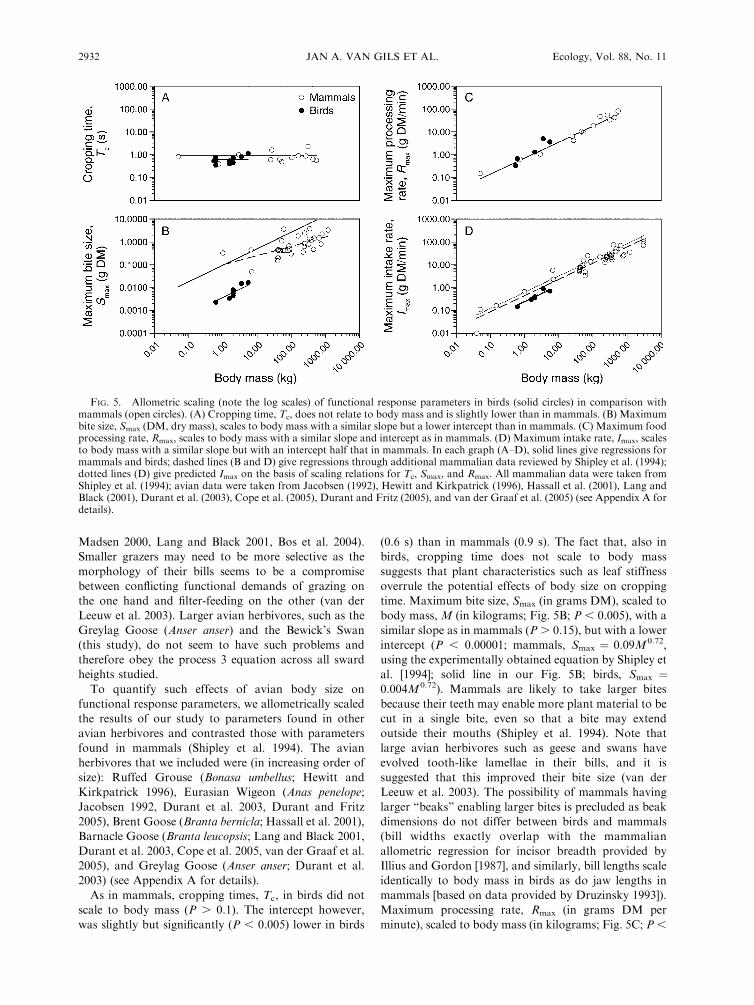
To quantify such effects of avian body size on
functional response parameters, we allometrically scaled
the results of our study to parameters found in other
avian herbivores and contrasted those with parameters
found in mammals (Shipley et al. 1994). The avian
herbivores that we included were (in increasing order of
size): Ruffed Grouse (Bonasa umbellus; Hewitt and
Kirkpatrick 1996), Eurasian Wigeon (Anas penelope;
Jacobsen 1992, Durant et al. 2003, Durant and Fritz
2005), Brent Goose (Branta bernicla; Hassall et al. 2001),
Barnacle Goose (Branta leucopsis; Lang and Black 2001,
Durant et al. 2003, Cope et al. 2005, van der Graaf et al.
2005), and Greylag Goose (Anser anser; Durant et al.
2003) (see Appendix A for details).
As in mammals, cropping times, Tc, in birds did not
scale to body mass (P . 0.1). The intercept however,
was slightly but significantly (P , 0.005) lower in birds
(0.6 s) than in mammals (0.9 s). The fact that, also in
birds, cropping time does not scale to body mass
suggests that plant characteristics such as leaf stiffness
overrule the potential effects of body size on cropping
time. Maximum bite size, Smax (in grams DM), scaled to
body mass, M (in kilograms; Fig. 5B; P , 0.005), with a
similar slope as in mammals (P . 0.15), but with a lower
intercept (P , 0.00001; mammals, Smax ¼ 0.09M0.72,
using the experimentally obtained equation by Shipley et
al. [1994]; solid line in our Fig. 5B; birds, Smax ¼0.004M0.72). Mammals are likely to take larger bites
because their teeth may enable more plant material to be
cut in a single bite, even so that a bite may extend
outside their mouths (Shipley et al. 1994). Note that
large avian herbivores such as geese and swans have
evolved tooth-like lamellae in their bills, and it is
suggested that this improved their bite size (van der
Leeuw et al. 2003). The possibility of mammals having
larger ‘‘beaks’’ enabling larger bites is precluded as beak
dimensions do not differ between birds and mammals
(bill widths exactly overlap with the mammalian
allometric regression for incisor breadth provided by
Illius and Gordon [1987], and similarly, bill lengths scale
identically to body mass in birds as do jaw lengths in
mammals [based on data provided by Druzinsky 1993]).
Maximum processing rate, Rmax (in grams DM per
minute), scaled to body mass (in kilograms; Fig. 5C; P ,
FIG. 5. Allometric scaling (note the log scales) of functional response parameters in birds (solid circles) in comparison withmammals (open circles). (A) Cropping time, Tc, does not relate to body mass and is slightly lower than in mammals. (B) Maximumbite size, Smax (DM, dry mass), scales to body mass with a similar slope but a lower intercept than in mammals. (C) Maximum foodprocessing rate, Rmax, scales to body mass with a similar slope and intercept as in mammals. (D) Maximum intake rate, Imax, scalesto body mass with a similar slope but with an intercept half that in mammals. In each graph (A–D), solid lines give regressions formammals and birds; dashed lines (B and D) give regressions through additional mammalian data reviewed by Shipley et al. (1994);dotted lines (D) give predicted Imax on the basis of scaling relations for Tc, Smax, and Rmax. All mammalian data were taken fromShipley et al. (1994); avian data were taken from Jacobsen (1992), Hewitt and Kirkpatrick (1996), Hassall et al. (2001), Lang andBlack (2001), Durant et al. (2003), Cope et al. (2005), Durant and Fritz (2005), and van der Graaf et al. (2005) (see Appendix A fordetails).
JAN A. VAN GILS ET AL.2932 Ecology, Vol. 88, No. 11
0.05) with a similar slope (P . 0.2) and intercept (P .
0.2) as in mammals (Rmax ¼ 0.71M0.70). This may seem
remarkable at first, since birds, unlike mammals, do not
chew and would therefore be expected to have higher
maximum processing rates. However, because they do
not chew, it may take them longer to maneuver tall grass
leaves that are hanging out of the bill into the mouth
(Fig. 1). This so-called ‘‘spaghetti effect’’ (Ungar 1996)
has been observed in a variety of waterfowl species
(Lang and Black 2001, Durant et al. 2003). The time loss
of the ‘‘spaghetti effect’’ in birds may be similar to the
time loss of chewing in mammals, which would explain
the similarity in maximum processing rate. Maximum
intake rate, Imax (in grams DM per minute), scaled to
body mass (in kilograms; Fig. 5D; P , 0.005) with a
similar slope as in mammals (P . 0.4), but with an
intercept two times lower (P , 0.005; mammals, Imax ¼0.45M0.71; birds, Imax ¼ 0.24M0.71). Note that these
maximum intake rates are correctly predicted by
inserting the allometric scaling relationship for Tc, Smax,
and Rmax into Eq. 2 (yielding Imax¼ 0.26M0.71 for birds
and comparable to 0.63M0.71 predicted by Shipley et al.
[1994] for mammals; dotted lines in Fig. 5D), which is an
additional support for avian herbivory to be governed
by Spalinger and Hobbs process 3 (i.e., given that Tc and
Rmax do not differ much between equally sized birds and
mammals, a lower Smax in birds logically leads to a lower
Imax under process 3 foraging).
In their struggle to at least maintain a balanced energy
budget, there may be several ways in which birds could
compensate for such lower (instantaneous) intake rates
that are only half those of mammals. First of all, they
could be better at digesting their food. However, this
seems unlikely as evidence suggests birds have similar or
even lower digestive efficiencies than mammals (Karasov
1990, Grajal 1995), possibly because the ability to fly has
precluded the evolution of a complex and heavy
digestive system as found in mammals (Dudley and
Vermeij 1992). Secondly, birds may have lower energy
requirements than mammals. Also this seems unlikely as
birds generally have similar or even higher metabolic
rates than mammals (Nagy 2005). Thirdly, and most
likely, birds spend more time feeding per day than
mammals do. Indeed, when contrasting herbivorous
birds with herbivorous mammals, we found that birds
allocated more than twice (2.4 times) as much time to
foraging (9.7 6 0.6 h per 24 h) (mean 6 SE) than
mammals did (4.1 6 0.6 h per 24 h; R2 ¼ 0.54, P ,
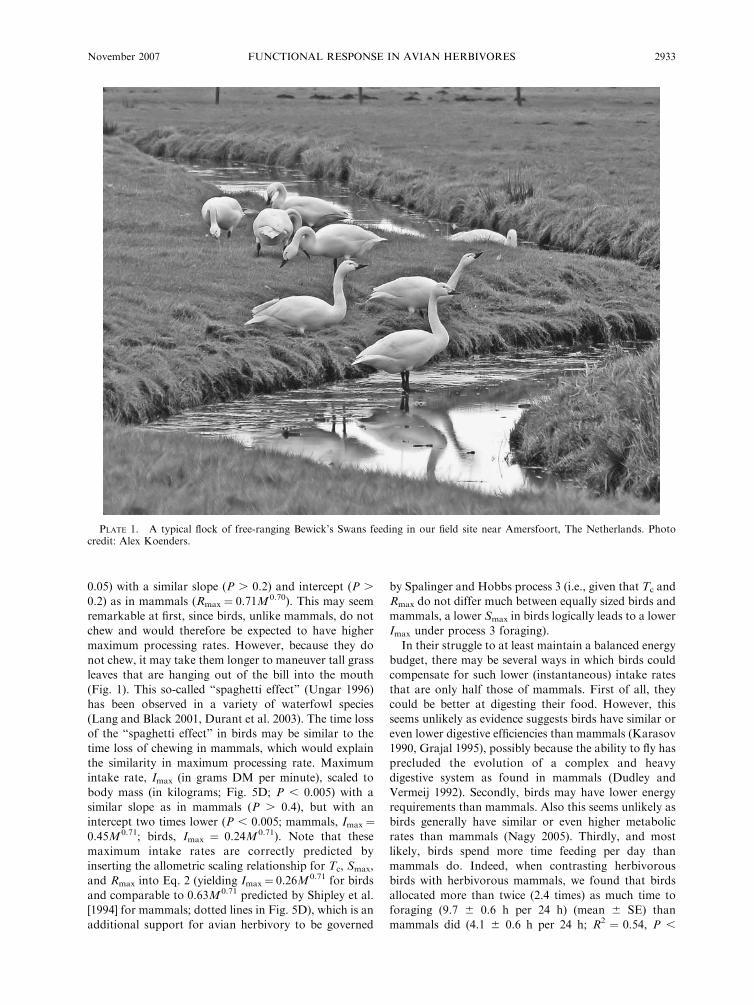
PLATE 1. A typical flock of free-ranging Bewick’s Swans feeding in our field site near Amersfoort, The Netherlands. Photocredit: Alex Koenders.
November 2007 2933FUNCTIONAL RESPONSE IN AVIAN HERBIVORES
0.00001, N ¼ 42; see Appendix B for studies reviewed).
Note that the factor 2.4 exactly matches the ratio
between the mechanistically predicted Imax of a mammal
and that of a bird: 0.63M0.71/0.26M0.71 ¼ 2.4. Further
note that this analysis does not suggest that mammals
are not able to feed longer than this. It rather suggests
that, generally speaking, they do not need to feed longer
in order to maintain a balanced energy budget. Of
course, under more stringent conditions, such as when
their population has grown to carrying capacity, short-
term intake rates may fall well below Imax (e.g., due to
competition), urging mammals to stretch their working
day as well (a point of view shared by Jeschke and
Tollrian [2005]).
ACKNOWLEDGMENTS
We are grateful to Pieter Coehoorn, Els Corporaal, BertHidding, Rik van Kraaij, Rinze de Leeuw, Daan Liefhebber,Reinder Radersma, and Peter de Vries for their observationsduring many long, cold, and windy hours in the field. In the lab,Dick Kuiper from the Van Hall Instituut assisted during theADF analyses, and Harry Korthals took care of all NIRSmeasurements. We thank Marcel Klaassen for discussion andOlivier Duriez, Stephan G. Kohlmann, Bart A. Nolet, and twoanonymous referees for constructive comments on draftmanuscripts. The experiment was approved by the DutchAnimal Welfare Committee (protocol CL 03.04). This ispublication 4020 of the Netherlands Institute of Ecology(NIOO-KNAW) and 481 of the Centre for Wetland Ecology.
LITERATURE CITED
Agnew, R. E., R. S. Park, C. S. Mayne, and A. S. Laidlaw.2004. Potential of near infrared spectroscopy to predict thevoluntary intake of grazed grass. Animal Feed Science andTechnology 115:169–178.
Augustine, D. J., L. E. Frelich, and P. A. Jordan. 1998.Evidence for two alternate stable states in an ungulategrazing system. Ecological Applications 8:1260–1269.
Bedard, J., and G. Gauthier. 1986. Assessment of faecal outputin geese. Journal of Applied Ecology 23:77–90.
Bergman, C. M., J. M. Fryxell, C. C. Gates, and D. Fortin.2001. Ungulate foraging strategies: Energy maximizing ortime minimizing? Journal of Animal Ecology 70:289–300.
Bos, D., J. van de Koppel, and F. J. Weissing. 2004. Dark-bellied Brent geese aggregate to cope with increased levels ofprimary production. Oikos 107:485–496.
Bradbury, J. W., S. L. Vehrencamp, K. E. Clifton, and L. M.Clifton. 1996. The relationship between bite rate and localforage abundance in wild Thomson’s gazelles. Ecology 77:2237–2255.
Burnham, K. P., and D. R. Anderson. 1998. Model selectionand inference: a practical information-theoretic approach.Springer-Verlag, New York, New York, USA.
Charman, K. 1979. Feeding ecology and energetics of the dark-bellied Brent goose (Branta bernicla bernicla) in Essex andKent. Pages 451–465 in R. L. Jefferies and A. Davies, editors.Ecological processes in coastal environments. Blackwood,London, UK.
Cope, D. R., M. J. J. E. Loonen, J. M. Rowcliffe, and R. A.Pettifor. 2005. Larger barnacle geese (Branta leucopsis) aremore efficient feeders: a possible mechanism for observedbody size–fitness relationships. Journal of Zoology 265:37–42.
Druzinsky, R. E. 1993. The time allometry of mammalianchewing movements: chewing frequency scales with body
mass in mammals. Journal of Theoretical Biology 160:427–440.
Dudley, R., and G. J. Vermeij. 1992. Do the powerrequirements of flapping flight constrain folivory in flyinganimals? Functional Ecology 6:101–104.
Durant, D. 2003. The digestion of fibre in herbivorousAnatidae—a review. Wildfowl 54:7–24.
Durant, D., and H. Fritz. 2005. Variation of pecking rate withsward height in wild wigeon Anas penelope. Journal ofOrnithology 147:367–370.
Durant, D., H. Fritz, S. Blais, and P. Duncan. 2003. Thefunctional response in three species of herbivorous Anatidae:effects of sward height, body mass and bill size. Journal ofAnimal Ecology 72:220–231.
Ginnett, T. F., and M. W. Demment. 1995. The functionalresponse of herbivores—analysis and test of a simplemechanistic model. Functional Ecology 9:376–384.
Grajal, A. 1995. Digestive efficiency of the hoatzin, Opisthoco-mus hoazin—a folivorous bird with foregut fermentation. Ibis137:383–388.
Gross, J. E., L. A. Shipley, N. T. Hobbs, D. E. Spalinger, andB. A. Wunder. 1993. Functional response of herbivores infood-concentrated patches: tests of a mechanistic model.Ecology 74:778–791.
Hassall, M., R. Riddington, and A. Helden. 2001. Foragingbehaviour of Brent geese, Branta b. bernicla, on grasslands:effects of sward length and nitrogen content. Oecologia 127:97–104.
Hewitt, D. G., and R. L. Kirkpatrick. 1996. Forage intake ratesof ruffed grouse and potential effects on grouse density.Canadian Journal of Zoology 74:2016–2024.
Hobbs, N. T., J. E. Gross, L. A. Shipley, D. E. Spalinger, andB. A. Wunder. 2003. Herbivore functional response inheterogeneous environments: a contest among models.Ecology 84:666–681.
Holling, C. S. 1959. Some characteristics of simple types ofpredation and parasitism. Canadian Entomologist 91:385–398.
Holling, C. S. 1965. The functional response of predators toprey density and its role in mimicry and populationregulation. Memoires of the Entomological Society ofCanada 45:3–60.
Holling, C. S. 1966. The functional response of invertebratepredators to prey density. Memoires of the EntomologicalSociety of Canada 48:1–86.
Illius, A. W., P. Duncan, C. Richard, and P. Mesochina. 2002.Mechanisms of functional response and resource exploitationin browsing roe deer. Journal of Animal Ecology 71:723–734.
Illius, A. W., and I. J. Gordon. 1987. The allometry of foodintake in grazing ruminants. Journal of Animal Ecology 56:989–999.
Jacobsen, O. W. 1992. Factors affecting selection of nitrogen-fertilized grassland areas by breeding wigeon Anas penelope.Ornis Scandinavica 23:121–131.
Jeschke, J. M., M. Kopp, and R. Tollrian. 2002. Predatorfunctional responses: discriminating between handling anddigesting prey. Ecological Monographs 72:95–112.
Jeschke, J. M., and R. Tollrian. 2005. Predicting herbivorefeeding times. Ethology 111:187–206.
Karasov, W. H. 1990. Digestion in birds: chemical andphysiological determinants and ecological implications.Studies in Avian Biology 13:391–415.
Kohlmann, S. G., J. H. Matis, and K. L. Risenhoover. 1999.Estimating handling times for herbivore diets: a statisticalmethod using the gamma distribution. Journal of AnimalEcology 68:638–645.
Lang, A., and J. M. Black. 2001. Foraging efficiency inBarnacle geese Branta leucopsis: a functional response to
JAN A. VAN GILS ET AL.2934 Ecology, Vol. 88, No. 11

sward height and an analysis of sources of individualvariation. Wildfowl 52:7–20.
Lang, A., A. I. Houston, J. M. Black, R. A. Pettifor, and J.Prop. 1998. From individual feeding performance to predict-ing population dynamics in barnacle geese: the spring stagingmodel. Norsk Polarinstitutt Skrifter 200:203–211.
Martin, P., and P. Bateson. 1993. Measuring behaviour: anintroductory guide. Cambridge University Press, Cambridge,UK.
Nagy, K. A. 2005. Field metabolic rate and body size. Journalof Experimental Biology 208:1621–1625.
Noldus Information Technology. 1997. The Observer: supportpackage for video analysis. Reference manual. Version 4.0for Windows edition. Noldus Information Technology,Wageningen, The Netherlands.
Nolet, B. A., O. Langevoord, R. M. Bevan, K. R. Engelaar, M.Klaassen, R. J. W. Mulder, and S. van Dijk. 2001. Spatialvariation in tuber depletion by swans explained by differencesin net intake rates. Ecology 82:1655–1667.
Owen, M., R. L. Wells, and J. M. Black. 1992. Energy budgetsof wintering barnacle geese: the effects of declining foodresources. Ornis Scandinavica 23:451–458.
Pettifor, R. A., R. W. G. Caldow, J. M. Rowcliffe, J. D. Goss-Custard, J. M. Black, K. H. Hodder, A. I. Houston, A. Lang,and J. Webb. 2000. Spatially explicit, individual-based,behavioural models of the annual cycle of two migratorygoose populations. Journal of Applied Ecology 37:s103–135.
Piersma, T., J. van Gils, P. de Goeij, and J. van der Meer. 1995.Holling’s functional response model as a tool to link thefood-finding mechanism of a probing shorebird with itsspatial distribution. Journal of Animal Ecology 64:493–504.
Prop, J. 1991. Food exploitation patterns by brent geese duringspring staging. Ardea 79:331–342.
Prop, J., and T. Vulink. 1992. Digestion by barnacle geese in theannual cycle: the interplay between retention time and foodquality. Functional Ecology 6:180–189.
R Development Core Team. 2005. R: A language andenvironment for statistical computing. R Foundation forStatistical Computing, Vienna, Austria.
Searle, K. R., T. Vandervelde, N. T. Hobbs, and L. A. Shipley.2005. Gain functions for large herbivores: tests of alternativemodels. Journal of Animal Ecology 74:181–189.
Shipley, L. A., J. E. Gross, D. E. Spalinger, N. T. Hobbs, andB. A. Wunder. 1994. The scaling of intake rate in mammalianherbivores. American Naturalist 143:1055–1082.
Shipley, L. A., D. E. Spalinger, J. E. Gross, N. T. Hobbs, andB. A. Wunder. 1996. The dynamics and scaling of foragingvelocity and encounter rate in mammalian herbivores.Functional Ecology 10:234–244.
Spalinger, D. E., and N. T. Hobbs. 1992. Mechanisms offoraging in mammalian herbivores: new models of functionalresponse. American Naturalist 140:325–348.
SYSTAT Software. 2000. SYSTAT. Version 10. SYSTATSoftware, Point Richmond, California, USA.
Therkildsen, O. R., and J. Madsen. 2000. Assessment of foodintake rates in pink-footed geese Anser brachyrhynchus basedon examination of oesophagus contents. Wildlife Biology 6:167–172.
Ungar, E. D. 1996. Ingestive behaviour. Pages 185–218 in J.Hodgson and A. W. Illius, editors. The ecology andmanagement of grazing systems. CAB International, Wal-lingford, UK.
Van der Graaf, A. J., P. Coehoorn, and J. Stahl. 2005. Swardheight and bite size affect the functional response of barnaclegeese Branta leucopsis. Journal of Ornithology 147:479–484.
Van der Leeuw, A. H. J., K. Kurk, P. C. Snelderwaard, R. G.Bout, and H. Berkhoudt. 2003. Conflicting demands on thetrophic system of Anseriformes and their evolutionaryimplications. Animal Biology 53:259–301.
Vandermeer, J. H., and D. E. Goldberg. 2003. Populationecology: first principles. Princeton University Press, Prince-ton, New Jersey, USA.
Van der Wal, R., J. van de Koppel, and M. Sagel. 1998. On therelation between herbivore foraging efficiency and plantstanding crop: an experiment with barnacle geese. Oikos 82:123–130.
Van Gils, J. A., V. J. Munster, R. Radersma, D. Liefhebber,R. A. M. Fouchier, and M. Klaassen. 2007. Hamperedforaging and migratory performance in swans infected withlow-pathogenic avian influenza A virus. PLoS ONE 2(1):e184.
Van Soest, P. J. 1982. Nutritional ecology of the ruminant. Oand B Books, Corvallis, Oregon, USA.
APPENDIX A
The method used for extracting functional response parameters from studies on avian herbivores (Ecological Archives E088-182-A1).
APPENDIX B
The method used for extracting daily feeding times from studies on avian and mammalian herbivores (Ecological Archives E088-182-A2).
November 2007 2935FUNCTIONAL RESPONSE IN AVIAN HERBIVORES