Replication fork blockage by transcription factor-DNA complexes in Escherichia coli
Upload
khangminh22Category
view
0download
0
Citation: Wang, L.; Shi, F.; Wang, Z.;
Liang, S. Blockage Effects in Wind
Tunnel Tests for Tall Buildings with
Surrounding Buildings. Appl. Sci.
2022, 12, 7087. https://doi.org/
10.3390/app12147087
Academic Editor: Elsa Caetano
Received: 15 June 2022
Accepted: 8 July 2022
Published: 14 July 2022
Publisher’s Note: MDPI stays neutral
with regard to jurisdictional claims in
published maps and institutional affil-
iations.
Copyright: © 2022 by the authors.
Licensee MDPI, Basel, Switzerland.
This article is an open access article
distributed under the terms and
conditions of the Creative Commons
Attribution (CC BY) license (https://
creativecommons.org/licenses/by/
4.0/).
applied sciences
Article
Blockage Effects in Wind Tunnel Tests for Tall Buildings withSurrounding BuildingsLei Wang 1,2 , Fen Shi 1, Zheng Wang 1 and Shuguo Liang 2,*
1 School of Civil Engineering, Henan Polytechnic University, Jiaozuo 454000, China;[email protected] (L.W.); [email protected] (F.S.); [email protected] (Z.W.)
2 School of Civil & Building Engineering, Wuhan University, Wuhan 430072, China* Correspondence: [email protected]
Abstract: To study the blockage effects in wind tunnel tests for tall buildings with surroundingbuildings and establish a reasonable calculation method for the blockage ratio, this paper carriedout fifty-one test conditions of pressure model wind tunnel tests with three scale ratios. The testsconsidered the relative location, relative height, and model number of the surrounding buildings tothose of the target building by the rigid pressure models. Based on the wind tunnel tests, the blockageeffects on the pressure coefficients and drag coefficients were studied in detail. The results showedthat the blockage effects were different when the relative positions of the surrounding models to thetarget model were different, even if the blockage ratio was the same. The blockage effects caused bythe surrounding models with unit blockage ratio were usually more significant than those causedby the target pressure-measuring model itself. The existing correction methods for the blockageeffects are mainly derived from the wind tunnel tests of an isolated building model. Using existingcalculations to evaluate the blockage effect of wind tunnel tests for tall buildings with surroundingbuildings may result in obvious deviations. Finally, the concept of the equivalent blockage ratio wasproposed, which can be used to calculate the blockage ratio of wind tunnel tests of tall buildingswith surrounding buildings. The proposed calculation method of this equivalent blockage ratio canprovide a reference for the determination of scale ratios for wind tunnel test models of tall buildings.
Keywords: blockage effect; wind tunnel tests; grouped tall buildings; calculation method
1. Introduction
The blockage effect may lead to a serious distortion of wind tunnel test data. For exam-ple, a 5% blockage ratio for a rectangular prism model can increase the pressure coefficientby 20% [1]. The research results of the wind tunnel blockage effect of a single rectangularprism model shows that the windward wind pressure is less affected by the blockage effect,while the lateral and leeward wind pressure are more affected by the blockage effect, whichhas become a consensus [2–12]. Compared to a single building, the blockage effect of groupbuildings is usually more significant and complex [13]. Unfortunately, the existing researchon the blockage effect of tall buildings mainly focuses on single model tests, while researchon the blockage effect of group model tests is very scarce.
From the traditional point of view, the blockage ratio is generally defined as the ratioof the windward area of the test model compared with the cross-sectional area of the windtunnel test section. This definition is not ambiguous for the wind tunnel tests of an isolatedbuilding, but it is worth discussing whether the definition is applicable for wind tunneltests of group buildings. For example, according to the traditional definition of the blockingratio, the blocking ratios of the test models shown in Figure 1 are equal, but the blockingeffect may be very different.
Appl. Sci. 2022, 12, 7087. https://doi.org/10.3390/app12147087 https://www.mdpi.com/journal/applsci

Appl. Sci. 2022, 12, 7087 2 of 19Appl. Sci. 2022, 12, x FOR PEER REVIEW 2 of 19
Figure 1. The same blocking ratio with a different layout of the surrounding buildings.
For an isolated building, it is relatively easy to control the blockage ratio and block-age effect by adjusting the scale ratio. Comparatively speaking, wind tunnel tests of group buildings are more likely to cause a significant blockage effect. In practice, super high-rise buildings are usually located within grouped buildings, where the relative height, loca-tion, and number of surrounding buildings varies, which may lead to some unpredictable phenomena such as a ‘small blockage ratio, large blockage effect’ and a ‘same blockage ratio, different blockage effect’. Therefore, it is of great practical significance to study the blockage effect of wind tunnel tests on tall buildings with surrounding buildings, which can provide a reference to determine the scale ratio of test models. In light of this, a series of wind tunnel tests was carried out in this paper.
2. Wind Tunnel Tests 2.1. Wind Tunnel Tests
The wind tunnel tests were conducted in the boundary layer wind tunnel of Wuhan University, China, where the cross-section of the wind tunnel is 3.2 m wide × 2.1 m high. The aerodynamic contour of the wind tunnel is illustrated in Figure 2.
The target pressure-measuring model is a square-shaped cylinder with an aspect ra-tio of 4. To avoid the influence of the scale ratio of the wind field on the test data, the wind field was set as a smooth uniform flow. The research object of this paper was the mean wind pressure coefficient and drag coefficient, so research results in uniform flow are also applicable to the turbulent field in the atmospheric boundary layer. For the isolated pres-sure model, wind tunnel tests of three scale ratios were carried out in this study. For the grouped building models, three scale ratios, eight relative positions, and two relative heights of the pressure model and the surrounding model were considered in this study. A total of 51 test conditions were carried out in this paper. The test models were defined as a large model, medium model, and small model, respectively, according to the scale ratio from large to small. If it is assumed that the real size of the tall building is 240 m high and 60 m wide, the scale ratios of the large model, medium model, and small model were 1/200, 1/300 and 1/600, respectively. Figure 3 shows the layout of the pressure points on the target pressure-measuring model. Figure 4 shows the layout of the grouped tall build-ings.
Figure 2. The aerodynamic contour of the wind tunnel.
Figure 1. The same blocking ratio with a different layout of the surrounding buildings.
For an isolated building, it is relatively easy to control the blockage ratio and blockageeffect by adjusting the scale ratio. Comparatively speaking, wind tunnel tests of groupbuildings are more likely to cause a significant blockage effect. In practice, super high-risebuildings are usually located within grouped buildings, where the relative height, location,and number of surrounding buildings varies, which may lead to some unpredictablephenomena such as a ‘small blockage ratio, large blockage effect’ and a ‘same blockageratio, different blockage effect’. Therefore, it is of great practical significance to study theblockage effect of wind tunnel tests on tall buildings with surrounding buildings, whichcan provide a reference to determine the scale ratio of test models. In light of this, a seriesof wind tunnel tests was carried out in this paper.
2. Wind Tunnel Tests2.1. Wind Tunnel Tests
The wind tunnel tests were conducted in the boundary layer wind tunnel of WuhanUniversity, China, where the cross-section of the wind tunnel is 3.2 m wide × 2.1 m high.The aerodynamic contour of the wind tunnel is illustrated in Figure 2.
Appl. Sci. 2022, 12, x FOR PEER REVIEW 2 of 19
Figure 1. The same blocking ratio with a different layout of the surrounding buildings.
For an isolated building, it is relatively easy to control the blockage ratio and block-age effect by adjusting the scale ratio. Comparatively speaking, wind tunnel tests of group buildings are more likely to cause a significant blockage effect. In practice, super high-rise buildings are usually located within grouped buildings, where the relative height, loca-tion, and number of surrounding buildings varies, which may lead to some unpredictable phenomena such as a ‘small blockage ratio, large blockage effect’ and a ‘same blockage ratio, different blockage effect’. Therefore, it is of great practical significance to study the blockage effect of wind tunnel tests on tall buildings with surrounding buildings, which can provide a reference to determine the scale ratio of test models. In light of this, a series of wind tunnel tests was carried out in this paper.
2. Wind Tunnel Tests 2.1. Wind Tunnel Tests
The wind tunnel tests were conducted in the boundary layer wind tunnel of Wuhan University, China, where the cross-section of the wind tunnel is 3.2 m wide × 2.1 m high. The aerodynamic contour of the wind tunnel is illustrated in Figure 2.
The target pressure-measuring model is a square-shaped cylinder with an aspect ra-tio of 4. To avoid the influence of the scale ratio of the wind field on the test data, the wind field was set as a smooth uniform flow. The research object of this paper was the mean wind pressure coefficient and drag coefficient, so research results in uniform flow are also applicable to the turbulent field in the atmospheric boundary layer. For the isolated pres-sure model, wind tunnel tests of three scale ratios were carried out in this study. For the grouped building models, three scale ratios, eight relative positions, and two relative heights of the pressure model and the surrounding model were considered in this study. A total of 51 test conditions were carried out in this paper. The test models were defined as a large model, medium model, and small model, respectively, according to the scale ratio from large to small. If it is assumed that the real size of the tall building is 240 m high and 60 m wide, the scale ratios of the large model, medium model, and small model were 1/200, 1/300 and 1/600, respectively. Figure 3 shows the layout of the pressure points on the target pressure-measuring model. Figure 4 shows the layout of the grouped tall build-ings.
Figure 2. The aerodynamic contour of the wind tunnel. Figure 2. The aerodynamic contour of the wind tunnel.
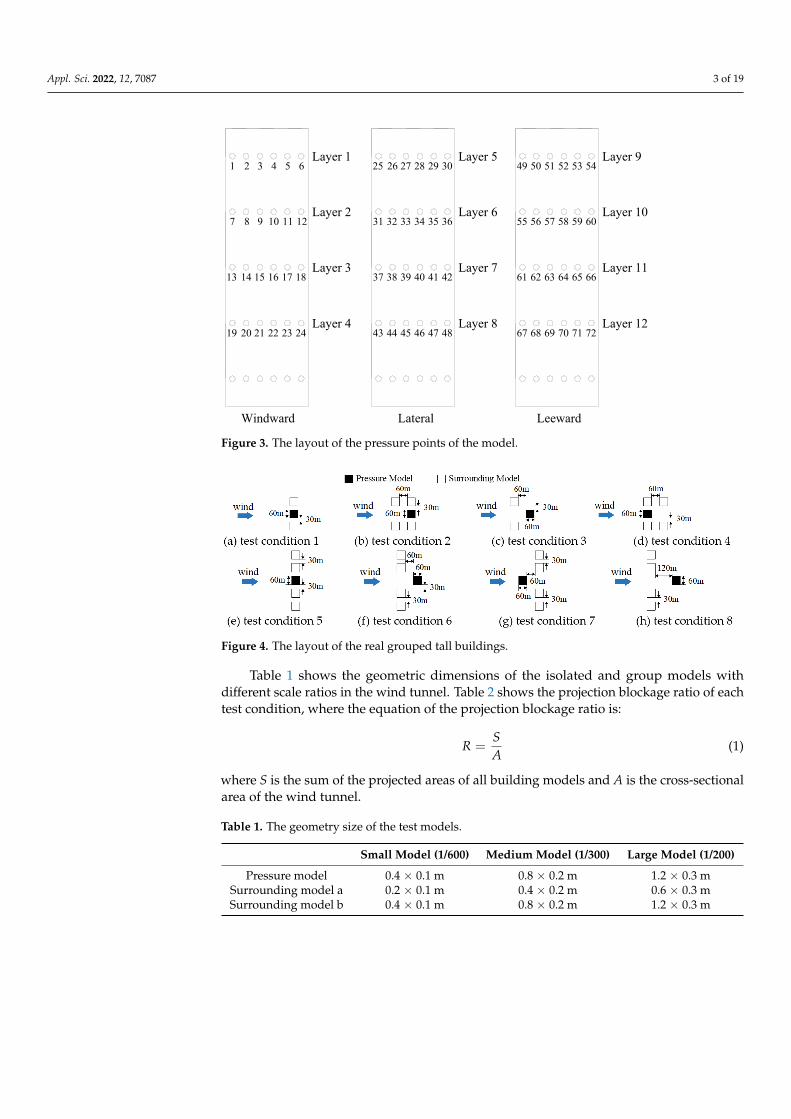
The target pressure-measuring model is a square-shaped cylinder with an aspect ratioof 4. To avoid the influence of the scale ratio of the wind field on the test data, the windfield was set as a smooth uniform flow. The research object of this paper was the meanwind pressure coefficient and drag coefficient, so research results in uniform flow arealso applicable to the turbulent field in the atmospheric boundary layer. For the isolatedpressure model, wind tunnel tests of three scale ratios were carried out in this study. Forthe grouped building models, three scale ratios, eight relative positions, and two relativeheights of the pressure model and the surrounding model were considered in this study. Atotal of 51 test conditions were carried out in this paper. The test models were defined as alarge model, medium model, and small model, respectively, according to the scale ratiofrom large to small. If it is assumed that the real size of the tall building is 240 m high and60 m wide, the scale ratios of the large model, medium model, and small model were 1/200,1/300 and 1/600, respectively. Figure 3 shows the layout of the pressure points on thetarget pressure-measuring model. Figure 4 shows the layout of the grouped tall buildings.
Appl. Sci. 2022, 12, 7087 3 of 19Appl. Sci. 2022, 12, x FOR PEER REVIEW 3 of 19
Figure 3. The layout of the pressure points of the model.
Figure 4. The layout of the real grouped tall buildings.
Table 1 shows the geometric dimensions of the isolated and group models with dif-ferent scale ratios in the wind tunnel. Table 2 shows the projection blockage ratio of each test condition, where the equation of the projection blockage ratio is:
SRA
= (1)
where S is the sum of the projected areas of all building models and A is the cross-sectional area of the wind tunnel.
In Table 2, H represents the height of the pressure model, which means that the sur-rounding models of test conditions 1a–8a are half the height of the target pressure-meas-uring model, and the surrounding model of test conditions 1b–8b is equal to the height of the target pressure-measuring model. Figure 5 shows the photos of the wind tunnel test model in this study.
Table 1. The geometry size of the test models.
Small Model (1/600) Medium Model (1/300) Large Model (1/200) Pressure model 0.4 × 0.1 m 0.8 × 0.2 m 1.2 × 0.3 m
Surrounding model a 0.2 × 0.1 m 0.4 × 0.2 m 0.6 × 0.3 m Surrounding model b 0.4 × 0.1 m 0.8 × 0.2 m 1.2 × 0.3 m
1Layer 1
2 3 4 5 6
7 8 9 10 11 12
13 14 15 16 17 18
19 20 21 22 23 24
Layer 2
Layer 3
Layer 4
Windward
Layer 5
Layer 6
Layer 7
Layer 8
Lateral
Layer 9
Layer 10
Layer 11
Layer 12
Leeward
25 26 27 28 29 30
31 32 33 34 35 36
37 38 39 40 41 42
43 44 45 46 47 48
49 50 51 52 53 54
55 56 57 58 59 60
61 62 63 64 65 66
67 68 69 70 71 72
Figure 3. The layout of the pressure points of the model.
Appl. Sci. 2022, 12, x FOR PEER REVIEW 3 of 19
Figure 3. The layout of the pressure points of the model.
Figure 4. The layout of the real grouped tall buildings.
Table 1 shows the geometric dimensions of the isolated and group models with dif-ferent scale ratios in the wind tunnel. Table 2 shows the projection blockage ratio of each test condition, where the equation of the projection blockage ratio is:
SRA
= (1)
where S is the sum of the projected areas of all building models and A is the cross-sectional area of the wind tunnel.
In Table 2, H represents the height of the pressure model, which means that the sur-rounding models of test conditions 1a–8a are half the height of the target pressure-meas-uring model, and the surrounding model of test conditions 1b–8b is equal to the height of the target pressure-measuring model. Figure 5 shows the photos of the wind tunnel test model in this study.
Table 1. The geometry size of the test models.
Small Model (1/600) Medium Model (1/300) Large Model (1/200) Pressure model 0.4 × 0.1 m 0.8 × 0.2 m 1.2 × 0.3 m
Surrounding model a 0.2 × 0.1 m 0.4 × 0.2 m 0.6 × 0.3 m Surrounding model b 0.4 × 0.1 m 0.8 × 0.2 m 1.2 × 0.3 m
1Layer 1
2 3 4 5 6
7 8 9 10 11 12
13 14 15 16 17 18
19 20 21 22 23 24
Layer 2
Layer 3
Layer 4
Windward
Layer 5
Layer 6
Layer 7
Layer 8
Lateral
Layer 9
Layer 10
Layer 11
Layer 12
Leeward
25 26 27 28 29 30
31 32 33 34 35 36
37 38 39 40 41 42
43 44 45 46 47 48
49 50 51 52 53 54
55 56 57 58 59 60
61 62 63 64 65 66
67 68 69 70 71 72
Figure 4. The layout of the real grouped tall buildings.
Table 1 shows the geometric dimensions of the isolated and group models withdifferent scale ratios in the wind tunnel. Table 2 shows the projection blockage ratio of eachtest condition, where the equation of the projection blockage ratio is:
R =SA
(1)
where S is the sum of the projected areas of all building models and A is the cross-sectionalarea of the wind tunnel.
Table 1. The geometry size of the test models.
Small Model (1/600) Medium Model (1/300) Large Model (1/200)
Pressure model 0.4 × 0.1 m 0.8 × 0.2 m 1.2 × 0.3 mSurrounding model a 0.2 × 0.1 m 0.4 × 0.2 m 0.6 × 0.3 mSurrounding model b 0.4 × 0.1 m 0.8 × 0.2 m 1.2 × 0.3 m

Appl. Sci. 2022, 12, 7087 4 of 19
Table 2. The blockage ratio of each test condition.
Condition Small Model (1/600) Medium Model (1/300) Large Model (1/200) Surrounding Model Height
1a 1.19% 4.76% 10.71% 0.5H2a 1.19% 4.76% 10.71% 0.5H3a 1.19% 4.76% 10.71% 0.5H4a 1.19% 4.76% 10.71% 0.5H5a 1.79% 7.14% 16.07% 0.5H6a 1.79% 7.14% 16.07% 0.5H7a 1.79% 7.14% 16.07% 0.5H8a 1.79% 7.14% 16.07% 0.5H1b 1.79% 7.14% 16.07% H2b 1.79% 7.14% 16.07% H3b 1.79% 7.14% 16.07% H4b 1.79% 7.14% 16.07% H5b 2.98% 11.90% −−−−− H6b 2.98% 11.90% −−−−− H7b 2.98% 11.90% −−−−− H8b 2.98% 11.90% −−−−− H
In Table 2, H represents the height of the pressure model, which means that thesurrounding models of test conditions 1a–8a are half the height of the target pressure-measuring model, and the surrounding model of test conditions 1b–8b is equal to theheight of the target pressure-measuring model. Figure 5 shows the photos of the windtunnel test model in this study.
Appl. Sci. 2022, 12, x FOR PEER REVIEW 4 of 19
Table 2. The blockage ratio of each test condition.
Condition Small Model (1/600) Medium Model (1/300) Large Model (1/200) Surrounding Model Height 1a 1.19% 4.76% 10.71% 0.5H 2a 1.19% 4.76% 10.71% 0.5H 3a 1.19% 4.76% 10.71% 0.5H 4a 1.19% 4.76% 10.71% 0.5H 5a 1.79% 7.14% 16.07% 0.5H 6a 1.79% 7.14% 16.07% 0.5H 7a 1.79% 7.14% 16.07% 0.5H 8a 1.79% 7.14% 16.07% 0.5H 1b 1.79% 7.14% 16.07% H 2b 1.79% 7.14% 16.07% H 3b 1.79% 7.14% 16.07% H 4b 1.79% 7.14% 16.07% H 5b 2.98% 11.90% −−−−− H 6b 2.98% 11.90% −−−−− H 7b 2.98% 11.90% −−−−− H 8b 2.98% 11.90% −−−−− H
(a) (b) (c)
Figure 5. Photos of the wind tunnel test. (a) Small single model; (b) Test condition 5a of the me-dium model; (c) Test condition 7a of the medium model.
2.2. Data Processing of Wind Tunnel Tests The wind pressures of the upper four layers were analyzed in this study, and only
one lateral surface was considered because of the symmetry of the square model. The mean pressure coefficient of the i-th pressure point can be calculated as follows:
21/ ( )2i iw Vμ ρ= (2)
where iw is the mean pressure of the i-th pressure point, ρ is the air density, and V is the test velocity. In turn, the layer pressure coefficient is defined as:
6
, ,1
/ 6layer j j nn
μ μ=
= (3)
where n represents the n-th pressure point of the j-th layer. The blockage ratio of the small model is relatively small, generally less than 2%, so
the wind pressure of the small model is less affected by the blockage effect. Therefore, the wind pressure results of the small model were used as a benchmark in this paper, and the relative error of the mean pressure coefficient of each layer is defined as:
, , , ,, ,
, ,
( )layer j l layer j slayer j l
layer j s
μ μμ
μ−
Δ = (4)
Figure 5. Photos of the wind tunnel test. (a) Small single model; (b) Test condition 5a of the mediummodel; (c) Test condition 7a of the medium model.
2.2. Data Processing of Wind Tunnel Tests
The wind pressures of the upper four layers were analyzed in this study, and only onelateral surface was considered because of the symmetry of the square model. The meanpressure coefficient of the i-th pressure point can be calculated as follows:
µi = wi/(12
ρV2) (2)
where wi is the mean pressure of the i-th pressure point, ρ is the air density, and V is thetest velocity. In turn, the layer pressure coefficient is defined as:
µlayer,j =6
∑n=1
µj,n/6 (3)
where n represents the n-th pressure point of the j-th layer.

Appl. Sci. 2022, 12, 7087 5 of 19
The blockage ratio of the small model is relatively small, generally less than 2%, sothe wind pressure of the small model is less affected by the blockage effect. Therefore, thewind pressure results of the small model were used as a benchmark in this paper, and therelative error of the mean pressure coefficient of each layer is defined as:
∆µlayer,j,l =(µlayer,j,l − µlayer,j,s)
µlayer,j,s(4)
∆µlayer,j,m =(µlayer,j,m − µlayer,j,s)
µlayer,j,s(5)
where the subscripts l, m, and s are the initials for large, medium, and small, respectively,representing the large, medium, and small models.
The equation of drag coefficient is as follows:
CD =FD
0.5ρV2 A(6)
where FD is the mean along-wind force and A is the windward area of the target pressuremodel.
Based on the wind pressure data of the small model, the relative error of the dragcoefficient can be obtained as follows:
∆CD,l =(CD,l − CD,s)
CD,s(7)
∆CD,m =(CD,m − CD,s)
CD,s(8)
where CD,l, CD,m, and CD,s represent the drag coefficients of the large model, mediummodel, and small model, respectively; ∆CD,l and ∆CD,m represent the relative error of thedrag coefficients of the large model and medium model, respectively.
3. Blockage Effects of Isolated Model Wind Tunnel Test3.1. Test Results of Isolated Model Test
Table 3 shows the drag coefficient of the single pressure model with different blockageratios. As seen in Table 3, the drag coefficient increases with an increase in the blockage ratio.
Table 3. The drag coefficient.
Model Scale Ratio Blockage Ratio Drag Coefficient
Small model 1/600 0.6% 1.38
Medium model 1/300 2.38% 1.43
Large model 1/200 5.36% 1.57
3.2. Discuses about the Cause of the Drag Coefficient Difference
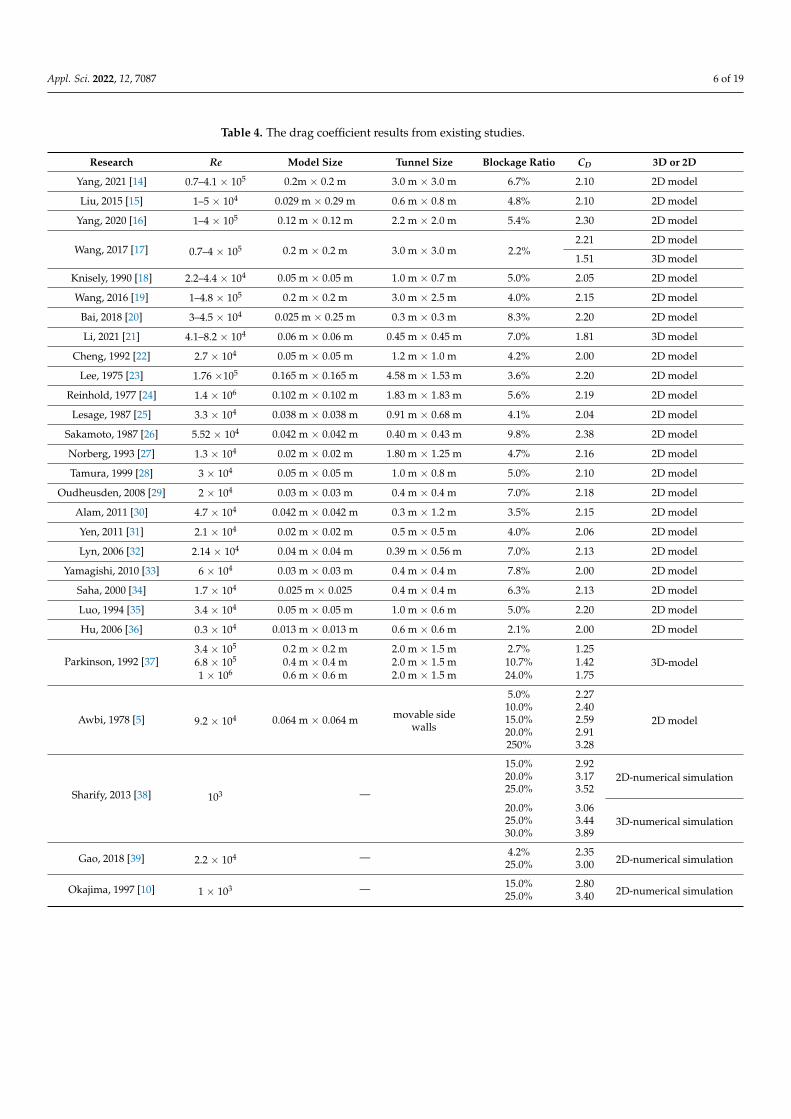
As is well-known, the cause of the drag coefficient difference may be due to theReynolds number effect and blockage effect. Table 4 shows the drag coefficient resultsfrom existing studies including the wind tunnel test and numerical simulation results oftwo-dimensional and three-dimensional square cylinders; the wind fields of these studieswere uniform flow with a turbulence intensity smaller than 2%.
Appl. Sci. 2022, 12, 7087 6 of 19
Table 4. The drag coefficient results from existing studies.
Research Re Model Size Tunnel Size Blockage Ratio CD 3D or 2D
Yang, 2021 [14] 0.7–4.1 × 10⁵ 0.2m × 0.2 m 3.0 m × 3.0 m 6.7% 2.10 2D model
Liu, 2015 [15] 1–5 × 10⁴ 0.029 m × 0.29 m 0.6 m × 0.8 m 4.8% 2.10 2D model
Yang, 2020 [16] 1–4 × 10⁵ 0.12 m × 0.12 m 2.2 m × 2.0 m 5.4% 2.30 2D model
Wang, 2017 [17] 0.7–4 × 10⁵ 0.2 m × 0.2 m 3.0 m × 3.0 m 2.2%2.21 2D model
1.51 3D model
Knisely, 1990 [18] 2.2–4.4 × 10⁴ 0.05 m × 0.05 m 1.0 m × 0.7 m 5.0% 2.05 2D model
Wang, 2016 [19] 1–4.8 × 10⁵ 0.2 m × 0.2 m 3.0 m × 2.5 m 4.0% 2.15 2D model
Bai, 2018 [20] 3–4.5 × 10⁴ 0.025 m × 0.25 m 0.3 m × 0.3 m 8.3% 2.20 2D model
Li, 2021 [21] 4.1–8.2 × 10⁴ 0.06 m × 0.06 m 0.45 m × 0.45 m 7.0% 1.81 3D model
Cheng, 1992 [22] 2.7 × 10⁴ 0.05 m × 0.05 m 1.2 m × 1.0 m 4.2% 2.00 2D model
Lee, 1975 [23] 1.76 ×10⁵ 0.165 m × 0.165 m 4.58 m × 1.53 m 3.6% 2.20 2D model
Reinhold, 1977 [24] 1.4 × 10⁶ 0.102 m × 0.102 m 1.83 m × 1.83 m 5.6% 2.19 2D model
Lesage, 1987 [25] 3.3 × 10⁴ 0.038 m × 0.038 m 0.91 m × 0.68 m 4.1% 2.04 2D model
Sakamoto, 1987 [26] 5.52 × 10⁴ 0.042 m × 0.042 m 0.40 m × 0.43 m 9.8% 2.38 2D model
Norberg, 1993 [27] 1.3 × 10⁴ 0.02 m × 0.02 m 1.80 m × 1.25 m 4.7% 2.16 2D model
Tamura, 1999 [28] 3 × 10⁴ 0.05 m × 0.05 m 1.0 m × 0.8 m 5.0% 2.10 2D model
Oudheusden, 2008 [29] 2 × 10⁴ 0.03 m × 0.03 m 0.4 m × 0.4 m 7.0% 2.18 2D model
Alam, 2011 [30] 4.7 × 10⁴ 0.042 m × 0.042 m 0.3 m × 1.2 m 3.5% 2.15 2D model
Yen, 2011 [31] 2.1 × 10⁴ 0.02 m × 0.02 m 0.5 m × 0.5 m 4.0% 2.06 2D model
Lyn, 2006 [32] 2.14 × 10⁴ 0.04 m × 0.04 m 0.39 m × 0.56 m 7.0% 2.13 2D model
Yamagishi, 2010 [33] 6 × 10⁴ 0.03 m × 0.03 m 0.4 m × 0.4 m 7.8% 2.00 2D model
Saha, 2000 [34] 1.7 × 10⁴ 0.025 m × 0.025 0.4 m × 0.4 m 6.3% 2.13 2D model
Luo, 1994 [35] 3.4 × 10⁴ 0.05 m × 0.05 m 1.0 m × 0.6 m 5.0% 2.20 2D model
Hu, 2006 [36] 0.3 × 10⁴ 0.013 m × 0.013 m 0.6 m × 0.6 m 2.1% 2.00 2D model
Parkinson, 1992 [37]3.4 × 10⁵ 0.2 m × 0.2 m 2.0 m × 1.5 m 2.7% 1.25
3D-model6.8 × 105 0.4 m × 0.4 m 2.0 m × 1.5 m 10.7% 1.421 × 10⁶ 0.6 m × 0.6 m 2.0 m × 1.5 m 24.0% 1.75
Awbi, 1978 [5] 9.2 × 10⁴ 0.064 m × 0.064 m movable sidewalls
5.0% 2.27
2D model10.0% 2.4015.0% 2.5920.0% 2.91250% 3.28
Sharify, 2013 [38] 103 —
15.0% 2.922D-numerical simulation20.0% 3.17
25.0% 3.52
20.0% 3.063D-numerical simulation25.0% 3.44
30.0% 3.89
Gao, 2018 [39] 2.2 × 10⁴ — 4.2% 2.352D-numerical simulation25.0% 3.00
Okajima, 1997 [10] 1 × 10³ — 15.0% 2.802D-numerical simulation25.0% 3.40

Appl. Sci. 2022, 12, 7087 7 of 19
As seen in Table 4, the drag coefficient results of the 2D model were much bigger thanthe 3D model. Regardless of whether it was a 2D or 3D square cylinder, if the blockage ratiois constant, the drag coefficient changes slightly when the Reynolds number is changedby changing the wind speed (see Figure 6). For example, the drag coefficients in manystudies were all close to 2.1–2.2 [15,17,18,23,25,28,30,31]. In contrast, the drag coefficientcorresponding to different blockage ratios was quite different, and the drag coefficientincreased with the increase in the blockage ratio (see Figure 7).
Appl. Sci. 2022, 12, x FOR PEER REVIEW 7 of 19
Figure 6. CD varies with Reynolds number [14,16,17,20,21].
Figure 7. CD varies with blockage ratio [5,10,37,38].
The above analysis indicates that the drag coefficient is affected by both the Reynolds number effect and blockage effect, but compared with the blockage effect, the influence of Reynolds number difference can be ignored.
3.3. Analytical Model of Drag Coefficient Error Caused by the Blockage Effect Based on the above analysis, the relationship between the drag coefficient error
caused by the target pressure-measuring model and the blockage ratio can be calculated as follows:
Δ(Rt) = kRt (9)
where Δ(Rt) represents the drag coefficient error caused by the blockage effect of the target pressure-measuring model; Rt represents the blockage ratio of the target pressure-meas-uring model; k is the influence coefficient of the blockage effect, which is equal to the drag coefficient error caused by the unit blockage ratio. According to the results in Table 3, C0 = 1.37 and k = 2.5 can be obtained by least squares fitting, where C0 is the drag coefficient when the blockage ratio is zero. In fact, this influence coefficient of the blockage effect is exactly the same as the results of Maskell [2], whose resulting influence coefficient was also 2.5. Figure 8 shows the fitting result of Equation (9).
0.0 0.1 0.2 0.3 0.40
1
2
3
4
CD
Blocking Ratio
Parkinson,1992; 3D Model Awbi,1978; 2D Model Sharify,2013; 2D Simulation Okajima,1997; 2D Simulation
0 2 4 61.3
1.4
1.5
1.6
1.7
C D
blocking ratio(%)
test results of this paper k =2.5
Figure 6. CD varies with Reynolds number [14,16,17,20,21].
Appl. Sci. 2022, 12, x FOR PEER REVIEW 7 of 19
Figure 6. CD varies with Reynolds number [14,16,17,20,21].
Figure 7. CD varies with blockage ratio [5,10,37,38].
The above analysis indicates that the drag coefficient is affected by both the Reynolds number effect and blockage effect, but compared with the blockage effect, the influence of Reynolds number difference can be ignored.
3.3. Analytical Model of Drag Coefficient Error Caused by the Blockage Effect Based on the above analysis, the relationship between the drag coefficient error
caused by the target pressure-measuring model and the blockage ratio can be calculated as follows:
Δ(Rt) = kRt (9)
where Δ(Rt) represents the drag coefficient error caused by the blockage effect of the target pressure-measuring model; Rt represents the blockage ratio of the target pressure-meas-uring model; k is the influence coefficient of the blockage effect, which is equal to the drag coefficient error caused by the unit blockage ratio. According to the results in Table 3, C0 = 1.37 and k = 2.5 can be obtained by least squares fitting, where C0 is the drag coefficient when the blockage ratio is zero. In fact, this influence coefficient of the blockage effect is exactly the same as the results of Maskell [2], whose resulting influence coefficient was also 2.5. Figure 8 shows the fitting result of Equation (9).
103 104 105 1060.0
0.5
1.0
1.5
2.0
2.5
3.0
CD
Re
Wang,2017; 2D Model Wang,2017; 3D Model Yang,2020; 2D Model Bai,2018; 2D Model Yang,2021; 2D Model Li,2021; 3D Model
0.0 0.1 0.2 0.3 0.40
1
2
3
4
CD
Blocking Ratio
Parkinson,1992; 3D Model Awbi,1978; 2D Model Sharify,2013; 2D Simulation Okajima,1997; 2D Simulation
0 2 4 61.3
1.4
1.5
1.6
1.7
CD
blocking ratio(%)
test results of this paper k =2.5
Figure 7. CD varies with blockage ratio [5,10,37,38].
The above analysis indicates that the drag coefficient is affected by both the Reynoldsnumber effect and blockage effect, but compared with the blockage effect, the influence ofReynolds number difference can be ignored.
3.3. Analytical Model of Drag Coefficient Error Caused by the Blockage Effect
Based on the above analysis, the relationship between the drag coefficient error causedby the target pressure-measuring model and the blockage ratio can be calculated as follows:
∆(Rt) = kRt (9)
where ∆(Rt) represents the drag coefficient error caused by the blockage effect of thetarget pressure-measuring model; Rt represents the blockage ratio of the target pressure-measuring model; k is the influence coefficient of the blockage effect, which is equal to thedrag coefficient error caused by the unit blockage ratio. According to the results in Table 3,C0 = 1.37 and k = 2.5 can be obtained by least squares fitting, where C0 is the drag coefficientwhen the blockage ratio is zero. In fact, this influence coefficient of the blockage effect isexactly the same as the results of Maskell [2], whose resulting influence coefficient was also2.5. Figure 8 shows the fitting result of Equation (9).

Appl. Sci. 2022, 12, 7087 8 of 19
Appl. Sci. 2022, 12, x FOR PEER REVIEW 7 of 19
Figure 6. CD varies with Reynolds number [14,16,17,20,21].
Figure 7. CD varies with blockage ratio [5,10,37,38].
The above analysis indicates that the drag coefficient is affected by both the Reynolds number effect and blockage effect, but compared with the blockage effect, the influence of Reynolds number difference can be ignored.
3.3. Analytical Model of Drag Coefficient Error Caused by the Blockage Effect Based on the above analysis, the relationship between the drag coefficient error
caused by the target pressure-measuring model and the blockage ratio can be calculated as follows:
Δ(Rt) = kRt (9)
where Δ(Rt) represents the drag coefficient error caused by the blockage effect of the target pressure-measuring model; Rt represents the blockage ratio of the target pressure-meas-uring model; k is the influence coefficient of the blockage effect, which is equal to the drag coefficient error caused by the unit blockage ratio. According to the results in Table 3, C0 = 1.37 and k = 2.5 can be obtained by least squares fitting, where C0 is the drag coefficient when the blockage ratio is zero. In fact, this influence coefficient of the blockage effect is exactly the same as the results of Maskell [2], whose resulting influence coefficient was also 2.5. Figure 8 shows the fitting result of Equation (9).
103 104 105 1060.0
0.5
1.0
1.5
2.0
2.5
3.0
CD
Re
Wang,2017; 2D Model Wang,2017; 3D Model Yang,2020; 2D Model Bai,2018; 2D Model Yang,2021; 2D Model Li,2021; 3D Model
0.0 0.1 0.2 0.3 0.40
1
2
3
4
CD
Blocking Ratio
Parkinson,1992; 3D Model Awbi,1978; 2D Model Sharify,2013; 2D Simulation Okajima,1997; 2D Simulation
0 2 4 61.3
1.4
1.5
1.6
1.7
CD
blocking ratio(%)
test results of this paper k =2.5
Figure 8. The drag coefficient varying with the blockage ratio.
It should be noted that some studies have indicated that the blockage effect andblockage ratio are not linear, and this phenomenon could also be observed in Figure 8.Even so, when the blockage ratio of the target pressure-measuring model was less than6%, the relationship between the drag coefficient and the blockage ratio can essentially belinear. Regarding the condition when the blockage ratio of the target pressure model isgreater than 6%, this is not likely to occur in reality, otherwise, it will cause unnecessarytrouble, especially for grouped models. Therefore, it can meet the accuracy requirements inevaluating the blockage effect according to the linear hypothesis in the common range ofblockage ratio experiments.
4. Blockage Effect of Grouped Models4.1. When the Surrounding Model Is Half the Height of the Target Pressure Model
In this section, the surrounding model is half the height of the target pressure model.According to the test results, the mean pressure coefficient of the windward surface is lessaffected by the blockage effect, and the relative error of pressure coefficient is generallyless than 15%. However, when the surrounding models are located upstream of the targetpressure model, the relative error of the mean wind pressure of the windward surfacecannot be ignored. For example, the ∆µlayer of the medium model of test condition 2 reached30% (see Figure 9, which shows the layer pressure coefficient and relative error of the layerpressure coefficient of test condition 2). Similarly, the ∆µlayer of the windward surfaceof the medium model of test condition 6 was close to 40% (see Figure 10, which showsthe layer pressure coefficient and the relative error of the layer pressure coefficient of testcondition 6). Obviously, this is because the wind velocity flowing through the upstreamsurrounding models is increased and this phenomenon, with the model creating a largerblockage ratio, is more obvious. The results were substantially different from the existingstudy results of the blockage effect of the single model.
Appl. Sci. 2022, 12, x FOR PEER REVIEW 8 of 19
Figure 8. The drag coefficient varying with the blockage ratio.
It should be noted that some studies have indicated that the blockage effect and blockage ratio are not linear, and this phenomenon could also be observed in Figure 8. Even so, when the blockage ratio of the target pressure-measuring model was less than 6%, the relationship between the drag coefficient and the blockage ratio can essentially be linear. Regarding the condition when the blockage ratio of the target pressure model is greater than 6%, this is not likely to occur in reality, otherwise, it will cause unnecessary trouble, especially for grouped models. Therefore, it can meet the accuracy requirements in evaluating the blockage effect according to the linear hypothesis in the common range of blockage ratio experiments.
4. Blockage Effect of Grouped Models 4.1. When the Surrounding Model Is Half the Height of the Target Pressure Model
In this section, the surrounding model is half the height of the target pressure model. According to the test results, the mean pressure coefficient of the windward surface is less affected by the blockage effect, and the relative error of pressure coefficient is generally less than 15%. However, when the surrounding models are located upstream of the target pressure model, the relative error of the mean wind pressure of the windward surface cannot be ignored. For example, the Δμlayer of the medium model of test condition 2 reached 30% (see Figure 9, which shows the layer pressure coefficient and relative error of the layer pressure coefficient of test condition 2). Similarly, the Δμlayer of the windward surface of the medium model of test condition 6 was close to 40% (see Figure 10, which shows the layer pressure coefficient and the relative error of the layer pressure coefficient of test condition 6). Obviously, this is because the wind velocity flowing through the up-stream surrounding models is increased and this phenomenon, with the model creating a larger blockage ratio, is more obvious. The results were substantially different from the existing study results of the blockage effect of the single model.
(a) (b)
Figure 9. The wind tunnel test results of test condition 2. (a) Layer pressure coefficient; (b) relative error of layer pressure coefficient.
(a) (b)
Figure 10. The wind tunnel test results of test condition 6. (a) Layer pressure coefficient; (b) rela-tive error of layer pressure coefficient.
2 4 6 8 10 12
-2
-1
0
1
layer
μ layer
small model medium model large model
2 4 6 8 10 12-0.5
0.0
0.5
1.0
Δμlayer
medium model large model
layer
2 4 6 8 10 12
-2
-1
0
1
μ layer
layer
small model medium model large model
2 4 6 8 10 12-0.5
0.0
0.5
1.0
medium model large model
Δμlayer
layer
Figure 9. The wind tunnel test results of test condition 2. (a) Layer pressure coefficient; (b) relativeerror of layer pressure coefficient.

Appl. Sci. 2022, 12, 7087 9 of 19
Appl. Sci. 2022, 12, x FOR PEER REVIEW 8 of 19
Figure 8. The drag coefficient varying with the blockage ratio.
It should be noted that some studies have indicated that the blockage effect and blockage ratio are not linear, and this phenomenon could also be observed in Figure 8. Even so, when the blockage ratio of the target pressure-measuring model was less than 6%, the relationship between the drag coefficient and the blockage ratio can essentially be linear. Regarding the condition when the blockage ratio of the target pressure model is greater than 6%, this is not likely to occur in reality, otherwise, it will cause unnecessary trouble, especially for grouped models. Therefore, it can meet the accuracy requirements in evaluating the blockage effect according to the linear hypothesis in the common range of blockage ratio experiments.
4. Blockage Effect of Grouped Models 4.1. When the Surrounding Model Is Half the Height of the Target Pressure Model
In this section, the surrounding model is half the height of the target pressure model. According to the test results, the mean pressure coefficient of the windward surface is less affected by the blockage effect, and the relative error of pressure coefficient is generally less than 15%. However, when the surrounding models are located upstream of the target pressure model, the relative error of the mean wind pressure of the windward surface cannot be ignored. For example, the Δμlayer of the medium model of test condition 2 reached 30% (see Figure 9, which shows the layer pressure coefficient and relative error of the layer pressure coefficient of test condition 2). Similarly, the Δμlayer of the windward surface of the medium model of test condition 6 was close to 40% (see Figure 10, which shows the layer pressure coefficient and the relative error of the layer pressure coefficient of test condition 6). Obviously, this is because the wind velocity flowing through the up-stream surrounding models is increased and this phenomenon, with the model creating a larger blockage ratio, is more obvious. The results were substantially different from the existing study results of the blockage effect of the single model.
(a) (b)
Figure 9. The wind tunnel test results of test condition 2. (a) Layer pressure coefficient; (b) relative error of layer pressure coefficient.
(a) (b)
Figure 10. The wind tunnel test results of test condition 6. (a) Layer pressure coefficient; (b) rela-tive error of layer pressure coefficient.
2 4 6 8 10 12
-2
-1
0
1
layer
μ layer
small model medium model large model
2 4 6 8 10 12-0.5
0.0
0.5
1.0
Δμlayer
medium model large model
layer
2 4 6 8 10 12
-2
-1
0
1
μ layer
layer
small model medium model large model
2 4 6 8 10 12-0.5
0.0
0.5
1.0
medium model large model
Δμlayer
layer
Figure 10. The wind tunnel test results of test condition 6. (a) Layer pressure coefficient; (b) relativeerror of layer pressure coefficient.
Compared with the wind pressure coefficient of the windward surface, the blockageeffect significantly affected the negative pressure area of the target pressure model includingthe lateral and leeward surfaces. Moreover, the phenomenon of the blockage effect of thenegative pressure area is very interesting as it showed the following characteristics:
The ∆µayer of the negative pressure area of test condition 1 was close to 30% (seeFigure 11). Compared with test condition 1, two surrounding models were added upstreamfor test condition 2, and then the ∆µlayer increased slightly (see Figure 9b, whose ∆µlayer ofthe medium model was close to 35%). The resulting effect shows that when surroundingmodels are added in the upstream of the surrounding models at both sides of the targetpressure model, the blockage effect increases slightly, even though the blockage ratio isconstant.
Appl. Sci. 2022, 12, x FOR PEER REVIEW 9 of 19
Compared with the wind pressure coefficient of the windward surface, the blockage effect significantly affected the negative pressure area of the target pressure model includ-ing the lateral and leeward surfaces. Moreover, the phenomenon of the blockage effect of the negative pressure area is very interesting as it showed the following characteristics:
The Δμayer of the negative pressure area of test condition 1 was close to 30% (see Figure 11). Compared with test condition 1, two surrounding models were added upstream for test condition 2, and then the Δμlayer increased slightly (see Figure 9b, whose Δμlayer of the medium model was close to 35%). The resulting effect shows that when surrounding mod-els are added in the upstream of the surrounding models at both sides of the target pres-sure model, the blockage effect increases slightly, even though the blockage ratio is con-stant.
(a) (b)
Figure 11. Wind tunnel test results of test condition 1. (a) Layer pressure coefficient; (b) relative error of layer pressure coefficient.
The surrounding models for test condition 3 were located upstream of the target pres-sure model (see Figure 12). The Δμlayer of the lateral and leeward surfaces of the medium model were about 20%, and the Δμlayer of the lateral and leeward surfaces of the large model was about 50%. In fact, the projection blockage ratio of test condition 3 was the same as that of test condition 1 and test condition 2 (see Figures 9 and 11), but the blockage effect was quite different because of the difference in the relative position of the surround-ing models and the target pressure model.
(a) (b)
Figure 12. Wind tunnel test results of test condition 3. (a) Layer pressure coefficient; (b) relative error of layer pressure coefficient.
Compared with test condition 1, two surrounding models were added downstream in test condition 4 (see Figures 11 and 13). From the wind pressure results, there was little difference between the two test conditions. This result shows that when there are sur-rounding models at the sides of the target pressure model, the blockage effect caused by the surrounding model at the downstream of the side surrounding model can be ignored.
2 4 6 8 10 12
-2
-1
0
1 small model medium model
μ layer
layer2 4 6 8 10 12
-0.5
0.0
0.5
1.0
Δμlayer
layer
medium model
2 4 6 8 10 12
-2
-1
0
1
layer
μ layer
small model medium model large model
2 4 6 8 10 12-0.5
0.0
0.5
1.0
Δμlayer
layer
medium model large model
Figure 11. Wind tunnel test results of test condition 1. (a) Layer pressure coefficient; (b) relative errorof layer pressure coefficient.
The surrounding models for test condition 3 were located upstream of the targetpressure model (see Figure 12). The ∆µlayer of the lateral and leeward surfaces of themedium model were about 20%, and the ∆µlayer of the lateral and leeward surfaces of thelarge model was about 50%. In fact, the projection blockage ratio of test condition 3 wasthe same as that of test condition 1 and test condition 2 (see Figures 9 and 11), but theblockage effect was quite different because of the difference in the relative position of thesurrounding models and the target pressure model.

Appl. Sci. 2022, 12, 7087 10 of 19
Appl. Sci. 2022, 12, x FOR PEER REVIEW 9 of 19
Compared with the wind pressure coefficient of the windward surface, the blockage effect significantly affected the negative pressure area of the target pressure model includ-ing the lateral and leeward surfaces. Moreover, the phenomenon of the blockage effect of the negative pressure area is very interesting as it showed the following characteristics:
The Δμayer of the negative pressure area of test condition 1 was close to 30% (see Figure 11). Compared with test condition 1, two surrounding models were added upstream for test condition 2, and then the Δμlayer increased slightly (see Figure 9b, whose Δμlayer of the medium model was close to 35%). The resulting effect shows that when surrounding mod-els are added in the upstream of the surrounding models at both sides of the target pres-sure model, the blockage effect increases slightly, even though the blockage ratio is con-stant.
(a) (b)
Figure 11. Wind tunnel test results of test condition 1. (a) Layer pressure coefficient; (b) relative error of layer pressure coefficient.
The surrounding models for test condition 3 were located upstream of the target pres-sure model (see Figure 12). The Δμlayer of the lateral and leeward surfaces of the medium model were about 20%, and the Δμlayer of the lateral and leeward surfaces of the large model was about 50%. In fact, the projection blockage ratio of test condition 3 was the same as that of test condition 1 and test condition 2 (see Figures 9 and 11), but the blockage effect was quite different because of the difference in the relative position of the surround-ing models and the target pressure model.
(a) (b)
Figure 12. Wind tunnel test results of test condition 3. (a) Layer pressure coefficient; (b) relative error of layer pressure coefficient.
Compared with test condition 1, two surrounding models were added downstream in test condition 4 (see Figures 11 and 13). From the wind pressure results, there was little difference between the two test conditions. This result shows that when there are sur-rounding models at the sides of the target pressure model, the blockage effect caused by the surrounding model at the downstream of the side surrounding model can be ignored.
2 4 6 8 10 12
-2
-1
0
1 small model medium model
μ layer
layer2 4 6 8 10 12
-0.5
0.0
0.5
1.0
Δμlayer
layer
medium model
2 4 6 8 10 12
-2
-1
0
1
layer
μ layer
small model medium model large model
2 4 6 8 10 12-0.5
0.0
0.5
1.0
Δμlayer
layer
medium model large model
Figure 12. Wind tunnel test results of test condition 3. (a) Layer pressure coefficient; (b) relative errorof layer pressure coefficient.
Compared with test condition 1, two surrounding models were added downstreamin test condition 4 (see Figures 11 and 13). From the wind pressure results, there waslittle difference between the two test conditions. This result shows that when there aresurrounding models at the sides of the target pressure model, the blockage effect caused bythe surrounding model at the downstream of the side surrounding model can be ignored.
Appl. Sci. 2022, 12, x FOR PEER REVIEW 10 of 19
(a) (b)
Figure 13. Wind tunnel test results of test condition 4. (a) Layer pressure coefficient; (b) relative error of layer pressure coefficient.
Compared with test condition 1, two surrounding models were added at both sides of the target pressure model in test condition 5 (see Figures 11 and 14). The Δμlayer of the lateral and leeward surface reached 100%, which was significantly greater than that of test condition 1. The resulting effect shows that when the surrounding models are located at the sides of the target pressure model, the blockage effect has the greatest impact on the wind pressure of the lateral and leeward surfaces.
(a) (b)
Figure 14. Wind tunnel test results of test condition 5. (a) Layer pressure coefficient; (b) relative error of layer pressure coefficient.
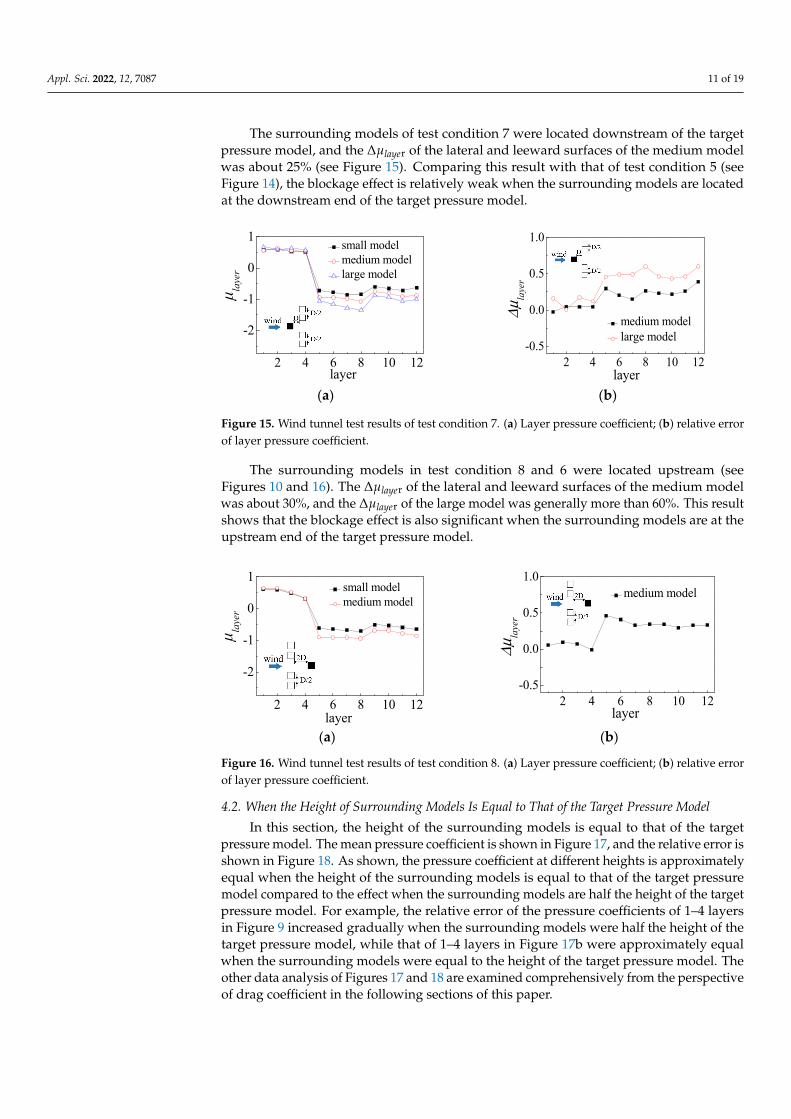
The surrounding models of test condition 7 were located downstream of the target pressure model, and the Δμlayer of the lateral and leeward surfaces of the medium model was about 25% (see Figure 15). Comparing this result with that of test condition 5 (see Figure 14), the blockage effect is relatively weak when the surrounding models are located at the downstream end of the target pressure model.
(a) (b)
Figure 15. Wind tunnel test results of test condition 7. (a) Layer pressure coefficient; (b) relative error of layer pressure coefficient.
The surrounding models in test condition 8 and 6 were located upstream (see Figures 10 and 16). The Δμlayer of the lateral and leeward surfaces of the medium model was about 30%, and the Δμlayer of the large model was generally more than 60%. This result shows
2 4 6 8 10 12
-2
-1
0
1
layer
μ layer
small model medium model large model
2 4 6 8 10 12-0.5
0.0
0.5
1.0
Δμlayer
layer
medium model large model
2 4 6 8 10 12
-2
-1
0
1
μ layer
layer
small model medium model large model
2 4 6 8 10 12-0.5
0.0
0.5
1.0
medium model large model
Δμlayer
layer
2 4 6 8 10 12
-2
-1
0
1
μ layer
layer
small model medium model large model
2 4 6 8 10 12-0.5
0.0
0.5
1.0
Δμlayer
layer
medium model large model
Figure 13. Wind tunnel test results of test condition 4. (a) Layer pressure coefficient; (b) relative errorof layer pressure coefficient.
Compared with test condition 1, two surrounding models were added at both sidesof the target pressure model in test condition 5 (see Figures 11 and 14). The ∆µlayer of thelateral and leeward surface reached 100%, which was significantly greater than that of testcondition 1. The resulting effect shows that when the surrounding models are located atthe sides of the target pressure model, the blockage effect has the greatest impact on thewind pressure of the lateral and leeward surfaces.
Appl. Sci. 2022, 12, x FOR PEER REVIEW 10 of 19
(a) (b)
Figure 13. Wind tunnel test results of test condition 4. (a) Layer pressure coefficient; (b) relative error of layer pressure coefficient.
Compared with test condition 1, two surrounding models were added at both sides of the target pressure model in test condition 5 (see Figures 11 and 14). The Δμlayer of the lateral and leeward surface reached 100%, which was significantly greater than that of test condition 1. The resulting effect shows that when the surrounding models are located at the sides of the target pressure model, the blockage effect has the greatest impact on the wind pressure of the lateral and leeward surfaces.
(a) (b)
Figure 14. Wind tunnel test results of test condition 5. (a) Layer pressure coefficient; (b) relative error of layer pressure coefficient.
The surrounding models of test condition 7 were located downstream of the target pressure model, and the Δμlayer of the lateral and leeward surfaces of the medium model was about 25% (see Figure 15). Comparing this result with that of test condition 5 (see Figure 14), the blockage effect is relatively weak when the surrounding models are located at the downstream end of the target pressure model.
(a) (b)
Figure 15. Wind tunnel test results of test condition 7. (a) Layer pressure coefficient; (b) relative error of layer pressure coefficient.
The surrounding models in test condition 8 and 6 were located upstream (see Figures 10 and 16). The Δμlayer of the lateral and leeward surfaces of the medium model was about 30%, and the Δμlayer of the large model was generally more than 60%. This result shows
2 4 6 8 10 12
-2
-1
0
1
layer
μ layer
small model medium model large model
2 4 6 8 10 12-0.5
0.0
0.5
1.0
Δμlayer
layer
medium model large model
2 4 6 8 10 12
-2
-1
0
1
μ layer
layer
small model medium model large model
2 4 6 8 10 12-0.5
0.0
0.5
1.0
medium model large model
Δμlayer
layer
2 4 6 8 10 12
-2
-1
0
1
μ layer
layer
small model medium model large model
2 4 6 8 10 12-0.5
0.0
0.5
1.0
Δμlayer
layer
medium model large model
Figure 14. Wind tunnel test results of test condition 5. (a) Layer pressure coefficient; (b) relative errorof layer pressure coefficient.
Appl. Sci. 2022, 12, 7087 11 of 19
The surrounding models of test condition 7 were located downstream of the targetpressure model, and the ∆µlayer of the lateral and leeward surfaces of the medium modelwas about 25% (see Figure 15). Comparing this result with that of test condition 5 (seeFigure 14), the blockage effect is relatively weak when the surrounding models are locatedat the downstream end of the target pressure model.
Appl. Sci. 2022, 12, x FOR PEER REVIEW 10 of 19
(a) (b)
Figure 13. Wind tunnel test results of test condition 4. (a) Layer pressure coefficient; (b) relative error of layer pressure coefficient.
Compared with test condition 1, two surrounding models were added at both sides of the target pressure model in test condition 5 (see Figures 11 and 14). The Δμlayer of the lateral and leeward surface reached 100%, which was significantly greater than that of test condition 1. The resulting effect shows that when the surrounding models are located at the sides of the target pressure model, the blockage effect has the greatest impact on the wind pressure of the lateral and leeward surfaces.
(a) (b)
Figure 14. Wind tunnel test results of test condition 5. (a) Layer pressure coefficient; (b) relative error of layer pressure coefficient.
The surrounding models of test condition 7 were located downstream of the target pressure model, and the Δμlayer of the lateral and leeward surfaces of the medium model was about 25% (see Figure 15). Comparing this result with that of test condition 5 (see Figure 14), the blockage effect is relatively weak when the surrounding models are located at the downstream end of the target pressure model.
(a) (b)
Figure 15. Wind tunnel test results of test condition 7. (a) Layer pressure coefficient; (b) relative error of layer pressure coefficient.
The surrounding models in test condition 8 and 6 were located upstream (see Figures 10 and 16). The Δμlayer of the lateral and leeward surfaces of the medium model was about 30%, and the Δμlayer of the large model was generally more than 60%. This result shows
2 4 6 8 10 12
-2
-1
0
1
layer
μ layer
small model medium model large model
2 4 6 8 10 12-0.5
0.0
0.5
1.0
Δμlayer
layer
medium model large model
2 4 6 8 10 12
-2
-1
0
1
μ layer
layer
small model medium model large model
2 4 6 8 10 12-0.5
0.0
0.5
1.0
medium model large model
Δμlayer
layer
2 4 6 8 10 12
-2
-1
0
1μ layer
layer
small model medium model large model
2 4 6 8 10 12-0.5
0.0
0.5
1.0
Δμlayer
layer
medium model large model
Figure 15. Wind tunnel test results of test condition 7. (a) Layer pressure coefficient; (b) relative errorof layer pressure coefficient.
The surrounding models in test condition 8 and 6 were located upstream (seeFigures 10 and 16). The ∆µlayer of the lateral and leeward surfaces of the medium modelwas about 30%, and the ∆µlayer of the large model was generally more than 60%. This resultshows that the blockage effect is also significant when the surrounding models are at theupstream end of the target pressure model.
Appl. Sci. 2022, 12, x FOR PEER REVIEW 11 of 19
that the blockage effect is also significant when the surrounding models are at the up-stream end of the target pressure model.
(a) (b)
Figure 16. Wind tunnel test results of test condition 8. (a) Layer pressure coefficient; (b) relative error of layer pressure coefficient.
4.2. When the Height of Surrounding Models Is Equal to That of the Target Pressure Model In this section, the height of the surrounding models is equal to that of the target
pressure model. The mean pressure coefficient is shown in Figure 17, and the relative error is shown in Figure 18. As shown, the pressure coefficient at different heights is approxi-mately equal when the height of the surrounding models is equal to that of the target pressure model compared to the effect when the surrounding models are half the height of the target pressure model. For example, the relative error of the pressure coefficients of 1–4 layers in Figure 9 increased gradually when the surrounding models were half the height of the target pressure model, while that of 1–4 layers in Figure 17b were approxi-mately equal when the surrounding models were equal to the height of the target pressure model. The other data analysis of Figures 17 and 18 are examined comprehensively from the perspective of drag coefficient in the following sections of this paper.
(a) (b) (c)
(d) (e) (f)
2 4 6 8 10 12
-2
-1
0
1
μ layer
layer
small model medium model
2 4 6 8 10 12-0.5
0.0
0.5
1.0
Δμlayer
layer
medium model
2 4 6 8 10 12
-2
-1
0
1
layer
μ layer
small model medium model large model
2 4 6 8 10 12
-2
-1
0
1
small model medium model
μ layer
layer2 4 6 8 10 12
-2
-1
0
1
small model medium model large model
μ layer
layer
2 4 6 8 10 12
-2
-1
0
1
small model medium model
μ layer
layer2 4 6 8 10 12
-2
-1
0
1
small model medium model
μ layer
layer 2 4 6 8 10 12-2
-1
0
1
small model medium model
μ layer
layer
Figure 16. Wind tunnel test results of test condition 8. (a) Layer pressure coefficient; (b) relative errorof layer pressure coefficient.
4.2. When the Height of Surrounding Models Is Equal to That of the Target Pressure Model
In this section, the height of the surrounding models is equal to that of the targetpressure model. The mean pressure coefficient is shown in Figure 17, and the relative error isshown in Figure 18. As shown, the pressure coefficient at different heights is approximatelyequal when the height of the surrounding models is equal to that of the target pressuremodel compared to the effect when the surrounding models are half the height of the targetpressure model. For example, the relative error of the pressure coefficients of 1–4 layersin Figure 9 increased gradually when the surrounding models were half the height of thetarget pressure model, while that of 1–4 layers in Figure 17b were approximately equalwhen the surrounding models were equal to the height of the target pressure model. Theother data analysis of Figures 17 and 18 are examined comprehensively from the perspectiveof drag coefficient in the following sections of this paper.

Appl. Sci. 2022, 12, 7087 12 of 19
Appl. Sci. 2022, 12, x FOR PEER REVIEW 11 of 19
that the blockage effect is also significant when the surrounding models are at the up-stream end of the target pressure model.
(a) (b)
Figure 16. Wind tunnel test results of test condition 8. (a) Layer pressure coefficient; (b) relative error of layer pressure coefficient.
4.2. When the Height of Surrounding Models Is Equal to That of the Target Pressure Model In this section, the height of the surrounding models is equal to that of the target
pressure model. The mean pressure coefficient is shown in Figure 17, and the relative error is shown in Figure 18. As shown, the pressure coefficient at different heights is approxi-mately equal when the height of the surrounding models is equal to that of the target pressure model compared to the effect when the surrounding models are half the height of the target pressure model. For example, the relative error of the pressure coefficients of 1–4 layers in Figure 9 increased gradually when the surrounding models were half the height of the target pressure model, while that of 1–4 layers in Figure 17b were approxi-mately equal when the surrounding models were equal to the height of the target pressure model. The other data analysis of Figures 17 and 18 are examined comprehensively from the perspective of drag coefficient in the following sections of this paper.
(a) (b) (c)
(d) (e) (f)
2 4 6 8 10 12
-2
-1
0
1
μ layer
layer
small model medium model
2 4 6 8 10 12-0.5
0.0
0.5
1.0
Δμlayer
layer
medium model
2 4 6 8 10 12
-2
-1
0
1
layer
μ layer
small model medium model large model
2 4 6 8 10 12
-2
-1
0
1
small model medium model
μ layer
layer2 4 6 8 10 12
-2
-1
0
1
small model medium model large model
μ layer
layer
2 4 6 8 10 12
-2
-1
0
1
small model medium model
μ layer
layer2 4 6 8 10 12
-2
-1
0
1
small model medium model
μ layer
layer 2 4 6 8 10 12-2
-1
0
1
small model medium model
μ layer
layerAppl. Sci. 2022, 12, x FOR PEER REVIEW 12 of 19
(g) (h)
Figure 17. The mean pressure coefficient of the layers. (a) test condition 1; (b) test condition 2; (c) test condition 3; (d) test condition 4; (e) test condition 5; (f) test condition 6; (g) test condition 7; (h) test condition 8.
(a) (b) (c)
(d) (e) (f)
(g) (h)
Figure 18. The relative error of the mean pressure coefficient of layers. (a) test condition 1; (b) test condition 2; (c) test condition 3; (d) test condition 4; (e) test condition 5; (f) test condition 6; (g) test condition 7; (h) test condition 8.
It should be pointed out that the interference effects of the three scaled models of each test condition were the same, therefore, all of the above relative errors of the wind pressure are not related to the interference effect.
5. Discussion on the Existing Definition of Blockage Ratio The existing calculation methods for the blockage ratio mainly include the projection
blockage ratio and the section blockage ratio. The definition of the projection blockage ratio is shown in Equation (1). The section blockage ratio is defined as the ratio of the windward area of all models at the section where the target pressure model is located
2 4 6 8 10 12-2
-1
0
1
small model medium model
μ layer
layer2 4 6 8 10 12
-2
-1
0
1
small model medium model
μ layer
layer
2 4 6 8 10 12-0.5
0.0
0.5
1.0
medium model large model
Δμlayer
layer2 4 6 8 10 12
-0.5
0.0
0.5
1.0
medium model
Δμlayer
layer2 4 6 8 10 12
-0.5
0.0
0.5
1.0
1.5
medium model large model
Δμlayer
layer
2 4 6 8 10 12-0.5
0.0
0.5
1.0
medium model
Δμlayer
layer 2 4 6 8 10 12
-0.5
0.0
0.5
1.0
medium model
Δμlayer
layer2 4 6 8 10 12
-0.5
0.0
0.5
1.0
medium model
Δμlayer
layer
2 4 6 8 10 12-0.5
0.0
0.5
1.0
medium model
Δμlayer
layer2 4 6 8 10 12
-0.5
0.0
0.5
1.0
medium model
Δμlayer
layer
Figure 17. The mean pressure coefficient of the layers. (a) test condition 1; (b) test condition 2; (c) testcondition 3; (d) test condition 4; (e) test condition 5; (f) test condition 6; (g) test condition 7; (h) testcondition 8.
Appl. Sci. 2022, 12, x FOR PEER REVIEW 12 of 19
(g) (h)
Figure 17. The mean pressure coefficient of the layers. (a) test condition 1; (b) test condition 2; (c) test condition 3; (d) test condition 4; (e) test condition 5; (f) test condition 6; (g) test condition 7; (h) test condition 8.
(a) (b) (c)
(d) (e) (f)
(g) (h)
Figure 18. The relative error of the mean pressure coefficient of layers. (a) test condition 1; (b) test condition 2; (c) test condition 3; (d) test condition 4; (e) test condition 5; (f) test condition 6; (g) test condition 7; (h) test condition 8.
It should be pointed out that the interference effects of the three scaled models of each test condition were the same, therefore, all of the above relative errors of the wind pressure are not related to the interference effect.
5. Discussion on the Existing Definition of Blockage Ratio The existing calculation methods for the blockage ratio mainly include the projection
blockage ratio and the section blockage ratio. The definition of the projection blockage ratio is shown in Equation (1). The section blockage ratio is defined as the ratio of the windward area of all models at the section where the target pressure model is located
2 4 6 8 10 12-2
-1
0
1
small model medium model
μ layer
layer2 4 6 8 10 12
-2
-1
0
1
small model medium model
μ layer
layer
2 4 6 8 10 12-0.5
0.0
0.5
1.0
medium model large model
Δμlayer
layer2 4 6 8 10 12
-0.5
0.0
0.5
1.0
medium model
Δμlayer
layer2 4 6 8 10 12
-0.5
0.0
0.5
1.0
1.5
medium model large model
Δμlayer
layer
2 4 6 8 10 12-0.5
0.0
0.5
1.0
medium model
Δμlayer
layer 2 4 6 8 10 12
-0.5
0.0
0.5
1.0
medium model
Δμlayer
layer2 4 6 8 10 12
-0.5
0.0
0.5
1.0
medium model
Δμlayer
layer
2 4 6 8 10 12-0.5
0.0
0.5
1.0
medium model
Δμlayer
layer2 4 6 8 10 12
-0.5
0.0
0.5
1.0
medium model
Δμlayer
layer
Figure 18. The relative error of the mean pressure coefficient of layers. (a) test condition 1; (b) testcondition 2; (c) test condition 3; (d) test condition 4; (e) test condition 5; (f) test condition 6; (g) testcondition 7; (h) test condition 8.

Appl. Sci. 2022, 12, 7087 13 of 19
It should be pointed out that the interference effects of the three scaled models of eachtest condition were the same, therefore, all of the above relative errors of the wind pressureare not related to the interference effect.
5. Discussion on the Existing Definition of Blockage Ratio
The existing calculation methods for the blockage ratio mainly include the projectionblockage ratio and the section blockage ratio. The definition of the projection blockage ratiois shown in Equation (1). The section blockage ratio is defined as the ratio of the windwardarea of all models at the section where the target pressure model is located compared tothe sectional area of the wind tunnel. Taking the medium model as an example, Table 5shows the projection blockage ratio, section blockage ratio, and relative error of the dragcoefficient. Figure 19 shows the relative error of the drag coefficient varying with theblockage ratio.
Table 5. The relative error of drag coefficient of the medium model.
Test Condition Projection Blockage Ratio Section Blockage Ratio Relative Error of Drag Coefficient (∆CD)
1 4.76% 4.76% 19.7%2 4.76% 4.76% 21.2%3 4.76% 2.38% 18.2%4 4.76% 4.76% 15%5 7.14% 7.14% 23.5%6 7.14% 2.38% 16%7 7.14% 2.38% 14.4%8 7.14% 2.38% 24.5%
Appl. Sci. 2022, 12, x FOR PEER REVIEW 13 of 19
compared to the sectional area of the wind tunnel. Taking the medium model as an exam-ple, Table 5 shows the projection blockage ratio, section blockage ratio, and relative error of the drag coefficient. Figure 19 shows the relative error of the drag coefficient varying with the blockage ratio.
Table 5. The relative error of drag coefficient of the medium model.
Test Condition Projection Blockage Ratio Section Blockage Ratio Relative Error of Drag Coefficient (ΔCD) 1 4.76% 4.76% 19.7% 2 4.76% 4.76% 21.2% 3 4.76% 2.38% 18.2% 4 4.76% 4.76% 15% 5 7.14% 7.14% 23.5% 6 7.14% 2.38% 16% 7 7.14% 2.38% 14.4% 8 7.14% 2.38% 24.5%
According to the results in Table 5 and Figure 19, the ΔCD does not increase uniformly with an increase of the projection blockage ratio and section blockage ratio. For example, the projection blockage ratio of test condition 1–3 was the same, while the ΔCD was not equal, which is a contradictory phenomenon. The same phenomenon occurred in test con-ditions 5–8. Similarly, the section blockage ratio of test conditions 1–3 was the same, but the ΔCD showed significant differences. Furthermore, the section blockage ratio of test condition 8 was smaller than that of test conditions 1 and 3, but the ΔCD was significantly larger than in those tests. The above results show that there will be contradictory phenom-enon of a ‘same blockage ratio, different blockage effect’ or a ‘small blockage ratio, large blockage effect’ when the existing definitions of the blockage ratio are used to evaluate the blockage effect.
(a) (b)
Figure 19. ΔCD varying with blockage ratio. (a) ΔCD varying with projection blockage ratio; (b) ΔCD varying with section blockage ratio.
It can be seen from the above analysis that neither the projection blockage ratio nor the section blockage ratio can be used to directly evaluate the severity of the blockage effect. That is to say, the value of these two ratios does not correspond to the severity of the blockage effect of tall buildings with surrounding buildings.
6. Proposed Calculation Method of Equivalent Blockage Ratio The above analysis in this paper shows that the blockage effect will be significantly
affected by the location, number, and height of the surrounding models, and this mecha-nism is very complex. It is difficult to propose a correct method for the blockage effect in a wind tunnel test for grouped buildings. However, it is of great significance to put for-ward a calculation method to evaluate the severity of the blockage effect, which can help researchers determine the scale ratio of wind tunnel test models. The calculation method
2 4 6 810
15
20
25
ΔCD
(%)
projection blocking ratio(%)2 4 6 810
15
20
25
ΔCD
(%)
section blocking ratio(%)
Figure 19. ∆CD varying with blockage ratio. (a) ∆CD varying with projection blockage ratio; (b) ∆CD
varying with section blockage ratio.
According to the results in Table 5 and Figure 19, the ∆CD does not increase uniformlywith an increase of the projection blockage ratio and section blockage ratio. For example, theprojection blockage ratio of test condition 1–3 was the same, while the ∆CD was not equal,which is a contradictory phenomenon. The same phenomenon occurred in test conditions5–8. Similarly, the section blockage ratio of test conditions 1–3 was the same, but the ∆CDshowed significant differences. Furthermore, the section blockage ratio of test condition8 was smaller than that of test conditions 1 and 3, but the ∆CD was significantly larger thanin those tests. The above results show that there will be contradictory phenomenon of a‘same blockage ratio, different blockage effect’ or a ‘small blockage ratio, large blockage effect’when the existing definitions of the blockage ratio are used to evaluate the blockage effect.
Appl. Sci. 2022, 12, 7087 14 of 19
It can be seen from the above analysis that neither the projection blockage ratio northe section blockage ratio can be used to directly evaluate the severity of the blockageeffect. That is to say, the value of these two ratios does not correspond to the severity of theblockage effect of tall buildings with surrounding buildings.
6. Proposed Calculation Method of Equivalent Blockage Ratio
The above analysis in this paper shows that the blockage effect will be significantlyaffected by the location, number, and height of the surrounding models, and this mechanismis very complex. It is difficult to propose a correct method for the blockage effect ina wind tunnel test for grouped buildings. However, it is of great significance to putforward a calculation method to evaluate the severity of the blockage effect, which canhelp researchers determine the scale ratio of wind tunnel test models. The calculationmethod for the blockage ratio will be presented with the drag coefficient as the topic forthe following sections of this paper.
6.1. The Drag Coefficient Error Caused by Surrounding Models
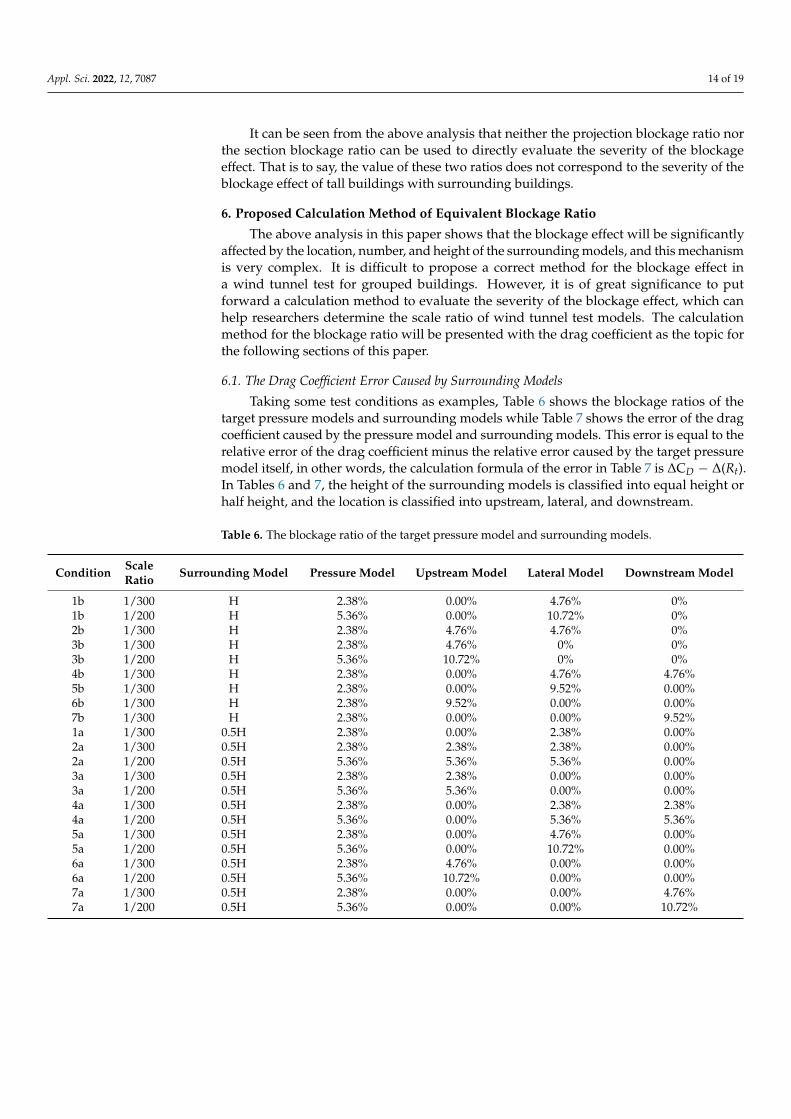
Taking some test conditions as examples, Table 6 shows the blockage ratios of thetarget pressure models and surrounding models while Table 7 shows the error of the dragcoefficient caused by the pressure model and surrounding models. This error is equal to therelative error of the drag coefficient minus the relative error caused by the target pressuremodel itself, in other words, the calculation formula of the error in Table 7 is ∆CD − ∆(Rt).In Tables 6 and 7, the height of the surrounding models is classified into equal height orhalf height, and the location is classified into upstream, lateral, and downstream.
Table 6. The blockage ratio of the target pressure model and surrounding models.
Condition ScaleRatio Surrounding Model Pressure Model Upstream Model Lateral Model Downstream Model
1b 1/300 H 2.38% 0.00% 4.76% 0%1b 1/200 H 5.36% 0.00% 10.72% 0%2b 1/300 H 2.38% 4.76% 4.76% 0%3b 1/300 H 2.38% 4.76% 0% 0%3b 1/200 H 5.36% 10.72% 0% 0%4b 1/300 H 2.38% 0.00% 4.76% 4.76%5b 1/300 H 2.38% 0.00% 9.52% 0.00%6b 1/300 H 2.38% 9.52% 0.00% 0.00%7b 1/300 H 2.38% 0.00% 0.00% 9.52%1a 1/300 0.5H 2.38% 0.00% 2.38% 0.00%2a 1/300 0.5H 2.38% 2.38% 2.38% 0.00%2a 1/200 0.5H 5.36% 5.36% 5.36% 0.00%3a 1/300 0.5H 2.38% 2.38% 0.00% 0.00%3a 1/200 0.5H 5.36% 5.36% 0.00% 0.00%4a 1/300 0.5H 2.38% 0.00% 2.38% 2.38%4a 1/200 0.5H 5.36% 0.00% 5.36% 5.36%5a 1/300 0.5H 2.38% 0.00% 4.76% 0.00%5a 1/200 0.5H 5.36% 0.00% 10.72% 0.00%6a 1/300 0.5H 2.38% 4.76% 0.00% 0.00%6a 1/200 0.5H 5.36% 10.72% 0.00% 0.00%7a 1/300 0.5H 2.38% 0.00% 0.00% 4.76%7a 1/200 0.5H 5.36% 0.00% 0.00% 10.72%

Appl. Sci. 2022, 12, 7087 15 of 19
Table 7. The error of the drag coefficient caused by the pressure model and surrounding model.
Condition Scale Ratio Surrounding Model Total Error Pressure Model Surrounding Models
1b 1/300 H 25% 4% 21%1b 1/200 H 58% 14% 44%2b 1/300 H 35% 4% 31%3b 1/300 H 26% 4% 22%3b 1/200 H 59% 14% 45%4b 1/300 H 34% 4% 30%5b 1/300 H 46% 4% 42%6b 1/300 H 34% 4% 30%7b 1/300 H 16% 4% 12%1a 1/300 0.5H 20% 4% 16%2a 1/300 0.5H 21% 4% 17%2a 1/200 0.5H 43% 14% 29%3a 1/300 0.5H 18% 4% 14%3a 1/200 0.5H 39% 14% 25%4a 1/300 0.5H 15% 4% 11%4a 1/200 0.5H 34% 14% 20%5a 1/300 0.5H 24% 4% 20%5a 1/200 0.5H 55% 14% 41%6a 1/300 0.5H 16% 4% 12%6a 1/200 0.5H 45% 14% 31%7a 1/300 0.5H 14% 4% 10%7a 1/200 0.5H 33% 14% 19%
According to the analysis results in Section 4 of this paper, it is necessary to considerthe overlapping projected parts of the upstream models and lateral models, but it is notnecessary to consider the overlapping parts of the downstream models and lateral models.According to this characteristic and the results in Tables 6 and 7, the multivariable equationscan be obtained as follows:{
Rueqkueq + Rleqkleq + Rdeqkdeq + Roeqkoeq = ∆qeRuhqkuhq + Rlhqklhq + Rdhqkdhq + Rohqkohq = ∆qh
(10)
In Equation (10), the subscripts u, l, d, e, h, and o represent the upstream, lateral,downstream, equal, half, and overlap effects, respectively. The subscript q represents theq-th equation. R and k represent the blockage ratio and influence coefficient of the unitblockage ratio, ∆ represents the error of the drag coefficient.
By solving Equation (10) using regression analysis, each coefficient value can beobtained (see Table 8). It can be seen from Table 8 that: (a) the influence coefficient of theblockage effect of downstream models was at the minimum, while that of lateral modelswas at the maximum (i.e., the blockage effect caused by the lateral model with each unitblockage ratio was larger than that of the upstream model and that of the downstreammodel); (b) the influence coefficient of the blockage effect of surrounding models of equalheight was greater than that of models of half-height; and (c) in addition to the conditionwhere the surrounding models were at the downstream end, the influence coefficient ofblockage effect of surrounding models was greater than that of the target pressure model.These conclusions are entirely consistent with the analysis results in Section 4.
Table 8. Th regression results of the influence coefficient of the blockage effect.
Surrounding Location Equal Height Half Height
Upstream Ru 3.8 3.2lateral Rl 4.3 3.7
Downstream Rd 1.4 1.5Overlap Ro 1.4 1.6

Appl. Sci. 2022, 12, 7087 16 of 19
6.2. Equivalent Blockage Ratio
Based on the above analysis, the drag coefficient error caused by the blockage effectof the target pressure-measuring models can be calculated according to Equation (9), andthe drag coefficient error caused by the blockage effect of the surrounding models can becalculated according to Equation (10); the added amount of these two values is the totalerror caused by the blockage effect. For the convenience of Equations (9) and (10), thispaper proposes the concept of a equivalent blockage ratio. Taking the influence coefficientof the blockage effect of a target pressure-measuring model in Equation (9), which was 2.5,as the benchmark, the influence coefficient of the blockage effect of the surrounding modelsin Equation (10) was divided by 2.5, thereafter, the equation of the equivalent blockageratio can be expressed as follows:
Rr = Rt + 1.52Rue + 1.72Rle + 0.56Rde − 0.56Roe + 1.28Ruh + 1.48Rlh + 0.6Rdh − 0.64Roe (11)
Thus, the relationship between the equivalent blockage ratio Rr and ∆CD is as follows:
∆CD = 2.5Rr (12)
Figure 20 shows the test results of ∆CD and the results calculated by Equation (12). Itcan be seen from Figure 20 that the results of Equation (12) are in agreement with the testdata. As is known, the essential meaning of the blockage ratio is to evaluate the severity ofthe blockage effect to ensure the reliability of the wind tunnel test data. In this paper, themeaning of the equivalent blockage ratio by Equation (11) can directly serve for the windtunnel tests of tall buildings. In other words, if the drag coefficient is taken as the controlobject, the calculation method of a blockage ratio should be the equivalent blockage ratioinstead of the traditional method when determining the scale ratio for test models.
Appl. Sci. 2022, 12, x FOR PEER REVIEW 16 of 19
models in Equation (10) was divided by 2.5, thereafter, the equation of the equivalent blockage ratio can be expressed as follows:
Rr = Rt + 1.52Rue + 1.72Rle + 0.56Rde − 0.56Roe + 1.28Ruh + 1.48Rlh + 0.6Rdh − 0.64Roe (11)
Thus, the relationship between the equivalent blockage ratio Rr and ΔCD is as follows:
ΔCD = 2.5Rr (12)
Figure 20 shows the test results of ΔCD and the results calculated by Equation (12). It can be seen from Figure 20 that the results of Equation (12) are in agreement with the test data. As is known, the essential meaning of the blockage ratio is to evaluate the severity of the blockage effect to ensure the reliability of the wind tunnel test data. In this paper, the meaning of the equivalent blockage ratio by Equation (11) can directly serve for the wind tunnel tests of tall buildings. In other words, if the drag coefficient is taken as the control object, the calculation method of a blockage ratio should be the equivalent block-age ratio instead of the traditional method when determining the scale ratio for test mod-els.
Figure 20. The relationship between ΔCD and the equivalent blockage ratio.
As the actual wind tunnel test of high-rise buildings may be very different from the test conditions in this paper, the practical application method of Equation (11) and Table 8 is described as follows:
For an actual wind tunnel test for a tall building with surrounding buildings, the drag coefficient error caused by the blockage effect of the target pressure-measuring model can be calculated easily, whose influence coefficient is 2.5, while the drag coefficient error caused by the surrounding buildings should be calculated according to the heights of the surrounding buildings. If the heights of the surrounding buildings are about 1/3 to 2/3 of the pressure-measuring building, the influence coefficient of the drag coefficient error can be approximately determined according to the ‘half height’ conditions in Table 8, and if the height of the surrounding buildings exceeds 2/3 of the height of the pressure-measur-ing building, the influence coefficient can be approximately determined according to ‘equal height’ conditions in Table 8. Of course, this is only an approximate method, and further research is necessary to cover other actual possible situations.
7. Conclusions It should be pointed out that the interference effects of the three scaled models of
each test condition in this paper were the same, in other words, the relative error of the wind pressure has nothing to do with the interference effect. Meanwhile, compared to the blockage effect, the influence of Reynolds number difference can be ignored for square prisms. Therefore, it is reasonable to attribute the reason for the data differences in this paper to the blockage effects. In this paper, the influence of the blockage effect of the wind tunnel tests of grouped buildings on the pressure coefficient was studied, and the concept of the equivalent blockage ratio is proposed. Some of the paper’s innovative conclusions are as follows:
4 8 12 16 200
15
30
45
60
ΔCD (%
)
Rr(%)
test results calculation result of Eq.12
Figure 20. The relationship between ∆CD and the equivalent blockage ratio.
As the actual wind tunnel test of high-rise buildings may be very different from thetest conditions in this paper, the practical application method of Equation (11) and Table 8is described as follows:
For an actual wind tunnel test for a tall building with surrounding buildings, thedrag coefficient error caused by the blockage effect of the target pressure-measuring modelcan be calculated easily, whose influence coefficient is 2.5, while the drag coefficient errorcaused by the surrounding buildings should be calculated according to the heights of thesurrounding buildings. If the heights of the surrounding buildings are about 1/3 to 2/3 ofthe pressure-measuring building, the influence coefficient of the drag coefficient error canbe approximately determined according to the ‘half height’ conditions in Table 8, and if theheight of the surrounding buildings exceeds 2/3 of the height of the pressure-measuringbuilding, the influence coefficient can be approximately determined according to ‘equalheight’ conditions in Table 8. Of course, this is only an approximate method, and furtherresearch is necessary to cover other actual possible situations.

Appl. Sci. 2022, 12, 7087 17 of 19
7. Conclusions
It should be pointed out that the interference effects of the three scaled models ofeach test condition in this paper were the same, in other words, the relative error of thewind pressure has nothing to do with the interference effect. Meanwhile, compared to theblockage effect, the influence of Reynolds number difference can be ignored for squareprisms. Therefore, it is reasonable to attribute the reason for the data differences in thispaper to the blockage effects. In this paper, the influence of the blockage effect of the windtunnel tests of grouped buildings on the pressure coefficient was studied, and the conceptof the equivalent blockage ratio is proposed. Some of the paper’s innovative conclusionsare as follows:
(1) The wind pressure of the lateral and leeward surfaces is more greatly affected by theblockage effect, while that of the windward surface is less affected by its blockageeffect. However, when there are many surrounding models at the upstream end of thetarget pressure model, the blockage effect of the pressure coefficient of the windwardsurface cannot be ignored.
(2) When the relative position of the surrounding model is different from that of thetarget pressure model, even if the blockage ratios are the same, the blockage effect isstill significantly different.
(3) When the surrounding models are located at the upstream or lateral side of the targetpressure model, the blockage effect are the most significant. The blockage effect isrelatively weak when the surrounding models are located at the downstream end ofthe target pressure model. The blockage effect caused by surrounding models witheach unit blockage ratio is greater than that of the target pressure model itself.
(4) Existing calculation methods for the blockage ratio are only applicable for the windtunnel tests of single buildings. There are some calculation defects when these meth-ods are used to evaluate the blockage severity of grouped buildings, which will causethe contradiction phenomenon of a ‘small blockage ratio, large blockage effect’ andthe ‘same blockage ratio, different blockage effect’.
(5) The proposed equivalent blockage ratio calculation method is applicable to the block-age effect of grouped tall buildings. In the design of wind tunnel test models ofgrouped tall buildings, this method is more reliable in controlling the equivalentblockage ratio in a certain range than the blockage ratio of traditionally definedmethods.
(6) Additional discussion: First, it should be pointed out that the blockage effect canalso be affected by the relationship between the relative height of test models fortall buildings and the wind tunnel section. For example, for a model with the samewidth, when the height increases, the blockage ratio increases at the same ratio, butthe blockage effect may not increase as much [10]. The definition of a blockage ratioas proposed by Okajima is the ratio of the width of the windward surface of themodel compared to the width of the wind tunnel section, which may be based on thisconsideration. In this paper, the ratio of the model height to the height of the windtunnel section was about 20~60%, which is the most common size for wind tunnel testmodels at present. Second, the test models in this paper were cylinders with squaresections. When the test models include other blunt body sections, especially whenthe test model is a streamline body, the blockage effect results may be quite different.Whether the test results in this paper are applicable to such test conditions needs tobe discussed separately. Finally, it must be acknowledged that the distribution of thesurrounding models varies greatly. This paper only analyzed some representativetest conditions, but there are still many test conditions that can supplement thesefindings. Nevertheless, as a beginning and pioneering research paper on the blockageeffect of high-rise buildings with surrounding buildings, this paper will provide anapproximate guidance for similar wind tunnel tests.

Appl. Sci. 2022, 12, 7087 18 of 19
Author Contributions: Data curation, L.W., F.S. and Z.W.; Funding acquisition, S.L.; Writing—review& editing, F.S. All authors have read and agreed to the published version of the manuscript.
Funding: This study was supported by the National Natural Science Foundation of China (Nos.51708186 and 51178359).
Conflicts of Interest: The authors declare no conflict of interest.
References1. Saathoff, P.J.; Melbourne, W.H. Freestream turbulence and wind tunnel blockage effects on streamwise surface pressures. J. Wind.
Eng. Ind. Aerodyn. 1987, 26, 353–370. [CrossRef]2. Maskell, E.C. A Theory of the Blockage Effects on Bluff Bodies and Stalled Wings in a Closed Wind Tunnel; Her Majesty’s Stationery
Office: London, UK, 1963.3. Raju, K.; Singh, V. Blockage effects on drag of sharp-edged bodies. J. Wind Eng. Ind. Aerodyn. 1975, 1, 301–309. [CrossRef]4. Courchesne, J.; Laneville, A. A comparison of correction methods used in the evaluation of drag coefficient measurements for
two-dimensional rectangular cylinders. J. Fluids Eng. 1979, 101, 506–510. [CrossRef]5. Awbi, H. Wind-tunnel-wall constraint on two-dimensional rectangular-section prisms. J. Wind Eng. Ind. Aerodyn. 1978, 3, 285–306.
[CrossRef]6. Awbi, H. Effect of blockage on the strouhal number of two-dimensional bluff bodies. J. Wind Eng. Ind. Aerodyn. 1983, 12, 353–362.
[CrossRef]7. James, N. The Effects of Stream Turbulence on a Separated Flow with Reattachment. Ph.D. Thesis, University of London, London,
UK, 1982.8. Nakamura, Y.; Ohya, Y. The effects of turbulence on the mean flow past two-dimensional rectangular cylinders. J. Fluid Mech.
1984, 149, 255–273. [CrossRef]9. Laneville, A. Turbulence and blockage effects on two dimensional rectangular cylinders. J. Wind Eng. Ind. Aerodyn. 1990, 33,
11–20. [CrossRef]10. Okajima, A.; Yi, D.; Sakuda, A.; Nakano, T. Numerical study of blockage effects on aerodynamic characteristics of an oscillating
rectangular cylinder. J. Wind Eng. Ind. Aerodyn. 1997, 67–68, 91–102. [CrossRef]11. Prasanth, T.; Behara, S.; Singh, S.; Kumar, R.; Mittal, S. Effect of blockage on vortex-induced vibrations at low Reynolds numbers.
J. Fluids Struct. 2006, 22, 865–876. [CrossRef]12. Ross, I.; Altman, A. Wind tunnel blockage corrections: Review and application to Savonius vertical-axis wind turbines. J. Wind
Eng. Ind. Aerodyn. 2011, 99, 523–538. [CrossRef]13. Wang, L.; Liang, S.G.; Tang, H.Q. Investigation on wind tunnel blockage effect of super high-rise building. In Proceedings of the
Seventh International Colloquium on Bluff Body Aerodynamics and Applications, Shanghai, China, 2–6 September 2012.14. Yang, F.; Zhou, Z.; Tang, G.; Lu, L. Steady flow around a square cylinder near a plane boundary. Ocean Eng. 2021, 222, 108599.
[CrossRef]15. Liu, M.; Xiao, L.; Yang, L. Experimental investigation of flow characteristics around four square-cylinder arrays at subcritical
Reynolds numbers. Int. J. Nav. Arch. Ocean Eng. 2015, 7, 906–919. [CrossRef]16. Yang, Q.; Liu, Q.K.; Han, R. Reynolds number effect of aerodynamic characteristics of square prism with different rounded corner
ratios. J. Vib. Shock. 2020, 39, 150–156.17. Wang, H.; Zhao, X.; He, X.; Zhou, Y. Effects of oncoming flow conditions on the aerodynamic forces on a cantilevered square
cylinder. J. Fluids Struct. 2017, 75, 140–157. [CrossRef]18. Knisely, C. Strouhal numbers of rectangular cylinders at incidence: A review and new data. J. Fluids Struct. 1990, 4, 371–393.
[CrossRef]19. Wang, X.R.; Gu, M. Experimental study on wind pressure distributions of 2-D square prisms with various corner treatments.
China Civ. Eng. J. 2016, 49, 79–88.20. Bai, H.; Alam, M. Dependence of square cylinder wake on Reynolds number. Phys. Fluids 2018, 30, 015102. [CrossRef]21. Li, S.; Luo, Z.; Deng, X.; Peng, W.; Liu, Z. Experimental investigation on active control of flow around a finite-length square
cylinder using dual synthetic jet. J. Wind Eng. Ind. Aerodyn. 2021, 210, 104519. [CrossRef]22. Cheng, C.; Lu, P.; Chen, R. Wind loads on square cylinder in homogeneous turbulent flows. J. Wind Eng. Ind. Aerodyn. 1992, 41,
739–749. [CrossRef]23. Lee, B.E. The effect of turbulence on the surface pressure field of a square prism. J. Fluid Mech. 1975, 69, 263–282. [CrossRef]24. Reinhold, T.A.; Tieleman, H.W.; Maher, F.J. Interaction of square prisms in two flow fields. J. Wind Eng. Ind. Aerodyn. 1977, 2,
223–241. [CrossRef]25. Lesage, F.; Gartshore, I. A method of reducing drag and fluctuating side force on bluff bodies. J. Wind Eng. Ind. Aerodyn. 1987, 25,
229–245. [CrossRef]26. Sakamoto, H.; Hainu, H.; Obata, Y. Fluctuating forces acting on two square prisms in a tandem arrangement. J. Wind Eng. Ind.
Aerodyn. 1987, 26, 85–103. [CrossRef]27. Norberg, C. Flow around rectangular cylinders: Pressure forces and wake frequencies. J. Wind Eng. Ind. Aerodyn. 1993, 49,
187–196. [CrossRef]
Appl. Sci. 2022, 12, 7087 19 of 19
28. Tamura, T.; Miyagi, T. The effect of turbulence on aerodynamic forces on a square cylinder with various corner shapes. J. WindEng. Ind. Aerodyn. 1999, 83, 135–145. [CrossRef]
29. van Oudheusden, B.; Scarano, F.; van Hinsberg, N.; Roosenboom, E. Quantitative visualization of the flow around a square-sectioncylinder at incidence. J. Wind Eng. Ind. Aerodyn. 2008, 96, 913–922. [CrossRef]
30. Alam, M.M.; Zhou, Y.; Wang, X.W. The wake of two side-by-side square cylinders. J. Fluid Mech. 2011, 669, 432–471. [CrossRef]31. Yen, S.C.; Liu, J.H. Wake flow behind two side-by-side square cylinders. Int. J. Heat Fluid Flow 2011, 32, 41–51. [CrossRef]32. Lyn, D.A.; Einav, S.; Rodi, W.; Park, J.-H. A laser-Doppler velocimetry study of ensemble-averaged characteristics of the turbulent
near wake of a square cylinder. J. Fluid Mech. 1995, 304, 285–319. [CrossRef]33. Yamagishi, Y.; Kimura, S.; Oki, M. Flow characteristics around a square cylinder with changing chamfer dimensions. J. Vis. 2010,
13, 61–68. [CrossRef]34. Saha, A.K.; Muralidhar, K.; Biswas, G. Experimental study of flow past a square cylinder at high Reynolds numbers. Exp. Fluids
2000, 29, 553–563. [CrossRef]35. Luo, S.; Yazdani, M.; Chew, Y.; Lee, T. Effects of incidence and afterbody shape on flow past bluff cylinders. J. Wind Eng. Ind.
Aerodyn. 1994, 53, 375–399. [CrossRef]36. Hu, J.C.; Zhou, Y.; Dalton, C. Effects of the corner radius on the near wake of a square prism. Exp. Fluids 2005, 40, 106–118.
[CrossRef]37. Parkinson, G.; Kong, L.; Cook, N. Configuration criteria for a blockage-tolerant wind tunnel. J. Wind Eng. Ind. Aerodyn. 1992, 40,
215–219. [CrossRef]38. Sharify, E.M.; Saito, H.; Harasawa, H. Experimental and numerical study of blockage effects on flow characteristics around a
square-section cylinder. J. Jpn. Soc. Exp. Mech. 2013, 13, s7–s12.39. Gao, Y.; Quan, Y.; Gu, M. Large Eddy Simulation of Blockage Effect on Flow Past a Two Dimensional Square Cylinder. J. Tongji
Univ. 2018, 46, 1018–1025.
Copyright © 2022 FDOKUMEN