Bistable Bacterial Growth Dynamics in the Presence of ... - MDPI
19
antibiotics Article Bistable Bacterial Growth Dynamics in the Presence of Antimicrobial Agents Nelly Frenkel 1,† , Ron Saar Dover 1,† , Eve Titon 2 , Yechiel Shai 1, * and Vered Rom-Kedar 2, * Citation: Frenkel, N.; Saar Dover, R.; Titon, E.; Shai, Y.; Rom-Kedar, V. Bistable Bacterial Growth Dynamics in the Presence of Antimicrobial Agents. Antibiotics 2021, 10, 87. https://doi.org/10.3390/ antibiotics10010087 Received: 21 December 2020 Accepted: 13 January 2021 Published: 18 January 2021 Publisher’s Note: MDPI stays neutral with regard to jurisdictional claims in published maps and institutional affil- iations. Copyright: © 2021 by the authors. Licensee MDPI, Basel, Switzerland. This article is an open access article distributed under the terms and conditions of the Creative Commons Attribution (CC BY) license (https:// creativecommons.org/licenses/by/ 4.0/). 1 Department of Biomolecular Sciences, 206 Nella and Leon Benoziyo Building for Biological Sciences, The Weizmann Institute of Science, Rehovot 76100, Israel; [email protected] (N.F.); [email protected] (R.S.D.) 2 Department of Computer Science and Applied Mathematics, 211 Jacob Ziskind Building, The Weizmann Institute of Science, Rehovot 76100, Israel; [email protected] * Correspondence: [email protected] (Y.S.); [email protected] (V.R.-K.); Tel.: +972-8-9342711 (Y.S.); +972-8-934-3170 (V.R.-K.); Fax: +972-8-9344112 (Y.S.); +972-8-934-4122 (V.R.-K.) † Nelly Frenkel and Ron Saar Dover contributed equally to this work. Abstract: The outcome of an antibiotic treatment on the growth capacity of bacteria is largely dependent on the initial population size (Inoculum Effect). We characterized and built a model of this effect in E. coli cultures using a large variety of antimicrobials, including conventional antibiotics, and for the first time, cationic antimicrobial peptides (CAMPs). Our results show that all classes of antimicrobial drugs induce an inoculum effect, which, as we explain, implies that the dynamic is bistable: For a range of anti-microbial densities, a very small inoculum decays whereas a larger inoculum grows, and the threshold inoculum depends on the drug concentration. We characterized three distinct classes of drug-induced bistable growth dynamics and demonstrate that in rich medium, CAMPs correspond to the simplest class, bacteriostatic antibiotics to the second class, and all other traditional antibiotics to the third, more complex class. These findings provide a unifying universal framework for describing the dynamics of the inoculum effect induced by antimicrobials with inherently different killing mechanisms. Keywords: microbiology; antibiotics; antimicrobial peptides; inoculum effect; mathematical model- ing of infection 1. Introduction Antibiotic resistance is rising to dangerously high levels in all parts of the world. Over-prescription and misusage cause natural selection that favors strains with new resis- tance mechanisms, threatening our ability to treat common infectious diseases effectively. Many factors can affect bacterial susceptibility to antibiotics, including the metabolic state and the presence of persistent cells [1–3], the microenvironment conditions that affect the antibiotic potency [4], the physical structure of the population (biofilms) [5], and the population size, or inoculum, at the site of infection. Indeed, a major power of bacteria is within numbers since it has been well established that as a population, bacteria often survive a concentration of an antimicrobial agent that is lethal to individual cells. In a ther- apeutic context, this means that the fate of an initial infection depends on the initial load of bacteria—while small infections are easily cleared even with no antibiotics, large infections are hazardous, even when antibiotics are administered at high doses. This phenomenon, known as the “inoculum effect” (IE), is well established in-vitro [6–12], as well as in-vivo in animal models and in human patients [11,13–19]. The IE is a bistable effect [9,12]—a system is said to be monostable if it always equili- brates to one final state, and bistable when it admits more than one stable state [20]. In a clinical situation, having bistable behavior is unfavorable since the treatment outcome is difficult to predict even if the dynamics (drug–target interaction) is assumed to be deter- ministic. Treating with insufficient antibiotics doses can lead to ineffective bacterial clearing Antibiotics 2021, 10, 87. https://doi.org/10.3390/antibiotics10010087 https://www.mdpi.com/journal/antibiotics
-
Upload
khangminh22 -
Category
Documents
-
view
0 -
download
0
Transcript of Bistable Bacterial Growth Dynamics in the Presence of ... - MDPI
antibiotics
Article
Bistable Bacterial Growth Dynamics in the Presence ofAntimicrobial Agents
Nelly Frenkel 1,† , Ron Saar Dover 1,† , Eve Titon 2, Yechiel Shai 1,* and Vered Rom-Kedar 2,*
�����������������
Citation: Frenkel, N.; Saar Dover, R.;
Titon, E.; Shai, Y.; Rom-Kedar, V.
Bistable Bacterial Growth Dynamics
in the Presence of Antimicrobial
Agents. Antibiotics 2021, 10, 87.
https://doi.org/10.3390/
antibiotics10010087
Received: 21 December 2020
Accepted: 13 January 2021
Published: 18 January 2021
Publisher’s Note: MDPI stays neutral
with regard to jurisdictional claims in
published maps and institutional affil-
iations.
Copyright: © 2021 by the authors.
Licensee MDPI, Basel, Switzerland.
This article is an open access article
distributed under the terms and
conditions of the Creative Commons
Attribution (CC BY) license (https://
creativecommons.org/licenses/by/
4.0/).
1 Department of Biomolecular Sciences, 206 Nella and Leon Benoziyo Building for Biological Sciences,The Weizmann Institute of Science, Rehovot 76100, Israel; [email protected] (N.F.);[email protected] (R.S.D.)
2 Department of Computer Science and Applied Mathematics, 211 Jacob Ziskind Building,The Weizmann Institute of Science, Rehovot 76100, Israel; [email protected]
* Correspondence: [email protected] (Y.S.); [email protected] (V.R.-K.);Tel.: +972-8-9342711 (Y.S.); +972-8-934-3170 (V.R.-K.); Fax: +972-8-9344112 (Y.S.); +972-8-934-4122 (V.R.-K.)
† Nelly Frenkel and Ron Saar Dover contributed equally to this work.
Abstract: The outcome of an antibiotic treatment on the growth capacity of bacteria is largelydependent on the initial population size (Inoculum Effect). We characterized and built a model ofthis effect in E. coli cultures using a large variety of antimicrobials, including conventional antibiotics,and for the first time, cationic antimicrobial peptides (CAMPs). Our results show that all classesof antimicrobial drugs induce an inoculum effect, which, as we explain, implies that the dynamicis bistable: For a range of anti-microbial densities, a very small inoculum decays whereas a largerinoculum grows, and the threshold inoculum depends on the drug concentration. We characterizedthree distinct classes of drug-induced bistable growth dynamics and demonstrate that in rich medium,CAMPs correspond to the simplest class, bacteriostatic antibiotics to the second class, and all othertraditional antibiotics to the third, more complex class. These findings provide a unifying universalframework for describing the dynamics of the inoculum effect induced by antimicrobials withinherently different killing mechanisms.
Keywords: microbiology; antibiotics; antimicrobial peptides; inoculum effect; mathematical model-ing of infection
1. Introduction
Antibiotic resistance is rising to dangerously high levels in all parts of the world.Over-prescription and misusage cause natural selection that favors strains with new resis-tance mechanisms, threatening our ability to treat common infectious diseases effectively.Many factors can affect bacterial susceptibility to antibiotics, including the metabolic stateand the presence of persistent cells [1–3], the microenvironment conditions that affectthe antibiotic potency [4], the physical structure of the population (biofilms) [5], and thepopulation size, or inoculum, at the site of infection. Indeed, a major power of bacteriais within numbers since it has been well established that as a population, bacteria oftensurvive a concentration of an antimicrobial agent that is lethal to individual cells. In a ther-apeutic context, this means that the fate of an initial infection depends on the initial load ofbacteria—while small infections are easily cleared even with no antibiotics, large infectionsare hazardous, even when antibiotics are administered at high doses. This phenomenon,known as the “inoculum effect” (IE), is well established in-vitro [6–12], as well as in-vivoin animal models and in human patients [11,13–19].
The IE is a bistable effect [9,12]—a system is said to be monostable if it always equili-brates to one final state, and bistable when it admits more than one stable state [20]. In aclinical situation, having bistable behavior is unfavorable since the treatment outcome isdifficult to predict even if the dynamics (drug–target interaction) is assumed to be deter-ministic. Treating with insufficient antibiotics doses can lead to ineffective bacterial clearing
Antibiotics 2021, 10, 87. https://doi.org/10.3390/antibiotics10010087 https://www.mdpi.com/journal/antibiotics

Antibiotics 2021, 10, 87 2 of 19
and patients mortality [21], as well as favors the selection of drug-resistant strains [22,23].It is therefore a common practice to administer antibiotics in excessive dosages, which mayweaken the immune system. An optimal treatment achieves a complete eradication of theinfection with minimal antibiotics dosing, yet, the IE complicates the determination of suchan optimal strategy [12,23–26].
There are several known biological mechanisms that were proposed to account for theIE. First, it is known that the E. coli spontaneous beneficial mutation rate is 10−5 mutationsper genome per generation [27]. Thus, bacterial populations equal to or larger than 105 maycontain genetic heterogeneity to antibiotic resistance [28,29]. Phenotypic heterogeneity [1–3,7] isalso more prominent in these larger initial populations. This heterogeneity can generatebistability: at low numbers we expect that only one, non-resistant population exists,hence treatment leads to extinction, whereas at high initial numbers heterogeneity mayallow a resistant strain to grow, leading to bistability.
Second, density-dependent mechanisms may also lead to an IE. The bacterial densityaffects both the cellular state of the cell, and its interactions with the antimicrobial agent.Cellular communication that is sensitive to population density is called quorum sensing.Quorum sensing enables bacteria to synchronize gene expression and alter their propertiesto become more resistant to different antibiotics. At low cell densities, a large proportion ofthe signaling factors disperse before they can be used, and so their production provides asmall direct or indirect fitness benefit. At high cell densities, a much greater proportionof the signaling factors is available per cell, and consequently bacteria can better copewith the relevant stressor [30]. Another density-dependent mechanism, which does notinvolve cellular signaling, is reduction in the antibiotic concentration. For instance, E. colisecrete the β-lactamase enzyme that cleaves and inactivates β-lactam antibiotics [31].A large population produces more β-lactamase then a small population and can thereforedegrade the antibiotic faster [32–34]. If the population survives and grows, more enzymeis produced and cleaves the antibiotic in a higher rate—a positive feedback mechanism.A similar concept applies when an antibiotic agent binds to its target or to non-specificcell components and its effective concentration is therefore reduced. This might nothave much effect when the antibiotic concentration is sufficiently large compared to thepopulation size, but it is expected to lead to a bistable situation at a critical ratio. Even ifthe antibiotic concentration does not change in time, bistable behavior can arise whengrowth is proportional to the amount of antibiotic molecules available to each bacteriumat the time of exposure [11,35]. The above density dependent mechanisms are inherentlynonlinear since they do not increase gradually, proportionally to the bacterial load andantimicrobial concentration, but rather have either a threshold or limiting effects.
In the bacteria-antimicrobial context, a monostable system corresponds to the casewhere any initial number of bacteria (B) reaches the same maximal population size iftreated with antibiotic concentration (A) that does not kill all cells (“sub-lethal treatment”).A lethal treatment leads to eradication of all loads, and therefore, the fate of the system isindependent of the initial load (Figure 1A). In a bistable situation, the fate of the systemmay depend on its initial load. Here, for a range of the antimicrobial agent concentrations,the bacterial population can assume two possible states (the two solid black lines in Figure 1B),depending on whether the initial bacterial concentration was above or under the thresholdconcentration Bc(A) (dashed black line in Figure 1B). Three main regimes govern thisbistable dependence. First, a minimal antibiotic/peptide concentration Ac is needed to killor inhibit a minute number of bacterial cells, so for A < Ac, even minute bacterial popula-tions grow, similar to untreated cells. Second, an enormous amount of antimicrobial agentinhibits practically any number of cells, so there exists Ae such that for A > Ae all relevantbacterial densities are growth-inhibited or killed. Third, for Ac < A < Ae, the greaterthe concentration of the antimicrobial agent, the larger the bacterial concentration it caninhibit and therefore the threshold concentration Bc(A) is monotonically increasing withA in this range. It follows that for any given antimicrobial agent concentration in therange Ac < A < Ae, the fate of the bacterial population depends on whether its initial

Antibiotics 2021, 10, 87 3 of 19
concentration is above or below Bc(A) (dotted bottom line, Figure 1B). We thus have abistable behaviour for all Ac < A < Ae (Figure 1B).
Antibiotics 2021, 10, x FOR PEER REVIEW 3 of 20
rial concentration it can inhibit and therefore the threshold concentration B A is mono‐
tonically increasing with A in this range. It follows that for any given antimicrobial agent
concentration in the range A A A , the fate of the bacterial population depends on
whether its initial concentration is above or below B A (dotted bottom line, Figure 1B).
We thus have a bistable behaviour for all A A A (Figure 1B).
Figure 1. One dimensional models of monostable and bistable bacterial growth in the presence of antimicrobial agents.
The x‐axis represents the collection of antimicrobial concentrations, the y‐axis shows the bacterial amount. In this plot, the
bacterial dynamics correspond to motion along vertical lines—from any initial inoculum at a given antimicrobial concen‐
tration, the bacterial load increases (moves upward) in the red regions and decreases (moves downward) in the blue re‐
gions. The solid/dashed lines correspond to stable/unstable equilibrium states, respectively. (A) The monostable model
has a single stable equilibrium bacterial concentration for any antimicrobial concentration (a thick full line). (B) The bista‐
ble model has a range of concentrations, the bistable range, where the system has at least two possible stable equilibria
(two full lines). The upper solid line represents the antimicrobial‐concentration dependent maximal capacities. The dashed
line of unstable equilibria represents the collection of critical bacterial loads B A above which the bacteria grow to the
upper equilibrium branch and below which the bacteria become extinct or inhibited. Ac is a minimal antimicrobial agent
concentration that inhibits/kills a minute number of cells. Ae is a concentration that inhibits/kills every tested bacterial
load. The bistable range corresponds to concentrations between Ac and Ae.
The monostable/bistable behaviors appear in nonlinear models depending on a sin‐
gle dynamic variable—the varying bacterial concentration, inhibited by a fixed control
parameter—the antimicrobial agent. The latter determines whether a monostable or bista‐
ble behavior ensues (see Malka et al. [20,36], where neutrophils play the role of the anti‐
microbial agent). Notably, other more complex mechanisms may also result in a bistable
behavior. By Ockham’s razor principle, since the concentration‐dependent bistable mech‐
anism is the simplest adequate model, and such a model involves hardly any assumptions
on the specifics of the antimicrobial‐bacteria interactions, it provides the main underlying
mechanism for in‐vitro bacteria‐antimicrobial dynamics when the antimicrobial action re‐
mains fixed (and possibly for in‐vivo dynamics under specific conditions, e.g., neutro‐
penic conditions in the case of neutrophils‐bacteria interactions [20,36]). The inoculum ef‐
fect [11,34,35] suggests that a similar underlying mechanism may apply to in‐vitro bacte‐
ria‐antibiotics interactions.
Here, we show that every tested antimicrobial agent showed an inoculum effect for
E.coli cells, regardless of the distinct type and mechanism of action of the antimicrobial
agent. In particular, we show, for the first time to the best of our knowledge, that classical
antimicrobial peptides that do not have specific targets on the bacterial membrane induce
an inoculum effect (this was previously observed for some non‐classical antimicrobial
peptides [37]). Moreover, we show that the killing induced by these peptides may be de‐
scribed by an even simpler model than those considered in [11,20,35,36]; Here, the abrupt
kill of the bacteria by the peptides exhibits IE. After this, the surviving bacteria grow with
no influence of the peptides.
Figure 1. One dimensional models of monostable and bistable bacterial growth in the presence of antimicrobial agents.The x-axis represents the collection of antimicrobial concentrations, the y-axis shows the bacterial amount. In this plot,the bacterial dynamics correspond to motion along vertical lines—from any initial inoculum at a given antimicrobialconcentration, the bacterial load increases (moves upward) in the red regions and decreases (moves downward) in the blueregions. The solid/dashed lines correspond to stable/unstable equilibrium states, respectively. (A) The monostable modelhas a single stable equilibrium bacterial concentration for any antimicrobial concentration (a thick full line). (B) The bistablemodel has a range of concentrations, the bistable range, where the system has at least two possible stable equilibria (twofull lines). The upper solid line represents the antimicrobial-concentration dependent maximal capacities. The dashedline of unstable equilibria represents the collection of critical bacterial loads Bc(A) above which the bacteria grow to theupper equilibrium branch and below which the bacteria become extinct or inhibited. Ac is a minimal antimicrobial agentconcentration that inhibits/kills a minute number of cells. Ae is a concentration that inhibits/kills every tested bacterialload. The bistable range corresponds to concentrations between Ac and Ae.
The monostable/bistable behaviors appear in nonlinear models depending on asingle dynamic variable—the varying bacterial concentration, inhibited by a fixed con-trol parameter—the antimicrobial agent. The latter determines whether a monostableor bistable behavior ensues (see Malka et al. [20,36], where neutrophils play the role ofthe antimicrobial agent). Notably, other more complex mechanisms may also result ina bistable behavior. By Ockham’s razor principle, since the concentration-dependentbistable mechanism is the simplest adequate model, and such a model involves hardlyany assumptions on the specifics of the antimicrobial-bacteria interactions, it providesthe main underlying mechanism for in-vitro bacteria-antimicrobial dynamics when theantimicrobial action remains fixed (and possibly for in-vivo dynamics under specific condi-tions, e.g., neutropenic conditions in the case of neutrophils-bacteria interactions [20,36]).The inoculum effect [11,34,35] suggests that a similar underlying mechanism may apply toin-vitro bacteria-antibiotics interactions.
Here, we show that every tested antimicrobial agent showed an inoculum effect forE.coli cells, regardless of the distinct type and mechanism of action of the antimicrobialagent. In particular, we show, for the first time to the best of our knowledge, that classicalantimicrobial peptides that do not have specific targets on the bacterial membrane inducean inoculum effect (this was previously observed for some non-classical antimicrobialpeptides [37]). Moreover, we show that the killing induced by these peptides may bedescribed by an even simpler model than those considered in [11,20,35,36]; Here, the abruptkill of the bacteria by the peptides exhibits IE. After this, the surviving bacteria grow withno influence of the peptides.

Antibiotics 2021, 10, 87 4 of 19
2. Experimental Materials and Methods2.1. Commercial Antibiotics
Ampicillin sodium salt, kanamycin sulphate, chloramphenicol, carbenicillin disodium salt,oxacillin sodium salt, and gentamicin solution were purchased from Sigma-Aldrich(Rehovot, Is-rael). Polymixin B was purchased from Fluka BioChemika (Seelze, Germany). and tetracyclinehydrochloride was purchased from Sigma-Aldrich (Rehovot, Israel).
2.2. Peptide Synthesis and Purification
Peptides were synthesized by using a 433A synthesizer (Applied Biosystems RheniumModiin, Israel) on rink amide 0.65 mmol/mg MBHA (4-Methylbenzhydrylamine) resin, us-ing Fmoc protected amino acids. The synthesized products were washed thoroughly withDMF (Di-Methyl-Formamide) and DCM (Dichloromethane), then dried and cleaved. Cleav-age was performed by addition of 95% trifluoroacetic acid (TFA), 2.5% water, and 2.5% TIS(Titanium(II) Sulphide). The peptides were then purified (>98% homogeneity) by reverse-phase High Performance Liquid Chromatography HPLC (RP-HPLC). Purification wasperformed using a C18 column and a linear gradient (Melittin—20–80%, K6L9—10–90%,MSI-78 (Pexiganin) 10–90%) of acetonitrile in water (final fluid containing 0.1% TFA (v/v))for 40 min.
2.3. Medium
Initially, we tried a BM2 minimal medium [62 mM potassium phosphate buffer, pH 7.0,7 mM ammonium sulfate, 1 mM magnesium sulfate, 10 µM ferrous sulfate, 0.5% (w/v)casamino acids]. We prepared all medium components without glucose, then autoclavedit (sterilize by heating) and then added filtered glucose solution to 0.2% final concentra-tion. Realizing that the minimal medium results in complex behaviour of the control(see discussion of Figure 2 in results), we used the Luria Broth (LB) medium in all the otherexperiments as described next.
Antibiotics 2021, 10, x FOR PEER REVIEW 9 of 20
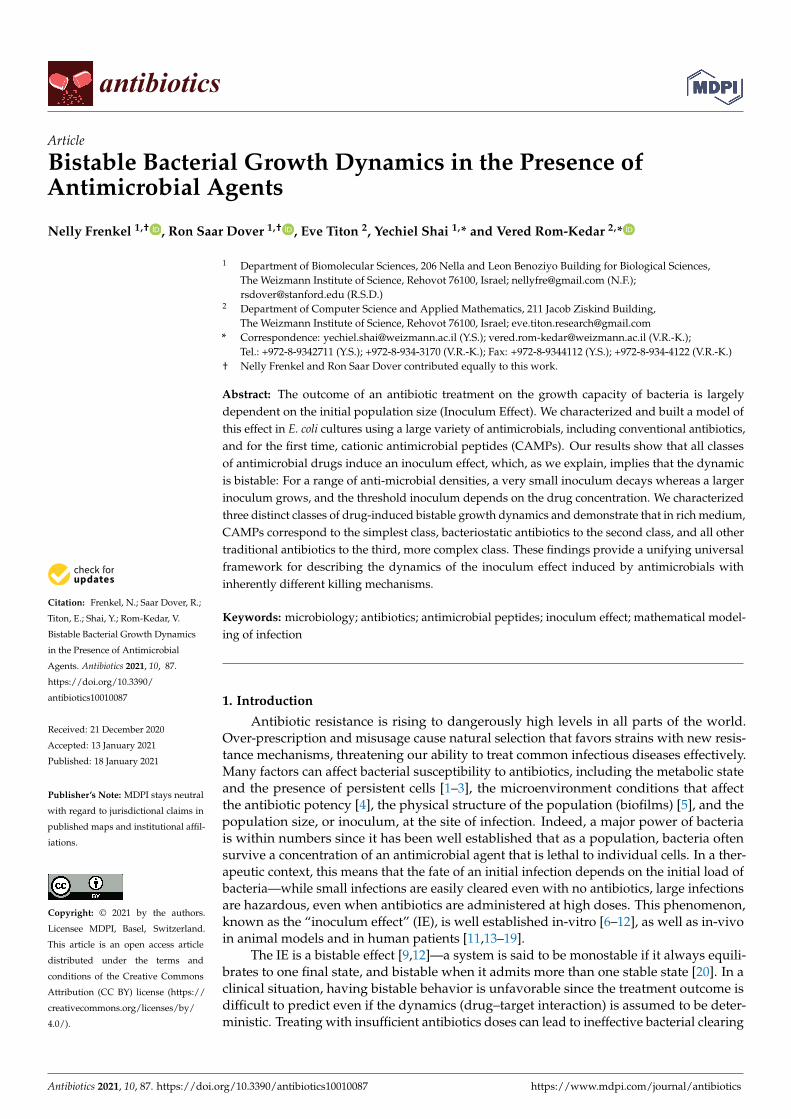
Figure 2. Growth dynamics of untreated bacteria in rich and minimal medium. (A) The growth of 12 initial loads (six
different loads in duplicated) in rich medium (LB) as monitored by a change in optical density (OD) in time. Circles—data
points, solid line—smooth approximation to data used for calculating the growth function, see methods. (B) The growth
curves [experimental dOD/dt versus OD] collapse to a single growth function. (C) In minimal medium, there is high var‐
iability between duplicates and a strong influence of the initial load on the growth rate and the maximal population size.
(D) The different growth curves in minimal medium do not collapse to a single growth function.
4.2. Bacterial Growth with All Tested Cationic Antimicrobial Peptides is Bistable and a BIK
Mathematical Model Adequately Describes this Growth
Cationic antimicrobial peptides (CAMPs) directly kill bacteria by perforating or com‐
pletely disintegrating their membrane [40]. We first tested polymixin B, a cyclic peptide
derived from the bacterium Bacillus polymyxa used in the clinic to fight resistant Gram‐
negative infections. Figure 3A presents the growth curves for increasing values of peptide
concentrations. The panels with A = 0.2, 0.3, 0.6 µM of Figure 3A show that while large
initial bacterial loads overcame these concentrations of polymixin B, small initial loads
could not. This proves that the antimicrobial peptide polymixin B induces a bistable inoc‐
ulum effect.
Whenever there was growth, all loads at any peptide concentration exhibited the
same growth function as the control (see dOD/dt curves in Figure 3B and in Figure S2 for
additional repeats of the experiment). Namely, when there is growth, we again see that
the rate of change of the bacterial concentration (dB/dt) depends only on its current con‐
centration (B(t)) and not on the initial load B(0) or the time of growth. As the CAMP loses
much of its potency within an hour (Figure S2), such a behavior is well described by a BIK
mathematical model (Equation (2)): The initial load and the peptide concentration deter‐
mine if growth occurs (via the kill function), and, if growth occurred, it follows the control
dynamics.
In Figure 3C, we present the dependence of the normalized maximal capacity of loads
that reached their maximum within the experiment for three repeats of the same experi‐
ment. This plot corresponds to an experimental bifurcation diagram—the solid lines of
the bifurcation diagram of Figure 1 are the asymptotic bacterial loads for a given anti‐
microbial concentration. While for the BAD model this maximal load decreases with A
(see Figure 1), for the BIK model it is A‐independent (Figure 3E). The repeats revealed that
Figure 2. Growth dynamics of untreated bacteria in rich and minimal medium. (A) The growth of 12 initial loads(six different loads in duplicated) in rich medium (LB) as monitored by a change in optical density (OD) in time. Circles—data points, solid line—smooth approximation to data used for calculating the growth function, see methods. (B) The growthcurves [experimental dOD/dt versus OD] collapse to a single growth function. (C) In minimal medium, there is highvariability between duplicates and a strong influence of the initial load on the growth rate and the maximal population size.(D) The different growth curves in minimal medium do not collapse to a single growth function.

Antibiotics 2021, 10, 87 5 of 19
2.4. Bacterial Strains
E. coli MG1655 with a Lux-kanamycin resistance plasmid (described previously in [38])was used for generation of all bacterial growth curves except for the curves generated withkanamycin where non-resistant E. coli MG1655 was used. Bacteria were grown in minimalmedium, Luria Broth (LB) medium or LB+kanamycin (30 µg/mL) medium, shaking ina standard aerated 15 mL tube for bacterial growth at a 37 ◦C, 200–250 rpm shaking hotroom for 4 h (OD600 = 1–1.5), and then diluted for the experiments.
2.5. Generation of Growth Curves from Various Initial Inoculums
A sterile 96-well plate with a flat bottom was prepared with serial dilutions of thenecessary antibiotic/peptide in LB medium (total volume in well 100 µL). In short, an initialhigh concentration stock of the antibiotic/peptide in DDW was used to make an initialstock in LB to fill 200 µL into wells in row A. Serial dilutions were then made by amultipipette into the other wells already containing 100 µL of LB (the last row was leftwithout antibiotics/peptide as a positive control). Bacteria from a shaking culture asdescribed above were then measured for their OD600 and normalized in 2 mL LB mediumto an OD600 of 0.01 (order of 106 colony forming units (CFU)/mL as measured from livecounts). Serial dilutions of the bacteria were then made in additional 5 LB tubes (200 µLfrom previous dilution were transferred into 1800 µL of LB every time after vortexing).One hundred microliters of the highest bacterial dilution were inserted into wells A1-B12, 100 µL of the second highest bacterial dilution into wells C1-D12, etc. The smallestinoculum contains about 5 CFU and, in all experiments’ controls, exhibited growth (wasnot empty). The prepared plate was placed in an automatic microplate plate-reader for16 h with medium shaking speed and an OD600 measurement every 20 min.
2.6. Antibacterial Activity
The base minimal inhibitory concentration (bMIC) was determined for each antibi-otic/antimicrobial peptide (AMP) based on the above-described growth curves—bacterialpopulations with an initial inoculum of 106 CFU/mL (2 × 10⁵ CFU per well) that finishedwith an OD600 lower than a cut-off of 0.35 after a 16-h incubation were considered asextinct or inhibited. The lowest antibiotic/peptide concentration for which both duplicateswent extinct is the bMIC. Similarly, density-dependent MICs were generated for lowerinoculums using the same cut-off.
2.7. Preparation of Spent Media with Polymixin B (PMB) and Ampicillin (Amp)
Appropriate concentrations of PMB and Amp were prepared in LB medium forsubsequent dilutions for an MIC assay described above. E. coli MG1655 were grown inshaking LB until an OD600 of about 0.4–0.6 and diluted into some of the prepared PMB andAmp stocks to an OD600 of 0.1. All types of these media and LB alone were then incubatedin shaking in 37 ◦C for 1 h. Incubated media were centrifuged, and the supernatant wasused for a standard MIC assay described above.
2.8. Determination of Antibiotic Potency over Time
E. coli MG1655 were grown in shaking LB overnight (ON) and then centrifuged for5 min in 3000 rpm and diluted to an OD600 of 1. ampicillin, chloramphenicol, carbenicillin,and tetracycline were added to appropriate concentrations for final MIC determinationas indicated in the results to tubes containing either LB or LB and bacteria in an OD600of 1. Some LB tubes with bacteria in the same density were also incubated with restwithout any antibiotics. All tubes were incubated for 24 h in shaking and 37 ◦C. In addition,another inoculum of E. coli MG1655 was grown in shaking LB ON. After 23 h, the wholeprocess was repeated for the 1 h samples with the new ON culture. When 24 h had passed,all samples were filtered through 0.2 µm syringe filters and appropriate amounts of allcorresponding antibiotics were added to the samples that were incubated with bacteriaonly (without antibiotics). Finally, all samples were diluted by a factor of 2 with fresh LB
Antibiotics 2021, 10, 87 6 of 19
for the highest antibiotic concentration and by increasing dilutions for a standard MICassay as described above. In addition, fresh LB with fresh antibiotics was prepared foreach antibiotic for a parallel classic MIC assay as a control by the protocol described above.All MIC assays were performed in 96-well plates over 16h of incubation in shaking (250 rpm)and 37 ◦C. Final results were determined by the sight of turbidity and OD600 measurements.
3. Mathematical Models
Three types of deterministic mathematical models are proposed, all admitting bistablebehavior as described in the introduction section; the new bistable immediate kill andthen A-independent dynamics model (simplest, chart flow 1), the classical A-dependentdynamics model (simple, chart flow 2), and a classical multiple time-dependent factors A-dependent dynamics model (the most complex model presented here, chart flows 2 and 3).Notably, more complex models taking into account detailed molecular processes, stochas-tic effects, and/or several phenotypic populations exhibiting bistable behavior may beintroduced. One of the main results here is that the two simpler models are adequate fordescribing the data for some of the antimicrobial agents.
We denote by B(t) (bacterial cells/mL) the concentration of the bacteria at time t (hours)and by A the initial concentration of the antibiotics/peptide (µM). The growth curves underthe influence of the antibiotics/peptides reflect the overall population growth, which isdecreased/delayed by either killing of substantial portions of the population (peptides orbactericidal antibiotics) or by growth-inhibition (bacteriostatic antibiotics).
3.1. The Bacterial Growth Model
The simplest bacterial limited growth model is of the form:
dBdt
= F(B), t > 0. (1)
Such a deterministic one-dimensional mathematical model is expected to be validfor sufficiently large inoculum, for which stochastic fluctuations leading to extinction arenon-probable and when the environmental conditions are fixed (e.g., the nutrients supplyhardly changes during the experiment). Several analytical forms for F(B), such as logistic,Gompertz, and others are commonly used [9,39]. Here we propose that the growth function,F(B), can be experimentally found by plotting the change in the bacterial inoculum pertime interval dB
dt ∼ B(t+dt)−B(t)dt versus B(t). If, to a good enough approximation, a unique
curve is found when this procedure is repeated for several initial inoculum B(0), thenmodel (1) is adequate for describing the control bacterial dynamics. Otherwise, a morecomplex model is needed. A threshold condition on the deviations of the experimental dB
dtcurve from its mean can be set to distinguish between these behaviors.
Flow Chart 1. The bistable kill model (BIK) dynamics.
Antibiotics 2021, 10, x FOR PEER REVIEW 6 of 20
3.1. The Bacterial Growth Model
The simplest bacterial limited growth model is of the form:
𝑑𝐵𝑑𝑡
F 𝐵 , 𝑡 0. (1)
Such a deterministic one‐dimensional mathematical model is expected to be valid for
sufficiently large inoculum, for which stochastic fluctuations leading to extinction are
non‐probable and when the environmental conditions are fixed (e.g., the nutrients supply
hardly changes during the experiment). Several analytical forms for F 𝐵 , such as logistic,
Gompertz, and others are commonly used [9,39]. Here we propose that the growth func‐
tion, F 𝐵 , can be experimentally found by plotting the change in the bacterial inoculum
per time interval ~ versus 𝐵 𝑡 . If, to a good enough approximation, a
unique curve is found when this procedure is repeated for several initial inoculum 𝐵 0 ,
then model (1) is adequate for describing the control bacterial dynamics. Otherwise, a
more complex model is needed. A threshold condition on the deviations of the experi‐
mental curve from its mean can be set to distinguish between these behaviors.
Flow Chart 1. The bistable kill model (BIK) dynamics.
3.2. The Bistable Immediate Kill Model (BIK)
The model describes a scenario where the bacterial destruction occurs rapidly at
some initial kill phase τ, after which the surviving bacteria, if such exist, grow as if there
are no peptides in the medium, namely, as in the control, see flow chart No 1. The math‐
ematical description of this model includes the control bacterial growth function, F(B), as
above, and a nonlinear kill function, 𝐾 𝐵 0 , 𝐴 , so that 𝐵 τ 𝐾 𝐵 0 , 𝐴 is the bacteria
concentration after the initial kill phase. Here, the bacterial growth is descried by the equa‐
tions:
𝐵 τ K 𝐵 0 , 𝐴 ,𝑑𝐵𝑑𝑡
F 𝐵 , 𝑡 τ. (2)
Such a model predicts that if there is bacterial growth, then, if one plots the change in
the bacterial inoculum per time interval ~ versus 𝐵 𝑡 for any initial inoc‐
ulum and any concentrations of the antimicrobial peptide, a unique bacterial growth func‐
tion, which is identical to the control growth function, F(B), will emerge. Here, the bista‐
bility is due to the nonlinear threshold form of the kill function.
Flow Chart 2. The A‐dependent dynamics model (BAD)
3.2. The Bistable Immediate Kill Model (BIK)
The model describes a scenario where the bacterial destruction occurs rapidly at someinitial kill phase τ, after which the surviving bacteria, if such exist, grow as if there are nopeptides in the medium, namely, as in the control, see flow chart No 1. The mathematical

Antibiotics 2021, 10, 87 7 of 19
description of this model includes the control bacterial growth function, F(B), as above, anda nonlinear kill function, K(B(0), A), so that B(τ) = K(B(0), A) is the bacteria concentrationafter the initial kill phase. Here, the bacterial growth is descried by the equations:
B(τ) = K(B(0), A),dBdt
= F(B), t > τ. (2)
Such a model predicts that if there is bacterial growth, then, if one plots the changein the bacterial inoculum per time interval dB
dt ∼ B(t+dt)−B(t)dt versus B(t) for any initial
inoculum and any concentrations of the antimicrobial peptide, a unique bacterial growthfunction, which is identical to the control growth function, F(B), will emerge. Here, thebistability is due to the nonlinear threshold form of the kill function.
Flow Chart 2. The A-dependent dynamics model (BAD)Antibiotics 2021, 10, x FOR PEER REVIEW 7 of 20
3.3. The A‐Dependent Dynamics Model (BAD)
The model describes a scenario by which the bacterial destruction or growth inhibi‐
tion occurs continuously due to the fixed–in‐time antibiotics action (See flow chart No 2).
The mathematical description of this model is given by a concentration dependent growth
function, 𝐹 𝐵, 𝐴 , controlling the bacterial growth under a given antibiotics concen‐
tration:
𝑑𝐵𝑑𝑡
𝐹 𝐵, 𝐴 , 𝑡 0. (3)
Such a model predicts that if there is bacterial growth, then, if one plots the bacterial
growth function (namely versus 𝐵 𝑡 ) for different initial inoculum and a fixed anti‐
biotics concentration, a unique growth function 𝐹 𝐵, 𝐴 , will emerge (yet different an‐
tibiotics concentrations may result in different curves). Depending on the properties of the
function 𝐹 𝐵, 𝐴 , bistability may emerge (as in Figure 1B, see [20,36]). Then, the MIC
increases with the initial inoculum. In [9], the analytic expressions for the density‐depend‐
ent MIC of six different forms of 𝐹 𝐵, 𝐴 are compared to the experimental density
dependent MICs. Here we find the experimentally derived 𝐹 𝐵, 𝐴 from which the
resulting density dependent MIC s derived.
Flow Chart 3. A bistable multiple factors dynamics model (BMFD) (coupled to flow
chart 2).
3.4. The Bistable Multiple Factors A‐Dependent Dynamics Models (BMFD)
These models describe scenarios by which the bacterial destruction or growth inhi‐
bition depend on additional factors that vary during the experiment, such as antibiotics
and β‐lactamase concentrations. Mathematically, such models require at least a two‐dimen‐
sional deterministic system, see for example [11,35] (it is also plausible that stochastic
terms need to be included, see e.g., [26]). The simplest possible model of this kind is de‐
fined by two functions 𝐹 𝐵, 𝐴 , 𝐺 𝐵, 𝐴 that describe the bacterial growth and
the depletion of the antibiotics’ concentration by natural decay and by the bacterial dy‐
namics—see flow chart No 3:
𝑑𝐵𝑑𝑡
𝐹 𝐵, 𝐴 , 𝑑𝐴𝑑𝑡
𝐺 𝐵, 𝐴 , 𝑡 0 (4)
Such higher‐dimensional models are more complex than the BIK and BAD models.
Indeed, these can be considered as two limiting cases of the two‐dimensional model (4):
Very fast depletion of the antibiotics leads to a BIK model, whereas very slow depletion
and consumption of the antibiotics means that the antibiotic concentration remains essen‐
tially fixed and the BAD model emerges. When the experimental growth function for each
3.3. The A-Dependent Dynamics Model (BAD)
The model describes a scenario by which the bacterial destruction or growth inhibi-tion occurs continuously due to the fixed–in-time antibiotics action (See flow chart No2). The mathematical description of this model is given by a concentration dependentgrowth function, FBAD(B, A) , controlling the bacterial growth under a given antibioticsconcentration:
dBdt
= FBAD(B, A), t > 0. (3)
Such a model predicts that if there is bacterial growth, then, if one plots the bacte-rial growth function (namely dB
dt versus B(t)) for different initial inoculum and a fixedantibiotics concentration, a unique growth function FBAD(B, A), will emerge (yet differentantibiotics concentrations may result in different curves). Depending on the properties ofthe function FBAD(B, A), bistability may emerge (as in Figure 1B, see [20,36]). Then, theMIC increases with the initial inoculum. In [9], the analytic expressions for the density-dependent MIC of six different forms of FBAD(B, A) are compared to the experimentaldensity dependent MICs. Here we find the experimentally derived FBAD(B, A) from whichthe resulting density dependent MIC s derived.
Flow Chart 3. A bistable multiple factors dynamics model (BMFD) (coupled to flowchart 2).
Antibiotics 2021, 10, x FOR PEER REVIEW 7 of 20
3.3. The A‐Dependent Dynamics Model (BAD)
The model describes a scenario by which the bacterial destruction or growth inhibi‐
tion occurs continuously due to the fixed–in‐time antibiotics action (See flow chart No 2).
The mathematical description of this model is given by a concentration dependent growth
function, 𝐹 𝐵, 𝐴 , controlling the bacterial growth under a given antibiotics concen‐
tration:
𝑑𝐵𝑑𝑡
𝐹 𝐵, 𝐴 , 𝑡 0. (3)
Such a model predicts that if there is bacterial growth, then, if one plots the bacterial
growth function (namely versus 𝐵 𝑡 ) for different initial inoculum and a fixed anti‐
biotics concentration, a unique growth function 𝐹 𝐵, 𝐴 , will emerge (yet different an‐
tibiotics concentrations may result in different curves). Depending on the properties of the
function 𝐹 𝐵, 𝐴 , bistability may emerge (as in Figure 1B, see [20,36]). Then, the MIC
increases with the initial inoculum. In [9], the analytic expressions for the density‐depend‐
ent MIC of six different forms of 𝐹 𝐵, 𝐴 are compared to the experimental density
dependent MICs. Here we find the experimentally derived 𝐹 𝐵, 𝐴 from which the
resulting density dependent MIC s derived.
Flow Chart 3. A bistable multiple factors dynamics model (BMFD) (coupled to flow
chart 2).
3.4. The Bistable Multiple Factors A‐Dependent Dynamics Models (BMFD)
These models describe scenarios by which the bacterial destruction or growth inhi‐
bition depend on additional factors that vary during the experiment, such as antibiotics
and β‐lactamase concentrations. Mathematically, such models require at least a two‐dimen‐
sional deterministic system, see for example [11,35] (it is also plausible that stochastic
terms need to be included, see e.g., [26]). The simplest possible model of this kind is de‐
fined by two functions 𝐹 𝐵, 𝐴 , 𝐺 𝐵, 𝐴 that describe the bacterial growth and
the depletion of the antibiotics’ concentration by natural decay and by the bacterial dy‐
namics—see flow chart No 3:
𝑑𝐵𝑑𝑡
𝐹 𝐵, 𝐴 , 𝑑𝐴𝑑𝑡
𝐺 𝐵, 𝐴 , 𝑡 0 (4)
Such higher‐dimensional models are more complex than the BIK and BAD models.
Indeed, these can be considered as two limiting cases of the two‐dimensional model (4):
Very fast depletion of the antibiotics leads to a BIK model, whereas very slow depletion
and consumption of the antibiotics means that the antibiotic concentration remains essen‐
tially fixed and the BAD model emerges. When the experimental growth function for each
3.4. The Bistable Multiple Factors A-Dependent Dynamics Models (BMFD)
These models describe scenarios by which the bacterial destruction or growth inhibi-tion depend on additional factors that vary during the experiment, such as antibiotics and
Antibiotics 2021, 10, 87 8 of 19
β-lactamase concentrations. Mathematically, such models require at least a two-dimensionaldeterministic system, see for example [11,35] (it is also plausible that stochastic terms needto be included, see e.g., [26]). The simplest possible model of this kind is defined by twofunctions FBMFD(B, A), GBMFD(B, A) that describe the bacterial growth and the depletionof the antibiotics’ concentration by natural decay and by the bacterial dynamics—see flowchart No 3:
dBdt
= FBMFD(B, A),dAdt
= GBMFD(B, A), t > 0 (4)
Such higher-dimensional models are more complex than the BIK and BAD models.Indeed, these can be considered as two limiting cases of the two-dimensional model (4):Very fast depletion of the antibiotics leads to a BIK model, whereas very slow depletion andconsumption of the antibiotics means that the antibiotic concentration remains essentiallyfixed and the BAD model emerges. When the experimental growth function for each antibioticconcentration depends on the bacterial initial load, one concludes that the BIK and BAD models areinsufficient to describe the bacterial growth dynamics, so a BMFD model is needed (we do notattempt to fit such models here).
3.5. Experimental Growth Functions
To find the bacterial growth functions experimentally, we process their OD600 countsas follows. First, to avoid noisy oscillations, we cut the signal at the detection level and afterthe first maxima and smooth the signal by a standard MatLab algorithm, see supplement fordetails. Then, we plot OD(t+dt)−OD(t)
dt ∼ dODdt versus OD(t), thus obtaining the OD growth
function. Since the OD is, to a good approximation, linear in the CFU count, for inoculumabove the threshold level of 106 CFU/mL, the growth functions, F(B,A), correspond to alinear scaling and shift of the OD growth function graphs.
4. Results4.1. A One-Dimensional Mathematical Model Is Adequate to Describe the Bacterial Growth inRich Medium but not in Minimal Medium
To investigate how the initial bacterial concentration (i.e., initial load) influencesthe growth outcome at a given antibacterial agent concentration, we first searched forconditions in which the medium content itself is not a limiting factor that can affect thegrowth dynamics. Six initial bacterial loads with a fold-change between them (roughly 10–106 CFU/mL) were prepared from an exponentially growing culture of E. coli and grown ina rich medium (LB) or in a minimal medium (see methods). In the rich medium, all initialloads had the same growth rate during the exponential phase, and reached the samemaximal concentration (optical density, OD)—the full capacity of the well (Figure 2A).When grown in a minimal medium, the different initial loads did not necessarily reach thesame maximal concentration, nor grew with similar rates during the exponential growthphase. In addition, there was a higher variability between replicated samples (Figure 2D).
Plotting the experimental growth functions, dOD/dt versus OD, for the rich andminimal medium experiments, we obtain that for the rich medium all curves convergeapproximately to a single line (Figure 2B), whereas for the minimal medium they do not(Figure 2D). Namely, in rich medium, the rate of change of the bacterial concentration(dB/dt) depends only on its current concentration (B(t)) and not on the initial load B(0)or the time of growth. Mathematically, such a behavior corresponds to classical deter-ministic 1D dynamics, so, this verifies that the bacterial dynamics in rich medium is wellapproximated by the one-dimensional model (1) for at least 16 h.
4.2. Bacterial Growth with All Tested Cationic Antimicrobial Peptides Is Bistable and a BIKMathematical Model Adequately Describes This Growth
Cationic antimicrobial peptides (CAMPs) directly kill bacteria by perforating or com-pletely disintegrating their membrane [40]. We first tested polymixin B, a cyclic peptidederived from the bacterium Bacillus polymyxa used in the clinic to fight resistant Gram-negative infections. Figure 3A presents the growth curves for increasing values of peptide

Antibiotics 2021, 10, 87 9 of 19
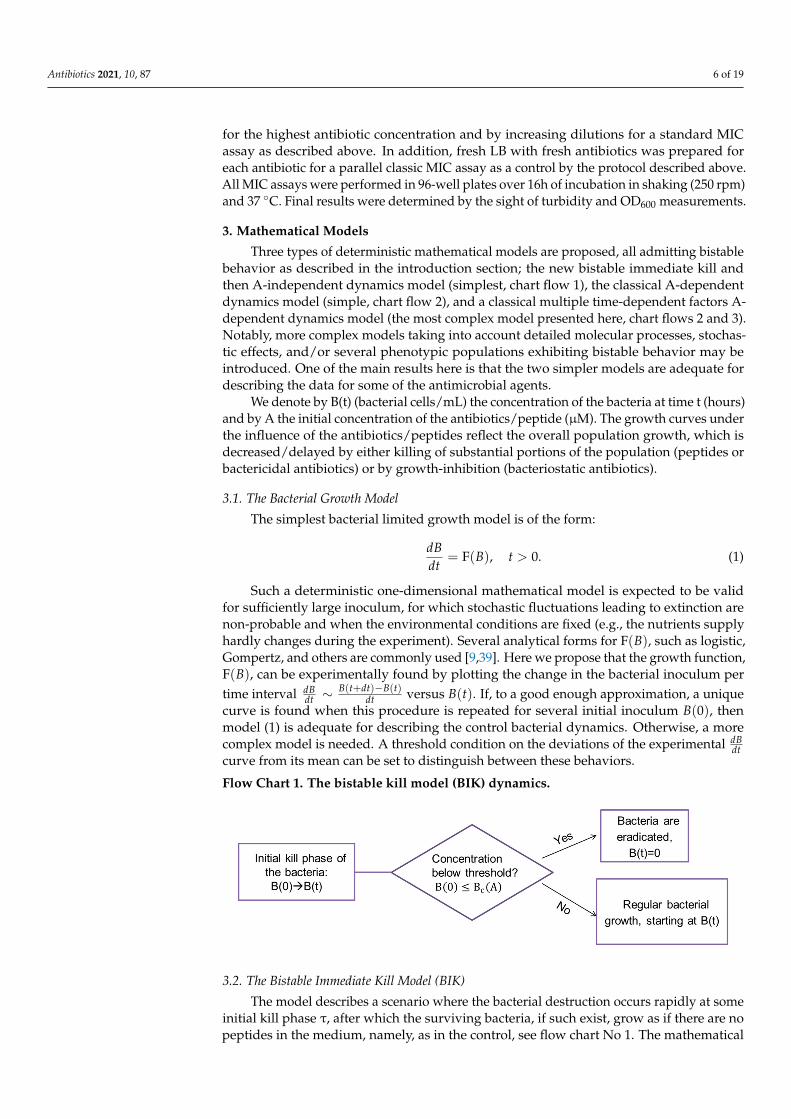
concentrations. The panels with A = 0.2, 0.3, 0.6 µM of Figure 3A show that while largeinitial bacterial loads overcame these concentrations of polymixin B, small initial loadscould not. This proves that the antimicrobial peptide polymixin B induces a bistableinoculum effect.
Antibiotics 2021, 10, x FOR PEER REVIEW 10 of 20
the bistable range of polymixin B for inoculums of 10–106 CFU/mL is at least 3‐fold (0.04A 0.625 µM, see Figure 3C).
Figure 3. Bacterial growth dynamics under antimicrobial peptides treatment. (A) At the bistable range, a given bacterial
load is either extinct or grows to full capacity as shown for polymixin B. (B) The specific growth functions are independent
of both the loads and the peptide concentration. (C) The normalized maximal growth capacity of each growing load is
independent of the polymixin B concentration—three repeats together. (D) Normalized maximal growth capacities for all
loads and peptide concentrations for MSI‐78 (Pexiganin) show similar bistable behavior—4 repeats together. (E) The pep‐
tide–bacteria interaction can be described by a bifurcation diagram in which bistable behavior occurs between Ac and Ae.
See also separate experimental results in Figure S7.
Interestingly, the same dynamics were observed for all three other tested antimicro‐
bial peptides—K6L9, MSI, and melittin (Figure 3D and supplementary Figure S2): The
bacteria are either completely extinct, or are fully grown by the same growth function as
the control, to the maximal capacity of the control well. We thus find that the bistable BIK
mathematical model is adequate for describing the growth dynamics in all four tested
antimicrobial peptides.
4.3. Bacterial Growth with Either Tetracycline or Chloramphenicol Antibiotics is Bistable, and a
BAD Mathematical Model Adequately Describes this Growth
Figure 4A shows the growth curves for different initial loads with increasing concen‐
trations of tetracycline, a bacteriostatic antibiotic that inhibits protein synthesis. Figure 4A
demonstrates that bistable behavior appears for 0.8 𝐴 2 µM; at 𝐴 1 µM initial loads of 10 CFU/mL do not grow whereas all initial loads greater or equal to 102 CFU/mL
grow. At 𝐴 1.5 µM initial loads of 10, 102, 103 CFU/mL do not grow and the ones with
loads 104, 105, 106 CFU/mL do grow, see the respective panels of Figure 4A. Thus, bistabil‐
ity is verified for this range.
Figure 4B shows that for a given A, all loads grow with a similar growth function:
Again, the rate of change of the bacterial concentration (dB/dt) depends only on A and on
its current concentration (B(t)) and not on the initial load B(0) or the time of growth. Math‐
ematically, such a behaviour corresponds to classical deterministic 1D dynamics with a
growth function that depends on A. Thus, the BAD model (2) is an adequate mathematical
model for describing the bacterial dynamics in these experiments. Note that the simpler
Figure 3. Bacterial growth dynamics under antimicrobial peptides treatment. (A) At the bistable range, a given bacterialload is either extinct or grows to full capacity as shown for polymixin B. (B) The specific growth functions are independentof both the loads and the peptide concentration. (C) The normalized maximal growth capacity of each growing load isindependent of the polymixin B concentration—three repeats together. (D) Normalized maximal growth capacities for allloads and peptide concentrations for MSI-78 (Pexiganin) show similar bistable behavior—4 repeats together. (E) The peptide–bacteria interaction can be described by a bifurcation diagram in which bistable behavior occurs between Ac and Ae. See alsoseparate experimental results in Figure S7.
Whenever there was growth, all loads at any peptide concentration exhibited thesame growth function as the control (see dOD/dt curves in Figure 3B and in Figure S2for additional repeats of the experiment). Namely, when there is growth, we again seethat the rate of change of the bacterial concentration (dB/dt) depends only on its currentconcentration (B(t)) and not on the initial load B(0) or the time of growth. As the CAMPloses much of its potency within an hour (Figure S2), such a behavior is well described bya BIK mathematical model (Equation (2)): The initial load and the peptide concentrationdetermine if growth occurs (via the kill function), and, if growth occurred, it follows thecontrol dynamics.
In Figure 3C, we present the dependence of the normalized maximal capacity ofloads that reached their maximum within the experiment for three repeats of the sameexperiment. This plot corresponds to an experimental bifurcation diagram—the solidlines of the bifurcation diagram of Figure 1 are the asymptotic bacterial loads for a givenanti-microbial concentration. While for the BAD model this maximal load decreases withA (see Figure 1), for the BIK model it is A-independent (Figure 3E). The repeats revealedthat the bistable range of polymixin B for inoculums of 10–106 CFU/mL is at least 3-fold(0.04 ≤ A ≤ 0.625 µM, see Figure 3C).
Interestingly, the same dynamics were observed for all three other tested antimicrobialpeptides—K6L9, MSI, and melittin (Figure 3D and supplementary Figure S2): The bacteria

Antibiotics 2021, 10, 87 10 of 19
are either completely extinct, or are fully grown by the same growth function as thecontrol, to the maximal capacity of the control well. We thus find that the bistable BIKmathematical model is adequate for describing the growth dynamics in all four testedantimicrobial peptides.
4.3. Bacterial Growth with Either Tetracycline or Chloramphenicol Antibiotics Is Bistable, and aBAD Mathematical Model Adequately Describes This Growth
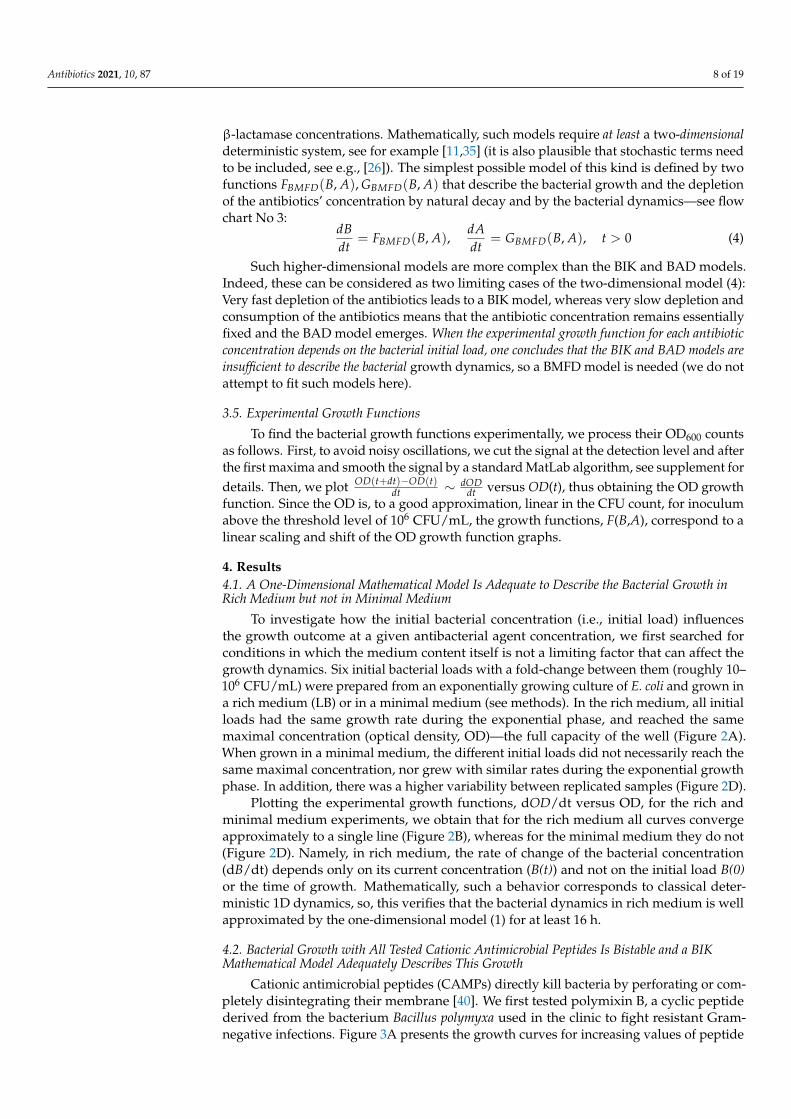
Figure 4A shows the growth curves for different initial loads with increasing concen-trations of tetracycline, a bacteriostatic antibiotic that inhibits protein synthesis. Figure 4Ademonstrates that bistable behavior appears for 0.8 < A < 2 µM; at A = 1 µM initial loadsof 10 CFU/mL do not grow whereas all initial loads greater or equal to 102 CFU/mL grow.At A = 1.5 µM initial loads of 10, 102, 103 CFU/mL do not grow and the ones with loads104, 105, 106 CFU/mL do grow, see the respective panels of Figure 4A. Thus, bistability isverified for this range.
Antibiotics 2021, 10, x FOR PEER REVIEW 11 of 20
BIK model cannot describe this behavior. Surprisingly, the experimentally derived func‐
tion 𝐹 𝐵, 𝐴 is not unimodal for 𝐴 0.3 µM, namely there are two loads at which lo‐
cal maximal growth occurs.
Figure 4C shows how the normalized maximal capacity of loads that reached their
maximum within the experiment depends on the tetracycline concentration. As predicted
by the BAD mathematical model, the maximal capacity depends only on the tetracycline
concentration (and not on the initial inoculum), and, as in Figure 1, the maximal capacity
decreases with the tetracycline concentration (here, by as much as 20%).
Figure 4D shows that the bistability result and the dependence of the normalized
maximal capacity on the tetracycline concentration are robust. Repeating the same exper‐
iment several times (6), bistability is observed when the bistable concentration range is
sampled (Figure S4 show the individual experiments). Moreover, even though the maxi‐
mal capacity of the control changes considerably between experiments (see Figures S4)
the dependence of the normalized maximal capacity on the tetracycline concentration re‐
mains essentially unchanged.
The same type of results is obtained with chloramphenicol (the other bacteriostatic
agent we tested), with bistability emerging at different concentrations, a bit noisier de‐
pendence on the experimental conditions, and with much stronger dependence of the
maximal capacity on the chloramphenicol concentration (Figure S4).
Figure 4. Dynamics of bacterial growth with Tetracycline. (A) The bacterial population is either extinct or growing with
a similar growth curve under a given concentration of tetracycline. At any given antibiotic concentration A (one of the
seven subplots), all loads that grow have similar growth curves, shifted in time (different colors correspond to different
initial loads as indicated, duplicates are shown). For A > 1 μm some of the small loads fail to grow altogether. The maximal
growth capacity declines as the antibiotic concentration A rises. (B) The specific growth function (dOD/dt versus OD) of
the different loads changes as a function of A but remains fairly constant for all loads at a given A. (C) The maximal
capacity of all loads at a given tetracycline concentration A is always similar and declines as A becomes bigger. Normal‐
ized maximal capacities of one representative experiment are presented. (D) The normalized maximal capacity for six
experiments together exhibits bistability and the same decline with the concentration A.
4.4. Bacterial Growth with Either Gentamycin, Kanamycin, Ampicillin, or Carbenicillin
Antibiotics is Bistable. At the Bistable Range the Bacterial Dynamics is Complex and Cannot be
Adequately Described by a BIK nor a BAD Mathematical Model
The aminoglycoside bactericidal antibiotics gentamycin and kanamycin bind to the
30S subunit of the bacterial ribosome and inhibit translation, which eventually causes cell
death. We find that at a fixed kanamycin concentration in the bistable range 3.75 A15 µM, starting with initial loads of 10–106 CFU/mL, the loads that grow do not grow to
the same maximal concentration (Figure 5A), and the specific growth rates of the different
Figure 4. Dynamics of bacterial growth with Tetracycline. (A) The bacterial population is either extinct or growing with asimilar growth curve under a given concentration of tetracycline. At any given antibiotic concentration A (one of the sevensubplots), all loads that grow have similar growth curves, shifted in time (different colors correspond to different initialloads as indicated, duplicates are shown). For A > 1 µm some of the small loads fail to grow altogether. The maximal growthcapacity declines as the antibiotic concentration A rises. (B) The specific growth function (dOD/dt versus OD) of the differentloads changes as a function of A but remains fairly constant for all loads at a given A. (C) The maximal capacity of all loadsat a given tetracycline concentration A is always similar and declines as A becomes bigger. Normalized maximal capacitiesof one representative experiment are presented. (D) The normalized maximal capacity for six experiments together exhibitsbistability and the same decline with the concentration A.
Figure 4B shows that for a given A, all loads grow with a similar growth function:Again, the rate of change of the bacterial concentration (dB/dt) depends only on A andon its current concentration (B(t)) and not on the initial load B(0) or the time of growth.Mathematically, such a behaviour corresponds to classical deterministic 1D dynamics witha growth function that depends on A. Thus, the BAD model (2) is an adequate mathematicalmodel for describing the bacterial dynamics in these experiments. Note that the simplerBIK model cannot describe this behavior. Surprisingly, the experimentally derived functionFBAD(B, A) is not unimodal for A ≥ 0.3 µM, namely there are two loads at which localmaximal growth occurs.
Figure 4C shows how the normalized maximal capacity of loads that reached theirmaximum within the experiment depends on the tetracycline concentration. As predictedby the BAD mathematical model, the maximal capacity depends only on the tetracycline

Antibiotics 2021, 10, 87 11 of 19
concentration (and not on the initial inoculum), and, as in Figure 1, the maximal capacitydecreases with the tetracycline concentration (here, by as much as 20%).
Figure 4D shows that the bistability result and the dependence of the normalizedmaximal capacity on the tetracycline concentration are robust. Repeating the same exper-iment several times (6), bistability is observed when the bistable concentration range issampled (Figure S4 show the individual experiments). Moreover, even though the maximalcapacity of the control changes considerably between experiments (see Figure S4) thedependence of the normalized maximal capacity on the tetracycline concentration remainsessentially unchanged.
The same type of results is obtained with chloramphenicol (the other bacteriostaticagent we tested), with bistability emerging at different concentrations, a bit noisier depen-dence on the experimental conditions, and with much stronger dependence of the maximalcapacity on the chloramphenicol concentration (Figure S4).
4.4. Bacterial Growth with Either Gentamycin, Kanamycin, Ampicillin, or CarbenicillinAntibiotics Is Bistable. At the Bistable Range the Bacterial Dynamics Is Complex and Cannot BeAdequately Described by a BIK nor a BAD Mathematical Model
The aminoglycoside bactericidal antibiotics gentamycin and kanamycin bind to the 30Ssubunit of the bacterial ribosome and inhibit translation, which eventually causes cell death.We find that at a fixed kanamycin concentration in the bistable range 3.75 ≤ A ≤ 15 µM,starting with initial loads of 10–106 CFU/mL, the loads that grow do not grow to the samemaximal concentration (Figure 5A), and the specific growth rates of the different initialloads do not overlap (Figure 5B). Thus, no growth functions can adequately describe thedynamics by a BAD or a BIK mathematical model. Thus, at the bistable range, the nor-malized maximal capacities are different for different loads (Figure 5C). Describing thedynamics requires a more complex model (a BFMD). Figure 5D and the growth curves in S5show that gentamycin exhibits similar bistable yet complex dynamics for 1.5 ≤ A ≤ 4 µM.
Antibiotics 2021, 10, x FOR PEER REVIEW 12 of 20
initial loads do not overlap (Figure 5B). Thus, no growth functions can adequately de‐
scribe the dynamics by a BAD or a BIK mathematical model. Thus, at the bistable range,
the normalized maximal capacities are different for different loads (Figure 5C). Describing
the dynamics requires a more complex model (a BFMD). Figure 5D and the growth curves
in S5 show that gentamycin exhibits similar bistable yet complex dynamics for 1.5 A4 µM.
Figure 5E,F and the growth curves in S5 show the bistable complex dynamics ob‐
tained with the two β‐lactam antibiotics ampicillin and carbenicillin. These antibiotics pre‐
vent synthesis of new cell‐wall peptidoglycan and consequently cause cell‐lysis—bacteri‐
olytic. With ampicillin, the bistable range for initial loads of 10–106 CFU/mL is 8 A12 µM (Figure 5D) whereas for carbenicillin a bistable range of 8 A 16 µM is ob‐served (Figure 5E). These findings prove that both BAD and BIK mathematical models
cannot describe the bacterial dynamics with ampicillin or carbenicillin.
Figure 5. Bacteria grown with β‐lactam or aminoglycoside antibiotics exhibit complex bistable dynamics. (A) The
growth of different initial loads for a fixed initial concentration of kanamycin has different forms and thus their growth
curves do not collapse to a single growth function (B). Collective results of normalized maximal capacity are shown for
(C) six repeats with kanamycin. (D) Four repeats with gentamycin. (E) Four repeats with ampicillin. (F) Four repeats with
carbenicillin. The maximal capacities are load and dose dependent. See also separate experimental results in Figure S5.
4.5. The Existence of a Bistable Range for Inoculums 10–106 CFU/mL Indicates that the MIC for
Inoculums Larger than 106 CFU/mL is Higher than the Standard bMIC
The experiments described in Figures 3 and 4 identify the bistable concentration
ranges for initial inoculums of 10–106 CFU/mL, namely, at or below the standard inocu‐
lums used for determining the bMIC. Theoretically, the observed trend of inoculum‐in‐
creasing MIC at low inoculums should continue to larger inoculums—it stops only when
the MIC reaches the concentration Ae of Figure 3E and 1 respectively in the BIK and the
BAD models, and, similarly, when A is increased past the bistable range of a more com‐
plex BFMD model. Indeed, Figure 6A shows that a concentration of 200 µM ampicillin
does not overcome an initial inoculum of 108 CFU/mL whereas doubling this concentra‐
tion to 400 µM does. It follows that the MIC for 108 CFU/mL is in the 200–400 µM range,
Figure 5. Bacteria grown with β-lactam or aminoglycoside antibiotics exhibit complex bistable dynamics. (A) Thegrowth of different initial loads for a fixed initial concentration of kanamycin has different forms and thus their growthcurves do not collapse to a single growth function (B). Collective results of normalized maximal capacity are shown for (C)six repeats with kanamycin. (D) Four repeats with gentamycin. (E) Four repeats with ampicillin. (F) Four repeats withcarbenicillin. The maximal capacities are load and dose dependent. See also separate experimental results in Figure S5.

Antibiotics 2021, 10, 87 12 of 19
Figure 5E,F and the growth curves in S5 show the bistable complex dynamics obtainedwith the two β-lactam antibiotics ampicillin and carbenicillin. These antibiotics preventsynthesis of new cell-wall peptidoglycan and consequently cause cell-lysis—bacteriolytic.With ampicillin, the bistable range for initial loads of 10–106 CFU/mL is 8 ≤ A ≤ 12 µM(Figure 5D) whereas for carbenicillin a bistable range of 8 ≤ A ≤ 16 µM is observed(Figure 5E). These findings prove that both BAD and BIK mathematical models cannotdescribe the bacterial dynamics with ampicillin or carbenicillin.
4.5. The Existence of a Bistable Range for Inoculums 10–106 CFU/mL Indicates That the MIC forInoculums Larger than 106 CFU/mL Is Higher than the Standard bMIC
The experiments described in Figures 3 and 4 identify the bistable concentration rangesfor initial inoculums of 10–106 CFU/mL, namely, at or below the standard inoculums usedfor determining the bMIC. Theoretically, the observed trend of inoculum-increasing MIC atlow inoculums should continue to larger inoculums—it stops only when the MIC reachesthe concentration Ae of Figure 3E and 1 respectively in the BIK and the BAD models, and,similarly, when A is increased past the bistable range of a more complex BFMD model.Indeed, Figure 6A shows that a concentration of 200 µM ampicillin does not overcome aninitial inoculum of 108 CFU/mL whereas doubling this concentration to 400 µM does. Itfollows that the MIC for 108 CFU/mL is in the 200–400 µM range, namely, Ae, the highestconcentration at which bistability occurs with ampicillin, is beyond 200 µM (order ofmagnitude higher than the bMIC 12–14 µM, see Table 1 and [12].
00.20.40.60.8
11.21.41.6
00:00 04:48 09:36 14:24
O.D
60
0
Time (hr)
400 uM Amp
00.20.40.60.8
11.21.41.6
00:00 04:48 09:36 14:24
O.D
60
0
Time (hr)
200 uM Amp
0
0.5
1
1.5
00:00 04:48 09:36 14:24
O.D
60
0
Time (hr)
100 uM Amp
0
0.5
1
1.5
00:00 04:48 09:36 14:24
O.D
60
0
Time (hr)
50 uM Amp
00.20.40.60.8
11.21.41.6
00:00 04:48 09:36 14:24
O.D
60
0
Time (hr)
No Antibiotic
A
0
Antibiotics/Peptide concentration
Bac
teri
al c
on
cen
trat
ion
Standard MIC
106 CFU
MIC for small
infections
104 CFU
Desired Universal
MIC
Initial bacterial loads not
covered by the standard MIC
B
Figure 6. Growth of Inoculums higher than the standard with Ampicillin. (A) Growth curves of different initial inocu-lums for 14 h in high concentrations of Ampicillin. (B) The standard MIC and its relation to MICs of other inoculums forbistable growth dynamics.

Antibiotics 2021, 10, 87 13 of 19
Table 1. Antibacterial agent properties and tested bMIC ranges concentrations.
Agent Type Mechanism Target MIC (µM)
Chloramphenicol Chloramphenicol Bacteriostatic Ribosomal 50S 5–20Tetracycline Polyketide Bacteriostatic Ribosomal 30S 2–4.5Gentamycin Aminoglycoside Bactericidal Ribosomal 30S 4–8Kanamycin Aminoglycoside Bactericidal Ribosomal 30S 10–20Ampicillin a β-lactam Bacteriolytic Cell-wall PBP 12–14
Carbenicillin a β-lactam Bacteriolytic Cell-wall PBP 21–43Oxacillin β-lactam b Bacteriolytic Cell-wall PBP 1800
Polymixin B CAMP Bactericidal Membrane 0.3–1.25Melittin CAMP Bactericidal Membrane 20
MSI CAMP Bactericidal Membrane 17K6L9 CAMP Bactericidal Membrane 10–20
a E. coli K12 MG1655 is a β-lactamase producer that can cleave β-lactam antibiotics. PBP is a penicillin-binding-protein. b Oxacillin is a β-lactamase resistant β-lactam.
4.6. The Cause for the Complex Dynamics Is not Necessarily the Antibiotics Stability
The BMFD dynamics is associated with factors that change during the experimentand influence the bacterial growth. The rich medium we use guarantees that nutrients arenot the limiting factor (Figure 2). Naturally, the next factor to test is the antibiotics stabilityduring the course of the experiment (Figure 7A). We find that after 24 h, ampicillin potencydecreases (MIC doubles) due to exposure to high bacterial loads whereas carbenicillinpotency increases due to its exposure to the medium (Figure 7A right panel). Chloram-phenicol, which has simple BAD dynamics is stable for at least 24 h, whereas tetracycline,which also has simple BAD dynamics is less effective after 24 h, independently of bacterialpresence. MIC experiments with oxacillin, which is a beta-lactam antibiotic resistant tobeta-lactamase degradation, demonstrate that even stable antibiotics can produce BMFDbistable dynamics (Figure 7B–E).
Antibiotics 2021, 10, x FOR PEER REVIEW 14 of 20
during the course of the experiment (Figure 7A). We find that after 24 h, ampicillin po‐
tency decreases (MIC doubles) due to exposure to high bacterial loads whereas carbeni‐
cillin potency increases due to its exposure to the medium (Figure 7A right panel). Chlo‐
ramphenicol, which has simple BAD dynamics is stable for at least 24 h, whereas tetracy‐
cline, which also has simple BAD dynamics is less effective after 24 h, independently of
bacterial presence. MIC experiments with oxacillin, which is a beta‐lactam antibiotic re‐
sistant to beta‐lactamase degradation, demonstrate that even stable antibiotics can pro‐
duce BMFD bistable dynamics (Figure 7B–E).
Figure 7. Antibiotic stability. (A) Minimal inhibitory concentration of the antibiotic relative to the MIC as a function of
several media conditions (incubation with or without antibiotics and bacteria as indicated). (B) Different loads of bacteria
grown with oxacillin have a similar growth slope in the exponential growth phase at almost all A’s (except for loads that
fail to grow altogether). (C) The specific growth function of the different loads in oxacillin changes with the loads and with
A, with no obvious trend with respect to A. In particular, the peak of the function remains essentially constant at different
oxacillin concentrations. (D) The maximal capacity at all oxacillin concentrations is always similar, and does not decline
as A becomes bigger, although different loads reach different maximal capacities in each antibiotic concentration. (E) The
maximal capacities of different loads grown in oxacillin from 6 different experiments. See also separate experimental re‐
sults in Figure S6.
4.7. Bistability Occurs with Diverse Biochemical Mechanisms of Action
Table 1 summarizes the mechanism of action and the type of the antimicrobial agent
we tested. Bistability is detected for all these distinct types of agents.
5. Discussion
In all agents we tested, including all cationic antimicrobial peptides and all conven‐
tional antibiotics, independently of their biochemical mechanism of action (Table 1), we
found the inoculum effect. At a certain range of concentrations, which is specific for every
drug and experimental setting, the system exhibits a bistable behavior in which large
loads survive and small loads are inhibited. We identified three distinct types of bistable
dynamics, as summarized in flow chart 4, and developed an experimental framework that
enables to determine which type of dynamics is realized for a given antimicrobial agent.
In particular, for certain cases (all the cationic antimicrobial peptides and all the commer‐
Figure 7. Antibiotic stability. (A) Minimal inhibitory concentration of the antibiotic relative to the MIC as a function ofseveral media conditions (incubation with or without antibiotics and bacteria as indicated). (B) Different loads of bacteriagrown with oxacillin have a similar growth slope in the exponential growth phase at almost all A’s (except for loads thatfail to grow altogether). (C) The specific growth function of the different loads in oxacillin changes with the loads andwith A, with no obvious trend with respect to A. In particular, the peak of the function remains essentially constant atdifferent oxacillin concentrations. (D) The maximal capacity at all oxacillin concentrations is always similar, and does notdecline as A becomes bigger, although different loads reach different maximal capacities in each antibiotic concentration.(E) The maximal capacities of different loads grown in oxacillin from 6 different experiments. See also separate experimentalresults in Figure S6.
Antibiotics 2021, 10, 87 14 of 19
4.7. Bistability Occurs with Diverse Biochemical Mechanisms of Action
Table 1 summarizes the mechanism of action and the type of the antimicrobial agentwe tested. Bistability is detected for all these distinct types of agents.
5. Discussion
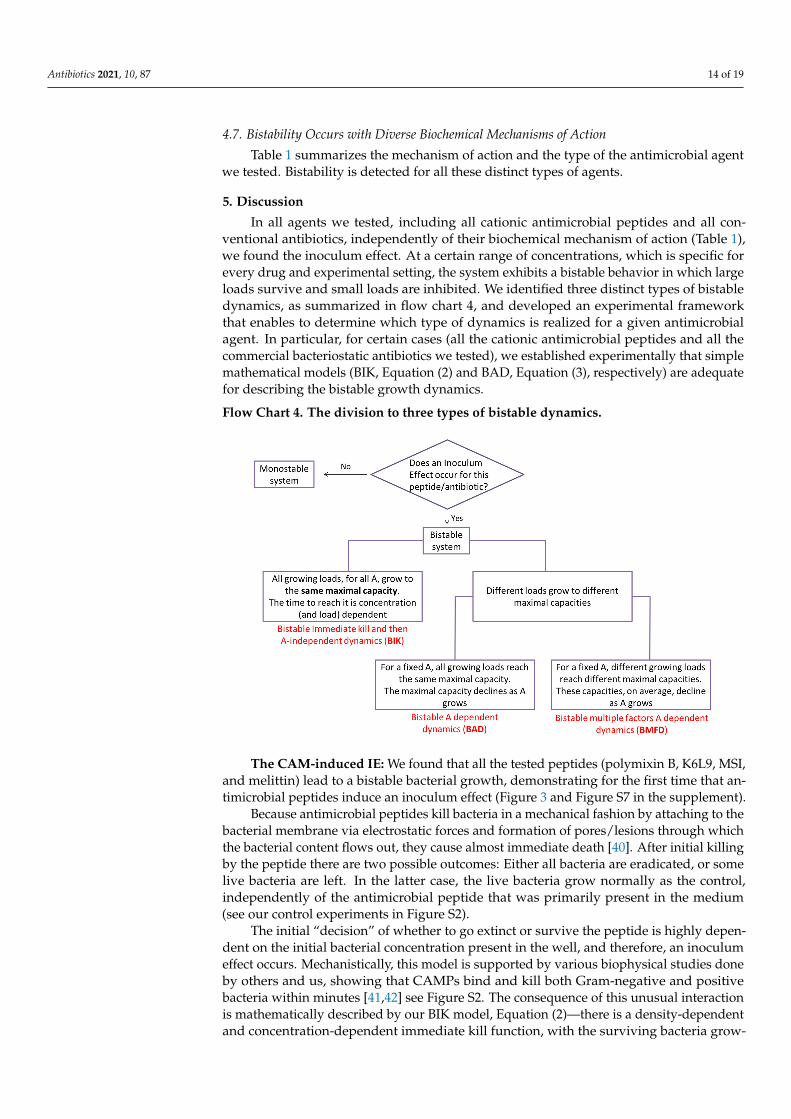
In all agents we tested, including all cationic antimicrobial peptides and all con-ventional antibiotics, independently of their biochemical mechanism of action (Table 1),we found the inoculum effect. At a certain range of concentrations, which is specific forevery drug and experimental setting, the system exhibits a bistable behavior in which largeloads survive and small loads are inhibited. We identified three distinct types of bistabledynamics, as summarized in flow chart 4, and developed an experimental frameworkthat enables to determine which type of dynamics is realized for a given antimicrobialagent. In particular, for certain cases (all the cationic antimicrobial peptides and all thecommercial bacteriostatic antibiotics we tested), we established experimentally that simplemathematical models (BIK, Equation (2) and BAD, Equation (3), respectively) are adequatefor describing the bistable growth dynamics.
Flow Chart 4. The division to three types of bistable dynamics.
Antibiotics 2021, 10, x FOR PEER REVIEW 15 of 20
cial bacteriostatic antibiotics we tested), we established experimentally that simple math‐
ematical models (BIK, Equation (2) and BAD, Equation (3), respectively) are adequate for
describing the bistable growth dynamics.
Flow Chart 4. The division to three types of bistable dynamics.
The CAM‐induced IE: We found that all the tested peptides (polymixin B, K6L9,
MSI, and melittin) lead to a bistable bacterial growth, demonstrating for the first time that
antimicrobial peptides induce an inoculum effect (Figure 3 and Figures S7 in the supple‐
ment).
Because antimicrobial peptides kill bacteria in a mechanical fashion by attaching to
the bacterial membrane via electrostatic forces and formation of pores/lesions through
which the bacterial content flows out, they cause almost immediate death [40]. After initial
killing by the peptide there are two possible outcomes: Either all bacteria are eradicated,
or some live bacteria are left. In the latter case, the live bacteria grow normally as the
control, independently of the antimicrobial peptide that was primarily present in the me‐
dium (see our control experiments in Figure S2).
The initial “decision” of whether to go extinct or survive the peptide is highly de‐
pendent on the initial bacterial concentration present in the well, and therefore, an inocu‐
lum effect occurs. Mechanistically, this model is supported by various biophysical studies
done by others and us, showing that CAMPs bind and kill both Gram‐negative and posi‐
tive bacteria within minutes [41,42] see Figure S2. The consequence of this unusual inter‐
action is mathematically described by our BIK model, Equation (2)—there is a density‐
dependent and concentration‐dependent immediate kill function, with the surviving bac‐
teria growing exactly as the control, obeying a deterministic one‐dimensional ordinary
differential equation with a growth function that is found experimentally (Figure 3B).
It was recently established that when cell‐penetrating peptides are employed in con‐
junction with AMPs, the MIC is reduced [43–45]. We do expect, as we established with all
The CAM-induced IE: We found that all the tested peptides (polymixin B, K6L9, MSI,and melittin) lead to a bistable bacterial growth, demonstrating for the first time that an-timicrobial peptides induce an inoculum effect (Figure 3 and Figure S7 in the supplement).
Because antimicrobial peptides kill bacteria in a mechanical fashion by attaching to thebacterial membrane via electrostatic forces and formation of pores/lesions through whichthe bacterial content flows out, they cause almost immediate death [40]. After initial killingby the peptide there are two possible outcomes: Either all bacteria are eradicated, or somelive bacteria are left. In the latter case, the live bacteria grow normally as the control,independently of the antimicrobial peptide that was primarily present in the medium(see our control experiments in Figure S2).
The initial “decision” of whether to go extinct or survive the peptide is highly depen-dent on the initial bacterial concentration present in the well, and therefore, an inoculumeffect occurs. Mechanistically, this model is supported by various biophysical studies doneby others and us, showing that CAMPs bind and kill both Gram-negative and positivebacteria within minutes [41,42] see Figure S2. The consequence of this unusual interactionis mathematically described by our BIK model, Equation (2)—there is a density-dependentand concentration-dependent immediate kill function, with the surviving bacteria grow-

Antibiotics 2021, 10, 87 15 of 19
ing exactly as the control, obeying a deterministic one-dimensional ordinary differentialequation with a growth function that is found experimentally (Figure 3B).
It was recently established that when cell-penetrating peptides are employed inconjunction with AMPs, the MIC is reduced [43–45]. We do expect, as we establishedwith all other non-linear antimicrobial mechanisms of action, that IE will be identifiedalso when such combinations are employed. Whether or not the surviving bacteria willgrow as the control does (namely exhibiting BIK dynamics), or, perhaps, slower due to thecell-penetrating peptides (BAD or BMFD dynamics), is an open question for future studies.
The complexity of IE induced by antibiotics: We provide an experimental method-ology to examine when the growth dynamics is adequately described by a simple one-dimensional model or when higher-dimensional models must be employed.
For the two tested commercial bacteriostatic antibiotics that target the ribosome (tetra-cycline and chloramphenicol), for a fixed antibiotics concentration, all duplicates, and alldifferent initial loads that grow collapse to one growth function (Figure 4 and Figure S4).We conclude that in these cases, when growth occurs, stochastic effects, antibiotics stability,and other limiting factors are insignificant. Thus, the deterministic one-dimensional ordi-nary differential equation BAD model (Equation (3)) adequately describes the dynamics,with growth functions depending on the initial antibiotics’ concentration [A0]. We foundthese functions from the experimental data and observed that they might have multiplemaxima for large [A0] (Figure 4 and Figure S4). This can be indicative of a change in thecollective behavior of bacteria in stress at higher densities and needs to be further studied.These experimentally derived functions may be utilized in future mathematical models ofbacterial growth dynamics such as was done in [11,12,18,35].
Bacterial growth with beta-lactam antibiotics, which specifically target the cell wall, orwith aminoglycosides that inhibit the ribosome, cannot be described by a single time inde-pendent ordinary differential equation: dB/dt is not a function of B(t). Indeed, we observethat different loads grow differently and even duplicates have different growth curves anddifferent maximal capacity (Figure 5 and Figure S5). In some of these cases, the dynamicsappears to shift from 1d dynamics in the lower antibiotic concentrations towards at least2d dynamics for high concentrations (Figure 5C–F shows that the maximal growth capacityof different loads collapses to one curve for low A but not for large A). Interestingly, thetransition seems to occur in concert with the appearance of the bistability.
To describe this behavior, one needs to construct the more complex BMFD mathemati-cal models that include additional variables and time-dependent factors. Equations (2) and(3) provide the simplest type of such models (see [11,18] for a variety of such models).
The role of experimental conditions: While growth in rich medium is well describedby the traditional limited growth mathematical model (1), minimal medium leads tocomplex behavior even without the introduction of anti-microbial agents. To eliminate thisvariability in our experiments, we conducted all experiments with antimicrobials in the richmedium setup and found a bistable range in all of these experiments. Mathematical modelsshow that if one decreases the growth rate at the exponential phase of a one-dimensionalBAD model, bistability is suppressed and monostability arises [20,36]. An experimental setup that realizes such conditions (e.g., by a chemostat) and its implications on best strategiesfor treatment protocols are left for future studies.
The IE and MIC: We concentrated on establishing the IE for low inoculums, belowthe standard loads for bMIC. Importantly, an increase in the density dependent MIC withthe initial inoculum (as in Figure 1B) implies bistability whereas a decrease in the densitydependent MIC with the inoculum (as in Figure 1A) is associated with monostability.The mathematical theory shows that bistability typically implies that the standard bMICis insufficient for fighting inoculums that are larger than the standard inoculum of 106
CFU/mL. Figure 6 demonstrates that this is indeed the case, corroborating similar findingsin [11,12,18].
Mechanistic explanation of IE: While IE was identified in previous studies of partic-ular conventional antibiotic agents and bacteria [10–14,18], previous explanations of its
Antibiotics 2021, 10, 87 16 of 19
appearance included genetic and/or phenotypic population heterogeneity and additionalfactors that vary during the experiments. These were modelled, for example, by determinis-tic multi-dimensional equations of classical reaction kinetics [11,18] or by two-dimensionalPK (Pharmakokinetics)/PD (Pharmakodynamics) dynamics [12]. Here we show that forsome cases (the bacteriostatic antibiotics) the one-dimensional BAD model can explainthe resulting growth curves by density-dependent mechanisms alone. By Ockham’s ra-zor principle, we assert that the BAD models are adequate for these cases: The morecomplex reasoning can be neglected for explaining bacterial growth in rich media underbacteriostatic antibiotics.
On the other hand, we demonstrated that in other cases (bistable bacterial growthwith bactericidal and bacteriolytic antibiotics), higher dimensional models are required.These could possibly be described by either density-dependent mechanisms (such as theproduction of β-lactamase or, for other bacteria, by extracellular PH variations [12]) ormodels involving population heterogeneity, see [11,12,18] and references therein. Forexample, it is well established that E. coli MG1655 produces β-lactamase, an enzyme thathydrolyses β-lactam antibiotics such as ampicillin and carbenicillin [11,38]. If the antibioticis being inactivated by the bacteria, higher initial loads produce larger concentrations ofthe enzyme over the course of time, and therefore, the antibiotic concentration will declinefaster. Our experimental results with oxacillin demonstrate that even when the β-lactamis not degraded by the bacteria and the drug concentration remains constant over time,IE appears, and the growth dynamic may be still multi-dimensional. Interestingly, theseresults also exhibit high sensitivity to the experimental settings. This sensitivity could bepossibly attributed to the stress induced by the very high antibiotic concentrations (E. coliare often naturally resistant to oxacillin [46]), possibly introducing an additional time andantibiotic concentration-dependent factor to the system. Additional experimental workin which these factors are monitored is needed for clarifying the dominant mechanismsinvolved in the more complex settings. While the identification of mechanisms that controlthe IE may be pivotal for developing more efficient antimicrobial drugs, we assert thatsuch an identification is inessential and is not always helpful in predicting the bacterialgrowth dynamics.
Hypothetical therapeutic implications: From a therapeutic point of view, under-standing the particular bacterial growth dynamic in the presence of different classes ofantimicrobials and starting from various bacterial inoculums is central for the assignmentof the correct treatment for various bacterial infections (see [11,12,18]). When early diagno-sis and treatment are impossible, the ability to predict bacterial growth dynamics in thepresence of a selected treatment becomes indispensable. In such cases, the estimation of bac-terial load present in the infection site, and the knowledge of the type of growth dynamicof the infecting bacterium with different antimicrobials, would allow for a personalizedtreatment in terms of dosage and frequency of treatment [11,12,18,35,47].
Models of in-vivo dynamics usually require a BMFD model since the antibiotics clearsfrom the body and the nutrients supply varies. Once an in-vitro BAD model is established,the form of the function FBMFD(B, A) can be identified with the experimentally derivedFBAD(B, A). The study of in-vivo bacterial infections requires additional considerations,such as the presence of the immune system, the clearing of the drugs, as well as envi-ronmental conditions that are not only subjected to changes by the bacteria but also bythe host (e.g., the host may control limiting factors for the bacterial growth, and suchfactors invoke higher dimensional dynamics, see Figure 2C,D). Nevertheless, studies haveshown [17,48] that quite often, in-vitro results regarding interaction dynamics betweenbacteria and antimicrobials are indicative of such dynamics in-vivo and may be used asbuilding blocks for the in-vivo models [36].
Outlook: Our current efforts are concentrated on simulating the results based on thefitting of our experimental data and studying their implications. To achieve a successfulclinical treatment, basic growth dynamics rules such as those presented herein should beadapted to include additional parameters such as nutrient limiting factors, drug clearance,

Antibiotics 2021, 10, 87 17 of 19
the action of the immune system, and the level of drug resistance of the specific bacterialspecies present at the infection site. Inclusion of these additional factors into the bistabilityof the basic bacteria-antimicrobial agents’ system can shed light on the relation betweenin-vitro and in-vivo growth dynamics.
Supplementary Materials: The following are available online at https://www.mdpi.com/2079-6382/10/1/87/s1, Figure S1: Robustness to smoothing, Figure S2: PMB potency after incubationwith bacteria, Figure S3: Amp potency after incubation with bacteria, Figure S4: Dynamics ofbacterial growth with Chloramphenicol and Tetracycline, Figure S5: Bacteria grown with β-lactamor aminoglycoside antibiotics exhibit BMFD, Figure S6: Bacterial growth dynamics with Oxacillinexhibit BMFD which is antibiotic concentration independent, Figure S7: Bacterial growth dynamicsunder antimicrobial peptides treatment.
Author Contributions: Conceptualization, R.S.D., Y.S. and V.R.-K.; Formal analysis, N.F. and V.R.-K.;Funding acquisition, Y.S. and V.R.-K.; Investigation, N.F. and R.S.D.; Methodology, N.F., R.S.D., E.T.and V.R.-K.; Software, E.T. and V.R.-K.; Writing—original draft, N.F.; Writing—review & editing,R.S.D., Y.S. and V.R.-K. All authors have read and agreed to the published version of the manuscript.
Funding: The SELA-YEDA Centre at the Weizmann Institute of Science and the ISRAEL SCIENCEFOUNDATION (YS grant No. 1944/20 and VRK grant No. 1208/16).
Data Availability Statement: Figures in supplementary material present available data. Data isavailable and can be accessed directly from the authors.
Acknowledgments: We thank Roy Malka for discussions and comments.
Conflicts of Interest: The authors declare no conflict of interest.
References1. Balaban, N.Q.; Merrin, J.; Chait, R.; Kowalik, L.; Leibler, S. Bacterial Persistence as a Phenotypic Switch. Science 2004, 305, 1622–
1625. [CrossRef]2. Kussell, E.; Leibler, S. Phenotypic diversity, population growth, and information in fluctuating environments. Science 2005,
309, 2075–2078. [CrossRef]3. Wang, X.; Kang, Y.; Luo, C.; Zhao, T.; Liu, L.; Jiang, X.; Fu, R.; An, S.; Chen, J.; Jiang, N.; et al. Heteroresistance at the Single-Cell
Level: Adapting to Antibiotic Stress through a Population-Based Strategy and Growth-Controlled Interphenotypic Coordination.mBio 2014, 5, e00942-13. [CrossRef]
4. Stewart, P.S.; Costerton, J.W. Antibiotic resistance of bacteria in biofilms. Lancet 2001, 358, 135–138. [CrossRef]5. Prakash, B.; Veeregowda, B.M.; Krishnappa, G. Biofilms: A survival strategy of bacteria. Curr. Sci. 2003, 85, 1299–1307.6. Smith, K.P.; Kirby, J.E. The Inoculum Effect in the Era of Multidrug Resistance: Minor Differences in Inoculum Have Dramatic
Effect on MIC Determination. Antimicrob. Agents Chemother. 2018, 62. [CrossRef] [PubMed]7. Scheler, O.; Makuch, K.; Debski, P.R.; Horka, M.; Ruszczak, A.; Pacocha, N.; Sozanski, K.; Smolander, O.-P.; Postek, W.; Garstecki, P.
Droplet-based digital antibiotic susceptibility screen reveals single-cell clonal heteroresistance in an isogenic bacterial population.Sci. Rep. 2020, 10, 1–8. [CrossRef] [PubMed]
8. Sales, M.J.; Sakoulas, G.; Szubin, R.; Palsson, B.; Arias, C.; Singh, K.V.; Murray, B.E.; Monk, J.M. Genome Sequence Compari-son of Staphylococcus aureus TX0117 and a Beta-Lactamase-Cured Derivative Shows Increased Cationic Peptide ResistanceAccompanying Mutations in relA and mnaA. Microbiol. Resour. Announc. 2020, 9. [CrossRef] [PubMed]
9. Salas, J.R.; Jaberi-Douraki, M.; Wen, X.; Volkova, V.V. Mathematical modeling of the ‘inoculum effect’: Six applicable models andthe MIC advancement point concept. FEMS Microbiol. Lett. 2020, 367. [CrossRef] [PubMed]
10. Quinn, B.; Hussain, S.; Malik, M.; Drlica, K.; Zhao, X. Daptomycin inoculum effects and mutant prevention concentration withStaphylococcus aureus. J. Antimicrob. Chemother. 2007, 60, 1380–1383. [CrossRef]
11. Udekwu, K.I.; Parrish, N.; Ankomah, P.; Baquero, F.; Levin, B.R. Functional relationship between bacterial cell density and theefficacy of antibiotics. J. Antimicrob. Chemother. 2009, 63, 745–757. [CrossRef] [PubMed]
12. Karslake, J.; Maltas, J.; Brumm, P.; Wood, K.B. Population Density Modulates Drug Inhibition and Gives Rise to PotentialBistability of Treatment Outcomes for Bacterial Infections. PLoS Comput. Biol. 2016, 12, e1005098. [CrossRef] [PubMed]
13. Soriano, F.; Santamaría, M.; Ponte, C.; Castilla, C.; Fernández-Roblas, R. In vivo significance of the inoculum effect of antibioticsonEscherichia coli. Eur. J. Clin. Microbiol. Infect. Dis. 1988, 7, 410–412. [CrossRef] [PubMed]
14. Davey, P.G.; Barza, M. The inoculum effect with Gram-negative bacteria in vitro and in vivo. J. Antimicrob. Chemother. 1987,20, 639–644. [CrossRef] [PubMed]
15. Nannini, E.C.; Singh, K.V.; Arias, C.A.; Murray, B.E. In Vivo Effects of Cefazolin, Daptomycin, and Nafcillin in Experimental En-docarditis with a Methicillin-Susceptible Staphylococcus aureus Strain Showing an Inoculum Effect against Cefazolin. Antimicrob.Agents Chemother. 2013, 57, 4276–4281. [CrossRef]
Antibiotics 2021, 10, 87 18 of 19
16. Fantin, B.; Poujade, J.; Grégoire, N.; Chau, F.; Roujansky, A.; Kieffer, N.; Berleur, M.; Couet, W.; Nordmann, P. The inoculumeffect of Escherichia coli expressing mcr-1 or not on colistin activity in a murine model of peritonitis. Clin. Microbiol. Infect. 2019,25, 1563.e5–1563.e8. [CrossRef]
17. Hoover, J.L.; Lewandowski, T.F.; Mininger, C.L.; Singley, C.M.; Sucoloski, S.; Rittenhouse, S. A Robust Pneumonia Model.in Immunocompetent Rodents to Evaluate Antibacterial Efficacy against S. pneu-moniae, H. influenzae, K. pneumoniae, P.aeruginosa or A. baumannii. J. Vis. Exp. 2017, 119, 55068.
18. Wiesch, P.A.Z.; Abel, S.; Gkotzis, S.; Ocampo, P.; Engelstädter, J.; Hinkley, T.; Magnus, C.; Waldor, M.K.; Udekwu, K.; Cohen, T.Classic reaction kinetics can explain complex patterns of antibiotic action. Sci. Transl. Med. 2015, 7, 287ra73. [CrossRef]
19. Singh, K.V.; Tran, T.T.; Nannini, E.C.; Tam, V.H.; Arias, C.A.; Murray, B.E. Efficacy of Ceftaroline against Methicillin-Susceptible Staphylococcus aureus Exhibiting the Cefazolin High-Inoculum Effect in a Rat Model of Endocarditis. Antimi-crob. Agents Chemother. 2017, 61, e00324-17. [CrossRef]
20. Malka, R.; Shochat, E.; Rom-Kedar, V. Bistability and Bacterial Infections. PLoS ONE 2010, 5, e10010. [CrossRef]21. Soriano, F.; Ponte, C.; Santamaria, M.; Jimenez-Arriero, M. Relevance of the inoculum effect of antibiotics in the outcome of
experimental infections caused by Escherichia coli. J. Antimicrob. Chemother. 1990, 25, 621–627. [CrossRef] [PubMed]22. Martínez, J.L.; Baquero, F. Mutation Frequencies and Antibiotic Resistance. Antimicrob. Agents Chemother. 2000, 44, 1771–1777.
[CrossRef] [PubMed]23. Veening, J.-W.; Smits, W.K.; Kuipers, O.P. Bistability, Epigenetics, and Bet-Hedging in Bacteria. Annu. Rev. Microbiol. 2008,
62, 193–210. [CrossRef] [PubMed]24. Dubnau, D.; Losick, R. Bistability in bacteria. Mol. Microbiol. 2006, 61, 564–572. [CrossRef] [PubMed]25. Graumann, P.L. Different genetic programmes within identical bacteria under identical conditions: The phenomenon of bistability
greatly modifies our view on bacterial populations. Mol. Microbiol. 2006, 61, 560–563. [CrossRef]26. Coates, J.; Park, B.R.; Le, D.; Simsek, E.; Chaudhry, W.; Kim, M. Antibiotic-induced population fluctuations and stochastic
clearance of bacteria. Elife 2018, 7, e32976. [CrossRef]27. Perfeito, L.; Fernandes, L.; Mota, C.; Gordo, I. Adaptive Mutations in Bacteria: High Rate and Small Effects. Science 2007,
317, 813–815. [CrossRef]28. Palmer, A.C.; Kishony, R. Understanding, predicting and manipulating the genotypic evolution of antibiotic resistance.
Nat. Rev. Genet. 2013, 14, 243–248. [CrossRef]29. Blair, J.M.A.; Webber, M.A.; Baylay, A.J.; Ogbolu, D.O.; Piddock, L.J.V. Molecular mechanisms of antibiotic resistance.
Nat. Rev. Genet. 2015, 13, 42–51. [CrossRef]30. Darch, S.E.; West, S.A.; Winzer, K.; Diggle, S.P. Density-dependent fitness benefits in quorum-sensing bacterial populations.
Proc. Natl. Acad. Sci. USA 2012, 109, 8259–8263. [CrossRef]31. Sykes, R.B.; Matthew, M. The beta-lactamases of gram-negative bacteria and their role in resistance to beta-lactam antibiotics.
J. Antimicrob. Chemother. 1976, 2, 115–157. [CrossRef] [PubMed]32. Thomson, K.S.; Moland, E.S. Cefepime, piperacillin-tazobactam, and the inoculum effect in tests with extended-spectrum
beta-lactamase-producing Enterobacteriaceae. Antimicrob. Agents Chemother. 2001, 45, 3548–3554. [CrossRef] [PubMed]33. Tanouchi, Y.; Pai, A.; Buchler, N.E.; You, L. Programming stress-induced altruistic death in engineered bacteria. Mol. Syst. Biol.
2012, 8, 626. [CrossRef] [PubMed]34. Lenhard, J.R.; Bulman, Z.P. Inoculum effect of beta-lactam antibiotics. J. Antimicrob. Chemother. 2019, 74, 2825–2843. [CrossRef]
[PubMed]35. Tan, C.; Smith, R.P.; Srimani, J.K.; Riccione, K.A.; Prasada, S.; Kuehn, M.; You, L. The inoculum effect and band-pass bacterial
response to periodic antibiotic treatment. Mol. Syst. Biol. 2012, 8, 617. [CrossRef] [PubMed]36. Malka, R.; Wolach, B.; Gavrieli, R.; Shochat, E.; Rom-Kedar, V. Evidence for bistable bacteria-neutrophil interaction and its clinical
implications. J. Clin. Investig. 2012, 122, 3002–3011. [CrossRef] [PubMed]37. Rio-Marques, L.; Hartke, A.; Bizzini, A. The Effect of Inoculum Size on Selection of In Vitro Resistance to Vancomycin, Daptomycin,
and Linezolid in Methicillin-Resistant Staphylococcus aureus. Microb. Drug Resist. 2014, 20, 539–543. [CrossRef]38. Zaslaver, A.; Mayo, A.E.; Rosenberg, R.; Bashkin, P.; Sberro, H.; Tsalyuk, M.; Surette, M.G.; Alon, U. Just-in-time transcription
program in metabolic pathways. Nat. Genet. 2004, 36, 486–491. [CrossRef]39. Martinez, M.N.; Papich, M.G.; Drusano, G.L. Dosing regimen matters: The importance of early intervention and rapid attain-ment
of the pharmacokinetic/pharmacodynamic target. Antimicrob. Agents Chemother. 2012, 56, 2795–2805. [CrossRef]40. Shai, Y. Mechanism of the binding, insertion and destabilization of phospholipid bilayer membranes by α-helical antimicrobial
and cell non-selective membrane-lytic peptides. Biochim. et Biophys. Acta (BBA)-Biomembr. 1999, 1462, 55–70. [CrossRef]41. Sochacki, K.A.; Barns, K.J.; Bucki, R.; Weisshaar, J.C. Real-time attack on single Escherichia coli cells by the human antimicrobial
peptide LL-37. Proc. Natl. Acad. Sci. USA 2011, 108, E77–E81. [CrossRef] [PubMed]42. Saar-Dover, R.; Bitler, A.; Nezer, R.; Shmuel-Galia, L.; Firon, A.; Shimoni, E.; Trieu-Cuot, P.; Shai, Y. D-alanylation of lipoteichoic
acids confers resistance to cationic peptides in group B streptococcus by increasing the cell wall density. PLoS Pathog. 2012,8, e1002891. [CrossRef]
43. Madani, F.; Lindberg, S.; Langel, Ü.; Futaki, S.; Gräslund, A. Mechanisms of Cellular Uptake of Cell-Penetrating Peptides.J. Biophys. 2011, 2011, 1–10. [CrossRef] [PubMed]

Antibiotics 2021, 10, 87 19 of 19
44. Lee, H.; Lim, S.I.; Shin, S.-H.; Lim, Y.; Koh, J.W.; Yang, S. Conjugation of Cell-Penetrating Peptides to Antimicrobial PeptidesEnhances Antibacterial Activity. ACS Omega 2019, 4, 15694–15701. [CrossRef] [PubMed]
45. Schmidt, N.; Mishra, A.; Lai, G.H.; Wong, G.C. Arginine-rich cell-penetrating peptides. FEBS Lett. 2009, 584, 1806–1813. [CrossRef][PubMed]
46. Stock, I.; Wiedemann, B. Natural antibiotic susceptibility of Escherichia coli, Shigella, E. vulneris, and E. hermannii strains.Diagn. Microbiol. Infect. Dis. 1999, 33, 187–199. [CrossRef]
47. Meredith, H.R.; Srimani, J.K.; Lee, A.J.; Lopatkin, A.J.; You, L. Collective antibiotic tolerance: Mechanisms, dynamics andintervention. Nat. Chem. Biol. 2015, 11, 182–188. [CrossRef]
48. Eagle, H.; Fleischman, R.; Musselman, A.D. The Bactericidal Action of Penicillin in Vivo: The Participation of the Host, and theSlow Recovery of the Surviving Organisms. Ann. Intern. Med. 1950, 33, 544–571. [CrossRef]