Virtual Meetings: Examining Presence on Group ...
56
Virtual Meetings: Examining Presence on Group Communication Quality, Performance and Satisfaction in Communication Environments Author: Amber Loode Student number: S1665464 Date: 11-02-2021 University of Twente P.O. Box 217, 7500AE Enschede The Netherlands ABSTRACT, Nowadays we live in an era where group communication is increasingly taking place using virtual environments. Virtual teams are characterized by groups that are geographically and temporally distributed whereby communication is maintained through electronic means. The effect of virtuality on groups has been discussed in literature as an essential factor in shaping the performance of a team, and in particular in the area of communication. Nevertheless, very few studies have investigated the effects of more recent communication environments (e.g. video conference and virtual reality) on group communication, even though they may be greatly deployed within highly virtual teams. Presence has been important to theorizing sophisticated human-computer interfaces such as virtual reality and video conference systems. Therefore, in order to assess these communication environments, the concepts of presence (e.g. telepresence, social presence, and self-presence) were used in this study. By means of an empirical study, groups of students were asked to solve assignments in different communication environments (e.g. in face-to-face, videoconference, and virtual reality environment). Through self-reported measures, perceived telepresence, social presence, self-presence and satisfaction in each communication environment were measured. In addition, the communication quality of a group (e.g. effectiveness, completeness, clarity, fluence and promptness) was measured by means of an observation scheme. And last, the results of the assignments were a measurement of the performance of a group. An analysis was performed to assess the effect of presence and the differences in communication environments. The results of this study suggest that in a FTF environment communication is very complete and team members feel most satisfied, whereas in a video conference environment communication is more effective and teams perform better. In a VR environment, the quality of communication is lowest because team members interact more difficultly and discussions are limited. In addition, social presence turned out to be the biggest positive predictor for communication quality and satisfaction. However, social presence turned out to negatively influence the effectiveness of a communication and indirectly the performance through an increase in completeness. These new insights could help academics to make optimal use of presence in the design of a virtual environment to enhance communication and consequently improve the performance and satisfaction of a group. Supervised by Mirjam Galetzka and Thomas van Rompay Keywords Virtuality, virtual teams, telepresence, social-presence, self-presence, group communication quality, group performance, satisfaction
-
Upload
khangminh22 -
Category
Documents
-
view
0 -
download
0
Transcript of Virtual Meetings: Examining Presence on Group ...
Virtual Meetings:
Examining Presence on Group Communication
Quality, Performance and Satisfaction in
Communication Environments
Author: Amber Loode
Student number: S1665464 Date: 11-02-2021
University of Twente
P.O. Box 217, 7500AE Enschede The Netherlands
ABSTRACT,
Nowadays we live in an era where group communication is increasingly taking place using virtual environments.
Virtual teams are characterized by groups that are geographically and temporally distributed whereby
communication is maintained through electronic means. The effect of virtuality on groups has been discussed in
literature as an essential factor in shaping the performance of a team, and in particular in the area of
communication. Nevertheless, very few studies have investigated the effects of more recent communication
environments (e.g. video conference and virtual reality) on group communication, even though they may be greatly
deployed within highly virtual teams. Presence has been important to theorizing sophisticated human-computer
interfaces such as virtual reality and video conference systems. Therefore, in order to assess these communication
environments, the concepts of presence (e.g. telepresence, social presence, and self-presence) were used in this
study. By means of an empirical study, groups of students were asked to solve assignments in different
communication environments (e.g. in face-to-face, videoconference, and virtual reality environment). Through
self-reported measures, perceived telepresence, social presence, self-presence and satisfaction in each
communication environment were measured. In addition, the communication quality of a group (e.g. effectiveness,
completeness, clarity, fluence and promptness) was measured by means of an observation scheme. And last, the
results of the assignments were a measurement of the performance of a group. An analysis was performed to assess
the effect of presence and the differences in communication environments. The results of this study suggest that
in a FTF environment communication is very complete and team members feel most satisfied, whereas in a video
conference environment communication is more effective and teams perform better. In a VR environment, the
quality of communication is lowest because team members interact more difficultly and discussions are limited.
In addition, social presence turned out to be the biggest positive predictor for communication quality and
satisfaction. However, social presence turned out to negatively influence the effectiveness of a communication and
indirectly the performance through an increase in completeness. These new insights could help academics to make
optimal use of presence in the design of a virtual environment to enhance communication and consequently
improve the performance and satisfaction of a group.
Supervised by Mirjam Galetzka and Thomas van Rompay
Keywords Virtuality, virtual teams, telepresence, social-presence, self-presence, group communication quality, group
performance, satisfaction
2
TABLE OF CONTENTS
1 Introduction ....……………………………………………………………………………….……..... 4
2 Theoretical Framework ………………………………………………………………………………. 6
2.1 Group communication quality factors …………………………………………….…………….. 7
2.2 Presence …………………………………………………………………………….……..…….. 8
2.2.1 Telepresence …………………………………………………………………………….. 8
2.2.2 Social presence ………………………………………………………………….………. 9
2.2.3 Self-presence ……………………………………………………….…………………… 9
2.3 Team effectiveness ……………..……………………………………………………………… 10
2.4 Communication environments …………………………………………….…………………… 11
2.4.1 Perceived telepresence ……………………………………………...………………….. 11
2.4.2 Perceived social presence …………………………………………...………………….. 12
2.4.3 Perceived self-presence ………………………………………...……………………… 12
3 Method ……………………………………………………………………………………………… 14
3.1 Design …………………. ……………………………………………………………………… 14
3.2 Pre-test ………………………………………………………………………………………… 14
3.3 Procedure ………………………………………………………………….…………………… 15
3.4 Materials …………………………………………………………………….….……………… 15
3.5 Tasks …………………………………………………………………………………………… 18
3.6 Participants ………………………………………………………………………………..…… 18
3.7 Measures ……………………………………………………………………………….………. 19
3.7.1 Telepresence, social presence, self-presence, and satisfaction ………………………… 19
3.7.2 Communication quality variables ……………………………………..……………….. 21
3.7.3 Performance ……………………………………………………….…..……………….. 21
3.8 Data analysis …………………………………………………………………………………… 21
3.8.1 Repeated measures ………………………………………………….…….……………. 21
3.8.2 Multivariate regression ……………………………………………….…….………….. 22
4 Results …………………………………………………………………………………...…………. 22
4.1 Effectiveness of the communication environments …………………………………………… 22
4.1.1 Perceived Presence ………………………………………………………………..…… 23
3
4.1.2 Communication quality ………………………………………………………..………. 24
4.1.3 Performance and satisfaction …………………………………………………..………. 25
4.2 Effect of presence on communication quality …………………………………………..……… 26
4.3 Effect of presence and communication quality on performance and satisfaction .…………….. 28
4.3.1 Performance …………………………………………………………………...……….. 28
4.3.2 Satisfaction ……………………………………………………………………..……… 29
4.4 Results of the hypotheses ………………………………………………………………………. 29
5 Discussion ……………………………………………………………………………………...…… 31
5.1 Limitations and future research ………………………………………………………………… 33
References ……………………………………………………………………………………………. 37
Appendices …………………………………………………………………………………………… 50
Appendix A – Observation scheme …….………………………………………………………….. 50
Appendix B – Self-report measurements …………………………………………………………... 52
Appendix C – Randomization of assignments and communication environments …….................... 53
Appendix D – Survival Exercises ………………………………………………………………….. 54
4
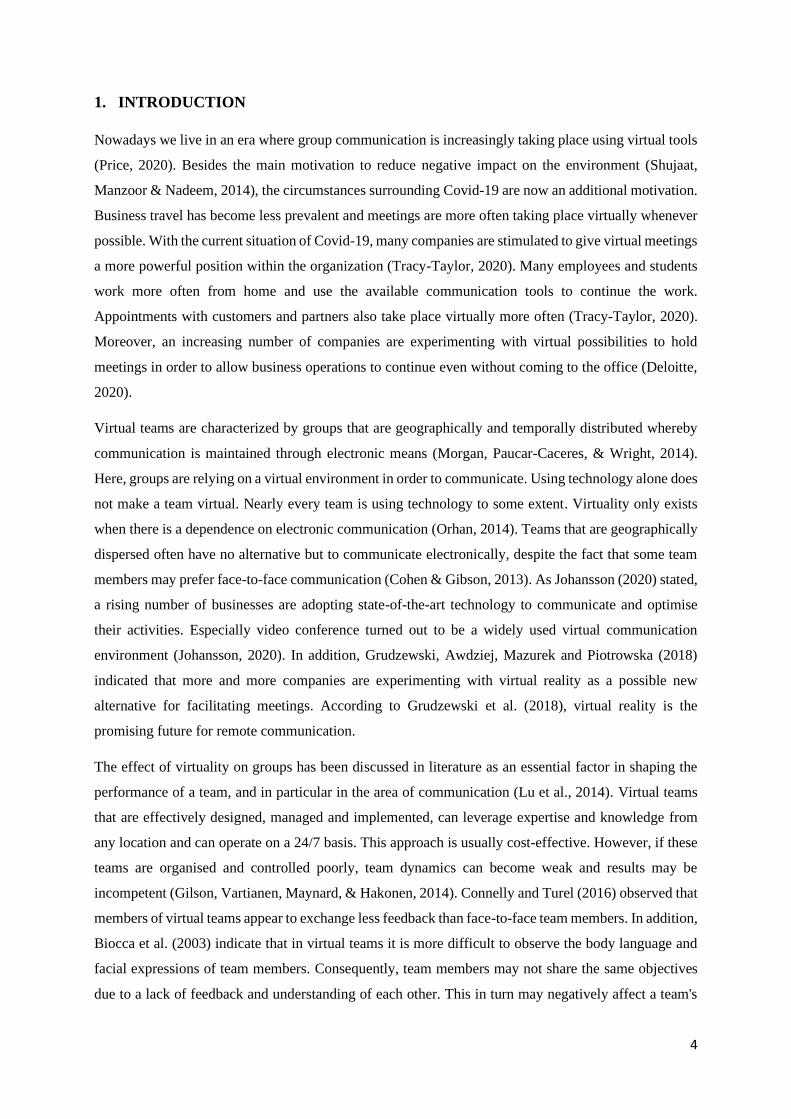
1. INTRODUCTION
Nowadays we live in an era where group communication is increasingly taking place using virtual tools
(Price, 2020). Besides the main motivation to reduce negative impact on the environment (Shujaat,
Manzoor & Nadeem, 2014), the circumstances surrounding Covid-19 are now an additional motivation.
Business travel has become less prevalent and meetings are more often taking place virtually whenever
possible. With the current situation of Covid-19, many companies are stimulated to give virtual meetings
a more powerful position within the organization (Tracy-Taylor, 2020). Many employees and students
work more often from home and use the available communication tools to continue the work.
Appointments with customers and partners also take place virtually more often (Tracy-Taylor, 2020).
Moreover, an increasing number of companies are experimenting with virtual possibilities to hold
meetings in order to allow business operations to continue even without coming to the office (Deloitte,
2020).
Virtual teams are characterized by groups that are geographically and temporally distributed whereby
communication is maintained through electronic means (Morgan, Paucar-Caceres, & Wright, 2014).
Here, groups are relying on a virtual environment in order to communicate. Using technology alone does
not make a team virtual. Nearly every team is using technology to some extent. Virtuality only exists
when there is a dependence on electronic communication (Orhan, 2014). Teams that are geographically
dispersed often have no alternative but to communicate electronically, despite the fact that some team
members may prefer face-to-face communication (Cohen & Gibson, 2013). As Johansson (2020) stated,
a rising number of businesses are adopting state-of-the-art technology to communicate and optimise
their activities. Especially video conference turned out to be a widely used virtual communication
environment (Johansson, 2020). In addition, Grudzewski, Awdziej, Mazurek and Piotrowska (2018)
indicated that more and more companies are experimenting with virtual reality as a possible new
alternative for facilitating meetings. According to Grudzewski et al. (2018), virtual reality is the
promising future for remote communication.
The effect of virtuality on groups has been discussed in literature as an essential factor in shaping the
performance of a team, and in particular in the area of communication (Lu et al., 2014). Virtual teams
that are effectively designed, managed and implemented, can leverage expertise and knowledge from
any location and can operate on a 24/7 basis. This approach is usually cost-effective. However, if these
teams are organised and controlled poorly, team dynamics can become weak and results may be
incompetent (Gilson, Vartianen, Maynard, & Hakonen, 2014). Connelly and Turel (2016) observed that
members of virtual teams appear to exchange less feedback than face-to-face team members. In addition,
Biocca et al. (2003) indicate that in virtual teams it is more difficult to observe the body language and
facial expressions of team members. Consequently, team members may not share the same objectives
due to a lack of feedback and understanding of each other. This in turn may negatively affect a team's
5
performance. According to Cohen and Gibson (2013), the lack of physical presence is perceived by
others as the main disadvantage of virtual teams. Members of a virtual team may be less effective or
satisfied because they feel less connected to both the task and the team members. However, to balance
these limitations, the study by Oeppen and Brennan (2020) proposes that working virtually mitigates the
often experienced face-to-face team process losses that arise from stereotyping, personality, authority
or political conflicts, and cliques. According to Marlow, Lacerenza and Salas (2017), an understanding
and assessment of the differences between virtual and face-to-face communication is essential in order
to develop and facilitate effective communication in a virtual team.
Additional virtual tools have become accessible to groups as technology has progressed. However, the
majority of studies continue to focus on traditional virtual tools such as email, text message, and
teleconference, which have been studied in great detail in the past. Nevertheless, very few studies have
investigated the effects of these more recent tools (e.g. video conference and virtual reality) on team
communication, even though they may be deployed within highly virtual teams to a greater extent than
the traditional communication tools studied (Koutsabasis, Vosinakis, Malisova, & Paparounas, 2012).
Since communication systems have developed gradually to replicate experiences with individuals and
environments, computer scientists, psychologists, and communication academics have devoted more
attention to this (Lee, 2004). Presence has been important to theorizing sophisticated human-computer
interfaces such as virtual reality and video conference systems (Fägersten, 2010). For the design and
assessment of interactive media and computer interfaces, the principle of presence has significant
practical relevance, particularly in telecommunications (videoconferencing, computer-supported
collaborative work, etc.) and education (online education, training classes, etc.) (Whitmer & Singer,
1998). According to Lee (2004), presence can be divided into 3 types of presence: telepresence, the
feeling that one is present in a real place; social presence, the feeling that one is present with someone
else; and self-presence, the degree to which one recognizes the virtual self as the true self. Based on
these types of presence, communication environments can be assessed (Lee, 2004).
As previously stated by Koutsabasis et al. (2012), more research needs to be done on recent
communication environments (e.g. video conference and virtual reality) and their effects on
communication quality, performance, and satisfaction. In order to assess the communication
environments, this study used the concepts of presence (e.g. telepresence, social presence, and self-
presence). A study was conducted on communication quality, performance and satisfaction of a group
by examining the presence of face-to-face, videoconference and virtual reality communication
environments.
This study aims to provide insight into the optimization potentials of a virtual environment. New insights
could help academics to make optimal use of these types of presence in the design of a virtual
6
environment to enhance communication and consequently improve the performance and satisfaction of
a group. A general research question has been developed:
‘To what extent does presence (telepresence, social presence and self-presence) impact the group
communication quality (effectiveness, completeness, clarity, fluence and promptness) and in turn,
performance and satisfaction in a problem-solving context?’
In order to compare the communication environments, it was interesting for this study to examine how
presence is perceived in each communication environment. Therefore, the differences in presence
between the three communication environments were identified. For this reason, a sub question was
developed:
‘To what extent do communication environments differ in terms of telepresence, social presence and
self-presence?’
In order to answer these questions, an empirical study has been carried out. In the present study, groups
were asked to solve assignments in a virtual reality, video conference, and face-to-face environment.
Based on observations and self-reported measures, the relationship between presence and
communication quality, performance and satisfaction was examined for each communication
environment.
2. THEORETICAL FRAMEWORK
The growth of virtual teams has led to extensive research into how these teams function in comparison
to face-to-face teams and into ways of making virtual teams more effective (Morrison-Smith & Ruiz,
2020). A variety of studies have shown that providing the opportunity for face-to-face conversations
improves group engagement and socialization (Connaughton & Daly, 2004; Kiesler & Cummings,
2002; Kraut, Fussell, Brennan, & Siegel, 2002). Kraut et al. (2002) argued that when people are face-
to-face, they can interact and cooperate by using a wide variety of linguistic, paralinguistic and non-
verbal actions. Deictic gestures (i.e., pointing) may be used to refer to persons, places, and objects
rapidly and effortlessly (Connaughton & Daly, 2004). Furthermore, since face-to-face interaction
occurs in real time, speakers receive immediate input about how their message is received when it is
transmitted (Fussell et al., 2002).
Videoconferencing has been studied for many years in terms of mutual gaze and head orientation
(Palmero et al., 2018), remote guidance (Fussell et al., 2004), the sense of presence (Baños et al., 2004),
and the richness of the communication channels (Bos, Olson, Gergle, & Wright, 2002). Van der Kleij,
Schraagen, Werkhoven and Dreu (2009) compared video conferencing groups with face-to-face groups
in their study. They found that video conferencing groups took more time, but team members interrupted
each other significantly less than face-to-face groups. They argued that the interaction process in video
7
conferencing groups was more formal. Listeners were found to be more courteous by waiting for a
speaker to finish before adding to the dialogue. In addition, Olson, Appunn, McAllister, Walters, and
Grinnell (2014) found that adding video to an existing virtual team increased trust and collaboration.
Furthermore, Akkirman and Harris (2005) found lower levels of perceived satisfaction with group
processes and outcomes in video conferencing groups as compared to face-to-face groups.
An evolving platform that offers modern and creative approaches to problem solving, entertainment,
education and a variety of other aspects of our lives is virtual reality (Kaplan et al., 2020). According to
Hammick and Lee (2014), the lack of visual/auditory cues in virtual reality is an important factor
affecting the quality of a communication in teams. As Seele, Misztal, Herpers, Schild and Buhler (2017)
argued, a lack of visual or auditory cues can cause misunderstandings in the transmission of information,
which can lead to teams not working effectively. However, compared to a FTF world, shy people are
less likely to perceive negative or inhibitory feedback signals from others due to the lack of visual and
auditory stimuli in virtual reality (Stritzke, Nguyen, & Durkin, 2004). As a result, virtual reality has a
positive effect on shy people, making them feel less anxious to communicate.
2.1 Group communication quality factors
Group communication is defined as a group process that refers to the exchange of information among
group members and is essential for the performance of a group (Kraut et al., 2002). A high-quality group
communication generates multiple perspectives, where shared knowledge allows members to
understand the problem space and to successfully define the problems (Burgoon et al., 2002). According
to González-Romá and Hernández (2014), group communication quality is composed of five
subconstructs, including effectiveness, completeness, clarity, fluence and promptness. Effectiveness
indicates the relevance of group communication. Great effectiveness in group communication creates
important information communication that is to the point. Completeness refers to the extent a group
communication covers all issues important for the topic. High completeness has no piece of important
information missing. Clarity indicates the group’s understanding of the information shared and received.
High clarity in group communication is achieved when all members of the group understand the
information. Fluence indicates the extent of free and easily sharing information among a group. In fluent
group communication, information can be exchanged without interruptions. Promptness indicates a
group’s responses and feedback in terms of time. Group communication is high on time when one
receives timely answers and feedback with minimal delays (González-Romá & Hernández, 2014). This
study used these five subconstructs to asses group communication quality in communication
environments.
8
2.2 Presence
Presence has been important to theorizing sophisticated human-computer interfaces such as virtual
reality and video conference systems, and therefore has been the focal point of both applied and
academic work (Cummings et al., 2012). Presence can be additionally separated into three particular
subcategories: telepresence, social presence, and self-presence (Lee, 2004).
2.2.1 Telepresence
Telepresence is the perceptual illusion of non-mediation (Steuer, 1992). It is the sensation of "being
there" in a world created by a medium (Heeter, 1992). In telepresence, the user does not observe or
recognize the existence of a medium in his communication environment and interacts as he would in the
absence of the medium. Although the medium is important for facilitating telepresence, cognitive
perception of the user's environment is essential for developing a feeling of telepresence (Baños, Botella,
Guerrero, & Rey, 2004). Lombard and Ditton (1997) stated that telepresence is of a subjective nature as
it involves various sensory, psychological, and emotional processes. In addition, Biocca (1997) argued
that telepresence is concerned with transport, meaning that the consciousness of a user is transported to
a location that is alternative to the actual location, where one feels and acts as if one is in a real place
(Sanchez-Vives & Slater, 2005). This alternative location, telepresence, can be triggered by a sense of
"place illusion" which is created within a virtual environment (Slater, 2009). According to Esteban-
Millat, Martínez-López, Luna and Rodríguez-Ardura (2014), telepresence is related to flow. When one
is in flow, one's engagement with the activity is strong but effortless, one is able to exert a sense of
control over their actions, the concerns for the self vanish, and the perception of time is distorted. During
a flow state, focus and involvement are particularly high (Esteban-Millat et al., 2014). According to
Pelet, Ettis and Cowart (2017), the more users are engaged and feel present in the mediated simulated
world, the more likely they are to concentrate, enjoy, feel challenged, feel in control and show interest.
In addition, Finneran and Zhang (2003) argued that telepresence is an important factor in helping an
individual to stay concentrated on the task, thereby decreasing distraction and off-topic communication.
As previously mentioned by Olson et al. (2002), teams that felt as they were in the same room (e.g.
collocated teams), were twice as productive as teams that did not felt as if they were in the same room
(uncollocated teams) regarding project outcomes. They linked collocated team productivity to fluid
communication practices, particularly frequent and impromptu feedback, which makes it easier to find
mutual understanding within groups. Based on these past researches it can be argued that telepresence
is related to group communication effectiveness, clarity, fluence, and promptness. Since no evidence is
found for group communication completeness, it is excluded from the hypothesis. Therefore, the
following hypotheses are stated:
H1: Telepresence is positively related to group communication effectiveness (a), clarity (b),
fluence (c), and promptness (d).
9
2.2.2 Social Presence
Biocca, Harms and Burgoon (2003 ) describe social presence as a "feeling of being with someone else".
In a virtual context, Lowry (2006) defined presence as the extent to which a communication tool enables
the group members to observe (feel) the actual presence of the team members and the resulting valuation
of inter-personal relationships, even though they are situated in distinct locations, operate at different
moments in time, and all communication takes place via electronic means. Supporting evidence
indicates that a reduced level of social presence within virtual teams can lead to a quality reduction in
communication (Roberts et al., 2006). The Social Presence Theory (SPT) notes that media with a low
social presence may not be appropriate for inter-subjective interpretation when communication is
accompanied by interactivity and reciprocity (Lombard & Ditton, 1997). Fundamental to SPT is the
conviction that the sender's presence affects the receiver 's perception of the information given.
Correspondingly, common, unmediated face-to-face spoken interactions offer the highest social
presence (Miranda & Saunders, 2003), whereas computer-aided media offer lower social presence
(Roberts, Lowry, & Sweeney, 2006). A low social presence can reduce the performance of group
members by ignoring or delaying particular comments or information. Since low social presence leads
to a decrease in social signals, it is likely to cause less interaction and reciprocity, that in turn, are
essential for high qualitative communication. Kraut et al. (2002) examined the communication of people
that were placed in each other's presence. This communication included the creation of greater common
ground, more accurate timing of messages, improved off-topic coordination, better misconception
repair, and fluid patterns of communication (Lu, Watson-Manheim, Chudoba, & Wynn, 2006).
Therefore, the following hypotheses are stated:
H2: Social presence is positively related to group communication effectiveness (a),
completeness (b), clarity (c), fluence (d), and promptness (e).
2.2.3 Self-presence
Self-presence is defined as the degree to which one recognizes the virtual self as the true self (Aymerich-
Franch, Karutz, & Bailenson, 2012). This presence aspect is linked to how attached one feels to one's
virtual self, thoughts, or personality (Ratan, Santa Cruz, & Vorderer, 2007). Schwartz and Steptoe
(2018) found that visual representation, spatialized audio, and movements of one’s body relate to the
increased sense of self in virtual environments. These three elements represent the observable signals
that develop the immersive self, in which each element is linked and influenced by the others in order
to construct self-presentation. Biocca et al. (2003) indicate that representation of one's real physical body
to one's virtual body may affect someone's body schema or image. They note that a discrepancy may
occur between one's real body and virtual body, physically as well as socially. Physically,
misunderstandings can occur in the transmission of information via unclear, non-verbal communication
(e.g., through limited facial expressions, gestures or posture). Socially, inconsistencies may occur in the
absence of appropriate answers to the user's feedback (e.g. limited promptness, relevance or validity of
10
feedback to user questions). Findings by Biocca et al. (2003) showed that non-verbal cues played a key
role in the clear transfer of information between communicators in communication environments.
According to Kang and Watt (2013), one adopt more non-verbal communication when one experience
the possibility for copying facial expressions and body movements in a communication environment.
As communicators use more non-verbal communication when one perceives more embodiment and self-
presence, this can cause one to communicate more quickly and clearly with others. As Roberts et al.
(2006) stated, a reduced self-presence within virtual teams could reduce the quality of communication
within a team, and therefore, could affect its productivity in terms of project outcomes. Based on these
past researches it can be argued that self-presence is related to group communication effectiveness,
clarity, and promptness. Since no evidence is found for group communication completeness and fluence,
it is excluded from the hypothesis. Therefore, the following hypotheses are stated:
H3: Self-presence is positively related to group communication effectiveness (a), clarity (b), and
promptness (c).
2.3 Team effectiveness
Two key measures of the effectiveness of teams are performance and satisfaction. Piccoli, Powell and
Ives (2004) specified effectiveness as group output and the effect of a group on its members. With regard
to work experience and satisfaction, effective teams need to be able to deliver a higher level of output
quality and reward group members (Jarvenpaa & Ives, 1994). In addition, performance can be
interpreted as the degree to which the outcomes of a group fulfil the requisite expectations or
measurements (Lurey & Raisinghani, 2001), whereas satisfaction can be described as the degree of the
members' assessment of the actions and agreements with the group output (Chidambaram, 1996). As
previously mentioned, literature state the positive relationship of performances with telepresence, social
presence and self-presence which is mediated by group communication quality. It is argued that when
the perception of presence in virtual teams increases, the quality of group communication also increases,
and in turn, leads to more group productivity. Nevertheless, no study examined the relationship of
presence and satisfaction. As effectiveness of virtual teams are not only measured by performances but
also satisfaction, it becomes of great interest to study this relationship. Raluca and Romulus (2018)
stressed that a worker's satisfaction is determined by the degree to which one feels satisfied with one's
work. This satisfaction is based on a number of factors, in which one of the key factor is communication.
In addition, Shujaat et al. (2014) found that group work and communication quality have a significant
impact on employee satisfaction. Considering these theoretical arguments, the following hypotheses are
stated:
H4: The effect of telepresence on performance will be mediated by group communication
effectiveness (a), completeness (b), clarity (c), fluence (d), and promptness (e).
11
H5: The effect of social presence on performance will be mediated by group communication
effectiveness (a), completeness (b), clarity (c), fluence (d), and promptness (e).
H6: The effect of self-presence on performance will be mediated by group communication
effectiveness (a), completeness (b), clarity (c), fluence (d), and promptness (e).
H7: The effect of telepresence on satisfaction will be mediated by group communication
effectiveness (a), completeness (b), clarity (c), fluence (d), and promptness (e).
H8: The effect of telepresence on satisfaction will be mediated by group communication
effectiveness (a), completeness (b), clarity (c), fluence (d), and promptness (e).
H9: The effect of telepresence on satisfaction will be mediated by group communication
effectiveness (a), completeness (b), clarity (c), fluence (d), and promptness (e).
2.4 Communication environments
The principle of presence has significant practical relevance for the design and assessment of interactive
media and computer interfaces, and is therefore used to theorizing communication systems such as
virtual reality and video conference systems (Whitmer & Singer, 1998).
2.4.1 Perceived telepresence
Virtual Reality (VR) involves computer technology applied to simulate a virtual environment (Biocca
& Levy, 1995). Contrary to conventional communication interfaces such as video conferencing, VR
places the user in an immersive experience. As opposed to having a computer screen in front of them, it
allows users to interact with their world (Lin et al., 2017). Pallavicini, Pepe and Minissi (2019)
investigated telepresence among players using a virtual reality game and a desktop game. Participants
reported a significantly higher feeling of telepresence at the end of the virtual reality game in relation to
the level of presence perceived at the end of the desktop gameplay. In addition, several studies (e.g.
Steed et al., 1999; Slater & Steed, 2000; Moreno & Mayer, 2004) examined immersive virtual platforms
(e.g. HMD, cave automatic virtual environment; CAVE) compared to non-immersive platforms (e.g.
Desktop). These studies support a common understanding that immersive virtual environments generate
a greater sense of telepresence than non-immersive virtual platforms. Since face-to-face communication
does not take place in a virtual environment, telepresence was interpreted in this case as the feeling of
being present in the room. Considering this, this study hypothesised that face-to-face communication
allow for the highest perceived telepresence, followed by virtual reality, and then videoconferencing.
H10: Telepresence is perceived highest with face-to-face, followed by virtual reality and
lowest with video conferencing.
12
2.4.2 Perceived social presence
According to Roberts, Lowry and Sweeney (2006), normal, unmediated face-to-face interactions allow
for the highest perceived social presence, while computer-assisted media provide a lower perceived
social presence. Norris, Weger, Bullinger and Bowers (2014) argue that VR experiences that utilise
avatars to produce real time verbal and non-verbal social responses affect the perceived social presence,
the feeling of being present with others. Avatars are presumed according to studies (Blascovich et al.,
2002; Slater & Steed, 2000) to transmit social signals and improve social presence. Recent research of
Bente et al. (2008) presents findings that (1) visual representation and (2) realistic behavioral
representation of actions (e.g. eye and mouth gestures and body computation) improve social presence.
This research highlights the importance of behavioral realism in promoting a sense of social presence in
virtual reality facilitated by virtual avatars. However, avatars in virtual reality do not resemble the user
and have a limited level of behavioral realism. This is expected to improve in the future. Considering
these studies on visual representation and behavioral realism, virtual reality was expected to generate at
the moment a moderate sense of social presence. Furthermore, the use of online video conferencing in
this study was expected to have a valuable impact on social presence as it is defined as' the capacity of
individuals to reflect their personal attributes into the group, introducing themselves as "real persons"
towards others (Garrison, Anderson, & Archer, 2000). Giesbers, Rienties, Gijselaers, Segers and
Tempelaar (2009) claim that perceived social presence is strengthened by the users being able to
communicate themselves in a group more socially and emotionally when participants can be seen and
heard simultaneously and have access to a common workspace through online video conferencing. Since
in this study visual representation and behavioral realistism are greater in videoconferencing than in
virtual reality, it is hypothesised that the perceived social presence will be greater in videoconferencing
than in virtual reality.
H11: Social presence is perceived highest with face-to-face, followed by video conferencing
and lowest with virtual reality.
2.4.3 Perceived self-presence
Biocca (2014) claims that in a virtual environment, the self-avatar reflects one 's behavior. However if
the self-avatar that one encounters does not seem to reflect the physical body, it may be challenging to
associate with. According to the principle of objective self-awareness (Wicklund, 1979), self-awareness
is enhanced through the use of cameras and/or one's own appearance in a social setting. Slater (2009)
proposed that self-presence relates back to the possible usefulness of a virtual reality self-avatar. If a
feeling of self-presence is perceived, a self-avatar should be "invisible" as an interface mediator and
users will interact in it unconsciously. Supportive studies from Bente et al. (2008) present findings that
when visual and realistic behavioral actions in body movements and facial expressions can be
represented in a virtual environment, perceived self-presence can increase. Nevertheless, in the
identification and use of a self-avatar in a simulated world, humans seem to have a lot of versatility.
13
Certainly, in social contexts, users can use avatars to interact effectively (Schultze, 2010). Dodds,
Mohler and Bülthoff have demonstrated, for example, that a self-avatar is a valuable resource in a virtual
reality environment to interact with others. Steed, Pan, Zisch and Steptoe (2016) state that when
analyzing self-presence, the feeling of embodiment inside a self-avatar should be regarded. In certain
cases, when embodied within a self-avatar, the individual considers the self-avatar as their true entity.
According to Roberts, Lowry and Sweeney (2006), one starts to gain self-presence by specifically
monitored hand controls, enabling one to perceive one's own hands movements and connect throughout
the environment. However, the appearance of avatars in virtual reality do not resemble the user. It has a
limited level of visual representation and behavioral realism in terms of eye and mouth movements
compared to video conferencing. According to Roberts, Lowry and Sweeney (2006), normal,
unmediated face-to-face interactions allow for the highest perceived self-presence, while computer-
assisted media provide a lower perceived self-presence. Considering this, it is hypothesised that the
perceived self-presence will be the highest in a face-to-face environment, followed by videoconference,
and then virtual reality.
H12: Self-presence is perceived highest with face-to-face, followed by video conferencing and
lowest with virtual reality.
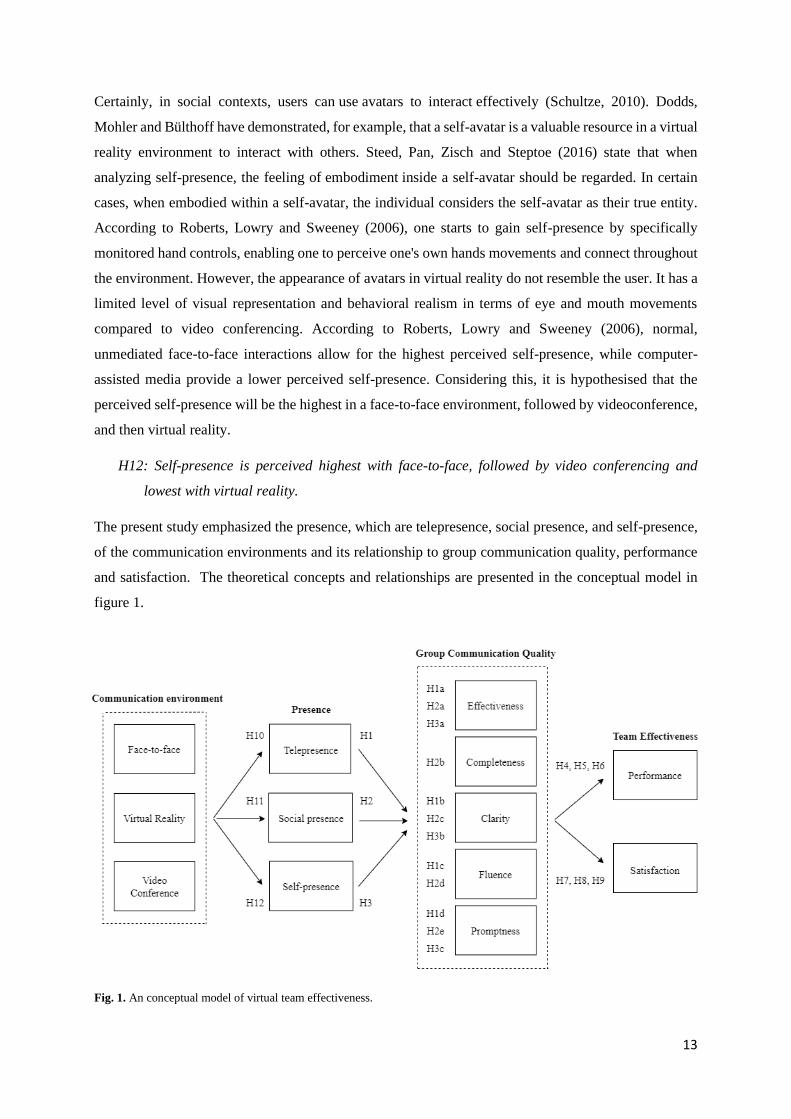
The present study emphasized the presence, which are telepresence, social presence, and self-presence,
of the communication environments and its relationship to group communication quality, performance
and satisfaction. The theoretical concepts and relationships are presented in the conceptual model in
figure 1.
Fig. 1. An conceptual model of virtual team effectiveness.
14
3. METHOD
3.1 Design
For this study, a within-subject design is used to examine the mediating effect of the five group
communication factors on performance and satisfaction for the different dimensions of virtuality (e.g.
telepresence, social presence, and self-presence). The communication environments (e.g. virtual reality,
video conference, and face-to-face), which in the hypotheses were assumed to differentiate in the degree
of telepresence, social presence, and self-presence, was the within-subject factor. By using a within-
subject design, random noise such as participant’s characteristics, intelligence, and/or relationships
could be minimized. However, it could have create a learning effect and fatigue could have occurred
(Charness, Gneezy, & Kuhn, 2012). Therefore, randomization in the order of the within factor (e.g. the
communication environment) and assignments were conducted (Appendix C) to minimize order effects,
transfer and learning across conditions (Budiu, 2018). In addition, the duration and complexity of the
questionnaire were taken into account, so that participants did not get fatigued.
3.2 Pre-test
A pre-test with 10 participants was conducted to clarify the relationships between the types of presence
and communication environments. During this pre-test participants were provided with explanations and
images of the communication environments and the different concepts of presence. Subsequently, the
participants had to rank the communication environments for telepresence, social presence and self-
presence. The results of the rankings of the 10 participants in the pre-test all corresponded to the
hypotheses that had been made in this study.
In addition, a second pre-test was conducted to test whether fatigue could happen when performing the
assignments. For this, a group of three students had to make the three assignments one after the other
and for each assignment, the time was recorded. After they finished, their opinion about the assignments
and the process was discussed. It was also noticeable that the last assignment was completed faster than
the first. These two references of information indicated that the motivation decreased per assignment.
Therefore, for this study we decided to provide a competitive aspect to the assignments by means of a
prize. By doing this it was possible to motivate the participants.
A third pre-test was done for the observation scheme to exclude inter-observer bias. In order to test
whether the observation scheme had clear guidelines for assigning scores, a pre-test was conducted with
two other observers. These observers had to judge a short fragment that was recorded during the
experiments. It turned out that the two observers gave exactly the same scores during this pre-test,
suggesting that the observation scheme can be accepted for the use in this study.
15
3.3 Procedure
The study mainly took place in the BMS lab of the University of Twente. Due to the circumstances
surrounding Covid-19, extra measures had to be taken to allow the physical experiments to take place.
For this, approval had to be obtained from the Ethics Committee and the BMS lab. Furthermore, the
planning of the physical experiments was taken into account and a maximum of one group of three
students per day was allowed in the flex-experiment rooms. Additional measures that were taken
concerning Covid-19 were disinfectants, mouth masks, special face masks and hairnets for the virtual
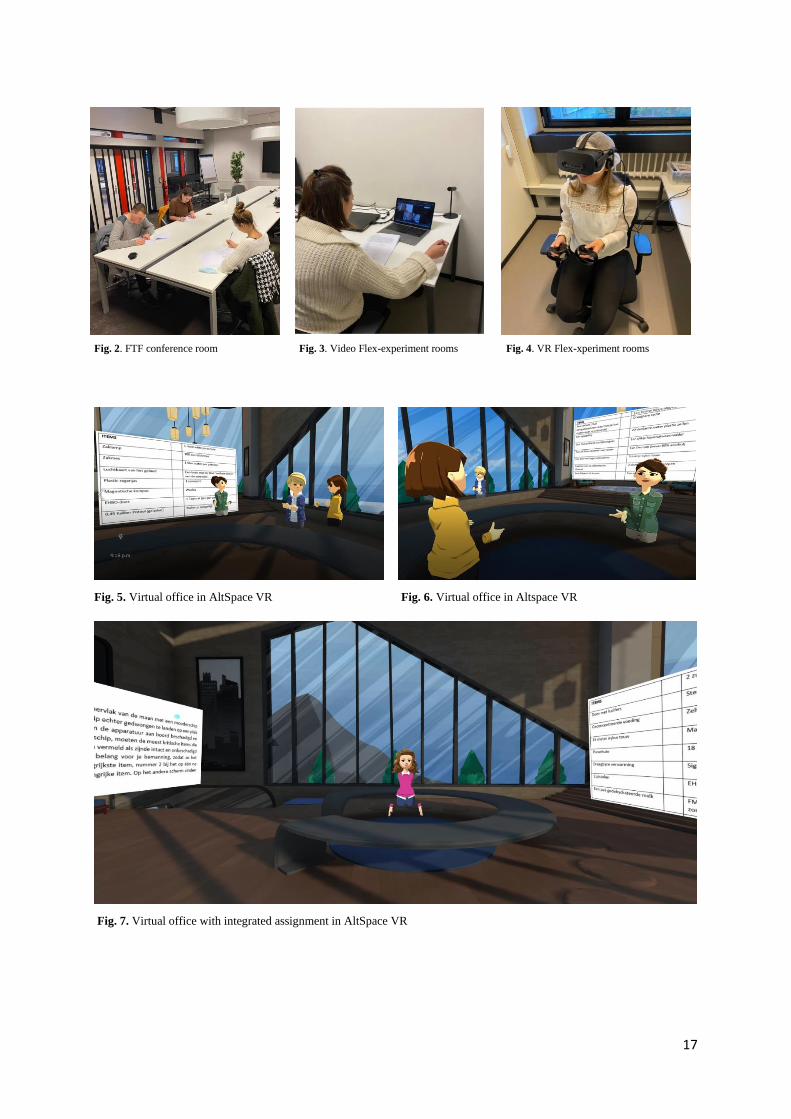
reality glasses, and special conference rooms that guaranteed 1.5 metres and ventilation. Figure 2, 3, and
4 represent these rooms. At the end of the day, the devices and materials used in the experiment were
cleaned.
Before the participants started the experiments they were each given a binder. This binder consisted of
the Informed Consent, Covid-19 papers, the assignments and the questionnaires. They were asked to
read the Informed Consent, and when they had done so and agreed to it, to sign it. In addition to the
informed consent, participants were also screened for Covid-19 symptoms beforehand. They had to fill
in a special form and have it signed by the researcher. These forms were then submitted to the BMS lab.
Before starting the assignments, participants were told that they could win a prize when they obtained
the best group results. They were explicitly told that time was not an important factor. The prize was
used as a means of motivation since the participants were to spend two hours completing three tasks that
resembled each other. Afterwards, it appeared that playing in VR was also a great means of motivation.
Depending on the order in which a group had to perform in a certain communication environment, the
three students were guided to their places. While the participants were engaged in the assignments, they
were video recorded. These recordings were used to assess the communication variables using an
observation scheme. After completing an assignment in a particular communication environment, they
were asked to complete a questionnaire. Participants had to fill in statements about telepresence, social
presence, self-presence and satisfaction. Participants therefore completed a total of three questionnaires.
In addition, participants were asked to fill in their experiences with FTF, video and VR to examine
potential covariance.
The duration of each assignment remained under 20 minutes. The overall procedure took approximately
two hours. After the experiments, participants were offered a small gift as a token of appreciation.
3.4 Materials
For each assignment a different environment was used to manipulate presence. The first communication
environment was traditional face-to-face communication in which students were placed together in one
room. Due to the circumstances concerning Covid-19, the 1.5 meter distance had to be taken into
account. For this purpose a room was used that allowed enough space to sit 1.5 meters apart with a group
16
of 3 students. These face-to-face meetings took place in a conference room at the University of Twente.
Using the assignment in their binder, participants were able to begin. In order to assess the
communication of the group, the process was recorded using a camera. For this purpose a JVC 4k camera
was used. Figure 2 represents the face-to-face communication environment that is used for these
experiments.
The second communication environment was a video conference. The video conference meeting took
place in the Flex-experiment rooms in the BMS lab at the University of Twente. Students were placed
individually in separate rooms to ensure that no face-to-face confrontation was made with each other.
These rooms contained a seat and a table equipped with a laptop and webcam. The students were
virtually connected through Google Meet. Google Meet is a software from Google that facilitates video
conferences. Participants received a link that opened the conference room on their laptop. Participants
simply had to click on participate and they could start with the assignment they had on a paper in front
of them. During the process the Google Meet meeting was recorded in order to observe and assess the
group communication. Figure 3 represents the Flex experiments rooms used for this experiment.
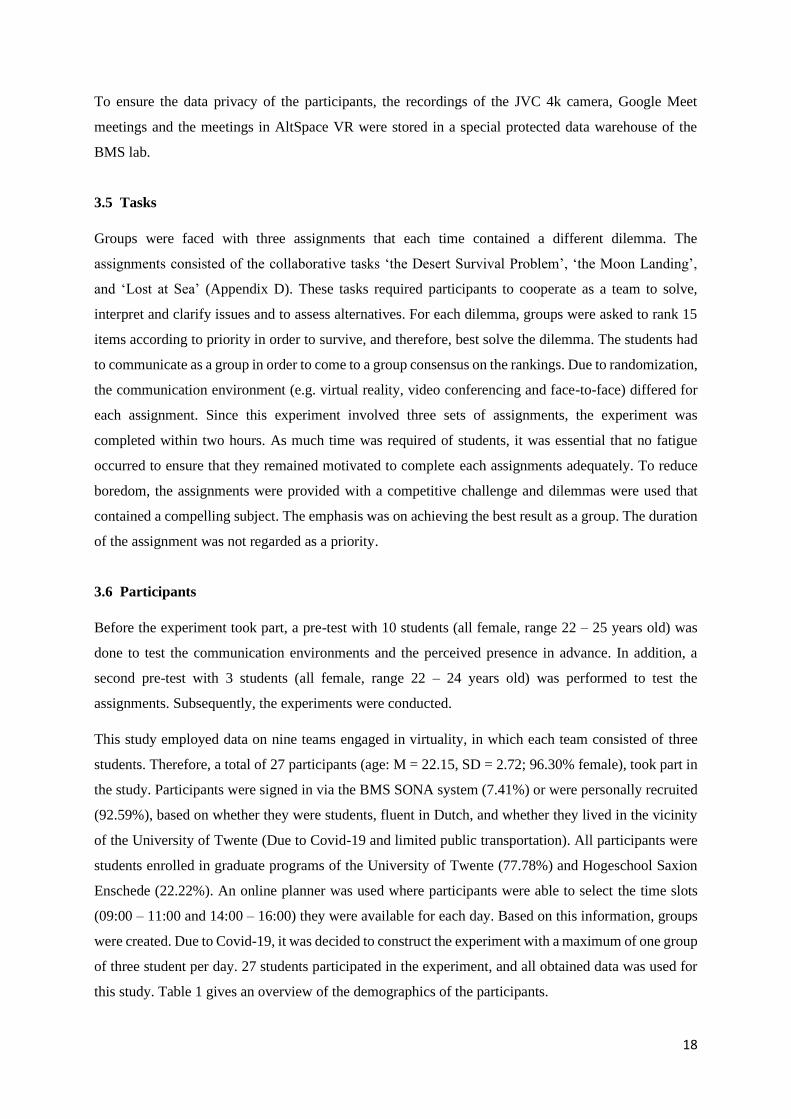
The third communication environment was virtual reality. Two Oculus Rift S glasses, an Oculus Rift
glass with two sensors, and three Dell Alienware Aurora computer systems were used from the BMS-
lab to support virtual reality. The software AltSpace VR was used to create a virtual world in which
participants experience as they are together in an office. Noteworthy, AltSpace VR uses avatars that do
not resemble the users. Therefore, the visual representation and behavioral realism of users were limited.
Again, students were placed in separate Flex-experiment rooms so they could not have face-to-face
interaction with each other. These rooms had sufficient space for participants to move around. Figure 4
represents the Flex experiments rooms for this experiment. Many participants had no experience with
VR. For this reason participants were introduced step by step to the VR environment in AltSpace VR
and received an explanation of the controllers. After the explanation, they were placed in a virtual
community space called 'The Campfire'. This is where people from all over the world are seated, with
whom you can communicate through your VR headset. The participants were asked to go and discover
VR for themselves. After the participants had experimented with VR in this shared virtual environment
for a while, and had become more familiar with the system, they were invited to join the constructed
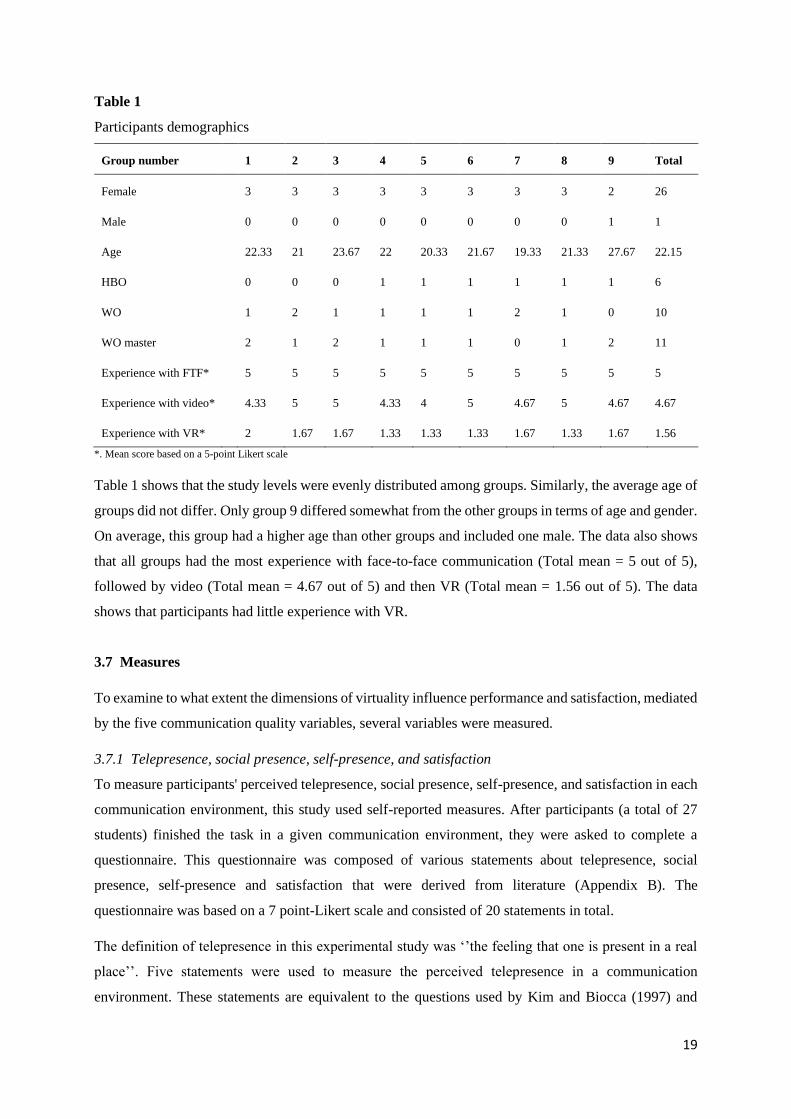
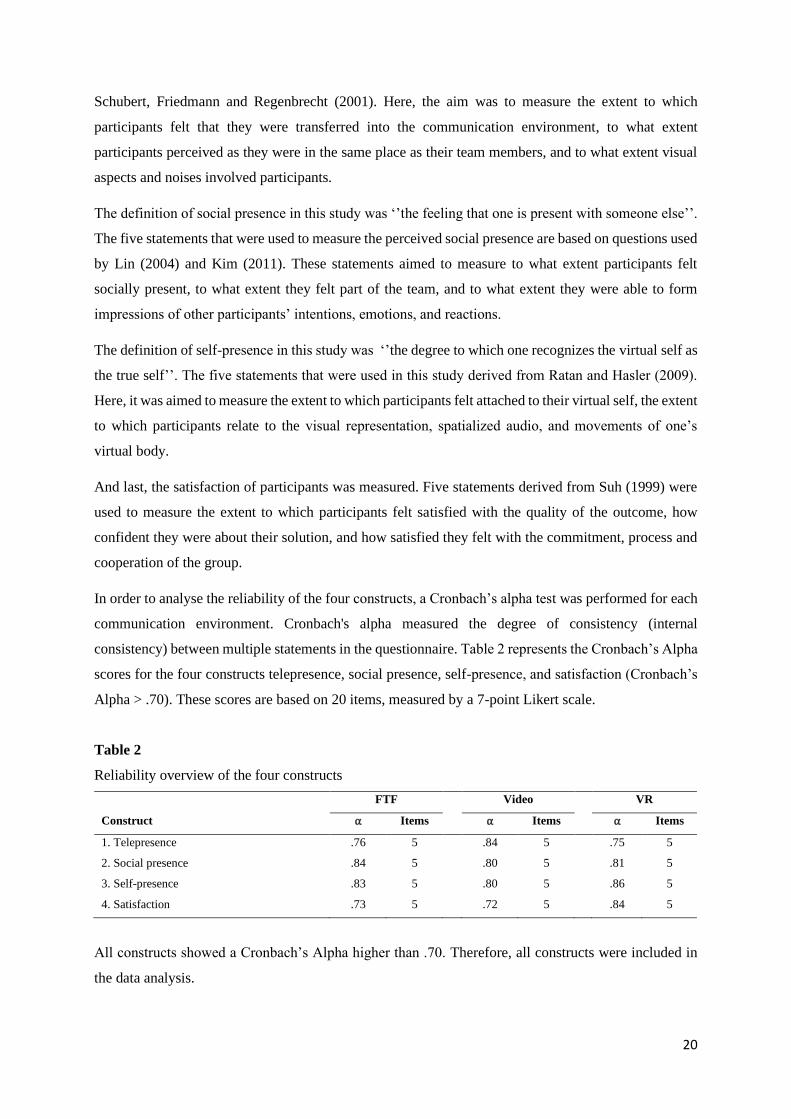
'Virtual Office' to start the experiment. Since participants wore VR glasses and therefore could not see
the paper assignment, the assignment was incorporated in the virtual office. By means of an API, the
assignment and a list of 15 items was built in the virtual office, enabling the participants to complete the
assignment in virtual reality without any interruption. Figure 5, 6, and 7 shows the VR environment
used in AltSpace VR.
17
Fig. 2. FTF conference room Fig. 3. Video Flex-experiment rooms Fig. 4. VR Flex-xperiment rooms
Fig. 5. Virtual office in AltSpace VR Fig. 6. Virtual office in Altspace VR
Fig. 7. Virtual office with integrated assignment in AltSpace VR
18
To ensure the data privacy of the participants, the recordings of the JVC 4k camera, Google Meet
meetings and the meetings in AltSpace VR were stored in a special protected data warehouse of the
BMS lab.
3.5 Tasks
Groups were faced with three assignments that each time contained a different dilemma. The
assignments consisted of the collaborative tasks ‘the Desert Survival Problem’, ‘the Moon Landing’,
and ‘Lost at Sea’ (Appendix D). These tasks required participants to cooperate as a team to solve,
interpret and clarify issues and to assess alternatives. For each dilemma, groups were asked to rank 15
items according to priority in order to survive, and therefore, best solve the dilemma. The students had
to communicate as a group in order to come to a group consensus on the rankings. Due to randomization,
the communication environment (e.g. virtual reality, video conferencing and face-to-face) differed for
each assignment. Since this experiment involved three sets of assignments, the experiment was
completed within two hours. As much time was required of students, it was essential that no fatigue
occurred to ensure that they remained motivated to complete each assignments adequately. To reduce
boredom, the assignments were provided with a competitive challenge and dilemmas were used that
contained a compelling subject. The emphasis was on achieving the best result as a group. The duration
of the assignment was not regarded as a priority.
3.6 Participants
Before the experiment took part, a pre-test with 10 students (all female, range 22 – 25 years old) was
done to test the communication environments and the perceived presence in advance. In addition, a
second pre-test with 3 students (all female, range 22 – 24 years old) was performed to test the
assignments. Subsequently, the experiments were conducted.
This study employed data on nine teams engaged in virtuality, in which each team consisted of three
students. Therefore, a total of 27 participants (age: M = 22.15, SD = 2.72; 96.30% female), took part in
the study. Participants were signed in via the BMS SONA system (7.41%) or were personally recruited
(92.59%), based on whether they were students, fluent in Dutch, and whether they lived in the vicinity
of the University of Twente (Due to Covid-19 and limited public transportation). All participants were
students enrolled in graduate programs of the University of Twente (77.78%) and Hogeschool Saxion
Enschede (22.22%). An online planner was used where participants were able to select the time slots
(09:00 – 11:00 and 14:00 – 16:00) they were available for each day. Based on this information, groups
were created. Due to Covid-19, it was decided to construct the experiment with a maximum of one group
of three student per day. 27 students participated in the experiment, and all obtained data was used for
this study. Table 1 gives an overview of the demographics of the participants.
19
Table 1
Participants demographics
Group number 1 2 3 4 5 6 7 8 9 Total
Female 3 3 3 3 3 3 3 3 2 26
Male 0 0 0 0 0 0 0 0 1 1
Age 22.33 21 23.67 22 20.33 21.67 19.33 21.33 27.67 22.15
HBO 0 0 0 1 1 1 1 1 1 6
WO 1 2 1 1 1 1 2 1 0 10
WO master 2 1 2 1 1 1 0 1 2 11
Experience with FTF* 5 5 5 5 5 5 5 5 5 5
Experience with video* 4.33 5 5 4.33 4 5 4.67 5 4.67 4.67
Experience with VR* 2 1.67 1.67 1.33 1.33 1.33 1.67 1.33 1.67 1.56
*. Mean score based on a 5-point Likert scale
Table 1 shows that the study levels were evenly distributed among groups. Similarly, the average age of
groups did not differ. Only group 9 differed somewhat from the other groups in terms of age and gender.
On average, this group had a higher age than other groups and included one male. The data also shows
that all groups had the most experience with face-to-face communication (Total mean = 5 out of 5),
followed by video (Total mean = 4.67 out of 5) and then VR (Total mean = 1.56 out of 5). The data
shows that participants had little experience with VR.
3.7 Measures
To examine to what extent the dimensions of virtuality influence performance and satisfaction, mediated
by the five communication quality variables, several variables were measured.
3.7.1 Telepresence, social presence, self-presence, and satisfaction
To measure participants' perceived telepresence, social presence, self-presence, and satisfaction in each
communication environment, this study used self-reported measures. After participants (a total of 27
students) finished the task in a given communication environment, they were asked to complete a
questionnaire. This questionnaire was composed of various statements about telepresence, social
presence, self-presence and satisfaction that were derived from literature (Appendix B). The
questionnaire was based on a 7 point-Likert scale and consisted of 20 statements in total.
The definition of telepresence in this experimental study was ‘’the feeling that one is present in a real
place’’. Five statements were used to measure the perceived telepresence in a communication
environment. These statements are equivalent to the questions used by Kim and Biocca (1997) and
20
Schubert, Friedmann and Regenbrecht (2001). Here, the aim was to measure the extent to which
participants felt that they were transferred into the communication environment, to what extent
participants perceived as they were in the same place as their team members, and to what extent visual
aspects and noises involved participants.
The definition of social presence in this study was ‘’the feeling that one is present with someone else’’.
The five statements that were used to measure the perceived social presence are based on questions used
by Lin (2004) and Kim (2011). These statements aimed to measure to what extent participants felt
socially present, to what extent they felt part of the team, and to what extent they were able to form
impressions of other participants’ intentions, emotions, and reactions.
The definition of self-presence in this study was ‘’the degree to which one recognizes the virtual self as
the true self’’. The five statements that were used in this study derived from Ratan and Hasler (2009).
Here, it was aimed to measure the extent to which participants felt attached to their virtual self, the extent
to which participants relate to the visual representation, spatialized audio, and movements of one’s
virtual body.
And last, the satisfaction of participants was measured. Five statements derived from Suh (1999) were
used to measure the extent to which participants felt satisfied with the quality of the outcome, how
confident they were about their solution, and how satisfied they felt with the commitment, process and
cooperation of the group.
In order to analyse the reliability of the four constructs, a Cronbach’s alpha test was performed for each
communication environment. Cronbach's alpha measured the degree of consistency (internal
consistency) between multiple statements in the questionnaire. Table 2 represents the Cronbach’s Alpha
scores for the four constructs telepresence, social presence, self-presence, and satisfaction (Cronbach’s
Alpha > .70). These scores are based on 20 items, measured by a 7-point Likert scale.
Table 2
Reliability overview of the four constructs
FTF Video VR
Construct ⍺ Items ⍺ Items ⍺ Items
1. Telepresence .76 5 .84 5 .75 5
2. Social presence .84 5 .80 5 .81 5
3. Self-presence .83 5 .80 5 .86 5
4. Satisfaction .73 5 .72 5 .84 5
All constructs showed a Cronbach’s Alpha higher than .70. Therefore, all constructs were included in
the data analysis.
21
3.7.2 Communication quality variables
To measure the five variables of group communication quality in each communication environment, this
study used observation measures. The observation scheme that was used consisted of a 5-point Likert
scale rating of behavior. The observation scheme can be found in Appendix A. Before the
communication was assessed, a pre-test was conducted with two other observers in order to test whether
the observation scheme had clear guidelines for assigning scores. To test his, Landis and Koch (1977)
presented standards for interpreting κ, indicating that κ values of 0.81 to 1.00 showed almost perfect
agreement. This pre-test resulted in full inter-rater reliability (κ = 1.00, p < .001), which is the degree of
agreement among observers. Based on this pre-test, it was accepted to work with the observation
scheme.
During the experiments, group communication was video recorded, observed, analyzed and assessed
based on the observation scheme. To ensure intra-observer reliability, i.e., the degree to which
measurements from the same observer are consistent, group communication was analyzed three times
by the same researcher. Based on the guidelines of Landis and Koch (1977), the Cohen’s Kappa of the
observations (κ = .893, p < .001) was measured, representing high levels of agreement. Therefore, it was
concluded that the observations were reliable to analyse in the study.
3.7.3 Performance
Performance was measured by the results of the assignments. Experts have reviewed the assignments in
the past and provided the correct answers for the dilemmas. Based on the experts' answers, the results
are calculated. In order to measure the performances of a group, the absolute difference between the
group priority ranking and expert priority ranking (e.g. error points) was assessed. A lower number of
error points signified a greater group performance. The three assignments that a group had to complete
were similar to each other but each involved a different dilemma. However, the level of difficulty of the
assignments were not the same. As a result, the scores of the three assignments were not comparable,
and therefore, the absolute scores of the assignments could not be used as comparative data. Therefore,
this study examined how well a particular group did on the assignment compared to other groups. In
other words, performance was determined by assessing the relative score compared to the rest of the
groups.
3.8 Data Analysis
In order to test the hypotheses, an One-way Repeated Measures analysis of variance (ANOVA) and
Multivariate regression was conducted.
3.8.1 Repeated measures
An one-way repeated measures analysis of variance (ANOVA) was used to compare 27 students’ ratings
of three different communication environments. This analysis was conducted to compare the effect of
22
face-to-face, video conference and virtual reality environments on telepresence, social presence, and
self-presence. The Bonferroni post hoc test, e.g. Pairwise comparison, was used to conclude significant
differences. This information determined whether we rejected or accepted hypotheses 10, 11 and 12. In
addition to answering the hypothesis, a repeated measures analysis was done for the five communication
variables, performance, satisfaction, and duration of the assignment. The purpose of the repeated
measures analysis was to answer the hypothesis, as well as to provide valuable insights into the
differences between the communication environments. To test the possibility of covariances such as
duration of an assignment and experience in a communication environment, a covariance analysis was
done within the one-way repeated measures analysis of variance (ANOVA). Boxplots and Shapiro-Wilk
statistics indicated that the assumption of normality was supported for all variables tested. Furthermore,
homogeneity of variances were demonstrated and Mauchly’s test was used to indicate the assumption
of sphericity.
3.8.2 Multivariate regression
In order to answer hypothesis H1, H2 and H3, a multivariate regression analysis of variance
(MANOVA) was performed. In this analysis, further research was conducted into the collective
influence of telepresence, social presence and self-presence as independent variables on the
communication quality variables, performance and satisfaction as dependent variables. In addition, a
regression analysis was performed for the communication quality variables as independent variables on
performance and satisfaction as dependent variables.
And finally, in order to answer hypothesis H4, H5, H6, H7, H8 and H9, the mediating effect of the
communication variables was analyzed. This was done by analyzing the regression results of the five
communication quality variables together with the three types of presence as independent variable on
the dependent variables performance and satisfaction.
4. RESULTS
This chapter reports the findings of one-way analysis of variance (ANOVA) and multivariate regression.
First, the findings that relate to the impact of the communication environment on presence,
communication quality, performance and satisfaction are presented. Then, the effect of presence on the
communication quality of a group is discussed. Finally, the role of presence and the quality of
communication in predicting the performance of a group and the satisfaction of its members is explored.
4.1 Effectiveness of the communication environments
This section elaborates on the effects of the communication environments on presence, communication
quality, performance and satisfaction and demonstrates significant differences. Table 3 and Table 4 give
an overview of these findings.
23
4.1.1 Perceived Presence
The following section presents results of the statistical analyses related to perceived telepresence, social
presence and self-presence of the three communication environments. In this analysis, hypotheses H10,
H11, and H12 were tested based on an one-way repeated measures of analysis of variances (ANOVA).
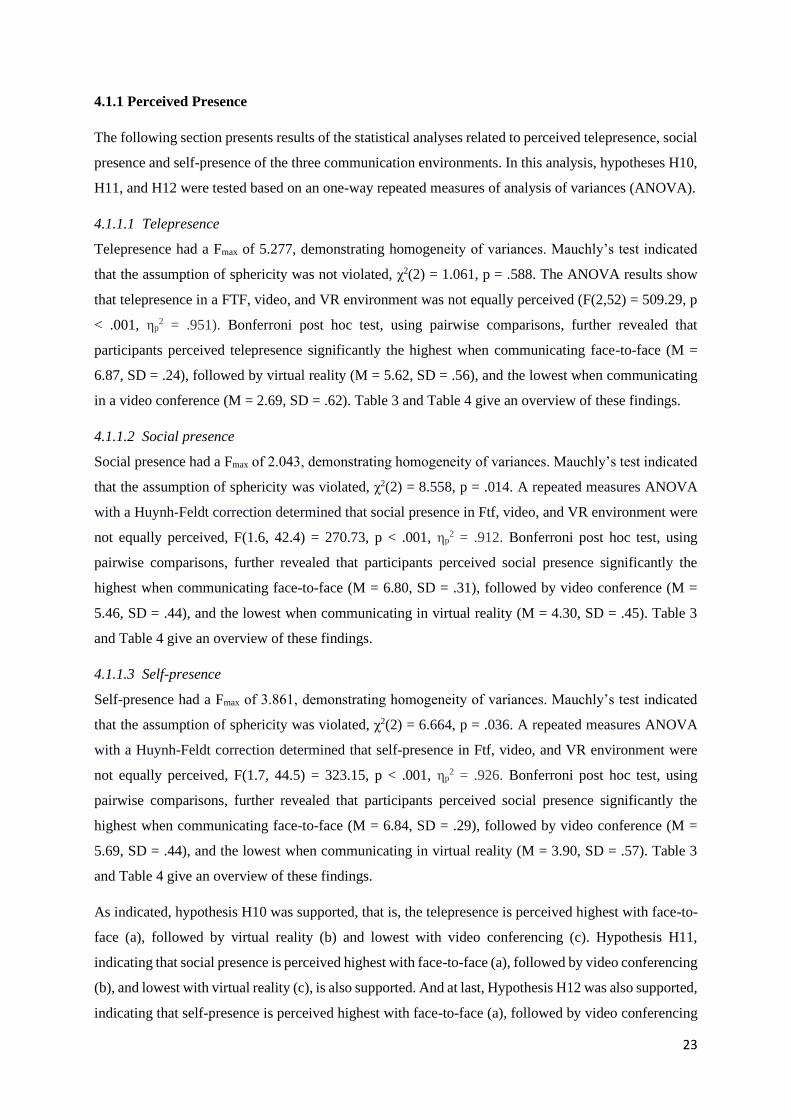
4.1.1.1 Telepresence
Telepresence had a Fmax of 5.277, demonstrating homogeneity of variances. Mauchly’s test indicated
that the assumption of sphericity was not violated, χ2(2) = 1.061, p = .588. The ANOVA results show
that telepresence in a FTF, video, and VR environment was not equally perceived (F(2,52) = 509.29, p
< .001, ηp2 = .951). Bonferroni post hoc test, using pairwise comparisons, further revealed that
participants perceived telepresence significantly the highest when communicating face-to-face (M =
6.87, SD = .24), followed by virtual reality (M = 5.62, SD = .56), and the lowest when communicating
in a video conference (M = 2.69, SD = .62). Table 3 and Table 4 give an overview of these findings.
4.1.1.2 Social presence
Social presence had a Fmax of 2.043, demonstrating homogeneity of variances. Mauchly’s test indicated
that the assumption of sphericity was violated, χ2(2) = 8.558, p = .014. A repeated measures ANOVA
with a Huynh-Feldt correction determined that social presence in Ftf, video, and VR environment were
not equally perceived, F(1.6, 42.4) = 270.73, p < .001, ηp2 = .912. Bonferroni post hoc test, using
pairwise comparisons, further revealed that participants perceived social presence significantly the
highest when communicating face-to-face (M = 6.80, SD = .31), followed by video conference (M =
5.46, SD = .44), and the lowest when communicating in virtual reality (M = 4.30, SD = .45). Table 3
and Table 4 give an overview of these findings.
4.1.1.3 Self-presence
Self-presence had a Fmax of 3.861, demonstrating homogeneity of variances. Mauchly’s test indicated
that the assumption of sphericity was violated, χ2(2) = 6.664, p = .036. A repeated measures ANOVA
with a Huynh-Feldt correction determined that self-presence in Ftf, video, and VR environment were
not equally perceived, F(1.7, 44.5) = 323.15, p < .001, ηp2 = .926. Bonferroni post hoc test, using
pairwise comparisons, further revealed that participants perceived social presence significantly the
highest when communicating face-to-face (M = 6.84, SD = .29), followed by video conference (M =
5.69, SD = .44), and the lowest when communicating in virtual reality (M = 3.90, SD = .57). Table 3
and Table 4 give an overview of these findings.
As indicated, hypothesis H10 was supported, that is, the telepresence is perceived highest with face-to-
face (a), followed by virtual reality (b) and lowest with video conferencing (c). Hypothesis H11,
indicating that social presence is perceived highest with face-to-face (a), followed by video conferencing
(b), and lowest with virtual reality (c), is also supported. And at last, Hypothesis H12 was also supported,
indicating that self-presence is perceived highest with face-to-face (a), followed by video conferencing
24
(b), and lowest with virtual reality (c). A summary of the results of the hypotheses testing section can
be found in Table 10.
4.1.2 Communication quality
A one-way repeated measures analysis of variance (ANOVA) was performed for the group
communication quality variables. Table 3 represents the results of the within-subject test and Table 4
represents the descriptive statistics and the pairwise comparison test.
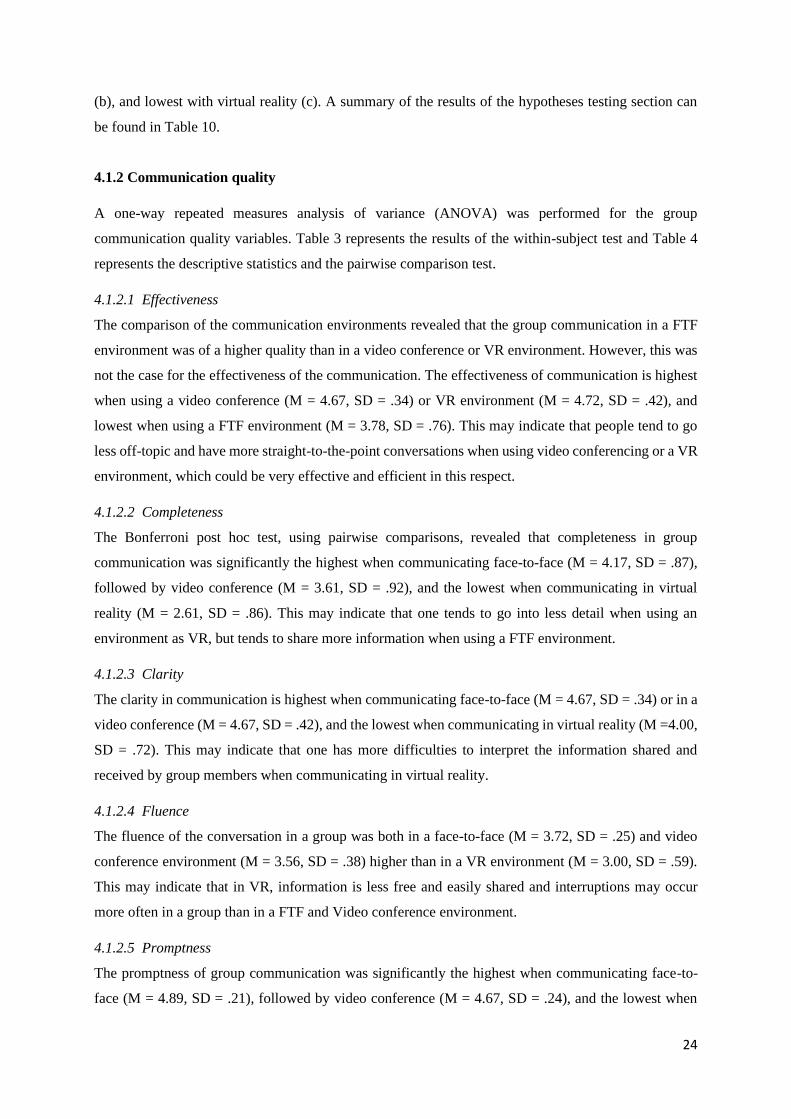
4.1.2.1 Effectiveness
The comparison of the communication environments revealed that the group communication in a FTF
environment was of a higher quality than in a video conference or VR environment. However, this was
not the case for the effectiveness of the communication. The effectiveness of communication is highest
when using a video conference (M = 4.67, SD = .34) or VR environment (M = 4.72, SD = .42), and
lowest when using a FTF environment (M = 3.78, SD = .76). This may indicate that people tend to go
less off-topic and have more straight-to-the-point conversations when using video conferencing or a VR
environment, which could be very effective and efficient in this respect.
4.1.2.2 Completeness
The Bonferroni post hoc test, using pairwise comparisons, revealed that completeness in group
communication was significantly the highest when communicating face-to-face (M = 4.17, SD = .87),
followed by video conference (M = 3.61, SD = .92), and the lowest when communicating in virtual
reality (M = 2.61, SD = .86). This may indicate that one tends to go into less detail when using an
environment as VR, but tends to share more information when using a FTF environment.
4.1.2.3 Clarity
The clarity in communication is highest when communicating face-to-face (M = 4.67, SD = .34) or in a
video conference (M = 4.67, SD = .42), and the lowest when communicating in virtual reality (M =4.00,
SD = .72). This may indicate that one has more difficulties to interpret the information shared and
received by group members when communicating in virtual reality.
4.1.2.4 Fluence
The fluence of the conversation in a group was both in a face-to-face (M = 3.72, SD = .25) and video
conference environment (M = 3.56, SD = .38) higher than in a VR environment (M = 3.00, SD = .59).
This may indicate that in VR, information is less free and easily shared and interruptions may occur
more often in a group than in a FTF and Video conference environment.
4.1.2.5 Promptness
The promptness of group communication was significantly the highest when communicating face-to-
face (M = 4.89, SD = .21), followed by video conference (M = 4.67, SD = .24), and the lowest when
25
communicating in virtual reality (M = 3.17, SD = .68). This may indicate that in a VR environment
communication is not as quick as in a FTF or video conference environment.
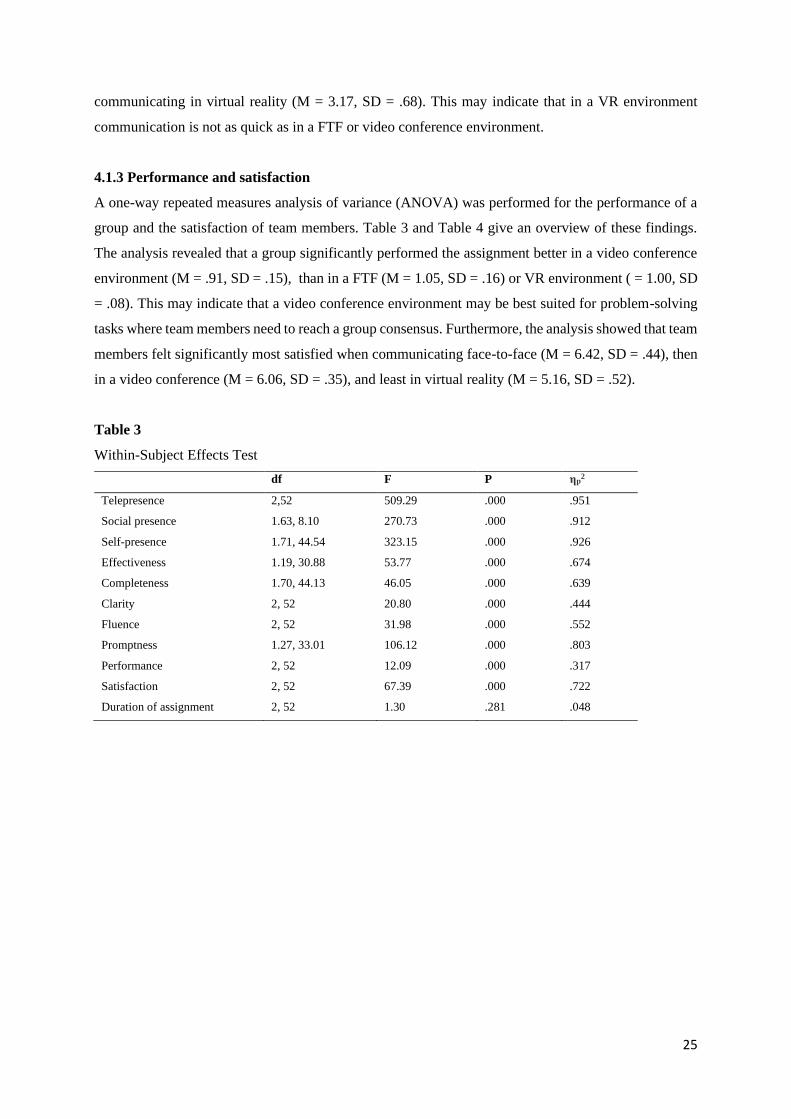
4.1.3 Performance and satisfaction
A one-way repeated measures analysis of variance (ANOVA) was performed for the performance of a
group and the satisfaction of team members. Table 3 and Table 4 give an overview of these findings.
The analysis revealed that a group significantly performed the assignment better in a video conference
environment (M = .91, SD = .15), than in a FTF (M = 1.05, SD = .16) or VR environment ( = 1.00, SD
= .08). This may indicate that a video conference environment may be best suited for problem-solving
tasks where team members need to reach a group consensus. Furthermore, the analysis showed that team
members felt significantly most satisfied when communicating face-to-face (M = 6.42, SD = .44), then
in a video conference (M = 6.06, SD = .35), and least in virtual reality (M = 5.16, SD = .52).
Table 3
Within-Subject Effects Test
df F P ηp2
Telepresence 2,52 509.29 .000 .951
Social presence 1.63, 8.10 270.73 .000 .912
Self-presence 1.71, 44.54 323.15 .000 .926
Effectiveness 1.19, 30.88 53.77 .000 .674
Completeness 1.70, 44.13 46.05 .000 .639
Clarity 2, 52 20.80 .000 .444
Fluence 2, 52 31.98 .000 .552
Promptness 1.27, 33.01 106.12 .000 .803
Performance 2, 52 12.09 .000 .317
Satisfaction 2, 52 67.39 .000 .722
Duration of assignment 2, 52 1.30 .281 .048
26
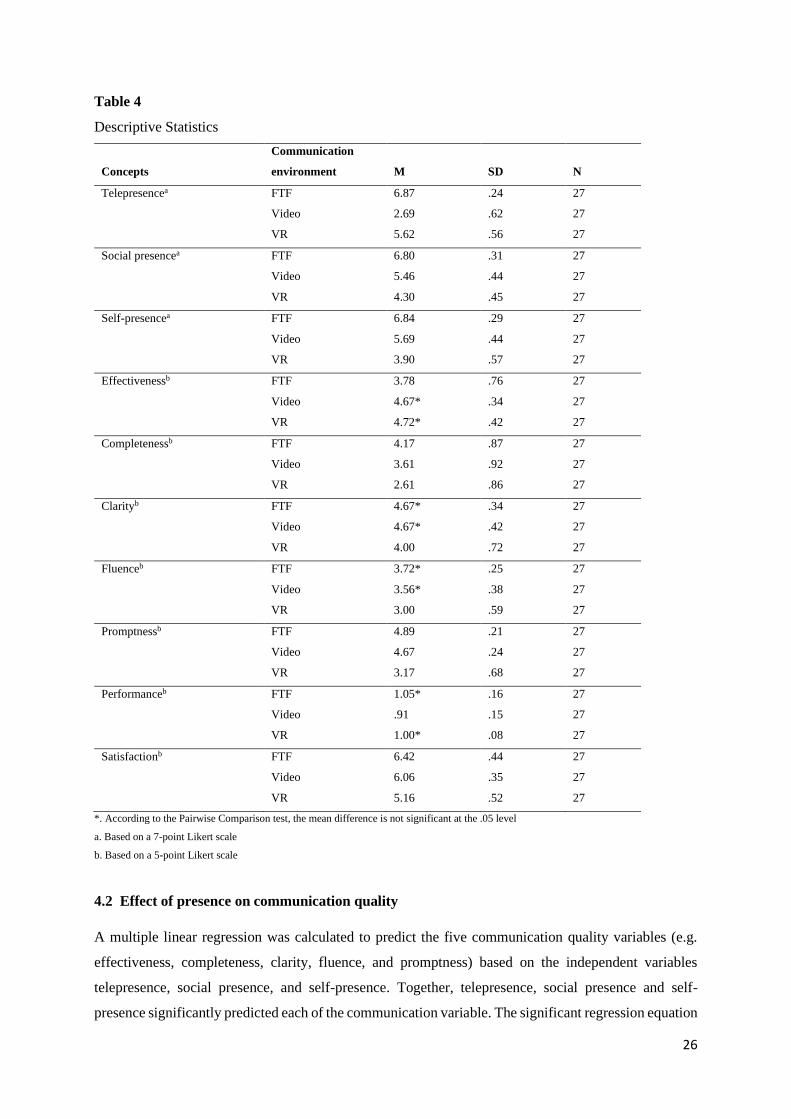
Table 4
Descriptive Statistics
Concepts
Communication
environment
M
SD
N
Telepresencea FTF 6.87 .24 27
Video 2.69 .62 27
VR 5.62 .56 27
Social presencea FTF 6.80 .31 27
Video 5.46 .44 27
VR 4.30 .45 27
Self-presencea FTF 6.84 .29 27
Video 5.69 .44 27
VR 3.90 .57 27
Effectivenessb FTF 3.78 .76 27
Video 4.67* .34 27
VR 4.72* .42 27
Completenessb FTF 4.17 .87 27
Video 3.61 .92 27
VR 2.61 .86 27
Clarityb FTF 4.67* .34 27
Video 4.67* .42 27
VR 4.00 .72 27
Fluenceb FTF 3.72* .25 27
Video 3.56* .38 27
VR 3.00 .59 27
Promptnessb FTF 4.89 .21 27
Video 4.67 .24 27
VR 3.17 .68 27
Performanceb FTF 1.05* .16 27
Video .91 .15 27
VR 1.00* .08 27
Satisfactionb FTF 6.42 .44 27
Video 6.06 .35 27
VR 5.16 .52 27
*. According to the Pairwise Comparison test, the mean difference is not significant at the .05 level
a. Based on a 7-point Likert scale
b. Based on a 5-point Likert scale
4.2 Effect of presence on communication quality
A multiple linear regression was calculated to predict the five communication quality variables (e.g.
effectiveness, completeness, clarity, fluence, and promptness) based on the independent variables
telepresence, social presence, and self-presence. Together, telepresence, social presence and self-
presence significantly predicted each of the communication variable. The significant regression equation
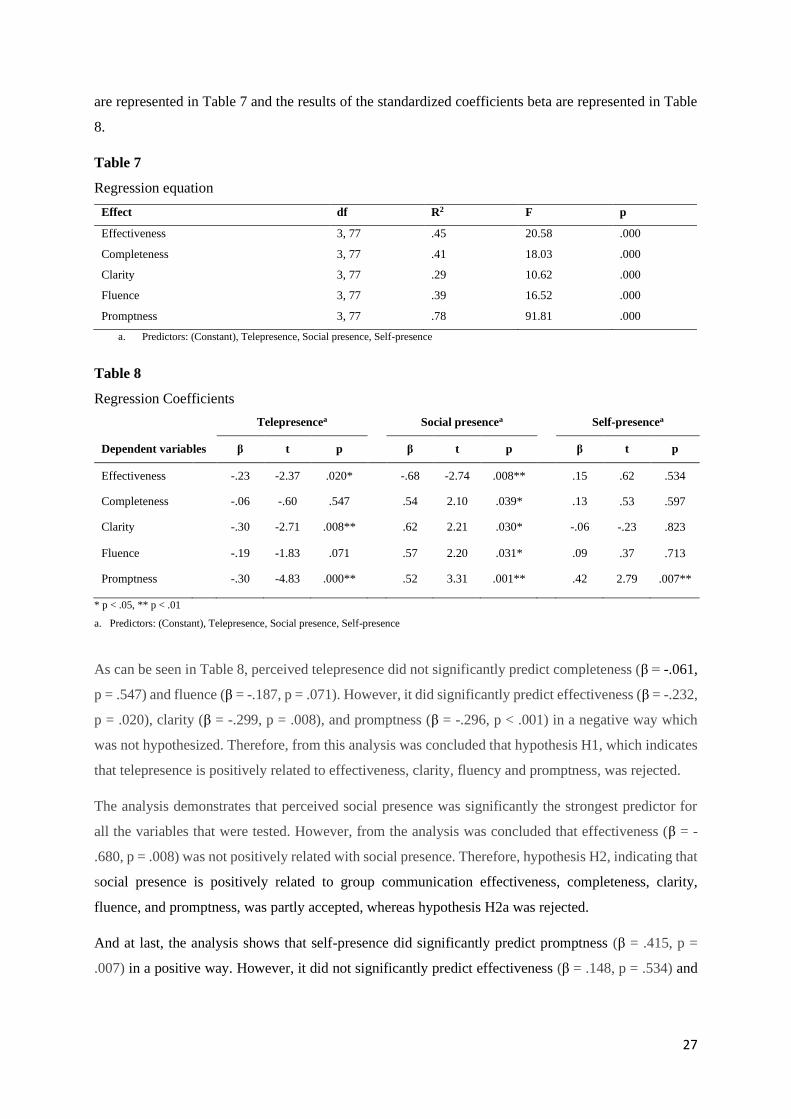
27
are represented in Table 7 and the results of the standardized coefficients beta are represented in Table
8.
Table 7
Regression equation
Effect df R2 F p
Effectiveness 3, 77 .45 20.58 .000
Completeness 3, 77 .41 18.03 .000
Clarity 3, 77 .29 10.62 .000
Fluence 3, 77 .39 16.52 .000
Promptness 3, 77 .78 91.81 .000
a. Predictors: (Constant), Telepresence, Social presence, Self-presence
Table 8
Regression Coefficients
Telepresencea Social presencea Self-presencea
Dependent variables β t p β t p β t p
Effectiveness -.23 -2.37 .020* -.68 -2.74 .008** .15 .62 .534
Completeness -.06 -.60 .547 .54 2.10 .039* .13 .53 .597
Clarity -.30 -2.71 .008** .62 2.21 .030* -.06 -.23 .823
Fluence -.19 -1.83 .071 .57 2.20 .031* .09 .37 .713
Promptness -.30 -4.83 .000** .52 3.31 .001** .42 2.79 .007**
* p < .05, ** p < .01
a. Predictors: (Constant), Telepresence, Social presence, Self-presence
As can be seen in Table 8, perceived telepresence did not significantly predict completeness (β = -.061,
p = .547) and fluence (β = -.187, p = .071). However, it did significantly predict effectiveness (β = -.232,
p = .020), clarity (β = -.299, p = .008), and promptness (β = -.296, p < .001) in a negative way which
was not hypothesized. Therefore, from this analysis was concluded that hypothesis H1, which indicates
that telepresence is positively related to effectiveness, clarity, fluency and promptness, was rejected.
The analysis demonstrates that perceived social presence was significantly the strongest predictor for
all the variables that were tested. However, from the analysis was concluded that effectiveness (β = -
.680, p = .008) was not positively related with social presence. Therefore, hypothesis H2, indicating that
social presence is positively related to group communication effectiveness, completeness, clarity,
fluence, and promptness, was partly accepted, whereas hypothesis H2a was rejected.
And at last, the analysis shows that self-presence did significantly predict promptness (β = .415, p =
.007) in a positive way. However, it did not significantly predict effectiveness (β = .148, p = .534) and
28
clarity (β = -.060, p = .823) as was assumed in hypothesis H3. Therefore, hypothesis H3c was accepted
and hypothesis H3a and H3b were rejected.
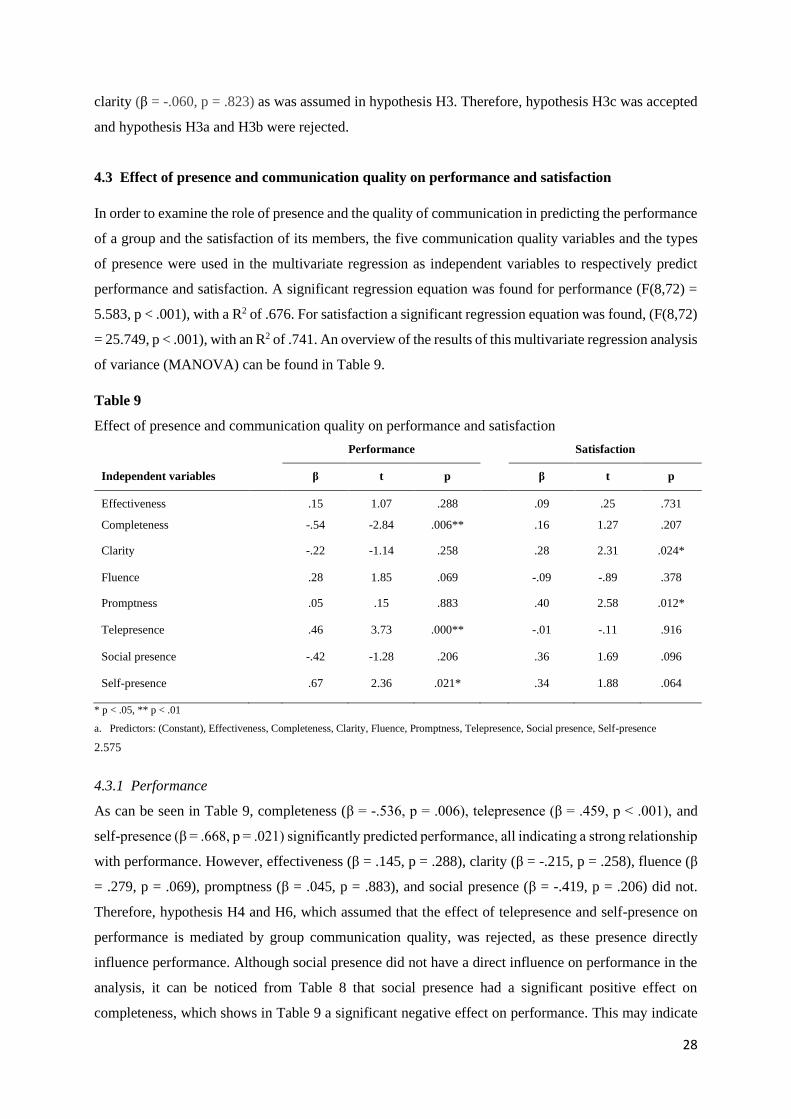
4.3 Effect of presence and communication quality on performance and satisfaction
In order to examine the role of presence and the quality of communication in predicting the performance
of a group and the satisfaction of its members, the five communication quality variables and the types
of presence were used in the multivariate regression as independent variables to respectively predict
performance and satisfaction. A significant regression equation was found for performance (F(8,72) =
5.583, p < .001), with a R2 of .676. For satisfaction a significant regression equation was found, (F(8,72)
= 25.749, p < .001), with an R2 of .741. An overview of the results of this multivariate regression analysis
of variance (MANOVA) can be found in Table 9.
Table 9
Effect of presence and communication quality on performance and satisfaction
Performance Satisfaction
Independent variables β t p β t p
Effectiveness
.15 1.07 .288 .09 .25 .731
Completeness -.54 -2.84 .006** .16 1.27 .207
Clarity -.22 -1.14 .258 .28 2.31 .024*
Fluence .28 1.85 .069 -.09 -.89 .378
Promptness .05 .15 .883 .40 2.58 .012*
Telepresence .46 3.73 .000** -.01 -.11 .916
Social presence -.42 -1.28 .206 .36 1.69 .096
Self-presence .67 2.36 .021* .34 1.88 .064
* p < .05, ** p < .01
a. Predictors: (Constant), Effectiveness, Completeness, Clarity, Fluence, Promptness, Telepresence, Social presence, Self-presence
2.575
4.3.1 Performance
As can be seen in Table 9, completeness (β = -.536, p = .006), telepresence (β = .459, p < .001), and
self-presence (β = .668, p = .021) significantly predicted performance, all indicating a strong relationship
with performance. However, effectiveness (β = .145, p = .288), clarity (β = -.215, p = .258), fluence (β
= .279, p = .069), promptness (β = .045, p = .883), and social presence (β = -.419, p = .206) did not.
Therefore, hypothesis H4 and H6, which assumed that the effect of telepresence and self-presence on
performance is mediated by group communication quality, was rejected, as these presence directly
influence performance. Although social presence did not have a direct influence on performance in the
analysis, it can be noticed from Table 8 that social presence had a significant positive effect on
completeness, which shows in Table 9 a significant negative effect on performance. This may indicate
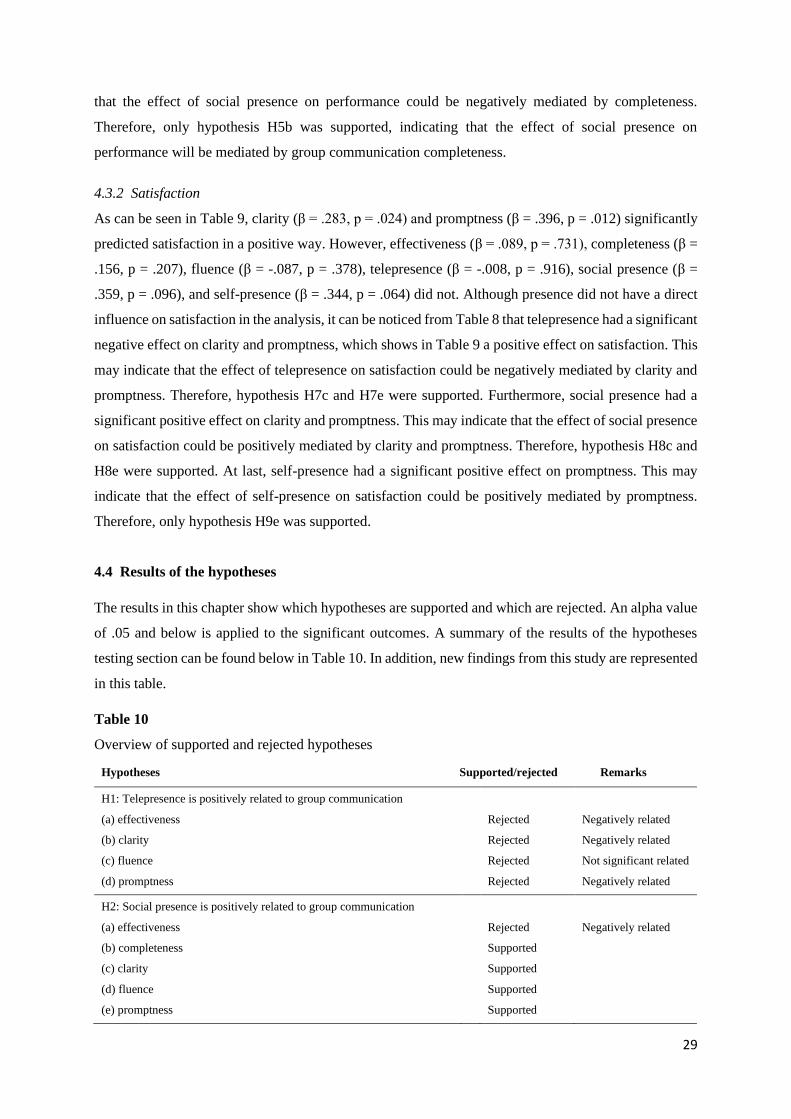
29
that the effect of social presence on performance could be negatively mediated by completeness.
Therefore, only hypothesis H5b was supported, indicating that the effect of social presence on
performance will be mediated by group communication completeness.
4.3.2 Satisfaction
As can be seen in Table 9, clarity (β = .283, p = .024) and promptness (β = .396, p = .012) significantly
predicted satisfaction in a positive way. However, effectiveness (β = .089, p = .731), completeness (β =
.156, p = .207), fluence (β = -.087, p = .378), telepresence (β = -.008, p = .916), social presence (β =
.359, p = .096), and self-presence (β = .344, p = .064) did not. Although presence did not have a direct
influence on satisfaction in the analysis, it can be noticed from Table 8 that telepresence had a significant
negative effect on clarity and promptness, which shows in Table 9 a positive effect on satisfaction. This
may indicate that the effect of telepresence on satisfaction could be negatively mediated by clarity and
promptness. Therefore, hypothesis H7c and H7e were supported. Furthermore, social presence had a
significant positive effect on clarity and promptness. This may indicate that the effect of social presence
on satisfaction could be positively mediated by clarity and promptness. Therefore, hypothesis H8c and
H8e were supported. At last, self-presence had a significant positive effect on promptness. This may
indicate that the effect of self-presence on satisfaction could be positively mediated by promptness.
Therefore, only hypothesis H9e was supported.
4.4 Results of the hypotheses
The results in this chapter show which hypotheses are supported and which are rejected. An alpha value
of .05 and below is applied to the significant outcomes. A summary of the results of the hypotheses
testing section can be found below in Table 10. In addition, new findings from this study are represented
in this table.
Table 10
Overview of supported and rejected hypotheses
Hypotheses Supported/rejected Remarks
H1: Telepresence is positively related to group communication
(a) effectiveness
(b) clarity
(c) fluence
(d) promptness
Rejected
Rejected
Rejected
Rejected
Negatively related
Negatively related
Not significant related
Negatively related
H2: Social presence is positively related to group communication
(a) effectiveness
(b) completeness
(c) clarity
(d) fluence
(e) promptness
Rejected
Supported
Supported
Supported
Supported
Negatively related
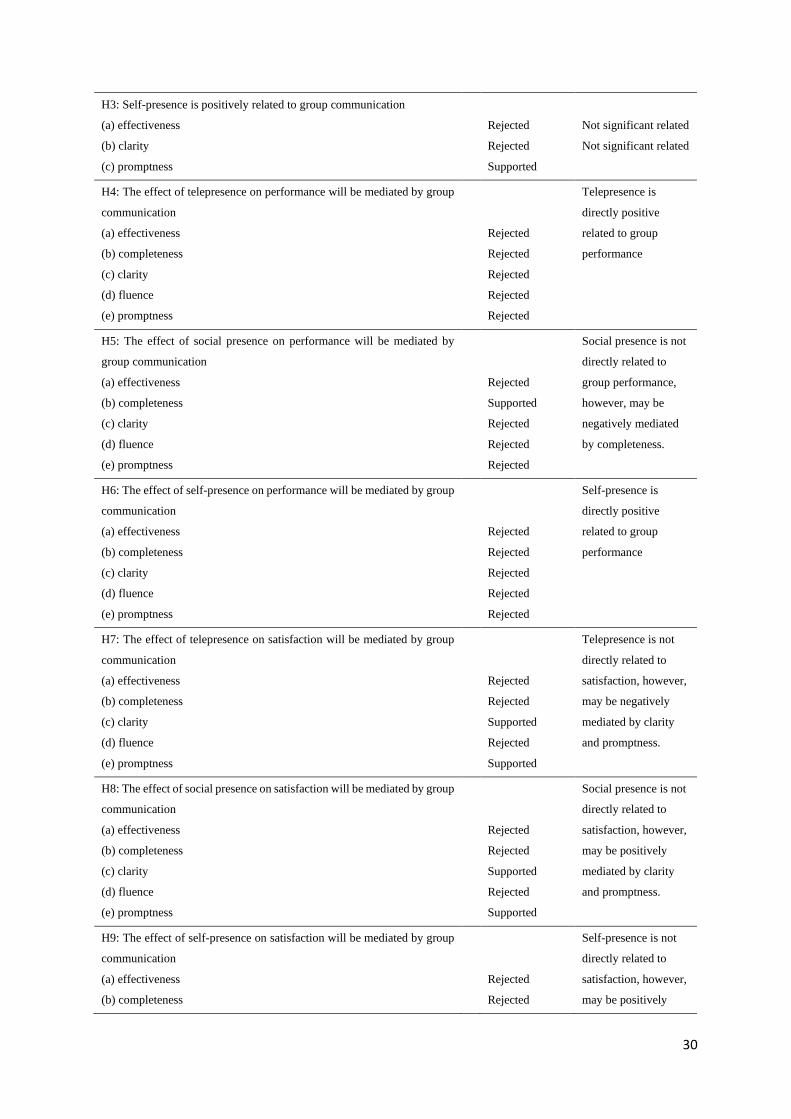
30
H3: Self-presence is positively related to group communication
(a) effectiveness
(b) clarity
(c) promptness
Rejected
Rejected
Supported
Not significant related
Not significant related
H4: The effect of telepresence on performance will be mediated by group
communication
(a) effectiveness
(b) completeness
(c) clarity
(d) fluence
(e) promptness
Rejected
Rejected
Rejected
Rejected
Rejected
Telepresence is
directly positive
related to group
performance
H5: The effect of social presence on performance will be mediated by
group communication
(a) effectiveness
(b) completeness
(c) clarity
(d) fluence
(e) promptness
Rejected
Supported
Rejected
Rejected
Rejected
Social presence is not
directly related to
group performance,
however, may be
negatively mediated
by completeness.
H6: The effect of self-presence on performance will be mediated by group
communication
(a) effectiveness
(b) completeness
(c) clarity
(d) fluence
(e) promptness
Rejected
Rejected
Rejected
Rejected
Rejected
Self-presence is
directly positive
related to group
performance
H7: The effect of telepresence on satisfaction will be mediated by group
communication
(a) effectiveness
(b) completeness
(c) clarity
(d) fluence
(e) promptness
Rejected
Rejected
Supported
Rejected
Supported
Telepresence is not
directly related to
satisfaction, however,
may be negatively
mediated by clarity
and promptness.
H8: The effect of social presence on satisfaction will be mediated by group
communication
(a) effectiveness
(b) completeness
(c) clarity
(d) fluence
(e) promptness
Rejected
Rejected
Supported
Rejected
Supported
Social presence is not
directly related to
satisfaction, however,
may be positively
mediated by clarity
and promptness.
H9: The effect of self-presence on satisfaction will be mediated by group
communication
(a) effectiveness
(b) completeness
Rejected
Rejected
Self-presence is not
directly related to
satisfaction, however,
may be positively
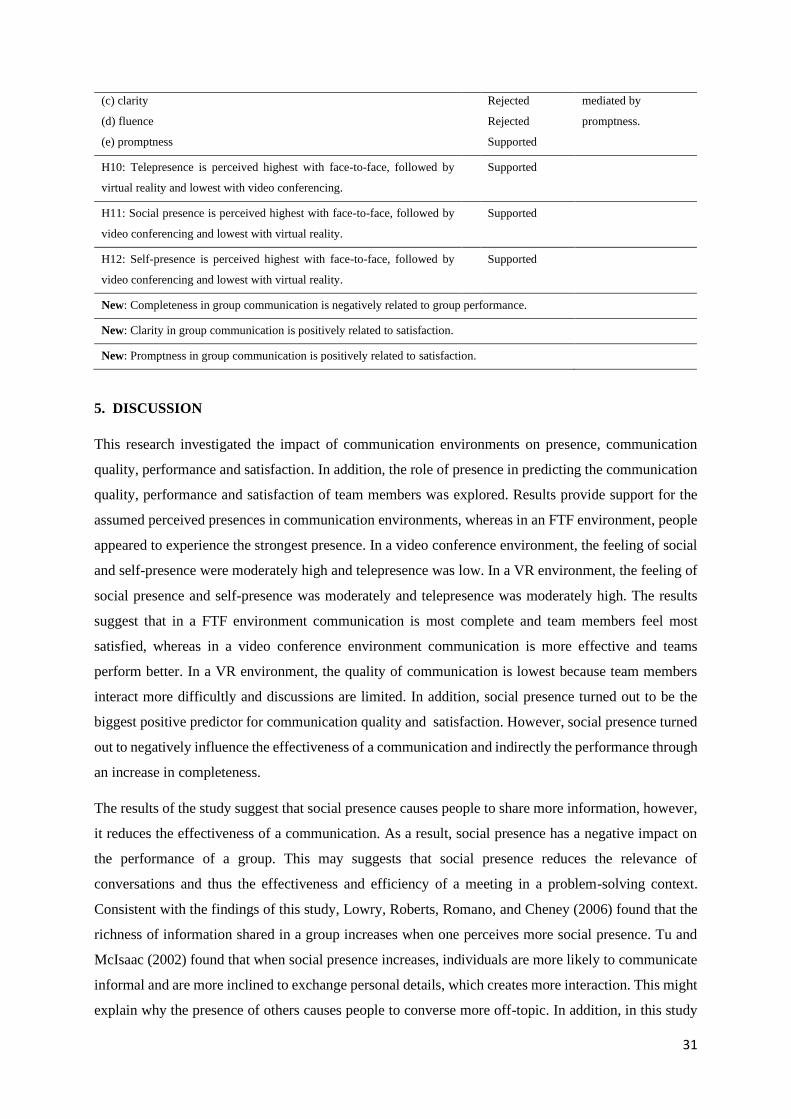
31
(c) clarity
(d) fluence
(e) promptness
Rejected
Rejected
Supported
mediated by
promptness.
H10: Telepresence is perceived highest with face-to-face, followed by
virtual reality and lowest with video conferencing.
Supported
H11: Social presence is perceived highest with face-to-face, followed by
video conferencing and lowest with virtual reality.
Supported
H12: Self-presence is perceived highest with face-to-face, followed by
video conferencing and lowest with virtual reality.
Supported
New: Completeness in group communication is negatively related to group performance.
New: Clarity in group communication is positively related to satisfaction.
New: Promptness in group communication is positively related to satisfaction.
5. DISCUSSION
This research investigated the impact of communication environments on presence, communication
quality, performance and satisfaction. In addition, the role of presence in predicting the communication
quality, performance and satisfaction of team members was explored. Results provide support for the
assumed perceived presences in communication environments, whereas in an FTF environment, people
appeared to experience the strongest presence. In a video conference environment, the feeling of social
and self-presence were moderately high and telepresence was low. In a VR environment, the feeling of
social presence and self-presence was moderately and telepresence was moderately high. The results
suggest that in a FTF environment communication is most complete and team members feel most
satisfied, whereas in a video conference environment communication is more effective and teams
perform better. In a VR environment, the quality of communication is lowest because team members
interact more difficultly and discussions are limited. In addition, social presence turned out to be the
biggest positive predictor for communication quality and satisfaction. However, social presence turned
out to negatively influence the effectiveness of a communication and indirectly the performance through
an increase in completeness.
The results of the study suggest that social presence causes people to share more information, however,
it reduces the effectiveness of a communication. As a result, social presence has a negative impact on
the performance of a group. This may suggests that social presence reduces the relevance of
conversations and thus the effectiveness and efficiency of a meeting in a problem-solving context.
Consistent with the findings of this study, Lowry, Roberts, Romano, and Cheney (2006) found that the
richness of information shared in a group increases when one perceives more social presence. Tu and
McIsaac (2002) found that when social presence increases, individuals are more likely to communicate
informal and are more inclined to exchange personal details, which creates more interaction. This might
explain why the presence of others causes people to converse more off-topic. In addition, in this study
32
was observed that more humour was used when social presence was high. A study of Polhemus et al.
(2001) confirms this observation, as they also described indicators of social presence, in which social
sharing, self-disclosure and humor were three of these indicators.
In contrast to the findings of this study, Lowry et al. (2006) argued that low social presence may reduce
group members' performance by causing individual comments or feedback to be ignored or delayed
altogether. This current study in fact showed that social presence is not automatically beneficial for the
performance of a group, as it can also cause excessive information sharing, which reduces the
effectiveness of a meeting. In addition, Robert and Dennis (2005) proposed that a medium can be so
rich that it becomes distracting or displaces focus away from a task. It is not only the richness of
communication that can reduce performance through social presence. Dennis et al. (2008) found that
the decline in performance can be related to evaluation apprehension that is reinforced by social presence
(Aiken et al., 1994; Nunamaker et al., 1991). Evaluation apprehension arises when individuals withhold
knowledge because they are concerned about being criticised by other individuals (Diehl & Stroebe,
1987; Lamm & Trommsdorff, 1973). Typically, this phenomenon is more pronounced in face-to-face
groups than in virtual groups (Valacich, George, Nunamaker, & Vogel, 1994). The information richness
and evaluation apprehension might explain the results of this study which suggest that the performance
of a group in a FTF environment is lower than in a video conference environment, which can be caused
by the perceived social presence in the communication environment.
Furthermore, the results of this study suggest that team members are most satisfied when they
communicate in a FTF environment, then video conference, and the least in a VR environment. This is
presumably attributed to perceived social presence and self-presence in an environment, which, in this
study, have found to contribute strongly to the promptness and clarity of a communication. The results
suggest that the rapid feedback and clear communication in an environment increases the satisfaction of
team members. One of the aspects of the immediacy principle that may affect communication
satisfaction is prompt feedback (Wegmann and McCauley, 2014). Plante and Asselin (2014) found that
timely feedback, clarification of problems, and responsiveness in online communication were all likely
to increase the immediacy impact for communication satisfaction in a virtual space. Nonverbal
interactions such as providing fast or modest feedback have also been shown to improve social presence
and stimulate immediacy in the virtual environment, resulting in communication satisfaction (Zydney,
2014). Moreover, Cunningham (2015) has disputed that the use of other features such as avatars to
supplement social presence in a virtual communication environment might not induce closeness or
satisfaction, but rather facilitate more rapid feedback from interactants which may contribute to an
immediacy effect towards achieving satisfaction. Karahoca and Kurnaz, (2016) disputed the concept
that virtual speakers perceive communication satisfaction when they get timely responses, however they
did add that willingness to respond on time can be strengthened if the messages are clear and sent by
familiar persons.
33
In addition, previous studies support the findings of this study suggesting that communication clarity
positively influences satisfaction. According to Ocker (2002), the absence of certain social cues, such
as touch, gestures, voice intonation and facial expressions in virtual environments, can affect the
satisfaction of virtual teams. According to Greenberg et al. (2007) a miscommunication resulting from
a lack of social presence can affect a person's satisfaction in a team. Musa, Nadianatra and Pollard (2004)
argued that increased velocity in feedback, decreased difficulty in communication, and increased
common ground would be associated with a higher level of satisfaction. Dennis et al. (2008) pointed out
the concept of Transmission Velocity, defined as the speed of conveying a message and associated with
prompt feedback, enhances understanding by allowing misleading or misinterpreted information to be
corrected immediately (Dennis & Valacich, 1999). Since transmission velocity allows a better shared
focus, it facilitates the achievement of satisfaction in a team (Dennis et al., 2008). Previous studies
therefore support the findings of this study.
And last, the findings of this study suggest that telepresence has a negative impact on effectiveness,
clarity and promptness in group communication. In addition, it indirectly contributes negatively to
satisfaction. A presumption was made that when one is more consciously aware that one is looking at a
screen instead of having the feeling that one is present in a communication environment, one starts to
communicate more effective, clearer and faster. In other words, when one experiences a detachment
from the communication environment, one will talk less off-topic and seek to communicate more clearly.
These findings contradict previous studies on telepresence and communication. According to Pelet, Ettis
and Cowart (2017), the more users are engaged and feel present in the mediated simulated world, the
more likely they are to concentrate, enjoy, feel challenged, feel in control and show interest.
Furthermore, Finneran and Zhang (2003) argued that telepresence is an important factor in helping an
individual to stay concentrated on the task, thereby decreasing distraction and off-topic communication.
However, Finneran and Zhang based their findings on previous research on the Flow theory of
Csikszentmihalyi (1988), which analysed different tasks such as chess playing and mountain climbing.
These tasks cause a person to lose themselves completely in the moment, which increases concentration.
However, the problem-solving tasks used in this study required less attention from the participants,
which may have caused them to move less into a flow state. Therefore, the differences in tasks may be
a reason why the findings of this study deviate from expectations.
5.1 Limitations and future research
Even though this study has offered several insights into the relationship between presence,
communication quality, performance and satisfaction, several limitations need to be considered when
interpreting the results and giving incentives for future studies on this related topic.
34
First, it is necessary to mention that one has to be cautious with the interpretation and generalization of
the results. The experiments of this study took place at a time when Covid-19 interfered with daily life.
As a result, some measures had to be taken to allow the experiments to continue. It was therefore not
possible to conduct the experiments with a large group size. This study was restricted to nine small
groups containing three participants per group.. The size of a group could affect a communication,
performance and satisfaction. Past research has demonstrated that group size is negatively linked to the
production of ideas (Gallupe et al., 1992; Valacich et al., 1995) and positively linked to group conflicts
(Steiner, 1972; Valacich et al., 1995). Substantially, the communication process losses have shown to
increase with large group sizes (Gallupe et al., 1992; Hackman & Vidmar, 1970; Valacich et al., 1995).
Furthermore, production blocking usually arises in larger groups (Gallupe, Cooper, & Grisé, 1994),
because individuals are constrained to speak one after the other; the time to assess each other's ideas is
then limited (Diehl & Stroebe, 1987). However, other studies related to group size have shown that
virtual environments can help large groups - particularly in terms of brainstorming productivity (Dennis,
Heminger, Nunamaker, & Vogel, 1990; Dennis & Valacich, 1993; Gallupe et al., 1992; Valacich,
Dennis, & Nunamaker, 1992; Valacich et al., 1995). When the size of a group increases, nearly all
groups experience some deterioration in group communication processes, even with virtual support
(Chidambaram & Tung, 2005).
In addition, a limitation of this study is that almost all participant were women. This may have affected
the results. Consistent with Social Role Theory (Eagly, 1987), it is assumed that men are agentic (i.e.
independent and task-oriented). In contrast, women are assumed to be more communal (i.e. focused on
building connections within social interactions). This may suggest that men communicate more
effectively than women. Academic studies on psychological gender differences have demonstrated that
women use communication as a means to strengthen social bonds and develop connections, whereas
men use communication to express power and deliver concrete results (Leaper, 1991; Maltz & Borker,
1982; Wood, 1996; Mason, 1994). Women tend to use more expressive, cautious and polite form of
language compared to men, particularly in conflict settings (Basow & Rubfield, 2003). Contrary, men
are more likely to provide problem solving solutions to prevent unnecessary discussion of interpersonal
problems (Baslow & Rubenfield, 2003). These differences in communication of gender might have
affected the results of the quality of communication and the performance of this study.
Moreover, in this study, AltSpace VR software was used. This is a software that facilitates virtual
communication environments. Because this software determines the visual characteristics of users, i.e.
the avatars, but also the environment in which one finds himself, this has an influence on the presence
that one experiences. In this study, the results of the experienced presence from AltSpace VR are used
to provide a general picture for virtual environments. However, it is possible that if this research were
to take place in a different VR software, the presence and perhaps also the communication quality,
performance and satisfaction could be different from that measured in AltSpace VR. Communication
35
software such as Facebook spaces, Rec Room, VR chat and MeetinVR offer a way to represent
participants as artificial avatars, which are non-realistic. This may be effective for some use-cases (e.g.
games), however, it can interrupt the immersion and presence in many different use-cases, such as
business meetings, family call and others. For this reason, there have been services that attempt to
portray users in a photorealistic manner (Gunkel, Dohmen, Stokking, & Niamut, 2019). These realistic
avatars include blinking, eye gazing and facial expressions. These features are essential to the quality of
communication in VR (Thies et al., 2018) Kang and Watt (2013) conducted research on visual and
behavioural realism of avatars, showing that higher levels of avatar realism increased perceived
communication richness and higher avatar anthropomorphism led to higher levels of psychological
copresence and communication satisfaction. It was further stated by Latoschik (2017) that a realistic
avatar elicits a significantly high acceptance of the virtual body to be one's own. Furthermore, Thies et
al. (2018) found that a realistic avatar of others appeared to improve one's perceptions of the altered own
body. They found that the presence of other people's avatars affects our self-perception in virtual reality.
Not only in the case of avatar realism, one’s perception of presence can increase, but also when the
visual realism of an environment become more advanced. Hvass (2017) suggests that when one is faced
with a more visually realistic environment, one perceives a stronger sense of presence. Some aspects of
realism, such as the inclusion of shadows and reflections tend to have a positive impact on
presence (Slater, Khanna, Mortensen, & Yu, 2009). As visual realism and photo-realistic avatars are
developing, it becomes interesting for future research to examine its role on perceived presence and
communication of a group.
In addition, this study did not take into account the external differences in communication environments.
For example, the face-to-face meetings took place in a conference room that did not resemble the
conference room used in virtual reality. Thus, there may be external variables in the different
environments that could have affect perceived presence, communication quality, performance or
satisfaction. As argued previously, the visual realism could affect one’s perceived presence in an virtual
reality environment. In addition, a study by Brager (2020) found that the amount of details and items in
a minimalist setting significantly impacted the participants' creative performance. Sommer (1969)
discovered that a warm or sociofugal environment of roses, books, vases, and other items increased
female participants' interaction rates. Furthermore, Chaikin, Derlega, and Miller (1976) observed that in
a soft room (i.e. picturewall, cushioned chairs, rugs, and soft lighting), higher levels of self-disclosure
was measured to others than when interacting in a hard room (cement walls and fluorescent lighting).
To overcome the influence of external variables, future research could make use of a 360 degree photo
in virtual reality in order to exactly copy a face-to-face communication environment and confront these
external variables that may influence perceived presence.
And lastly, observations were made of groups working together to solve a problem. As companies are
increasingly looking at how to implement business processes in virtual environments, it also becomes
36
very interesting for future research to investigate how virtual environments and presence affect
communication, performance, and satisfaction when teams perform other tasks outside of a problem-
solving context, such as daily stand-up meetings or creative meetings. In the literature, various theories
on the effectiveness of communication media have been presented. Among these, two influential
perspectives are the social presence theory (Lombard & Ditton, 1997) and the media richness theory
(Daft, Lengel, & Trevino, 1987), which both describe communication media according to their
functionalities and consider a medium to be effective to the degree that its characteristics correspond to
the requirements of the task. Roberts, Lowry and Sweeney (2006) suggest that the performance of a
virtual group improves when the ability of a medium to convey social presence matches the social
requirements of a task. They argue that a problem-solving task may demand less social presence than
other tasks. This may explain the findings of this study, which showed that social presence negatively
influences the performance in a problem-solving assignment, as it did not fit the social needs of the task.
The role of presence in different types of tasks, such as creative meeting and daily stand-up meetings,
becomes therefore of great interest to study.
Creative teams can be defined as teams in which the production of new and useful ideas is fluid
(Amabile, 1983). Brainstorming events may be challenging for teams that are globally dispersed as
team members are no longer co-located and lack a shared physical space to develop ideas. It is argued
that the feeling of co-presence will facilitate communication and knowledge sharing between the team
members (Appel-Meulenbroek, 2010). According to Chandra and Leenders (2012), the concept of co-
presence, or working in a shared space, is linked to the creativity of a team. In addition, Bhagwatwar,
Massey, and Dennis (2013) showed that virtual environments can assist a team in its brainstorming
process by fostering creativity and engaging the members as they perform the task. Hidden technology,
as a result of telepresence, improves not only success but also commitment, inspiration, satisfaction, and
imagination (Roberts & Heldal, 2006). According to Waterworth (2001), presence aids in the
development of imaginative perceptions that can elicit strong emotions. This may have an effect on
social creativity. Furthermore, Uziel (2010) found that individuals who perceived a high social presence
had a relatively more fluid flow of ideas. Finally, the concept of avatars innovation (Kohler et al., 2011)
links avatars as self-representations of users to open innovation in virtual teams (Merrick, Gu, & Wang,
2011). These findings may indicate that teams are more creative and thus effective when the perception
of telepresence, social presence and self-presence is high.
However, a meeting that is expected to be effective with less presence is a stand-up meeting. A daily
stand-up meeting is characterised by its speed and high energy, which support the goal of establishing
focus in a meeting (Stray, Moe, & Bergersen, 2017). Long meetings with low energy tend to distract,
which is not effective for daily stand-up meetings. According to Yip (2006), there should be no
domination in a stand-up meeting. Due to the limited time available, everybody must
concisely communicate important information. Therefore, effectiveness of a communication is an
37
important aspect for daily stand-up meetings (Andriyani, 2017). According to Diehl and Stroebe (1987),
social presence can lead to production blockage, which happens when a person is busy listening to other
group members, especially when one speaker dominates the interaction or takes too long, and therefore
cannot express his or her ideas. Tu and McIsaac (2002) found that when social presence increases,
people tend to be more informal and are more willing to share personal information, thereby causing
people to converse more off-topic. In addition, the results of this study suggest that telepresence and
social presence negatively influence effective communication. These findings may indicate that teams
do not need high telepresence and social presence in order to achieve effective stand-up meetings. Future
research should explore the role of presence on communication, performance, and satisfaction for
different types of tasks.
REFERENCES
Aiken, M., Krosp, J., Shirani, A., & Martin, J. (1994). Electronic brainstorming in small and large
groups. Information & Management, 27(3), 141-149.
Akkirman, A., Harris, L. (2005). Organizational communication satisfaction in the virtual workplace.
Journal of Management Development, 24(5), 397-409
Amabile, T.M. (1983). The social psychology of creativity: A componential conceptualization. Journal
of Personality and Social Psychology, 45(2), 357-376.
Andriyani, Y. (2017, May). Knowledge Management and Reflective Practice in Daily Stand-Up and
Retrospective Meetings. International Conference on Agile Software Development, 24, 285-291.
Appel-Meulenbroek, R. (2010). Knowledge sharing through co-presence: added value of facilities.
Facilities, 28(3), 189-205.
Armstrong, D.J., & Cole, P. (2002). Managing distances and differences in geographically work groups.
In P.J. Hinds, & S. Kiesler (Eds.), Distributed Work (pp. 167-186). Cambridge, MA: The MIT
Press.
Aymerich-Franch, L., Karutz, C., & Bailenson, N. (2012). Effects of facial and voice similarity on
presence in a public speaking virtual environment. Proceedings of the International Society for
Presence Research Annual Conference, 5(2), 234-252.
Baños R., Botella C., Alcañiz, V., Guerrero B., Rey. B (2005). Immersion and Emotion: Their Impact
on the Sense of Presence. Cyber Psychology & Behaviour, 7,6, 123-141. Doi:
https://doi.org/10.1089/cpb.2004.7.734
Baños, R. M., Botella, C., Alcañiz, M., Liaño, V., Guerrero, B., & Rey, B. (2004). Immersion and
emotion: their impact on the sense of presence. Cyberpsychology & behavior, 7(6), 734-741.
38
Baslow, S. A., & Rubenfeld, K. (2003). Troubles talk: Effects of gender and gender-typing. Sex Roles:
A Journal of Research, 48, 183-187.
Benbunan-Fich, R., Hiltz, S., Turoff, M. (2001). A comparative content analysis of face-to-face vs.
ALN-mediated teamwork. Paper presented at the Proceedings of the 34th Hawaii International
Conference on System Sciences
Bente, G., Rüggenberg, S., Krämer, N. C., and Eschenburg, F. (2008). Avatar-mediated networking:
increasing social presence and interpersonal trust in net-based collaborations. Human
Communication Resources, 34, 287–318. doi: 10.1111/j.1468-2958.2008.00322.x
Biocca, F. (1997). The cyborg's dilemma: progressive embodiment in virtual environments. Journal of
Computer-Mediated Communication, 3(2), 89-102 Doi: https://doi.org/10.1111/j.1083-
6101.1997.tb00070.x
Biocca, F. (2014). Connected to My Avatar: Effects of avatar embodiments on user cognitions,
behaviors, and self-construal. Social Computing and Social Media, 15,. 421-429
Biocca, F., Harms, C., & Burgoon, J. K. (2003). Toward a more robust theory and measure of social
presence: Review and suggested criteria. Presence: Teleoperators and Virtual Environments,
12, 456-480
Biocca, F., Levy, M. R. (1995). Communication in the Age of Virtual Reality.
Blascovich, J., Loomis, J., Beall, A. C., Swinth, K. R., Hoyt, C. L., and Bailenson, J. N. (2002).
Immersive virtual environment technology as a methodological tool for social psychology.
Journal of Psychology and Computers 13, 103–124. doi: 10.1207/S15327965PLI1302_01
Bos, N., Olson, J., Gergle, D., Olson, G., Wright, Z. (2002). Effects of four computer-mediated
communications channels on trust development. Proceedings of CHI, 135-140.
Brager, M.E.M. (2020) Less is more creativity : The possible influence of minimalist interior designs in
office environments on the creativity of millennials.
Budiu, R. (2018). Between-subjects vs within-subjects study design. World Leaders in Research-
Based User Experience. Retrieved from https://www.nngroup.com/articles/between-within-
subjects/
Burgoon, J. K. & Walther, J. B. (1990). Nonverbal expectancies and the evaluative consequences of
violations. Human Communication Research, 17(2), 232-265
Burgoon, J. K., Bonito, J., Ramirez, A., Kam, K., Dunbar, N. E., & Fischer, J. (2002). Testing the
interactivity principle: Effects of Mediation, Propinquity, and verbal and nonverbal modalities
in interpersonal interaction. Journal of Communication, 52(3), 657-677.
Burke, K., & Chidambaram, L. (1999). How much bandwidth is enough? A longitudinal examination
of media characteristics and group outcomes. MIS Quarterly, 23, 557-580.
Burke, K., Aytes, K., Chidabaram, L., & Johnson, J. (1999). A study of partially distributed work groups:
The impact of media, location, and time on perceptions and performance. Small Group Research,
30, 453-490.
39
Campbell, D. E. (1979). Interior office design and visitor response. Journal of Applied Psychology, 64,
648-653.
Chaikin, A. L., Derlega, V. J., & Miller, S. J. (1976). Effects of room environment on selfdisclosure in
a counseling analogue. Journal of Counseling Psychology, 23, 479-481.
Chandra, Y., & Leenders, M. (2012). User innovation and entrepreneurship in the virtual world: A study
of Second Life residents. Technovation, 32(7), 464–476. doi:10.1016/j.technovation.2012.02.002
Charness, G., Gneezy, U., Kuhn, M. (2012). Experimental methods: Between-subject and within-
subject design. Journal of Economic Behavior & Organization, 81(1), 1-8.
Chesney, T., Chuah, S., Dobele, A.R., & Hoffmann, R. (2017). Information richness and trust in
ecommerce: implications for services marketing. Journal of Services Marketing, 295-307.
Chidambaram, L. (1996). Relational development in computer-supported groups. MIS Quarterly,
20(1), 143–165.
Chidambaram, L., & Tung, L. L. (2005). Is out of sight, out of mind? An empirical study of social
loafing in technology-supported groups. Information Systems Research, 16(2), 149-160.
Christie, B. (1985). Human factors of information technology in the office. New York: John Wiley
Cohen, G., & Gibson, B. (2003). In the beginning: Introduction and framework. In C. B. Gibson & S.
G. Cohen (Eds.), Virtual teams that work: Creating conditions for virtual team effectiveness.
San Francisco: Jossey-Bass
Connaughton, S. L., & Daly, J. A. (2004). Leading from afar: Strategies for effectively leading virtual
teams. Virtual and collaborative teams: Process, technologies and practice. Florida, IGI Global
Connelly, C. and Turel, O. (2016). Effects of Team Emotional Authenticity on Virtual Team
Performance. Front. Psychology 7, 1336. doi: 10.3389/fpsyg.2016.01336
Cramton, C. (2001). The Mutual knowledge problem and its consequences for dispersed collaboration.
Journal of Organization Science, 12(1), 346-371
Csikszentmihalyi, M., 1988. The flow experience and human psychology. In: Csikszentmihalyi, M.,
Csikszentmihalyi, I.S. (Eds.), Optimal Experience: Psychological Studies of Flow in
Consciousness. Cambridge University Press, New York, 15–35.
Cunningham, J. M. (2015). Mechanizing People and Pedagogy: Establishing Social Presence in the
Online Classroom. Online Learning, 19(3), 34-47.
Daft, R. L. (2013). Information richness theory. Encyclopedia of Management Theory: Sage
Publications.
Daft, R.L., Lengel, R.H. and Trevino, L.K. (1987). Message equivocality, media selection, and manager
performance: implications for information systems. MIS Quarterly, 11(3), 355-366.
40
Deloitte. (2020). Remote Collaboration: Facing the challenges of COVID-19. Retrieved from
https://www2.deloitte.com/content/dam/Deloitte/de/Documents/human-capital/Remote-
Collaboration-COVID-19.pdf
Dennis, A. R., & Valacich, J. (1993). Computer brainstorms: More heads are better than one. Journal
of Applied Psychology, 78, 531-537
Dennis, A. R., Heminger, A. R., Nunamaker, J. F., Jr., & Vogel, D. R. (1990). Bringing automated
support to large groups: The Burr-Brown experience. Information & Management, 18(3), 111-
121.
Dennis, A.R., & Valacich, J.S. (1999). Rethinking media richness: Towards a theory of media
synchronicity. Proceedings of the 32nd Hawaii International Conference on System Sciences, 1,
1-10
Dennis, A.R., Fuller, R.M, & Valacich, J.S. (2008). Media, tasks, and communication processes: A
theory of media synchronicity. MIS Quarterly, 32(3), 575-600.
Dieck, T., Jung, T., Han, I. (2016). Mapping requirements for the wearable smart glasses augmented
reality museaum application. Journal of Hospitality and Tourism Technology, 7(3), 230-253.
Diehl, M., & Stroebe, W. (1987). Productivity loss in brainstorming groups: Toward the solution of a
riddle. Journal of Personality and Social Psychology, 53, 497-509.
Diehl, M., & Stroebe, W. (1987). Productivity loss in brainstorming groups: Toward the solution of a
riddle. Journal of Personality and Social Psychology, 53(3), 497–
509. https://doi.org/10.1037/0022-3514.53.3.497
Dodds, T. J., Mohler, B. J., Bülthoff, H. H. (2011). Talk to the virtual hands: Self-animated avatars
improve communication in head-mounted display virtual environments. PloS one, 6(10). 1-12
Dubé, L., & Robey, D. (2008). Surviving the paradoxes of virtual teamwork. Information Systems
Journal, 19(1), 3-20.
Eagly, A. H. (1987). Sex differences in social behavior: A social-role interpretation. Hillsdale, NJ:
Erlbaum.
Ekman, P., & Friesen, W. (1969). The repertoire of nonverbal behavior: Categories, origins, and coding.
Semiotica, 1, 49–98.
Eom, M.T. (2009). Cross-cultural virtual team and its key antecedents to success. The Journal of Applied
Business and Economics, 10, 1-14.
Esteban-Millat, I., Martínez-López, F., Luna, D., and Rodríguez-Ardura, C. (2014). The Concept of
Flow in Online Consumer Behavior. Handbook of Strategic e-business management. 371-402
41
Fägersten, K. B. (2010). Using discourse analysis to assess social co-presence in the video conference
environment. Journal of Communication, 42(5). 1-19
Finneran, C. & Zhang, P. (2003). A person–artefact–task (PAT) model of flow antecedents in
computer-mediated environments. International Journal of Human-Computer Studies, 59(1),
475-496. doi: 10.1016/S1071-5819(03)00112-5.
Flavián, C. (2019). The impact of virtual, augmented and mixed reality technologies on the customer
experience. Journal of Business Research, 100(1), 547-560. doi: 10.1016-/j.jbusres.2018.10.050
Fussell, S., Setlock, L., Yang, J., Ou, J., Mauer, E., and Kramer, A. (2004). Gestures Over Video Streams
to Support Remote Collaboration on Physical Tasks. Human-Computer Interaction, 19(3), 273–
309
Galegher, J. (1994). Computer-mediated communication for intellectual teamwork: an experiment in
group writing. Information System Research, 5(1), 110–138.
Gallupe, R. B., Cooper, W., & Grisé, M.-L. (1994). Blocking electronic brainstorms. Journal of Applied
Psychology, 79(1), 77-86.
Gallupe, R. B., Dennis, A. R., Cooper, W. H., Valacich, J. S., Bastianutti, L. M., & Nunamaker, J. F.,
Jr. (1992). Electronic brainstorming and group size. Academy of Management Journal, 35, 350-
369.
Garrison, D., Anderson, T., Archer, W. (2000). Critical inquiry in a text-based environment: computer
conferencing in higher education. The Internet and Higher Education, 2(2). 87–105
Gibson, C. B., & Cohen, S. G. (2013). The last word: Conclusions and implication. Virtual teams that
work: Creating conditions for virtual team effectiveness. San Francisco, CA: Jossey-Bass.
Giesbers, B., Rienties, B., Gijselaers, W. H., Segers, M., Tempelaar, D. T. (2009). Social presence,
Web videoconferencing and learning in virtual teams. Industry & Higher Education, 23(4).
301–309.
Gilson, L., Martins, L., & Maynard, T. (2004). Virtual teams: What do we know and where do we go
from here? Journal of Management, 30(6), 805–835.
Gilson, L., Vartiainen, M., Maynard, M., Hakonen, M. (2014). Virtual Teams Research. Journal of
Management, 41(5), 1313-1337. doi: 0.1177/0149206314559946
González-Romá, V., & Hernández A. (2014). Climate Uuniformity: Its influence on team
communication quality, task conflict, and team performance. Journal of Applied Psychology,
99(1), 1042-1058. Doi: https://doi.org/10.1037/a0037868
Greenberg, P.S., Greenberg, R.H., & Antonucci, Y.L. (2007). Creating and sustaining trust in virtual
teams. Business Horizons, 50(4), 325-333.
Grudzewski, F., Awdziej, M., Mazurek, G., Piotrowska, K. (2018). Virtual reality in marketing
communication – the impact on the message, technology and offer perception – empirical study.
Economics and Business Review, 4(18), 36-50. doi: 10.18559/ebr.2018.3.4
42
Gunkel, S. N., Dohmen, M. D., Stokking, H., & Niamut, O. (2019). 360-degree photo-realistic VR
conferencing. IEEE Conference on Virtual Reality and 3D User Interfaces, 12, 946-947.
Guo, W., Chen, Y., Lei, J., & Wen, Y. (2014). The effects of facilitating feedback on online learners’
cognitive engagement: Evidence from the asynchronous online discussion. Education Sciences,
4(2), 193-208.
Hackman, J. R., & Vidmar, N. (1970). Effects of size and task type of group performance and member
reactions. Sociometry, 33(1), 37-54.
Hagwatwar, A., Massey, A., & Dennis, A. R. (2013). Creative Virtual Environments: Effect of
Supraliminal Priming on Team Brainstorming. Hawaii International Conference on System
Sciences, 46, 215-224. doi:10.1109/HICSS.2013.152
Hammick, J., Lee, M. (2014). Do shy people feel less communication apprehension online? The effects
of virtual reality on the relationship between personality characteristics and communication
outcomes. Computers in Human Behavior, 33, 302-310
Heeter, C. (1992) Being there: the subjective experience of presence. Presence: Teleoperators Virtual
Environment, 1(2), 262–271.
Hung, M. L., & Chou, C. (2014). The development, validity, and reliability of communication
satisfaction in an online asynchronous discussion scale. The Asia-Pacific Education Researcher,
23(2), 165-177.
Hvass, J., Larsen, O., Vendelbo, K., Nilsson, N., Nordahl, R., & Serafin, S. (2017). Visual realism and
presence in a virtual reality game. 3DTV Conference,5, 1-4.
Ihde, D. (1990). Technology and the lifeworld: from garden to earth. Indiana University Press.
Izard, C. E. (1997). Emotions and facial expressions: A perspective from differential emotions theory.
In J. A. Russell & J. M. Fernandez-Dols (Eds.), The psychology of facial expression. 57–77.
Cambridge, U.K.: Cambridge University Press.
Jarvenpaa, S., Ives, B. (1994). The global network organization of the future, Journal of Management
Information Systems, 10(1), 25–58.
Johansson, N. (2020). Productive remote collaboration in VR. Human Interaction Systems, 5(4). 362-
380
Kang, S. H., & Watt, J. H. (2013). The impact of avatar realism and anonymity on effective
communication via mobile devices. Computers in Human Behavior, 29(3), 1169-1181.
Kaplan, A. D., Cruit, J., Endsley, M., Beers, S. M., Sawyer, B. D., Hancock, P. A. (2020). The effects
of virtual reality, augmented reality, and mixed reality as training enhancement methods: a meta-
analysis. Journal of Human factors 4, 210-232. Doi: 10.1177/0018720820904229
43
Karahoca, D., Kurnaz, A. (2016). Analyzing Communication Dimensions in a Ubiquitous Learning
Environment. J. UCS, 22(1), 124-145.
Kiesler, S., & Cummings, J. N. (2002). What do we know about proximity and distance in work groups?
A legacy of research. Cambridge, MIT Press.
Kim, J. (2011). Developing an instrument to measure social presence in distance higher education.
British Journal of Educational Technology, 42(5), 763-777
Knapp, M., & Hall, J. (2007). Nonverbal communication in human interaction. Boston: Wadsworth.
Kohler, T., Fueller, J., Matzler, K., & Stieger, D. (2011a). Co-creation in virtual worlds: The design of
the user experience. MIS quarterly, 35(3), 773–788.
Koutsabasis, P. & Vosinakis, S. & Malisova, K. & Paparounas, N. (2012). On the Value of Virtual
Worlds for Collaborative Design. Design Studies, 11(4), 231-244 Doi:
10.1016/j.destud.2011.11.004.
Kraut, R. E., Fussell, S. R., Brennan, S. E., & Siegel, J. (2002). Understanding effects of proximity on
collaboration: Implications for technologies to support remote collaborative work. Cambridge
The MIT Press, 12(1), 137-162.
Kraut, R. E., Fussell, S. R., Brennan, S. E., & Siegel, J. (2002). Understanding effects of proximity on
collaboration: Implications for technologies to support remote collaborative work. Lessons from
Collocated Work. Cambridge, Boston Review
Lamm, H., & Trommsdorff, G. (1973). Group versus individual performance on tasks requiring
ideational proficiency (brainstorming): A review. European Journal of Social Psychology, 3, 361-
388.
Landis, J., Koch, G. (1977). The measurement of observer agreement for categorical data. Biometrics,
33(1), 159–174.
Latoschik, M. E., Roth, D., Gall, D., Achenbach, J., Waltemate, T., & Botsch, M. (2017, November).
The effect of avatar realism in immersive social virtual realities. Proceedings of ACM
Symposium on Virtual Reality Software and Technology, 23, 44-68.
Leaper. C. (1991). Influence and involvement in children's discourse: Age, gender, and partner effects.
Child Development, 62, 797-811.
Lee, K. (2004). Presence, explicated. Communication Theory, 14(1). 27-50
Leenders, R., Engelen, J. & Kratzer, J. (2003). Virtuality, communication, and new product team
creativity: a social network perspective. Journal of Engineering and Technology Management,
20(1), 69-92. doi: 10.1016/S0923-4748(03)00005-5
Lin, C. (2008) A model to develop effective virtual teams. Journal of Decisin Support Systems, 45(2),
1031-1045. Doi: 10.1016/j.dss.2008.04.002
Lin, J., Han, P., Lee, J., Chen, Y., Chang, T., Chen, K., Hung, Y. (2017). Visualizing the keyboard in
virtual reality for enhancing immersive experience. Journal of Computer Systems, 6(7), 12-28
44
Lin. G.Y. (2004). Social Presence Questionnaire of Online Collaborative Learning: Development and
Validity. Annual Proceedings for Educational Communications and Technology, 3(1), 1-4
Lipnack, J., Stamps, J. (2000). Virtual Teams: People Working Across Boundaries with Technology.
Journal of Interactive Technology, 11(4), 381-399. ISBN: 978-0-471-38825-8.
Littlejohn, S. (2002). Theories of human communication (7th ed.). Belmont, CA: Wadsworth.
Lombard, M., Ditton, T. (1997) At the Heart of It All: The Concept of Presence. Journal of Computer-
Mediated Communication, 3(4), 22-45. Doi: https://doi.org/10.1111/j.1083-
6101.1997.tb00072.x
Lowry, P. (2006). The Impact of Group Size and Social Presence on Small-Group Communication.
Journal of Small Group Research, 37(12), 631-661. Doi: 10.1177/1046496406294322
Lowry, P., Roberts, T., Romano, N., Cheney, P., Hightower, R. (2006). The impact of group size and
social presence on small-group communication. Small Grou Research, 37(6), 631-661
Lu, M., Watson-Manheim, B., Chudoba, K., Wynnm E. (2014). Virtuality and Team Performance:
Understanding the Impact of Variety of Practices. Journal of Global Information Technology
Management. 9, 4-23. Doi: https://doi.org/10.1080/1097198X.2006.10856412
Lurey, J., Raisinghani, M. (2001). An empirical study of best practices in virtual teams. Information
and Management. 38, 523–544.
Maltz, D. N., & Borker, R. (1982). A cultural approach to male-female miscommunication. In J. J.
Gumpertz (Ed.), Language and social identity. Cambridge; Cambridge University Press.
Marlow, S., Lacerenza, C., Salas, E. (2017). Communication in virtual teams: a conceptual framework
and research agenda. Human Resource Management Review, 27 doi:
10.1016/j.hrmr.2016.12.005.
Mason, E. S. (1994). Gender differences in job satisfaction. The Joumal of Social Psychology, 135, 143-
151.
Merrick, K. E., Gu, N., and Wang, X. (2011). Case studies using multiuser virtual worlds as an
innovative platform for collaborative design. Journal of information technology in construction,
16, 165–188.
Mesmer-Magnus, J. R., DeChurch, L. A., Jimenez-Rodriguez, M., Wildman, J., & Shuffler, M. (2011).
A meta-analytic investigation of virtuality and information sharing in teams. Organizational
Behavior and Human Decision Processes, 115(2), 214–225. Doi: 10.1016.2011.03.002
Miranda, S., & Saunders, C. (2003). The social construction of meaning: An alternative perspective on
information sharing. Information Systems Research (ISR), 14(1), 87-106.
Miranda, S., & Saunders, C. (2003). The social construction of meaning: An alternative perspective on
information sharing. Information Systems Research (ISR), 14(1), 87-106.
45
Moreno, R., Mayer, R. E. (2004). Personalized messages that promote science learning in virtual
environments. Journal of Education and Psychology 96, 165–173. doi: 10.1037/0022-
0663.96.1.165
Morgan, L., Paucar-Caceres, A. & Wright, G. (2014). Leading Effective Global Virtual Teams: The
Consequences of Methods of Communication. Information Systemms Research 27(4), 607–624.
doi: https://doi.org/10.1007/s11213-014-9315-2
Morrison-Smith, S., Ruiz, J. (2020). Challenges and barriers in virtual teams: a literature review. SN
Applied Science 2, 343-361 doi: https://doi.org/10.1007/s42452-020-2801-5
Morrow, P. C., & McElroy, J. C. (1981). Interior office design and visitor response: A constructive
replication. Journal of Applied Psychology, 66, 646-650.
Musa, N., & Pollard, C. (2004). User Satisfaction and Trust in Virtual Teams: A Preliminary
Investigation. International Conference on work with computer systems, 23, 78-132.
10.13140/2.1.4239.6481.
Norris, A. E., Weger, H., Bullinger, C., Bowers, A. (2014). Quantifying engagement: Measuring
player involvement in human–avatar interactions. Computers in Human Behavior, 34, 1- 11.
doi: 10.1016/j.chb.2014.01.044
Nowak, K. L., & Biocca, F. (2003). The Effect of the Agency and Anthropomorphism on Users' Sense
of Telepresence, Copresence, and Social Presence in Virtual Environments. Teleoperators &
Virtual Environments, 12(5), 481-494.
Nunamaker, J. F., Jr., Dennis, A., Valacich, J., Vogel, D., & George, J. (1991). Electronic meeting
systems to support group work. Communications of the ACM, 34(7), 40-61.
O’Reilly, C. A., & Roberts, K. H. (1977). Task group structure, communication, and effectiveness in
three organizations. Journal of Applied Psychology, 62(6), 674-681.
Ocker, R. (2002). The mediating effect of group development on satisfaction in a virtual and mixed-
mode environment. Paper presented at the Proceedings of the 35th Hawaii International
Conference on System Sciences
Ocker, R., J. (2002). The mediating effect of group development on satisfaction in a virtual and mixed
mode environment. Proceeding of the 35th Hawaii International Conference on System Sciences,
15, 234-246.
Oeppen, R. and Brennan, P. (2020). Human factors recognition at virtual meetings and video
conferencing: how to get the best performance from yourself and others. British Journal of Oral
and Maxillofacial Surgery, 58(6), 643-646.
Olson, J., Appunn, F., Walters, K., McAllister, C., & Grinnell, L., (2014). Webcams and virtual teams:
An impact model. Team Performance Management 20(3), 24-45 http://dx.doi.org/10.1108/TPM-
05-2013-0013
Olson, J., Teasley, S., Covi, L. & Olson, G. (2002). The (currently) unique advantages of collocated
work. In P. Hinds & S. Kiesler (Eds.), Distributed work (pp. 213-233). Cambridge, MA: The MIT
Press
46
Orhan, M. (2014). Extending the Individual Level of Virtuality: Implications of Task Virtuality in
Virtual and Traditional Settings. Administrative Science 4, 400-412. doi:
10.3390/admsci4040400
Pallavicini, F., Pepe, A., Minissi, M. (2019). Gaming in Virtual Reality: What Changes in Terms of
Usability, Emotional Response and Sense of Presence Compared to Non-Immersive Video
Games? Journal of Simulation & Gaming, 24, 1-24.
Palmero, C., van Dam, E. A., Escalera, S., Kelia, M., Lichtert, G. F., Noldus, L. P., van Wieringen, A.
(2018). Automatic mutual gaze detection in face-to-face dyadic interaction videos. Proceedings
of Measuring Behavior 1, 22-44
Pelet, J., Ettis, S., Cowart, K. (2017). Optimal experience of flow enhanced by telepresence: Evidence
from social media use. Journal of information and management, 54(1), 115-128
Piccoli, G., Powell, A. Ives, B. (2004). Virtual teams: team control structure, work processes, and
team effectiveness. Information Technology and People, 17, 359–379.
Plante and Asselin (2014). Best practices for creating social presence and caring behaviors online.
Nursing Education Perspectives, 35(4), 219-223.
Polhemus, L., Shih, L. F., & Swan, K. (2001). Virtual interactivity: The representation of social presence
in an online discussion. Annual meeting of the American Educational Research Association, 4,
283-312.
Price, M. (2020). Scientists discover upsides of virtual meetings. Journal of Science, 368(6490), 457-
458. doi: 10.1126/science.368.6490.457
Raluca, Z. & Romulus, V. (2018). Group Communication, Performance and Satisfaction in
Organizations. Journal of Economics Sciences Series, 18(1), 135-155.
Ratan, A. & Hasler, B. (2009). Self-presence standardized: Introducing the self-presence questionnaire
(SPQ). Proceedings of the 12th Annual International Workshop on Presence, 2(4), 98-104
Ratan, R., Santa Cruz, M. & Vorderer, P. (2007). Multitasking, Presence & Self-Presence on the Wii.
Journal of Computer Science, 13(4), 114-120
Ratan, R.A. & Hasler, B. (2009). Self-Presence Standardized: Introducing the Self-Presence
Questionnaire (SPQ). Proceedings of the 10th Annual International Workshop on Presence, 3(2),
231-254
Robert, L., & Dennis, A. R. (2005). The paradox of richness: A cognitive model of media choice. IEEE
Transactions on Professional Communication, 48(1), 10-21.
Roberts, D., Heldal, I., et al.: Factors influencing Flow of Object Focused Collaboration in Collaborative
Virtual Environments. Virtual Reality, Special Issue on Collaborative Virtual Environments for
Creative People, 10(2), 119–133 (2006)
Roberts, L., Lowry, B., & Sweeney, D. (2006). An evaluation of the impact of social presence through
group size and the use of collaborative software on group member “voice” in face-to-face and
47
computer-mediated task groups. IEEE Transactions on Professional Communication, 49(2), 28-
43.
Roberts, T. L., Lowry, P. B., & Sweeney, P. D. (2006). An evaluation of the impact of social presence
through group size and the use of collaborative software on group member “voice” in face-to-face
and computer-mediated task groups. IEEE Transactions on Professional Communication, 49(2),
28-43.
Rudd, M., Kathleen, D., Vohs, J. (2012). Awe Expands People’s Perception of Time, Alters Decision
Making, and Enhances Well-Being. Journal of Psychological Science, 5(2), 127-146. Doi:
https://doi.org/10.1177/0956797612438731
Sanchez-Vives, M. & Slater, M. (2005). From presence to consciousness through virtual reality. Nat
Rev Neurosci, 6(1), 332–339. Doi: https://doi.org/10.1038/nrn1651
Schubert, T., Friedmann, F., Regenbrecht, H. (2001.) The Experience of Presence: Factor Analytic
Insights. Presence: Teleoperators and Virtual Environments, 10(3), 266-281
Schultze, U. (2010). Embodiment and presence in virtual worlds: a review. Journal of Information
Technology, 25(4). 434–449
Schwartz, R. & Steptoe, W, (2018). The Immersive VR Self: Performance, Embodiment and Presence
in Immersive Virtual Reality Environments. A Networked Self and Human Augmentic, 2(5),
342-352
Seele, S., Misztal, S., Buhler, H., Herpers, R., & Schild, J. (2017, October). Here's Looking At You
Anyway! How Important is Realistic Gaze Behavior in Co-located Social Virtual Reality Games?.
Proceedings of the Annual Symposium on Computer-Human Interaction in Play, 531-540
Shannon L., Marlow S., Christina N., Salas, L. (2017) Communication in virtual teams: a conceptual
framework and research agenda. Journal of Human Resource Management Review, 27(1), 4.
Doi: 10.1016/j.hrmr.2016.12.005
Sherman, W. & Craig, A. (2003). Understanding Virtual Reality: Interface, Application, and Design.
Shujaat, S., Manzoor, A., Nadeem, P. (2014). Impact of team work on employee satisfaction. Journal
of Business Studies, 10(2), 71-80.
Slater, M. (2009) Place illusion and plausibility can lead to realistic behaviour in immersive virtual
environments. Biological Sciences, 364(1535). 3549–3557
Slater, M. (2009). Place illusion and plausibility can lead to realistic behaviour in immersive virtual
environments. Journal of Psychology, 86(3), 274-294. Doi:
http://doi.org/10.1098/rstb.2009.0138
Slater, M., Khanna, P., Mortensen, J., Yu, I. (2009). Visual realism enhances realistic response in an
immersive virtual environment. IEEE computer graphics and applications, 29(3), 76–84.
Slater, M., Steed, A. (2000). A virtual presence counter. Journal of Teleoperators and Virtual
Environments 9, 413–434. doi: 10.1162/105474600566925
Sommer, R. (1969). Personal space. Englewood Cliffs, NJ: Prentice Hall.
48
Steed, A., Pan, Y., Zisch, F., Steptoe, W. (2016). The impact of a self-avatar on cognitive load in
immersive virtual reality. IEEE Virtual Reality Conference. 67-76
Steed, A., Slater, M., Sadagic, A., Bullock, A., and Tromp, J. (1999). Leadership and collaboration in
shared virtual environments. Proceedings of IEEE VR (New York, NY: IEEE)
Steiner, I. (1972). Group process and productivity. New York: Academic Press
Steuer, J. (1992). Defining virtual reality: dimensions determining telepresence, Communication,
42(4), 73–93
Stray, V., Moe, N. B., & Bergersen, G. R. (2017, May). Are daily stand-up meetings valuable? A survey
of developers in software teams. International Conference on Agile Software Development,
5, 274-281.
Stritzke, W.G.K., Nguyen, A., and Durkin K. (2004). Shyness and computer-mediated
communication: A self-presentational experiences. Media Psychology 6, 1-22
Suh, K. S. (1999). Impact of communication medium on task performance and satisfaction: an
examination of media-richness theory. Journal of Information and Management, 35(1), 295-312
Sung, E. Richard E. Mayer, F. (2012). Five facets of social presence in online distance education.
Computers in Human Behavior, 28(5) 1738-1747. ISSN 0747-5632,
Thies, J., Zollhöfer, M., Stamminger, M., Theobalt, C., & Nießner, M. (2018). FaceVR: Real-time
gaze-aware facial reenactment in virtual reality. ACM Transactions on Graphics (TOG), 37(2),
1-15.
Tracy-Taylor, A. K. (2020). Leading in the Time of Corona. The Oral History Review, 47(2), 260-268.
Tu, C. H., & McIsaac, M. (2002). The relationship of social presence and interaction in online
classes. The American journal of distance education, 16(3), 131-150.
Tussyadiah, P., Jung, T., Dieck, M. (2017). Embodiment of wearable augmented reality technology in
tourism experiences. Journal of Travel Research, 57(5), 597-611. Doi:
https://doi.org/10.1177/0047287517709090
Uziel, L. (2010). Look at Me, I'm Happy and Creative: The Effect of Impression Management on
Behavior in Social Presence. Personality and Social Psychology Bulletin, 36, 1591-602.
10.1177/0146167210386239.
Valacich, J. S., Dennis, A. R., & Nunamaker, J. F., Jr. (1992). Group size and anonymity effects on
computer-mediated idea generation. Small Group Research, 23(1), 49-73.
Valacich, J. S., George, J. F., Nunamaker, J., & Vogel, D. R. (1994). Physical proximity effects on
computer-mediated group idea generation. Small Group Research, 25(1), 83-104.
49
Valacich, J. S., Wheeler, B., Mennecke, B., & Wachter, R. (1995). The effects of numerical and logical
size on computer-mediated idea generation. Organizational Behavior and Human Decision
Processes, 62, 318-329.
van der Kleij, R., Schraagen, J. M., Werkhoven, P., & De Dreu, C. K. W. (2009). How conversations
change over time in face-to-face and video-mediated communication. Small Group Research,
40(4), 355–381. https://doi.org/10.1177/1046496409333724
Vinayagamoorthy, V., Brogni, A., Gillies, M., Slater, M., Steed, A. (2004). An investigation of presence
response across variations in visual realism. The Annual International Presence Workshop, 7,
148– 155.
Warkentin, M., Sayeed, L., Hightower, R. (1997). Virtual teams versus face-to-face teams: an
exploratory study of a web-based conference system. Decision Science, 28(1), 975–996.
Waterworth, E.L., Waterworth, J.A.: Focus, locus, and sensus: The three dimensions of virtual
experience. Cyberpsychology & Behavior, 4(2), 203–213 (2001)
Wegmann, S. J., & McCauley, J. K. (2014). Investigating Asynchronous Online Communication: A
Connected Stance Revealed. Journal of Asynchronous Learning Network, 18(1), 243-267
Whitmer, B. G., Singer, M. J. (1998). Measuring presence in virtual environments: A presence
questionnaire. Presence: Teleoperators and Virtual Environments, 7, 225–240.
Wicklund, R. A. (1979). The influence of self-awareness on human behavior. American Scientist, 67,
187–193.
Wood, J. T (1996). Gendered lives: Communication, gender and culture (2nd ed). Belmont,
CA;Wadsworth
Yip, J. (2006). It's Not Just Standing Up: Patterns of Daily Stand-up Meetings. Journal of Mediated
Communication, 24, 223-267.
Zydney, J. (2014). Strategies for creating a community of inquiry through online asynchronous
discussions. Journal of online learning and teaching, 10(1), 153-178.
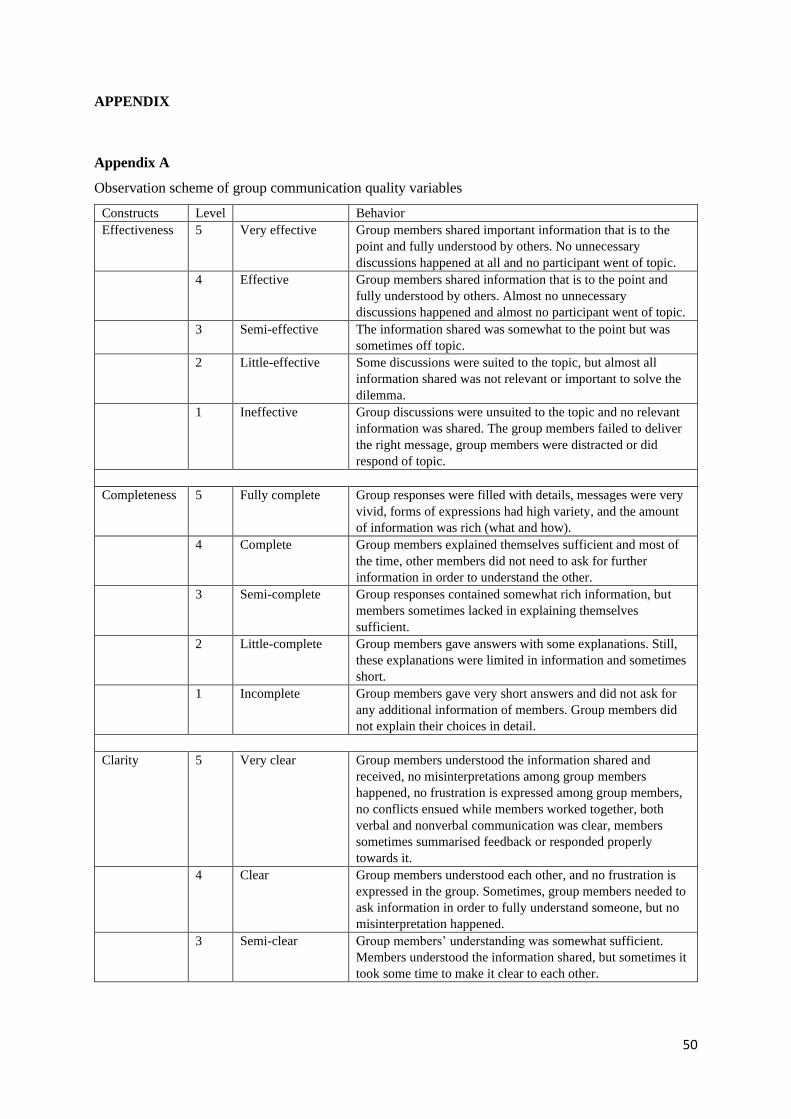
50
APPENDIX
Appendix A
Observation scheme of group communication quality variables
Constructs Level Behavior
Effectiveness 5 Very effective Group members shared important information that is to the
point and fully understood by others. No unnecessary
discussions happened at all and no participant went of topic.
4 Effective Group members shared information that is to the point and
fully understood by others. Almost no unnecessary
discussions happened and almost no participant went of topic.
3 Semi-effective The information shared was somewhat to the point but was
sometimes off topic.
2 Little-effective Some discussions were suited to the topic, but almost all
information shared was not relevant or important to solve the
dilemma.
1 Ineffective Group discussions were unsuited to the topic and no relevant
information was shared. The group members failed to deliver
the right message, group members were distracted or did
respond of topic.
Completeness 5 Fully complete Group responses were filled with details, messages were very
vivid, forms of expressions had high variety, and the amount
of information was rich (what and how).
4 Complete Group members explained themselves sufficient and most of
the time, other members did not need to ask for further
information in order to understand the other.
3 Semi-complete Group responses contained somewhat rich information, but
members sometimes lacked in explaining themselves
sufficient.
2 Little-complete Group members gave answers with some explanations. Still,
these explanations were limited in information and sometimes
short.
1 Incomplete Group members gave very short answers and did not ask for
any additional information of members. Group members did
not explain their choices in detail.
Clarity 5 Very clear Group members understood the information shared and
received, no misinterpretations among group members
happened, no frustration is expressed among group members,
no conflicts ensued while members worked together, both
verbal and nonverbal communication was clear, members
sometimes summarised feedback or responded properly
towards it.
4 Clear Group members understood each other, and no frustration is
expressed in the group. Sometimes, group members needed to
ask information in order to fully understand someone, but no
misinterpretation happened.
3 Semi-clear Group members’ understanding was somewhat sufficient.
Members understood the information shared, but sometimes it
took some time to make it clear to each other.
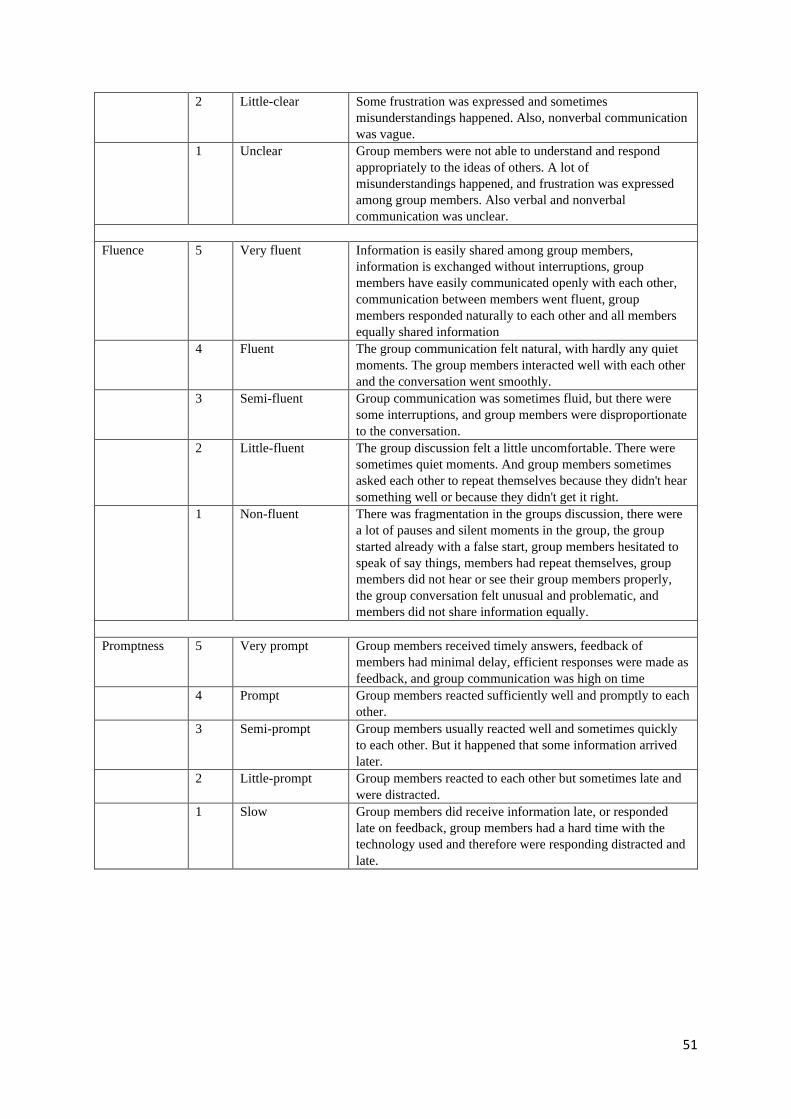
51
2 Little-clear Some frustration was expressed and sometimes
misunderstandings happened. Also, nonverbal communication
was vague.
1 Unclear Group members were not able to understand and respond
appropriately to the ideas of others. A lot of
misunderstandings happened, and frustration was expressed
among group members. Also verbal and nonverbal
communication was unclear.
Fluence 5 Very fluent Information is easily shared among group members,
information is exchanged without interruptions, group
members have easily communicated openly with each other,
communication between members went fluent, group
members responded naturally to each other and all members
equally shared information
4 Fluent The group communication felt natural, with hardly any quiet
moments. The group members interacted well with each other
and the conversation went smoothly.
3 Semi-fluent Group communication was sometimes fluid, but there were
some interruptions, and group members were disproportionate
to the conversation.
2 Little-fluent The group discussion felt a little uncomfortable. There were
sometimes quiet moments. And group members sometimes
asked each other to repeat themselves because they didn't hear
something well or because they didn't get it right.
1 Non-fluent There was fragmentation in the groups discussion, there were
a lot of pauses and silent moments in the group, the group
started already with a false start, group members hesitated to
speak of say things, members had repeat themselves, group
members did not hear or see their group members properly,
the group conversation felt unusual and problematic, and
members did not share information equally.
Promptness 5 Very prompt Group members received timely answers, feedback of
members had minimal delay, efficient responses were made as
feedback, and group communication was high on time
4 Prompt Group members reacted sufficiently well and promptly to each
other.
3 Semi-prompt Group members usually reacted well and sometimes quickly
to each other. But it happened that some information arrived
later.
2 Little-prompt Group members reacted to each other but sometimes late and
were distracted.
1 Slow Group members did receive information late, or responded
late on feedback, group members had a hard time with the
technology used and therefore were responding distracted and
late.
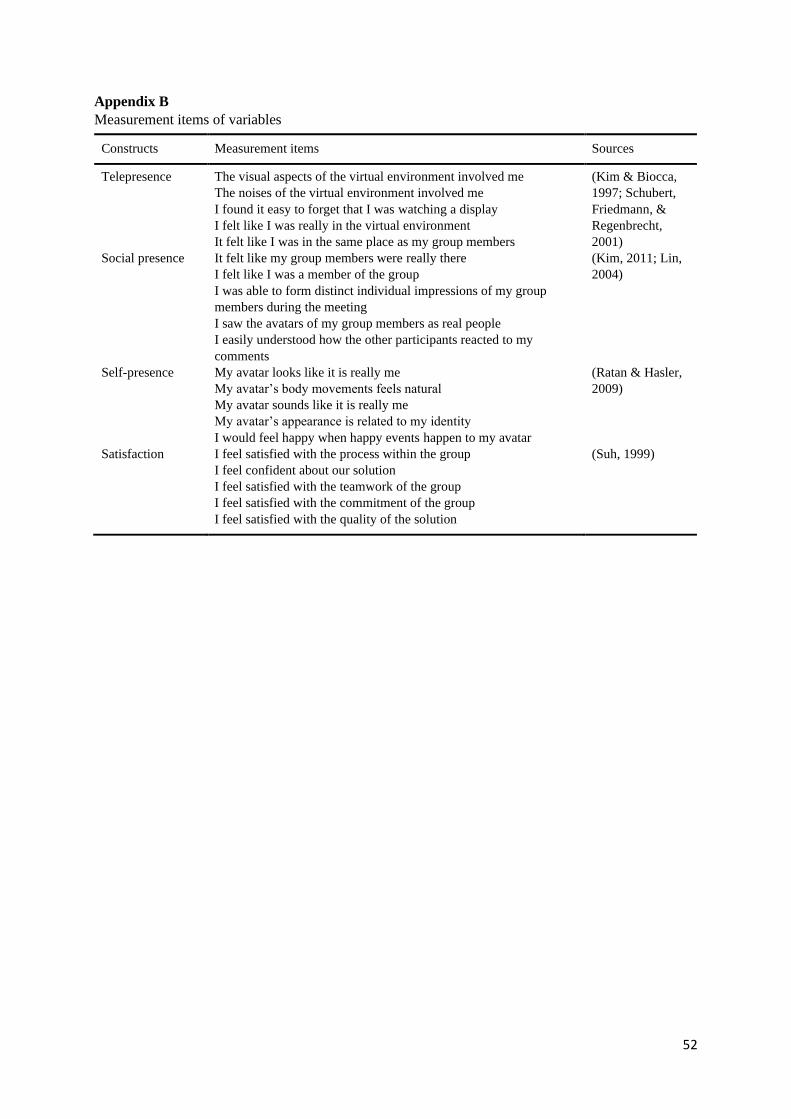
52
Appendix B
Measurement items of variables
Constructs
Measurement items
Sources
Telepresence
The visual aspects of the virtual environment involved me
The noises of the virtual environment involved me
I found it easy to forget that I was watching a display
I felt like I was really in the virtual environment
It felt like I was in the same place as my group members
(Kim & Biocca,
1997; Schubert,
Friedmann, &
Regenbrecht,
2001)
Social presence It felt like my group members were really there
I felt like I was a member of the group
I was able to form distinct individual impressions of my group
members during the meeting
I saw the avatars of my group members as real people
I easily understood how the other participants reacted to my
comments
(Kim, 2011; Lin,
2004)
Self-presence My avatar looks like it is really me
My avatar’s body movements feels natural
My avatar sounds like it is really me
My avatar’s appearance is related to my identity
I would feel happy when happy events happen to my avatar
(Ratan & Hasler,
2009)
Satisfaction I feel satisfied with the process within the group
I feel confident about our solution
I feel satisfied with the teamwork of the group
I feel satisfied with the commitment of the group
I feel satisfied with the quality of the solution
(Suh, 1999)
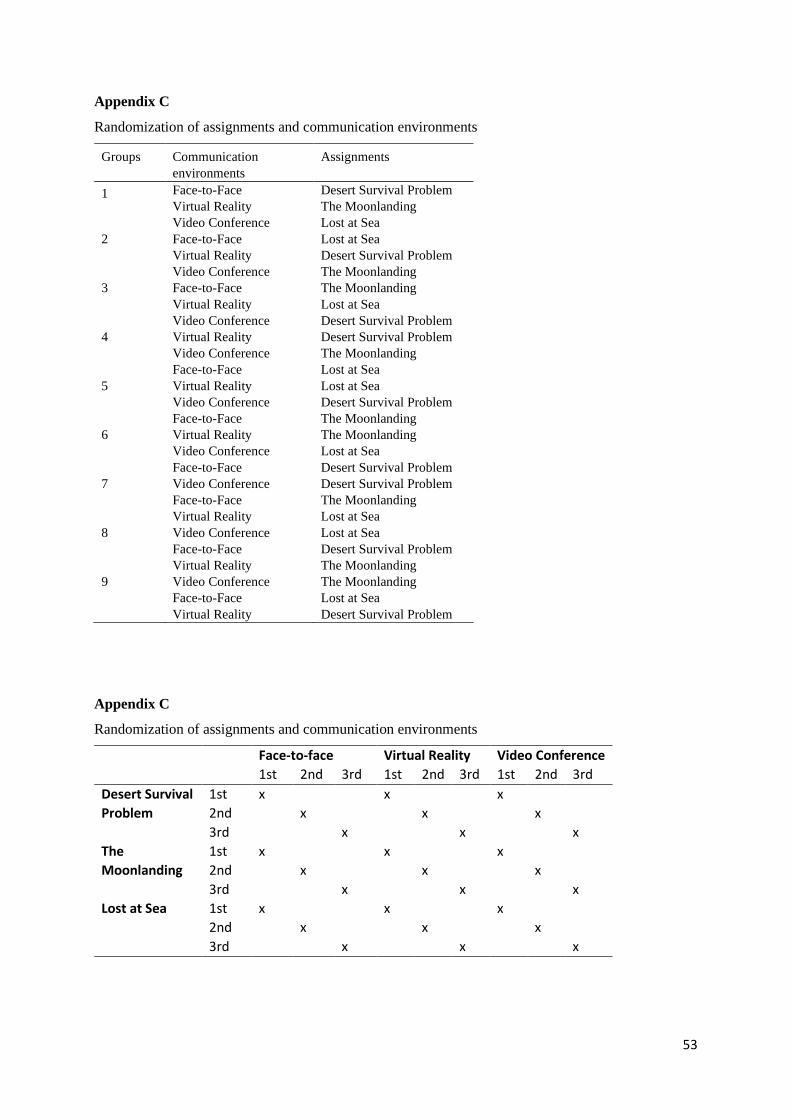
53
Appendix C
Randomization of assignments and communication environments
Groups
Communication
environments
Assignments
1 Face-to-Face
Virtual Reality
Video Conference
Desert Survival Problem
The Moonlanding
Lost at Sea
2 Face-to-Face
Virtual Reality
Video Conference
Lost at Sea
Desert Survival Problem
The Moonlanding
3 Face-to-Face
Virtual Reality
Video Conference
The Moonlanding
Lost at Sea
Desert Survival Problem
4 Virtual Reality
Video Conference
Face-to-Face
Desert Survival Problem
The Moonlanding
Lost at Sea
5 Virtual Reality
Video Conference
Face-to-Face
Lost at Sea
Desert Survival Problem
The Moonlanding
6 Virtual Reality
Video Conference
Face-to-Face
The Moonlanding
Lost at Sea
Desert Survival Problem
7 Video Conference
Face-to-Face
Virtual Reality
Desert Survival Problem
The Moonlanding
Lost at Sea
8 Video Conference
Face-to-Face
Virtual Reality
Lost at Sea
Desert Survival Problem
The Moonlanding
9 Video Conference
Face-to-Face
Virtual Reality
The Moonlanding
Lost at Sea
Desert Survival Problem
Appendix C
Randomization of assignments and communication environments
Face-to-face Virtual Reality Video Conference
1st 2nd 3rd 1st 2nd 3rd 1st 2nd 3rd
Desert Survival
Problem
1st x
x
x
2nd
x
x
x
3rd
x
x
x
The
Moonlanding
1st x
x
x
2nd
x
x
x
3rd
x
x
x
Lost at Sea 1st x
x
x
2nd
x
x
x
3rd x x x
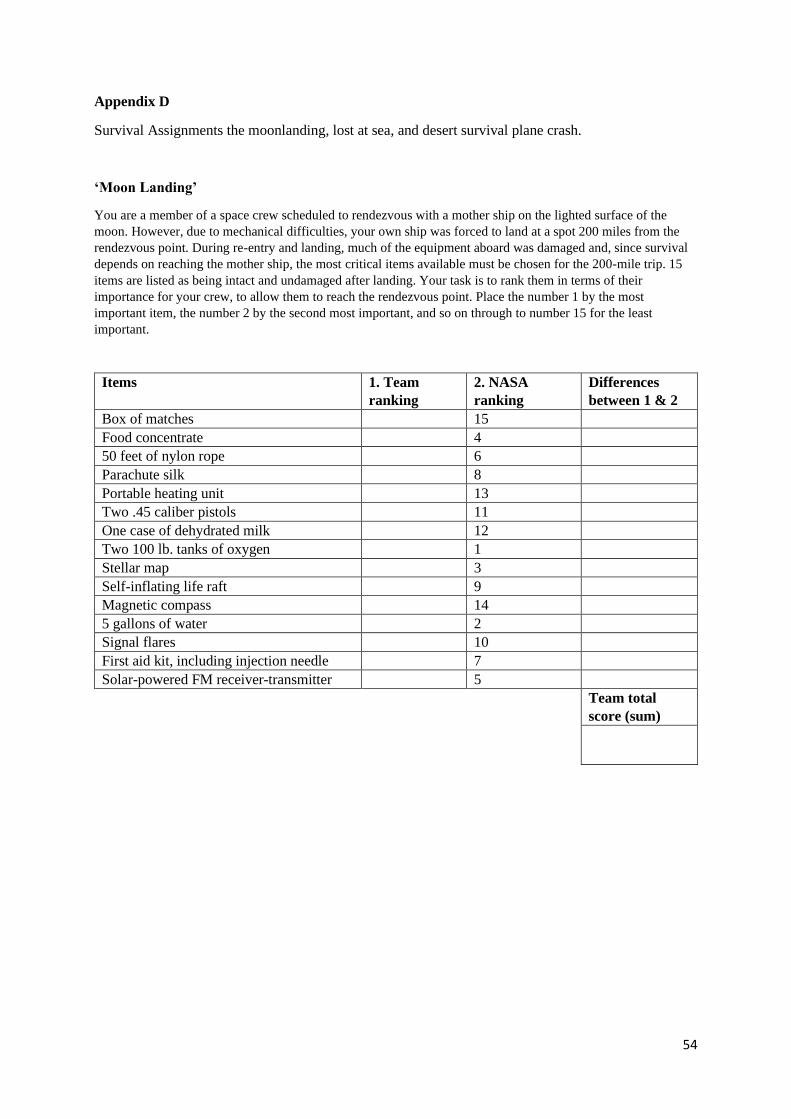
54
Appendix D
Survival Assignments the moonlanding, lost at sea, and desert survival plane crash.
‘Moon Landing’
You are a member of a space crew scheduled to rendezvous with a mother ship on the lighted surface of the
moon. However, due to mechanical difficulties, your own ship was forced to land at a spot 200 miles from the
rendezvous point. During re-entry and landing, much of the equipment aboard was damaged and, since survival
depends on reaching the mother ship, the most critical items available must be chosen for the 200-mile trip. 15
items are listed as being intact and undamaged after landing. Your task is to rank them in terms of their
importance for your crew, to allow them to reach the rendezvous point. Place the number 1 by the most
important item, the number 2 by the second most important, and so on through to number 15 for the least
important.
Items 1. Team
ranking
2. NASA
ranking
Differences
between 1 & 2
Box of matches 15
Food concentrate 4
50 feet of nylon rope 6
Parachute silk 8
Portable heating unit 13
Two .45 caliber pistols 11
One case of dehydrated milk 12
Two 100 lb. tanks of oxygen 1
Stellar map 3
Self-inflating life raft 9
Magnetic compass 14
5 gallons of water 2
Signal flares 10
First aid kit, including injection needle 7
Solar-powered FM receiver-transmitter 5
Team total
score (sum)
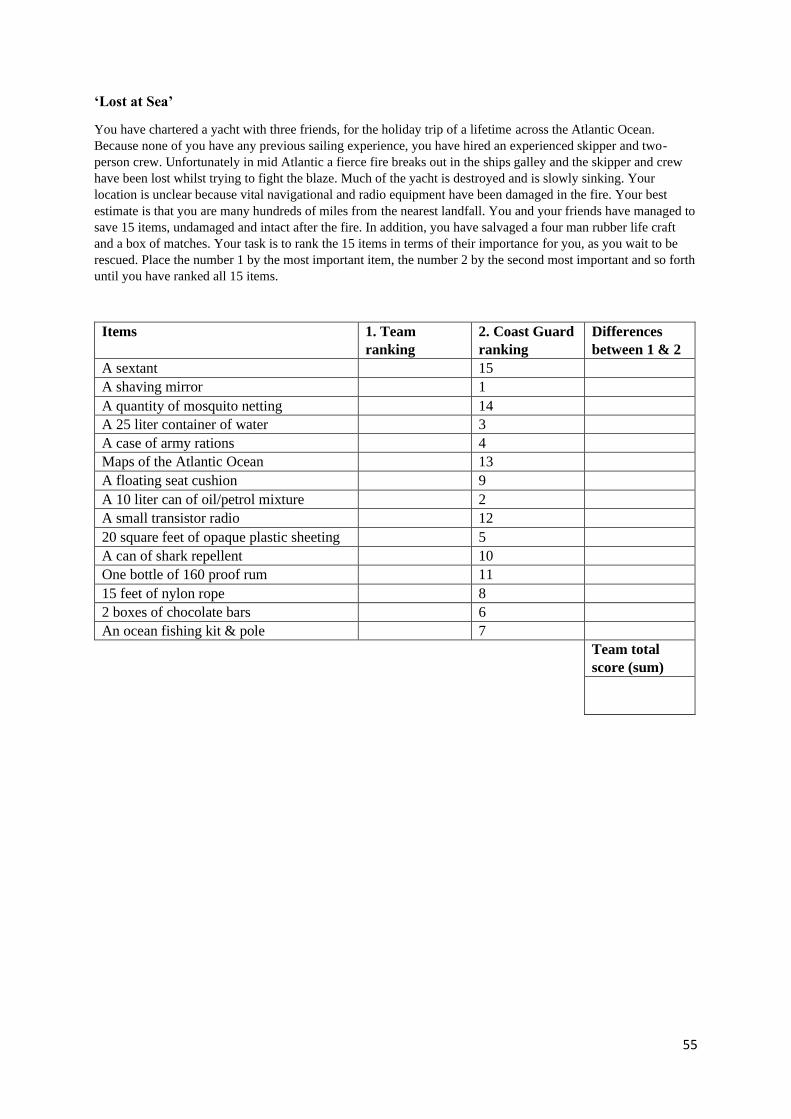
55
‘Lost at Sea’
You have chartered a yacht with three friends, for the holiday trip of a lifetime across the Atlantic Ocean.
Because none of you have any previous sailing experience, you have hired an experienced skipper and two-
person crew. Unfortunately in mid Atlantic a fierce fire breaks out in the ships galley and the skipper and crew
have been lost whilst trying to fight the blaze. Much of the yacht is destroyed and is slowly sinking. Your
location is unclear because vital navigational and radio equipment have been damaged in the fire. Your best
estimate is that you are many hundreds of miles from the nearest landfall. You and your friends have managed to
save 15 items, undamaged and intact after the fire. In addition, you have salvaged a four man rubber life craft
and a box of matches. Your task is to rank the 15 items in terms of their importance for you, as you wait to be
rescued. Place the number 1 by the most important item, the number 2 by the second most important and so forth
until you have ranked all 15 items.
Items 1. Team
ranking
2. Coast Guard
ranking
Differences
between 1 & 2
A sextant 15
A shaving mirror 1
A quantity of mosquito netting 14
A 25 liter container of water 3
A case of army rations 4
Maps of the Atlantic Ocean 13
A floating seat cushion 9
A 10 liter can of oil/petrol mixture 2
A small transistor radio 12
20 square feet of opaque plastic sheeting 5
A can of shark repellent 10
One bottle of 160 proof rum 11
15 feet of nylon rope 8
2 boxes of chocolate bars 6
An ocean fishing kit & pole 7
Team total
score (sum)
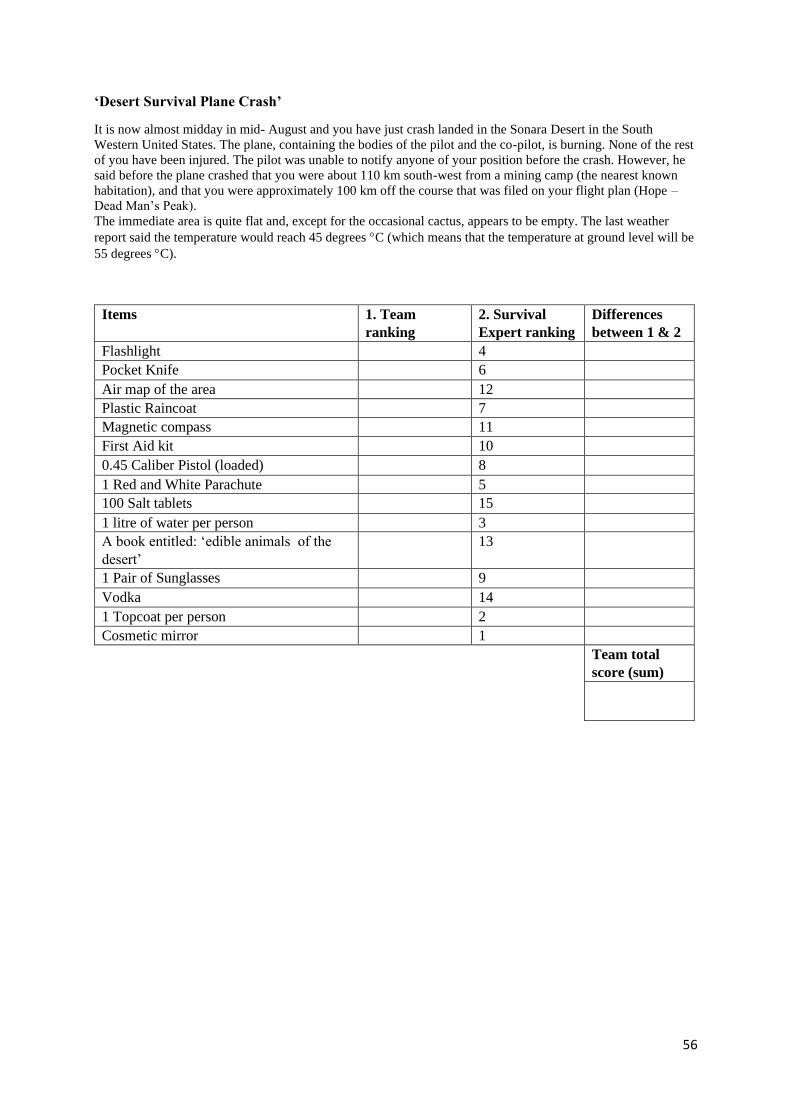
56
‘Desert Survival Plane Crash’
It is now almost midday in mid- August and you have just crash landed in the Sonara Desert in the South
Western United States. The plane, containing the bodies of the pilot and the co-pilot, is burning. None of the rest
of you have been injured. The pilot was unable to notify anyone of your position before the crash. However, he
said before the plane crashed that you were about 110 km south-west from a mining camp (the nearest known
habitation), and that you were approximately 100 km off the course that was filed on your flight plan (Hope –
Dead Man’s Peak).
The immediate area is quite flat and, except for the occasional cactus, appears to be empty. The last weather
report said the temperature would reach 45 degrees C (which means that the temperature at ground level will be
55 degrees C).
Items 1. Team
ranking
2. Survival
Expert ranking
Differences
between 1 & 2
Flashlight 4
Pocket Knife 6
Air map of the area 12
Plastic Raincoat 7
Magnetic compass 11
First Aid kit 10
0.45 Caliber Pistol (loaded) 8
1 Red and White Parachute 5
100 Salt tablets 15
1 litre of water per person 3
A book entitled: ‘edible animals of the
desert’
13
1 Pair of Sunglasses 9
Vodka 14
1 Topcoat per person 2
Cosmetic mirror 1
Team total
score (sum)