BIS Quarterly Review - International banking and financial ...
106
BIS Quarterly Review December 2007 International banking and financial market developments
-
Upload
khangminh22 -
Category
Documents
-
view
0 -
download
0
Transcript of BIS Quarterly Review - International banking and financial ...

BIS Quarterly Review December 2007
International banking and financial market developments

BIS Quarterly Review Monetary and Economic Department Editorial Committee:
Claudio Borio Frank Packer Paul Van den Bergh Már Gudmundsson Eli Remolona William White Robert McCauley Philip Turner General queries concerning this commentary should be addressed to Frank Packer (tel +41 61 280 8449, e-mail: [email protected]), queries concerning specific parts to the authors, whose details appear at the head of each section, and queries concerning the statistics to Philippe Mesny (tel +41 61 280 8425, e-mail: [email protected]).
Requests for copies of publications, or for additions/changes to the mailing list, should be sent to:
Bank for International Settlements Press & Communications CH-4002 Basel, Switzerland E-mail: [email protected]
Fax: +41 61 280 9100 and +41 61 280 8100
This publication is available on the BIS website (www.bis.org).
© Bank for International Settlements 2007. All rights reserved. Brief excerpts may be reproduced or translated provided the source is cited.
ISSN 1683-0121 (print)
ISSN 1683-013X (online)
BIS Quarterly Review, December 2007 iii
BIS Quarterly Review
December 2007
International banking and financial market developments
Overview : markets hit by renewed credit woes................................................... 1 Credit markets take centre stage once again ........................................ 1 Box 1: Subprime loss mechanics: some rough estimates .................... 4 Bank equities hard hit by writedowns .................................................... 8 Bond yields fall on flight to safety and growth concerns ........................ 10 Box 2: Central bank actions in response to the turmoil in money markets........................................................................ 12 Emerging markets show signs of de- and recoupling ............................ 16
Highlights of international banking and financial market activity ......................... 19 The international debt securities market ............................................... 19 Derivatives markets ............................................................................. 21 Box 1: Turnover in OTC derivatives markets ....................................... 25 The international banking market ......................................................... 26 Box 2: The evolving instrument composition of official holdings of US dollars ........................................................................... 27
Special features
International banking centres: a network perspective ......................................... 33 Goetz von Peter
From size to network structure ............................................................. 34 Identifying international banking centres by network methods ............... 36 Conclusion ........................................................................................... 43 Box: Selected network measures for identifying banking centres ........ 44
International banking with the euro .................................................................... 47 Patrick McGuire and Nikola Tarashev
The euro and the global banking system .............................................. 48 The euro and the euro area banking system ......................................... 54 Box: Measuring net banking flows: some challenges .......................... 56 Conclusion ........................................................................................... 60
What drives the growth in FX activity ? Interpreting the 2007 triennial survey ..... 63 Gabriele Galati and Alexandra Heath
Rapid growth in turnover with financial customers ................................ 65 The rising importance of emerging market currencies ........................... 69 Conclusions ......................................................................................... 70
Risk in carry trades: a look at target currencies in Asia and the Pacific .............. 73 Jacob Gyntelberg and Eli Remolona
Carry trades versus uncovered interest parity ....................................... 74 Box: Carry trades as a standard trading strategy ................................ 75 Measuring the risk in carry trades ........................................................ 76 Risk and return in carry trades ............................................................. 79 Conclusions ......................................................................................... 80

iv BIS Quarterly Review, December 2007
Changing post-trading arrangements for OTC derivatives ................................... 83 Elisabeth Ledrut and Christian Upper
Characteristics of OTC derivatives and implications for post-trade processing ........................................................................... 84 The problem of confirmation backlogs ................................................... 86 Box: The US paper crunch, 1967–1970 ............................................... 88 The market for post-trade services ........................................................ 90 Conclusion ........................................................................................... 93
Recent initiatives by Basel-based committees and groups Basel Committee on Banking Supervision ............................................. 97 Financial Stability Forum ...................................................................... 100
Statistical Annex ........................................................................................ A1
Special features in the BIS Quarterly Review ................................ B1
List of recent BIS publications .............................................................. B2
Notations used in this Review
e estimated
lhs, rhs left-hand scale, right-hand scale billion thousand million … not available . not applicable – nil 0 negligible $ US dollar unless specified otherwise Differences in totals are due to rounding.

BIS Quarterly Review 1
Ingo Fender+41 61 280 8415
Peter Hördahl+41 61 280 8434
Overview: markets hit by renewed credit woes
Further deterioration in the US housing market and concerns about associated economic and financial risks continued to take centre stage during the period under review. Prices for risky assets had recovered into October, as earlier worries about systemic risk had eased, not least because of determined central bank action in the money markets. However, uncertainties about subprime and other credit market exposures remained, adding to more general concerns that US housing market woes would deepen and eventually contribute to broader economic weakness. With market participants refocusing on these risks and liquidity conditions in money markets remaining tense, sentiment worsened once again from mid-October.
Against this background, and with oil prices surging to new highs, share prices fell sharply in major equity markets. The financial sector was particularly badly hit, following a string of multibillion dollar credit-related writedowns by banks. Adding to this, third quarter year-on-year corporate earnings growth was negative in the United States for the first time in several years.
In this environment, government bond yields in major industrialised economies fell as investors again fled to safety, but also as the result of an anticipated weakening of economic activity. Heightened expectations of monetary policy easing, in particular in the United States, added to the decline in yields. Such expectations, in combination with the sharp rise in oil prices, may have contributed to rising break-even inflation rates in a number of markets.
While being drawn into more general market weakness later in the period, emerging market assets were supported by perceptions that downside risks to growth in many emerging markets would be more limited than for the major industrialised economies. Emerging market equities, in particular, outperformed their counterparts in the mature markets on assumptions of continued robust earnings growth.
Credit markets take centre stage once again
Credit market developments went through two distinct stages in the period from end-August to end-November, as a temporary recovery gave way to another episode of broad-based market weakness. Credit markets broadly recovered into mid-October, following repeated central bank liquidity injections into

2 BIS Quarterly Review
interbank money markets and lower policy rates in the United States. However, unfavourable news about the US housing market subsequently revived earlier concerns about direct and indirect exposures to associated economic and financial risks. As a result, having reached respective low points on or around 11 October, major credit spread indices widened once again thereafter. Between end-August and 30 November, the US five-year CDX high-yield index spread rose by 85 basis points to 492, while corresponding investment grade spreads widened by 9 basis points to 76. In the process, both index spreads rose above their end-July peaks, before recovering somewhat. European indices broadly mirrored the performance of their US counterparts, widening back to 348 basis points for the iTraxx Crossover index and near 53 for investment grade spreads. At these levels, higher-yield spreads had moved somewhat above the values that have historically been associated with low current default rates, suggesting market expectations of rising default risk (Graph 1, left-hand and centre panels).
Late September, in particular, saw a broad recovery in credit markets, with the FOMC decision to cut the federal funds target by 50 basis points on 18 September triggering a strong price reaction across all market segments. Credit spreads tightened sharply, as immediate concerns about systemic risk eased. Adding to the positive sentiment, sizeable write-offs announced by major banks were at the time seen as providing much needed transparency about mortgage-related losses. Recovering markets, in turn, allowed banks to shrink their $400 billion pipeline of leveraged loan and high-yield bond deals awaiting financing. The LCDX spread, based on credit default swaps (CDSs) written on senior secured bank loans, touched levels around 200 basis points in late September, signalling a more benign environment (Graph 1, right-hand panel). By end-October, the global backlog had reportedly been reduced to around $245 billion, with a number of previously delayed deals – such as First Data and TXU – being relaunched and placed in the market.
Credit spread indices
Investment grade1 High-yield/crossover1 Leveraged loans and CMBSs
15
30
45
60
75
Jan 06 Jul 06 Jan 07 Jul 07
DJ CDX IGiTraxx Main
160
240
320
400
480
Jan 06 Jul 06 Jan 07 Jul 07
DJ CDX HYiTraxx Crossover
90
250
410
570
730
Apr 07 Jul 07 Oct 07
LCDX²CMBXNA_2³CMBXNA_3³
1 Five-year on-the-run CDS mid-spread, in basis points. 2 Index spreads for five-year CDSs on syndicated US loans. 3 Index spreads for BBB tranches of commercial mortgage-backed securities (index series 2 and 3).
Source: JPMorgan Chase. Graph 1
Credit markets recover into October …

BIS Quarterly Review 3
Despite this recovery, market conditions remained weak for structured instruments, which continued to be weighed down by deteriorating asset quality and uncertainties about valuation. With the origination of subprime mortgages essentially shut down, and that of other non-agency products severely curtailed, net issuance of jumbo prime and Alt-A mortgage-backed securities (MBSs) was down to about $3 billion in September. This compared dramatically to levels of about $30 billion/month and more in 2005 and 2006. Given the large amounts of adjustable rate mortgages known to await interest rate resets in 2008, these low volumes signalled further slowing prepayments and rising delinquencies ahead – indicators that had been suggestive of rapidly deteriorating credit fundamentals for some time (Graph 2, left-hand and centre panels). Housing data added to the negative news when, on 27 September, the new home sales release saw a decline of 21% from the previous year’s value.
Sentiment worsened further from mid-October, when a new wave of downgrades of mortgage bond ratings triggered a second stage of broad-based credit market weakness. Between 11 and 19 October, Moody’s and Standard & Poor’s each downgraded more than 2,500 subprime mortgage bonds, totalling some $80 billion in original face value. This added to rating adjustments by Fitch on around $18 billion worth of 2006 vintage paper on 8 October. As these downgrades included many constituents of the various ABX.HE indices, ABX spreads widened significantly on the news (Graph 2, right-hand panel). This occurred despite the fact that the downgrades had been widely anticipated, following weak delinquency data for ABX constituent bonds (see Box 1). In the process, the more senior tranches tended to underperform the lower-rated ones, as losses were increasingly expected to eventually push through existing subordination layers. While spreads stabilised somewhat in early November, investors in AA-rated 2006 vintage subprime collateral are estimated to have taken mark to market losses in the order of 30% between end-August and
US mortgage markets
Subprime delinquency rates1 MBS issuance2 ABX tranche spreads3
0
5
10
15
3 6 9 12 15 18 21 24
2001–05 range20072006
0
1
2
3
00 01 02 03 04 05 06 07
SubprimeAlt-AOther private labelAgency
0
2,000
4,000
6,000
Jan 07 May 07 Sep 07
BBB-ratedA-ratedAA-ratedAAA-rated
1 Mortgage delinquency rates (60+ days) by cohort year, in per cent. Number of months of seasoning plotted on the horizontal axis. 2 In trillions of US dollars; for 2007, first three quarters. 3 JPMorgan Chase home equity (ABX.HE 2007-1) closing on-the-run spreads, in basis points.
Sources: JPMorgan Chase; LoanPerformance; UBS. Graph 2
… and mark to market losses …
Further subprime downgrades …
… and weak housing data
… despite continuing concerns about asset quality …

4 BIS Quarterly Review
Box 1: Subprime loss mechanics: some rough estimates Commentators from both the public and private sectors have long voiced concerns that the rapid expansion of structured finance markets, while enhancing the ability of market participants to price and allocate risks, has also made it more difficult to track the redistribution of risks within the financial system.1 Indeed, uncertainties about the size and distribution of mortgage-related losses have been among the key drivers of the broader financial market turbulence observed during the second half of 2007. This box aims to shed some light on a particular aspect of this uncertainty: the complexities introduced by the (re-)securitisation of subprime mortgage loans. For this purpose, loss projections for a pool of securities backed by home equity loans are subjected to a sensitivity analysis of key model parameters. A key result is that plausible model assumptions can generate sizeable projected losses at current delinquency levels, and that relatively modest changes in model assumptions can lead to marked increases in projected losses across different tranches of instruments with subprime exposure. This, in turn, may help to explain recent downgrade activity by the major rating agencies as well as pricing patterns for instruments such as the ABX index.
Given the degree to which subprime exposure has been securitised, mortgage market deterioration was bound ultimately to feed into ABSs and CDOs. Subprime delinquencies have been on the rise since 2005, and are expected to surpass previous peaks, especially for the most recent mortgage vintages. At the same time, there are long lags involved in the transmission of delinquencies on underlying subprime (and other) exposures to the realisation of related losses within mortgage-backed securitisations. As the foreclosure process can take more than a year to complete, and collateral pools are not usually marked to market, many recent securitisations will therefore not experience material writedowns until 2008. However, given the trends in delinquencies, markets are now focusing on the size of projected losses, and the conditions under which these are going to translate into losses on individual ABS and, eventually, CDO tranches.
Rough estimates of subprime losses are made on the basis of simple default projections derived from November 2007 deal-level information on delinquencies and foreclosures. The asset pool used consists of the constituents of the ABX.HE 07-1 index of home equity loan securitisations. The approach proceeds in three steps. First, based on assumptions about “transitions to default” of delinquent loans (ie, about the percentage of current delinquencies that will lead to foreclosure events or worse), deal-level information is turned into projected defaults from current delinquencies. Second, these projections are mapped into default timing data on the basis of historical relationships between the average age of mortgage loans and observed percentage
Subprime loss projections: ABX.HE 07-1 exposures1
Average deal-level loss and default severities2
Average deal-level loss and default transitions3
CDO pool loss and default severities4
0
10
20
30
5 25 45 65 85
3545556575
0
7
14
21
5 25 45 65 85
15 2535 4555
0
7
14
21
5 25 45 65 85
510152025
1 As a percentage of the original balance. 2 Average loss (y-axis) on ABX.HE 07-1 constituents for different default severities (x-axis) and default transition assumptions. 3 Average loss (y-axis) on ABX.HE 07-1 constituents for different default transition rates (x-axis) and default severity assumptions. 4 Pool loss (y-axis) for different default severities (x-axis) and subprime collateral pool allocations; assuming a default transition rate of 65% and exposure to the individual constituents of the ABX.HE 07-1 at the 10–15% loss level. Horizontal lines mark pool losses of 6%, 12% and 16%.
Sources: Intex; Loan Performance; UBS; BIS calculations.

BIS Quarterly Review 5
lifetime losses across different mortgage vintages.2 Third, the resulting default projections, together with “default severity” (ie, loss-given-default) assumptions, are used to derive projected lifetime losses. To get a sense of the sensitivity of these projections to parameter changes, the default severity and transition assumptions are then varied, leading to a matrix of loss projections for different sets of assumptions.
Lifetime losses for an equally weighted portfolio of the 20 securities underlying the ABX.HE 07-1 index are projected as a function of default transitions and severities in the graph (left-hand and centre panels). Projected losses cross the 10% loss level for default severities of around 25%, and rise to more than 15% for severities of 35% and above. Historically, scenarios with low or negative house price appreciation have been associated with default transitions of 60–70%, and default severities of around 30–40%. These would suggest projected losses at 15% and above. Indeed, given the unusually weak current environment, significantly higher losses are possible and could be consistent with the large discounts from par currently being priced by ABX investors.
The same analysis can be used to illustrate the loss mechanics for hypothetical CDOs that have subprime assets as part of their collateral pool.3 Loss projections for CDO pools with equally weighted exposures to the ABX constituents at the 10–15% loss level are shown in the graph (right-hand panel).4 (This specification implies that ABS-level losses will affect the collateral pool only when 10% of the underlying claims have been depleted, while being capped at a loss rate of 15%; the remainder of the pool is assumed to be unimpaired). With default transitions set at 65%, projected pool loss is shown as a function of default severities and the assumed share of subprime collateral in the pool. Horizontal lines (at loss levels of 6%, 12% and 16%), in turn, give a broad indication of where BBB, A and AA-rated CDO tranches respectively might start to take losses, if assumed deal structures were to fulfil the requirements for such ratings.5
While hypothetical in nature, the exercise demonstrates how sensitive projected losses on CDOs can be to changes in subprime exposure and default severity. The CDO pools are projected to incur losses once default severities are around 15%, as losses push through the protection provided by subordination at the ABS level. For higher severities, projected CDO losses will ramp up further and approach the 6% level, where the most junior CDO debt tranche is assumed to be located. For low subprime exposures in the collateral pool, these junior tranches would be considered “safe” even at very high default severities. However, higher allocations to subprime assets, in combination with default severities of 30–40% (ie, for scenarios of weak house prices), can easily generate projected losses that push through assumed BBB and A-level thresholds. This sensitivity of loss projections to variation in model parameters, in turn, is consistent with the scale and magnitude of rating actions on subprime-backed securitisations observed to date and indicative of the likelihood of more downgrades were housing fundamentals to deteriorate further. _________________________________
1 An important characteristic of many of these instruments is the process of “tranching”, which protects investors at the more senior level of the capital structure from losses until the more junior tranches are depleted. See CGFS, The role of ratings in structured finance: issues and implications, January 2005. 2 For this purpose, lifetime losses are defined as cumulative defaults at month 60 and timing assumptions are based on historical averages in environments of low (ie, less than 5%) house price appreciation. See UBS, “Mortgage Strategist”, 26 June 2007, for details on the projection methodology. 3 For tractability, a number of simplifying assumptions have to be made, limiting any direct implications of the analysis for actual CDO pools. Moody’s data suggest that CDO exposure to subprime assets has varied substantially, ranging from less than 1% to as high as 88% of total pool size. Moreover, with assets originating from 64 issuers on average and low levels of issuer concentration, subprime exposures in CDOs tend to be much more diverse than the ABX index. In addition, CDO pools would tend to be more seasoned, limiting the exposure to the most troubled mortgages. See Moody’s, “The impact of subprime residential mortgage-backed securities on Moody’s-rated structured finance CDOs: a preliminary review”, 23 March 2007. 4 This corresponds, broadly, to BBB quality, accounting for excess spread and overcollateralisation. 5 See I Fender and J Kiff, “CDO rating methodology: some thoughts on model risk and its implications”, Journal of Credit Risk, vol 1(3), 2005, pp 37–58.
end-November, compared to about 20% on tranches originally rated BBB. Index spreads for commercial mortgage securitisations also widened, suggesting that investors anticipated asset quality erosion to spill over from residential markets (Graph 1, right-hand panel).
Part of the renewed selling pressure in mortgage markets was explained by concerns about asset sales by structured finance CDOs and structured investment vehicles (SIVs). With more than 500 CDOs having direct exposure

6 BIS Quarterly Review
to the downgraded Moody’s assets alone, ratings-related collateral haircuts were seen as possibly triggering structural provisions that give senior investors the option to liquidate the underlying collateral pool. A related problem, mark to market losses on assets held by SIVs, regained prominence on 19 October, when the failure of two SIVs to honour debt commitments led to fears of forced asset sales. This was despite signs of stabilisation in commercial paper markets more broadly, as reflected by reduced spreads on asset-backed commercial paper (ABCP) with 100% liquidity support (Graph 3, right-hand panel). At the same time, volumes declined further and the financing profile remained skewed towards short maturities of one week and less, as investors continued to have difficulties valuing ABCP collateral in an environment of largely illiquid markets (Graph 3, centre and left-hand panels).
From mid-October, negative sentiment thus started once again to spill over from mortgages into the broader credit market, as investors refocused on lingering problems with exposures to risky assets. One sign of continuing uncertainty about the size and distribution of losses from such exposures was the pricing of credit protection against the default risk of banks and other financial institutions, which pointed to growing concerns about financial sector strains. Although large write-offs during the third quarter earnings season had given some initial indication of prospective losses, large-scale revisions and renewed credit market weakness suggested that more losses were about to materialise. Related concerns about banks’ capital positions were compounded by further rating actions. On 23 October, Standard & Poor’s lowered the ratings on 145 tranches from CDOs worth $3.7 billion in total issuance amounts. Later the same week, Moody’s downgraded 117 CDO tranches, while Fitch placed some $37 billion in CDOs on review for possible downgrade. Further large-scale rating actions were taken during the following weeks. CDS spreads on many banks and other financial institutions thus moved substantially above the levels seen during the summer, especially for names with large securitisation
Asset-backed commercial paper (ABCP) markets
US CP outstanding1 Maturing ABCP2 US ABCP spreads4
0.80
0.87
0.94
1.01
1.08
1.15
Jun 07 Aug 07 Oct 07
Asset-backedNon-asset-backed
0
60
120
180
240
300
31 Aug 28 Sep 26 Oct 23 Nov20
22
24
26
28
30
In billions of USD (lhs)In per cent (rhs)³
–15
0
15
30
45
60
Jun 07 Aug 07 Oct 07 Dec 07
30-day90-day
1 In trillions of US dollars. 2 Outstanding ABCP maturing during the following week. 3 As a percentage of total outstanding. 4 ABCP yield minus the corresponding Libor rate, in basis points; ABCP yields for A1+ rated issues.
Sources: Federal Reserve Board; Bloomberg; BIS calculations. Graph 3
… financial sector spreads see sharp widening …
With markets refocusing on risk exposures …
… prompt renewed concerns about forced asset sales

BIS Quarterly Review 7
businesses or known to rely heavily on wholesale funding. At the same time, differentiation across the larger banks remained smaller than before the credit market sell-off, possibly reflecting a continuing lack of transparency about their exposures (Graph 4, left-hand and centre panels).
Mortgage-related losses also started to emerge outside the banking sector. Financial guarantors, who provide external credit enhancement to mortgage-backed and other securities, were affected in particular. Widening credit spreads on senior tranches of structured instruments had resulted in mark to market losses on the value of insurance written on these products. Related fears about a possible rise in future claims thus resulted in CDS spreads on names such as Ambac and FGIC widening sharply in late October and into November. This, in turn, pointed to market concerns about impairment of even the most highly rated mortgage exposures, and to possible losses among investors in such instruments if rating changes or other events were to force writedowns on these holdings (Graph 4, left-hand panel).
The underperformance of financial sector spreads continued throughout most of November, fuelled by further news about disappointing earnings and mortgage-related losses. Nevertheless, spreads recovered somewhat towards the end of the month, following high-profile capital injections in the financial sector. In contrast, spreads on corporate names did not see comparable changes in spread levels and dispersion over the period, although surveys in the euro area, the United Kingdom and the United States reported tightening lending terms for corporates and consumers. To the extent that this pointed to weaker economic growth and more limited funding availability (see the Highlights section in this issue for detail on corporate issuance activity),
Financial sector spreads and lending terms
CDS spread changes1 Dispersion of bank spreads2, 5 Lending terms and conditions
0
900
1,800
2,700
Jan 07 Apr 07 Jul 07 Oct 07
Banks²Corporates³Key monolines4
0
0.3
0.6
0.9
0 100 200 300
15 Jun 0731 Jul 0715 Nov 07
–70
–35
0
35
2006 2007
US C&I loans6
US C&I spreads7
US consumer loans8
1 Average of five-year CDS spreads; 1 January 2007 = 100. 2 Twenty large, internationally active banks from France, Germany, Japan, Switzerland, the United Kingdom and the United States (average rating of Aa2). 3 Twenty large industrial and consumer goods companies with the same country composition and average rating as the sample of banks described above. 4 Seven financial guarantors. 5 The x-axis indicates option-adjusted spreads in basis points (means normalised at 100), with the corresponding probability densities (fitted with a normal-based kernel density function) shown along the y-axis, in per cent. 6 Net percentage of domestic respondents tightening standards for commercial and industrial (C&I) loans for large and medium-sized firms seeking loans. 7 Net percentage of domestic respondents increasing spreads of loan rates over banks’ cost of funds for large and medium-sized firms seeking loans. 8 Net percentage of domestic respondents tightening standards on consumer loans (excluding credit cards).
Sources: Federal Reserve Board; Markit; BIS calculations. Graph 4
… and tightening financing conditions
… fuelling concerns about further losses …

8 BIS Quarterly Review
spreads for lower-quality corporate borrowers could thus come under pressure going forward (Graph 4, right-hand panel).
Bank equities hard hit by writedowns
Global equity markets largely mirrored events in credit markets during the period under review. Stock prices initially staged a broad-based recovery, with the S&P 500 Index reaching an all-time high on 9 October. However, from mid-October equities began to fall as renewed credit-related concerns again triggered worries about future profits and depressed investors’ appetite for risk. A strong performance in the final week of November lifted equities off the lows reached earlier in the month. Nevertheless, between mid-October and end-November, the S&P 500 lost 4.4%, while the TOPIX index fell 7.6% and the Dow Jones EURO STOXX retreated 2.6% (Graph 5, left-hand panel).
Third quarter profit growth in the United States, in particular, was substantially less buoyant than what markets had become accustomed to over the past few years, which contributed to the decline in equities. While positive US earnings surprises still outnumbered negative ones, the earnings growth expectations against which the announced earnings were measured were considerably lower than previously, implying sharply lower realised earnings as well. The average year-on-year earnings growth in the third quarter was –2.5% (on a share-weighted basis), ending a 20-quarter run of double digit increases in earnings that had averaged no less than 17% (Graph 5, right-hand panel).
Also weighing on global equity markets from the second half of October was the dismal performance of the financial sector, following a string of multibillion dollar writedowns related to structured credit products. As a consequence of such losses, banks, in particular in the United States, saw equity prices plummet (Graph 5, centre panel), and several of them experienced management shakeouts at the highest levels. Not surprisingly, third quarter earnings among US financial firms in the S&P 500 Index fell
Equity markets and earnings
Overall indices1 Bank indices1 US corporate earnings2
82
88
94
100
106
Jan 07 Apr 07 Jul 07 Oct 07
S&P 500DJ EURO STOXXTOPIX
60
70
80
90
100
Jan 07 Apr 07 Jul 07 Oct 07–30
–15
0
15
30
2005 2006 2007
S&P 500Financials
1 In local currency; 3 January 2007 = 100. 2 Annual EPS growth rates, in per cent; S&P 500 companies.
Source: Bloomberg. Graph 5
… and outsized bank writedowns …
… sharply lower earnings …
Equity prices fall on credit worries …

BIS Quarterly Review 9
sharply, and were considerably more negative than for the index as a whole (Graph 5, right-hand panel). The gloom was not limited to banks in the United States, as several non-US banks also reported substantial subprime-related losses. Moreover, fears among investors that the writedowns disclosed for the third quarter would turn out to represent only a fraction of what would ultimately be revealed weighed further on bank equity prices. Similar developments were observed in other parts of the financial sector. Some of the largest financial guarantors saw their equity prices drop by 40–60% in October, while US mortgage finance companies Freddie Mac and Fannie Mae lost over 40% of their equity market value between mid-October and end-November, despite some recovery in the last week of November following heightened expectations of further Fed rate cuts as well as reports of a US government-sponsored plan aimed at reducing the number of home foreclosures.
In this environment, implied volatilities again rose sharply, after having eased off their highs in August (Graph 6, left-hand panel). The S&P 500 VIX implied volatility index, which had declined to as low as 16% on 9 October, reached 31% just over one month later. This was even higher than the levels seen at the height of the first round of the credit crisis. Similar developments took place elsewhere, with one-month implied volatilities on the DJ EURO STOXX 50 Index and on the Nikkei 225 Index rising significantly in the second half of the period under review (Graph 6, left-hand panel). Moreover, the shape of implied volatility term structures as of end-November indicated that equity price volatility and associated risk premia were expected to remain elevated for some time (Graph 6, centre panel). Meanwhile, indicators of risk tolerance in equity markets fell sharply again after a brief recovery in September (Graph 6, right-hand panel).
Equity market volatility and risk tolerance
Implied volatility; equity indices1 Implied volatility; term structure2 Risk tolerance3
8
15
22
29
36
Jan 06 Jul 06 Jan 07 Jul 07
VIX (S&P 500)DJ EURO STOXXNikkei 225
12
16
20
24
28
0 4 8 12 16 20 24
S&P 500, 30 NovS&P 500, 9 OctDJ EURO STOXX, 30 NovDJ EURO STOXX, 9 Oct
–6
–4
–2
0
2
2005 2006 2007
S&P 500DAX 30FTSE 100Principal component4
1 Volatility implied by the price of at-the-money call option contracts on stock market indices, in per cent. 2 Volatility implied by the price of at-the-money call and put option contracts on stock market indices (on 31 May 2007 and 7 September 2007), in per cent. The horizontal axis refers to the maturity of the options in months. 3 Derived from the differences between two distributions of returns, one implied by option prices, the other based on actual returns estimated from historical data; weekly averages of daily data. 4 First principal component of risk tolerance indicators estimated for the S&P 500, DAX 30 and FTSE 100.
Sources: Bloomberg; Chicago Mercantile Exchange; Eurex; London International Financial Futures and Options Exchange; BIS calculations. Graph 6
… while implied volatilities surge again

10 BIS Quarterly Review
Bond yields fall on flight to safety and growth concerns
Yields on long-term bonds in major industrialised economies broadly reflected developments in credit and other risky asset markets during the period under review. Bond yields rose somewhat in September and early October, when conditions in financial markets appeared to improve, but subsequently fell back as market strains again became apparent and the flight to safety resumed (Graph 7, left-hand panel). As was the case during the summer months, US bond yields displayed the largest declines among the G3 economies, with 10-year Treasuries falling by almost 75 basis points between mid-October and end-November, while corresponding euro area and Japanese bond yields fell by around 30 and 25 basis points respectively.
In money markets, which had seen severe disruptions as of early August, the situation continued to deteriorate into September, with interbank rates in most major economies, rising further from already high levels. The United Kingdom saw some of the sharpest increases in this period, as illiquidity problems at the mortgage lender Northern Rock became more and more evident, eventually triggering a bank run by worried savers. The UK Treasury’s announcement on 17 September that the government would guarantee deposits in Northern Rock ended the run on the bank and appeared to contribute to easing some of the tensions in interbank markets as well.
The situation in money markets slowly improved in the second half of September and through much of October, with interbank spreads narrowing somewhat. This followed a temporary reprieve from the flow of bad credit market news, continued injections of central bank liquidity (see Box 2) and easier US monetary policy. The 50 basis point rate cut by the Federal Reserve on 18 September had a particularly large impact (Graph 7, centre panel).
However, as bad news again began to flow in from the banking sector in mid-October and the sentiment in credit markets deteriorated, interbank money market rates rose once more. In another sign of increased nervousness, swap spreads widened considerably (Graph 7, right-hand panel), a development
Interest rates
Long-term bond yields1, 2 US short-term rates1 Ten-year swap spreads3
3.8
4.2
4.6
5.0
5.4
Jan 07 Apr 07 Jul 07 Oct 071.4
1.8
2.2
2.6
3.0
United States (rhs)Euro area (rhs)Japan (lhs)
4.2
4.7
5.2
5.7
6.2
Jul 07 Sep 07 Nov 07
Fed funds targetFed funds effective1-month Libor3-month Libor
15
30
45
60
75
Jan 07 Apr 07 Jul 07 Oct 07
United StatesEuro area
1 End-of-day data, in per cent. 2 Ten-year government bond yields; for the euro area, German bund. 3 In basis points.
Sources: Bloomberg; BIS calculations. Graph 7
… as money market strains intensify …
Bond yields fall …

BIS Quarterly Review 11
which historically has been associated with heightened risk aversion and perceptions of increasing risks to the banking system. Spreads between three-month interbank interest rates and overnight index swap (OIS) rates also rose (Graph 8), indicating some combination of greater preference for liquidity and rising counterparty risk premia: interbank lending involves payment upfront whereas OIS contracts are settled on a net basis at maturity. Market concerns were particularly acute with respect to the expected liquidity situation around the turn of the year – a period when liquidity demand normally tends to be heightened and markets particularly vulnerable to illiquidity – as indicated by a sharp spike in one-month interbank rates when this maturity began to span the turn of the year (Graph 7, centre panel). However, in addition to year-end concerns, implied forward interbank-OIS spreads seemed to signal expectations of a persistent lack of liquidity and lasting concerns about counterparty risk. Such forward spreads shifted upwards for horizons extending well into 2008, and the shape of the term structure beyond the turn of the year was consistent with investors anticipating tensions to remain high in money markets for an extended period of time (Graph 8).
In this environment, expectations of further policy rate cuts by the Federal Reserve strengthened in late October and in November, while expectations formed that the ECB and the Bank of Japan would remain on hold for some time (Graph 9, left-hand and centre panels). Whereas the Federal Reserve’s rate cut of 50 basis points on 18 September was larger than expected, the subsequent 25 basis point reduction on 31 October was fully anticipated by markets. At the time, the FOMC statement seemed to convey a neutral message (“the upside risks to inflation roughly balance the downside risks to growth”), and the option-implied probability of the Fed remaining on hold until end-January 2008 was above 50%. However, this probability dropped quickly in
Three-month Libor-OIS spreads and implied forward spreads1 In per cent
United States Euro area United Kingdom
0
0.3
0.6
0.9
Jan 07 May 07 Oct 07 Mar 08 0
0.3
0.6
0.9
Jan 07 May 07 Oct 07 Mar 08
Spreads30 November31 October
0
0.3
0.6
0.9
Jan 07 May 07 Oct 07 Mar 08 1 Three-month interbank Libor rates (for the United States, eurodollar; for the euro area, Euribor) minus corresponding overnight index swap (OIS) rates (for the euro area, EONIA swap). Forward curves display implied three-month forward spreads calculated from the term structure of Libor-OIS spreads on the indicated dates.
Sources: Bloomberg; BIS calculations. Graph 8
Further Fed rate cuts seen as increasingly likely …
… and are expected to persist

12 BIS Quarterly Review
Box 2: Central bank actions in response to the turmoil in money markets François-Louis Michaud and William Nelson Since August, several central banks in industrialised countries have taken a wide range of actions in response to the turmoil in money markets (see table), with a view to equilibrating demand and supply for central bank reserve balances at the policy rate. Demand had become elevated and more volatile since commercial banks faced more uncertain payment flows and a sharply higher cost of running short of cash. Depending on the assessment of the situation and on the operating framework, the steps taken have included changes to the size, frequency, maturity and other terms of market operations, as well as an easing of the terms on loans from standing facilities. Differences in frameworks complicate any cross-country assessment of the relative vigour of these actions.
Steps by selected central banks to enhance liquidity since August 20071 RBA BoC ECB BoJ SNB BoE Fed
Exceptional fine-tuning (frequency, conditions) Yes Yes Yes Yes Yes Yes Yes
Exceptional long-term open market operations No No Yes No Yes Yes Yes
Change in the standing lending facility No No No No No No Yes
Expansion of eligible collateral Yes Yes No No Yes2 Yes Yes
Change in banks’ reserve requirements No No No No No Yes3 No
Other change in the supply of reserves No No Yes4 No No No No
RBA = Reserve Bank of Australia; BoC = Bank of Canada; ECB = European Central Bank; BoJ = Bank of Japan; SNB = Swiss National Bank; BoE = Bank of England; Fed = Federal Reserve System. 1 Central banks representing the most traded currencies. 2 Entered into effect on 1 October, not linked with the turmoil. 3 In September. 4 Since October, excess liquidity provided at the beginning of the maintenance period and drained gradually. Source: Central banks.
In early August, several central banks responded to upward pressures on the overnight interest rate in their interbank markets both by temporarily injecting substantial reserves and by providing reserves more flexibly (see graph, left-hand and centre panels). The ECB conducted overnight fine-tuning operations, which in the recent past have generally occurred only about once a month, every day from 9 to 14 August. The amount of credit provided through the operations began at €95 billion but eventually declined to €8 billion. For the first operation, the ECB took the unusual step of meeting all demand at its policy rate of 4%; the other operations were conducted as regular variable rate tenders. On Friday 10 August, the Federal Reserve conducted an extraordinary three auctions of overnight repurchase agreements totalling $38 billion, with the final auction occurring in the early afternoon. While the Fed did not change the collateral it accepts for its market operations, primary dealers on some days in mid-August provided relatively large shares of mortgage-backed securities as opposed to Treasury or agency securities. A number of other central banks, including the Reserve Bank of Australia, the Bank of Canada, the Bank of Japan and the Swiss National Bank, also conducted market operations that were either outside their regular schedule or in larger than normal amounts in response to the turmoil in August, and in some cases subsequently.
The Bank of England normally supplies reserves through market operations in an amount equal to the aggregate of the reserve targets chosen by banks at the start of each month-long maintenance period.1 In September, reflecting the continued dislocation in markets, targeted reserves rose in aggregate by 6%. In addition, on 13 September, as the secured overnight rates had continued to exceed the policy rate by more than usual, the Bank expanded the aggregate amount of reserves provided by 25%. It also conducted an exceptional fine-tuning operation on 18 September, adding a further 25% of the aggregate reserve target. These additional reserves were subsequently re-offered at the scheduled weekly open market operation on 20 September.
In addition, central banks have taken a number of steps designed to address the continued shortage of funding in term money markets at maturities beyond overnight. The Federal Reserve cut the interest rate on its standing loan facility by 50 basis points on 17 August and increased the allowable term on loans from overnight to 30 days. This easing may have been intended to encourage banks to extend credit or backup lines to others. The ECB conducted exceptional long-term refinancing operations on 23 August and 12 September and has since maintained the resulting increased share of longer-term refinancing. Similarly, on 21 September, the Bank of England for the

BIS Quarterly Review 13
Outstanding central bank reverse transactions1 and money market rates2 in 2007
United States Euro area United Kingdom
0
22
44
66
88
9 Aug 4 Sep 28 Sep 24 Oct1
2
3
4
5
One day (rhs)³2 to 9 days (rhs)³More than 9 days (rhs)³Fed funds (lhs)
–100
150
400
650
900
9 Aug 4 Sep 28 Sep 24 Oct1
2
3
4
5
Main refinancing (rhs)Long-term refinancing (rhs)Fine-tuning (rhs)Policy rate (lhs)EONIA (lhs)
0
22
44
66
88
9 Aug 4 Sep 28 Sep24 Oct 0
1.4
2.8
4.2
5.6One week repo (rhs)4
Long-term repo (rhs)Fine-tuning repo (rhs)Overnight rate (lhs)
1 Amounts outstanding in billions of units of local currency; provisions and absorptions denoted by a positive and a negative sign, respectively. For the United States and United Kingdom, repurchase agreements; for the euro area, refinancing and fine-tuning operations. 2 In per cent. 3 Original maturity in business days. 4 The decline in one-week repos reflects reserves being supplied to the market by drawings under the support facility provided to Northern Rock.
Source: National data.
first time offered repurchase agreements with three-month maturities. The four auctions did not elicit any bids, however, as term rates had already eased somewhat after the programme had been announced. Towards the end of November, in response to heightened year-end pressures on interbank rates, the Federal Reserve and the ECB decided to conduct additional term transactions with maturities extending into 2008 and announced their intention to take additional steps to keep interbank rates near their respective policy rates as needed.
Several central banks have also widened somewhat the range of eligible collateral, temporarily or permanently. The Federal Reserve, although it had already accepted asset-backed commercial paper (ABCP) as discount window collateral, began in August to accept paper for which the pledging bank provides liquidity or credit support. The Bank of Canada decided in August to accept temporarily as collateral for its market operations all securities that were already eligible for its standing liquidity facility. In September, the Reserve Bank of Australia widened the list of collateral eligible for its overnight repo facility and its discretionary operations to include ABCP and residential mortgage-backed securities. The Bank of England’s three-month repurchase agreements were offered against a wider list of collateral than was applicable to the regular operations.
While the gross size of the operations increased during the turbulence, to a large extent injections of funds were reversed, in line with the average demand for reserve balances set by reserve requirement arrangements. In the United States, for instance, after spiking in one maintenance period in August, the amount of excess reserves (not shown) subsequently fell back to normal levels although repurchase agreements have increased in response to seasonal demands for cash and to offset redemptions of Treasury securities held outright. The comparative stability in the amount outstanding of refinancing operations in the euro area in part reflects the reabsorption of injections to ensure consistency with the demand set by reserve requirements.
It can be misleading to compare gross, or even cumulative net, amounts of central bank operations to gauge how far they accommodate the increased demand for reserves. For example, if the operations are of a shorter maturity, more of them will be needed to meet a given demand. Thus, although the amount of liquidity provided spiked in early August in the United States and the euro area, it was generally extended through overnight operations, which were automatically reversed the following day. Moreover, the average size of the demand can vary considerably across countries because of differences in the size of the reserve requirement. These requirements, for instance, are considerably higher in the euro area than in the United States. _________________________________
1 Banks are allowed to offset deficits with surpluses in meeting a target for reserves during a “maintenance period”. Outside the United Kingdom, this average target amount is generally set through a formula decided by the central bank (“reserve requirement”). See: BIS Papers no 9, “Comparing monetary policy operating procedures across the United States, Japan and the euro area”, December 2001; Markets Committee, Monetary policy frameworks and central bank operations, BIS, December 2007.

14 BIS Quarterly Review
the weeks following the FOMC meeting. At the end of November, by which time speeches by Federal Reserve officials pointed to the need for flexibility in determining policy rates, the option-implied probability of no rate change by end-January had fallen to around 5%, while interest rate cuts of 50 basis points or more were seen as the most likely outcome (Graph 9, right-hand panel).
As indicated by sharp declines in real yields on index-linked bonds, expectations of further monetary policy easing were largely fuelled by fears of the fallout from the continuing financial crisis on real economic growth. With indications that consumer confidence was deteriorating significantly and profits beginning to fall, expectations of a considerable slowdown in economic activity picked up. The fact that investors saw the US economy as particularly vulnerable was reflected in the more pronounced fall in US long-term real yields: between end-August and end-November, the yield on 10-year US index-linked bonds dropped by 75 basis points, whereas yields on similar bonds in the euro area and Japan declined by around 30 and 15 basis points respectively (Graph 10, left-hand panel). Survey results among bank economists largely mirrored this observation, with expectations for 2008 real GDP growth in the United States continuing to slide despite the sharp downward revisions of earlier months (Graph 10, centre panel). Even in the euro area and Japan, where growth expectations had held up relatively well throughout the turbulent summer months, autumn survey data showed that expectations for economic activity in 2008 were significantly dented. While continued domestic economic weakness seemed to largely explain the adjustment of growth expectations in the case of Japan, the persistent financial dislocations and resulting tighter credit conditions, in combination with a falling dollar, appeared to be behind much of the downward revisions in the euro area.
Forward curves and fed funds expectations In per cent
Fed funds futures EONIA and yen forward rates1 January 2008 FF expectations3
3.2
3.6
4.0
4.4
4.8
Aug 07 Dec 07 Apr 08 Aug 08
30 Nov 200728 Sep 200731 Aug 2007
2.8
3.1
3.4
3.7
4.0
Aug 07 Dec 07 Apr 08 Aug 080.6
0.9
1.2
1.5
1.8
Yen (lhs) 2
EONIA (rhs)
0
13
26
39
52
31 Oct 200730 Nov 2007 Unchanged
–25–50
–75
–100
1 Implied one-month rates. 2 Calculated from Libor fixing rates. 3 Probabilities of changes in the federal funds target rate (FF) implied by prices of fed funds futures and options. The values above the bars represent total reductions in FF between the dates indicated and end-January 2008 (in basis points), compared to the prevailing level of 4.5%. The probabilities on the vertical axis are expressed in per cent.
Sources: Bloomberg; BIS calculations. Graph 9
… as fears of a sharp slowdown increase
The financial crisis dents the euro area growth outlook …

BIS Quarterly Review 15
With credit-related jitters returning in October and November, foreign exchange markets experienced currency rate movements similar to those seen in the first round of the credit crisis. Reduced risk appetite and rising volatility once again prompted investors to roll back some of their carry trades. As a result, low-yielding funding currencies, such as the Japanese yen and the Swiss franc, strengthened against higher-yielding “target currencies” including the New Zealand dollar and the Australian dollar. However, in contrast to the experience during the summer months, the US dollar suffered a considerable and protracted fall between September and November, reaching repeated all-time lows against the euro and multi-year lows against the yen and a range of other currencies (Graph 10, right-hand panel). Expectations that US policy rates would be reduced more and faster than those in most other economies seem to have played an important role in explaining this dollar weakness.
One further characteristic of the financial turbulence during the period under review was that it was associated with a rise in break-even inflation rates in both the United States and the euro area. While 10-year break-even inflation rates in these economies had remained stable or had declined somewhat at the time of the mini sell-off in February–March as well as during the first bout of turbulence in the summer, they rose by around 20 basis points in the United States and 10 basis points in the euro area between end-August and end-November (Graph 11, left-hand panel). This seemed to signal an apparent increase in expected inflation, in line with survey data indicating a pickup in US and euro area inflation expectations for 2008 (Graph 11, right-hand panel). An increase in the correlation between oil prices and break-even inflation rates in recent months suggests that a significant part of the increase in inflation expectations might have been due to the surge in oil prices that took place during much of the period. Nonetheless, investors’ perceptions about monetary policy might also have played a role. Five-year forward break-even rates five
Real yields, growth expectations and exchange rates
Long-term real yields1 2008 GDP growth expectations2 Exchange rates
0.9
1.4
1.9
2.4
Jan 07 May 07 Sep 07 1.8
2.1
2.4
2.7
Jan 07 Apr 07 Jul 07 Oct 07
United StatesEuro areaJapan
0.67
0.70
0.73
0.76
Jan 07 Apr 07 Jul 07 Oct 07105
110
115
120
EUR/USD (rhs)JPY/USD (lhs)
1 Ten-year yields on index-linked government bonds, in per cent; for the euro area, based on French government bonds linked to euro area inflation. 2 Forecasts as published monthly by Consensus Economics, in per cent; observations are positioned in the month in which the forecast was made.
Sources: Bloomberg; © Consensus Economics; national data. Graph 10
… as oil prices rise …
Rising break-even rates signal higher inflation expectations …
… as the slide of the dollar continues

16 BIS Quarterly Review
years ahead, which are less likely to be influenced by increasing oil prices and other transient shocks, continued to rise to relatively elevated levels in both the United States and the euro area (Graph 11, centre panel). Investors seemed increasingly to take the view that central banks might have to maintain a more accommodative policy stance than normal in order to contain risks to economic growth stemming from the fragility in financial markets.
Emerging markets show signs of de- and recoupling
Emerging market assets continued to be generally supported by perceptions that downside risks to growth in many emerging market economies would be more limited than for the United States and other industrialised economies. Reflecting this so-called “decoupling” theme, and following large gains between end-August and late October, major emerging market equity indices outperformed their counterparts in the mature markets. However, with emerging market credit spreads seeing renewed widening from mid-October, a growing gap between credit and equity market developments suggested diverging investor views about the sustainability of relative valuations across markets and countries. These tensions, in turn, may have contributed to weaker equity markets later in the period.
The EMBI Global emerging market bond index gained some 4.3% in return terms between end-August and end-November, and 6.7% from its low point in mid-August. This favourable return performance helped to mask a clear shift in sentiment, which mirrored developments in broader credit markets. Emerging market spreads, which had tightened until 12 October, widened to near 260 basis points at the end of the period, some 4 points higher than the peak on 16 August (Graph 12, left-hand panel). In a sign of continued differentiation
Break-even inflation rates, oil price and inflation expectations
Ten-year break-even inflation rates and oil price
Five-year/five-year forward break-even inflation rates3
2008 inflation expectations4
2.1
2.3
2.5
2.7
Jan 07 Apr 07 Jul 07 Oct 0750
65
80
95
United States (rhs)¹Euro area (rhs)¹Crude oil (Brent, lhs)²
2.1
2.3
2.5
2.7
Jan 07 Apr 07 Jul 07 Oct 07
United StatesEuro area
1.8
2.0
2.2
2.4
Jan 07 Apr 07 Jul 07 Oct 070.3
0.5
0.7
0.9
United States (rhs)Euro area (rhs)Japan (lhs)
1 Nominal minus real 10-year zero coupon bond yields; five-day moving averages, in per cent. 2 In US dollars. 3 Five-year forward break-even inflation rates five years ahead, calculated from estimated zero coupon spot break-even rates; five-day moving averages, in per cent. 4 Forecasts as published monthly by Consensus Economics; observations are positioned in the month in which the forecast was made; in per cent.
Sources: Bloomberg; © Consensus Economics; national data. Graph 11
… but bond markets …
… and monetary policy is expected to be more accommodative Emerging market assets trade on “decoupling” theme …

BIS Quarterly Review 17
across borrowers, price increases for key commodities, with the WTI oil price pushing through $90/barrel on 25 October, tended to support issuers such as Ecuador and Venezuela over part of the period.
Emerging market equities rose to successive highs throughout October, before moving off these peaks in November. In part, emerging market valuations profited from positive developments in the US market. Between the FOMC decision on 18 September and 9 October, the day the S&P 500 reached its all-time peak, the MSCI emerging market index gained some 11% in local currency terms and another 5.5% by end-month. While losing part of these gains throughout November, the MSCI index still advanced by about 24% from its low on 17 August. With the US currency depreciating by an effective 3.9% against its emerging market trading partners over the same period, dollar returns were even higher, at near 30% (Graph 12, centre panel).
Emerging market equities continued to benefit from expectations of robust activity growth, with recent forecasts suggesting global GDP growth of around 4% in 2008. Consensus growth forecasts for China remained more than 1 percentage point higher than a year ago. Reflecting this positive sentiment, earnings forecasts remained robust, which restrained the rise in forward-looking measures of equity valuation. After sustained price gains in many emerging markets up until late October, average price/earnings ratios were, at around 14, roughly on a par with those in major industrialised economies. While weakening equity markets later in the period served to reduce these values, price/earnings multiples in a number of countries remained high by historical standards and relative to other markets. For example, valuations in China and India exceeded those in the United States and Japan by more than 30% and were even higher against their own longer-term averages. To the extent that global macroeconomic conditions helped to sustain these levels, valuations could thus look elevated for some markets if changes to the global outlook were to depress projected earnings (Graph 12, right-hand panel).
Emerging market assets
Credit spreads and EMBI returns MSCI regional equity prices5 Emerging market P/E ratios6
70
150
230
310
390
Jan 05 Jan 06 Jan 07300
325
350
375
400
CDX.EM index (rhs)1, 2
EMBIG (rhs)1, 3
EMBIG Ret (lhs)4
40
70
100
130
160
Jan 05 Jan 06 Jan 07
AsiaLatin AmericaEmerging Europe
7
9
11
13
15
Jan 05 Jan 06 Jan 071 In basis points. 2 Five-year on-the-run CDS mid-spread for 14 emerging market issuers. 3 EMBI Global index; sovereign spread over government bond yields. 4 EMBI Global index; cumulative total return index as calculated by JPMorgan Chase. 5 In local currency; 31 December 2005 = 100. 6 P/E ratios based on consensus forecasts of one-year operating earnings; MSCI indices.
Sources: Bloomberg; Datastream; I/B/E/S; BIS calculations. Graph 12
… equity valuations in some countries are high by historical standards
While growth forecasts remain favourable …
… are drawn into broader market weakness
… as well as equities …


BIS Quarterly Review, December 2007 19
Ryan Stever+41 61 280 6915
Christian Upper+41 61 280 8416
Goetz von Peter+41 61 280 8326
Highlights of international banking and financial market activity1
The BIS, in cooperation with central banks and monetary authorities worldwide, compiles and disseminates several datasets on activity in international banking and financial markets. The latest available data on international debt securities and exchange-traded derivatives refer to the third quarter of 2007, thus covering some of the recent turbulence in financial markets. The discussion on over-the-counter derivatives refers to the first half of 2007, and that on international banking markets to the second quarter.
The international debt securities market
Borrowing in the international debt markets retreated sharply during the turmoil in financial markets in the third quarter of 2007. Net issuance of $396 billion in bonds and notes was less than half that of the previous quarter. Year-on-year growth was negative (–4%) for the first time in two years, and well below both the 18% growth the previous quarter and the 7% average since 2003.
Stagnation was evident across an array of currency denominations, though not all (Graph 1, right-hand panel). The $90 billion in new euro-denominated bonds and notes represented a year-on-year decline of 9% (compared to a 17% decrease the previous quarter), while the dollar and sterling segments sagged to 0% and 2%, respectively (from 17% and 14% the previous quarter). Perhaps reflecting the relative stability of Japanese money markets during the quarter, the issuance of yen-denominated bonds and notes appears to have been little affected by the turbulence. Indeed, year-on-year growth in this segment remained elevated at 30%. The $18 billion in net yen borrowing in the third quarter accounted for nearly 4% of global issuance, the highest yen share in three years.
The decline in euro-denominated borrowing reflected weak issuance in the euro area, particularly from French and German residents (Graph 1, left-hand panel). There was only $82 billion in new bonds and notes issued by euro area borrowers, following $392 billion the previous quarter. For the first time since the 1980s, German net issuance was negative (–$20 billion), while the 1 Queries concerning international debt securities and derivatives statistics should be
addressed to Christian Upper and those regarding the banking statistics to Goetz von Peter.
Sharpest declines in euro-denominated borrowing
Net issuance of bonds and notes less than half that of the previous quarter

20 BIS Quarterly Review, December 2007
$10 billion in borrowing from residents of France was significantly below the $34 billion average over the last five years. For residents of both these countries, the decrease in issuance was due to a fall in financial sector borrowing, particularly from private banks.
Although the decline was not as marked, net issuance in the United States, the United Kingdom and Australia also fell from the previous quarter. Borrowing from the United States was around $190 billion in the third quarter, which corresponded to a year-on-year growth rate of 4%, well below the previous quarter’s 22%. The $74 billion in international debt added by UK borrowers reflected the first case of negative year-on-year growth since 2004. The $11 billion raised by Australian residents, mostly private financial institutions, represented a 3% year-on-year decrease (compared to a 13% increase the previous quarter), and was well below the $20 billion in borrowing in each of the last three quarters.
In the emerging economies, bond and note issuance declined even more significantly than in the advanced economies, coinciding with a significant widening of emerging market bond spreads (Graph 1, centre panel). Borrowing in emerging Europe and Asia decreased particularly sharply. Announcements from emerging Europe were over 75% lower than the previous quarter, with year-on-year growth falling to –7%. Net issuance from borrowers of the emerging economies in the Asia-Pacific region was a mere $1 billion, the lowest since the third quarter of 2001.
The decline in emerging market issuance may have reflected a retreat in the risk appetite of the investment community more generally. Examining gross issuance in the third quarter by credit quality class for international debt securities, the slowdown is most pronounced for non-investment grade bonds (Graph 2, left-hand panel). While non-investment grade debt issuance had expanded by an average of 11% year on year over the previous two years, in the latest quarter it collapsed to nearly one fifth the level of the previous
Net issuance of international bonds and notes By nationality of issuer and currency, in billions of US dollars
Developed countries Emerging markets By currency2
0
200
400
600
800
2004 2005 2006 2007
Euro areaUnited StatesUnited Kingdom
–30
0
30
60
90
2004 2005 2006 2007–120
–60
0
60
120
Africa & Middle EastAsia-PacificEuropeLatin America & CaribbeanChange in EMBI spread (lhs)¹
–5
0
5
10
15
2004 2005 2006 20070
20
40
60
80
AUD CADGBP JPYUSD (lhs) EUR (lhs)
¹ Quarterly change in spread of JPMorgan EMBI Composite index. ² Four-quarter moving averages of percentage share in total net issuance. AUD = Australian dollar; CAD = Canadian dollar; GBP = pound sterling; JPY = Japanese yen; USD = US dollar; EUR = euro.
Sources: Dealogic; Euroclear; ICMA; Thomson Financial; BIS. Graph 1
Emerging market borrowing slows …
… as does issuance of non-investment grade debt

BIS Quarterly Review, December 2007 21
quarter, leaving year-on-year growth at –10%. US non-investment grade borrowing dropped from $10 billion the previous quarter to $1 billion, while issuance from the euro area declined from $11 billion to $3 billion.
That said, even borrowing in some of the most highly rated markets was affected by the turmoil in credit markets. Issuance of covered bonds, securities issued by financial institutions that are backed by mortgage and government debt and are typically thought to be almost free of credit risk, slowed sharply in the second half of the third quarter (Graph 2, right-hand panel). The $27 billion in announcements in September marked the lowest level for that month since 2004. Spanish covered bond issuance slowed by more than that of other countries. The $5 billion in new borrowing by Spanish borrowers in the third quarter sank year-on-year growth to –8% and meant the slowest quarter for these issuers since the third quarter of 2003.
Among sectors, private non-financial borrowing slowed the least, with year-on-year growth nearly flat. Notable issues that attracted demand included some from US corporate Johnson & Johnson announced on 13 August. The five-year issue was AAA-rated and sold at a 62 basis point spread over the benchmark, and there were enough orders to warrant an increase in the size of the initial issuance by $100 million. Even some lower-rated corporates sold bonds at typical spreads. A 10-year bond rated BBB+ from Comcast announced on 20 August sold at a spread of 170 basis points, reportedly only around 10 basis points over the typical spread for this type of bond.
Derivatives markets
Exchange-traded derivatives
The turbulence in financial markets led to the busiest trading on record on the international derivatives exchanges. Activity was particularly strong in derivatives on short-term interest rates, whose trading volumes went up by
Announced bond issuance In billions of US dollars
Non-investment grade1 Covered2
0
10
20
30
2004 2005 2006 2007
United States JapanEuro area United KingdomOther
0
40
80
120
2004 2005 2006 2007
Germany SpainFrance United KingdomOther
¹ International issuance. ² Domestic and international issuance.
Sources: Dealogic; BIS. Graph 2
Surge in turnover of futures and options …

22 BIS Quarterly Review, December 2007
Potential causes
31% in the third quarter.2 Rapid growth was also recorded in contracts on stock indices (19%) and on foreign exchange (18%). Activity in government bond contracts, by contrast, showed a more moderate rate of increase (8%). Combined turnover in listed interest rate, currency and stock index derivatives rose by 27% to $681 trillion between July and September, after remaining stable in the previous quarter. The year-on-year rate of growth accelerated to 46%, from 11% in the second quarter.
The surge in activity in futures and options on short-term interest rates contrasts with reports of a decline in activity in other segments of the money market. Although turnover in money market derivatives increased in several currencies, the sharpest rises were recorded in contracts on short-term sterling (47%) and euro interest rates (43%), followed by US dollar contracts (28%). Turnover in all three currencies soared, as the spread between three-month interbank rates and rates paid on overnight interest rate swaps – a measure of pressures in the money market – widened in August (Graph 3). In September, activity declined in dollar- and euro-denominated contracts, but continued to increase in sterling derivatives. Similar spikes in turnover in exchange-traded money market derivatives had been observed during previous episodes of market stress. For example, turnover in eurodollar futures and options shot up by 241% between August and September 1998, when the near failure of a large hedge fund sparked significant distress.
The precise channels through which financial turbulence feeds into high turnover are not clear, though. One factor that is likely to have played a role in August is the hedging needs of banks forced to rely on the overnight market for their funding as liquidity in longer-term segments of the money market dried up. This is supported by the fact that turnover in derivatives on federal funds increased by a greater magnitude (158% month on month) in August than turnover in contracts on three-month eurodollar rates (65%). It is also possible that market participants shifted some trading from the spot market or from over-the-counter derivatives onto the exchanges, either because of lower perceived counterparty risk given the existence of a central counterparty or because of the higher market transparency.
The turbulence in international financial markets also left its imprint in the foreign exchange segment, where turnover went up by 18% to $6 trillion in the third quarter. This rise was mainly driven by a sharp increase in the volumes of contracts on the yen (55%) and the Swiss franc (24%). While this is consistent with reports of a large-scale unwinding of carry trades during August and September, a similar increase in activity has not been recorded in any of the major target currencies. For example, turnover in contracts on the Australian dollar increased by 17%, sterling by 12%, the Brazilian real by 9%, and the New Zealand dollar by 3%.3
2 All growth rates in this section refer to quarter-on-quarter increases, unless otherwise noted.
3 See G Galati et al, “Evidence of carry trade activity”, BIS Quarterly Review, September 2007, pp 27–41, on how the available data can be used to assess the size of carry trade positions.
Heavy trading in contracts on the yen
… particularly in money market contracts

BIS Quarterly Review, December 2007 23
A surge in activity on Chinese exchanges lifted turnover in commodity markets in the third quarter. Global turnover in commodity derivatives measured by the number of contracts traded (notional amounts are not available) increased by 26%, owing to a rapid expansion in agricultural commodities (53%). Turnover in derivatives on precious metals rose by 10%, while the number of contracts on non-precious metals and energy remained approximately stable. An increase in activity in agricultural commodities was almost entirely driven by higher activity in contracts listed on Chinese exchanges, which tend to refer to considerably smaller physical quantities than those traded on the dominant Chicago exchanges (see BIS Quarterly Review, March 2007, p 26).
OTC derivatives
In November, the BIS released the latest statistics on positions in the global over-the-counter (OTC) derivatives market. These comprise the results of the second part of the Triennial Central Bank Survey of Foreign Exchange and Derivatives Market Activity as well as the regular semiannual OTC derivatives statistics.4 The two surveys share the same format but differ in coverage. The triennial survey is more comprehensive. It contains information on instruments not covered by the semiannual survey, in particular credit derivatives other than credit default swaps (CDSs). Moreover, whereas the semiannual survey aggregates data from major dealers in the G10 countries and Switzerland, the triennial survey covers market participants in 47 jurisdictions.
Positions in the OTC derivatives market have increased at a rapid pace since the last triennial survey was undertaken in 2004. Notional amounts
4 For a discussion of the methodology of the two surveys, see the November 2007 Statistical
Release, available at www.bis.org/publ/otc_hy0711.htm.
Turnover in short-term interest rate contracts Monthly data, in trillions of US dollars
US dollar Euro Sterling
0
40
80
120
160
Mar 07 May 07 Aug 070
25
50
75
100Options (rhs)Futures (rhs)Spread (lhs)¹
0
15
30
45
60
Mar 07 May 07 Aug 070
25
50
75
100
0
10
20
30
40
Mar 07 May 07 Aug 070
25
50
75
100
1 Three-month interbank Libor rates (for the United States, eurodollar; for the euro area, Euribor) minus corresponding overnight index swap (OIS) rates (for the euro area, EONIA swap), in basis points.
Sources: Bloomberg; FOW TRADEdata; Futures Industry Association; BIS calculations. Graph 3
High level of activity in commodity markets
Developments since last triennial survey in 2004
Triennial survey and regular OTC derivatives statistics

24 BIS Quarterly Review, December 2007
outstanding of such instruments totalled $516 trillion at the end of June 2007, 135% higher than the level recorded in the 2004 survey (Graph 4). This corresponds to an annualised compound rate of growth of 33%, which is higher than the approximatively 25% average annual rate of increase since positions in OTC derivatives were first surveyed by the BIS in 1995.5 Notional amounts outstanding provide useful information on the structure of the OTC derivatives market but should not be interpreted as a measure of the riskiness of these positions. Gross market values, which represent the cost of replacing all open contracts at the prevailing market prices, have increased by 74% since 2004, to $11 trillion at the end of June 2007.
While growth has accelerated in all major risk categories during the last three years, the highest rate of increase was reported in the credit segment. Positions in credit derivatives stood at $51 trillion at end-June 2007, compared to under $5 trillion in the 2004 survey. CDSs are by far the dominant instrument in this category, accounting for 88% of positions in credit derivatives.
The triennial survey provides a useful benchmark against which the coverage of the semiannual data can be assessed. It turns out that the 55 reporting dealers surveyed on a half-yearly basis account for 88% of total positions in that market, reflecting the fact that OTC derivatives are generally executed between a large bank or securities house and a customer.6 The coverage of the semiannual survey is lowest in the equity and foreign exchange segments, where the regular reporters account for approximately 85% of total positions. A much higher coverage is achieved in CDSs (94%).
5 The 1995 survey covered OTC foreign exchange and interest rate derivatives only. However,
other evidence suggests that positions in other risk categories were relatively small at the time. The bias resulting from incomplete coverage is therefore probably small.
6 Of course, this ignores the possibility that contracts are entered into between institutions that do not report to the triennial survey. Conversations with market participants suggest that such positions are likely to be extremely small relative to those covered by the two surveys.
Positions in OTC derivatives markets In trillions of US dollars1
Open positions Notional amounts by risk category
0
100
200
300
400
500
1992 1995 1998 2001 2004 20070
25
50
75
100
125 Outstanding amounts (rhs)Gross market values (lhs)
0
100
200
300
400
500
Foreignexchange
Interestrate²
Equity Commodity Credit
Triennial survey 2004Triennial survey 2007
1 All figures are adjusted for double-counting. 2 Single currency contracts only.
Source: BIS Triennial Survey. Graph 4

BIS Quarterly Review, December 2007 25
Box 1: Turnover in OTC derivatives markets
This box discusses developments in the turnover of OTC derivatives in April 2007, drawing on the recent BIS Triennial Central Bank Survey of Foreign Exchange and Derivatives Market Activity (www.bis.org/triennial.htm). Turnover in the foreign exchange market is explored in more detail in the feature on page 63 of this issue.
Trading volumes in the OTC derivatives market continued to expand at a rapid pace between 2004 and 2007. Average daily turnover of interest rate and non-traditional foreign exchange derivatives contracts reached $2,090 billion in April 2007, 71% higher than three years before (see table). This corresponds to an annual compound rate of growth of 20%, which is in line with the growth recorded since the derivatives part of triennial survey was started in 1995.
Growth was particularly strong in the FX segment, where average daily turnover in cross-currency swaps and foreign exchange options increased by 108% to $292 billion in April 2007, thus outstripping growth in “traditional” instruments such as spot, forward and FX swap contracts (71%). While options remained the main “non-traditional” FX instrument in the OTC market, accounting for slightly less than three quarters of total turnover, the instrument with the fastest rate of growth (279%) was actually cross-currency swaps, whose turnover increased to $80 billion. In part, this growth could be explained by the hedging of foreign currency bonds. April 2007 saw a large issuance of dollar-denominated bonds by non-resident issuers, some of whom may have hedged their obligations in the swap market.
More moderate growth than in FX contracts was recorded in the interest rate segment, where average daily turnover increased by 65% to $1,686 billion. The euro remained the leading currency in this segment, although the gap vis-à-vis the US dollar narrowed. In the reporting period, 39% of turnover took place in euro-denominated contracts, and 32% in dollar. However, their combined share has fallen by nearly 10 percentage points since the 2004 survey, as turnover growth in several non-core markets has outstripped that in the two leading currencies. For example, average daily trading volumes of sterling-denominated interest rate derivatives increased by 91%, compared to rates of growth of 42% and 53%, respectively, in the euro and the dollar. Turnover in contracts denominated in the yen almost tripled, bringing that currency’s share in total turnover to over 8%, from 4.5% three years before. To some extent, rapid growth in the yen market reflects a catching-up since for many years activity in that market had been hampered by low and stable interest rates.
Global OTC derivatives market turnover by instrument1 Average daily turnover in April, in billions of US dollars
Instrument 1998 2001 2004 2007
A. Foreign exchange instruments 97 67 140 291 Cross-currency swaps 10 7 21 80
Options 87 60 117 212
Other 0 0 2 0 B. Interest rate instruments2 265 489 1,025 1,686
FRAs 74 129 233 258
Swaps 155 331 621 1,210
Options 36 29 171 215
Other 0 0 0 1
C. Estimated gaps in reporting 13 19 55 113 D. Total 375 575 1,220 2,090 1 Adjusted for local and cross-border double-counting. 2 Single currency interest rate contracts only.
Turning to the regular, semiannual derivatives statistics, growth in the amounts outstanding of OTC derivatives accelerated in the first half of 2007, prior to the turbulence that hit financial markets in August and subsequent months.
Developments in the first half of 2007

26 BIS Quarterly Review, December 2007
Notional amounts outstanding of all types of OTC contracts increased by 25% between January and June, after a 12% increase in the second half of 2006. Growth accelerated in all risk categories with the possible exception of commodities,7 although once again the pace of increase in CDSs (49%) outstripped the rises in other risk categories.
The international banking market
Locational banking statistics
Following a surge in the first quarter, international banking activity returned to a more moderate pace during the second quarter of 2007. Cross-border claims expanded by $1.3 trillion to stand at $30 trillion, up 22% relative to a year earlier. As claims on non-banks continued to grow steadily (23% year on year), the moderation was entirely due to a slowdown in the growth of interbank activity. The US dollar share in the expansion was 47%, followed by those of the euro (30%) and the yen (10%). Swiss franc- and sterling-denominated claims remained nearly constant, after an exceptional expansion in sterling activity the previous quarter.
Credit to non-banks continued on a robust growth path. Cross-border claims on non-bank entities expanded by $594 billion, following similar increases in the previous two quarters (23% year on year). Most of this credit was granted in the form of loans and, as a result, the share of debt securities in total non-bank claims outstanding fell below 38%, down from 43% at end-2005. During the latest quarter, the main destinations were the United States ($177 billion), the euro area ($132 billion) and emerging markets ($106 billion).
Emerging markets received an unprecedented flow of bank credit. While bank claims on emerging markets soared by $201 billion, well beyond the record set in the first quarter of 2007, new deposit placements with BIS reporting banks fell below $100 billion for the first time in a year. As a result, emerging markets attracted $104 billion of net bank flows during the quarter. Half of this amount went to emerging Europe alone. Africa and the Middle East also attracted a record $32 billion, as inflows to the region were for once not offset by outflows in the form of deposit placements. Latin America was the only region where deposit placements ($28 billion) exceeded inflows, resulting in a net outflow of $4 billion.
Net inflows to emerging Asia ($22 billion) reflected both growing in- and outflows ($73 billion and $50 billion, respectively). China attracted $17 billion in net claims, with little change in deposits. Residents of Korea received $16 billion, in part by reducing their international deposit holdings by $5 billion. Growth in claims on Korea moderated somewhat, to 40% year on year (down from 63% the previous quarter), following efforts by the Korean authorities to check the build-up of foreign banks’ claims on their Korean affiliates.
7 The high rate of growth in commodity contracts in the second half of 2006 is likely to have
been caused by substantial revisions of the amounts outstanding at the end of 2006.
Bank credit to emerging markets hits new record …
Loans to private non-banks continue to expand
Banking activity returns to a more moderate pace

BIS Quarterly Review, December 2007 27
Box 2: The evolving instrument composition of official holdings of US dollars Robert N McCauley
The establishment of the China Investment Corporation to invest a portion of China’s reserves has raised the salience of the choice of asset classes by official investors. This box reviews the recent evolution of official investment in US dollar instruments globally. Comparing the mix of identified dollar holdings in mid-2006 with that in mid-2004, several long-standing trends remain in evidence: the shift to longer-duration holdings and the shift away from US Treasury obligations to agency securities and, to a lesser extent, corporate debt securities.1 At the same time, official holdings of equities in the United States have not risen much. Pursuit of higher returns with a corresponding acceptance of greater risk on the part of official investors remains a gradual process that to date has been largely confined to fixed income, at least within their dollar holdings.
The shift by official investors to longer-maturity investments, which started with the global bond rally in the 1980s, has continued this decade. In mid-2004, 60.6% of identified holdings were long-term securities; by mid-2006, this share had risen to 69.0%. While the practice of official reserve managers of buying coupon securities with less than one year to maturity implies that aggregating holdings by original maturity may overstate the preference for longer tenors, official holdings of long-term securities rose from 51.7% to 58.9% over the same period when measured on a residual maturity basis as well.
Notwithstanding this shift to longer-maturity holdings, the share of Treasury securities fell in favour of agency and, to a lesser extent, corporate debt securities. Treasury securities fell from 52.3% of identified holdings to 46.9%. If unidentified holdings of long-term dollar securities offshore were taken into account, the share of Treasury obligations would probably be less than 40% and perhaps as low as a third. By contrast, official holdings of long-term agency securities more than doubled over the two years. As a share of the identified portfolio, they rose from 9.6% to 15.8%, while holdings of corporate bonds rose from 2% to 3%. Contained in the latter were $30 billion in corporate asset-backed securities held in mid-2006, which could include those backed by mortgages that did not meet the standards of the government-supported mortgage enterprises.
Since mid-2006, the shift from Treasury to agency securities has accelerated. Although they can understate official purchases subsequently captured in surveys of holdings, monthly flow data strongly suggest such an acceleration. Cumulative purchases up to August 2007 of US Treasury coupon securities totalled $50 billion, while cumulative purchases of agency securities (adjusted for estimated principal repayments on agency asset-backed securities) totalled over $125 billion. In the strained markets of August 2007, reported official sales of Treasury coupon securities hit $30 billion, even as official purchases of agency securities remained positive at $2 billion. Cumulative purchases of corporate notes may have fallen not far short of purchases of Treasuries.
Given the breadth of discussion of a potential shift of foreign official holdings into equities, the striking observation is the modest increase in identified official holdings of US equities. True, the share rose from 6% to 7%. But price appreciation alone can account for this rise. Cumulative reported purchases of equities by officials since mid-2006 have been about zero.
The limitations of these data should be recognised. They mostly combine US Treasury International Capital data collected by the Federal Reserve and the Treasury, on the one hand, and BIS data on official US dollar deposits offshore, on the other. It is known that neither system succeeds in capturing all official holdings. Moreover, as noted above, neither system is designed to capture the securities holdings of official investors in offshore depositories, including many highly rated issues by non-US obligors favoured by official investors. Finally, the US Treasury’s definition of “official” includes many sovereign wealth funds not included in reserve holdings as reported to the IMF, so that IMF-reported dollar reserves are not strictly comparable.
Nevertheless, the data capture enough of global official holdings of dollars to support several observations. The shift to longer-term holdings is robust to the limitations just reviewed, and indeed would probably only be more obvious if long-term dollar securities held outside the United States were captured. The same applies to the shift away from US Treasury securities, and the increase in agency and corporate holdings. Finally, identified official holdings of US equities do not as yet demonstrate much increase in the official appetite for equity gains and risk.

28 BIS Quarterly Review, December 2007
Instrument composition of official holdings of US dollars In billions of US dollars and per cent
Short-term
Long-term1
Total Short-term
Long-term1
Total
End-June 2004 End-June 2006
Treasury securities 249 923 1,172 188 1,213 1,401
Other assets 635 434 1,069 803 846 1,649
Repos and deposits in the United States 141 195
Commercial paper and certificates of deposit in the United States 93 125
Offshore deposits 401 37 483 62
Agency securities 216 473
Corporate bonds 47 96
Equities 134 215
Total 884 (39.4)
1,357 (60.6)
2,241 (100)
991 (32.5)
2,059 (67.5)
3,050 (100)
Memo: Share of Treasury securities in identified assets of the given maturity 28.2 68.0 52.3 19.7 59.4 45.9
Total IMF-reported US dollar reserves 1,643 1,999 1 Defined by original maturity. By remaining maturity, the share was 51.7% at end-June 2004 and 59.6% at end-June 2006.
Sources: Figures for US Treasury, agency and corporate bonds and equities are from US Treasury, Federal Reserve Bank of New York and Board of Governors of the Federal Reserve System, Report on foreign portfolio holdings of US securities as of June 30, 2004 (2006) and at end-June 2006 (May 2007). Figures for deposits and money market paper in the United States are from BEA, International Transactions, Table 4 (or the US Treasury Bulletin, Tables CM-I-2 and IFS-2). Figures for offshore US dollar deposits are estimated from the BIS Quarterly Review, Table 5C, the Japanese SDDS for June 2004 and 2006, and the BIS Annual Report. The US Treasury definition of official institutions, including “national government-sponsored investment funds” (page 10), may be broader than those of the BIS and the IMF. IMF data from COFER.
Some central banks in emerging markets responded to strong inflows by
adding to their reserves. Official monetary authorities deposited $161 billion with BIS reporting banks in the first half of 2007, increasing their holdings in banks by 14%. In contrast to the first quarter, new deposits in the second quarter were almost exclusively in US dollars, raising the dollar share from 53% to 55%. Even so, the dollar share remains below the 65% quoted for overall official foreign exchange reserves.8 (For a perspective on the role of offshore deposits in the management of official foreign exchange reserves, see Box 2.)
Cross-border bank lending to emerging Europe has accelerated considerably over the last five years (Graph 5). Total claims of BIS reporting banks on the region currently stand at $727 billion and have been growing at 39% year on year.9 Russia and Turkey, the two largest economies in the
8 IMF data on official foreign exchange reserves (COFER) report total reserves with identified
currency composition at $3.65 trillion, of which $2.37 trillion in US dollars (preliminary data for the second quarter of 2007). BIS reporting banks’ liabilities to official monetary institutions with identified currency composition amount to $1.3 trillion, of which $714 billion are in dollars, and $381 billion in euros.
9 This figure is based on reported cross-border bank claims on eastern European countries, including Russia, Turkey and Slovenia. (Excluding these countries brings total claims to $464 billion.) Total foreign claims on the region are larger still ($1,171 billion, from the BIS
… with rapid growth of lending to emerging Europe

BIS Quarterly Review, December 2007 29
region, have the greatest stock of claims outstanding. However, as the region also holds substantial international deposits, banks’ net claims are considerably lower ($189 billion). Much of this difference is due to Russian deposit placements ($258 billion).
There is considerable diversity within this region owing to a range of country-specific factors; still, some general observations can be made at the subregional level.10 Central European countries (Graph 5, left-hand panels) have a greater amount of debt outstanding to international banks than do southeastern European countries, in part due to a longer history of financial deepening. By contrast, the Baltic states and southeastern European countries are attracting foreign credit at the fastest rates, albeit from a lower base (Graph 5, centre panels). Growth in cross-border credit to this group ranged from 40 to 100% per annum at end-June 2007. Contributing factors include recent EU accession (Bulgaria and Romania), exchange rate stability due to currency boards (the Baltic states and Bulgaria) and, in some cases, temporary outward migration giving rise to remittances.
Consolidated banking statistics
The consolidated banking statistics, which are compiled according to the nationality of reporting banks and net out inter-office positions, show an overall expansion of foreign claims during the second quarter of 2007 to $31 trillion on an immediate borrower basis (IB), and to $26 trillion on an ultimate risk basis (UR).11 A large share of the expansion (IB) was accounted for by banks headquartered in Germany (21%), France (18%) and the United States (16%), each adding over $200 billion in new claims, followed by banks headquartered in Japan (7.7%) and the Netherlands (6.5%). Regarding contingent facilities (UR), credit commitments continued to expand at the annual rate of 32% to reach $4.7 trillion outstanding. Contingent claims were outpaced, however, by contingent liabilities: guarantees have been extended at an annualised rate of 77% to stand at $5.7 trillion, underwritten primarily by US, Swiss, French and UK banks.
The large flows to emerging markets visible in the locational statistics are mirrored in a substantial increase in consolidated foreign claims. Foreign claims on emerging markets increased by over $300 billion, of which emerging Europe and Asia received a third each, while Latin America received 22%, and Africa and the Middle East 12% (IB). The emerging market share in reporting banks’ portfolios rose, in a single quarter, from 11.2% to 11.8% (IB), and from 11.% to 12.5% (UR). In 2004, this share stood at 9.6% (IB). Among the 24 countries reporting their banks’ ultimate risk exposures, UK banks have
consolidated banking statistics), because they include foreign banks’ local claims. The region as a whole features a high degree of foreign bank ownership.
10 Cyprus and Malta should be considered separately for their role as entrepôt banking facilities.
11 The consolidated statistics on an ultimate risk basis differ from those on an immediate borrower basis by taking into account net risk transfers related to guarantees and collateral. While IB data are reported by banks headquartered in 30 countries and include positions of resident foreign banks, UR data are submitted by banks headquartered in 24 countries.
Expansion driven by German, French and US banks
Rising exposures to emerging markets …

30 BIS Quarterly Review, December 2007
accumulated $507 billion and US banks $454 billion of foreign claims on emerging markets, followed by French, Spanish, German, Austrian, Dutch and Swiss banks, each holding exposures in the range of $200–300 billion. As a share of their foreign claims portfolio, the exposures to emerging markets of Greek (71%) and Austrian (49%) banks stand out. By comparison, banks headquartered in emerging markets maintain relatively low foreign exposures to other emerging markets (12.5% IB, 14.7% UR).12
Allocating a high portfolio share to emerging markets does not, however, imply high concentration vis-à-vis individual countries. Graph 6 shows a measure of portfolio concentration for banks headquartered in 30 countries.13 Greek and Austrian banks show fairly low concentration at the 12 Emerging markets reporting consolidated banking statistics include Chile, India, Taiwan
(China) and Turkey (IB and UR) as well as Mexico and Brazil (IB).
13 This measure only captures concentration in the value of claims allocated to individual countries; it does not take into account risk or ratings.
Credit to emerging Europe1
Central Europe Southeastern Europe and Baltics Others
02 03 04 05 06 07
HR CZ HUPL SK SI
02 03 04 05 06 07
BG EE LVLT RO
–40
0
40
80
120
02 03 04 05 06 07
CY MTRU TR
HR CZ HU PL SK SI
Total claims²Net claims³
BG EE LV LT RO –120
–80
–40
0
40
80
120
CY MT RU TR
BG = Bulgaria; CY = Cyprus; CZ = Czech Republic; EE = Estonia; HR = Croatia; HU = Hungary; LT = Lithuania; LV = Latvia; MT = Malta; PL = Poland; RO = Romania; RU = Russia; SI = Slovenia; SK = Slovakia; TR = Turkey.
¹ Upper panels: year-on-year growth rate of total claims of BIS reporting banks; lower panels: stocks of total claims and net claims, end-June 2007. ² Of BIS reporting banks on the respective countries, in billions of US dollars. ³ Equals total claims minus total liabilities of BIS reporting banks vis-à-vis the respective countries.
Source: BIS locational banking statistics. Graph 5
... contribute little to portfolio concentration

BIS Quarterly Review, December 2007 31
country level, indicating an emerging market exposure that is diversified across many countries. Similarly, those banks with the largest international portfolios, notably German, UK, French, Dutch, Japanese and US banks, tend to have moderate concentration (Swiss banks being the main exception in this group). The highest concentration in international bank portfolios appears to occur in the presence of an important neighbour. Mexican and Canadian banks concentrate 61% and 65% of their respective international portfolios on US entities, while 47% of Australian banks’ combined portfolio relates to entities in New Zealand.
Portfolio concentration of country exposures1
0
1,000
2,000
3,000
4,000
AT US PT LU All
SG DE
BE FR IN SE
GR HK
NO PA NL FI GB TR BR
TW ES IT DK JP IE CH CL
AU CA
MX
Immediate borrower basisUltimate risk basis
¹ For banks of each nationality, the portfolio considered here consists of their combined foreign claims, as of end-June 2007. Portfolio shares express foreign claims vis-à-vis individual countries as a percentage of the value of all foreign claims in the portfolio. Portfolio concentration is then measured by the Herfindahl index, the sum of squared portfolio shares.
All = all reporting countries; AT = Austria; AU = Australia; BE = Belgium; BR = Brazil; CA = Canada; CH = Switzerland; CL = Chile; DE = Germany; DK = Denmark; ES = Spain; FI = Finland; FR = France; GB = United Kingdom; GR = Greece; HK = Hong Kong SAR; IE = Ireland; IN = India; IT = Italy; JP = Japan; LU = Luxembourg; MX = Mexico; NL = Netherlands; NO = Norway; PA = Panama; PT = Portugal; SE = Sweden; SG = Singapore; TR = Turkey; TW = Taiwan, China; US = United States. Six countries, namely Brazil, Denmark, Hong Kong SAR, Luxembourg, Mexico and Panama, do not provide consolidated banking data on an ultimate risk basis.
Source: BIS consolidated international banking statistics. Graph 6


BIS Quarterly Review, December 2007 33
Goetz von Peter+41 61 280 8326
International banking centres: a network perspective1
International banking centres have attracted renewed interest recently, as established centres compete over more dimensions while new centres emerge. Comparative studies often focus on indicators of financial activity in a particular location, but the prominence of an international banking centre also reflects cross-border linkages with banks in other locations. This feature combines these cross-border linkages into a global network and identifies important banking centres using network methods. The range of measures discussed capture the degree to which banking centres can be considered central to the international banking network.
JEL Classification: F34, G21, L14, C45.
The rise of international financial centres is a topic of long-standing interest. Their historical formation has been studied from various angles (Kindleberger (1974), Cassis (2006)). The topic is receiving renewed attention as the pre-eminent global financial centres, London and New York, are increasingly complemented by regional centres such as Hong Kong SAR and Singapore, and as new financial centres in the Arab world seek to establish an international presence. The activities of banks within international financial centres often receive special scrutiny under the heading of international banking centres (eg Choi et al (1996, 2003)).
But what exactly is an international banking centre? Banking centres are often defined as an agglomeration of banking activity in a specific location, performing a range of functions or combining a number of markets. But the term “centre” also conveys a notion of space, that of a position in relation to other locations. From that perspective, a banking centre can be viewed as the centre of a network formed by banking linkages between locations.
Drawing on the BIS international banking statistics, this feature applies methods from the literature on networks to identify banking centres that are particularly well placed or play an important role in international banking. The results, it should be stressed, are not intended as overall rankings of banking centres, for while the network perspective captures international balance sheet
1 The views expressed in this article are those of the author and do not necessarily reflect those
of the BIS. The author is grateful to Claudio Borio, Patrick McGuire, Frank Packer, Nikola Tarashev, Kostas Tsatsaronis, Christian Upper and Philip Wooldridge for helpful comments.

34 BIS Quarterly Review, December 2007
linkages, the local aspects emphasised in more traditional assessments are also undeniably important. Rather, the feature intends to show how a new and complementary approach might be used in assessing the vitality of international banking centres.
From size to network structure
It is well known that a small number of countries account for a large global share of international banking activity.2 Graph 1 shows the evolution of market shares in cross-border activity of the largest banking centres. In the second quarter of 2007, banks located in the United Kingdom held 20.4% of international bank assets on their books, and 22.8% of international bank liabilities, largely as a result of international deposit placements. The next largest banking centre is the United States, whose share in liabilities (12.6%) exceeds that in international assets (9.2%), reflecting considerable onlending to the domestic economy. The market share of banks in Japan rose substantially during the 1980s, but reversed thereafter as banks weakened by financial distress withdrew from the international market. The divergences over time in the lower ranks suggest that these positions are more contestable, with banks in Germany, France, the Cayman Islands and Switzerland oscillating in the range of 3–10% of market share.
Market share identifies centres with substantial international banking activity. But what accounts for their size? In what sense are these locations central, and what role do they perform in the international banking system?
2 International banking comprises cross-border activity in all currencies, and operations with
domestic residents in foreign currencies. Market share in international banking activity is a standard measure of the size of an international banking centre, and one of many indicators of international financial activity more generally.
Large international banking centres Market shares in international banking activity, in per cent1
Total claims Total liabilities
0
20
40
60
80
Jun 84 Jun 89 Jun 94 Jun 99 Jun 04
United Kingdom GermanyUnited States FranceJapan Cayman IslandsSwitzerland
0
20
40
60
80
Jun 84 Jun 89 Jun 94 Jun 99 Jun 041 Value of total cross-border claims or liabilities booked by banks located in the country identified by the legend, as a share of all BIS reporting banks’ total cross-border claims or liabilities vis-à-vis banks and non-banks. Market shares are based on claims and liabilities expressed at constant 2007 Q2 exchange rates.
Source: BIS locational banking statistics. Graph 1
Banks in inter-national centres generate linkages across space ...
A small number of countries account for a large share of international banking activity
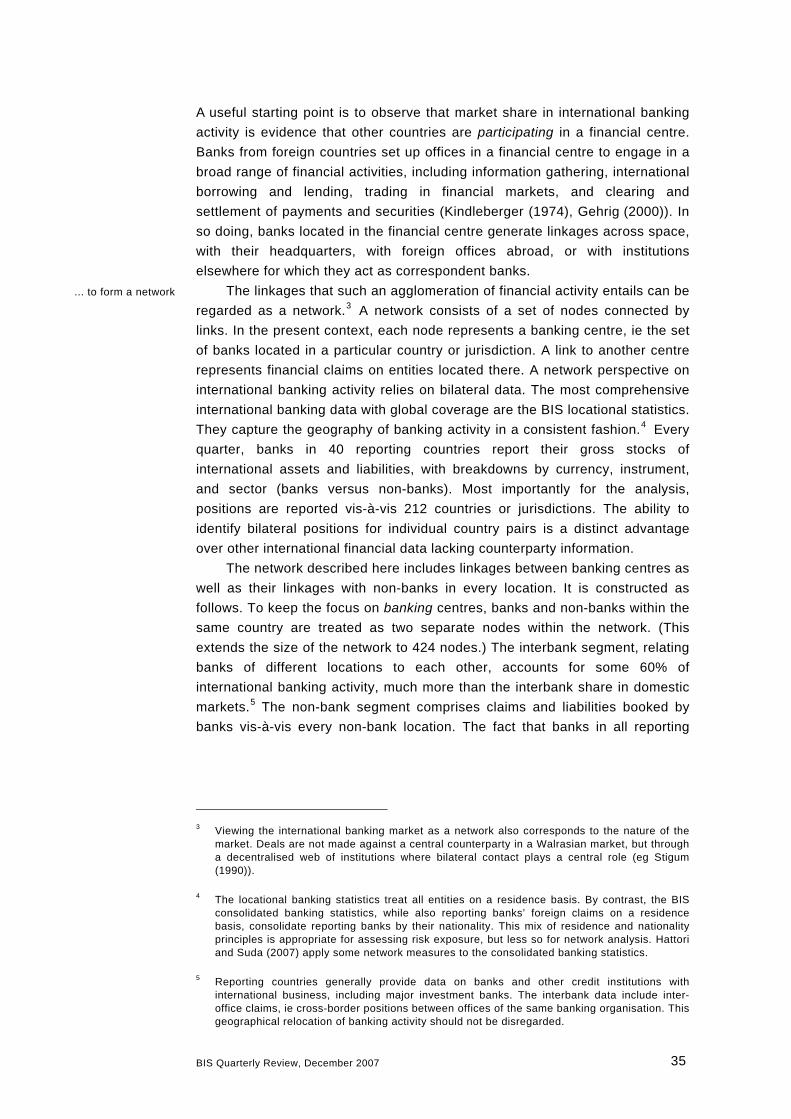
BIS Quarterly Review, December 2007 35
A useful starting point is to observe that market share in international banking activity is evidence that other countries are participating in a financial centre. Banks from foreign countries set up offices in a financial centre to engage in a broad range of financial activities, including information gathering, international borrowing and lending, trading in financial markets, and clearing and settlement of payments and securities (Kindleberger (1974), Gehrig (2000)). In so doing, banks located in the financial centre generate linkages across space, with their headquarters, with foreign offices abroad, or with institutions elsewhere for which they act as correspondent banks.
The linkages that such an agglomeration of financial activity entails can be regarded as a network.3 A network consists of a set of nodes connected by links. In the present context, each node represents a banking centre, ie the set of banks located in a particular country or jurisdiction. A link to another centre represents financial claims on entities located there. A network perspective on international banking activity relies on bilateral data. The most comprehensive international banking data with global coverage are the BIS locational statistics. They capture the geography of banking activity in a consistent fashion.4 Every quarter, banks in 40 reporting countries report their gross stocks of international assets and liabilities, with breakdowns by currency, instrument, and sector (banks versus non-banks). Most importantly for the analysis, positions are reported vis-à-vis 212 countries or jurisdictions. The ability to identify bilateral positions for individual country pairs is a distinct advantage over other international financial data lacking counterparty information.
The network described here includes linkages between banking centres as well as their linkages with non-banks in every location. It is constructed as follows. To keep the focus on banking centres, banks and non-banks within the same country are treated as two separate nodes within the network. (This extends the size of the network to 424 nodes.) The interbank segment, relating banks of different locations to each other, accounts for some 60% of international banking activity, much more than the interbank share in domestic markets.5 The non-bank segment comprises claims and liabilities booked by banks vis-à-vis every non-bank location. The fact that banks in all reporting
3 Viewing the international banking market as a network also corresponds to the nature of the
market. Deals are not made against a central counterparty in a Walrasian market, but through a decentralised web of institutions where bilateral contact plays a central role (eg Stigum (1990)).
4 The locational banking statistics treat all entities on a residence basis. By contrast, the BIS consolidated banking statistics, while also reporting banks’ foreign claims on a residence basis, consolidate reporting banks by their nationality. This mix of residence and nationality principles is appropriate for assessing risk exposure, but less so for network analysis. Hattori and Suda (2007) apply some network measures to the consolidated banking statistics.
5 Reporting countries generally provide data on banks and other credit institutions with international business, including major investment banks. The interbank data include inter-office claims, ie cross-border positions between offices of the same banking organisation. This geographical relocation of banking activity should not be disregarded.
... to form a network

36 BIS Quarterly Review, December 2007
countries disclose both assets and liabilities can be exploited to alleviate the problem of an incomplete reporting population.6
The pattern and size of linkages in such a network clearly contain a wealth of information. Such information can be used to characterise features of the network as a whole, as in much of the physics literature on networks (Newman et al (2006)). The information can also be used to characterise individual nodes, as in social network analysis concerned with the importance of actors in a group (Wasserman and Faust (1994)). To identify which locations act as international banking centres, this feature builds on the second approach. The idea is to infer, from the pattern of linkages, in what sense a banking centre is central in the international banking network. The results apply to banking centres, and do not extend to financial centres more broadly, partly because links between non-banks are not available in the data.
The analysis takes account of the fact that the international banking network differs from those studied elsewhere in the literature: the network is directed, dense and valued. The network is directed, because a link from Japan to Singapore is not the same as a link in the other direction: the direction indicates which location is holding the claims (ie liabilities of the other location). The network is dense, because 39% of potential links are active, much more than studies find for domestic interbank networks. Moreover, the network is valued, because links are not merely present or absent, but consist of monetary values that vary enormously across space (Gini coefficient 0.94). As a result, at least as important as understanding where links are is how large the associated exposures are. Since the network literature remains largely silent on valued networks, it is important to employ and extend methods suitable for this case.
Identifying international banking centres by network methods
This section characterises the importance of banking locations according to various network measures that are associated with being an international banking centre (or “global hub”). Degree, closeness and betweenness relate to how a centre is connected and positioned in relation to other countries; intermediation also takes the size of exposures into account; and prestige brings the identity of counterparties into the picture. The measures, derived in the Box, are computed on the entire network (including non-bank locations), but only banking centres are ranked in Table 1.
6 The procedure overlays reported claims and liabilities, which achieves the following. Banks in
Finland, for example, report claims on all other countries including Russia. As a non-reporting country, Russia does not report what entities located there lend to banks in Finland, but this can be inferred from the deposits that banks in Finland report to have obtained from entities in Russia. Positions are observable whenever a reporting bank is on either side of the transaction, ie as creditor or as debtor. (Only positions between non-reporting banks and between non-banks remain unobservable.)
Important banking centres can be identified using network methods

BIS Quarterly Review, December 2007 37
Degree
To qualify as a global hub, a banking centre should be well connected in the international banking network. Being connected to many counterparties enables a banking centre to interact readily with other locations around the
International banking centres Measures of network centrality2 Market
share1 In-degree Closeness Betweenness Intermediation Prestige
United Kingdom 22.1 (1) 89.7 (1) 0.82 (1) 12.8 (1) 20.5 (1) 8.59 (1)
United States3 12.9 (2) 43.9 (20) 0.60 (24) 1.4 (25) 4.3 (5) 4.46 (2)
France 6.6 (3) 80.5 (4) 0.80 (2) 9.9 (2) 15.7 (2) 3.79 (3)
Cayman Islands 6.1 (4) 61.5 (11) 0.63 (15) 2.7 (12) 1.4 (16) 1.87 (6)
Germany 5.6 (5) 81.2 (3) 0.77 (3) 8.2 (3) 9.5 (4) 2.60 (5)
Switzerland 4.5 (6) 84.5 (2) 0.75 (4) 8.2 (4) 11.0 (3) 3.56 (4)
Ireland 3.6 (7) 50.0 (16) 0.63 (16) 1.6 (21) 0.8 (25) 1.04 (12)
Netherlands 3.5 (8) 65.5 (7) 0.69 (7) 3.6 (6) 2.8 (8) 1.38 (8)
Belgium 2.9 (9) 79.1 (5) 0.70 (5) 5.5 (5) 3.3 (7) 1.75 (7)
Italy 2.8 (10) 63.6 (8) 0.65 (13) 2.6 (14) 1.3 (19) 1.02 (13)
Spain 2.6 (11) 62.0 (10) 0.67 (12) 3.0 (10) 2.1 (12) 1.07 (11)
Japan 2.6 (12) 48.8 (18) 0.65 (14) 2.1 (15) 0.9 (24) 0.81 (17)
Luxembourg 2.5 (13) 67.1 (6) 0.67 (11) 3.1 (9) 1.9 (13) 1.19 (9)
Singapore 2.0 (14) 40.9 (23) 0.63 (18) 1.7 (19) 2.4 (10) 0.97 (15)
Australia 1.7 (15) 53.5 (14) 0.63 (17) 3.3 (7) 2.7 (9) 1.02 (14)
Rank correlation4 1.00 0.85 0.71 0.68 0.66 0.95
Largest relative change5 Positive
CH +4 KO +21 CA +11 AT +14 PA +23
LU +7 TW +17 TW +14 AW +99 JE +6
CA +10 DK +13 AU +8 IN +16 CH +2
IN +16 AT +11 SV +53 PA +27 LU +4
BE +4 PK +44 KE +60 CH +3 MO +11
Negative
CR –31 MT –28 VN –130 CR –79 HR –8
SG –9 KZ –42 SK –118 VN –129 IS –8
IE –9 IE –9 IE –14 SK –117 NO –5
KY –7 KY –11 KY –8 IE –18 JP –5
US –18 US –22 US –23 KY –12 IE –5
Aruba (AW), Australia (AU), Austria (AT), Belgium (BE), Canada (CA), the Cayman Islands (KY), Croatia (CR), Denmark (DK), El Salvador (SV), Hungary (HR), Iceland (IS), India (IN), Ireland (IE), Japan (JP), Jersey (JE), Kazakhstan (KZ), Kenya (KE), Korea (KR), Luxembourg (LU), Macao (MO), Malta (MT), Norway (NO), Pakistan (PK), Panama (PA), Singapore (SG), Slovakia (SK), Switzerland (CH), Taiwan, China (TW), the United Kingdom excluding islands (UK), the United States including international banking facilities (US) and Vietnam (VN). 1 Market shares are calculated on total international bank liabilities excluding liabilities to bank residents. For non-reporting countries, bank liabilities are inferred from the interbank claims of BIS reporting banks (their liabilities to non-banks remain unobserved).2 In-degree, betweenness and intermediation are expressed in per cent, closeness as an inverse distance, and prestige is normalised to sum to 100. Refer to the Box for details. 3 Calculating the measures on a network restricted to those countries on which the United States fully reports raises the US rank on in-degree (to 19) and closeness (to 22). 4 Kendall rank correlation with the ranking of 212 banking centres on market share. 5 Centres with the largest relative change in their rank, compared to their rank on market share.
Source: BIS. Table 1
Connectedness is measured by the number of links to and from a node

38 BIS Quarterly Review, December 2007
globe. This enables hubs to perform a variety of functions, including the global distribution of liquidity (Niehans and Hewson (1976), Johnston (1983)). Connectedness can be quantified by the measure called degree, ie the total number of links that emanate from, or point to, a node.
Banking centres generally establish a presence on both sides of the market. If they borrow from many locations (in-degree), they also tend to lend to many locations (out-degree; Graph 2, left-hand panel). Interestingly, the most connected hubs, by this measure, take deposit placements from a greater number of locations than they lend to: for instance, banks in the United Kingdom take deposits from 382 locations in the world (90% of all bank and non-bank locations), while lending to 79% of locations. The mid-field settles near 50% on both in- and out-degree, except for Taiwan (China), Korea and Denmark, where banks lend to nearly twice as many locations as they borrow from.
In-degree may be more noteworthy because it reflects the choices of entities abroad to place funds with a centre, whereas out-degree results to a larger extent from a centre’s own decisions. The in-degree ranks following the United Kingdom are occupied by Switzerland, Germany, France and Belgium, each chosen as counterparties by over 70% of locations. Some locations are not as well connected as their global market share would suggest. The United States and the Cayman Islands, ranked second and fourth on market share, rank 20th and 11th on in-degree, respectively.7 By contrast, the banking centres of Canada, Macao and India are highly connected for their size, and post corresponding gains relative to their rank based on market share.
Relations with non-banks contribute materially to the in-degree of several banking centres (Graph 2, right-hand panel). Indeed, the most connected hubs, together with Jersey and Luxembourg, have liabilities to non-banks virtually everywhere in the world. Banks in Jersey and India receive funds disproportionately from non-bank counterparties – they engage in sectoral transformation from non-bank liabilities to interbank claims. By contrast, banking centres below the 45° line derive their degree to a greater extent from the interbank market. This group includes several important emerging markets, such as Brazil, Chile, Mexico and Turkey.
Closeness
A second network criterion is that a banking centre aspiring to a global position should be close to the rest of the world. A suitable measure of closeness, which allows for direct and indirect linkages, is the inverse of the average “distance” from a banking centre to all other locations, where distance refers to the number of links on the shortest path (see Box). Thus one half would be the score of a banking centre that, on average, reaches other locations in two
7 This is partly explained by the caveat that the United States does not report the full country
breakdown for all regions. Excluding known unreported countries raises US in-degree to 46% (rank 19). A different way of addressing the issue is to merge the Cayman Islands (reporting a full breakdown) with the United States in a single node; their combined in-degree equals 65% (rank 8).
Relations with non-banks contribute to connectedness

BIS Quarterly Review, December 2007 39
steps. The maximum score of 1 would be attained by a global hub directly connected to all locations.
While large banking centres tend to be strongly connected to each other as well as to the major economies, the closeness measure helps identify those centres with the broadest reach to smaller and more remote countries. The United Kingdom leads the closeness ranking, with a score of 0.82 (implying an average distance to other locations of 1.22; Table 1). However, the topology of international banking does not resemble a pure star network in which a single centre connects all other nodes, since several other banking centres are also well placed to reach remote areas (Graph 3). Four European centres attain scores over 0.7, and five Asian centres one of over 0.6. Indeed, Korea and Taiwan (China) post the largest gains in their ranking, relative to that based on market share, as a result of diversifying their lending across many locations.
The closeness of an international banking centre may be particularly important from the perspective of small and remote countries. Suppose a bank from a small Asian country sets up an office in Hong Kong SAR, for example, in order to access a global pool of liquidity or to finance trade with third parties. The resulting linkage effectively moves the country closer to Hong Kong, in a network sense. This not only raises (marginally) Hong Kong’s closeness score, but also raises (perhaps substantially) the small country’s score because it is
Connectedness of banking centres
In- and out-degree1 In-degree by sector of counterparty2
0
0.2
0.4
0.6
0.8
1.0
0 0.2 0.4 0.6 0.8 1.0
UKFRDE
CH
BENL
LUAT
ESIT
KYCA
KRTWDK
JPSG
HK
IEAU
SEJE
BR
INUSNO ES
PT
BH
FI
TR
IMFr
actio
n of
loca
tions
cen
tre le
nds
to (o
ut-d
egre
e)
0
0.2
0.4
0.6
0.8
1.0
0 0.2 0.4 0.6 0.8 1.0
DK
UKCHFR
BE
DELUJE
INES
AT
NLIT
CA
AUKY
SE
JEJP
US
BSNO
HK
SGTWPT
KRPA FI
BHAN
GGMO
BM
IM
GR
CL
MX
BRTR
Frac
tion
of n
on-b
ank
loca
tions
lend
ing
to c
entre
Fraction of locations lending to centre (in-degree) Fraction of banking centres lending to centre
The BIS reporting countries are: Australia (AU), Austria (AT), the Bahamas (BS), Bahrain (BH), Belgium (BE), Bermuda (BM), Brazil (BR), Canada (CA), the Cayman Islands (KY), Chile (CL), Denmark (DK), Finland (FI), France (FR), Germany (DE), Greece (GR), Guernsey (GG), Hong Kong SAR (HK), India (IN), Ireland (IE), the Isle of Man (IM), Italy (IT), Japan (JP), Jersey (JE), Korea (KR), Luxembourg (LU), Macao (MO), Mexico (MX), the Netherlands (NL), the Netherlands Antilles (AN), Norway (NO), Panama (PA), Portugal (PT), Singapore (SG), Spain (ES), Sweden (SE), Switzerland (CH), Taiwan, China (TW), Turkey (TR), the United Kingdom excluding islands (UK) and the United States including international banking facilities (US).
Each point represents a banking centre. Its position in the plane shows the fraction of locations with which the banking centre has a direct connection as indicated by the axis labels. The green line represents the least squares regression, while the blue line is a 45o
line of equality. 1 Compares assets (out-degree) and liabilities (in-degree). 2 Separates in-degree into bank and non-bank locations. Graph 2
Closeness identifies centres with the broadest reach to smaller countries

40 BIS Quarterly Review, December 2007
now only two steps away from all of Hong Kong’s counterparties. The presence of foreign banks is indeed one of the most cited features of financial centres (Reed (1981), Choi et al (1986, 1996, 2003)). The BIS locational statistics also show that major centres host many foreign banks (Table 2). The broad representation of banks from emerging markets in the United Kingdom helps to explain its remarkable global reach.
Betweenness
Locations that are not directly linked can reach each other through banks in a third country. The important role such middlemen play in a network is captured by the following criterion: to qualify as a global hub, a banking centre should be in a position to connect other locations with each other. This can be quantified by betweenness, the frequency with which a banking centre lies on the shortest path between two unconnected locations (see Box). A high score on this criterion can be thought of as measuring a centre’s ability to bring together customers from both sides of the market (lenders and borrowers).
Among the largest banking centres, the ranking differs little from that based on market share. Banks in the United Kingdom have a 13% chance of being on the shortest path between any two unconnected locations (non-bank locations included). Banks in Germany, France and Switzerland follow closely, but perhaps for a different reason. The United Kingdom’s score reflects London’s position as a host to many foreign banks, whereas Germany, France and Switzerland are home to multinational banks generating considerable inter-office activity across borders. The ranking differs more in the mid-field, indicating that betweenness captures an aspect of banking centres quite distinct from their size (the rank correlation with market share is 0.65; Table 1). The gains in ranking witnessed by Canada, Taiwan (China) and Australia suggest that their banking centres are positioned strategically with respect to some region or part of the network.
Intermediation
To qualify as a global hub, a banking centre should also perform an important intermediary role in the international banking network. There can be many
Representation of foreign banks in international banking centres1 CH FR HK SG UK
Number of BIS reporting banks2 108 268 194 153 337
Headquartered in the reporting country 41 120 19 5 73
Headquartered in another reporting country 53 127 131 126 198
Headquartered outside the reporting area 14 21 44 21 61 1 Shown here: Switzerland (CH), France (FR), Hong Kong SAR (HK), Singapore (SG) and the United Kingdom (UK). 2 Only the main office of a bank is recorded, regardless of the number of offices the bank maintains in the country. The number of banks headquartered outside the reporting area of 40 BIS reporting countries is indicative of the representation of banks from emerging markets. (The columns add to less than the total number of reporting banks in some cases because of unallocated banks.)
Source: BIS locational banking statistics. Table 2
The intermediation measure captures the intensity of links by incorporating portfolio shares
Betweenness reflects the frequency with which a centre lies on the shortest path

BIS Quarterly Review, December 2007 41
intermediaries between any pair of unconnected locations.8 Since the betweenness measure treats each path (hence each intermediary) as equivalent, regardless of value, it may underestimate the importance of hubs as focal points. The intermediation measure proposed here captures the intensity of links by incorporating the portfolio shares of each banking centre’s international claims. The measure calculates the share of each sender’s portfolio that a banking centre transports to every recipient, and averages this product of shares across all country pairs (see Box).
The largest hubs also appear as the most important intermediaries (Table 1). The likelihood that a dollar transferred between any country pair goes through the United Kingdom is highest (20%), followed by France, Switzerland, Germany and the United States. For the large banking centres, the intermediation measure tends to exceed betweenness, which indicates that large hubs are the preferred conduits when there are several paths. This is not because they would send a large share of their portfolio to each recipient, but because they receive such a high portfolio share from many locations. This also explains why intermediation correlates with size: taking deposits enlarges a hub’s reported size.
However, not all banking centres perform an intermediation function commensurate with their size. Some large offshore centres score quite low on global intermediation, because they concentrate their positions on a few locations, eg the Cayman Islands on US entities. Conversely, some mid-sized centres attain a high score through a combination of connectedness and specialisation. Specifically, decomposing the intermediation measure by sector shows banks in Switzerland to be the main intermediary between non-bank pairs, while banks in the United Kingdom lead the ranking for pairs with banks on either side. Similarly, calculating intermediation separately for pairs across and pairs within the same continent demonstrates the importance of global and regional hubs. While the largest banking centres are truly global hubs intermediating across all continents, a significant regional role is played by banks in Austria and Denmark (within Europe), Canada and Panama (Americas), Bahrain (Africa and the Middle East), as well as Singapore, Hong Kong SAR and Australia (Asia-Pacific).9 The presence of global and regional banking hubs can be visualised in a network graph (Graph 3). Each banking centre is shown in a size proportional to its intermediation score.
Prestige An aspect that has not received attention in the analysis so far is the identity of the counterparties that relate to a banking centre. This is taken into
8 This is a consequence of high density in the international banking network. For the 212
banking locations (plus as many non-bank locations), there are n(n–1), nearly 180,000 pairs in the directed network. Of about 168,000 pairs with no reported link from one location to the other, 91% can be linked through an intermediary, of which there are eight on average.
9 Some of these centres concentrate their portfolios on a set of countries weakly connected to the global hubs. For example, banks in Austria, due to their extensive relations with eastern Europe, advance to rank 1 within Europe. Similarly, banks in Bahrain specialise in attracting petrodollar deposits throughout the Middle East.
Prestige reflects the importance of counterparties
Intermediation does not always go with size

42 BIS Quarterly Review, December 2007
consideration in the following criterion: a banking centre is an important hub if the centres lending to it are themselves important. The idea that the prestige or status of an actor derives from the importance of those nominating him is borrowed from sociology. To compute prestige, each centre receives the same initial score, to which one then adds a term involving the scores of its creditors, weighted by their respective portfolio shares. The prestige scores are then determined simultaneously in a system of equations (see Box).
The results identify as important hubs those centres that also scored highly on other criteria, particularly on market share (Table 2). The United States reclaims the second rank, because having fewer links is offset by the fact that important centres deposit sizeable shares of their portfolios with banks located there. These include the United Kingdom, Jersey, France and the
Global and regional hubs in the international banking network
AT
BEFI
FR
DE
GR
IE
ITLU
NL
PT
ES
DK
NOSE
CHUK
AU
CA
JP
USBS
BH
BM
KY
GG
HK
IM
JE
AN
PA
SG
MO
BR
CL
IN
MX
TW
TR
KR
AR CN
IL LB
NZPE
RU
SA
ZA
AE
WI
nFR
nDE
nNL
nES
nCH
nUK
nAU
nJP
nUS
nBH
nKYnHK
nJE
nSGnTW
nTR
nKR
nCN
nKW
nQA
nSA
nAE
nWI
The graph shows the linkages between 212 banking centres and their linkages with 212 non-banks. Each location is represented by a node. The size of the nodes is proportional to the measure of intermediation (Table 1). The colour of the nodes represents the continent (red for Africa and the Middle East, green for the Americas, blue for Asia-Pacific and mustard for Europe). The labelled locations include banks in 40 BIS reporting countries (for the country codes, see Graph 2), plus banks in Argentina (AR), China (CN), Israel (IL), Lebanon (LB), New Zealand (NZ), Peru (PE), Russia (RU), Saudi Arabia (SA), South Africa (ZA), and the West Indies, UK (WI). Non-bank locations, where labelled, carry the prefix “n”, eg Kuwait (nKW), Qatar (nQA) and the United Arab Emirates (nAE). The thickness and shading of linkages reflect the value transacted between two locations (calculated as the square root of the sum of bilateral claims). To simplify the graph, linkages with a value less than 2.5% of the portfolios of both locations are not shown. Graph 3

BIS Quarterly Review, December 2007 43
Caribbean offshore centres (notably the Cayman Islands and the Bahamas). The Cayman Islands are highly ranked due to their large bilateral link with entities in the United States. The ranks gained by Jersey, Switzerland and Luxembourg can also be attributed to their large liabilities to major international hubs. Hubs bestow importance on each other due to the intensive bilateral links between them. These “highways” on which international banking flows are channelled are highly persistent from quarter to quarter, judging by the constancy in the ranking of links by size. Accordingly, the major linkages in the international banking network visible in Graph 3 also remain stable over time.
Conclusion
This feature proposes to view the international banking market as a global network in order to identify international banking centres based on the position they occupy in relation to other locations. The range of measures developed from this perspective illustrates that size is only one indicator of a banking centre’s multifaceted dimensions. Although the best connected and most central locations are generally also the largest centres, an important network position need not come with size. Where the network measures deviate from market share, they provide complementary information on the role of a centre in the international banking system, eg one of regional intermediation. Just as interestingly, where these measures coincide with size, as for most top-tier banking centres, they may help explain market share: a central position attracts deposits and the participation of foreign banks and thereby contributes to reported size.
The presence of banking hubs is also an important characteristic of domestic banking systems.10 That such a characteristic would reproduce itself at the global level is perhaps not surprising, in view of the extensive international activities of the largest banks of various nationalities. Policymakers seem aware of the benefits and issues surrounding financial centres. Yet the formal economics and finance literature offers little guidance on the possible implications for efficiency and stability that such a centralised financial structure with cross-border linkages entails.
10 Recent studies cover Austria (Boss et al (2004)), Italy (Iori et al (2007)) and Switzerland
(Müller (2003)). Hubs also characterise payment system networks, eg in Japan (Inaoka et al (2004)) and the United States (Soramäki et al (2007)).

44 BIS Quarterly Review, December 2007
Selected network measures for identifying banking centres The network can be expressed in matrix form. The typical element ijB records the value of claims of entities located in country i on entities in country j. The network includes banks and non-banks, treated as separate nodes for each of the countries or jurisdictions (212 currently). Hence each index runs from 1 to 424n = . The matrix can be read in two directions: rows of B represent claims of location i on location j, and columns of B represent liabilities of j to each i. All diagonal elements iiB are zero, and off-diagonal elements are positive, or zero if there is no associated link. Since linkages between non-reporting banks and between non-banks are not observable, the matrix contains an unobserved block of size 2( )n r− , where r is the number of reporting countries ( 40r = currently). The network is directed, dense and valued, hence B is not symmetric and contains many non-zero entries, each stating claims in millions of US dollars.
The network measures in this feature relate to individual nodes. Each captures an aspect of network centrality of banking centres. To clarify what information they use, the measures are expressed in terms of two variants of B . The first, N , only records links regardless of their monetary value: 1ijN = if 0ijB > , and 0 otherwise, for all i,j. The second, P , contains portfolio shares, obtained by scaling each centre’s claims on other locations by the size of its overall lending to other locations, /ij ij k ikP B B= ∑ , for all i. Degree, closeness and betweenness use N , whereas intermediation and prestige rely on P .
Degree is the number of links that emanate from, or point to, a node. The two senses differ in directed networks. There is a direct link from node i to j if 1ijN = . Node i’s out-degree is the row sum of N , j ijN∑ , whereas its in-degree is the column sum, j jiN∑ . Dividing by the maximum attainable degree, ( 1)n − , yields degree as reported in Table 1. The histogram of the number of nodes of given degree is known as the degree distribution.
Closeness and betweenness rely on path counts. If i links to k and k links to j, the product 1ik kjN N = . Hence the sum k ik kjN N∑ gives the number of paths from i to j of length two. More
generally, the matrix power pN counts indirect paths of length p. The distance from i to j is the length of the shortest path, min [ ] 0p
ij p ijNδ = > . It equals one when there is a direct link, two when i reaches j in two steps via another location, and so on. The average distance from i to all other nodes equals 1( 1) j ijn δ−− ∑ , and closeness is its inverse. Betweenness focuses on the nodes that the shortest path passes through. Let jkg denote the number of shortest paths between j and k, and ( )jkg i the number of those going through node i. The probability that i is on a (randomly chosen) shortest path from j to k equals ( ) /jk jkg i g . Betweenness of node i is the sum of these probabilities over all pairs excluding i, ( ) /j i k i jk jkg i g≠ ≠∑ ∑ divided by the maximum this sum can attain, ( 1)( 2)n n− − .
The intermediation measure extends betweenness by taking portfolio shares into account. The quantity 2[ ]ij k ik kjP p p= ∑ is the total probability that a dollar sent by i reaches j in two steps. Any location k for which 0ik kjp p > is an intermediary to the pair (i,j). The main intermediary is identified as the one transporting the greatest share of the sender’s portfolio to the recipient,
arg maxk ik kjh p p= (provided 2[ ] 0ijP > ). This means that a dollar sent by i has a higher likelihood of reaching j through h than through any other banking centre. Conditional on j receiving a dollar from i, the likelihood that it is through k equals 2/ [ ]ik kj ijp p P . The intermediation measure for a centre k is obtained by summing these probabilities across all pairs (i,j) and normalising by the total number of pairs ( 1)n n − . Instead of a probability, the main intermediary count gives one point, for each pair, to the main intermediary (and zero to all other intermediaries).
Finally, prestige considers in addition the identity of counterparties. The score of a banking centre i consists of the scores of i’s creditors weighed by their portfolio shares vis-à-vis i,
i j ji jv P v= ∑ . This defines a linear system, 'v P v= , with a non-trivial solution given by the eigenvector associated with the unit eigenvalue. (This is known as Bonacich centrality.) It is preferable to solve the related system * 1' ( ') ,v P v e v I P eα α −= + ⇒ = − where e is the unit vector embodying exogenous importance. (This avoids countries with a zero score contributing nothing to the centrality of others.) The weight on endogenous factors is chosen as 1/ 2α = , half the unit eigenvalue. Prestige handles valued networks, and takes indirect paths into account through the centrality scores of counterparties.

BIS Quarterly Review, December 2007 45
References
Boss, M, H Elsinger, M Summer and S Thurner (2004): “Network topology of the interbank market”, Quantitative Finance 4.
Cassis, Y (2006): Capitals of capital: a history of international financial centres, 1780–2005, Cambridge University Press.
Choi, S, A Tschoegl and C Yu (1986): “Banks and the world’s major financial centers, 1970–1980”, Weltwirtschaftliches Archiv 122(1).
——— (1996, 2003): “Banks and the world’s major banking centers”, Welt-wirtschaftliches Archiv 132(4) and 139(3).
Gehrig, T (2000): “Cities and the geography of financial centers”, in Economics of cities: theoretical perspectives, Cambridge University Press.
Hattori, M and Y Suda (2007): “Developments in a Cross-Border Bank Exposure ‘Network’”, proceedings of a CGFS workshop held at the Bank for International Settlements.
Inaoka, H, T Ninomiya, K Taniguchi and T Shimizu (2004): “Fractal network derived from banking transactions - an analysis of network structures formed by financial institutions”, Bank of Japan Working Paper no 04-E-04.
Iori G, G de Masi, O Precup, G Gabbi and G Caldarelli (2007): “A network analysis of the Italian overnight money market”, Journal of Economic Dynamics and Control, forthcoming.
Johnston, R (1983): The economics of the euro-market: history, theory and policy, Macmillan, New York.
Kindleberger, C (1974): “The formation of financial centers: a study in comparative economic history”, Princeton Studies in International Finance, no 36.
Müller, J (2003): “Two approaches to assess contagion in the interbank market”, manuscript.
Newman, M, A Barabási and D Watts (eds) (2006): The structure and dynamics of networks, Princeton University Press.
Niehans, J and J Hewson (1976): “The eurodollar market and monetary theory”, Journal of Money, Credit and Banking 8(1).
Reed, H (1981): The preeminence of international financial centers, Praeger Publishers.
Soramäki, K, M Bech, J Arnold, R Glass and W Beyeler (2007): “The topology of interbank payment flows”, Physica A 379.
Stigum, M (1990): The money market, 3rd edition, The McGraw-Hill Companies, Inc.
Wasserman, S and K Faust (1994): Social network analysis: methods and applications, Cambridge University Press.

BIS Quarterly Review, December 2007 47
Patrick McGuire+41 61 280 8921
Nikola Tarashev+41 61 280 9213
International banking with the euro1
The structure of the international banking market has evolved in important ways since the introduction of the euro in 1999. In comparison to legacy currencies, the use of the euro in cross-border banking transactions grew on aggregate, and the bilateral linkages within the euro area became more dispersed in the years after its introduction. However, growth in the use of the euro globally has plateaued more recently. In addition, measures of banks’ presence in foreign credit markets reveal rather mixed signs of greater integration of the euro area banking system since 1999.
JEL classification: F34, G15, G21.
The introduction of the euro in 1999 was expected to usher in important structural changes in international banking. The conversion of the legacy currencies into one held the promise of efficiency gains that could help the single currency challenge the supremacy of the US dollar in international transactions. Moreover, the introduction of the euro, coupled with the ongoing process of deregulation of cross-border transactions, provided the opportunity for greater integration of the banking systems within the euro area, as banks there capitalised on lower transaction costs.
Nine years on, has the structure of the international banking system shown signs of change along the predicted lines? To address this question, this special feature relies mainly on the BIS international banking statistics, one of the few sources of data on bilateral capital flows available with a currency breakdown.2 The first section takes a global perspective, and centres on the use of the euro (relative to the US dollar) in international banking transactions. On a global basis, the use of the euro increased in both absolute and relative terms up to the late 1990s, but has plateaued in recent years. Overall growth was primarily driven by greater activity of banks headquartered in the euro area
1 The views expressed in this article are those of the authors and do not necessarily reflect
those of the BIS. The authors would like to thank Angelika Donaubauer and Emir Emiray for their assistance with the graphs.
2 The BIS locational statistics by residency include reporting banks’ cross-border positions (assets and liabilities) in all currencies, and positions vis-à-vis residents in foreign currencies, broken down by the residence of the counterparty. Positions are reported for the five major currencies (US dollar, euro, Japanese yen, Swiss franc and sterling), the domestic currency of the reporting country, and residual currencies. For a complete description, see BIS (2003a,b) and Wooldridge (2002).

48 BIS Quarterly Review, December 2007
(henceforth, euro area banks) but also by important changes in the use of the euro by banks headquartered elsewhere, in particular UK and Swiss banks.
The second section analyses the structure of international banking activity within the euro area. A large body of research, relying on price-based measures of integration, has generally found that the interbank market in the euro area is highly integrated, whereas retail lending (ie to non-banks) has remained relatively fragmented. The quantity-based measures considered here are in line with this general story. The dispersion of cross-border bank linkages in the euro area has increased since the introduction of the euro, in part driven by the expansion of interbank activity. However, other measures of integration, for example the rate of foreign bank participation in domestic retail markets, have risen in some, but not all, euro area countries.
The euro and the global banking system
Since its introduction on 1 January 1999, the use of the euro in international banking (measured on a stock basis) has nearly quadrupled. Total euro-denominated claims of BIS reporting banks grew to $12.4 trillion in the second quarter of 2007, up from $3.6 trillion in the first quarter of 1999 (Graph 1, top left-hand panel).3 In relation to other currencies, however, the euro gained in importance only during the first four years after its introduction, rising from 34% to 41% of total international claims. This share flattened after 2003, and has even edged downwards recently as the euro has lost ground to sterling.
Euro area banks are the predominant lenders of euros. Across all currencies, German and French banks report, respectively, the largest and third largest foreign claims in the BIS consolidated statistics,4 with Dutch banks following closely behind (Graph 2, left-hand panel). Much of these claims are likely to be denominated in euros. The BIS nationality statistics, which allow for a partial reconstruction of banks’ global balance sheets, suggest that more than half of German, French and Dutch banks’ claims (excluding inter-office claims) are denominated in euros (Graph 2, centre panel).5 Moreover, roughly two thirds of the global stock of euro-denominated claims (excluding inter-office claims) are booked by euro area banks (Graph 2, right-hand panel), often from their offices in major financial centres. In the United Kingdom, for example, the offices of German and Dutch banks account, respectively, for 15% and 7% of total claims (and 15% and 9% of euro-denominated claims) booked by banks located there.
3 Unless otherwise noted, all figures are in US dollars at constant end-2007 Q2 exchange rates.
4 The BIS consolidated banking statistics track reporting banks’ global exposures, broken down by the nationality of banking systems. Foreign claims are comprised of cross-border claims plus local claims extended from offices in host countries.
5 The BIS locational statistics by nationality provide a breakdown of banks’ total cross-border positions (in all currencies) and positions vis-à-vis residents (in foreign currencies), broken down by the nationality of the parent bank (but not by vis-à-vis country). Thus, the figures exclude euro-denominated claims on residents extended within the euro area. In addition, figures exclude euro-denominated claims on residents booked by offices in the United States and claims on all counterparties booked by offices in other non-reporting countries.
Euro area banks …

BIS Quarterly Review, December 2007 49
That said, banks headquartered outside the euro area have increasingly made use of the euro since 1999, in particular UK and Swiss banks (Graph 2, centre panel). UK-headquartered banks, for example, expanded their euro lending from their home offices the most, accounting for 32% of total euro-denominated claims booked by banks in the United Kingdom in mid-2007, up from 15% in 1999 (Graph 2, right-hand panel). As a result, the share accounted for by euro area-headquartered banks fell over this same period, both in the United Kingdom and globally (same panel, thin line).
BIS reporting banks’ euro-denominated positions1
Total claims Geographical dispersion8
0
4
8
12
97 99 01 03 05 0720
35
50
65To other (rhs)²To UK (rhs)²To EA (rhs)2, 3
Intra-EA (rhs)2, 4
Share 1 (lhs)5
Share 2 (lhs)6
Share 3 (lhs)7
8
20
32
44
90 93 96 99 02 05
All currenciesEuroUS dollar
Bank flows between the euro area and the United Kingdom
Net claims of banks in the UK9 Cumulative net flows10 Euro-denominated net claims11
–400
–200
0
200
400
90 93 96 99 02 05
All currenciesUS dollarEuroSterlingOther
–600
–400
–200
0
200
90 93 96 99 02 05–600
–400
–200
0
200
90 93 96 99 02 05
InterbankBanks to non-banks12
Non-banks to banks13
1 Values expressed at constant end-2007 Q2 exchange rates. 2 Stocks of outstanding euro-denominated international claims by vis-à-vis region, in trillions of US dollars. EA = euro area. 3 Excluding claims extended within the euro area. 4 Claims extended within the euro area only. 5 Share of euro-denominated claims in total international claims, in per cent. 6 Share of euro-denominated claims in total international claims other than claims extended within the euro area, in per cent. 7 Share of cross-border euro-denominated claims in total international claims extended within the euro area, in per cent. 8 The share of the total volume of international banking linkages (defined in Graph 3) that is accounted for by the smallest 75% of these linkages. Thick lines relate to the global network of banking linkages, in which individual euro area countries represent separate nodes. Thin lines relate to the network within the euro area, in per cent. 9 Vis-à-vis residents (except for sterling) and non-residents, in billions of US dollars. “Other” comprises all currencies except the US dollar, the euro, the Swiss franc, sterling and the yen. 10 From euro area residents to the rest of the world, in billions of US dollars. “Other” comprises all currencies except the US dollar and the euro. 11 Cumulative net flows from euro area residents to banks and non-banks in the rest of the world (thick lines) and in the United Kingdom only (thin lines), in billions of US dollars. 12 Cumulative net flows from banks in the euro area to non-banks in the particular vis-à-vis region. 13 Cumulative net flows from non-banks in the euro area to banks in the particular vis-à-vis region.
Source: BIS. Graph 1
… as well as UK and Swiss banks …

50 BIS Quarterly Review, December 2007
Euro-denominated linkages
A graphical representation of the international banking system can help in understanding the expansion of euro-denominated activity, and the pattern of linkages among regions. Graph 3 portrays the international banking system as a network of interconnected nodes, each representing a country or region.6 The size of each line connecting two nodes is proportional to the size of the bilateral currency-specific linkage, measured as the sum of the gross positions (assets plus liabilities) of banks in each country. While this measure does not track the flow of funds between nodes, it is a gauge of the overall size of banks’ cross-border positions at a particular point in time.
Overall, banks’ gross positions in euros are concentrated in a relatively small number of regional pairs (Graph 3). The largest euro linkage, between the euro area and the United Kingdom, grew from $1.1 trillion at end-1998 to $3.9 trillion in mid-2007, contributing significantly to the overall rise in total euro-denominated claims (Graph 1, top left-hand panel).7 A formal measure of geographical dispersion, ie the share of the total value of linkages accounted
6 See McGuire and Tarashev (2006) for greater detail on the construction of these measures,
and von Peter (in this issue) for a network analysis of global banking linkages.
7 By comparison, linkages in the US dollar market were generally larger than those in the euro market both at end-1998 and at mid-2007 (Graph 3, bottom panels).
Size of banking systems and lending in euros1
By bank nationality
Foreign claims2, 3 Share of euro claims4 Lenders in euros5
0
0.9
1.8
2.7
3.6
99 01 03 050
6
12
18
24
EA banksOther banks
0
16
32
48
64
99 01 03 05 07
FR DE NLCH UK JPUS
0
20
40
60
80
99 01 03 05 07 0
0.8
1.6
2.4
3.2
EA banks2, 6
Other banks2, 6
EA7
EA
CH = Swiss banks; DE = German banks; EA = euro area banks; FR = French banks; JP = Japanese banks; NL = Dutch banks; UK = UK banks; US = US banks. Shaded areas plotted against the left-hand axis in the respective panel. 1 Excludes inter-office positions. 2 In trillions of US dollars. 3 Total foreign consolidated claims on an immediate borrower basis, which equal cross-border claims in all currencies plus claims in all currencies extended from offices abroad. 4 Share of euro-denominated claims in total claims extended from offices worldwide excluding local euro-denominated lending within the euro area, in per cent. 5 Thick lines plot the share of claims booked by banks headquartered in a particular country or region in total euro-denominated claims extended from all banks in the United Kingdom, in per cent. 6 Credit extended by offices in the United Kingdom. 7 Share of claims booked by euro area-headquartered banks in the euro-denominated claims extended from all reporting countries, in per cent.
Source: BIS. Graph 2
… have driven the growth in euro-denominated activity

BIS Quarterly Review, December 2007 51
Linkages in the international banking system1
Euro: 1998 Q4 Euro: 2007 Q2
Asia-PacAsia FCCarib FC
CH
Em Euro
Euro
JP
Lat Am
Oil
Other
UK
US
Euro - UK:
Euro - JP:
Euro - CH:
$1.1trn
$119bn
$164bn
Asia-PacAsia FCCarib FC
CH
Em Euro
Euro
JP
Lat Am
Oil
Other
UK
US
Euro - UK:
Euro - JP:
Euro - CH:
$3.9trn
$331bn
$353bn
US dollar: 1998 Q4 US dollar: 2007 Q2
Asia-PacAsia FCCarib FC
CH
Em Euro
Euro
JP
Lat Am
Oil
Other
UK
US
US - UK:
US - Carib FC:
US - Euro:
$451bn
$1.0trn
$354bn
Asia-PacAsia FCCarib FC
CH
Em Euro
Euro
JP
Lat Am
Oil
Other
UK
US
US - UK:
US - Carib FC:
US - Euro:
$3.5trn
$3.3trn
$1.5trn
Asia FC = Asian financial centres (Hong Kong SAR, Macao and Singapore); Asia-Pac = China, India, Indonesia, Korea, Malaysia, Pakistan, the Philippines, Taiwan (China) and Thailand; Carib FC = Caribbean financial centres (Aruba, the Bahamas, Bermuda, the Cayman Islands, the Netherlands Antilles and Panama); CH = Switzerland; Em Euro = emerging Europe (Bulgaria, Croatia, Cyprus, the Czech Republic, Estonia, Hungary, Latvia, Lithuania, Malta, Poland, Romania, Slovakia, Slovenia, Turkey and Ukraine); Euro = euro area member states excluding Slovenia; JP = Japan; Lat Am = Argentina, Brazil, Chile, Colombia, Mexico and Peru; Oil = OPEC member states (excluding Indonesia) plus Russia; Other = Australia, Canada, Denmark, New Zealand, Norway and Sweden; UK = United Kingdom, Guernsey, the Isle of Man and Jersey; US = United States. 1 The size of each red circle is proportional to the stock of cross-border claims and liabilities of reporting banks located in the particular geographical region. Some regions include non-reporting countries. The thickness of a line between regions A and B is proportional to the sum of claims of banks in A on all residents of B, liabilities of banks in A to non-banks in B, claims of banks in B on all residents of A and liabilities of banks in B to non-banks in A.
Source: BIS. Graph 3
for by the smallest 75% of the linkages, shows that dispersion in euro linkages has remained stable, at roughly 12% since 1999, having lost 5 percentage

52 BIS Quarterly Review, December 2007
points during the early 1990s (Graph 1, top right-hand panel).8 At the same time, across all currencies, the geographical dispersion of linkages has been declining, mainly the result of greater concentration in the US dollar market.9
The pattern of net flows through the banking system has changed significantly over time. This can be seen in Graph 4, where nodes are connected by arrows that convey the direction and size of net banking flows.10 The largest euro-denominated flows between 1990 and 1998, from the United Kingdom to the euro area, cumulated to $129 billion or almost three times more than the second largest flow, that from Switzerland to the euro area (Graph 4, top left-hand panel). Since 1999, however, other euro linkages have grown in importance. For example, geographical and currency diversification by banks in Japan has resulted in the largest euro-denominated bilateral net flow, from Japan to the euro area ($228 billion). Net flows from the euro area to emerging Europe, and from the Caribbean financial centres to the euro area, have grown as well (Graph 4, top right-hand panel).
Currency transformation in the United Kingdom
In channelling funds to the euro area, banks in the United Kingdom convert non-euro liabilities into euro-denominated claims on euro area borrowers.11 UK resident banks have run a growing net long position in euros since 1999 (Graph 1, bottom left-hand panel). By mid-2007, euro-denominated net claims (claims minus liabilities) of these banks reached $416 billion, up from virtually nil in mid-1997. This growth has been financed by a concurrent increase in UK resident banks’ net liabilities in sterling and in currencies other than the major five.
Net flows of euros from the United Kingdom have accounted for a substantial portion of the total net flows of euros to residents in the euro area (Graph 1, bottom centre and right-hand panels). Since 1990, UK residents have provided an estimated 73% of the $415 billion in euro-denominated cumulative net flows channelled via the banking system to the euro area. Much of this constituted greater claims of UK resident banks on non-bank borrowers in the euro area, primarily in the Netherlands, France and Spain.
Importantly, UK resident banks have funded part of their position vis-à-vis the euro area by issuing debt and equity securities, as opposed to deposits, which clouds the interpretation of bilateral net flow measures. The reason is that reporting banks generally do not know the holder of these securities liabilities once they are sold on the secondary markets, and thus are unable to
8 This calculation takes each euro area country as a separate node, but excludes intra-euro
area linkages. The message of these dispersion measures is not significantly different if the cutoff for the smallest linkages is set between 60 and 90% of all linkages.
9 Dispersion in this market dropped from 18% in 1998 to 11% in the most recent quarter, reflecting substantial growth in the US-UK and US-Caribbean linkages.
10 These net flows are partially based on estimates. See the box on page 56 for further detail.
11 The BIS statistics include only reporting banks’ on-balance sheet cash positions, and do not take into account off-balance sheet hedging.
Debt security liabilities difficult to track
… as do banks in the United Kingdom
Banks in Japan channel euros to the euro area …

BIS Quarterly Review, December 2007 53
allocate them to a particular vis-à-vis country (see box on page ). Nonetheless, even if all of these liabilities are allocated to residents of the euro area (an admittedly conservative assumption), that region would still account for roughly 82% of the net (positive) position in euros booked by UK resident banks.
Cumulative net flows through the international banking system
Euro: 1990 Q3–1998 Q4 Euro: 1999 Q1–2007 Q2
Asia-PacAsia FCCarib FC
CH
Em Euro
Euro
JP
Lat Am
Oil
Other
UK
US
UK to Euro:
CH to UK:
JP to Euro:
$129bn
$49bn
$34bn
Asia-PacAsia FCCarib FC
CH
Em Euro
Euro
JP
Lat Am
Oil
Other
UK
US
JP to Euro:
UK to Euro:
Euro to Em Euro:
$228bn
$174bn
$127bn
US dollar: 1990 Q3–1998 Q4 US dollar: 1999 Q1–2007 Q2
Asia-PacAsia FCCarib FC
CH
Em Euro
Euro
JP
Lat Am
Oil
Other
UK
US
JP to US:
UK to US:
UK to Euro:
$177bn
$169bn
$58bn
Asia-PacAsia FCCarib FC
CH
Em Euro
Euro
JP
Lat Am
Oil
Other
UK
US
UK to US:
Carib FC to US:
Euro to UK:
$365bn
$273bn
$156bn
See the note in Graph 3 for the definition of nodes. The thickness of an arrow is proportional to the amount of cumulative net bank flows between regions. Net flows between regions A and B equal the sum of: (1) net claims (assets minus liabilities) of banks in A on non-banks in B; (2) net claims of non-banks in A on banks in B; and (3) net interbank flows between A and B. Some regions include countries which do not report data. The thickness of the arrows is scaled by the overall flows cumulated over the respective period and thus is not directly comparable across panels.
Source: BIS. Graph 4

54 BIS Quarterly Review, December 2007
The euro and the euro area banking system
Banks in the euro area play an important role in the cross-border transfer of funds. In the case of Germany, for example, cumulative net flows (in all currencies) via the banking system to the rest of the world since 1999 have exceeded the total net outflow of capital from the country, as measured by cumulative current account balances (Graph 5).12 Similarly, cumulative net
Cumulative net banking flows in the euro area
From Germany1 From France1 From Italy1
–600
–300
0
300
600
900
90 93 96 99 02 05
To EA²To non-EA³Net bank flows4
Current account
–350
–175
0
175
350
525
90 93 96 99 02 05–800
–600
–400
–200
0
90 93 96 99 02 05
Net banking flows:5 1990 Q3–1998 Q4 Net banking flows:5 1999 Q1–2007 Q2
AT
BE
DE
ES
FI
FR
GR
IE
IT
LU
NL
PT
NL to DE:
LU to DE:
FR to DE:
$72bn
$43bn
$16bn
AT
BE
DE
ES
FI
FR
GR
IE
IT
LU
NL
PT
FR to IT:
DE to ES:
DE to NL:
$189bn
$170bn
$117bn
AT = Austria; BE = Belgium; DE = Germany; EA = euro area; ES = Spain; FI = Finland; FR = France; GR = Greece; IE = Ireland; IT = Italy; LU = Luxembourg; NL = Netherlands; PT = Portugal. 1 In all currencies, in billions of US dollars. 2 Net banking flows to the euro area. 3 Net banking flows between the country identified in the panel heading and all countries outside the euro area. 4 Net banking flows to the rest of the world. 5 Euro- denominated cumulative flows. See the definition of cumulative net banking flows in Graph 4.
Source: BIS. Graph 5
12 These figures should be interpreted with caution because Germany has not reported euro-
denominated debt security liabilities since 1999, thus biasing upwards the estimated net bank flows from Germany. See the box on page 56 for further detail.

BIS Quarterly Review, December 2007 55
bank flows into Italy, estimated at more than $600 billion since end-1997, are much larger than Italy’s cumulative current account deficit over this period.
Since 1999, cross-border banking activity within the euro area has been increasingly denominated in euros. On a stock basis, intra-euro area cross-border claims in this currency have grown significantly, up sixfold since 1997. As a result, euro-denominated claims accounted for 78% of total intra-euro area claims in all currencies in mid-2007 (Graph 1, top left-hand panel), up from 62% in 1998.
Has the single currency served as a catalyst for greater integration of the banking systems in the euro area? Existing research on this issue has generally found that interbank markets became more integrated with the introduction of the euro, whereas retail markets have remained fragmented.13 Much of this research on euro area integration has paid little attention to quantity-based measures of international banking activity, one exception being Manna (2004). Yet such measures contain useful information about the extent to which banks have diversified their asset portfolios across countries within the euro area and expanded their foreign operations there. The remainder of this section helps to fill in these gaps by focusing first on quantity-based measures of integration of the interbank market in the euro area, and then its retail counterpart.
Cross-border activity in the intra-euro area interbank market has picked up significantly since the introduction of the euro. The annualised growth rate of overall positions in this market increased from 17% between 1990 and 1998 to 25% since 1999, boosting the stock of outstanding claims to $3.4 trillion in the second quarter of 2007. Importantly, this growth has consistently outpaced that in interbank markets elsewhere and, as a result, the euro area market currently accounts for 16% of total international interbank activity, up from 10% in 1998. Much of this has been fuelled by greater use of the euro, whose share in the interbank market hovered around 70% until 1998, but then increased steadily and has stabilised at 86% since 2003.
This growth in interbank lending has gone hand in hand with greater geographical dispersion of the gross cross-border positions within the euro area. When applied to countries in this region, the measure of dispersion introduced in the previous section exhibits a noticeable jump around the time of the introduction of the euro (Graph 1, top right-hand panel). The share of the total value of cross-border linkages (defined as in Graph 3) accounted for by the smallest 75% of the bilateral linkages within the euro area increased from 25% in mid-1998 to 34% in mid-1999 and then, gradually, to 41% by mid-2007. By contrast, the geographical dispersion of the US dollar segment of the cross-border banking market within the euro area has declined steadily since end-1998.
13 See, for example, Baele et al (2004), Bos and Schmiedel (2006), Dominguez (2006), ECB
(2006), Galati and Tsatsaronis (2001), Gropp et al (2006) and Manna (2004).
… have become more dispersed geographically
Intra-euro area linkages …

56 BIS Quarterly Review, December 2007
Measuring net banking flows: some challenges
Banks’ growing use of debt and equity securities markets for funding purposes has made it increasingly difficult to measure the net capital position of one country versus another. The objective of this box is to explain and quantify this issue and to describe one possible procedure for addressing it. The main challenge is that a large fraction of banks’ securities liabilities are held by non-banks, which do not report in the BIS banking statistics.
Banks’ liabilities are increasingly in the form of debt or equity securities rather than deposits. Such liabilities issued by BIS reporting banks grew from $382 billion at end-1995, or 4% of these banks’ total liabilities outstanding, to $4.2 trillion at mid-2007, or 13% of total liabilities. This has generated two related problems which cloud interpretation of the BIS statistics. First, the trading of securities on secondary markets implies that banks cannot identify the holders of the vast majority of their securities liabilities. As a consequence, the liabilities which banks themselves cannot allocate to a particular vis-à-vis country grew from 7% to 10% of the total over the same period. Second, the distinction between international and domestic securities issuance has been blurred over time, thus making it unclear whether a particular liability is cross-border or not. For example, most euro area countries have not reported international euro-denominated debt security liabilities since 1999, implicitly treating such securities liabilities as domestic. However, euro-denominated debt security claims on banks in these countries reported by banks in other countries have been increasing steadily since end-1995, suggesting that much of these securities are in fact held internationally (graph, left-hand panel).
The aggregate indicators of banks’ unallocated or omitted liabilities fail to convey the extent to which such liabilities may impair measures of net bilateral positions. For example, the stock of unallocated liabilities of banks in the United Kingdom is large relative to their reported gross liabilities to euro area residents (graph, centre panel). More importantly, these unallocated liabilities are generally larger than the reported net position of banks in the United Kingdom vis-à-vis euro area residents, implying large uncertainty about the true magnitude of this net position.
The bilateral structure of the BIS locational statistics allows for a partial correction of the data. A fraction of the unallocated debt security liabilities of banks in the United Kingdom (currently 19%) are reported as assets by banks elsewhere (graph, right-hand panel) and, thus, allocated according to the residence of these counterparties. However, a similar allocation of the large remaining fraction, which is most likely held by non-bank investors that are not covered by the BIS banking statistics, relies inevitably on an estimate of these investors’ geographical distribution. A natural approach towards such an estimate, which is adopted for the main discussion in this special feature, is to assume that this distribution mimics the readily observable geographical distribution of reporting banks’ deposit liabilities to non-banks.
Banks’ securities liabilities1
Omitted liabilities Comparing unallocated liabilities Dissecting unallocated liabilities
0
200
400
600
800
95 97 99 01 03 05
Claims on banks²Unallocated liabilities³
0
600
1,200
1,800
2,400
95 97 99 01 03 05
Bank claims4
Liabilities4
Net claimsUnallocated liabilities5
0
200
400
600
800
95 97 99 01 03 05
Unallocated liabilities6
Claims on banks7
1 In billions of US dollars. Based on BIS locational statistics, by residency. 2 Euro-denominated debt security claims on banks in the euro area, as reported by all BIS reporting banks. 3 Euro-denominated debt security liabilities held by unidentified counterparties, as reported by banks in the euro area. 4 Total claims and liabilities of UK resident banks vis-à-vis euro area residents. 5 All instruments, as reported by UK resident banks. 6 Debt securities, as reported by UK resident banks. 7 Debt security claims of BIS reporting banks on UK resident banks.

BIS Quarterly Review, December 2007 57
The BIS statistics, combined with data on domestic credit to non-banks, can be used to construct measures of the degree of integration of retail banking in the euro area. These measures, constructed from the point of view of non-bank borrowers and of bank creditors, rely on the BIS consolidated banking statistics, which do not provide a currency breakdown, and which are available only after 1998. Thus, it is impossible to make comparisons with the period prior to the introduction of the euro, and to explicitly analyse the use of the euro. That said, the measures are helpful in assessing bank diversification and integration at an aggregate level.
A first set of measures track the importance of foreign-headquartered banks in domestic lending markets across the euro area.14 One approach is to focus on the share of direct cross-border credit in total credit to non-banks in a particular country. This is a form of financing conducted by, or at least booked at, foreign-headquartered banks’ offices located outside the borrower’s country of residence, and which is typically missed in domestic banking statistics. Specifically, the measure is calculated as the ratio of cross-border (XB) to total bank credit to non-banks, or XB/(XB + DC), where DC is domestic bank credit to non-banks.15
A second approach arguably captures foreign bank participation in a particular country more fully, by taking into account foreign banks’ local lending, ie the lending done by these banks’ offices (branches and subsidiaries) located in the borrowing country. Specifically, the measure is calculated as the ratio of reporting banks’ cross-border and locally extended claims on non-banks to total bank credit to non-banks in the country, or ( ) ( )DCXBLLINT ++ . In the numerator, international claims (INT) include cross-border and local claims in foreign currencies on non-banks. Local claims in local currencies, LL, are not broken down by sector in the BIS statistics, and thus also include lending to other banks. Hence, the measure is presented as a range – with LL included and excluded from the numerator – in Graph 6. A best-guess point estimate within this range is calculated by applying to LL the sectoral breakdown available for INT.
The evidence based on these measures suggests that foreign bank participation rates are rising in some, but not all, euro area countries (Graph 6). Importantly, however, where such a rise is evident, it seems to have been driven by greater participation of euro area-headquartered banks. For example, foreign bank participation has trended upwards in Germany, Spain and, more recently, Italy, but has been relatively flat in France, Belgium and the
14 These measures, discussed in detail in the June 2005 BIS Quarterly Review, capture the
participation of BIS reporting banks only. They may underestimate overall foreign participation if, for example, domestic banks are owned by foreign non-bank entities (eg private equity firms).
15 This measure may underestimate the role of foreign institutions because it ignores local lending by foreign-headquartered banks’ offices located in the country. At the same time, it may overestimate the role of foreign institutions if domestic banks’ offices located abroad account for a significant share of the cross-border credit received by domestic non-bank borrowers.
… have risen in some euro area countries
Foreign bank participation rates …

58 BIS Quarterly Review, December 2007
Foreign bank participation rates in selected countries
Germany France Italy
95 97 99 01 04 06
Foreign bank participationrange¹Estimated rate²Cross-border rate³
95 97 99 01 04 060
0.1
0.2
0.3
0.4
95 97 99 01 04 06
Belgium Netherlands Spain
95 97 99 01 04 06 95 97 99 01 04 060
0.1
0.2
0.3
0.4
95 97 99 01 04 06
United Kingdom Japan United States
95 97 99 01 04 06 95 97 99 01 04 060
0.1
0.2
0.3
0.4
95 97 99 01 04 061 Ratio of international claims on non-banks (which include local claims in foreign currency) to total credit to non-banks (domestic credit plus cross-border claims). The inclusion or exclusion of local claims in local currency (on all sectors) in the numerator yields the shaded range. 2 Rate estimated by applying the sectoral breakdown from international claims to local currency claims. The thick red lines are based on data reported by all foreign banks, while the thin ones are based on data reported by banks headquartered in the euro area. 3 Ratio of BIS reporting banks’ cross-border claims on non-banks to total credit to non-banks. The thick green lines are based on data for all reporting countries, while the thin ones are based on data reported by banks located in the euro area.
Sources: IMF; BIS. Graph 6
Netherlands. The rise in participation rates in the former group of countries generally reflected greater participation of banks headquartered in the euro

BIS Quarterly Review, December 2007 59
area (see thin lines in Graph 6), thus providing some direct evidence of greater integration. However, participation rates remain low in some euro area countries (eg in Germany and France) in comparison to the United States and the United Kingdom.
Adopting the point of view of bank creditors leads to a measure of the internationalisation of national banking systems. The specific measure is an estimate of the size of foreign claims on non-banks relative to total claims on non-banks booked by banks headquartered in a particular country.16 Unfortunately, the level of detail in the BIS nationality statistics does not allow for decomposing foreign credit according to the residence of non-bank borrowers. Thus, while a rise in the measure suggests greater integration of banking systems globally, it relates only indirectly to integration of the euro area banking systems.
By this measure, all major national banking systems have become more international over the last decade (Graph 7, left-hand panel). Foreign claims are significantly more important for euro area-headquartered banks than for Japanese and US banks, but less important than for Swiss banks. For banks headquartered in the euro area, foreign credit currently accounts for an estimated 38% of their total lending to non-banks, up from 26% at end-1999.
16 For banks headquartered in a particular country, foreign credit to non-banks is the sum of
international credit to non-banks, an estimate of local lending in local currency to non-banks booked by foreign offices, cross-border credit extended by offices abroad to non-banks in the home country and foreign currency lending to residents of the home country. Total credit equals foreign credit plus an estimate of credit extended domestically by these same banks. This is estimated by subtracting credit from foreign banks in the home country from total domestic credit data provided by the IMF.
Internationalisation of banking systems By bank nationality, in per cent
Foreign credit1 Foreign credit to euro area2 Local lending3
0
10
20
30
40
99 01 03 0558
62
66
70
74
9
18
27
36
45
99 01 03 05 07
DE FR EACH UK JPUS
5
13
21
29
37
99 01 03 05 07
CH = Swiss banks; DE = German banks; EA = euro area banks; FR = French banks; JP = Japanese banks; UK = UK banks; US = US banks. 1 Foreign credit to non-banks as a share in total credit to non-banks (see footnote 16 below); for Switzerland, left-hand scale. 2 Foreign credit to both banks and non-banks in the euro area, as a share of total foreign credit to banks and non-banks. 3 Local lending in local currency as a share of foreign credit to banks and non-banks in the euro area (thick lines) and outside the euro area (thin lines).
Sources: IMF; BIS. Graph 7
Euro area banks have expanded their foreign operations …

60 BIS Quarterly Review, December 2007
That said, the internationalisation of euro area banks does not appear to have been driven by greater euro area bias in their foreign positions. A roughly constant share (45%) of euro area-headquartered banks’ total foreign credit (to all sectors) has been extended to borrowers in the euro area since mid-1999 (Graph 7, centre panel). In addition, the portion of euro area banks’ foreign credit to euro area residents that is booked locally, ie by bank offices in host countries, has grown slowly (Graph 7, right-hand panel). This portion currently stands at 19%, up by 7 percentage points since end-1999, and only 3 percentage points since end-2003. By contrast, the “local” portion of the foreign credit extended by euro area banks outside the euro area has been much larger and has been growing faster: from 25% at end-1999 to 38% most recently.17
Conclusion
On balance, the introduction of the euro has brought about some significant changes in the structure of the international banking market. However, these changes must, in many instances, still be judged as rather moderate. Euro-denominated claims now account for a larger share of global claims than did claims in the legacy currencies. Recently, however, the use of the euro has not outpaced that of the US dollar and other currencies (primarily sterling), leaving the euro with a roughly constant share of total international banking transactions since 2003.
Within the euro area, cross-border claims have expanded significantly since the introduction of the euro, much of this expansion reflecting growth in interbank activity. Banking linkages in the euro area have grown more dispersed, suggesting greater integration of euro area banking systems. However, rates of foreign bank participation in total credit to non-banks have risen only marginally in many euro area countries, and remain below those for other developed countries, signalling that integration in euro area retail lending markets has been moderate.
References
Baele, L, A Ferrando, P Hördahl, E Krylova and C Monnet (2004): “Measuring financial integration in the euro area”, ECB Occasional Paper Series, no 14.
Bank for International Settlements (2003a): “Guide to the international financial statistics”, BIS Papers, no 14, February.
——— (2003b): “Guide to the international banking statistics”, BIS Papers, no 16, April.
Bos, J and H Schmiedel (2006): “Is there a single frontier in a single European banking market?”, ECB Working Paper Series, no 701, December.
17 The growth in this share reflects at least partially the increasing role of euro area banks in the
financial systems of new EU member states (García-Herrero and Wooldridge (2007)).
… primarily outside the euro area

BIS Quarterly Review, December 2007 61
Dominguez, K (2006): “The European Central Bank, the euro, and global financial markets”, Journal of Economic Perspectives, vol 20, no 4, Fall.
European Central Bank (2006): Indicators of financial integration in the euro area, September.
Galati, G and K Tsatsaronis (2001): “The impact of the euro on Europe’s financial markets”, BIS Working Papers, no 100, July.
García-Herrero, A and P Wooldridge (2007): “Global and regional financial integration: progress in emerging markets”, BIS Quarterly Review, September, pp 57–68.
Gropp, R, M Duca and J Vesala (2006): “Cross-border bank contagion in Europe”, ECB Working Paper Series, no 662, July.
Manna, M (2004): “Developing statistical indicators of the integration of the euro area banking system”, ECB Working Paper Series, no 300, January.
McGuire, P and N Tarashev (2006): “Tracking international bank flows”, BIS Quarterly Review, December, pp 27–40.
Wooldridge, P (2002): “Uses of the BIS statistics: an introduction”, BIS Quarterly Review, March, pp 75–92.


BIS Quarterly Review, December 2007 63
Gabriele Galati+41 61 280 8923
Alexandra Heath+41 61 280 8514
What drives the growth in FX activity? Interpreting the 2007 triennial survey1
The most recent BIS triennial survey shows that turnover in foreign exchange markets increased by more than 70% over the three years to April 2007. Two specific findings stand out. First, the growth in transactions between banks and other financial institutions was particularly strong, consistent with the increasing importance of hedge funds, as well as portfolio diversification by institutional investors with a longer-term horizon, such as pension funds. Second, there has been a marked increase in turnover involving emerging market currencies.
JEL classification: F31, G15, G20.
The 2007 BIS Triennial Central Bank Survey of Foreign Exchange and Derivatives Market Activity shows that turnover in traditional foreign exchange markets increased significantly to $3.2 trillion in April 2007 (Table 1).2 The growth since April 2004, the previous survey date, was an unprecedented 71% at current exchange rates and 65% at constant exchange rates.3 Although this growth was broadly based across traditional foreign exchange instruments, the pickup in the growth of foreign exchange swaps was particularly strong, increasing to 82% from 44% over the previous three years. Turnover in foreign exchange derivatives, such as currency swaps and foreign exchange options, increased even more rapidly, albeit from a very small base.
Trends in the growth of turnover by different types of counterparty established in earlier surveys have continued. The increase in trading between reporting dealers, typically commercial and, to a lesser extent, investment banks, and other financial institutions, including hedge funds and pension
1 The views expressed in this article are those of the authors and do not necessarily reflect
those of the BIS. We would like to thank Paola Gallardo and Carlos Mallo, who coordinated and compiled the triennial survey statistics, and Jhuvesh Sobrun for research assistance.
2 The survey was conducted in April 2007 by 54 central banks and monetary authorities. They collected data on turnover in traditional foreign exchange markets – spot, outright forwards and foreign exchange swaps – as well as over-the-counter currency and interest rate derivatives. All figures presented here are based on preliminary results released in September 2007.
3 The valuation effects are driven primarily by the depreciation of the dollar and the yen between April 2004 and April 2007.

64 BIS Quarterly Review, December 2007
funds, was particularly notable: the share of this trade in total turnover increased from 33% to 40% (Table 2). The share of trading between reporting dealers and non-financial customers also rose, reaching 17%, recovering to the level it held in 1992–98. Correspondingly, the share of interbank trading continued to fall. In April 2007, trading between reporting dealers captured 43% of the total market, compared to 53% in 2004 and 64% in 1998. This trend is present across instruments.
The survey data also indicate that there have been small but significant changes in the currency composition of foreign exchange turnover. In particular, the presence of emerging market currencies has increased. This potentially points to significant longer-term trends that may have implications for the geographical distribution of foreign exchange sales, given differences in the importance of these currencies for different financial centres.
This special feature looks at some of the trends in traditional foreign exchange turnover in more detail. The first section focuses on the factors underlying the increase in turnover with other financial institutions. In particular, it looks at the contribution made by leveraged investors exploiting short-term profit opportunities through strategies such as the carry trade, by investors with a longer-term horizon diversifying their portfolios and by algorithmic traders. The second section explores the growing importance of emerging market
Global foreign exchange market turnover1
Daily averages in April, in billions of US dollars
1992 1995 1998 2001 2004 2007
Spot transactions 394 494 568 387 621 1,005
Outright forwards 58 97 128 131 208 362
Foreign exchange swaps 324 546 734 656 944 1,714
Estimated gaps in reporting 43 53 61 26 107 128
Total 820 1,190 1,490 1,200 1,880 3,210
Memo: Total at April 2007 exchange rates 880 1,150 1,650 1,420 1,950 3,210
1 Adjusted for local and cross-border double-counting. Table 1
Foreign exchange market turnover by counterparty1
Daily averages in April, in billions of US dollars
1998 2001 2004 2007 Amount % share Amount % share Amount % share Amount % share
Total2 1,429 100 1,174 100 1,773 100 3,083 100
With reporting dealers 908 64 689 59 936 53 1,319 43
With other financial institutions 279 20 329 28 585 33 1,235 40
With non-financial customers 242 17 156 13 252 14 527 17
Local 657 46 499 43 674 38 1,185 38
Cross-border 772 54 674 57 1,099 62 1,896 62 1 Adjusted for local and cross-border double-counting. 2 Excluding estimated gaps in reporting. Table 2

BIS Quarterly Review, December 2007 65
currencies and the implications this has had for different financial centres. The final section concludes.
Rapid growth in turnover with financial customers4
Financial customers were the main drivers of the strong rise in global turnover. Growth in this segment has accounted for half of the increase in total turnover over the past three years, compared with 29% for interbank trading and 21% for the non-financial customer segment. This growth can be explained by several factors, many of which were noted in previous surveys and, as such, can be regarded as a continuation of earlier trends (Galati and Melvin (2004)). First, foreign exchange markets have offered leveraged investors with relatively short investment horizons attractive returns. Second, investors with a longer-term investment horizon have been actively diversifying their portfolios, which has created direct and indirect demand for foreign exchange. Finally, an increase in high-frequency algorithmic trading by some investors, mostly investment banks, has also increased turnover, particularly in the spot market.
Market commentary has suggested that leveraged investors such as hedge funds have been primary players in foreign exchange market activity in recent years. In addition, leveraged retail investors also appear to be a growing
4 The term “financial customers” as used here is equivalent to the term “other financial
institutions” in the triennial survey. This term covers all non-reporting financial institutions, such as smaller commercial banks, investment banks and securities houses, as well as mutual funds, pension funds, hedge funds, currency funds, money market funds, building societies, leasing companies, insurance companies, other financial subsidiaries of corporate firms and central banks.
Sharpe ratios1
April 1998–March 2001 April 2001–March 2004 April 2004–March 2007
EM
E
AU
D
NZD
S&
PUS
HY
US
A
EM
BIG
D
–1.0
–0.5
0
0.5
1.0
1.5
2.0
Bonds EquityCarry trade
EM
BIG
D
EM
E
AU
DN
ZD
S&
P
US
HY
US
A
–1.0
–0.5
0
0.5
1.0
1.5
2.0
Carry trade Bonds Equity
EMB
IGD
EM
EAU
DN
ZD
S&
PUS
HY
US
A
–1.0
–0.5
0
0.5
1.0
1.5
2.0
Bonds EquityCarry trade
AUD = Australian dollar; NZD = New Zealand dollar; EMBIGD = JPMorgan Chase EMBI Global Diversified index; US A = Merrill Lynch US dollar A-rated corporate index; US HY = Merrill Lynch US dollar high-yield corporate index; S&P = S&P 500 equity index; EME = MSCI emerging markets equity index. 1 Calculated as the ratio of annualised excess returns to the annualised standard deviation of returns. The one-month US dollar Libor rate is taken as the risk-free rate. Carry trade returns are calculated as the returns on a US dollar collateral account from a strategy of borrowing in yen with a leverage ratio of 10, to buy an Australian or New Zealand dollar deposit for one month, allowing for profits and losses to be cumulated. All bond and equity indices are in US dollars.
Sources: Bloomberg; Datastream; Global Financial Data; JPMorgan Chase; Merrill Lynch; BIS calculations. Graph 1
Leveraged investors, such as hedge funds, played an important role
Financial customers were the main driver of turnover growth

66 BIS Quarterly Review, December 2007
presence in foreign exchange markets, although the impact of these investors on global turnover is still relatively small and the degree of leverage is not likely to be large (Galati et al (2007)). One of the factors driving this trend is that retail investors have had significantly more access to margin accounts through online trading services targeted at retail traders, such as Deutsche Bank’s dbFX.
Indeed, strategies such as the carry trade, which use leverage to exploit interest rate differentials and exchange rate trends in an environment of low financial market volatility, have been profitable over the past three years (Galati et al (2007), Graph 1). The triennial survey statistics show that several currencies identified as carry trade targets, such as the Australian and New Zealand dollars, experienced particularly strong growth in turnover between April 2004 and April 2007 (Table 3).5 More broadly, there is a positive correlation between growth in turnover and the level of domestic interest rates across instruments (Graph 2).
The contribution of these investment strategies to overall turnover has been amplified by the increase in the funds managed by leveraged investors. Although it is difficult to obtain precise numbers, it is clear that hedge fund activity, measured by either estimates of assets under management or the number of funds, has increased significantly over the past six years (Graph 3, left-hand and centre panels). The growth in hedge fund activity has been concentrated in the United States and London. In addition to access to relatively cheap funding and benign conditions in financial markets, hedge fund
5 This is true even after taking into account valuation effects arising from exchange rate
changes and an increase in the share of Australian dollar turnover due to refinements in the data collection process. For an analysis of the role of the carry trade in Asia, see Gyntelberg and Remolona (in this issue).
Turnover and interest rates
Spot Outright forwards FX swaps
GBP
CHF
NOK
PLN
HUF
AUD
CAD
SEK
HKD
NZD
MXN
SGD
KRW
ZAR
DKK
RUB
INR
TWD
0
2
4
6
8
0 100 200 300 400 500
NZD
HUF
GBP
CHF
AUD
CAD
SEK
HKD
NOK
MXN
SGD
KRW
ZAR
DKK
RUB
PLN
INR
TWD
0
2
4
6
8
0 100 200 300 400 500
NOK
HUF
GBP
CHF
AUD
CAD
SEK
HKD
NZD
MXN
SGD
KRW
ZAR
DKK
RUB
PLN
INR
TWD
0
2
4
6
8
0 100 200 300 400 500 The horizontal axis indicates the percentage change between 2004 and 2007 of foreign exchange turnover, and the vertical axis indicates the average between April 2004 and April 2007 of the three-month interest rate. Both axes show figures in per cent. The line is obtained from an OLS regression, with adjusted R2 of 0.14, 0.29 and 0.02 for the left-hand, centre and right-hand panels, respectively.
Sources: Datastream; national data; BIS calculations. Graph 2
Funds managed by leveraged investors have increased
Carry trades have been a popular investment strategy

BIS Quarterly Review, December 2007 67
growth in foreign exchange markets has benefited from the development of prime brokerage services.6
Institutional investors, such as pension funds and investment trust managers with a longer-term investment horizon, have also been more active in their cross-currency investment activities. This reflects a number of driving forces. First, similarly to investors with a shorter-term horizon, these investors
6 With prime brokerage, a customer, for example a hedge fund, can obtain liquidity from a
variety of sources while at the same time maintaining a credit relationship, placing collateral and settling transactions with a single bank – the prime broker (Foreign Exchange Committee (2005)).
Foreign exchange turnover by currency1 Daily averages in April, percentage shares
2001 2004 2007
US dollar 90.4 88.7 86.3
Euro 37.7 37.2 37.0
Japanese yen 22.7 20.3 16.5
Pound sterling 13.3 16.9 15.0
Swiss franc 6.1 6.1 6.8
Australian dollar 4.2 5.5 6.7
Canadian dollar 4.5 4.2 4.2
Swedish krona 2.1 2.3 2.8
Hong Kong dollar 2.2 1.9 2.8
Norwegian krone 1.1 1.5 2.2
New Zealand dollar 0.2 1.0 1.9
Mexican peso 0.8 1.1 1.3
Singapore dollar 0.9 1.0 1.2
Korean won 0.7 1.2 1.1
South African rand 1.0 0.8 0.9
Danish krone 1.0 0.9 0.9
Russian rouble 0.4 0.7 0.8
Polish zloty 0.5 0.4 0.8
Indian rupee 0.2 0.3 0.7
Chinese renminbi 0.0 0.1 0.5
New Taiwan dollar 0.3 0.4 0.4
Brazilian real 0.4 0.2 0.4
All currencies 200 200 200
Emerging market currencies2 16.9 15.6 19.8
Asia3 4.7 5.3 7.2
Latin America4 1.5 1.6 1.8
Central and eastern Europe5 1.1 1.5 2.2 1 Because two currencies are involved in each transaction, the sum of the percentage shares of individual currencies totals 200% instead of 100%. The figures are adjusted for local and cross-border double-counting. 2 Defined as the residual after accounting for the top eight currencies, the Norwegian krone, the New Zealand dollar and the Danish krone. See also footnote 10 on page ●. 3 Includes the listed currencies of emerging Asian economies as well as the Indonesian rupiah, the Malaysian ringgit, the Philippine peso and the Thai baht. 4 Includes the listed Latin American currencies as well as the Chilean and Colombian pesos. 5 Includes the Czech koruna, the Hungarian forint, the Russian rouble, the Polish zloty and the Slovak koruna. Table 3

68 BIS Quarterly Review, December 2007
have increasingly viewed foreign exchange as a distinct asset class and have taken a more active approach to the management of currency exposure with a view to improving returns on international investments.7 Second, the portfolios these institutions manage have become increasingly diversified internationally (CGFS (2007)), encouraged by developments in financial markets, the greater availability of instruments that allow foreign exchange risk to be hedged and regulatory changes. A third driving force is that the value of funds managed by these investors has grown significantly. Data on Japanese investment trusts provide a specific example of the latter two factors at work (Graph 3, right-hand panel).
Another factor likely to have been important for the increase in turnover between reporting dealers and other financial institutions, particularly hedge funds and investment banks, is the growing role of algorithmic trading (The Economist (2007), Pengelly (2007)). This style of trading is designed to exploit high-frequency movements in exchange rate quotes that are available electronically, based on a set of predetermined rules. For example, algorithmic traders have tried to exploit changes in carry trade profitability at very high frequencies. Algorithmic trading generates high turnover relative to the underlying size of the positions. The growth in this market segment owes much to advances in technology in electronic trading systems, particularly in the spot market (Kos (2006)).8 There is also anecdotal evidence that algorithmic traders have contributed to a significant rise in futures market activity.9
7 One aspect of this approach is the increasing use of currency overlay, a process by which
investors manage their foreign exchange positions more actively and manage their currency exposures separately (Galati and Melvin (2004)).
8 The Banker (2007) reported that the continuing rise in algorithmic trading has boosted the business of electronic brokers in the interbank segment.
9 In early 2007, Reuters and the Chicago Mercantile Exchange announced plans to create a joint platform that would support the use of algorithmic trading.
Managed funds
Assets under management1 Number of hedge funds2 Japanese investment trust funds3
30
40
50
60
98 99 00 01 02 03 04 05 060.3
0.7
1.1
1.5
Conventional assets (rhs)Hedge funds (lhs)
0
2
4
6
03 04 05 06 07
TotalLondonNew York (NY)US excluding NY
0
25
50
75
98 99 00 01 02 03 04 05 06 07
Other foreign currencyForeign currency bondsForeign currency stocksDomestic currency
1 In trillions of US dollars. 2 Number of funds reporting to the HFR database; in thousands. 3 In trillions of yen.
Sources: Hedge Fund Research (HFR); IFSL; Investment Trust Association Japan. Graph 3
Algorithmic trading has boosted turnover

BIS Quarterly Review, December 2007 69
The rising importance of emerging market currencies
The results of the latest triennial survey also show that turnover involving emerging market currencies grew significantly faster than aggregate turnover. As a result, emerging market currencies are estimated to be on at least one side of almost 20% of all transactions, compared to less than 15% in April 2004 and less than 17% in April 2001 (Table 3).10 The largest growth rates in turnover for emerging market currencies were in transactions between banks and non-financial customers (157%), a segment generally identified more closely with economic growth and trade, and financial customers (144%). Over the past three years, emerging market financial assets have offered very attractive risk-adjusted returns (Graph 1). This partly reflects the strong growth in many of these economies and the ongoing trend towards deepening financial markets in the Asian region (Ho et al (2005)).
The rise in turnover was particularly pronounced for the Hong Kong dollar, and occurred across all three traditional foreign exchange instruments. This increase is likely to reflect Hong Kong SAR’s ties with China and, in particular, the recent wave of equity flows, most of which are related to initial public offerings (IPOs) by Chinese companies in Hong Kong. The volume of IPOs on the Hong Kong stock exchange has been very high in recent years, averaging $2 billion per month (BIS (2007)). In April 2007, Chinese nationals raised $9 billion on equity markets, an unusually large amount, mostly in Hong Kong. For example, China Citic Bank is quoted in market commentary as having raised about $3.7 billion in Hong Kong in April 2007.11 These activities generate sizeable money market activity, as buyers seek funding, which then spills over into the foreign exchange market, especially the derivatives segment, as banks swap US dollars for Hong Kong dollars. A wide range of other currencies also made significant contributions to overall growth in turnover, including the Indian rupee, the Mexican peso, the Polish zloty, the Singapore dollar and the South African rand.
Another interesting development for emerging market currencies is that, in many cases, the share of currency trade between non-resident counterparties has increased significantly. Some emerging market currencies, including the Brazilian real, the Indonesian rupiah, the Malaysian ringgit, the Mexican peso, the Polish zloty and the Turkish lira, experienced very large increases in the share of offshore trade. However, the share of trading with non-resident counterparties in emerging markets is still generally lower compared to currencies of industrial economies, and is particularly low for most Asian emerging market currencies, partly because a number of these economies place some restrictions on offshore trading activity.
10 These estimates assume that unidentified currencies are emerging market currencies, and so
provide an upper bound. The degree of overestimation in the 2007 survey is likely to be less than one percentage point, but is probably larger in earlier surveys. As such, the estimate of 15.6% in Table 3 should be treated as a generous upper bound. This issue will be discussed in more detail in the final report on the triennial survey, due to be released in December 2007.
11 www.iht.com/articles/2007/04/20/news/citic.php.
Offshore trading of emerging market currencies has increased
A marked rise in activity in Hong Kong dollars
Fast growth in emerging market currency turnover

70 BIS Quarterly Review, December 2007
Foreign exchange turnover by country and currency1
April 2007, in billions of US dollars
Emerging market currencies Reporting
dealer Other
financial institution
Non-financial customer
Total (% aggregate)
Aggregate turnover
United Kingdom 68.6 72.2 17.8 158.5
(12) 1,359.1
United States 70.0 62.5 41.6 174.1
(26) 663.6
Switzerland 8.7 2.0 1.9 12.6
(5) 241.7
Japan 10.6 1.9 1.2 13.6
(6) 238.4
Hong Kong SAR 85.9 16.9 6.2 109.1
(62) 174.6
Australia 5.2 3.0 0.8 9.0(5)
169.5
1 Net of local inter-dealer double-counting. Table 4
Offshore trading in emerging market currencies is distributed unevenly
across financial centres (Table 4). The United Kingdom and the United States have the largest volume of emerging market currency trading. In both cases, the share of this turnover accounted for by transactions with non-reporting financial institutions is relatively high, owing to the large presence of these institutions in these centres (Graph 3, centre panel). For the United Kingdom, cross-border transactions are more important than local ones, and two thirds of the turnover is accounted for by foreign exchange swaps. The most important emerging market currencies are the Hong Kong dollar, the Polish zloty and the South African rand. For the United States, spot transactions account for almost half of the turnover and, although a broad spectrum of emerging market currencies is traded, turnover is dominated by Latin American currencies, in particular the Mexican peso and the Brazilian real.
Singapore and Hong Kong are important offshore financial centres for currencies of emerging market economies in Asia. In addition to trade in each other’s currencies, there is significant turnover in the Chinese renminbi, the Korean won, the Indian rupee and the New Taiwan dollar. The importance of non-deliverable forward contracts in these currencies is reflected in the relatively high share of forward contracts in aggregate turnover. In contrast, other financial centres, such as Australia, Japan and Switzerland, have relatively small volumes of emerging market currency trading.
Conclusions
The latest triennial survey revealed an exceptional increase in global foreign exchange market turnover between April 2004 and April 2007. This special feature examined two noteworthy results: the growing importance of
Singapore and Hong Kong are very important for Asian currencies
Largest offshore centres are the United Kingdom and the United States

BIS Quarterly Review, December 2007 71
transactions between reporting dealers and other financial institutions and the increase in the turnover of emerging market currencies.
Some of the drivers of these results seem to reflect structural changes and are therefore likely to continue affecting developments in foreign exchange turnover. For example, the increase in portfolio diversification by longer-term fund managers appears to be the result of a fundamental shift in approach. To the extent that some home bias in investment behaviour remains, there is potential for further diversification to boost turnover between reporting dealers and financial customers going forward. The expansion of activity by leveraged retail traders could also add momentum to this trend. In contrast, the potential role for investors with a shorter-term horizon, such as those following carry trade strategies, is more dependent on factors such as financial market volatility that affect the attractiveness of foreign exchange as an asset class.
Further above average growth in turnover in emerging market currencies is also likely going forward, although this is dependent on emerging market economies continuing to experience robust growth, as well as a further deepening and opening of their domestic financial markets. Should the share of emerging market currencies in total turnover continue to increase, this could have significant implications for the geographical distribution of foreign exchange activity given that some financial centres, such as Hong Kong and Singapore, have a stronger focus on these currencies.
Other structural trends noted in previous analyses of triennial surveys appear not to have had a significant impact. The concentration of the banking sector and the increased efficiency driven by the spread of electronic broking platforms, which were put forward as explanations for the falling share of the interbank market in previous surveys, do not appear to have been as important over the past three years. Indeed, the growth in interbank transactions has been roughly steady over the past six years, and the fall in the share of this segment can largely be explained by the more rapid growth of the other segments.
Several other developments in foreign exchange markets are also having a profound impact, although the effect on aggregate turnover is not clear. First, the distinction between banks that are market-makers in the interbank market and other financial institutions continues to become less apparent as these other financial institutions increasingly provide market liquidity. This trend is underpinned by the consolidation in the banking industry, the growth of banking organisations that play a number of different roles in foreign exchange markets, the strong growth in prime brokerage and the granting of access to electronic brokers in the interbank market to hedge funds (Jung (2007)). While the impact of this trend on aggregate turnover is difficult to assess, it does suggest that the ability to characterise the behaviour of different counterparty types may become more difficult over time.
Another significant development is the expansion of multibank electronic trading platforms that cater to customer markets. While transactions between banks and their customers are still generally executed through direct
… while some earlier trends appear to have run their course
Some trends are likely to continue to affect turnover …
Several other developments will also be important

72 BIS Quarterly Review, December 2007
dealing,12 business transacted on electronic trading platforms has increased steadily. In the early 1990s, banks started to offer the advantages of these services to their customer business in the form of single-dealer trading platforms. Partly as a result of pressure from customers seeking simultaneous access to several pricing sources, dealing banks have tended to become associated with one or several of the multibank trading platforms that have become operational since the early 2000s. These systems allow customers to access prices and to trade with any of the participating dealers with whom they have an established credit relationship. The expansion of the role of multibank electronic platforms is likely to increase turnover by facilitating investors’ access to market-makers. Indeed, the electronic trading platforms have already increased turnover by providing access to retail margin traders and tools for algorithmic trading.
References
Bank for International Settlements (2007): 77th Annual Report, Basel, June.
The Banker (2007): “Writing’s on the wall for sell-side middle men?”, January.
Committee on the Global Financial System (2007): “Institutional investors, global savings and asset allocation”, CGFS publications, no 27, February.
The Economist (2007): “Algorithmic trading, ahead of the tape”, no 383, June, p 85.
Foreign Exchange Committee (2005): Foreign exchange prime brokerage product overview and best practice recommendations.
Galati, G, A Heath and P McGuire (2007): “Evidence of carry trade activity”, BIS Quarterly Review, September, pp 27–41.
Galati, G and M Melvin (2004): “Explaining the surge in FX turnover”, BIS Quarterly Review, December, pp 67–74.
Ho, C, G Ma and R N McCauley (2005): “Trading Asian currencies”, BIS Quarterly Review, March, pp 49–58.
Jung, J (2007): “Take me to your interdealer”, Risk, August, pp 22–4.
Kos, D (2006): “Recent volatility trends in the foreign exchange market”, remarks at the Forex Network New York conference, New York City, 11 May.
Pengelly, M (2007): “Algos a go-go”, Risk, August, pp 36–7.
12 An exception to this are banks in Switzerland, which are more likely to transact with their
financial customers through electronic trading systems.

BIS Quarterly Review, December 2007 73
Jacob Gyntelberg+852 2878 7145
Eli M Remolona+852 2878 7150
Risk in carry trades: a look at target currencies in Asia and the Pacific1
We analyse carry trades involving the Australian dollar, Indonesian rupiah, Indian rupee, New Zealand dollar and Philippine peso as target currencies. We find evidence supporting the view that downside risk is an important feature of such strategies and propose ways of measuring this risk.
JEL classification: F310, G150, G180, N250.
Carry trades are often viewed as a highly speculative investment strategy, to be tried only by the most sophisticated investor. Empirically, however, these trades have been shown to perform well quite consistently for protracted periods and have thus become a fairly common strategy. Confirming this observation is the fact that market participants have created tradable indices as well as various forms of structured FX instruments referencing carry trade strategies.
Based on a sample of target currencies in Asia and the Pacific, we find that carry trades have had extraordinarily high returns but also a risk of large losses. This finding suggests that carry trade returns may, at least in part, reflect compensation for very large downside risks. On balance, our analysis of carry trades involving target currencies in Asia and the Pacific does indeed show that the perceived risks of carry trading would be captured well by focusing on downside risk. Using value-at-risk (VaR) and expected shortfall as measures of downside risk, we find a positive relationship between risks and returns for carry trades.
This special feature is organised as follows. In the first section we briefly review the literature on uncovered interest parity (UIP), a condition that would make carry trades unprofitable. The second section presents alternative measures of risk for carry trades, focusing on five target currencies in Asia and
1 The authors are grateful for useful discussions and comments from numerous individuals at
CSFB, Deutsche Bank, Barclays, Merrill Lynch, Moody’s Investors Service, and FitchDerivatives, as well as from Claudio Borio, Már Gudmundsson, Anella Munro, Frank Packer, Ilhyock Shim and Philip Wooldridge. We thank Eric Chan for excellent research assistance. The views expressed in this article are those of the authors and do not necessarily reflect those of the BIS.

74 BIS Quarterly Review, December 2007
the Pacific. The third section presents preliminary evidence on the links between risk and return for carry trades. The final section concludes.
Carry trades versus uncovered interest parity
The carry trade strategy involves borrowing in a currency with low interest rates (called the funding currency) and investing in one with high interest rates (the target currency). If the target currency does not depreciate vis-à-vis the funding currency during the life of the investment, then the investor earns at least the interest differential. This strategy does not work if uncovered interest parity (UIP) holds. The UIP condition states that higher-yielding currencies will tend to depreciate against lower-yielding ones at a rate equal to the interest differential so that expected returns are equalised in a given currency. Under UIP, any interest differential is offset by currency movements.
In a large body of empirical literature, however, UIP has been shown to fail almost universally at time horizons shorter than five years.2 Indeed, in many cases the relationship is precisely the opposite of what is predicted by UIP: currencies with high interest rates tend to appreciate while those with low interest rates depreciate.3 Remolona and Schrijvers (2003) show that UIP fails especially when investors hold instruments with maturities that are longer than the investment horizon. This failure of UIP is so well established that the phenomenon is called the “forward premium puzzle”. In a world of risk, UIP is almost certainly false. The condition states that expected returns would be equal regardless of risk. Risks clearly vary across currencies, however, and different risks should command different expected returns.
The failure of UIP has been no secret to participants in currency markets. Indeed, the most popular investment strategy in these markets has been the carry trade, which is essentially a bet against UIP. The strategy has become so commonplace that the market has created tradable benchmarks for them and has introduced structured FX instruments referencing these benchmarks (see Box next page).4
Carry trades tend to be pursued only when the interest differential is wide enough to compensate for the foreign exchange risk being taken.5 Hence, they have so far tended not to involve most major currencies as targets; instead, they have involved such target currencies as the Australian dollar (AUD),
2 See, for example, the surveys of the literature by Engel (1996) and Flood and Rose (2002).
Chinn and Meredith (2004) suggest that UIP does hold at horizons longer than five years.
3 Carry trades are an important feature of financial globalisation. See Gudmundsson (2007) for the implicatons of such globalisation on the monetary transmission mechanism.
4 See Galati et al (2007) for a discussion of the difficulties involved in estimating the size of global carry trade activity.
5 Galati and Heath (2007) provide evidence that foreign exchange trade volumes are positively correlated with higher domestic interest rates. Hattori and Shin (2007) find evidence that volumes of carry trades involving the yen are high when interest differentials against the yen are high.
A significant interest rate differential is necessary
The forward premium puzzle
Carry trade strategies work when uncovered interest parity does not

BIS Quarterly Review, December 2007 75
Carry trades as a standard trading strategy
Carry trades have in recent years become so commonplace that the market has created tradable benchmarks for them and has introduced structured FX instruments referencing these indices.
Several tradable carry trade index families have been launched over the last year. All of them include one or more Asian currencies (see table below). These indices combine a long position in one or more high-yielding currencies with a short position in one or more low-yielding currencies. In terms of currencies referenced, the indices fall into two categories. One category references only 10 major currencies, namely the Australian dollar (AUD), Canadian dollar (CAD), Swiss franc (CHF), euro (EUR), pound sterling (GBP), Japanese yen (JPY), Norwegian krone (NOK), New Zealand dollar (NZD), Swedish krona (SEK) and US dollar (USD). The other group references combinations of these and selected regional currencies. Thus, even the indices based on a smaller set of currencies include Asia-Pacific currencies, namely the AUD, JPY and NZD. Indices with a broader base of currencies typically include all the Asia-Pacific currencies except the CNY and HKD.
A distinction can be made between indices where the choice of funding and investment currencies is done according to simple rules and those relying on more sophisticated allocation methods. The simple rule approach, which is used by the Deutsche Bank, puts equal weight on the three lowest-yielding and the three highest-yielding currencies every month. The more sophisticated approach, which is used for the CSFB and Barclays indices, deploys some form of mean-variance optimisation when choosing the index weights, which implies lower aggregate weights on highly correlated currencies
Characteristics of selected carry traded indices
Index family Originator Inception Structure Asian currencies referenced
CSFB Rolling optimised carry trade indices
Credit Suisse First Boston April 2007
Reallocation every month across 10 major + EM currencies
AUD, JPY, NZD, SGD
GEMS Asia Index Barclays Capital March 2007
Five currencies one month forward vs EUR or USD
IDR, NDR, KRW, PHP THB
DB Harvest Deutsche Bank March 2007
Reallocation every month across 10 major and 11 EM currencies
AUD, JPY, KRW, NZD, SGD, THB, TWD
Intelligent Carry Trade Index
Barclays Capital March 2007
Reallocation every month across 10 major currencies
AUD, JPY, NZD
Sources: Citigroup; Credit Suisse First Boston; Deutsche Bank; Barclays Capital.
Recently structured FX instruments based on carry trades have also been introduced in the form of collateralised foreign exchange obligations (CFXOs). The first deals were completed in spring 2007. A CFXO is a collateralised debt obligation based on the cash flow from underlying carry trades (Merrill Lynch (2007)). Investors are paid in order of priority, starting with senior investors and ending with equity holders.
An additional indication that carry trades are becoming a standard asset type in the global financial market is the fact that major international rating agencies have issued or are in the process of issuing methodology documents as well as guidelines on how they rate CFXOs and similar instruments. So far only Fitch Ratings has published guidelines and descriptions of the methodology used in their ratings (Fitch (2007)), while S&P and Moody’s will probably do so going forward. Similar to carry trade indices, CFXOs typically reference either only 10 major currencies or combinations of these and other typically regional currencies.
Icelandic króna (ISK), New Zealand dollar (NZD), South African rand (ZAR), Swedish krona (SEK), Turkish lira (YTL) and occasionally the pound sterling (GBP). In periods where interest differentials have been sufficiently wide, carry trades have also involved target currencies under managed float

76 BIS Quarterly Review, December 2007
regimes, such as the Brazilian real (BRL), Czech koruna (CZK), Hungarian forint (HUF), Indian rupee (INR), Indonesian rupiah (IDR) and Philippine peso (PHP).
The focus in this special feature is on the nature of the risk in carry trades. For a preliminary illustration of this risk, Graph 1 shows the performance of recent carry trades involving the Australian dollar and New Zealand dollar as target currencies and the Japanese yen as the funding currency. In the graph, realised returns have tended to be positive and have often been quite high but there have been occasional periods of negative returns. This pattern of returns suggests that the risk faced by investors in carry trades is downside risk, in which there is a small probability of a large loss. We analyse this risk more formally below.
Measuring the risk in carry trades
To explore the nature of the risk faced by investors in carry trades, we consider the return distributions for combinations of five currencies in Asia and the Pacific that are known to have been target currencies and two currencies that have been funding currencies, resulting in 10 currency pairs. The target currencies are the Australian dollar, Indonesian rupiah, Indian rupee, New Zealand dollar and Philippine peso, and the two funding currencies are the Swiss franc and Japanese yen. We look at the period from end-December 2000 to end-September 2007, a period when the relevant interest differentials were fairly wide. Carry trades for these currency pairs have been so common that Bloomberg makes daily returns for them available on page FXCT. These daily returns are calculated using three-month eurodeposit rates for the funding as well as the target currencies. We use these daily returns from Bloomberg for the period to construct return distributions. We then measure the extent to which the returns are more peaked or more flat relative to a normal distribution (kurtosis). A distribution with high kurtosis has a distinct peak near the mean,
Carry trades: ex post returns Annualised average daily return, in per cent1
–40
–20
0
20
40
60
03 Q3 04 Q1 04 Q3 05 Q1 05 Q3 06 Q1 06 Q3 07 Q1 07 Q3
AUD/JPYNZD/JPY
1 Calculated as the sum of interest rate differentials and the percentage change in the target currency’s bilateral exchange rate against the Japanese yen.
Sources: Bloomberg; BIS calculations. Graph 1
Consider 10 currency pairs in Asia and the Pacific
Carry trade investors face downside risk

BIS Quarterly Review, December 2007 77
declines rather rapidly and has heavy tails. More importantly, we also measure the extent to which returns lack symmetry or exhibit skewness. The return distribution is negatively skewed if it has a long tail in the negative direction.
Return distributions
In terms of mean returns, our sample of carry trade strategies has tended to outperform the major stock markets for the period under consideration. The annualised average daily return on the Australian dollar/yen carry trade, for example, was 12.5% per year during the period 2001 to September 2007, compared to 3.6% for the S&P 500 Index. Carry trades involving the Japanese yen as the funding currency show stronger average returns than trades involving the Swiss franc as the funding currency. This difference in performance arises in part because the interest differentials involving the yen have been wider than those involving the Swiss franc.
It is also evident that carry trade returns are not normally distributed. Graph 2 shows that return distributions for all the carry trades in our sample have positive kurtosis and thus heavier tails than a normal distribution. More importantly, the returns tend to be negatively skewed, reflecting a higher frequency of large negative returns.6 The negative skew reflects the presence of occasional large negative returns in the range of 2% to 4%. This skew is what we call downside risk. The graph shows that, for the period under consideration, the negative skew is most pronounced for carry trades involving the Australian and New Zealand dollars as target currencies. The negative skew is less pronounced for the target currencies under managed float regimes, namely the Indonesian rupiah, Indian rupee and Philippine peso. It does not seem to matter very much whether the funding currency is the Swiss franc or the yen: the resulting distributions tend to be similar for the two
6 Using a Jarque-Bera test, the null hypothesis of normality is rejected with significance well
below the 1% level in all cases.
Skewness and kurtosis for daily returns January 2001 to September 2007
Kurtosis Skewness
0
2
4
6
8
AUD IDR INR NZD PHP
JPY fundingCHF funding
–1.0
–0.8
–0.6
–0.4
–0.2
AUD IDR INR NZD PHP
Sources: Bloomberg; BIS calculations. Graph 2
Carry trade returns are negatively skewed

78 BIS Quarterly Review, December 2007
currencies.7
Risk measures
Given the distributions of returns for carry trades, what would be the appropriate measure of risk? Here we consider three possible measures: (1) volatility; (2) value-at-risk (VaR); and (3) expected shortfall.8 Volatility of returns is the most common measure of risk in financial markets and would be most appropriate for normally distributed returns, or at least symmetric return distributions.9 VaR may be defined as the capital needed to cover a certain level of losses from a financial instrument over a given holding period and for a given confidence level.10 It is a standard measure of risk in credit markets, where return distributions feature small probabilities of large losses. Expected shortfall is the potential expected loss in situations where losses exceed a given VaR.11 Both VaR and expected shortfall are measures that focus on downside risk. However, unlike the VaR measure, expected shortfall is considered to be a coherent measure of risk, that is, it always captures benefits from diversification (Artzner et al (1997), Artzner (1999)). For this article, VaR and expected shortfall are estimated using an extreme value theory approach.12 We use the 99% confidence level for both measures.
For purposes of comparing risks, we use the major equity markets as a reference point. Using volatility as the measure of risk, carry trades appear much less risky than major equity markets. In Table 1, daily return volatilities for carry trades in the period 2001 to 2007 are in the 0.6–0.8% range, which is well below that for major equity markets, where volatilities are in the 1–1.4% range. While the VaR and expected shortfall measures for carry trades are also below those of equity markets, the difference with the equity measures is less in relative terms. For instance, the ratio of the average of risk estimated for the 10 currency pairs and the average for the three stock markets reported in
7 The return profiles of carry trade returns are consistent with the Plantin and Shin (2007)
theoretical analysis of carry trades. Their model predicts that UIP will fail and that high-yielding currencies will have periods of gradual appreciation followed by abrupt reversals.
8 Other downside risk measures one could consider are implied volatilities for deep-out-of-the- money call options and risk reversals. While these measures have the advantage of being forward-looking, they also contain risk premia and are therefore potentially misleading measures of risk.
9 The return distributions for the equity markets in Table 1 all have positive kurtosis and are sligthly negatively skewed.
10 For a random variable X with continous distribution function F models losses over a given time horizon. VaRp is then the p-th quantile of the distribution F: VaRp = F-1(1–p) where F-1 is the inverse of the distribution function F.
11 We use ES0.01,which is the expected loss given the loss exceeds the 1% VaR and is given by ES0.01 = E(X│X > VaR0.01).
12 When estimating VaR and expected shortfall we follow the peak-over-threshhold method from Gilli and Këllezi (2006) and estimate a Generalized Pareto Distribution for the left tail of the distribution.
Carry trades appear much less risky based on volatility … … but less so based on downside risk measures
Three measures of risk

BIS Quarterly Review, December 2007 79
Table 1 is 0.60 when risk is measured by volatility, 0.62 when measured by VaR, and 0.65 when measured by expected shortfall.
These results are of interest because some researchers have found carry trades to offer unusually attractive risk-return trade-offs when using volatility as their measure of risk. Burnside et al (2007), for example, show that carry trades have much higher Sharpe ratios – which use volatility as a measure of risk - than equity markets. But the results may vary if we use other measures of risk. We next turn briefly to this issue.13
Risk and return in carry trades
In the following analysis, we are limited to comparing risk and return for a sample of only 10 carry trades. Hence, the conclusions we will draw will necessarily be tentative and suggestive.
Given the appropriate risk measure, ie assuming that the risk measure is what is used by market participants, expected returns would reflect risk. The higher the risk, the higher the expected return. One way to look at this relationship is to consider the ratio of expected returns to risk. The most common is the Sharpe ratio, which is the ratio of expected return to
13 Our estimates of return and risk may be subject to a “peso problem”, ie they may reflect a
perceived small probability of a large discrete change in the exchange rate, and thus be upwardly biased (Krasker (1980)).
Risk measures and returns for daily carry trade returns January 2001 to September 2007; in per cent
Mean return Currency pairs (long/short)
Daily Annualised
Volatility
1% VaR
1% expected shortfall
AUD/JPY 0.047 12.493 0.722 2.082 2.822 IDR/JPY1 0.040 10.404 0.803 2.453 3.195 INR/JPY 0.033 8.626 0.593 1.499 1.908 NZD/JPY 0.056 14.937 0.807 2.354 3.191 PHP/JPY2 0.034 8.897 0.624 1.555 2.199 AUD/CHF 0.024 6.077 0.638 1.836 2.397 IDR/CHF1 0.016 4.133 0.850 2.542 3.438 INR/CHF 0.010 2.403 0.666 1.630 1.963 NZD/CHF 0.032 8.381 0.722 2.070 2.697 PHP/CHF2 0.011 2.685 0.680 1.656 1.965 Memo: AUD/JPY (since 1996) 0.029 7.572 0.805 2.282 3.005 NZD/JPY (since 1996) 0.033 8.544 0.845 2.412 3.090 S&P 500 0.014 3.614 1.063 2.802 3.494 Nikkei 225 0.021 5.469 1.374 3.507 4.178 FTSE 100 0.009 2.176 1.126 3.160 4.201 1 From August 2001. 2 From February 2001.
Sources: Bloomberg; JPMorgan; UBS; BIS calculations using Matlab code from Gilli and Këllezi (2006). Table 1

80 BIS Quarterly Review, December 2007
volatility.14 The left-hand panel of Graph 3 compares the Sharpe ratios for carry trades and equity markets calculated over the 2001–07 period. In this case, the trade-offs between risk and return for carry trades have been far more attractive than for equity markets. This is consistent with the results of Burnside et al (2007), who consider these findings to be a puzzle. Moreover, the ratios vary substantially from one carry trade to another.
Once we turn to measures that focus on downside risk, however, the pattern of risk-return trade-offs looks different. In the case of both VaR and expected shortfall, the absolute differences between carry trade and equity market strategies, in terms of compensation received per unit of risk, have narrowed considerably (although they remain quite large). More importantly, we now find that the differences between carry trades are smaller. This implies that the compensation received per unit of downside risk is similar across carry trade strategies. While this does not show either VaR or expected shortfall to be the better measure of downside risk, the relative uniformity of risk-return ratios across currency pairs for either risk measure suggests that returns for carry trade strategies may be closely aligned to downside risks. 15
Conclusions
We look at the risk profile of 10 carry trade strategies involving the Australian dollar, Indonesian rupiah, Indian rupee, New Zealand dollar and Philippine peso as target currencies and the Swiss franc and Japanese yen as funding
14 Strictly speaking, the Sharpe ratio is the ratio of expected excess return to volatility. For our
purposes, however, the distinction between return and excess return is immaterial.
15 The standard deviations for the return risk ratios of the 10 currency pairs are respectively: 2% for the return to volatility ratio, 0.7% for the return to VaR ratio and 0.5% for the return to expected shortfall ratio.
Risk-return trade-offs: volatility versus downside risk Average return divided by risk measure for carry trades and equity markets, January 2001 to September 2007
Risk as volatility Risk as 1% VaR Risk as 1% expected shortfall
0
0.02
0.04
0.06
AUD
/JPY
IDR
/JPY
¹
INR
/JP
Y
NZD
/JP
Y
PHP/
JPY²
S&
P 5
00
Nik
kei 2
25
FTS
E 10
0
0
0.02
0.04
0.06
AUD
/JPY
IDR
/JPY
¹
INR
/JP
Y
NZD
/JP
Y
PHP/
JPY²
S&
P 5
00
Nik
kei 2
25
FTS
E 10
0
0
0.02
0.04
0.06
AUD
/JPY
IDR
/JPY
¹
INR
/JP
Y
NZD
/JP
Y
PHP/
JPY²
S&
P 5
00
Nik
kei 2
25
FTS
E 10
0
1 From August 2001. 2 From February 2001.
Sources: Bloomberg; JPMorgan; BIS calculations. Graph 3
Carry trade returns reflect downside risk

BIS Quarterly Review, December 2007 81
currencies. In recent years these strategies have yielded average returns that have seemed extraordinarily high relative to their risk in terms of volatilities. However, their return distributions show both fat tails and significant negative skewness. This suggests that to capture the perceived risks of carry trade strategies, appropriate measures of risk for these strategies would be those that focus on downside risk.
We consider two common measures of downside risk, VaR and expected shortfall. We find that both measures lead to broadly similar risk-return trade-offs across carry trade strategies. This suggests that expected carry trade returns do in fact reflect downside risk. We also find that the difference between risk-return trade-offs for carry trade strategies and those trade-offs for equity markets remain wide regardless of the risk measure used. This suggests that carry trades and equity markets belong to different asset classes, for which risks are priced differently.
References
Artzner, P, F Delbaen, JM Eber and D Heath (1997): “Thinking coherently”, Risk Magazine, vol 10, pp 68–71.
Artzner, P (1999): “Coherent measures of risk”, Mathematical Finance, vol 9, pp 203–28.
Bera, AK and CM Jarque (1980): “Efficient tests for normality, homoscedasticity and serial independence of regression residuals”, Economics Letters, vol 6, pp 255–9.
——— (1981): “Efficient tests for normality, homoscedasticity and serial independence of regression residuals: Monte Carlo evidence”, Economics Letters, vol 7, pp 313–18.
Burnside, C, M Eichenbaum, I Kleshchelski and S Rebelo (2007): “The returns to currency speculation in emerging markets”, American Economic Review, vol 97, no 2, pp 333–8.
Chinn, MD and G Meredith (2004): “Monetary policy and long horizon uncovered interest parity”, IMF Staff Papers, vol 51, pp 409–30.
Engel, C (1996): “The forward discount anomaly and the risk premium: a survey of recent evidence”, Journal of Empirical Finance, vol 32, pp 305–319.
Fitch Derivatives (2007): “Considerations for rating foreign exchange-linked credit obligations (CFXOs)”, Structured Credit, Special Report, April.
Flood, R and A Rose (2002): “Uncovered interest parity in crisis”, IMF Staff Papers, vol 49, pp 252–266.
Galati, G, A Heath and P McGuire (2007): “Evidence of carry trade activity”, BIS Quarterly Review, September, pp 27–41.
Gilli, M and E Këllezi (2006): “An application of extreme value theory for measuring financial risk”, Computational Economics, vol 27, pp 1–23.

82 BIS Quarterly Review, December 2007
Gudmundsson, M (2007): “Financial globalisation: key trends and implications for the transmission mechanism of monetary policy”, paper presented at a BNM-BIS conference on “Financial market developments and their implications for monetary policy”, Kuala Lumpur, 12–14 August (forthcoming publication).
Hattori, M and HS Shin (2007): ”The broad yen carry trade”, Bank of Japan, Institute for Monetary and Economic Studies, Discussion Paper no 2007-E-19.
Krasker, W (1980): “The ‘peso problem’ in testing the efficiency of forward exchange markets”, Journal of Monetary Economics, vol 6, pp 269–76.
Merrill Lynch (2007): “CDOs go beyond credit: FX CDOs, CCOs, EDS and CDOs”, European Structured Finance, CDO, March.
Plantin, G and H Shin (2007): “Carry trades and speculative dynamics”, working paper.
Remolona, E and M A Schrijvers (2003): “Reaching for yield: selected issues for reserve managers”, BIS Quarterly Review, September, pp 65–74.

BIS Quarterly Review, December 2007 83
Elisabeth Ledrut1 Christian Upper+41 61 280 8416
Changing post-trading arrangements for OTC derivatives2
The post-trading infrastructure of OTC derivatives markets has not always kept up with the rapid growth in trading volumes. Recent years have seen some initiatives that seek to introduce multilateral elements that facilitate flows of information between market participants while preserving the decentralised nature of the transactions. While central counterparties lead to the highest degree of mutualisation, other services, such as central information depositories or multilateral terminations, could deliver similar benefits in terms of information management.
JEL classification: G24, G29, G32.
Over-the-counter (OTC) derivatives markets have grown rapidly in terms of both size and complexity since the BIS started surveying the market in 1995. Daily turnover in OTC foreign exchange and interest rate contracts increased from $0.9 trillion in April 1995 to over $4 trillion in April 2007 (Graph 1, left-hand panel). Notional amounts outstanding of OTC derivatives of all types increased more than tenfold between 1995 and 2007, to $500 trillion at the end of June 2007, which corresponds to an average rate of growth of over 20% per year. While most of this growth was driven by increasing volumes in fairly standardised (“plain vanilla”) contracts, there has also been a proliferation of new products, some of which are highly complex.
The increase in size and complexity of the OTC derivatives markets naturally raises the issue of whether the risks emanating from such contracts are being properly managed. One area which has repeatedly given cause for concern is the post-trading infrastructure of the market, which has often not matched the rise in volumes and the continued development of new and increasingly complex products. The most visible indicator of deficiencies in post-trading processes has been the backlog in trades pending confirmation.
1 Manager, Risk Management Division, Euroclear SA/NV. This article was written when
Elisabeth Ledrut was at the BIS.
2 The views expressed are those of the authors and do not necessarily reflect those of the BIS, the Committee on Payment and Settlement Systems or Euroclear. We would like to thank Denis Beau and Patrick Parkinson for comments, and San Sau Fung and Jhuvesh Sobrun for excellent research assistance.

84 BIS Quarterly Review, December 2007
This feature discusses how the bilateral nature of OTC derivatives contracts affects clearing and settlement. It first offers a brief discussion of the main characteristics of OTC derivatives and their implications for post-trade processes. It then reviews the problem of confirmation backlogs and unnotified novations in credit derivatives and other contracts that brought post-trade processing into the spotlight three years ago. Finally, drawing on a recent report by the Committee on Payment and Settlement Systems (CPSS (2007)), it reviews recent developments in the market for post-trade services and considers how multilateral elements such as central counterparties, data warehouses or multilateral terminations can improve the management of information flows between market participants.3
Characteristics of OTC derivatives and implications for post-trade processing
OTC derivatives have a number of characteristics that have important implications for post-trade processing. First, while OTC transactions may take place on multilateral trading platforms, clearing and settlement is by its very nature bilateral. Information on each trade is often not stored centrally, as in the books of an exchange, but separately at each of the counterparties. Ensuring that this information is consistent is a major challenge.
Second, OTC derivatives are bilateral contracts, not assets that can be traded freely. Contracts with different counterparties are usually not fungible, which makes it difficult for traders to close positions. One way to circumvent
3 Clearing and settlement of exchange-traded derivatives is reviewed in CPSS (1997).
Global OTC derivatives markets
Turnover and amount outstanding1 Share by counterparty per instrument 3
0.8
1.6
2.4
3.2
4.0
1992 1995 1998 2001 2004 20070
120
240
360
480
Turnover (rhs)²Outstanding amounts (lhs)
Other reporting dealers
Other financial institutions
Non-financial institutions
0
20
40
60
80
100
Forex Interestrate
Equity-linked
CDS
1 Notional amounts, adjusted for double-counting, in trillions of US dollars. 2 Daily averages. 3 June 2007 figures, adjusted for double-counting, in per cent.
Source: BIS. Graph 1
… lack of fungibility …
Clearing and settlement complicated by the bilateral nature …
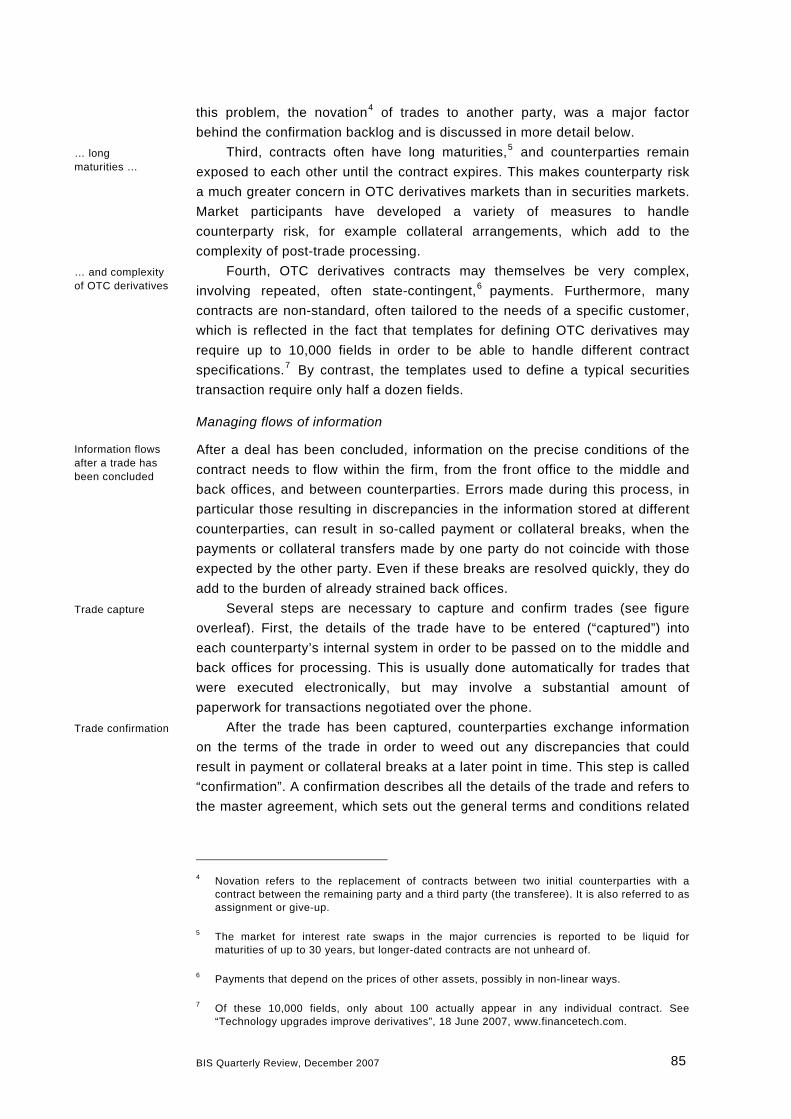
BIS Quarterly Review, December 2007 85
this problem, the novation4 of trades to another party, was a major factor behind the confirmation backlog and is discussed in more detail below.
Third, contracts often have long maturities,5 and counterparties remain exposed to each other until the contract expires. This makes counterparty risk a much greater concern in OTC derivatives markets than in securities markets. Market participants have developed a variety of measures to handle counterparty risk, for example collateral arrangements, which add to the complexity of post-trade processing.
Fourth, OTC derivatives contracts may themselves be very complex, involving repeated, often state-contingent,6 payments. Furthermore, many contracts are non-standard, often tailored to the needs of a specific customer, which is reflected in the fact that templates for defining OTC derivatives may require up to 10,000 fields in order to be able to handle different contract specifications.7 By contrast, the templates used to define a typical securities transaction require only half a dozen fields.
Managing flows of information
After a deal has been concluded, information on the precise conditions of the contract needs to flow within the firm, from the front office to the middle and back offices, and between counterparties. Errors made during this process, in particular those resulting in discrepancies in the information stored at different counterparties, can result in so-called payment or collateral breaks, when the payments or collateral transfers made by one party do not coincide with those expected by the other party. Even if these breaks are resolved quickly, they do add to the burden of already strained back offices.
Several steps are necessary to capture and confirm trades (see figure overleaf). First, the details of the trade have to be entered (“captured”) into each counterparty’s internal system in order to be passed on to the middle and back offices for processing. This is usually done automatically for trades that were executed electronically, but may involve a substantial amount of paperwork for transactions negotiated over the phone.
After the trade has been captured, counterparties exchange information on the terms of the trade in order to weed out any discrepancies that could result in payment or collateral breaks at a later point in time. This step is called “confirmation”. A confirmation describes all the details of the trade and refers to the master agreement, which sets out the general terms and conditions related
4 Novation refers to the replacement of contracts between two initial counterparties with a
contract between the remaining party and a third party (the transferee). It is also referred to as assignment or give-up.
5 The market for interest rate swaps in the major currencies is reported to be liquid for maturities of up to 30 years, but longer-dated contracts are not unheard of.
6 Payments that depend on the prices of other assets, possibly in non-linear ways.
7 Of these 10,000 fields, only about 100 actually appear in any individual contract. See “Technology upgrades improve derivatives”, 18 June 2007, www.financetech.com.
Trade confirmation
Trade capture
Information flows after a trade has been concluded
… and complexity of OTC derivatives
… long maturities …

86 BIS Quarterly Review, December 2007
Flows of information in OTC derivatives transactions
to OTC derivatives trades between these two counterparties. A confirmation proposal may either be prepared by both counterparties and then matched (most common for inter-dealer trades), or prepared by only one and affirmed by the other (for trades with investing institutions such as hedge funds). Once counterparties agree on the content of the confirmation, it will serve as the final record of the trade.
Since the confirmation process may take some time, in particular for more complex contracts, some counterparties exchange information on the major terms of the trade before preparing a full confirmation document (“trade verification”, also referred to as “economic affirmation”). As with trade capture, the verification and confirmation processes may involve a substantial amount of manual intervention, in particular for trades executed over the phone.
The problem of confirmation backlogs
The high number of unconfirmed trades a few years ago was perhaps the most visible sign of deficiencies in the flows of information related to the post-trade
Confirmation backlog ...
Trade verification

BIS Quarterly Review, December 2007 87
processing of OTC derivatives. Confirmation backlogs had already been flagged in CPSS (1998), which noted that a significant amount of confirmations remained outstanding for 90 days or more, yet their number continued to increase. The yearly ISDA Operations Benchmarking Surveys subsequently showed that in 2003 the average derivatives dealer had a confirmation backlog of 21 business days for credit derivatives, and nine days for vanilla interest rate swaps (Graph 2, left-hand panel). In 2004, the share of unconfirmed credit derivatives trades declined at small and medium-sized firms, but it remained stubbornly high at 25 days at the larger dealers (centre panel).8
Why should a high number of unconfirmed transactions be a concern? For market participants, the lack of confirmation represents an increase in uncertainty with regard to the exact terms of a trade and their exposure to their counterparties. While unconfirmed trades are legally binding in most jurisdictions, potential disagreement about their precise terms can result in lengthy and costly litigation. Similarly, knowledge of a firm’s precise positions is a precondition for successful risk management. Such worries are borne out by previous experience. For example, in the 1960s, problems in the clearing and settlement of securities transactions caused sizeable losses to market participants (see box).
8 Some market participants even referred to a “wall of outstanding confirmations”. This could be
taken quite literally, given the low degree of automation at the time. For example, the 150,000 confirmations outstanding for credit derivatives transactions in September 2005 (United States Government Accountability Office (2007)) correspond to a total of approximately 2,250,000 sheets of paper (assuming an average document length of 15 pages), which is equivalent to a pile at least 225 metres high!
Confirmation backlogs and back office staffing
Total confirmations1 Large-firm confirmations1 Back office staffing ratios2
0
6
12
18
24
30
01 02 03 04 05 06 07
Vanilla swapsCurrency optionsCredit derivativesNon-vanilla equity derivatives
0
6
12
18
24
30
01 02 03 04 05 06 070.2
0.5
0.8
1.1
1.4
1.7
01 02 03 04 05 06 07
All IR derivativesCurrency optionsEquity derivativesCredit derivatives
1 Outstanding volume, in business days; average by firm, calculated by dividing outstanding confirmations by daily volume of new trades. In 2007 (13.7 and 22.6 business days for all respondents and large firms, respectively). In the 2007 survey, no distinction is made between vanilla and non-vanilla equity derivatives. 2 Trade processing staff as a ratio of front office staff.
Source: ISDA Operations Benchmarking Surveys. Graph 2
… increases risk

88 BIS Quarterly Review, December 2007
The US paper crunch, 1967–19701
The current information management issues related to OTC derivatives transactions bear some resemblance to the US paper crunch in the late 1960s, when the back offices of US securities brokers were not able to handle the sharp increase in trading volumes. The number of “fails”, ie failures to deliver securities on the settlement date, soared in consequence, and so did losses from errors at brokerages. Some firms tried to resolve the problems by abruptly switching to computerised systems, with generally disappointing results. Ironically, instead of providing relief, the fall in volumes that accompanied the decline in stock prices in 1969 and 1970 added to the burden on already weakened firms. Declining revenues at a time when costs continued to rise resulted in the failures of many brokerage houses. According to Seligman (2003), approximately 160 members of the New York Stock Exchange failed during that period, and roughly the same number were either taken over or disbanded.
The Securities and Exchange Commission (SEC) initially reacted to the back office problems by shortening the trading day in August 1967 and in early 1968, but with little effect. In the 1970s, the SEC imposed a compulsory surcharge on the commissions paid on small trades in order to prop up the income of brokerages, but even so expenses of the leading securities firms substantially exceeded income and sizeable backlogs remained. In the end, the back office problems seem to have been “resolved” by private investors shunning the stock market for a variety of reasons, including bad experiences with back office procedures. A 1973 report by the New York Stock Exchange found that three out of 10 investors had experienced lost or late-delivered securities.
Notwithstanding the similarities between the paper crunch and the current situation in the OTC derivatives markets, there are also notable differences from today’s backlogs. First, the back office problems of the late 1960s concerned broker-dealers which were organised as partnerships and were by an order of magnitude smaller and less sophisticated than the large banks that dominate the OTC derivatives markets today.2 As a consequence, the broker-dealers of the 1960s had much less financial muscle to fund an overhaul of their back office procedures. Second, operational risk was arguably much less well understood in the 1960s than today, which resulted in less willingness to address such risks. That said, the paper crunch of the 1960s serves as a reminder that weak back office procedures could have serious implications not only for market efficiency but also for the financial health of firms active in the market. __________________________________
1 The discussion is based on SEC (1971) and Seligman (2003). 2 The discrepancies were also very large relative to their capital base. For example, SEC (1971) reports that the number of untraceable securities owed to customers exceeded capital by a factor of two at several firms!
The apparent inability of large derivatives firms to reduce their confirmation backlogs, in particular in credit derivatives, triggered regulatory action. In February 2005, the UK Financial Services Authority (FSA) sent a letter to all financial institutions under its supervision that were active in the credit derivatives market. The FSA voiced its concerns about the level of unconfirmed trades, calling for industry initiatives to solve this problem (FSA (2005)). In the summer of the same year, an industry grouping, the Counterparty Risk Management Policy Group II, drew attention to the problem and urged a reduction in the backlogs, along with various other recommendations (CRMPG II (2005)). In September, the Federal Reserve Bank of New York convened a meeting of representatives of 14 major dealers and their regulators where they committed to reducing the number of confirmations outstanding in credit derivatives (FRBNY (2005)). In the following year, the CPSS set up a working group to analyse existing post-trade arrangements and risk management practices in OTC derivatives markets more
Responses by regulators

BIS Quarterly Review, December 2007 89
generally, and to evaluate ways to enhance the infrastructure of the market (CPSS (2007)).
These initiatives have borne fruit. The number of outstanding credit derivatives confirmations at large firms fell from 25 business days in 2004 to six days at the end of 2006 (ISDA (2007)).9 This reduction in the number of unconfirmed trades was, to some extent, the result of an increase in the resources dedicated to back office operations. The number of personnel involved in processing trades went up from 0.67 per trader in 2004 to 1.25 in 2006 and 2007 (Graph 2, right-hand panel).
In addition, market participants removed a major stumbling block for more timely confirmations, namely the large number of unnotified novations. Novations, which involve the transfer of trades to a third party, are routinely used by hedge funds to exit positions, in particular in credit derivatives.10 Some dealers estimate that roughly 25% of their credit derivatives trades and 5% of their interest rate derivatives trades involve novation (CPSS (2007)). While the International Swaps and Derivatives Association’s (ISDA) master agreements have always required traders to seek the consent of their original counterparties before novating a trade, this was often not adhered to in practice. As a consequence, many dealers were kept in the dark as to who precisely their counterparty was. Indeed, they sometimes found out about novations only after payments were returned or were received from a different counterparty. The issue of novations seems to have been solved by the introduction by the ISDA in 2005 of a novation protocol that sets out precise deadlines for obtaining counterparty consents before novating a trade. The protocol has since been widely adopted by the industry.
Finally, market participants have shifted much of their trading activity to electronic platforms. This, in turn, has resulted in an increase in electronic grade processing, as most trading platforms provide the ability to capture trade data directly to firms’ internal databases and offer a link to an electronic confirmation service such as the Depository Trust and Clearing Corporation’s (DTCC) Deriv/SERV.11
While much has been achieved in addressing the confirmation backlog in credit derivatives, similar progress has not been made in other instruments. Indeed, in 2006 the number of unconfirmed trades in non-vanilla equity derivatives averaged 30 days (large firms) and 20 days (all firms), prompting regulators to call for a similar effort to the one made for credit derivatives (FRNBY (2006, 2007), CPSS (2007)).
9 Data provided by the major dealers to the Federal Reserve indicate that the number of
outstanding confirmations increased considerably in the first half of 2007, but remained far below the levels seen in previous years (Markit (2007)).
10 Novations allow parties wishing to exit a contract to seek quotes from several dealers. In contrast, terminating a contract would force them to accept the quotes of their initial counterparty, putting them in a weak bargaining position.
11 Annex 5 of CPSS (2007) describes the most important trading platforms and the extent to which they are linked to systems for post-trade processing.
… and increased use of electronic trading platforms
Reduction in confirmation backlog due to increased staffing …
… new protocol on novations …

90 BIS Quarterly Review, December 2007
Replicating the success achieved in reducing the backlog of unconfirmed credit derivatives transactions will not be easy in other market segments. The market for credit derivatives is highly concentrated and market participants tend to trade frequently, which facilitates investment in sophisticated trade processing systems. Other markets are less concentrated and feature a more heterogeneous set of traders. For example, BIS data indicate that only a third of all transactions in equity derivatives take place between 55 reporting dealers, compared to more than one half in the case of credit default swaps (Graph 1, right-hand panel). Electronic trading is also less widespread in other market segments. Data provided by major dealers show that large dealers electronically confirm almost 90% of their trading volume in credit derivatives. The corresponding figures for other market segments are far lower, in particular in the equity segment (Markit (2007)).
The market for post-trade services
Dedicating sufficient resources to back office processes and solving the problem of unnotified novations were clearly very important in reducing the confirmation backlog in credit derivatives. Ultimately, however, any lasting solution to delays in confirmations of OTC derivatives transactions and the management of life-cycle events, for example payments or collateral transfers, will probably also involve some degree of standardisation of market conventions and the establishment of mechanisms that facilitate the flow of information between institutions. This is bound to introduce some centralisation into the market for post-trade services.
This section discusses how the flow of information between market participants can be improved through a variety of multilateral arrangements.12 The most radical measure would be to novate all trades to a central counterparty (CCP), which would also centralise information on contract terms and manage life-cycle events. However, the prevalence of non-standardised contracts and uncertainty about valuations that characterise some segments of the OTC derivatives market could limit the scope for such arrangements. Market participants have therefore searched for other ways of overcoming the information problems associated with a fragmented market. These include introducing mechanisms such as central information depositories or portfolio reconciliation services that reap some of the benefits of CCPs without involving the novation of contracts to a new entity.
Central counterparties
CCPs have been an important feature of commodity and derivatives exchanges for a long time but are a relatively recent phenomenon in OTC derivatives markets.13 The most important provider of central counterparty services for 12 A broader overview of post-trade services is given in Annex 6 of CPSS (2007).
13 Central counterparties were introduced at several European commodity exchanges in the 19th century. In the United States, the Chicago Board of Trade (CBOT) set up a clearing house in 1883, but it did not become a true CCP until the 1920s (Moser (1998), Kroszner (2006)).
Success difficult to replicate in other market segments
Central counterparties new to OTC derivatives
Increased presence of multilateral arrangements in clearing and settlement

BIS Quarterly Review, December 2007 91
OTC derivatives, LCH.Clearnet Ltd, launched its CCP service for interest rate swaps, SwapClear, in September 1999.14 By the end of June 2007, the cumulative notional amounts of interest rate swaps cleared through SwapClear totalled $44 trillion, which compares to roughly 40% of total inter-dealer positions at that point in time (Graph 3, left-hand panel).15
Under CCP arrangements, the two counterparties of a transaction replace the claims and obligations vis-à-vis each other with separate claims and obligations against the clearing house. The CCP manages its risk by requiring traders to post collateral (“margin”) on their positions, which is adjusted on a daily basis or at even higher frequencies, if necessary. Should any of the counterparties of the CCP be unable to meet their obligations, then their position is liquidated and any shortfall is covered by the posted margin.
The establishment of a CCP can provide two major benefits: multilateral netting and a reduction of counterparty risk. Multilateral netting is achieved by making contracts between different counterparties fungible so that they can be offset against each other. Traders can therefore fully close a position by entering an offsetting contract with any other member of the clearing house. Multilateral netting, in turn, reduces counterparty risk since it reduces the volume of open positions. The counterparty risk of a particular contract may also be reduced by the replacement of a claim on a derivatives house by a
14 Prior to 1999, CCP arrangements for interest rate swaps were common only in Scandinavia.
More recently, several derivatives exchanges have begun clearing OTC derivatives through their clearing houses by converting them into equivalent exchange-traded contracts. See CPSS (2007), p 25.
15 The two figures are not strictly comparable since the numbers supplied by LCH.Clearnet do not account for the expiration of contracts. Nevertheless, they do illustrate a rough order of magnitude.
Central counterparty arrangements and multilateral terminations
OTC interest rate swaps1 Multilateral terminations of CDSs
0
50
100
150
200
250
Jun 98 Jun 00 Jun 02 Jun 04 Jun 06
SwapClear²Total contractsWith reporting dealers
0
0.6
1.2
1.8
2.4
3.0
Dec 04 Dec 05 Dec 060
3
6
9
12
15 TriOptima terminations(rhs)³Share (lhs)4
1 Notional amounts outstanding, in trillions of US dollars. 2 Cumulative since September 1999, excluding maturities. 3 Notional amounts of terminated credit default swaps (CDSs), in trillions of US dollars. 4 As a share of BIS outstanding amounts of CDSs, in per cent.
Sources: LCH.Clearnet Ltd; TriOptima; BIS. Graph 3
Benefits

92 BIS Quarterly Review, December 2007
claim on a CCP, since the latter tends to be more creditworthy than all but the highest-rated derivatives traders.16
The role of CCPs is not limited to managing counterparty risk or ensuring fungibility; they also play an informational role. Once transactions have been accepted by the CCP, the clearing house takes charge of managing information, of setting margins, and of ensuring that payments are made. In addition, high access standards by CCPs can serve as a catalyst for improvements in back office processes. For example, SwapClear only accepts trades that have been affirmed or confirmed through electronic services such as SWIFT or SwapsWire, which arguably spurred the development of electronic trade confirmation systems for interest rate swaps.
The benefits of CCP arrangements are greatest if there is a single CCP for all types of contracts. In practice, CCPs in the OTC derivatives market are restricted to plain vanilla contracts which are easy to value. For example, SwapClear has not yet attempted to clear interest rate options, in part because of valuation issues.17
Central information depositories
Given that CCP services have been limited to a restricted set of contracts, market participants have explored other avenues to obtain some of the benefits of CCPs. These include the centralisation of information or multilateral netting, through mechanisms that do not rely on the existence of accepted and unambiguous valuations. One possibility is to centralise the management of information without transferring counterparty risk. In practice, such trade information warehouses are often linked to electronic confirmation services. For example, SwapsWire maintains a database of all trades confirmed by its system, which allows market participants to reconcile their database to the SwapsWire records on a regular basis. SwapsWire also offers a link to SwapClear’s CCP and TriOptima’s triReduce services (see below). A trade information warehouse for credit default swaps has been set up by the DTCC, which automatically stores all trades confirmed through Deriv/SERV. Traders are also able to enter previous trades into the system. SWIFT offers an archive of trades confirmed by the system. Such information could be linked to services managing life-cycle events such as payments or collateral transfers.
16 See CPSS (2007), Bliss and Papathanassiou (2006) and Bliss and Steigerwald (2006) for a
more comprehensive discussion of CCPs. For various reasons, the role of CCPs is limited to the inter-dealer market. However, other players such as hedge funds may obtain similar benefits through prime broker arrangements. In such a relationship, institutions conduct trades with multiple executing brokers and novate them to a prime broker. Prime brokers thus take over the counterparty credit risk vis-à-vis the hedge funds’ counterparties, similar to the role of CCPs in the inter-dealer market. In addition, transactions with a prime broker can be netted bilaterally, which decreases the amount of collateral needed.
17 Pirrong (2006) argues that the fact that more complex contracts are not cleared centrally is related to the existence of asymmetric information between dealers and the CCP. The access to a better pricing model may encourage dealers to transfer riskier trades to the CCP and keep less risky trades on their books. The fact that not even all standardised contracts are centrally cleared could be explained by economies of scale between these contracts and more complex derivatives for which CCP arrangements do not exist.
Centralisation of information …
Limitations

BIS Quarterly Review, December 2007 93
Portfolio reconciliation and termination services
Storing information on contract terms in a central database clearly facilitates the reconciliation of portfolios between market participants, but it is not strictly necessary. An alternative is a multilateral portfolio reconciliation service such as triResolve, offered by TriOptima for a variety of instruments. Dealers provide TriOptima with contract by contract information on their derivatives positions through a central website. TriOptima then checks whether each individual contract is reported by both counterparties with identical terms.
Multilateral portfolio reconciliation can also be used to achieve at least some degree of fungibility of trades concluded with different sets of counterparties if combined with a multilateral termination (tear-up) service. For example, TriOptima’s triReduce service uses the information provided by the individual dealers to compute a set of bilateral contracts between participants that provides the same net exposures but lower gross exposures than the original positions. This could significantly reduce counterparty risk, which depends on gross rather than net exposures. TriOptima’s termination cycles have had a substantial effect on the size of the CDS market. In the first half of 2007, terminations of CDS contracts reached $3.2 trillion, which shaved approximately 11% off the rate of growth in that product category (Graph 3, right-hand panel). TriReduce is also available for interest rate swaps, but the impact of terminations on the amounts outstanding has been smaller than in the CDS market.
Conclusion
While market documentation practices and clearing and settlement processes are easily taken for granted, especially when they function well, they are in constant need of upgrade to keep up with increasing volumes and continuing innovation in markets. Infrastructure malfunction can result in a whole market grinding to a halt, while uncertainty about the confirmation and settlement of trades can drain market liquidity and discourage counterparties. A functioning market infrastructure can be seen as a public good, which highlights the positive role of public policy in ensuring that the necessary investments are made and in coordinating the response of private market participants. The way the backlog in confirmations of credit derivatives was addressed provides an interesting case study showing how regulators and private sector firms can work together. By helping to overcome the coordination problem inherent in investing in a public good, regulatory intervention served as a catalyst for private sector efforts to solve the problem.
… or regular portfolio reconciliation

94 BIS Quarterly Review, December 2007
References
Bliss, R and C Papathanassiou (2006): Derivatives clearing, central counterparties and novation: the economic implications, March.
Bliss, R and R Steigerwald (2006): “Derivatives clearing and settlement: a comparison of central counterparties and alternative structures”, Federal Reserve Bank of Chicago, Economic Perspectives, 4th Quarter, pp 22–41.
Committee on Payment and Settlement Systems (1997): Clearing arrangements for exchange-traded derivatives, March.
——— (1998): OTC derivatives: settlement procedures and counterparty risk management, September.
——— (2007): New developments in clearing and settlement arrangements for OTC derivatives, March.
Counterparty Risk Management Policy Group II (2005): Toward greater financial stability: a private sector perspective, July.
Federal Reserve Bank of New York (2005): Press release entitled “Statement regarding progress in credit derivatives markets” and letter from the industry, September.
——— (2006): Press release entitled “New York Fed welcomes industry commitments on equity derivatives” and letter from the industry, November.
——— (2007): Press release entitled “New York Fed welcomes new commitments on equity derivatives” and letter from the industry, May.
Financial Services Authority (2005): Letter on “Operations and risk management in credit derivatives markets”, February.
International Swaps and Derivatives Association (various issues): Operations Benchmarking Survey, www.isda.org.
Kroszner, R (2006): “Central counterparty clearing: history, innovation, and regulation”, Federal Reserve Bank of Chicago, Economic Perspectives, 4th Quarter, pp 37–41.
Markit (2007): Quarterly metrics report, second quarter, www.markit.com/marketing/metrics.php.
Moser, J (1998): “Contracting innovations and the evolution of clearing and settlement methods at futures exchanges”, Federal Reserve Bank of Chicago Working Paper, August.
Pirrong, C (2006): “Rocket science, default risk and the organization of derivatives markets”, mimeo.
Securities and Exchange Commission (1971): Study of unsafe and unsound practices of brokers and dealers, Washington DC, US Government Printing Office.

BIS Quarterly Review, December 2007 95
Seligman, J (2003): Cautious evolution or perennial irresolution: self-regulation and market structure during the first 70 years of the Securities and Exchange Commission, December.
United States Government Accountability Office (2007): Report to congressional requesters on “Credit derivatives: confirmation backlogs increased dealers’ operational risks, but were successfully addressed after joint regulatory action”, June.


BIS Quarterly Review, December 2007 97
Blaise Gadanecz+41 61 280 8417
Recent initiatives by the Basel-based committees and groups
During the period under review, the Basel Committee on Banking Supervision (BCBS) issued a statement about the usefulness of its ongoing initiatives in the light of recent financial market developments and continued work in a number of areas. The Financial Stability Forum (FSF) met in New York, formed a working group on market and institutional resilience, and reviewed its offshore financial centres initiative, as well as the implementation of recommendations in the area of highly leveraged institutions. Table 1 provides an overview of these and other developments.
Basel Committee on Banking Supervision
At its October meeting, the BCBS observed the usefulness of its work in various areas in view of the recent financial market turbulence. Also in October, the Committee issued a statement welcoming endeavours to enhance transparency for cover payments, as well as a consultative document on the Guidelines for Computing Capital for Incremental Default Risk in the Trading Book.
At the conclusion of its 8–9 October meeting, Nout Wellink, Chairman of the BCBS, noted that the Committee’s ongoing initiatives help address the types of issues and risks arising from the recent financial market turbulence. In particular, the Committee underscored the importance of implementing the Basel II capital framework, strengthening supervision and risk management practices in areas like liquidity risk, and improving the robustness of valuation practices and market transparency for complex and less liquid products. The Committee continues to assess the supervisory and risk management issues arising from recent financial market developments and, where appropriate, will consider supervisory responses that are pragmatic and proportionate.
With regard to strengthening the capital framework, Committee members agreed that Basel II implementation will help make the capital base more relevant to banks’ risk profiles and that the Committee will closely monitor its impact. The framework will also serve to create incentives for better risk measurement and management, including for securitisation exposures and liquidity lines for asset-backed commercial paper programmes. The Committee has also been working to introduce new standards for banks to hold capital
… by strengthening the capital framework …
Basel Committee’s initiatives help address issues and risks arising from recent market turbulence …

98 BIS Quarterly Review, December 2007
against the default risk associated with complex, less liquid credit products in the trading book. It agreed to seek public consultation on the proposed standards and to assess their impact on banks’ capital requirements. The Committee also emphasised the key role of Pillar 2 (the Supervisory Review Process).
As far as liquidity supervision and regulation is concerned, earlier this year the Committee initiated a review of jurisdictions’ approaches to supervising and regulating funding liquidity risk. This work will take account of lessons learned from recent market events, including how liquidity risk is assessed by banks and supervisors under the assumption of stressed market conditions and the risks related to off-balance sheet exposures.
Earlier this year the Committee launched an initiative to assess the reliability and auditability of fair value estimates, including the assessment of market liquidity in valuation methodologies. This work builds on its June 2006 guidance on the use of the fair value option and its current work on the trading book.
Finally, introducing Pillar 3 (Market Discipline) of Basel II will improve quantitative and qualitative information available to the marketplace on the risk profile of banks, including risks associated with securitisation exposures, the nature of such exposures and the risks that have been retained.
In a newsletter published on 12 October, the Committee issued a statement welcoming the dialogue between the public and private sector over the issue of enhanced transparency for cover payments1 initiated by the industry through the Wolfsberg Group and the Clearing House Association as well as the proposals under discussion in the SWIFT community to increase the transparency of transfers. A solution improving transparency in international payments should aid anti-crime efforts worldwide. The Committee encourages the industry, which is best placed to design the technical solutions to meet this challenge, to proceed with all the necessary changes in order to implement these solutions for all relevant standards of messages as soon as is feasible. The Committee encourages the effective and genuine use of such solutions. It has also asked its AML/CFT Expert Group to review the supervisory issues related to cover payments and the industry’s initiative, in coordination with all interested stakeholders and in particular the FATF, overseers of payment systems and the industry, in order to reach a consensus on principles informing supervisory policies and priorities for the implementation of the transparency rules.
On 12 October, the BCBS also issued for comment a consultative paper on the Guidelines for Computing Capital for Incremental Default Risk in the Trading Book. The paper is open for comment until 15 February 2008.
1 Cover payments are used in correspondent banking in particular to execute transfers ordered
by customers in foreign currencies. This technique of cover payments has advantages for banks, but the current messaging standards do not ensure full transparency for the intermediary banks on the transfers they are helping to execute. This has in some cases raised concerns about the risk that such a type of message could be chosen on purpose to conceal the names of parties to a transaction and about the ability of the intermediary banks to comply with their obligations.
In a consultative paper …
Efforts to enhance transparency for cover payments
… and market discipline
… enhancing bank valuation practices …
… through liquidity supervision …

BIS Quarterly Review, December 2007 99
Main initiatives by Basel-based committees and groups Press releases and publications over the period under review
Body Initiative Thematic focus Release date
Financial market developments and the work of the Basel Committee
• Implementing Basel II
• Strengthening supervision and risk management practices for liquidity risk
• Improving the robustness of valuation practices and market transparency for complex and less liquid products
Transparency in payments messages
• Encourage industry action to enhance information available to intermediary banks processing cover payments
• Consensus building on principles informing supervisory policies and priorities for the implementation of the transparency rules
BCBS1
Guidelines for computing capital for incremental default risk in the trading book
• Additional guidance on existing general principles
• Guidance on supervisory evaluation of internal models
October 2007
FSF meeting in New York
• Review of recent financial market turbulence
• Review of progress of work in the areas of market and institutional resilience and highly leveraged institutions
Offshore financial centres
• Progress in OFC compliance
• Support of ongoing efforts
• Continued FSF engagement
September 2007
Market and institutional resilience
• Establishment of working group and identification of workplan
• Focus areas to include risk management; valuation, accounting and risk disclosure; credit ratings; supervisory principles
October 2007
FSF
Highly leveraged institutions • Progress report on implementing
recommendations of Highly Leveraged Institutions Update Report
1 On 24 September 2007, the Joint Forum’s parent organisations, the Basel Committee on Banking Supervision (BCBS), the International Organization of Securities Commissions (IOSCO) and the International Association of Insurance Supervisors (IAIS), announced the appointment of Mr John C Dugan, Comptroller of the Currency in the United States, as Chairman of the Joint Forum.
Source: Relevant bodies’ websites (www.bis.org, www.fsforum.org). Table 1
The Basel/IOSCO Agreement reached in July 2005 (The Application of
Basel II to Trading Activities and the Treatment of Double Default Effects) contained several improvements to the capital regime for trading book positions. Among the revisions to the Market Risk Amendment was a new requirement for banks that model specific risk to measure and hold capital against default risk that is incremental to any such risk captured in the bank’s value-at-risk (VaR) model. The incremental default risk charge (IDRC) was

100 BIS Quarterly Review, December 2007
incorporated into the trading book capital regime in response to the increasing amount of exposure in banks’ trading books to credit risk embedded in often illiquid products whose risk is not reflected in the VaR. The requirement for the IDRC was set forth in the form of very high-level standards in paragraphs 718(xcii) and 718(xciii) of the Basel II Framework.2
The Committee expects banks to develop their own internal models for calculating a capital charge for incremental default risk in the trading book. This paper provides additional guidance on how the general principles in paragraphs 718(xcii) and 718(xciii) may be met and contains both guidance on how supervisors will evaluate internal models and fallback options deemed acceptable by the Committee.
Banks are expected to fulfil the principles for the IDRC laid out in this document to receive specific risk model recognition. However, banks that have already received the specific risk model recognition under the 1996 Market Risk Amendment do not have to implement the IDRC until 1 January 2010.
Financial Stability Forum
On 25–26 September, the FSF held a meeting in New York. Members reviewed recent strains in global financial markets and announced the formation of a working group on market and institutional resilience. They also reviewed the Forum’s offshore financial centres (OFC) initiative and heard reports on progress in work to address the recommendations of its May 2007 Highly Leveraged Institutions (HLI) Update Report. The preliminary report of the working group on market and institutional resilience and the HLI progress report were published in October.
In the September meeting, FSF members discussed the implications for financial stability of the recent turbulence in global financial markets and what might need to be done to strengthen financial system stability and resilience. Members noted signs of stabilisation in money and to some extent credit markets, although liquidity remains low in several market segments. They agreed that the process of adjustment may take some time, depending among other things on the restoration of confidence in valuations of credit instruments and in assessments of counterparty creditworthiness. In this context, the FSF would welcome the adoption of common guidelines for valuation, particularly for complex illiquid products. It also welcomed the progress being made with regard to the implementation of Basel II.
Members agreed that the global macroeconomic backdrop generally remains strong, underlying credit problems have been limited to a small
2 The Basel Committee set up the Accord Implementation Group on the Trading Book (AIGTB)
primarily to conduct the work on further clarification, as well as to provide a forum for supervisors to share their experience in overseeing banks’ implementation of the trading book capital regime. As there is no clear industry standard for measuring incremental default risk for the trading book, the AIGTB has worked closely with industry groups in developing principles for implementing the new charge that build off the principles in banks’ internal approaches. To evaluate the quantitative impact of the guidelines on banks’ portfolios, the Basel Committee is currently conducting a data collection exercise.
At its September meeting, FSF discusses financial stability implications of recent market turbulence …
… BCBS provides additional guidance for computing capital for incremental default risk

BIS Quarterly Review, December 2007 101
proportion of credit instruments, and the capital of regulated institutions has remained at sound levels.
FSF members noted that the turmoil in global financial markets in recent months has raised important concerns that require careful consideration by financial policymakers. Some weaknesses will be addressed through adjustments in the private sector. In other areas authorities will need to prompt or take action. To help formulate an appropriate and coordinated international response, and following a request by the G7 Finance Ministry Deputies, the FSF announced the formation of a Working Group composed of national authorities and chairs of the relevant international bodies. The Working Group, chaired by FSF Chairman Mario Draghi, set out to analyse the underlying causes of the recent market turbulence and to make proposals to enhance market and institutional resilience.
The Working Group issued a preliminary report on 15 October, setting out the Group’s workplan and identifying some of the areas that the Group will focus on. Drawing on planned and ongoing work of the relevant international supervisory, regulatory and central bank committees, the Group will develop a diagnosis of the causes of recent events, identify the weaknesses that merit attention from policymakers and recommend actions needed to enhance market discipline and resilience. With respect to risk management practices, the report noted that turmoil has brought to light interactions between credit, market liquidity and funding liquidity risks that many regulated financial institutions did not anticipate. On valuation, risk disclosure and accounting, the recent turmoil has exposed shortcomings in the transparency and valuation of complex products. It has also posed questions about principles and practices for the consolidation of related off-balance sheet entities. Regarding the role of credit rating agencies, issues have been raised about potential conflicts of interest in their activities, their role in the development of structured finance products and investors’ uses of ratings of these products. The Group will also consider what lessons to draw for the regulation and supervision of liquidity management and off-balance sheet risk exposures, and will identify any other areas in which supervisory oversight might need to be adapted to strengthen the financial system. Regarding the authorities’ capacity to respond to episodes of market turbulence (in terms of the instruments available to central banks and supervisors in times of distress and coordination between them at the national and international level), the Working Group will take stock of the current initiatives and identify the key issues meriting attention.
At the September meeting, the FSF also considered its OFC initiative, based on a recent review conducted by its OFC Review Group that drew on input and contributions from member bodies.3 First, members noted that, owing not least to the FSF initiative and efforts of its members, significant progress has been observed by the IMF in its assessments of OFCs’ 3 At its meeting in Tokyo in March 2005, the FSF announced a new process to promote further
improvements in OFCs. This reflected the need to address remaining problems in several OFCs, notably in the areas of effective cross-border cooperation and information exchange and adequacy of supervisory resources. At the time, the FSF agreed to review the adequacy of its initiative in addressing the current concerns held by its members in two years’ time.
FSF considers OFC initiative …
... valuation, risk disclosure and accounting …
… the role of credit rating agencies …
… and supervisory principles
Workplan to focus on …
… and announces working group on market and institutional resilience
… risk management practices …

102 BIS Quarterly Review, December 2007
compliance with international standards and by IOSCO in its engagement with selected jurisdictions on cooperation and information exchange practices. However, a few concerns remain. Second, the FSF considered that it should continue to support the ongoing efforts of FSF members, which are appropriate to the concerns that are felt to exist. Third, the FSF’s interest in fostering compliance with international standards in onshore and offshore jurisdictions, including better cooperation and information exchange, remains undiminished. Therefore the Review Group should remain ready to consider material problems, or potential problems, that members say they cannot resolve bilaterally and to recommend to the FSF ways in which it can support its members’ efforts. The range of potential follow-up actions identified in 2005 remains available to be used. Looking ahead, the FSF’s interest in the OFC initiative should be increasingly risk-focused,
While the hedge fund sector has not been the primary source of the recent market turmoil, the severity of market problems has highlighted the importance of ensuring sound counterparty risk management at regulated institutions and fostering the exchange of relevant information between hedge funds and their counterparties. The FSF’s May 2007 Highly Leveraged Institutions Update Report examined important issues in these areas and made a series of recommendations.
At the September meeting, the FSF received a progress report (published on 15 October) on work to address these recommendations. A first set of recommendations in the Update Report pertained to strengthening core firms’ risk management practices. Over the summer, supervisors made good progress in their collaborative review of the management of counterparty exposures at the core global financial intermediaries, including as they relate to hedge funds. The review of the current state of practice was completed before the summer. The second phase is delving more deeply into a narrower set of issues to identify the scope for enhancements and to formulate recommendations. Another recommendation of the Update Report related to improving data on core intermediaries. Supervisors in the largest financial centres are discussing at working level what survey data, both quantitative and qualitative, on counterparty exposures it would be feasible and useful to collect from intermediaries on a consistent basis across jurisdictions. Finally, the Update Report recommended action by investors and hedge funds to strengthen transparency, market discipline and sound practice standards. A number of private sector initiatives are now under way in this domain.4
4 A working group of 14 leading hedge fund managers based mainly in the United Kingdom was
formed in June to review best industry practice. On 10 October, the Hedge Fund Working Group issued a consultation document proposing 15 best practice standards covering fund governance, valuation, risk management, disclosure to investors and counterparties, and “activism”.
… and hears progress report on work to address recommendation of HLI Update Report