The Role of Electron Transfer and Dithiol-Disulfide Interchange in Solute Transport in Bacteria
Upload
independentCategory
view
0download
0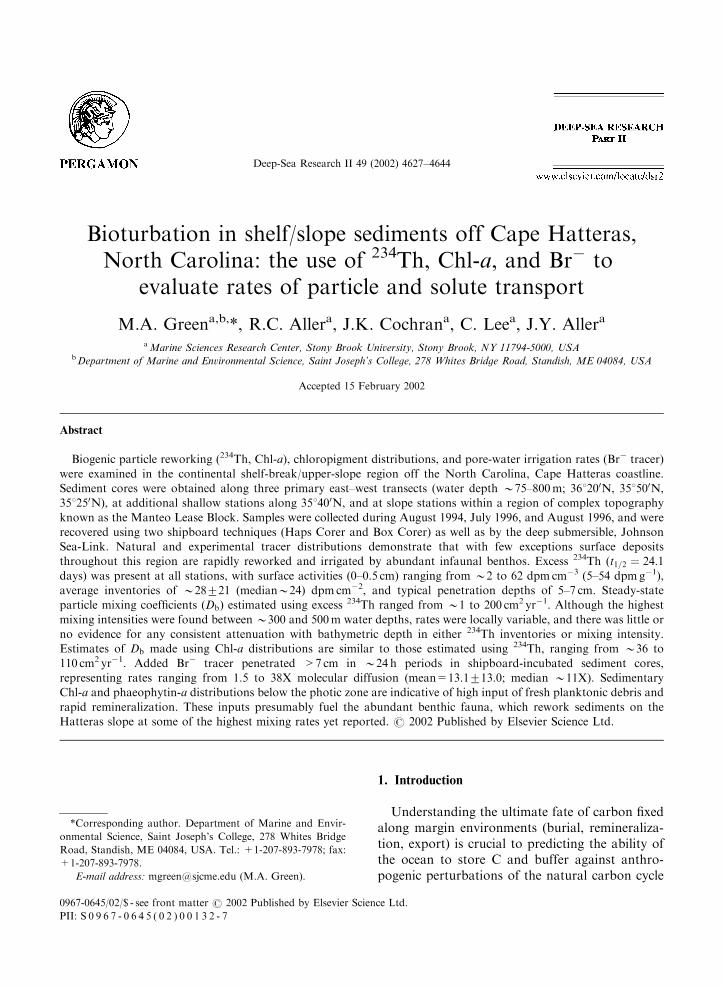
Deep-Sea Research II 49 (2002) 4627–4644
Bioturbation in shelf/slope sediments off Cape Hatteras,North Carolina: the use of 234Th, Chl-a, and Br� to
evaluate rates of particle and solute transport
M.A. Greena,b,*, R.C. Allera, J.K. Cochrana, C. Leea, J.Y. Allera
aMarine Sciences Research Center, Stony Brook University, Stony Brook, NY 11794-5000, USAbDepartment of Marine and Environmental Science, Saint Joseph’s College, 278 Whites Bridge Road, Standish, ME 04084, USA
Accepted 15 February 2002
Abstract
Biogenic particle reworking (234Th, Chl-a), chloropigment distributions, and pore-water irrigation rates (Br� tracer)
were examined in the continental shelf-break/upper-slope region off the North Carolina, Cape Hatteras coastline.
Sediment cores were obtained along three primary east–west transects (water depth B75–800m; 361200N, 351500N,
351250N), at additional shallow stations along 351400N, and at slope stations within a region of complex topography
known as the Manteo Lease Block. Samples were collected during August 1994, July 1996, and August 1996, and were
recovered using two shipboard techniques (Haps Corer and Box Corer) as well as by the deep submersible, Johnson
Sea-Link. Natural and experimental tracer distributions demonstrate that with few exceptions surface deposits
throughout this region are rapidly reworked and irrigated by abundant infaunal benthos. Excess 234Th (t1=2 ¼ 24:1days) was present at all stations, with surface activities (0–0.5 cm) ranging from B2 to 62 dpm cm�3 (5–54 dpmg�1),
average inventories of B28721 (medianB24) dpm cm�2, and typical penetration depths of 5–7 cm. Steady-state
particle mixing coefficients ðDbÞ estimated using excess 234Th ranged from B1 to 200 cm2 yr�1. Although the highest
mixing intensities were found between B300 and 500m water depths, rates were locally variable, and there was little or
no evidence for any consistent attenuation with bathymetric depth in either 234Th inventories or mixing intensity.
Estimates of Db made using Chl-a distributions are similar to those estimated using 234Th, ranging from B36 to
110 cm2 yr�1. Added Br� tracer penetrated >7 cm in B24 h periods in shipboard-incubated sediment cores,
representing rates ranging from 1.5 to 38X molecular diffusion (mean=13.1713.0; median B11X). Sedimentary
Chl-a and phaeophytin-a distributions below the photic zone are indicative of high input of fresh planktonic debris and
rapid remineralization. These inputs presumably fuel the abundant benthic fauna, which rework sediments on the
Hatteras slope at some of the highest mixing rates yet reported. r 2002 Published by Elsevier Science Ltd.
1. Introduction
Understanding the ultimate fate of carbon fixedalong margin environments (burial, remineraliza-tion, export) is crucial to predicting the ability ofthe ocean to store C and buffer against anthro-pogenic perturbations of the natural carbon cycle
*Corresponding author. Department of Marine and Envir-
onmental Science, Saint Joseph’s College, 278 Whites Bridge
Road, Standish, ME 04084, USA. Tel.: +1-207-893-7978; fax:
+1-207-893-7978.
E-mail address: [email protected] (M.A. Green).
0967-0645/02/$ - see front matter r 2002 Published by Elsevier Science Ltd.
PII: S 0 9 6 7 - 0 6 4 5 ( 0 2 ) 0 0 1 3 2 - 7

on the Earth’s surface. One margin environmentshown to be a major focusing area for shelf-derived organic carbon is the slope off CapeHatteras, where the physical convergence ofthe southward-flowing Virginia Current with thenorthward flowing Gulf Stream directs particulatematerial away from the Hatteras coast (Blake andGrassle, 1994; Walsh, 1994). Studies in the sloperegion off Cape Hatteras show this environment tohave significantly higher rates of sedimentation(Blair et al., 1996; DeMaster et al., 1994; Walsh,1994; Alperin et al., 2002), greater densities ofbenthic infauna (Blake and Grassle, 1994; Alleret al., 2002), elevated abundance of several speciesof demersal fish (Hecker, 1994), and more rapidrates of organic carbon remineralization relative toother slope regions in the western Atlantic (Archerand Devol, 1992; Blair et al., 1994; Alperin et al.,1999; Jahnke and Jahnke, 2000; Thomas et al.,2002). Evidence that the Hatteras slope representsa major depocenter for sedimenting organic mattersuggests this region, and other margin environ-ments with similar physical oceanographic re-gimes, may play a significant role in the globalcycling of carbon. A better understanding of massfluxes and biogeochemical processes influencingsedimented materials will help constrain the over-all importance of margin ‘depocenters’ in theoceanic cycling of carbon.
Biologically enhanced transport of particles andpore-water solutes at or near the sediment-waterinterface are critical controls on pathways andrates of C remineralization, and ultimately influ-ence storage of residual carbon in marine sedi-ments. In this paper we document the spatialdistribution of tracers of these processes, inparticular the natural radioisotope 234Th andchloropigments (Chl-a and phaeophytin-a (Ppt-a)), at multiple stations across the Cape Hatterasslope. Estimates of particle mixing rate ðDbÞ aremade here using both excess 234Th and Chl-a insediments. Comparison of 234Th inventories withexpected estimates based on water depth also helpsconstrain lateral transport processes in this region.Chl-a distributions offer insight into particlebioturbation along the Hatteras slope, the deliveryof organic material, and decomposition processes.Chl-a/Ppt-a ratios in surface deposits also allow
inference into the nature of the sedimentingorganic matter (e.g., reactive vs. refractory, freshvs. aged) and provide further evidence that afocused cross-slope transport of organic materialdominates particle transport on the Cape Hatterasmargin.
2. Study site and methods
2.1. Study site and sampling
Sediment cores along with overlying water wereobtained at stations along three primary east–westtransects (361200N, 351510N, 351250N) on the CapeHatteras shelf-break/slope region during summer1996 as part of the Department of Energy’s OceanMargins Program (Figs. 1a and b). For ease ofreference, stations have been designated by atransect prefix: N (northern), M (middle), and S(southern) followed by the station depth. Addi-tional core samples were collected in August 1994at both shallow and deep locations; the latter setwere within the topographically complex ManteoLease Block (MLB) (Mellor and Paull, 1994).Cores (9.5 cm ID) were collected using multiplerecovery techniques (Box Corer, Haps Corer, andthe submersible R/V Johnson Sea-Link). Thesubmersible was used primarily in the MLB toobtain samples along specific ridge, valley, andwall features. Each retrieval method yielded well-defined, undisturbed sediments, as was evidentfrom clear water above the sediment-water inter-face. Sediment ‘smearing’, which can occur duringthe insertion of a core tube into mud, wasminimized by discarding the outer rim of sedimentfrom all cores during sectioning. Cores were storedat in-situ temperature prior to shipboard proces-sing (o1 h). Exact station locations, water depth,core recovery methods, and the tracers used fordetermining transport coefficients ðDb; DsÞ areprovided in Table 1.
2.2. Analytical methods
2.2.1. Pigment analysis
One sub-core (ID=9.5 cm) from each stationwas sectioned at discrete intervals (0–0.5, 0.5–1.0,
M.A. Green et al. / Deep-Sea Research II 49 (2002) 4627–46444628

Fig. 1. (a) General locations of shelf edge–upper-slope transects and HAPS core transect (—), and from the MLB survey area (’). (b)
Detailed bathymetry and locations of topographically oriented stations within MLB survey area (Fig. 1a).
M.A. Green et al. / Deep-Sea Research II 49 (2002) 4627–4644 4629

1.0–2.0, 2.0–3.0, 3.0–4.0, 4.0–5.0, 5.0–7.0, 7.0–10.0) and analyzed for Chl-a and Ppt-a concentra-tions. Sectioned sediments were homogenized,placed into plastic vials, and immediately frozenuntil pigment extraction. Because samples werefrozen prior to analysis, the measurements pro-vided here represent the total extractable pigmentpool operationally defined as both the free andbound fractions (Sun et al., 1991).
Pigments were extracted from thawed wetsediments (B1 g) using 100% acetone as describedby Sun et al. (1991). Five ml of 100% acetone wereadded to each sample, mixed using a vortex stirrer,and sonicated for 10min. The acetone extract wasseparated by centrifugation for 5min at 3000 rpm(equivalent to 1210 g) and collected in a 30ml glasssyringe. An additional 5ml of 100% acetone were
added to the remaining sediment pellet and theextraction procedure repeated. The acetone ex-tracts were combined and filtered through a 0.2 mmZetapors membrane filter into a glass scintillationvial. Samples were stored in a freezer in the darkprior to pigment analysis within 24 h of extraction.
Chl-a and Ppt-a were determined in 50 mlacetone extract aliquots by ion-pairing reverse-phase high performance liquid chromatography(HPLC) after Mantoura and Llewellyn (1983), asmodified by Sun et al. (1991). The HPLC systemand exact method (e.g., eluant concentration,ramp and hold times, wavelengths, instrumenta-tion) are described in detail in Sun et al. (1991).Chl-a and Ppt-a were identified by co-elution withstandards (Sigma Chemical Co.) and quantifiedspectrophotometrically on a Hewlett Packard 8452
Table 1
List of sampling sites on Cape Hatteras shelf/slope, water depth, station location, coring retrieval method, and indicator used for
transport coefficient measurements ðDb;DsÞ
Station Water depth Latitude/longitude Coring device Tracers of transport
Summer 1994
MLB-583P 583m 351 28.9950/741 47.1700 Johnson Sea-Link 234Th
MLB-651V 651m 351 29.9030/741 48.2710 Johnson Sea-Link 234Th
MLB-679R 679m 351 29.0260/741 47.6130 Johnson Sea-Link 234Th
MLB-760R 760m 351 30.4280/741 46.4090 Johnson Sea-Link 234Th
MLB-897V 897m 351 29.0260/741 47.6130 Johnson Sea-Link 234Th
H-55 55m 351 39.9660/741 56.0290 Haps Core 234Th, Chl-a
H-86 86m 351 39.9380/741 50.5120 Haps Core 234Th, Chl-a
H-170 170m 351 39.9950/741 48.5040 Haps Core 234Th, Chl-a
Summer 1996
N194 194m 361 20.0070/741 46.7990 Haps Core 234Th, Chl-a, Br�
N274 274m 361 20.2300/741 46.1440 Box Core 234Th, Chl-a, Br�
N455 455m 351 20.1690/741 44.9900 Box Core 234Th, Chl-a, Br�
M177 177m 351 50.740/741 51.240 Haps Core 234Th, Chl-a, Br�
M301 301m 351 50.7410/741 50.5090 Box Core 234Th, Chl-a
M414 414m 351 51.1110/741 50.3450 Box Core 234Th, Chl-a
S108 108m 351 24.8040/751 53.0310 Haps Core 234Th, Chl-a, Br�
S300 300m 351 24.9950/741 50.2110 Box Core 234Th, Chl-a, Br�
S505 505m 351 25.0300/741 49.7510 Box Core 234Th, Chl-a
S753 753m 351 25.0360/741 48.4070 Johnson Sea-Link 234Th, Chl-a
MLB stations from August 1994 refers to the MLB (Fig. 1) and specific topographic features of V=valley, R=ridge, and P=plateau
in the topographically extreme MLB. During July and August 1996 N=northern-most transect (B361200), M=middle transect
(B351510), and S=southern transect (B351250). The Haps Cores retrieved during the 1994 cruise represent stations from along a
351400 transect.
M.A. Green et al. / Deep-Sea Research II 49 (2002) 4627–46444630

A Diode Array Spectrophotometer using anextinction coefficient of 68,700 at 440 nm. Con-centrations (nmol/g wet sediment) are based onpeak areas integrated using a Shimadzu C-R3AChromatopac.
2.2.2. 234Thorium
Cores taken using cellulose acetate butyrate(CAB) core liners (ID=9.5 cm) were sectioned at0.5 or 1 cm intervals. Wet sediment was dried atB901C to obtain water content and then homo-genized by grinding. Dried samples (B100 g) weresealed into aluminum cans for gamma counting.The 63 keV gamma emission of 234Th, measuredusing 1000 or 2000mm2 planar intrinsic germa-nium detectors, was used to determine 234Thactivities within several days or up to a few weeksafter core recovery. The relatively low energies ofthe gammas emitted by 234Th require correctionfor self-absorption by the samples. The detectorwas standardized by preparing silica gel standardscontaining 234Th in equilibrium with 238U andadjusting them to different densities by addingvarying quantities of Pb(NO3)2 solution. Self-absorption was quantified by measuring thetransmission of a 234Th reference source througheach standard. Transmission values (relative toan empty sample container) for the standards wereplotted relative to the cpm 234Th/dpm 234Th in thestandard to obtain the relationship betweensample density and counting efficiency. Transmis-sion of the reference source was measured througheach sample, and values were compared with therelationship of density vs. counting efficiency todetermine the appropriate counting efficiency foreach sample. Supported 234Th activities weredetermined by re-counting each sample after about5 half-lives of 234Th. Excess 234Th was calculatedfrom the difference between the measured 238Uactivity (after complete decay of excess 234Th) andtotal 234Th activity in sediments. Excess 234Thactivities were corrected to the time of samplecollection. Counting uncertainties were estimatedbased on 1s counting statistics.
2.2.3. Br� tracer experiments
Time-series changes in concentrations of Br�
added to intact sediment cores were used to
evaluate mass flux of Br� ðJBrÞ into sedimentsand solute transport rate at several stations(Martin and Banta, 1992; Green and Aller,2001). Previous work shows that Br� is effectivelyconservative in surface pore-water of marinedeposits (Mackin et al., 1988).
One CAB sub-core (ID=9.5 cm) containingoverlying water was fitted with o-ring sealed caps,aerated and gently stirred with small stirringmotors at in-situ temperature. Overlying waterwas spiked with B0.5 g KBr (first dissolved inB5ml of bottom water removed directly from thecore) and aliquots analyzed for Br� over time for24 h. Br� concentrations as a function of time inoverlying water and sediment pore water werecompared to theoretical estimates of Br� redis-tribution from a finite volume of water overlyingsediment, as predicted from a one-dimensional,diffusive transport model assuming no reaction(explicit finite difference scheme checked withexact analytical solution). Br� loss from overlyingwater and penetration rates into sediment werequantified using a constant transport coefficient.
Molecular diffusion transport coefficients ðDsÞwere calculated for Br� after Berner (1980)according to the equation:
DBrs ¼ f2DBr
0 ; ð1Þ
where f is the porosity at z ¼ 0 cm, and DBr0 is the
free solution diffusion coefficient for Br� correctedfor in-situ temperature and viscosity using theStokes Einstein relation (Li and Gregory, 1974).Transport coefficients greater than those based onsimple molecular diffusion (Eq. (1)) were assumedto result from increases in solute transport at thesediment-water interface by activities of benthicorganisms. In this case, a quasi-diffusive orapparent-diffusive term ðDappÞ sufficient to ac-count for measured Br� transport was used todescribe solute mobility across the sea waterinterface. Use of a Dapp coefficient should providea reasonable estimate of transport mode, ascompeting infaunal, epifaunal, and moleculartransport processes can mimic random eddydiffusivity due to the variety of transport processeswithin a given area. Other investigators, in bothfresh and marine systems, have found thatlumping the effects of biogenic reworking into an
M.A. Green et al. / Deep-Sea Research II 49 (2002) 4627–4644 4631

apparent diffusion coefficient can adequatelyconstrain transport in some cases (Vanderborghtet al., 1977; Goldhaber et al., 1977; Fisher,1982; Green and Aller, 1998, 2001). This modeltends to be a good approximation when biologicalreworking is limited to the near-surface sedimentsof the deposit, the length scale of transport isrelatively small, and the transport time is short(e.g., days).
3. Results and discussion
234Th activities are in excess of sedimentary 238Uat all stations due to addition of 234Th from thewater column (Fig. 2). Because of large differencesin sediment porosity from station to station andwith depth in individual cores, we chose to plot234Th profiles as dpm cm�3 sed (volumetric nor-malization). In the deep sea, diffusion of dissolved
0 10 200 5 100
2
4
6
8
10
0 10 20 30
N194 N274 N455
0 5 100
2
4
6
8
10
0 20 40 0 20 40
M177 M301 M414
0 20 3010 400 10 200 5 100 10 20 300
2
4
6
8
10S108 S300 S505 S753
234Thxs (dpm cm-3 sed-1)
Dep
th (
cm)
0 10 20
MLB-897
0 5 100
2
4
6
0 10 20 300 20 40 60
MLB-679MLB-583 MLB-651
0 10 20 30
0 10 20 300
2
4
6
0 20 40
MLB-760
H-55 H-86
0 10 20 30
H-170
Fig. 2. 234Thxs activity profiles from Hatteras shelf/slope stations. The solid curves correspond to model generated concentrations
derived from Eqs. (2) and (3).
M.A. Green et al. / Deep-Sea Research II 49 (2002) 4627–46444632

234Th from the overlying water is a possible sourceof 234Th to sediments (Aller and DeMaster, 1984).However, high particle fluxes in the Hatterasregion (e.g., Blair et al., 1996; Alperin et al.,2002) make dissolved 234Th an unlikely contribu-tor to seafloor patterns, and most excess 234Th isderived from scavenging by particles in the watercolumn. In general, at each station a surface zoneof exponentially decreasing excess activity overliesa deeper region with either uniformly low activityor isolated activity peaks. The surface region isinterpreted here as either uniformly mixed orperhaps rapidly deposited, and the underlyingzone as subject to isolated non-local transportevents on the time scale of 234Th decay (e.g., Allerand Cochran, 1976; Pope et al., 1996). X-radio-graphs of sedimentary structures taken bothduring this study (not shown) and previously inthe sampled region (Diaz et al., 1994) demonstratea complete dominance of biogenic relative tophysically formed structures, implying that thepreponderance of 234Th excess penetration was
due to biological reworking. Non-local mixing isevident at least at MLB-583, MLB-679, S-108, andS-505. The near-vertical profile, with no apparentexcess activity attenuation at station M177,suggests either extreme non-local mixing or arecent depositional event, or perhaps an artifact ofsampling (although all recovered cores used fordata collection appeared undisturbed). The factthat Chl-a distributions in cores retrieved at thissame station (see next paragraph) attenuate withdepth suggests that the 234Th profile at stationM177 likely results from a large mixing event, andnot from recent deposition. Excess 234Th fromeach station is given as both a volumetricmeasurement (dpm cm�3 sed) and mass measure-ment (dpmg�1 sed) in Table 2.
Although the absolute concentrations of excessChl-a varied from station to station, sedimentaryprofiles of Chl-a are similar to those of 234Th inthat values decrease exponentially with depthbelow the surface (Fig. 3). Stations along thesouthern transect (S108, S300, S505, and S753)
Table 2
Mass (dpmg�1) and volume (dpmcm�3 sed�1) based estimates of particle reworking (cm2 yr�1) using 234Th. AT refers to the excess234Th activity at the sediment-water interface
Station AT (dpmcc�1 sed�1) 234Th Db (volume estimate) AT (dpmg�1 sed�1) 234Th Db (mass estimate)
MLB-583P 8.5 16 11.9 33
MLB-651V 62 5 54.0 6
MLB-679R 15.8 46 34.0 5
MLB-760R 30 0.3 37 0.3
MLB-897V 18.5 9 20.3 8
H-55 28.2 30 24.8 20
H-86 38.5 8 22.6 9
H-170 32.1 3 18.7 9
N194 9.0 9 7.9 48
N274 5.0 200 13.5 118
N455 22.2 4 29.9 8
M177 2.3 1310 5.0 26,500
M301 16.1 35 47 7
M414 7.5 126 25.0 52
S108 11.8 184 14.4 626
S300 11 1 14.9 1.0
S505 11.2 29 20.1 36
S753 27.1 52 49.0 39
M.A. Green et al. / Deep-Sea Research II 49 (2002) 4627–4644 4633

and the shallow ‘Haps’ stations located alongthe 351400 transect showed the highest Chl-aconcentrations. The relatively short degradationhalf-life of Chl-a in marine sediments (B21days; Sun et al., 1991) means that high sur-face values reported here result from recentadditions of Chl-a to sediments with the subse-quent modification of sedimentary profiles bythe coupled interaction of bioturbation anddegradation. The average concentration of Chl-ataken from all stations from 0 to 5 cm isB19732mg Chl-am�2. Cahoon et al. (1994)report viable diatoms and average Chl-a concen-trations of B20mgm2 at depths ranging from 530to 2000m throughout the Cape Hatteras regionsuggesting high deposition rates for micro-algaedetritus.
3.1. Particle reworking
234Th—because of its high particle affinity, rapidextraction from the water column, and short half-life (24.1 d), 234Th is an useful indicator of particlesupply to the seafloor and particle reworking bybenthic fauna. Numerous studies have used 234Thto evaluate particle transport in marine sedimentsfrom both deep- and shallow-water environments(e.g., Aller and DeMaster, 1984; Gerino et al.,1998; Henderson et al., 1999; Smith et al., 2000).Assuming that retrieved cores accurately representin-situ 234Th distributions, it is possible to estimatethe particle mixing coefficient ðDbÞ required toproduce vertical penetrations of 234Th (Fig. 2).Given the sediment accumulation rates reportedfor the sampled region (ranging from 0.035 to0.15 cm yr�1; DeMaster et al., 1994; Blair et al.,1994; Alperin et al., 2002; Thomas et al., 2002),physical advection from sedimentation canbe discounted as a significant control on 234Thdistributions over the intervals of interest(5–10 cm). Ignoring advection and assuming stea-dy-state conditions, the general equation describ-ing particle-reactive radioisotope distributions inmarine sediments is
qA
qt¼ 0 ¼ Db
q2Aqz2
� lA; ð2Þ
where Db is the mixing coefficient, A the activity of234Thxs (dpmg�1or dpm cm�3), and l the radio-active decay coefficient for 234Th. We assume Db isconstant over the sampled interval (B5–10 cm).The solution to (2) with boundary conditions z ¼0;A ¼ AT and z-N; A-0 is
A ¼ AT expð�ðffiffiffil
p=DbÞ � zÞ: ð3Þ
Using Eq. (3), Db was calculated by curve-fittingto the observed 234Th distributions (Fig. 2, solidline). Mass and volume estimates of biodiffusiveparticle mixing ðDbÞ are both presented in Table 2,and range from a low of B5 cm2 yr�1 to highs ofB30–50 cm2 yr�1. Extremely high reworking rateswere calculated for station M177 (B1300 andB26,500 cm2 yr�1) and result from the nearvertical 234Th profiles found there. There is noregular pattern of higher or lower Db relative toeither a mass or volume-based estimate. Average
0 0.5 10 0.1 0.20
2
4
6
8
10
0 0.1 0.2
N194 N274 N455
0 0.2 0.40 0.1 0.20 0.1 0.20
2
4
6
8
10M177 M301 M414
0 0.5 10
2
4
6
8
10
0 5 10 0 0.5 10 5 10
S108 S505S300 S753
Excess chlorophyll-a (nmol cm-3 sed-1.)
Dep
th (
cm)
0 1 20
1
2
3
4
5H-55
0 0.5 1 0 1 2
H-86 H-170
Fig. 3. Chl-axs profiles from Hatteras shelf/slope stations. The
solid curves correspond to model generated concentrations
derived from Eqs. (4) and (5).
M.A. Green et al. / Deep-Sea Research II 49 (2002) 4627–46444634

particle mixing as a volumetric estimate isB45763 cm2 yr�1 (7SD). The mass-based aver-age isB25730 cm2 yr�1 (excluding station M177).These values and the calculation of Peclet numbersassuming the range of sediment accumulationrates cited previously, confirm that advection dueto sedimentation can be ignored relative tobiogenic reworking.
Chlorophyll-a—measured distributions of sedi-mentary Chl-a on the Hatteras shelf/slope areshown in Fig. 3. Chl-a and its immediate degrada-tion products can be used to track the delivery ofreactive organic substrates that fuel early diage-netic reactions in the surface 0–10 cm of marinedeposits. Sun et al. (1991) reported that Chl-a hasa degradation half-life of B21 days (similar to234Th) based on incubation experiments usingestuarine Long Island Sound (LIS) sediments.Hence, the observed depth-dependent profiles ofsedimentary Chl-a represent a balance betweensupply, transport processes, and decomposition,and can also be used to estimate rates of particlereworking, provided the decomposition rate isknown (Sun et al., 1991).
If we assume Chl-a can be treated as a particle-associated sedimentary component with a first-order degradation rate similar to that described inSun et al. (1991, 1993), the vertical distribution ofChl-a can be described at steady-state by theequation:
qC
qt¼ Db
q2C
qz2� kdC; ð4Þ
where C is the Chl-a concentration (nmol cm�3
sed�1), z the depth in sediment, Db the particlemixing coefficient assumed constant over theinterval considered here (B10 cm) and kd
the degradation rate constant for Chl-a. Sedimen-tation is ignored for reasons stated previously.
Setting boundary conditions as z ¼ 0;C ¼ C0
and z-N; C-CN the solution to Eq. (4) is
C ¼ ðC0 � CNÞexpð�zffiffiffiffiffikd
p=DbÞ þ CN: ð5Þ
In this case, the value CN corresponds tobackground Chl-a that is unreactive over the timescales of interest. Plots of lnðC � CNÞ vs. z yield aslope controlled by the competing processes ofdecomposition and mixing (described by the ratio
of Okd=Db). Therefore, knowledge of either thedegradation rate constant ðkdÞ or the particle-mixing coefficient ðDbÞ allows the other parameterto be estimated. Although the exact controls onChl-a degradation in sediments off the CapeHatteras coast were not studied here, estimatesof degradation rate can be made using results fromthe oxic and anoxic laboratory incubation studiesof Sun et al. (1993). These estimates are approx-imations and do not account for the effects ofmacrofauna on degradation (Ingalls et al., 2000);however, oxic rates appear to mimic overalldegradation in bioturbated sediments. Sun et al.(1993) show that Chl-a degradation rates can beestimated based on temperature according to
ln kd ¼ 18:3� 6160 T�1; ð6Þ
where T is degrees Kelvin. Values of kd at each sitewere estimated using Eq. (6) (Table 3) and in-situtemperature. These kd values were then used tocalculate Db from Eq. (5) and best-fit curves to theobserved Chl-a profiles (Fig. 3, solid line). Bothmass and volume normalized estimates of Db–Chl-a are given in Table 3 and range from B30 to700 cm2 yr�1. With few exceptions, there is littlevariability between mass and volume-based esti-mates, with average mass and volume estimatesfrom all stations (excluding the exceedingly highvalue of 700 at station H86) equal to 90752 and83740 cm2 yr�1, respectively.
We can use Eq. (5) and the mixing coefficientscalculated from 234Th (Table 2) to derive alter-native estimates of kd rather than vice versa (Sunet al., 1991). Values of kd required to fit Chl-aprofiles assuming the mixing rates calculated from234Th are given in Table 3. Comparison of thesetwo methods indicates that kd values generatedusing Db-
234Th are in general 2–10X lower thanlaboratory-based estimates obtained from Eq. (6).Cahoon et al. (1994) reported viable diatoms andassociated Chl-a at stations in the Hatteras regionover depths similar to those reported here. Slowerthan expected Chl-a degradation rates are con-sistent with the presence of living (culturable) cellscontaining Chl-a that is not subject to immediatedecomposition (Cahoon et al., 1994). On theother hand, grazing activity in situ by benthosshould enhance degradation of Chl-a relative to
M.A. Green et al. / Deep-Sea Research II 49 (2002) 4627–4644 4635

laboratory incubations (Ingalls et al., 2000). Directmeasurements of Chl-a degradation in situ arerequired to resolve these various possibilities.
Despite the many separate assumptions, themagnitudes of mixing coefficients calculated usingboth Chl-a and 234Th are in rough agreement withone another (Tables 2 and 3). As noted above,however, mixing coefficients are generally system-atically higher for Chl-a compared to 234Th. Fig. 4compares mixing estimates from the two indepen-dent methods based on either mass or volumemeasurements (excluding data from station M177:234Th-Db=1307, and from station H-86: Chl-a-Db=730) and yields an average Db-Chl-a/
Db-234Th equivalent to 8.7716.7 (Fig. 4, solid line
shows 1:1 comparison). Assuming that Chl-adegradation rates are accurate, the higher mixingintensities calculated from Chl-a relative to 234Thcould result in part from differences in particletypes. For example, Chl-a in these sediments maybe associated with the more labile organic carbonfraction, whereas 234Th may associate predomi-
nantly with particles of a more refractory nature.The abundant assemblage of benthic organisms(e.g., Schaff et al., 1992; Blake and Hilbig, 1994;
0 50 100 150 2000
50
100
150
200
Db234Th (cm2 yr-1)
Db
Chl
-a (
cm2
yr-1
)
Fig. 4. Comparison between particle reworking coefficients
derived from Chl-a distributions and those derived from234Th distributions at all stations where both data sets were
available. The solid line represents a 1:1 fit and the dashed line
represents the geometric mean (slope=0.77).
Table 3
Volume (nmol cm�3 sed�1) and mass (nmol g�1 dry sed�1) based estimates of particle reworking (cm2 yr�1) using excess Chl-a
Station Water temperature (1C) kd (Temperature) kd (234Th) Chl-a Db (volume estimate) Chl-a Db (mass estimate)
MLB-583P 4.0 0.021 — —
MLB-651V 4.0 0.021 — —
MLB-679R 4.0 0.021 — —
MLB-760R 4.0 0.021 — —
MLB-897V 4.0 0.021 — —
H-55 18 0.06 0.01 51 55
H-86 18 0.06 0.01 730 730
H-170 15 0.048 0.005 33 55
N194 14.4 0.046 0.005 44 44
N274 8.7 0.030 0.12 55 51
N455 6.2 0.024 0.001 73 91
M177 13.9 0.044 0.08 110 91
M301 9.2 0.031 0.01 91 201
M414 8.5 0.029 0.01 146 73
S108 17.2 0.056 0.01 164 164
S300 11.1 0.036 0.001 73 73
S505 4.0 0.021 0.02 66 37
S753 4.0 0.021 0.005 91 146
No Chl-a data are available for the MLB stations. Estimates of kd are based on bottom-water temperature and Eq. (7).
M.A. Green et al. / Deep-Sea Research II 49 (2002) 4627–46444636

Aller et al., 2002) may be selecting for higher-quality food particles associated with Chl-a,producing tracer-dependent mixing intensities.The ability of deposit feeders to select particlesof high food quality has been well documented(Smith et al., 1993; Miller et al., 2000). Evidencefor particle ‘age’ dependent mixing has been foundat deep-sea sites such as the Santa Catalina Basinwithin the California borderlands (Fornes et al.,2001). In contrast, Gerino et al. (1998) found nostatistically significant evidence for differentialmixing of 234Th, Chl-a or luminophores inorganic-rich estuarine sediments of LIS (Connecti-cut—New York) suggesting that differential mix-ing based on particle reactivity may be mostpronounced when food sources are highly limitedsuch as in the deep sea.
Average particle mixing coefficients show noregular attenuation over the water depths con-sidered in this study (Fig. 5), and at slope depths,coefficients are among the highest values yetreported for any marine sediments (Boudreau,1996). Fornes et al. (2001) determined short-term(4–74 day) rates of particle reworking usingexperimentally introduced radioactive and glassbead tracers in the Santa Catalina Basin (1215m),which are comparable in magnitude to thosereported here. Their measurements of mixingbased on natural 234Th profiles at the same sites
were much lower, however, averagingB1177 cm2 yr�1. As a comparative shallow-waterexample, mixing coefficients derived from 234Thand Chl-a at 19 subtidal estuarine stationsthroughout LIS have annual ranges from 25–52to 15–145 cm2 yr�1, respectively (Sun et al., 1994).Seasonal and interannual variability in suchmeasures can be large. Gerino et al. (1998),also using 234Th and Chl-a, found substantiallylower mixing rates than previous studies duringwinter and early summer at a central LIS site(B0.6–29 cm2 yr�1). The general ranges of 234Thand Chl-a derived mixing rates in those latter caseswere in agreement with rates determined duringthe same period using introduced luminophoretracers.
Studies of particle mixing in slope and deep-seaenvironments generally show much slowerrates than in shallow-water environments. Forexample, Henderson et al. (1999) show a systema-tic decrease in particle mixing in sediments fromdepths between 5 and 1468m along Little Baha-mas Banks. They conclude that shifts in particlemixing as a function of depth relate to changes inlight levels (POC production) and the ability ofPOC to reach deeper regions of the sea floor.Middelburg et al. (1997) calculated an overallempirical correlation between average 210Pb-de-rived mixing coefficients (Db; cm
2 yr�1) obtainedat a variety of margin locations and water depth(z; meters):
Db ¼ 30 e�:000914z: ð7Þ
Substantial variability exists at any given depthdue to local factors such as sedimentation rate.Comparison of mixing rates calculated withEq. (7) to values of Db reported here (Fig. 5)shows that mixing is on average B3–5X higher onthe Cape Hatteras margin than typically observedelsewhere. Part of this difference may come fromcomparison of 210Pb-derived rates with thosecalculated from 234Th. The latter are often, butnot always, relatively enhanced compared to210Pb-based values (e.g., Boudreau, 1996; Middel-burg et al., 1997), due to possible ‘age’ dependentor other selective mixing processes, or verticaldepth dependence of benthic community activity(Smith et al., 1993; Fornes et al., 2001).
0 200 400 600 800 10000
50
100
150
200
Depth (meters)
Db
(cm
2 yr
-1)
Fig. 5. Particle mixing coefficients derived from Chl-a distribu-
tions (n) and 234Th distributions (K) as a function of depth
across the Cape Hatteras shelf and upper slope. The solid line
represents the relationship between water depth and mixing
intensity (Eq. (7)) given in Middelburg et al. (1997).
M.A. Green et al. / Deep-Sea Research II 49 (2002) 4627–4644 4637

3.2. Irrigation rates
In addition to the high rates of particlereworking documented above, we noted significantenhancement of fluid transport above that ex-pected from molecular diffusion based on Br�
tracer additions to retrieved cores. Fluid transportcan be accelerated via both tube building andirrigation and by mobile infauna flushing sedi-ments during locomotion. Extensive exchangebetween pore- and overlying-water can havedramatic effects on diagenetic reactions, forexample by not allowing reaction products toincrease to levels that retard reaction rates and bytransporting O2 to regions of the deposit deeperthan would occur otherwise (Aller, 2001). Porewater Br� profiles in KBr-spiked cores werediffusive in nature with only station S108 (andpossibly M177) showing evidence of a sub-surface,non-local injection peak (Fig. 6). Using fits froman explicit finite difference model (diffusion, no
reaction, finite overlying water volume), we foundthat transport in these cores was B1.5–38Xgreater than simple molecular diffusion(mean=13.1713.0X above diffusion, med-ian=10.6; Table 4). Excluding the high transportvalue reported for station M177 (12 cm2 d�1) givesa mean Dapp for the remaining five stations of3.672.4 cm2 d�1, or B8X that of simple moleculardiffusion (using an average Ds ¼ 0:45 cm2 d�1).This evidence for rapid fluid transport comple-ments estimates of particle mixing. In theseexperiments we cannot rule out core retrievaleffects on the irrigation and burrowing behavior ofthe infauna, but measurements of benthic solutefluxes from such cores correspond well with thosemeasured in situ (Thomas et al., 2002; Aller et al.,in preparation), suggesting no major artifacts. Inaddition to the rapid exchange of solutes insurficial sediments illustrated here, evidence fordeeper exchange comes from pore-water profiles ofSO4
=concentrations, SO4=reduction rates, and pat-
terns of other pore-water solutes that demonstratethat deposits in the Hatteras region are oftenbiogenically irrigated over B1–2m (Alperin et al.,1999; Thomas et al., 2002).
3.3. 234Th and Chl-a inventories and reactive
particle fluxes
The flux of particulate matter to the sediment-water interface of the Cape Hatteras shelf/slope region sustains the benthic communities
0 2 4 6 80 2 4 6 80
2
4
6
8
10
0 2 4 6 8
N194 N274 N455
Br- (mM)
Dep
th (
cm)
0 2 4 6 80 2 4 6 8 100
2
4
6
8
10S108 S300
0 2 4 6 80
2
4
6
8
10M177
Fig. 6. Br� profiles from cores used for Br� incubation
experiments. Excess Br� occurs to at least 8 cm after a 14–
24 h incubation period and is indicative of the high rates of
solute transport seen in this region. The solid lines represent
model fits to the data.
Table 4
Apparent diffusion coefficients in sediments of the Cape
Hatteras shelf/slope
Station D0-Br� Porosity ðfÞ Ds Dapp Dapp=Ds
N194 0.96 0.64 0.39 4.0 10.3
N274 0.84 0.82 0.56 2.0 3.6
N455 0.79 0.81 0.52 0.8 1.5
M177 0.95 0.58 0.32 12 37.5
S108 1.04 0.6 0.37 4.0 10.8
S300 0.89 0.73 0.47 7.0 14.9
Values of D0�Br� are corrected for in situ temperature and
viscosity. All diffusion coefficients are in units of cm2 day�1.
M.A. Green et al. / Deep-Sea Research II 49 (2002) 4627–46444638
responsible for particle reworking. Aller et al.(2002) show that there is no statistical differencebetween densities of macrobenthos (>0.3mm)at depths above and below 500m at the stationsused here to calculate particle mixing. Likewise,there was little change in average total biomasswith depth from B70 to 900m. Biomass forall macrofauna recovered equalled 19717 gCm�2 at stations o500m and 19712 g Cm�2 atstations >500 and o900m. Faunal abundancesreported by Aller et al. (2002) are significantlyhigher at shelf/slope depths equivalent to thosereported in studies from the North Sea (Dauweet al., 1998), Galicia Bank (Flach et al., 2002),East China Sea (Rhoads et al., 1985), GobanSpur (Flach and Heip, 1996; Flach et al., 2002),and the Barents Sea (Kroncke et al., 2000). Theseunusually high numbers of benthos documentedin the Cape Hatteras slope-region provide amechanism for the mixing of sediments at ratesgreater than at many other locations of compar-able depth. High densities and activities of benthicorganisms also imply that an adequate supply ofquality organic material is being delivered anddeposited on the mid-slope. DeMaster et al. (2002)show that the macrobenthic biomass has bomb-D14C values, indicating that surface plankton arethe predominant source of this labile organicmatter. Of course, local exceptions to overallpatterns occur, such as at a near-vertical wall sitesampled in the MLB, where little 234Th accumu-lates, benthic activity is largely absent, andremineralization rates are also low (Aller et al.,in preparation).
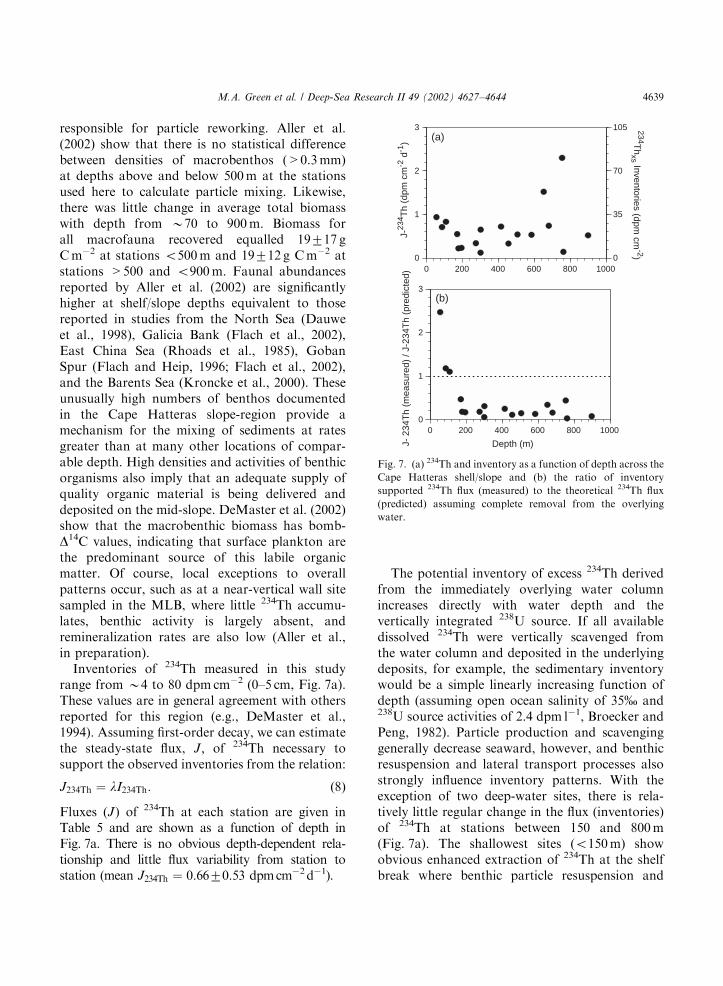
Inventories of 234Th measured in this studyrange from B4 to 80 dpm cm�2 (0–5 cm, Fig. 7a).These values are in general agreement with othersreported for this region (e.g., DeMaster et al.,1994). Assuming first-order decay, we can estimatethe steady-state flux, J; of 234Th necessary tosupport the observed inventories from the relation:
J234Th ¼ lI234Th: ð8Þ
Fluxes (J) of 234Th at each station are given inTable 5 and are shown as a function of depth inFig. 7a. There is no obvious depth-dependent rela-tionship and little flux variability from station tostation (mean J234Th ¼ 0:6670:53 dpmcm�2d�1).
The potential inventory of excess 234Th derivedfrom the immediately overlying water columnincreases directly with water depth and thevertically integrated 238U source. If all availabledissolved 234Th were vertically scavenged fromthe water column and deposited in the underlyingdeposits, for example, the sedimentary inventorywould be a simple linearly increasing function ofdepth (assuming open ocean salinity of 35% and238U source activities of 2.4 dpm l�1, Broecker andPeng, 1982). Particle production and scavenginggenerally decrease seaward, however, and benthicresuspension and lateral transport processes alsostrongly influence inventory patterns. With theexception of two deep-water sites, there is rela-tively little regular change in the flux (inventories)of 234Th at stations between 150 and 800m(Fig. 7a). The shallowest sites (o150m) showobvious enhanced extraction of 234Th at the shelfbreak where benthic particle resuspension and
0 200 400 600 800 10000
1
2
3
0
35
70
105 234Th
xs Inventories (dpm cm
-2)
J-23
4 Th
(dpm
cm
-2 d-1
)
0 200 400 600 800 10000
1
2
3
Depth (m)J- 2
34T
h (m
easu
red)
/ J-
234T
h (p
redi
cted
)
(a)
(b)
Fig. 7. (a) 234Th and inventory as a function of depth across the
Cape Hatteras shell/slope and (b) the ratio of inventory
supported 234Th flux (measured) to the theoretical 234Th flux
(predicted) assuming complete removal from the overlying
water.
M.A. Green et al. / Deep-Sea Research II 49 (2002) 4627–4644 4639

water column particle production interacts withonshore transport and shelf-edge upwelling ofwater high in dissolved 234Th (Fig. 7b). Thesepatterns suggest a relatively uniform source ofwater-column particles over the study region and/or a tendency for lateral homogenization andexchange of surficial particles within a benthicboundary layer across the region on time scales of234Th decay.
Using sedimentary Chl-a distributions, we alsocan estimate the fluxes of Chl-a from the sedimentChl-a inventory and the estimated first-orderdegradation rate coefficient at each site (replace lwith kd in Eq. (8)). These fluxes presumably reflectthe delivery of reactive planktonic material fromboth lateral and vertical sources. Fig. 8 shows theexcess Chl-a inventories (Table 5) and the fluxesof Chl-a as a function of station depth (kd as inTable 3). Although there is a tendency for anoverall decrease of inventory with station depth atmany sites, three deeper stations (300, 505, 753m)
have Chl-a contents as high or higher thanshallower water stations. Likewise, JChl-a appearto drop off with depth (Fig. 8b), but thereis considerable scatter at deeper sites and notenough data to discern an accurate pattern. Noregular functional relationship between JChl�a andJ234Th is evident (not shown). It is significant thatmeasurable amounts of Chl-a are found at allstations, regardless of depth. The fact that thehighest fluxes of Chl-a can be found at some of thedeepest sites sampled demonstrates the potential todeliver reactive material from shelf regions oroverlying surface water, and also the apparenthetereogeneity in these delivery patterns.
We can derive a relative estimate of the qualityof the organic carbon reaching each station by
55 86108
170177
194274
300301
414455
505753
0
2
4
6
8
10
12
14
Depth (m)
Chl
-a In
vent
ory
(nm
ol c
m-2
)
0 200 400 600 800 10000
1
2
3
4
Depth (m)
J-C
hl-a
(m
mol
m-2
d-1
)
(a)
(b)
Fig. 8. (a) Excess Chl-a inventories as a function of depth at
Cape Hatteras stations and (b) the flux of Chl-a to sediments
required to support the observed inventories assuming a first-
order degradation rate constant (Eq. (6)).
Table 5
Sediment inventory and steady-state flux of 234Th
(dpmcm�2 d�1) and Chl-a (mmolm�2 d�1) at Hatteras shelf/
slope stations
Station 234Th
inventory
J-234Th Chl-a
inventory
J-Chl-a
MLB-583P 18.23 0.53 — —
MLB-651V 52.4 1.52 — —
MLB-679R 25.4 0.74 — —
MLB-760R 4.7 0.14 — —
MLB-897V 18.1 0.52 — —
H-55 32.6 0.94 1.89 1.13
H-86 24.4 0.71 1.44 0.86
H-170 19.1 0.55 1.79 0.86
N194 7.9 0.23 0.11 0.05
N274 11.8 0.34 0.47 0.14
N455 11.5 0.33 0.29 0.07
M177 7.5 0.22 0.24 0.11
M301 22.5 0.65 0.31 0.10
M414 24.8 0.72 0.27 0.08
S108 28.6 0.83 1.36 0.76
S300 4 0.12 4.51 1.62
S505 18.5 0.54 13.5 2.83
S753 79.5 2.3 1.13 0.24
M.A. Green et al. / Deep-Sea Research II 49 (2002) 4627–46444640

comparing sedimentary Chl-a to Ppt-a, an initialdegradation pigment of Chl-a. Plots of the ratio ofChl-a to Ppt-a at stations along the N, M, and Stransect off Cape Hatteras are shown in Fig. 9. Asshown by the decrease in the ratio with depth insediment at individual stations, high Chl-a relativeto Ppt-a in sediments is indicative of input of freshplanktonic debris to these stations, and the ratiodecreases with Chl-a degradation at individualsites. Somewhat surprisingly, Chl-a/Ppt-a ratiosare relatively smaller at all shallow stations andincrease with bathymetric depth (with the excep-tion of S753) implying that relatively degradedplanktonic debris is reaching the sea-floor inshallow shelf-sediments and more reactive(fresher) planktonic debris is being deposited atdeeper, slope stations. Additional insight into therelative quality of C-org reaching the seafloor onthe Hatteras slope is shown in Fig. 10, whichshows surficial (0–0.5 cm) Chl-a/Ppt-a vs. waterdepth. Ignoring the low value corresponding toS753 (solid triangle), least-squares regressionanalysis yields a significant correlation ðpo0:05Þof Chl-a/Ppt-a as a function of depth ðr2 ¼ 0:54Þ:These data clearly imply input of more reactive Cto deeper stations. Such findings are consistentwith those of Cahoon et al. (1994) who show
viable diatoms and associated Chl-a at Hatterasstations ranging from B500 to 2000m, and withthe bomb-D14C values of benthos measured byDeMaster et al. (2002). Presumably, reactive C isbeing focused into deep water via the uniquephysical regime of this region, and transportedalong and across-isobath to deeper deposits,perhaps from shelf sites north of the study area.
4. Conclusions
Biogenic particle reworking rates measuredusing profiles of natural 234Th and Chl-a concen-trations, and pore-water irrigation rates measuredusing penetration of introduced Br� tracer, in-dicated high rates of both particle and fluidtransport within upper-mid slope deposits offCape Hatteras, North Carolina. Particle mixingintensities ðDbÞ average about 3–5X higher thanthose documented in other slope environments ofsimilar depth. Excess 234Th (half-life=24.1 days)is present at all stations, with surface values(0–0.5 cm) ranging from B5 to 30 dpm cm�3 andpenetration depths of at least 5–7 cm. Particlemixing coefficients ðDbÞ estimated using excess234Th range from B1 to 200 cm2 yr�1, based on
0 1 20 1 20
2
4
6
8
10
0 1 2
N194 N274 N455
0 2 40
2
4
6
8
10
0 2 40 2 4
M414M301M177
0 5 100 5 100 5 100 5 100
2
4
6
8
10S753S505S300S108
Dep
th (
cm)
Chlorophyll-a / Phaeophytin-a
Fig. 9. Ratio of Chl-a to Ppt-a in stations along the N, M, and
S transects.
0 200 400 600 800 10000
2
4
6
8
Depth (meters)
Chl
-a /
Ppt
-a (
0-0.
5 cm
)
Fig. 10. Surficial (0–0.5 cm) Chl-a/Ppt-a ratios vs. depth.
Ignoring the low value corresponding to station S753 yields a
significant correlation (solid line, po0:05) and a corresponding
r2 equivalent to 0.54.
M.A. Green et al. / Deep-Sea Research II 49 (2002) 4627–4644 4641

both volumetric and mass-based model fits tosedimentary 234Th. Estimates of Db also weremade using excess sedimentary Chl-a, and thesevalues range from B30 to 164 cm2 yr�1. Severalstations exhibited extremely high mixing ratespresumably due to a recent and large mixing eventor an artifact of sampling. In addition to particlemixing, Br� tracer experiments at selected stationsshowed Br� penetrated 75 cm in a 14–24 h periodin shipboard-incubated sediment cores, suggestingapparent diffusivities which average B13X thatpredicted from simple molecular diffusion. Thehigh rates of particle and fluid transport are fueledby input of relatively fresh planktonic debris asdemonstrated by Chl-a and Ppt-a in sedimentdeposits. Chl-a/Ppt-a ratios in near-surface sedi-ment indicate that mid-slope deposits can receivemore reactive debris than present at shallower,upslope regions, implying both along and across—isobath transport of material. When combined,these data demonstrate consistently high flux ofreactive particles from shallow to deep regions thatsustain high rates of bioturbation in sediments ofthe Cape Hatteras shelf-break to mid-slope region.
Acknowledgements
We thank Margaret Lima, Nancy Mumford,Steve Lucatuorto, Rebecca Yingst, ShannonDunn, Anitra Ingalls, and David Hirschberg fortheir help at sea and in the laboratory. We areparticularly indebted to all the other scientistspublished in 2002 for their hard work, dedication,and collaboration during the OMP project. Lastly,we thank the captains and crew of the R/V Seward
Johnson and the R/V Edwin Link. The final versionof this manuscript benefited from the thoughtfulreview of 2 anonymous referees and D.J. De-Master. Funding for this study came from DOEgrant DE-FG02-92ER61464 and NSF grant OCE-9818804.
References
Aller, R.C., 2001. Transport and reactions in the bioirrigated
zone. In: Boudreau, B., Jorgensen, B.B. (Eds.), The Benthic
Boundary Layer: Transport Processes and Biogeochemistry.
Oxford Press, Oxford, pp. 269–301.
Aller, R.C., Cochran, J.K., 1976. 234Th/238U disequilibrium
in nearshore sediment: particle reworking and diagenetic
time scales. Earth and Planetary Science Letters 29,
37–50.
Aller, R.C., DeMaster, D.J., 1984. Estimates of particle flux
and reworking at the deep-sea floor using 234Th/238U
disequilibrium. Earth and Planetary Science Letters 67,
308–318.
Aller, R.C., Green, M.A., Aller, J.Y. Carbon remineralization
in shelf/slope regions of Cape Hatteras, North Carolina. In
preparation.
Aller, J.Y., Aller, R.C., Green, M.A., 2002. Benthic faunal
assemblages and carbon supply along the continental shelf/
shelf break-slope off Cape Hatteras, North Carolina. Deep-
Sea Research II 49 (20), 4599–4626.
Alperin, M.J., Martens, C.S., Albert, D.B., Suayah, I.B.,
Benninger, L.K., Blair, N.E., Jahnke, R.A., 1999. Benthic
fluxes and porewater concentration profiles of dissolved
organic carbon in sediments from the North Carolina
continental slope. Geochimica et Cosmochimica Acta 63,
427–448.
Alperin, M.J., Suayah, I.B., Benninger, L.K., Martens, C.S.,
2002. Modern organic carbon burial fluxes, recent sedimen-
tation rates, and particle mixing rates from the upper
continental slope near Cape Hatteras, North Carolina
(USA). Deep-Sea Research II 49 (20), 4645–4665.
Berner, R.A., 1980. Early Diagenesis—A Theoretical
Approach. Princeton University Press, Princeton NJ,
241pp.
Blair, N.E., Plaia, G.R., Boehme, S.E., DeMaster, D.J., Levin,
L.A., 1994. The remineralization of organic carbon on the
North Carolina continental slope. Deep-Sea Research II 41,
755–766.
Blair, N.E., Levin, L.A., DeMaster, D.J., Plaia, G., 1996.
The short-term fate of algal carbon in continental
slope sediments. Limnology and Oceanography 41,
1208–1219.
Blake, J.A., Grassle, J.F., 1994. Benthic community structure
on the US South Atlantic slope off the Carolinas: spatial
heterogeneity in a current-dominated system. Deep-Sea
Research II 41, 835–874.
Blake, J.A., Hilbig, B., 1994. Dense infaunal assemblages on the
continental slope off Cape Hatteras, North Carolina. Deep-
Sea Research II 41, 875–899.
Boudreau, B.P., 1996, Diagenetic Models and Their Imple-
mentation. Springer, Berlin, 414pp.
Broecker, W.S., Peng, T.H., 1982. Tracers in the sea. Lamont–
Doherty Geological Observatory, Columbia University,
Palisades, NY, 690pp.
Cahoon, L.B., Laws, R.A., Thomas, C.J., 1994. Viable diatoms
and chlorophyll a in continental slope sediments off
Cape Hatteras, North Carolina. Deep-Sea Research II 41,
767–782.
Dauwe, B., Herman, P.M.J., Heip, C.H.R., 1998. Community
structure and bioturbation potential of macrofauna at four
M.A. Green et al. / Deep-Sea Research II 49 (2002) 4627–46444642

North Sea stations with contrasting food supply. Marine
Ecology Progress Series 173, 67–83.
DeMaster, D.J., Pope, R.H., Levin, L.A., Blair, N.E., 1994.
Biological mixing intensity and rates of organic carbon
accumulation in North Carolina slope sediments. Deep-Sea
Research II 41, 735–753.
DeMaster, D.J., Thomas, C.J., Blair, N.E., Fornes, W.L., Plaia,
G., Levin, L.A., 2002. Deposition of bomb 14C in
continental slope sediments of the Mid-Atlantic Bight:
assessing organic matter sources and burial rates. Deep-Sea
Research II 49 (20), 4667–4685.
Diaz, R.D., Randy Cutter, G., Rhoads, D.C., 1994. The
importance of bioturbation to continental sediment struc-
ture and benthic processes off Cape Hatteras, North
Carolina. Deep-Sea Research 41, 719–734.
Fisher, J.B., 1982. Effects of macrobenthos on the chemical
diagenesis of freshwater sediments. In: McCall and
Tevesz (Eds.), Animal–Sediment Relations. The Biogenic
Alteration of Sediments. Plenum Press, New York,
pp. 177–218.
Flach, E., Heip, C., 1996. Vertical distribution of macrozoo-
benthos with the sediment on the continental slope of the
Goban Spur area (NE Atlantic). Marine Ecology Progress
Series 141, 55–66.
Flach, E., Muthumbi, A., Heip, C., 2002. Meiofauna and
macrofauna community structure in relation to sediment
composition at the Iberian Margin compared to the Goban
Spur (NE Atlantic). Progress in Oceanography 52, 433–457.
Fornes, W.L., DeMaster, D.J., Smith, C.R., 2001. A particle
introduction experiment in Santa Catalina Basin sediments:
testing the age-dependent mixing hypothesis. Journal of
Marine Research 59 (1), 97–112.
Gerino, M., Aller, R.C., Lee, C., Cochran, J.K., Aller, J.Y.,
Green, M.A., Hirschberg, D., 1998. Comparison of different
tracers and methods used to quantify bioturbation during a
spring bloom: 234Th, luminophores, and chlorophyll-a.
Estuarine and Coastal Shelf Science 46, 531–547.
Goldhaber, M.B., Aller, R.C., Cochran, J.K., Rosenfeld, J.K.,
Martens, C.R., Berner, R.A., 1977. Sulphate reduction,
diffusion and bioturbation in Long Island Sound sediments:
report of the FOAM group. American Journal of Science
277, 193–237.
Green, M.A., Aller, R.C., 1998. Seasonal patterns of carbonate
diagenesis in nearshore terrigenous muds: relation to spring
phytoplankton bloom and temperature. Journal of Marine
Research 56, 1097–1123.
Green, M.A., Aller, R.C., 2001. Early diagenesis of calcium
carbonate in Long Island Sound sediments: benthic fluxes of
Ca2+ and minor elements during seasonal patterns of net
dissolution. Journal of Marine Research 59, 769–794.
Hecker, B., 1994. Unusual megafaunal assemblages on the
continental slope off Cape Hatteras. Deep-Sea Research II
41, 809–834.
Henderson, G.M., Lindsay, F.N., Slowey, N.C., 1999. Varia-
tion in bioturbation with water depth on marine slopes: a
study on the little Bahamas bank. Marine Geology 160,
105–118.
Ingalls, A.E., Aller, R.C., Lee, C., Sun, M.Y., 2000. The
influence of deposit-feeding on chlorophyll-a degradation in
coastal marine sediments. Journal of Marine Research 58,
631–651.
Jahnke, R.A., Jahnke, D.B., 2000. Rates of C, N, P, and Si
recycling and denitrification at the US mid-Atlantic
continental slope depocenter. Deep-Sea Research 47,
1404–1428.
Kroncke, I., Vanreusel, A., Vincx, M., Wollenburg, J.U.,
Mackensen, A., Liebezeit, G., Behrends, B., 2000. Different
benthic size-compartments and their relationship to sedi-
ment chemistry in the deep Eurasian Arctic Ocean. Marine
Ecology Progress Series 199, 31–41.
Li, Y.H., Gregory, S., 1974. Diffusion of ions in sea water and
in deep-sea sediments. Geochimica Cosmochimca Acta 38,
703–714.
Mackin, J.E., Aller, R.C., Aller, R.C., 1988. The effects of iron
reduction and non steady-state diagenesis on iodine,
ammonium, and boron distributions in sediments from the
Amazon continental shelf. Continental Shelf Research 8,
363–386.
Mantoura, R.F., Llewellyn, C.A., 1983. The rapid determina-
tion of algal chlorophyll and carotenoid pigments and their
breakdown products in natural waters by reversed-phased
high-performance liquid chromatography. Analytica Chi-
mica Acta 151, 297–314.
Martin, W.R., Banta, G.T., 1992. The measurement of
sediment irrigation rates: a comparison of the Br� tracer
and 222Rn/22Ra disequilibrium techniques. Journal of
Marine Research 50, 125–154.
Mellor, C.A., Paull, C.K., 1994. Sea beam bathymetry of
the Manteo 467 Lease Block off Cape Hatteras,
North Carolina. Deep-Sea Research II 41 (4–6),
711–718.
Middelburg, J.J., Soetaert, K., Herman, P.M.J., 1997. Empiri-
cal relationships for use in global diagenetic models. Deep-
Sea Research I 44 (2), 327–344.
Miller, R.J., Smith, C.R., DeMaster, D.J., Fornes, W.L., 2000.
Feeding selectivity and rapid particle processing by deep-sea
megafaunal deposit feeders: a 234Th tracer approach.
Journal of Marine Research 58, 653–673.
Pope, R.H., DeMaster, D.J., Smith, C.R., Seltmann, H., 1996.
Rapid bioturbation in equatorial Pacific sediments: evidence
from excess 234Th measurements. Deep-Sea Research II 43,
1339–1364.
Rhoads, D.C., Boesch, D.F., Zhican, T., Fengshan, X.,
Liqianq, H., Nilsen, K.J., 1985. Macrobenthos and sedi-
mentary facies on the Changiang delta platform and
adjacent continental shelf, East China Sea. Continental
Shelf Research 4, 189–213.
Schaff, T., Levin, L., Blair, N., DeMaster, D., Pope, R.,
Boehme, S., 1992. Spatial heterogeneity of benthos on the
Carolina continental slope: large (100 km)-scale variation.
Marine Ecology Progress Series 88, 143–160.
Smith, C.R., Pope, R.H., DeMaster, D.J, Maggard, L., 1993.
Age-dependent mixing in deep-sea sediments. Geochimica et
Cosmochimca Acta 57, 1473–1488.
M.A. Green et al. / Deep-Sea Research II 49 (2002) 4627–4644 4643

Smith, C.R., Levin, L.A., Hoover, D.J., McMurtry, G., Gage,
J.D., 2000. Variations in bioturbation across the oxygen
minimum zone in northwest Arabian Sea. Deep-Sea
Research 47, 227–257.
Sun, M.Y., Aller, R.C., Lee, C., 1991. Early diagenesis of
chlorophyll-a in Long Island Sound sediments: a measure of
carbon flux and particle reworking. Journal of Marine
Research 49, 379–401.
Sun, M.Y., Lee, C., Aller, R.C., 1993. Laboratory studies of
anoxic degradation of chlorophyll-a in Long Island Sound
sediment. Geochimica et Cosmochimica Acta 57, 147–157.
Sun, M.Y., Aller, R.C., Lee, C., 1994. Spatial and temporal
distributions of sedimentary chloropigments as indicators of
benthic processes in Long Island Sound. Journal of Marine
Research 52, 149–176.
Thomas, C.J., Blair, N.E., Alperin, M.J., DeMaster, D.J.,
Jahnke, R.A., Martens, C.S., Mayer, L., 2002. Organic
carbon deposition on the North Carolina continental slope
off Cape Hatteras (USA). Deep-Sea Research II 49 (20),
4687–4709.
Vanderborght, J.P., Wollast, R., Billen, G., 1977. Kinetic
models of diagenesis in disturbed sediments. Part I. Mass
transfer properties and silica diagenesis. Limnology and
Oceanography 22, 787–793.
Walsh, J.J., 1994. Particle export at Cape Hatteras. Deep-Sea
Research II 41, 603–628.
M.A. Green et al. / Deep-Sea Research II 49 (2002) 4627–46444644
Copyright © 2022 FDOKUMEN