
Abiotic and Biotic TNT Transformations - Defense Technical ...
Upload
independentCategory
view
0download
0
This article was downloaded by: [Benjamin Rook]On: 22 November 2013, At: 16:01Publisher: Taylor & FrancisInforma Ltd Registered in England and Wales Registered Number: 1072954 Registered office: Mortimer House,37-41 Mortimer Street, London W1T 3JH, UK
North American Journal of Fisheries ManagementPublication details, including instructions for authors and subscription information:http://www.tandfonline.com/loi/ujfm20
Biotic and Abiotic Factors Influencing CiscoRecruitment Dynamics in Lake Superior during1978–2007Benjamin J. Rook a , Michael J. Hansen b & Owen T. Gorman ca College of Natural Resources , University of Wisconsin–Stevens Point , 2100 Main Street,Stevens Point , Wisconsin , 54481 , USAb U.S. Geological Survey, Great Lakes Science Center , Hammond Bay Biological Station ,11188 Ray Road, Millersburg , Michigan , 49759 , USAc U.S. Geological Survey, Great Lakes Science Center, Lake Superior Biological Station , 2800Lake Shore Drive East , Ashland , Wisconsin , 54806 , USAPublished online: 22 Nov 2013.
To cite this article: Benjamin J. Rook , Michael J. Hansen & Owen T. Gorman (2013) Biotic and Abiotic Factors InfluencingCisco Recruitment Dynamics in Lake Superior during 1978–2007, North American Journal of Fisheries Management, 33:6,1243-1257
To link to this article: http://dx.doi.org/10.1080/02755947.2013.837122
PLEASE SCROLL DOWN FOR ARTICLE
Taylor & Francis makes every effort to ensure the accuracy of all the information (the “Content”) containedin the publications on our platform. However, Taylor & Francis, our agents, and our licensors make norepresentations or warranties whatsoever as to the accuracy, completeness, or suitability for any purpose of theContent. Any opinions and views expressed in this publication are the opinions and views of the authors, andare not the views of or endorsed by Taylor & Francis. The accuracy of the Content should not be relied upon andshould be independently verified with primary sources of information. Taylor and Francis shall not be liable forany losses, actions, claims, proceedings, demands, costs, expenses, damages, and other liabilities whatsoeveror howsoever caused arising directly or indirectly in connection with, in relation to or arising out of the use ofthe Content.
This article may be used for research, teaching, and private study purposes. Any substantial or systematicreproduction, redistribution, reselling, loan, sub-licensing, systematic supply, or distribution in anyform to anyone is expressly forbidden. Terms & Conditions of access and use can be found at http://www.tandfonline.com/page/terms-and-conditions

North American Journal of Fisheries Management 33:1243–1257, 2013C© American Fisheries Society 2013ISSN: 0275-5947 print / 1548-8675 onlineDOI: 10.1080/02755947.2013.837122
ARTICLE
Biotic and Abiotic Factors Influencing Cisco RecruitmentDynamics in Lake Superior during 1978–2007
Benjamin J. Rook*College of Natural Resources, University of Wisconsin–Stevens Point, 2100 Main Street, Stevens Point,Wisconsin 54481, USA
Michael J. HansenU.S. Geological Survey, Great Lakes Science Center, Hammond Bay Biological Station, 11188 Ray Road,Millersburg, Michigan 49759, USA
Owen T. GormanU.S. Geological Survey, Great Lakes Science Center, Lake Superior Biological Station,2800 Lake Shore Drive East, Ashland, Wisconsin 54806, USA
AbstractHistorically, the Cisco Coregonus artedi was abundant throughout the Great Lakes basin, but anthropogenic
influences caused the collapse of stocks during the mid-1900s, and fishery managers are currently exploring optionsfor restoration. To increase understanding of biotic and abiotic factors influencing Cisco recruitment dynamicsthroughout the Great Lakes, we used Ricker stock–recruitment models with rearing-habitat-weighted indices ofrecruitment and adult spawning stock size in Lake Superior to identify and quantify (1) the appropriate spatialscale for modeling age-1 recruitment dynamics and (2) the effects of biotic and abiotic factors on age-1 recruitmentdynamics within the regions identified for modeling. Cisco recruitment variation in Lake Superior was best describedby a regional model with separate stock–recruitment relationships for western, southern, eastern, and northernregions. The spatial scale for modeling was approximately 260 km. Age-1 recruitment was negatively correlated withadult spawning stock size in all four regions. Multifactor models suggested (1) a positive correlation between age-1recruitment and the interaction between wind speed and air temperature on a lakewide scale and (2) a negativecorrelation between age-1 recruitment and the biomass of Rainbow Smelt Osmerus mordax on a regional scale. Large-scale abiotic factors are beyond the control of fishery managers, so harvest of adult Ciscoes and potential predatorsand competitors should be carefully managed to achieve desired goals in Lake Superior. Although our study waslimited to Cisco stocks in Lake Superior, we believe that our general findings can be more broadly applied (albeitwith caution) to the restoration and management of remnant stocks throughout the Great Lakes basin.
The Cisco Coregonus artedi is a coldwater fish species that isnative to North America (Scott and Crossman 1973). Individualsare usually found where water temperatures are less than 17–18◦C and dissolved oxygen concentrations are greater than 3–4 mg/L (Hile 1936; McLain and Magnuson 1988). As a result,the species occupies a variety of habitats throughout Canadabut is limited to the Great Lakes basin and deeper inland lakes
*Corresponding author: rook [email protected] June 4, 2013; accepted August 16, 2013
throughout the north-central and northeastern USA (Scott andCrossman 1973; Latta 1995). The Cisco is a “keystone” prey fishspecies in many native coldwater food webs, where it serves asthe dominant pelagic zooplanktivore, is an important diet itemfor piscivores, and facilitates nutrient and energy transfer fromhighly productive pelagic zones to benthic zones (Conner et al.1993; Eshenroder and Burnham-Curtis 1999; see Ebener et al.
1243
Dow
nloa
ded
by [
Ben
jam
in R
ook]
at 1
6:01
22
Nov
embe
r 20
13

1244 ROOK ET AL.
2008 and Stockwell et al. 2009 for more complete descriptionsof Cisco life history characteristics).
Historically, Ciscoes were abundant throughout the GreatLakes basin, where they dominated the total biomass of allGreat Lakes fish communities (Smith 1995) and contributedmore to total basinwide commercial fishery yield than anyother species (cumulative yield was ∼1.36 × 10⁹ kg based onlake-specific pre-collapse averages; Baldwin et al. 2006). How-ever, anthropogenic influences, including overharvest, habitatcontamination and eutrophication, and introductions of exoticspecies, caused the collapse of Cisco stocks during the mid-1900s (Christie 1974). As a result, total annual Cisco yield hasremained well below 50,000 kg since 1953 in Lake Ontario,since 1958 in Lake Erie, since 1957 in Lake Huron, and since1963 in Lake Michigan (Baldwin et al. 2006). Currently, onlyremnant stocks remain throughout the lower Great Lakes (Millset al. 2005; Mohr and Ebener 2005; Stockwell et al. 2009).Ciscoes have recovered in Lake Superior, but current averageannual yield (798,000 kg during 1977–2000) is less than 15%of the average annual yield for the 50-year period prior to stockcollapse (5.4 × 10⁶ kg during 1915–1965; Baldwin et al. 2006).
Cisco yield has always been variable throughout the GreatLakes basin (Wells and McLain 1973); yields in each lake variedfivefold to 588-fold during the 50-year period prior to stock col-lapse (Baldwin et al. 2006). Variability in yield was influencedby changing market demand and weather conditions that oc-curred during peak commercial fishing seasons, but yield vari-ability was primarily influenced by changes in abundance asstrong and weak year-classes moved through the fisheries ineach lake (Wells and McLain 1973). Some of the weakest year-classes were produced by large parental stocks, whereas someof the strongest year-classes were produced by small parentalstocks (Scott 1951). As a result, early researchers believed thatCisco recruitment was primarily established during the first yearof life by density-independent environmental influences on eggand larval survival (Scott 1951). However, a lack of long-termdata prevented researchers from conducting stock–recruitmentanalyses to test such theories. Long-term data enabling stock–recruitment analyses are now available for Lake Superior (e.g.,Hoff 2004; Rook et al. 2012).
Ciscoes in Lake Superior are near the southernmost edgeof the species’ range (Scott and Crossman 1973), and studiesof marine fish stocks near the northernmost and southernmostedges of the species’ ranges suggest that Cisco recruitment inLake Superior should be highly variable and largely independentof adult spawning stock size because of an increased sensitiv-ity to density-independent environmental influences on the re-cruitment process (Myers 1991, 2001). Results of recent springbottom-trawl surveys (1978–2007 in U.S. waters; 1989–2007in Canadian waters) of the Lake Superior nearshore fish com-munity have shown that (1) year-class strength and subsequentrecruitment to the adult stage are primarily established prior tothe sampling of age-1 Ciscoes during the spring of each year; (2)over 300-fold variation in age-1 year-class strength is normal inU.S. waters, whereas approximately 50-fold variation in age-1
year-class strength is normal in Canadian waters; (3) lakewidesynchrony with large regional differences in relative year-classstrength is normal for strong recruitment events; and (4) some ofthe weakest year-classes are produced by large parental stocks,whereas some of the strongest year-classes are produced bysmall parental stocks (Ebener et al. 2008; Stockwell et al. 2009;Rook et al. 2012). Highly synchronous, lakewide recruitmentevents suggest that large-scale abiotic factors drive recruitmentvariation on a lakewide scale, whereas regional differences inthe relative magnitude of recruitment events suggest that small-scale biotic factors influence recruitment variation on a regionalscale within the context of overall lakewide conditions. Simi-larity between the current age-1 Cisco recruitment variabilityin Lake Superior and the historical variability in Cisco yieldthroughout the lower Great Lakes indicates that the factors driv-ing age-1 recruitment dynamics in Lake Superior may be thesame as those that were operating throughout the lower GreatLakes prior to stock collapse during the mid-1900s.
Previously, Rook et al. (2012) used a Ricker stock–recruitment model (Ricker 1975) to identify and quantify theappropriate spatial scale for modeling age-1 Cisco recruitmentdynamics in Lake Superior. Four different regions with spatialscales ranging from 230 to 290 km were identified (Rook et al.2012). However, regional differences in peak recruitment andthe spawning stock size that produced peak recruitment sug-gested that regional carrying capacity related to productivity orthe total area of suitable rearing habitat (e.g., Myers et al. 2001)may be an important underlying factor driving regional differ-ences in age-1 recruitment throughout Lake Superior (Rook et al.2012). Therefore, indices of recruitment and adult spawningstock size should be weighted by the total area of suitable Ciscorearing habitat within areas used for analysis to effectively re-move habitat area as a confounding factor in stock–recruitmentmodeling (Rook et al. 2012).
Our objectives for the present study were to (1) extend theanalysis of Rook et al. (2012) by using indices of recruitmentand adult spawning stock size weighted by the total area ofsuitable rearing habitat within the areas used for analysis toidentify and quantify the appropriate spatial scale for model-ing age-1 Cisco recruitment dynamics in Lake Superior and (2)identify and quantify the effects of biotic and abiotic factors onage-1 Cisco recruitment dynamics in Lake Superior within re-gions identified for modeling by using rearing-habitat-weightedindices of recruitment and adult spawning stock size. For objec-tive 1, we used a Ricker stock–recruitment model to identify andquantify the appropriate spatial scale for modeling recruitmentdynamics. We expected to find that multiple spatial units withingeographic regions could be modeled by using a single set ofstock–recruitment parameters (Rook et al. 2012). For objective2, we used a generalized version of the Ricker stock–recruitmentmodel (Hilborn and Walters 1992) to identify and quantify theeffects of biotic and abiotic factors on age-1 recruitment dy-namics within the regions identified for modeling. We expectedthat wind speed during the spring when Ciscoes were hatchingand air temperature during the spring when Ciscoes were 11–12
Dow
nloa
ded
by [
Ben
jam
in R
ook]
at 1
6:01
22
Nov
embe
r 20
13

LAKE SUPERIOR CISCO RECRUITMENT 1245
months of age would have positive effects on age-1 recruitmentbecause these factors have previously been correlated with age-1 recruitment in Lake Superior (Hoff 2004). We also expectedthat the biomass of Lake Trout Salvelinus namaycush during theyear of Cisco hatching would have a negative effect on age-1recruitment because Lake Trout abundance has previously beencorrelated with age-1 recruitment in Lake Superior (Hoff 2004).Finally, we expected that the biomass of Rainbow Smelt Os-merus mordax during the year of Cisco hatching would have anegative effect on age-1 recruitment because interspecific inter-actions with Rainbow Smelt are generally considered to limitage-1 Cisco recruitment in Lake Superior (Ebener et al. 2008;Stockwell et al. 2009).
METHODSStudy area.—Lake Superior is the largest and northernmost
of the Great Lakes (Figure 1; Lawrie and Rahrer 1973). Lim-ited nutrient availability, cold temperatures, extreme depths,and large fetch result in highly oligotrophic conditions, strongwind-driven currents, and intermittent stratification (Lawrie andRahrer 1973; Bennett 1978; Hoff 2004). Historically, overfish-ing and the introductions of exotic species have been the great-est threats to native fishes in Lake Superior (Lawrie and Rahrer1973).
Cisco sampling.—All data were obtained using the meth-ods described by Rook et al. (2012). Cisco recruitment wasindexed as the density (fish/ha) of age-1 fish (≤140 mm TL)in spring bottom trawls conducted within U.S. and Canadianwaters of Lake Superior, whereas Cisco adult spawning stocksize (STOCK; Table 1) was indexed as the density (fish/ha) ofadults (≥200 mm TL) in spring bottom trawls within U.S. andCanadian waters, the CPUE (fish/km) of adults (≥200 mm TL)in fishery-independent summer gill-net surveys conducted in
FIGURE 1. Study area, locations of spatial units used for stock–recruitmentanalyses, and regional spatial unit groupings for the best-fit spatial model de-scribing age-1 Cisco recruitment dynamics in Lake Superior (model 6 in Rooket al. 2012). For the best-fit spatial model, like colors represent regional spatialunit groupings (western region = Minnesota [MINN] and Wisconsin manage-ment unit 1 [WI-1]; southern region = WI-2, western Keweenaw [WKEW], andMichigan management unit 4 [MI-4]; eastern region = Michigan south shore[MISS], Whitefish Bay [WFBY], and eastern Canada [ECAN]; northern region= Nipigon Bay [NIPB], Black Bay [BLKB], and Thunder Bay [THBY]; seeRook et al. 2012 for complete descriptions of spatial units).
TABLE 1. Names and descriptions of variables included in the Cisco recruit-ment models; names ending with “H” indicate variables that were indexed duringthe spring when Ciscoes were hatching or during the year of Cisco hatching,whereas names ending with “Y” indicate variables that were indexed during thespring when Ciscoes were 11–12 months of age (i.e., yearlings).
Variable name Description
STOCK Adult spawning stock sizeSMELTH Rainbow Smelt biomass during the year of
Cisco hatchingLTH Lake Trout biomass during the year of Cisco
hatchingTEMPH Average April air temperature during the
spring when Ciscoes were hatchingTEMPY Average April air temperature during the
spring when Ciscoes were 11–12 monthsof age
WINDH Average April wind speed during the springwhen Ciscoes were hatching
ICEH Mean last day of 50% ice cover during thespring when Ciscoes were hatching
U.S. waters, and the CPUE (kg/km) of adults (≥225 mm TL) inautumn targeted commercial fisheries in Canadian waters (Rooket al. 2012).
Spatial summarization.—We calculated summary statisticsfor each index of recruitment and spawning stock size in 11spatial units within U.S. and Canadian waters of Lake Superior(Figure 1) using the methods described by Rook et al. (2012). Toremove habitat area as a confounding factor in subsequent anal-yses, estimates of spawner and recruit density were divided bythe total area of suitable Cisco rearing habitat within each spatialunit (i.e., scaled to 1,000 km2 of suitable rearing habitat). Dataused for subsequent analyses were in units of fish per hectareper 1,000 km2 of suitable rearing habitat area; however, we usethe shorthand “fish/ha” throughout the remainder of this paper.Suitable Cisco rearing habitat was defined as depths of 90 mor less (Gorman et al. 2012) and was estimated by using over-lay procedures in ArcMap (Environmental Systems ResearchInstitute, Redlands, California) and the 80-m depth contour ina bathymetry shapefile provided by the U.S. Geological Survey(Lake Superior Biological Station, Ashland, Wisconsin).
Predators and competitors.—Predator and competitorbiomasses (kg/ha; used instead of density) were indexed usingcatch rates in spring bottom-trawl surveys (see above). RainbowSmelt, a potential source of predation and competition for age-0Ciscoes, and Lake Trout, a potential source of predation for age-0 Ciscoes, were indexed as biomass of fish during the year ofCisco hatching (SMELTH and LTH, respectively; Table 1; An-derson and Smith 1971; Conner et al. 1993; Cox and Kitchell2004). Summary statistics were calculated for each index ofbiomass by using the methods described above for bottom-trawldensity. However, final biomass estimates were not scaled to the
Dow
nloa
ded
by [
Ben
jam
in R
ook]
at 1
6:01
22
Nov
embe
r 20
13

1246 ROOK ET AL.
total area of suitable Cisco rearing habitat within each spatialunit. To meet the assumptions of normality, loge transformedvalues of SMELTH and LTH were used for analysis.
Temperature and wind speed.—Air temperature (◦C; used asa surrogate for water temperature) and wind speed (km/h) wereindexed using data from the online database of the NationalOceanic and Atmospheric Administration’s (NOAA) NationalClimatic Data Center (NOAA 2008). Monitoring stations weredistributed along the U.S. and Canadian shorelines of Lake Su-perior and were used to index (1) average April air temperatureduring the spring when Ciscoes were hatching (TEMPH; Ta-ble 1), a period in which suboptimal temperatures may magnifythe effects of predation and competition or may prevent indi-viduals from reaching an adequate size for overwinter survival;(2) average April air temperature during the spring when Cis-coes were 11–12 months of age (TEMPY; Table 1), a period inwhich suboptimal temperatures may place additional stress onnew recruits after severe winters; and (3) average April windspeed during the spring when Ciscoes were hatching (WINDH;Table 1), a period in which increased wind speeds may limitlarval predation or mediate larval survival through transport towaters that are optimal or suboptimal for growth and develop-ment (Kinnunen 1997; Hoff 2004; Oyadomari and Auer 2004;Pangle et al. 2004). Temperature and wind speed values fromthe nearest monitoring station were assigned to each spatial unit.
Ice cover.—Cisco hatching date may depend on spring icecover (John and Hasler 1956), and recruitment of related core-gonids in the Great Lakes and large Swedish lakes has beenpositively correlated with ice cover during the incubation pe-riod (Taylor et al. 1987; Brown et al. 1993; Nyberg et al. 2001).Therefore, we used ice cover records from the NOAA GreatLakes Environmental Research Laboratory (Ann Arbor, Michi-gan) to calculate the mean last day of 50% ice cover (ICEH;Table 1) for each spatial unit. Ice cover records were available inan approximately 2.5-km-resolution grid format for the wintersof 1973–2005 (Assel et al. 2002; Assel 2005). All grids wereconverted to digital raster graphic files by using Python pro-gramming language (Python Software Foundation, Hampton,New Hampshire), and ArcMap was used to conduct an overlayanalysis for each year. Ice cover values were paired with densityestimates for Cisco recruits that hatched during spring of thesame year.
Spatial analysis.—Spatial analysis methods were describedby Rook et al. (2012). Therefore, only a brief summary is pro-vided here. Weighted estimates of spawner density were pairedwith weighted estimates of recruit density 2 years later, and asequence of Ricker stock–recruitment models was used to testdifferent hypotheses related to the spatial scale for age-1 Ciscorecruitment dynamics in Lake Superior,
Ri = αSi e−βSi eε,
where Ri is recruitment of the ith year-class of Ciscoes, Si isspawning stock size, α is the density-independent recruitment
rate, β is the density-dependent recruitment rate, and eε is amultiplicative error term (Ricker 1975). Model parameters α
and β were estimated using the linear model
loge(Ri/Si ) = loge α − βSi + ε.
All spatial models were identical to those used in the analysisby Rook et al. (2012). Five a priori models (models 1–5 in Rooket al. 2012) assumed separate α and β parameters for each spatialunit grouping, whereas one post hoc model (model 6 in Rooket al. 2012; Figure 1) assumed a single α and separate β param-eters and used region-specific spawning stock sizes (Si1–Si4)to estimate region-specific density-dependent recruitment rates(β1–β4; see Rook et al. 2012 for detailed model descriptions),
loge(Ri/Si ) = loge α − β1Si1 − β2Si2 − · · · − β4Si4 + ε.
The best-fit spatial model describing age-1 Cisco recruitmentdynamics in Lake Superior was selected by using Akaike’s in-formation criterion (AIC) and likelihood statistics (Burnhamand Anderson 2002). Peak recruitment (Rmax) and the spawningstock size that produced peak recruitment (Smax) were estimatedto show how Cisco recruitment differed among regions (Ricker1975; Hilborn and Walters 1992).
Multifactor analysis.—Weighted estimates of spawner den-sity were paired with weighted estimates of recruit density2 years later, and a sequence of generalized Ricker stock–recruitment models was used to test biotic and abiotic variablesfor their explanation of overall age-1 Cisco recruitment variationwithin four different regions of Lake Superior (Figure 1):
Ri = αSi e−βSi −δXi eε.
The generalized Ricker stock–recruitment model is analogousto the model used for spatial analysis (see above) but allows forother biotic or abiotic variables (Xi) and a parameter describingtheir effects on recruitment rate (δ; Hilborn and Walters 1992).The model parameters α, β, and δ were estimated by using thelinear model
loge(Ri/Si ) = loge α − βSi − δXi + ε.
Regional stock–recruit density estimates and values for bioticand abiotic variables (described above) were used to fit gener-alized stock–recruitment curves to 14 a priori models, eachcontaining a unique combination of biotic and abiotic variablesand two-way interaction terms (Table 2). Models were held con-stant among regions to allow variables and interaction terms tobe evaluated on both a regional scale (models 1–14; Table 2)and a lakewide scale (models 1 and 9–14; Table 2). Because thenumber of values for biotic and abiotic variables was generallyreduced in comparison with the number of stock–recruit den-sity estimates, all multifactor models (models 2–14; Table 2)were fitted by using a reduced version of the data set used for
Dow
nloa
ded
by [
Ben
jam
in R
ook]
at 1
6:01
22
Nov
embe
r 20
13

LAKE SUPERIOR CISCO RECRUITMENT 1247
TABLE 2. Regional (models 1–14) and lakewide (models 1 and 9–14) Ciscostock–recruitment models used for multifactor analysis (LN = loge). Variablesare defined in Table 1.
Modelnumber Variables and interaction terms included
1 STOCK2 STOCK + LN(SMELTH)3 STOCK + LN(LTH)4 STOCK + LN(SMELTH) + LN(LTH)5 STOCK + [LN(SMELTH) × LN(LTH)]6 STOCK + LN(SMELTH) + WINDH + TEMPY7 STOCK + LN(SMELTH) + (WINDH × TEMPY)8 STOCK + LN(SMELTH) + LN(LTH) + ICEH
+ TEMPH + WINDH + TEMPY9 STOCK + ICEH
10 STOCK + TEMPH11 STOCK + WINDH12 STOCK + TEMPY13 STOCK + WINDH + TEMPY14 STOCK + (WINDH × TEMPY)
spatial analysis (see above). To ensure the most accurate param-eter estimates possible and to ensure consistency between thespatial and multifactor analyses, one reduced model containingonly the STOCK variable (model 1; Table 2) was fitted usingthe larger spatial analysis data set. However, the fit of the re-duced model was compared with that of the multifactor modelsby using the reduced multifactor data set (i.e., model 1 was fit-ted by using the larger data set but was compared with the othermodels on equal terms; methods described below). Prior to anal-ysis, variables and interaction terms in all multifactor modelswere checked for collinearity by examining pairwise values ofPearson’s product-moment correlation coefficient, with valuesof 0.50 or greater considered to be problematic (Wilkinson et al.2004).
The AIC and likelihood statistics (see above) were used toevaluate model fit and the relative importance of individual vari-ables and interaction terms. Model ranking was performed on aregional scale using the full set of 14 a priori models (models
1–14; Table 2) and on a lakewide scale by assuming separateregional models and using a reduced set of seven a priori mod-els (i.e., models that were fitted at the regional scale but wereevaluated at the lakewide scale; models 1 and 9–14; Table 2).Because regional models were intended for both variable rank-ing and prediction, parameter estimates and 85% confidenceintervals were used to remove invalid models from the set ofcandidate models; models containing individual variables andinteraction terms with 85% confidence intervals that includedzero were considered invalid and removed from further analy-sis (Arnold 2010). Regional best-fit models were developed bycalculating model-averaged parameter estimates and uncondi-tional SEs for all variables and interaction terms in the remain-ing models (Burnham and Anderson 2002). When the individualvariables and interaction terms in those remaining models werehighly correlated (see above), Akaike weights (wi) were used toremove lower-ranking variables and interaction terms from theregional best-fit models (Burnham and Anderson 2002). If theweight of the reduced model surpassed the weight of all mul-tifactor models, we abandoned model averaging in favor of thesimpler reduced model. For the regional best-fit models describ-ing age-1 Cisco recruitment dynamics in Lake Superior, Rmax
and Smax were estimated to demonstrate how Cisco recruitmentdiffered among regions (see above). Because lakewide mod-els were intended only for variable ranking, all models werecompared “as is” by using methods identical to those used forregional models (see above).
RESULTS
Spatial AnalysisCisco recruitment variation in Lake Superior was best de-
scribed by a five-parameter regional model (model 6 in Rooket al. 2012) with a single α and separate β-parameters for eachregional group of spatial units (Table 3). Regional spatial unitgroupings were as follows (Figure 1): (1) the western region,including Minnesota waters and Wisconsin management unit 1(WI-1); (2) the southern region, including WI-2, western Ke-weenaw, and Michigan management unit 4 (MI-4); (3) the east-ern region, including Michigan south shore, Whitefish Bay, andeastern Canada; and (4) the northern region, including Nipigon
TABLE 3. Comparison of spatial models describing age-1 Cisco recruitment dynamics in Lake Superior (n = number of data points; K = number of parameters;RSS = residual sum of squares; AIC = Akaike’s information criterion; AICc = AIC corrected for small-sample bias; wi = Akaike weight). See Rook et al. (2012)for model descriptions.
Model n K RSS AIC AICc Scaled AICc wi
6 200 5 566.575 218.258 218.568 0.000 0.904 200 8 560.572 222.128 222.882 4.314 0.105 200 8 585.903 230.967 231.721 13.154 0.003 200 6 618.414 237.768 238.203 19.636 0.001 200 22 517.708 234.219 239.936 21.369 0.002 200 2 731.245 263.286 263.347 44.779 0.00
Dow
nloa
ded
by [
Ben
jam
in R
ook]
at 1
6:01
22
Nov
embe
r 20
13

1248 ROOK ET AL.
TABLE 4. Regional stock–recruitment curves describing age-1 Cisco recruitment dynamics in Lake Superior. Adjusted R2 values and P-values are provided forlinear versions of each curve (α = density-independent recruitment rate [age-1 recruits/spawner]; β = density-dependent recruitment rate [spawners−1]; ASE =asymptotic SE; Rmax = peak recruitment [age-1 recruits/ha]; Smax = spawning stock size [spawners/ha] that produced peak recruitment).
α β
Region Estimate ASE Estimate ASE Rmax Smax R2 P-value
Western 3.3 0.53 −0.1 0.02 10.9 8.9 0.32 <0.001Southern 3.3 0.53 −0.8 0.11 1.6 1.3 0.27 <0.001Eastern 3.3 0.53 −5.2 1.21 0.2 0.2 0.22 0.005Northern 3.3 0.53 −1.0 0.18 1.2 1.0 0.38 <0.001
Bay, Black Bay, and Thunder Bay. The four-group regionalmodel had a 90% likelihood of being the correct model amongall models considered, was 8.7-fold more likely than the second-ranked model, and was 8.5-fold more likely than all other modelscombined (Table 3). The spatial scale for modeling was approx-imately 260 km (range = 230–290 km).
The α was constant among regions (α = 3.3 age-1recruits/spawner), whereas β varied 47-fold among regions(range = −0.1 to −5.2 spawners−1; Table 4). Both Rmax andSmax varied 47-fold among regions (Rmax = 0.2–10.9 age-1 re-cruits/ha; Smax = 0.2–8.9 spawners/ha; Table 4; Figure 2). Ad-justed R2 values for linear models ranged from 0.22 to 0.38.All regional models were significant (P ≤ 0.05; Table 4). Time-series and normal probability plots indicated that model resid-uals were independent and approximately normally distributedfor all regions except the eastern region. However, strong recruit-ment events were consistently underestimated (Figure 3).
Multifactor AnalysisMultifactor models produced a substantially better fit than
reduced models for the southern and northern regions but notfor the western and eastern regions (Table 5). For the southernregion, the top-ranked model (model 14) included STOCK and
FIGURE 2. Regional stock–recruitment curves based on the top-ranked spa-tial model (model 6 in Rook et al. 2012) describing age-1 Cisco recruitmentdynamics in Lake Superior. Recruit densities are plotted on a modified loge
scale.
the WINDH × TEMPY interaction. The top-ranked model (55%likelihood) was 2.5-fold more likely than the second-rankedmodel (model 12; 22% likelihood), which included STOCKand TEMPY. The combined likelihood of the top-two modelswas 77%, which was 5.6-fold more likely than the third-rankedmodel and 8.7-fold more likely than the reduced model (Ta-ble 5). For the northern region, the top-ranked model (model2) included STOCK and SMELTH. The top-ranked model(30% likelihood) was slightly more likely than the second- tofourth-ranked models (range of likelihood = 17–28%). Thesecond-ranked model (model 5) included STOCK and theSMELTH × LTH interaction, the third-ranked model (model 11)included STOCK and WINDH, and the fourth-ranked model(model 14) included STOCK and the WINDH × TEMPY in-teraction. The combined likelihood of the top-four models forthe northern region was 97%—30.1-fold more likely than thereduced model (Table 5). For the western region, the top-rankedmodel (model 10) included STOCK and TEMPH. However,the top-ranked model (73% likelihood) was only 2.8-fold morelikely than the reduced model (27% likelihood; Table 5). Forthe eastern region, the top-ranked model was the reduced model(Table 5).
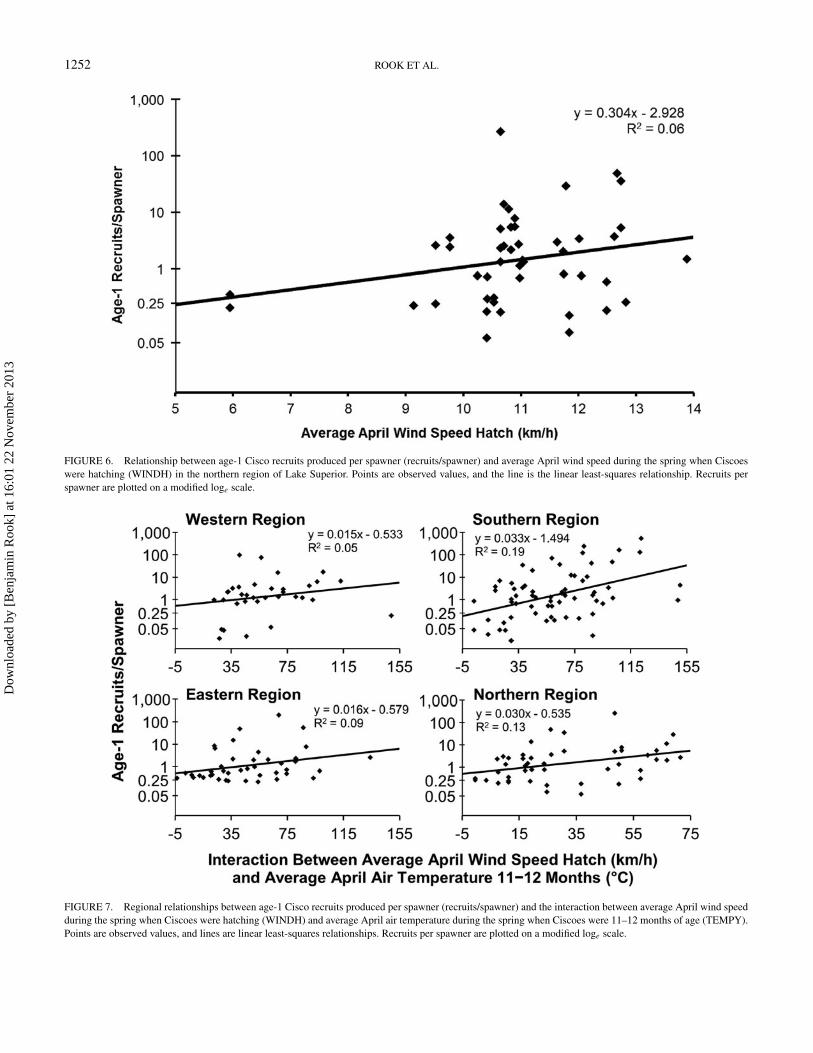
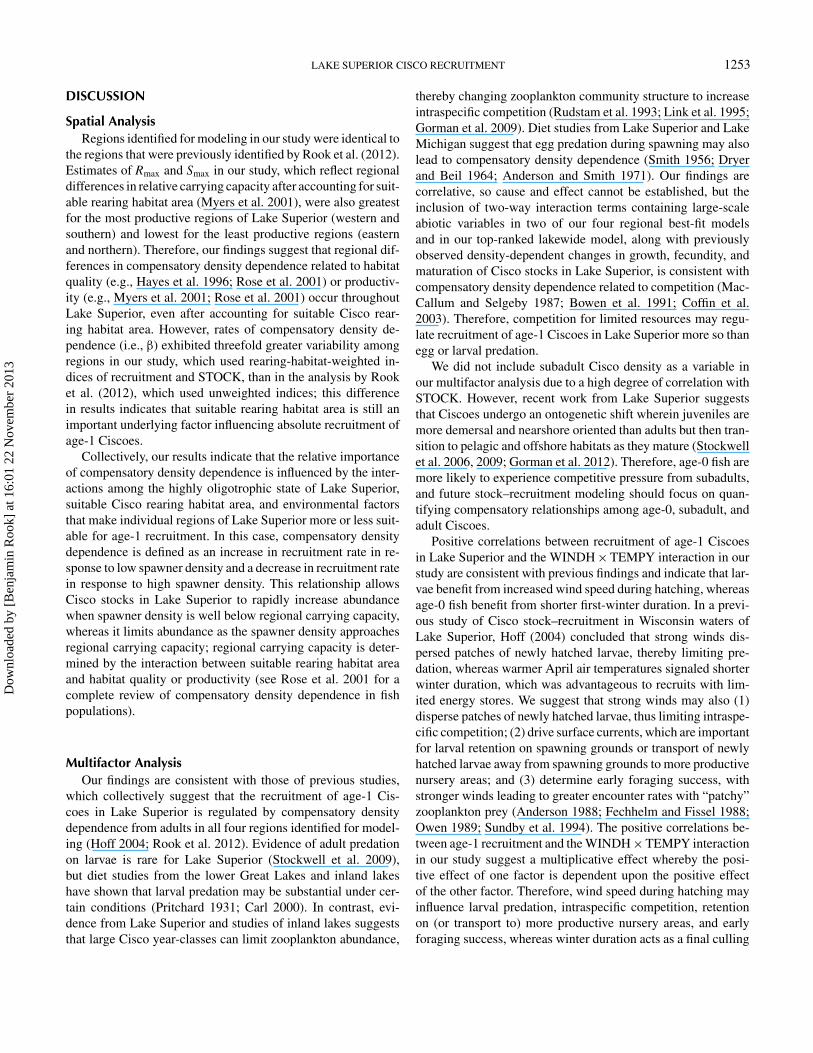
For regions where multifactor models fit substantiallybetter than reduced models (southern and northern re-gions), model-averaged parameter estimates indicated thatage-1 Cisco recruitment was positively correlated with theWINDH × TEMPY interaction (Figure 4). For the southernregion, age-1 Cisco recruitment was also positively correlatedwith TEMPY and SMELTH. However, because TEMPY washighly correlated with the WINDH × TEMPY interaction,TEMPY was removed from the regional best-fit model(Table 6); SMELTH was included in the regional best-fit modeldespite what appeared to be a somewhat spurious correlation(Figure 5). For the northern region, age-1 Cisco recruitment wasalso negatively correlated with SMELTH (Figure 5) and waspositively correlated with the SMELTH × LTH interaction andWINDH. However, because the SMELTH × LTH interactionwas highly correlated with SMELTH, this interaction term wasremoved from the regional best-fit model (Table 6); WINDHwas included in the regional best-fit model despite an apparentoutlier-driven correlation (Figure 6).
Dow
nloa
ded
by [
Ben
jam
in R
ook]
at 1
6:01
22
Nov
embe
r 20
13

LAKE SUPERIOR CISCO RECRUITMENT 1249
TABLE 5. Comparison of multifactor models describing age-1 Cisco recruitment dynamics in Lake Superior. Variables are defined in Table 1 (LN = loge;n = number of data points; K = number of parameters; RSS = residual sum of squares; AIC = Akaike’s information criterion; AICc = AIC corrected forsmall-sample bias; wi = Akaike weight).
Region Model n K RSS AIC AICc Scaled AICc wi
Western STOCK + TEMPH 34 3 76.885 33.742 34.542 0.000 0.73STOCK 34 2 87.662 36.187 36.574 2.032 0.27
Southern STOCK + (WINDH × TEMPY) 66 3 249.118 93.666 94.053 0.000 0.55STOCK + TEMPY 66 3 256.152 95.504 95.891 1.838 0.22STOCK + LN(SMELTH) 66 3 259.766 96.428 96.815 2.762 0.14STOCK 66 2 272.232 97.522 97.712 3.659 0.09
Eastern STOCK 42 2 83.941 33.083 33.390 0.000 1.00Northern STOCK + LN(SMELTH) 48 3 85.942 33.959 34.504 0.000 0.30
STOCK + [LN(SMELTH) × LN(LTH)] 48 3 86.188 34.096 34.642 0.138 0.28STOCK + WINDH 48 3 87.271 34.695 35.241 0.737 0.21STOCK + (WINDH × TEMPY) 48 3 88.119 35.159 35.705 1.201 0.17STOCK 48 2 98.977 38.737 39.004 4.500 0.03
Lakewide STOCK + (WINDH × TEMPY) 190 12 503.787 209.275 211.037 0.000 0.67STOCK + TEMPY 190 12 512.221 212.429 214.192 3.155 0.14STOCK 190 8 542.772 215.436 216.232 5.195 0.05STOCK + WINDH 190 12 517.972 214.551 216.313 5.276 0.05STOCK + TEMPH 190 12 518.124 214.606 216.369 5.332 0.05STOCK + ICEH 190 12 521.355 215.787 217.550 6.513 0.03STOCK + WINDH + TEMPY 190 16 498.806 215.387 218.531 7.494 0.02
FIGURE 3. Regional stock–recruitment curves based on the top-ranked spatial model (model 6 in Rook et al. 2012) describing age-1 Cisco recruitment dynamicsin Lake Superior. Points are observed values, and lines are predicted values. Recruit densities are plotted on a modified loge scale.
Dow
nloa
ded
by [
Ben
jam
in R
ook]
at 1
6:01
22
Nov
embe
r 20
13

1250 ROOK ET AL.
FIGURE 4. Regional relationships between age-1 Cisco recruit density, spawner density (STOCK), and average April air temperature during the spring whenCiscoes were 11–12 months of age (TEMPY). Average April wind speed during the spring when Ciscoes were hatching (WINDH) was held at minimum (10.8and 6.0 km/h), average (14.6 and 10.9 km/h), and maximum (19.2 and 13.9 km/h) observed values to display the effects of both wind speed and air temperatureon recruitment. Relationships are based on single model-averaged parameter estimates for the density-independent recruitment rate α, the density-dependentrecruitment rate β, and the interaction term δWINDH × TEMPY in each regional model (Table 6).
For regional best-fit models, α varied threefold amongregions and ranged from 1.4 to 3.8 age-1 recruits/spawner,whereas β varied 49-fold among regions and ranged from−0.1 to −5.2 spawners−1 (Table 6). The Rmax varied 21-foldamong regions and ranged from 0.2 to 4.8 age-1 recruits/ha,
whereas Smax varied 49-fold among regions and ranged from0.2 to 9.4 spawners/ha (Table 6). Adjusted R2 values for linearbest-fit models ranged from 0.22 to 0.40. All regional best-fitmodels were significant (P ≤ 0.05; Table 6). Time-series andnormal probability plots indicated that the model residuals were
Dow
nloa
ded
by [
Ben
jam
in R
ook]
at 1
6:01
22
Nov
embe
r 20
13
LAKE SUPERIOR CISCO RECRUITMENT 1251
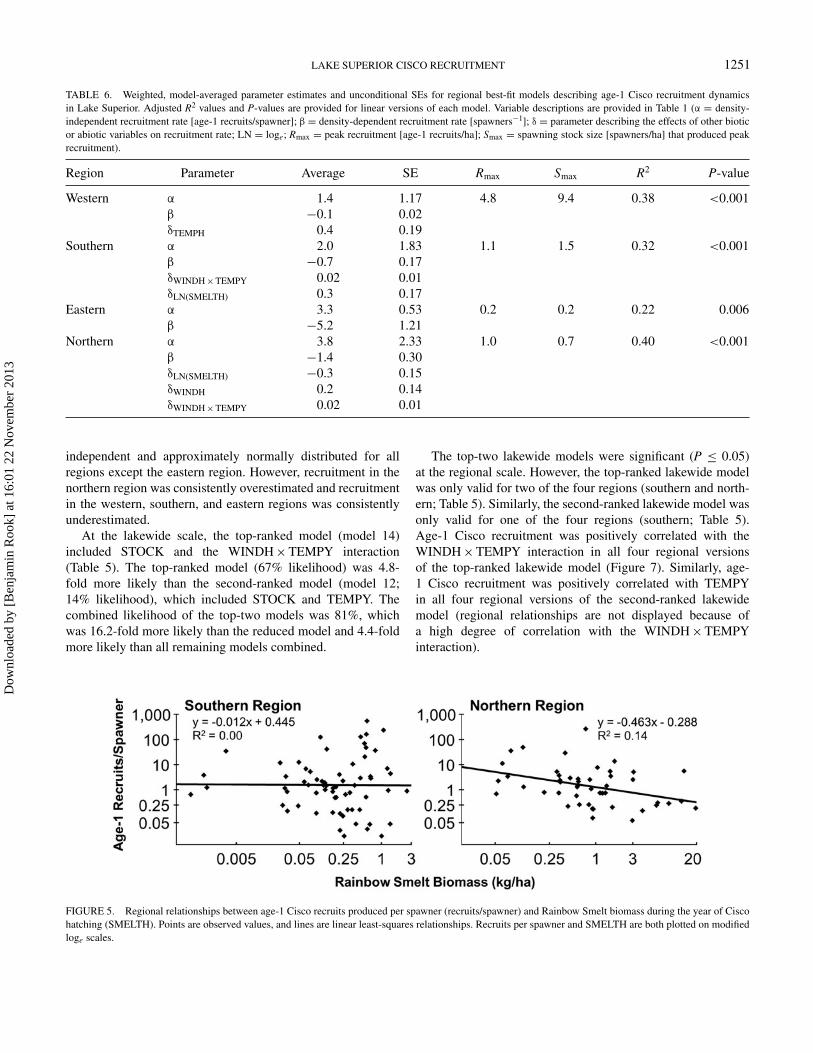
TABLE 6. Weighted, model-averaged parameter estimates and unconditional SEs for regional best-fit models describing age-1 Cisco recruitment dynamicsin Lake Superior. Adjusted R2 values and P-values are provided for linear versions of each model. Variable descriptions are provided in Table 1 (α = density-independent recruitment rate [age-1 recruits/spawner]; β = density-dependent recruitment rate [spawners−1]; δ = parameter describing the effects of other bioticor abiotic variables on recruitment rate; LN = loge; Rmax = peak recruitment [age-1 recruits/ha]; Smax = spawning stock size [spawners/ha] that produced peakrecruitment).
Region Parameter Average SE Rmax Smax R2 P-value
Western α 1.4 1.17 4.8 9.4 0.38 <0.001β −0.1 0.02δTEMPH 0.4 0.19
Southern α 2.0 1.83 1.1 1.5 0.32 <0.001β −0.7 0.17δWINDH × TEMPY 0.02 0.01δLN(SMELTH) 0.3 0.17
Eastern α 3.3 0.53 0.2 0.2 0.22 0.006β −5.2 1.21
Northern α 3.8 2.33 1.0 0.7 0.40 <0.001β −1.4 0.30δLN(SMELTH) −0.3 0.15δWINDH 0.2 0.14δWINDH × TEMPY 0.02 0.01
independent and approximately normally distributed for allregions except the eastern region. However, recruitment in thenorthern region was consistently overestimated and recruitmentin the western, southern, and eastern regions was consistentlyunderestimated.
At the lakewide scale, the top-ranked model (model 14)included STOCK and the WINDH × TEMPY interaction(Table 5). The top-ranked model (67% likelihood) was 4.8-fold more likely than the second-ranked model (model 12;14% likelihood), which included STOCK and TEMPY. Thecombined likelihood of the top-two models was 81%, whichwas 16.2-fold more likely than the reduced model and 4.4-foldmore likely than all remaining models combined.
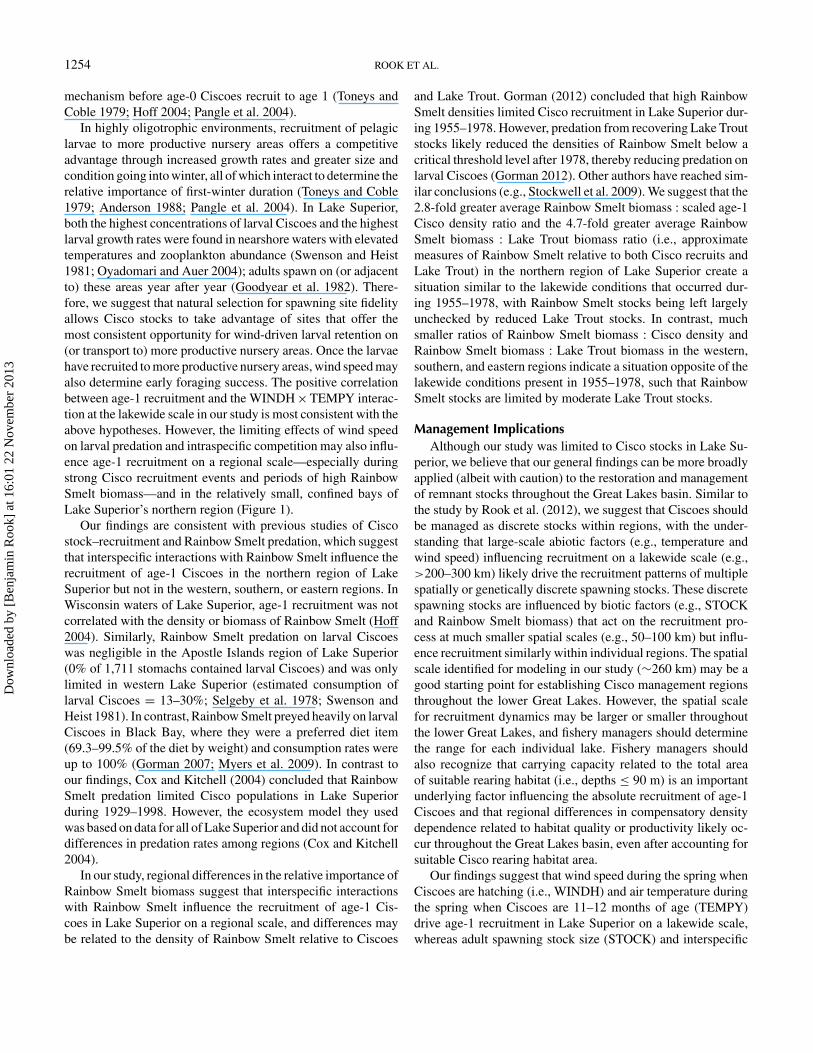
The top-two lakewide models were significant (P ≤ 0.05)at the regional scale. However, the top-ranked lakewide modelwas only valid for two of the four regions (southern and north-ern; Table 5). Similarly, the second-ranked lakewide model wasonly valid for one of the four regions (southern; Table 5).Age-1 Cisco recruitment was positively correlated with theWINDH × TEMPY interaction in all four regional versionsof the top-ranked lakewide model (Figure 7). Similarly, age-1 Cisco recruitment was positively correlated with TEMPYin all four regional versions of the second-ranked lakewidemodel (regional relationships are not displayed because ofa high degree of correlation with the WINDH × TEMPYinteraction).
FIGURE 5. Regional relationships between age-1 Cisco recruits produced per spawner (recruits/spawner) and Rainbow Smelt biomass during the year of Ciscohatching (SMELTH). Points are observed values, and lines are linear least-squares relationships. Recruits per spawner and SMELTH are both plotted on modifiedloge scales.
Dow
nloa
ded
by [
Ben
jam
in R
ook]
at 1
6:01
22
Nov
embe
r 20
13
1252 ROOK ET AL.
FIGURE 6. Relationship between age-1 Cisco recruits produced per spawner (recruits/spawner) and average April wind speed during the spring when Ciscoeswere hatching (WINDH) in the northern region of Lake Superior. Points are observed values, and the line is the linear least-squares relationship. Recruits perspawner are plotted on a modified loge scale.
FIGURE 7. Regional relationships between age-1 Cisco recruits produced per spawner (recruits/spawner) and the interaction between average April wind speedduring the spring when Ciscoes were hatching (WINDH) and average April air temperature during the spring when Ciscoes were 11–12 months of age (TEMPY).Points are observed values, and lines are linear least-squares relationships. Recruits per spawner are plotted on a modified loge scale.
Dow
nloa
ded
by [
Ben
jam
in R
ook]
at 1
6:01
22
Nov
embe
r 20
13
LAKE SUPERIOR CISCO RECRUITMENT 1253
DISCUSSION
Spatial AnalysisRegions identified for modeling in our study were identical to
the regions that were previously identified by Rook et al. (2012).Estimates of Rmax and Smax in our study, which reflect regionaldifferences in relative carrying capacity after accounting for suit-able rearing habitat area (Myers et al. 2001), were also greatestfor the most productive regions of Lake Superior (western andsouthern) and lowest for the least productive regions (easternand northern). Therefore, our findings suggest that regional dif-ferences in compensatory density dependence related to habitatquality (e.g., Hayes et al. 1996; Rose et al. 2001) or productiv-ity (e.g., Myers et al. 2001; Rose et al. 2001) occur throughoutLake Superior, even after accounting for suitable Cisco rear-ing habitat area. However, rates of compensatory density de-pendence (i.e., β) exhibited threefold greater variability amongregions in our study, which used rearing-habitat-weighted in-dices of recruitment and STOCK, than in the analysis by Rooket al. (2012), which used unweighted indices; this differencein results indicates that suitable rearing habitat area is still animportant underlying factor influencing absolute recruitment ofage-1 Ciscoes.
Collectively, our results indicate that the relative importanceof compensatory density dependence is influenced by the inter-actions among the highly oligotrophic state of Lake Superior,suitable Cisco rearing habitat area, and environmental factorsthat make individual regions of Lake Superior more or less suit-able for age-1 recruitment. In this case, compensatory densitydependence is defined as an increase in recruitment rate in re-sponse to low spawner density and a decrease in recruitment ratein response to high spawner density. This relationship allowsCisco stocks in Lake Superior to rapidly increase abundancewhen spawner density is well below regional carrying capacity,whereas it limits abundance as the spawner density approachesregional carrying capacity; regional carrying capacity is deter-mined by the interaction between suitable rearing habitat areaand habitat quality or productivity (see Rose et al. 2001 for acomplete review of compensatory density dependence in fishpopulations).
Multifactor AnalysisOur findings are consistent with those of previous studies,
which collectively suggest that the recruitment of age-1 Cis-coes in Lake Superior is regulated by compensatory densitydependence from adults in all four regions identified for model-ing (Hoff 2004; Rook et al. 2012). Evidence of adult predationon larvae is rare for Lake Superior (Stockwell et al. 2009),but diet studies from the lower Great Lakes and inland lakeshave shown that larval predation may be substantial under cer-tain conditions (Pritchard 1931; Carl 2000). In contrast, evi-dence from Lake Superior and studies of inland lakes suggeststhat large Cisco year-classes can limit zooplankton abundance,
thereby changing zooplankton community structure to increaseintraspecific competition (Rudstam et al. 1993; Link et al. 1995;Gorman et al. 2009). Diet studies from Lake Superior and LakeMichigan suggest that egg predation during spawning may alsolead to compensatory density dependence (Smith 1956; Dryerand Beil 1964; Anderson and Smith 1971). Our findings arecorrelative, so cause and effect cannot be established, but theinclusion of two-way interaction terms containing large-scaleabiotic variables in two of our four regional best-fit modelsand in our top-ranked lakewide model, along with previouslyobserved density-dependent changes in growth, fecundity, andmaturation of Cisco stocks in Lake Superior, is consistent withcompensatory density dependence related to competition (Mac-Callum and Selgeby 1987; Bowen et al. 1991; Coffin et al.2003). Therefore, competition for limited resources may regu-late recruitment of age-1 Ciscoes in Lake Superior more so thanegg or larval predation.
We did not include subadult Cisco density as a variable inour multifactor analysis due to a high degree of correlation withSTOCK. However, recent work from Lake Superior suggeststhat Ciscoes undergo an ontogenetic shift wherein juveniles aremore demersal and nearshore oriented than adults but then tran-sition to pelagic and offshore habitats as they mature (Stockwellet al. 2006, 2009; Gorman et al. 2012). Therefore, age-0 fish aremore likely to experience competitive pressure from subadults,and future stock–recruitment modeling should focus on quan-tifying compensatory relationships among age-0, subadult, andadult Ciscoes.
Positive correlations between recruitment of age-1 Ciscoesin Lake Superior and the WINDH × TEMPY interaction in ourstudy are consistent with previous findings and indicate that lar-vae benefit from increased wind speed during hatching, whereasage-0 fish benefit from shorter first-winter duration. In a previ-ous study of Cisco stock–recruitment in Wisconsin waters ofLake Superior, Hoff (2004) concluded that strong winds dis-persed patches of newly hatched larvae, thereby limiting pre-dation, whereas warmer April air temperatures signaled shorterwinter duration, which was advantageous to recruits with lim-ited energy stores. We suggest that strong winds may also (1)disperse patches of newly hatched larvae, thus limiting intraspe-cific competition; (2) drive surface currents, which are importantfor larval retention on spawning grounds or transport of newlyhatched larvae away from spawning grounds to more productivenursery areas; and (3) determine early foraging success, withstronger winds leading to greater encounter rates with “patchy”zooplankton prey (Anderson 1988; Fechhelm and Fissel 1988;Owen 1989; Sundby et al. 1994). The positive correlations be-tween age-1 recruitment and the WINDH × TEMPY interactionin our study suggest a multiplicative effect whereby the posi-tive effect of one factor is dependent upon the positive effectof the other factor. Therefore, wind speed during hatching mayinfluence larval predation, intraspecific competition, retentionon (or transport to) more productive nursery areas, and earlyforaging success, whereas winter duration acts as a final culling
Dow
nloa
ded
by [
Ben
jam
in R
ook]
at 1
6:01
22
Nov
embe
r 20
13
1254 ROOK ET AL.
mechanism before age-0 Ciscoes recruit to age 1 (Toneys andCoble 1979; Hoff 2004; Pangle et al. 2004).
In highly oligotrophic environments, recruitment of pelagiclarvae to more productive nursery areas offers a competitiveadvantage through increased growth rates and greater size andcondition going into winter, all of which interact to determine therelative importance of first-winter duration (Toneys and Coble1979; Anderson 1988; Pangle et al. 2004). In Lake Superior,both the highest concentrations of larval Ciscoes and the highestlarval growth rates were found in nearshore waters with elevatedtemperatures and zooplankton abundance (Swenson and Heist1981; Oyadomari and Auer 2004); adults spawn on (or adjacentto) these areas year after year (Goodyear et al. 1982). There-fore, we suggest that natural selection for spawning site fidelityallows Cisco stocks to take advantage of sites that offer themost consistent opportunity for wind-driven larval retention on(or transport to) more productive nursery areas. Once the larvaehave recruited to more productive nursery areas, wind speed mayalso determine early foraging success. The positive correlationbetween age-1 recruitment and the WINDH × TEMPY interac-tion at the lakewide scale in our study is most consistent with theabove hypotheses. However, the limiting effects of wind speedon larval predation and intraspecific competition may also influ-ence age-1 recruitment on a regional scale—especially duringstrong Cisco recruitment events and periods of high RainbowSmelt biomass—and in the relatively small, confined bays ofLake Superior’s northern region (Figure 1).
Our findings are consistent with previous studies of Ciscostock–recruitment and Rainbow Smelt predation, which suggestthat interspecific interactions with Rainbow Smelt influence therecruitment of age-1 Ciscoes in the northern region of LakeSuperior but not in the western, southern, or eastern regions. InWisconsin waters of Lake Superior, age-1 recruitment was notcorrelated with the density or biomass of Rainbow Smelt (Hoff2004). Similarly, Rainbow Smelt predation on larval Ciscoeswas negligible in the Apostle Islands region of Lake Superior(0% of 1,711 stomachs contained larval Ciscoes) and was onlylimited in western Lake Superior (estimated consumption oflarval Ciscoes = 13–30%; Selgeby et al. 1978; Swenson andHeist 1981). In contrast, Rainbow Smelt preyed heavily on larvalCiscoes in Black Bay, where they were a preferred diet item(69.3–99.5% of the diet by weight) and consumption rates wereup to 100% (Gorman 2007; Myers et al. 2009). In contrast toour findings, Cox and Kitchell (2004) concluded that RainbowSmelt predation limited Cisco populations in Lake Superiorduring 1929–1998. However, the ecosystem model they usedwas based on data for all of Lake Superior and did not account fordifferences in predation rates among regions (Cox and Kitchell2004).
In our study, regional differences in the relative importance ofRainbow Smelt biomass suggest that interspecific interactionswith Rainbow Smelt influence the recruitment of age-1 Cis-coes in Lake Superior on a regional scale, and differences maybe related to the density of Rainbow Smelt relative to Ciscoes
and Lake Trout. Gorman (2012) concluded that high RainbowSmelt densities limited Cisco recruitment in Lake Superior dur-ing 1955–1978. However, predation from recovering Lake Troutstocks likely reduced the densities of Rainbow Smelt below acritical threshold level after 1978, thereby reducing predation onlarval Ciscoes (Gorman 2012). Other authors have reached sim-ilar conclusions (e.g., Stockwell et al. 2009). We suggest that the2.8-fold greater average Rainbow Smelt biomass : scaled age-1Cisco density ratio and the 4.7-fold greater average RainbowSmelt biomass : Lake Trout biomass ratio (i.e., approximatemeasures of Rainbow Smelt relative to both Cisco recruits andLake Trout) in the northern region of Lake Superior create asituation similar to the lakewide conditions that occurred dur-ing 1955–1978, with Rainbow Smelt stocks being left largelyunchecked by reduced Lake Trout stocks. In contrast, muchsmaller ratios of Rainbow Smelt biomass : Cisco density andRainbow Smelt biomass : Lake Trout biomass in the western,southern, and eastern regions indicate a situation opposite of thelakewide conditions present in 1955–1978, such that RainbowSmelt stocks are limited by moderate Lake Trout stocks.
Management ImplicationsAlthough our study was limited to Cisco stocks in Lake Su-
perior, we believe that our general findings can be more broadlyapplied (albeit with caution) to the restoration and managementof remnant stocks throughout the Great Lakes basin. Similar tothe study by Rook et al. (2012), we suggest that Ciscoes shouldbe managed as discrete stocks within regions, with the under-standing that large-scale abiotic factors (e.g., temperature andwind speed) influencing recruitment on a lakewide scale (e.g.,>200–300 km) likely drive the recruitment patterns of multiplespatially or genetically discrete spawning stocks. These discretespawning stocks are influenced by biotic factors (e.g., STOCKand Rainbow Smelt biomass) that act on the recruitment pro-cess at much smaller spatial scales (e.g., 50–100 km) but influ-ence recruitment similarly within individual regions. The spatialscale identified for modeling in our study (∼260 km) may be agood starting point for establishing Cisco management regionsthroughout the lower Great Lakes. However, the spatial scalefor recruitment dynamics may be larger or smaller throughoutthe lower Great Lakes, and fishery managers should determinethe range for each individual lake. Fishery managers shouldalso recognize that carrying capacity related to the total areaof suitable rearing habitat (i.e., depths ≤ 90 m) is an importantunderlying factor influencing the absolute recruitment of age-1Ciscoes and that regional differences in compensatory densitydependence related to habitat quality or productivity likely oc-cur throughout the Great Lakes basin, even after accounting forsuitable Cisco rearing habitat area.
Our findings suggest that wind speed during the spring whenCiscoes are hatching (i.e., WINDH) and air temperature duringthe spring when Ciscoes are 11–12 months of age (TEMPY)drive age-1 recruitment in Lake Superior on a lakewide scale,whereas adult spawning stock size (STOCK) and interspecific
Dow
nloa
ded
by [
Ben
jam
in R
ook]
at 1
6:01
22
Nov
embe
r 20
13

LAKE SUPERIOR CISCO RECRUITMENT 1255
interactions with Rainbow Smelt influence age-1 recruitmenton a regional scale. Large-scale abiotic factors are beyond thecontrol of fishery managers, so the harvest of adult Ciscoes andpotential predators and competitors in Lake Superior should becarefully managed to achieve desired goals. Estimates of thespawning stock sizes that produced peak recruitment of age-1 Ciscoes (Smax) in our study may be a good starting pointfor spawning stock size targets. However, underestimation ofSTOCK due to sampling gear biases, consistent overestimationor underestimation of recruitment, and relatively poor model fitin both of our analyses suggest that fishery managers shouldexercise caution when applying the management parametersestimated in our study to stocks in Lake Superior. Similarly,more precise data collected at smaller spatial scales will likelybe required to improve model fit and to provide more preciseparameter estimates in future stock–recruitment modeling.
We recommend that to produce peak age-1 Cisco recruit-ment in Lake Superior, Cisco spawning stock size should bemaintained at minimum densities of 8.9–9.4 spawners/ha inthe western region, 1.3–1.5 spawners/ha in the southern region,0.2 spawners/ha in the eastern region, and 0.7–1.0 spawners/hain the northern region, whereas the biomass of Rainbow Smeltshould be maintained at the lowest levels possible in the northernregion. Fishery managers can only control harvest of adult Cis-coes and Lake Trout, and Cisco abundance in Lake Superior isdriven by highly variable age-1 recruitment and few year-classesof adults (Ebener et al. 2008; Stockwell et al. 2009; Rook et al.2012). Therefore, fishery managers should evaluate the possibleextinction risks associated with the spawning stock size targetsdescribed above and should adjust total allowable catch limits toconserve adult stocks at appropriate levels to prevent overfishingon strong year-classes while managing for moderate Lake Troutstocks that are capable of suppressing Rainbow Smelt stockswithout suppressing Cisco stocks (e.g., Stockwell et al. 2009;Gorman 2012; Yule et al. 2012). This ecosystem-based man-agement approach has been used to restore Cisco populations ininland lakes where the Rainbow Smelt was the dominant zoo-planktivore and the Walleye Sander vitreus was the top piscivore(Krueger and Hrabik 2005), and this approach has already beenlargely successful throughout Lake Superior (Stockwell et al.2009; Gorman 2012; Yule et al. 2012). However, our findingssuggest that Rainbow Smelt continue to limit age-1 Cisco re-cruitment in Lake Superior’s northern region, where RainbowSmelt biomass remains high relative to both age-1 Cisco densityand Lake Trout biomass.
ACKNOWLEDGMENTSWe thank the Great Lakes Fishery Commission for funding
this project. We are grateful to Don Schreiner, Steve Geving,and Ted Halpern (Minnesota Department of Natural Resources),Steve Schram and Mike Seider (Wisconsin Department of Nat-ural Resources), Shawn Sitar (Michigan Department of NaturalResources), Jeff Black and Steve Chong (Ontario Ministry of
Natural Resources), and Bill Mattes (Great Lakes Indian Fishand Wildlife Commission), who made this project possible byproviding assessment and commercial fishery data. Kevin Rus-sell and Eric Anderson provided guidance and valuable discus-sion. We also thank everyone at the U.S. Geological Survey’sLake Superior Biological Station, specifically Dan Yule for pro-viding one very hard-to-find book and Lori Evrard for databasesupport. Karl Ryavec and Al Bond provided desperately neededGIS and programming support. Any use of trade, product, orfirm names is for descriptive purposes only and does not implyendorsement by the U.S. Government. This article is contribu-tion 1799 of the U.S. Geological Survey, Great Lakes ScienceCenter.
REFERENCESAnderson, E. D., and L. L. Smith Jr. 1971. Factors affecting abundance of Lake
Herring (Coregonus artedii Lesueur) in western Lake Superior. Transactionsof the American Fisheries Society 100:691–707.
Anderson, J. T. 1988. A review of size dependent survival during pre-recruitstages of fishes in relation to recruitment. Journal of Northwest AtlanticFishery Science 8:55–66.
Arnold, T. W. 2010. Uninformative parameters and model selection usingAkaike’s information criterion. Journal of Wildlife Management 74:1175–1178.
Assel, R. A. 2005. Great Lakes ice cover climatology update: winters 2003,2004, and 2005. NOAA Technical Memorandum GLERL-135.
Assel, R. A., D. C. Norton, and K. C. Cronk. 2002. A Great Lakes ice cover digi-tal data set for winters 1973–2000. NOAA Technical Memorandum GLERL-121.
Baldwin, N. S., R. W. Saalfeld, M. R. Dochoda, H. J. Buettner, and R. L.Eshenroder. 2006. Commercial fish production in the Great Lakes 1867–2000. Great Lakes Fishery Commission, Ann Arbor, Michigan. Available:www.glfc.org/databases/commercial/commerc.php. (June 2013).
Bennett, E. B. 1978. Characteristics of the thermal regime of Lake Superior.Journal of Great Lakes Research 4:310–319.
Bowen, S. H., D. J. D’Angelo, S. H. Arnold, M. J. Keniry, and R. J. Albrecht.1991. Density-dependent maturation, growth, and female dominance in LakeSuperior Lake Herring (Coregonus artedii). Canadian Journal of Fisheriesand Aquatic Sciences 48:569–576.
Brown, R. W., W. W. Taylor, and R. A. Assel. 1993. Factors affecting the re-cruitment of Lake Whitefish in two areas of northern Lake Michigan. Journalof Great Lakes Research 19:418–428.
Burnham, K. P., and D. R. Anderson. 2002. Model selection and multimodalinference: a practical information-theoretic approach, 2nd edition. Springer-Verlag, New York.
Carl, L. M. 2000. Effects of two planktivores on the fish communities in Precam-brian shield lakes in southern Ontario. Pages 81–89 in V. L. Paragamian andD. W. Willis, editors. Burbot: biology, ecology, and management. AmericanFisheries Society, Fisheries Management Publication 1, Spokane, Washing-ton.
Christie, W. J. 1974. Changes in the fish species composition of the Great Lakes.Journal of the Fisheries Research Board of Canada 31:827–854.
Coffin, A. B., D. L. Pereira, and G. R. Spangler. 2003. Stock-specific growthrates of Lake Herring, Coregonus artedi, in western Lake Superior. Environ-mental Biology of Fishes 68:39–48.
Conner, D. J., C. R. Bronte, J. H. Selgeby, and H. L. Collins. 1993. Food ofsalmonine predators in Lake Superior, 1981–87. Great Lakes Fishery Com-mission Technical Report 59.
Cox, S. P., and J. F. Kitchell. 2004. Lake Superior ecosystem, 1929–1998:simulating alternative hypotheses for recruitment failure of Lake Herring(Coregonus artedi). Bulletin of Marine Science 74:671–683.
Dow
nloa
ded
by [
Ben
jam
in R
ook]
at 1
6:01
22
Nov
embe
r 20
13
1256 ROOK ET AL.
Dryer, W. R., and J. Beil. 1964. Life history of Lake Herring in Lake Superior.U.S. Fish and Wildlife Service Fishery Bulletin 63:493–530.
Ebener, M. P., J. D. Stockwell, D. L. Yule, O. T. Gorman, T. R. Hrabik, R. E.Kinnunen, W. P. Mattes, J. K. Oyadomari, D. R. Schreiner, S. Geving, K.Scribner, S. T. Schram, M. J. Seider, and S. P. Sitar. 2008. Status of Cisco(Coregonus artedi) in Lake Superior during 1970–2006 and management andresearch considerations. Great Lakes Fishery Commission, Lake SuperiorTechnical Report 1, Ann Arbor, Michigan.
Eshenroder, R. L., and M. K. Burnham-Curtis. 1999. Species succession andsustainability of the Great Lakes fish community. Pages 145–184 in W. W.Taylor and C. P. Ferreri, editors. Great Lakes fisheries policy and management:a binational perspective. Michigan State University Press, East Lansing.
Fechhelm, R. G., and D. B. Fissel. 1988. Wind-aided recruitment of CanadianArctic Cisco (Coregonus autumnalis) into Alaskan waters. Canadian Journalof Fisheries and Aquatic Sciences 45:906–910.
Goodyear, C. D., T. A. Edsall, D. M. Ormsby-Dempsey, G. D. Moss, andP. E. Polanski. 1982. Atlas of the spawning and nursery areas of Great Lakesfishes, volume 2: Lake Superior. U.S. Fish and Wildlife Service BiologicalServices Program FWS/OBS-82/52.
Gorman, O. T. 2007. Changes in a population of exotic Rainbow Smelt inLake Superior: boom to bust, 1974–2005. Journal of Great Lakes Research33(Supplement 1):75–90.
Gorman, O. T. 2012. Successional change in the Lake Superior fish community:population trends in Ciscoes, Rainbow Smelt, and Lake Trout, 1958–2008.Advances in Limnology 63:337–362.
Gorman, O. T., L. M. Evrard, M. H. Hoff, and J. H. Selgeby. 2009. Trendsin spring crustacean zooplankton communities of Lake Superior: evidenceof planktivory by Lake Herring. Pages 401–437 in M. Munawar and I. F.Munawar, editors. State of Lake Superior. Aquatic Ecosystem Health andManagement Society, Burlington, Ontario.
Gorman, O. T., D. L. Yule, and J. D. Stockwell. 2012. Habitat use by fishes ofLake Superior: I. diel patterns of habitat use in nearshore and offshore watersof the Apostle Islands region. Aquatic Ecosystem Health and Management15:333–354.
Hayes, D. B., C. P. Ferreri, and W. W. Taylor. 1996. Linking fish habitat to theirpopulation dynamics. Canadian Journal of Fisheries and Aquatic Sciences53(Supplement 1):383–390.
Hilborn, R., and C. J. Walters. 1992. Quantitative fisheries stock assessment:choice, dynamics and uncertainty. Chapman and Hall, New York.
Hile, R. 1936. Age and growth of the Cisco, Leucichthys artedi (Le Sueur), inthe lakes of the northeastern highlands, Wisconsin. U.S. Bureau of FisheriesBulletin 48:211–317.
Hoff, M. H. 2004. Biotic and abiotic factors related to Lake Herring recruitmentin the Wisconsin waters of Lake Superior, 1984–1998. Journal of Great LakesResearch 30(Supplement 1):423–433.
John, K. R., and A. D. Hasler. 1956. Observations on some factors affecting thehatching of eggs and the survival of young shallow-water Cisco, Leucichthysartedi LeSueur, in Lake Mendota, Wisconsin. Limnology and Oceanography1:176–194.
Kinnunen, R. E. 1997. The effect of Lake Superior surface water temperatureon Lake Herring (Coregonus artedi) length and year-class strength. Doctoraldissertation. Michigan Technological University, Houghton.
Krueger, D. M., and T. R. Hrabik. 2005. Food web alterations that promotenative species: the recovery of Cisco (Coregonus artedi) populations throughmanagement of native piscivores. Canadian Journal of Fisheries and AquaticSciences 62:2177–2188.
Latta, W. C. 1995. Distribution and abundance of Lake Herring (Coregonusartedi) in Michigan. Michigan Department of Natural Resources, FisheriesResearch Report 2014, Lansing.
Lawrie, A. H., and J. F. Rahrer. 1973. Lake Superior: a case history of the lakeand its fisheries. Great Lakes Fishery Commission Technical Report 19.
Link, J., J. H. Selgeby, M. H. Hoff, and C. Haskell. 1995. Winter diet of LakeHerring (Coregonus artedi) in western Lake Superior. Journal of Great LakesResearch 21:395–399.
MacCallum, W. R., and J. H. Selgeby. 1987. Lake Superior revisited 1984.Canadian Journal of Fisheries and Aquatic Sciences 44(Supplement 2):23–36.
McLain, A. S., and J. J. Magnuson. 1988. Analysis of recent declines in Cisco(Coregonus artedii) populations in several northern Wisconsin lakes. FinnishFisheries Research 9:155–164.
Mills, E. L., J. M. Casselman, R. Dermott, J. D. Fitzsimons, G. Gal, K. T.Holeck, J. A. Hoyle, O. E. Johannsson, B. F. Lantry, J. C. Makarewicz, E.S. Millard, I. F. Munawar, M. Munawar, R. O’Gorman, R. W. Owens, L. G.Rudstam, T. Schaner, and T. J. Stewart. 2005. A synthesis of ecological andfish-community changes in Lake Ontario, 1970–2000. Great Lakes FisheryCommission Technical Report 67.
Mohr, L. C., and M. P. Ebener. 2005. The coregonine community. Pages 69–76in M. P. Ebener, editor. The state of Lake Huron in 1999. Great Lakes FisheryCommission, Special Publication 05-02, Ann Arbor, Michigan.
Myers, J. T., M. L. Jones, J. D. Stockwell, and D. L. Yule. 2009. Reassessmentof the predatory effects of Rainbow Smelt on Ciscoes in Lake Superior.Transactions of the American Fisheries Society 138:1352–1368.
Myers, R. A. 1991. Recruitment variability and range of three fish species.Northwest Atlantic Fisheries Organization Scientific Council Studies 16:21–24.
Myers, R. A. 2001. Stock and recruitment: generalizations about maximumreproductive rate, density dependence, and variability using meta-analyticapproaches. ICES Journal of Marine Science 58:937–951.
Myers, R. A., B. R. MacKenzie, K. G. Bowen, and N. J. Barrowman. 2001. Whatis the carrying capacity for fish in the ocean? a meta-analysis of populationdynamics of North Atlantic Cod. Canadian Journal of Fisheries and AquaticSciences 58:1464–1476.
NOAA (National Oceanic and Atmospheric Administration). 2008. Sur-face data U.S. monthly and surface data global summary of the day.NOAA, National Climatic Data Center, Asheville, North Carolina. Avail-able: www.ncdc.noaa.gov/oa/ncdc.html. (June 2013).
Nyberg, P., E. Bergstrand, E. Degerman, and O. Enderlein. 2001. Recruitmentof pelagic fish in an unstable climate: studies in Sweden’s four largest lakes.Ambio 30:559–564.
Owen, R. W. 1989. Microscale and finescale variations of small planktonin coastal and pelagic environments. Journal of Marine Research 47:197–240.
Oyadomari, J. K., and N. A. Auer. 2004. Inshore–offshore distribution of lar-val fishes in Lake Superior off the western coast of the Keweenaw Penin-sula, Michigan. Journal of Great Lakes Research 30(Supplement 1):369–384.
Pangle, K. L., T. M. Sutton, R. E. Kinnunen, and M. H. Hoff. 2004. Overwintersurvival of juvenile Lake Herring in relation to body size, physiological con-dition, energy stores, and food ration. Transactions of the American FisheriesSociety 133:1235–1246.
Pritchard, A. L. 1931. Taxonomic and life history studies of the Ciscoes of LakeOntario. University of Toronto Press, Toronto.
Ricker, W. E. 1975. Computation and interpretation of biological statistics offish populations. Fisheries Research Board of Canada Bulletin 191.
Rook, B. J., M. J. Hansen, and O. T. Gorman. 2012. The spatial scale for Ciscorecruitment dynamics in Lake Superior during 1978–2007. North AmericanJournal of Fisheries Management 32:499–514.
Rose, K. A., J. H. Cowan Jr., K. O. Winemiller, R. A. Myers, and R.Hilborn. 2001. Compensatory density dependence in fish populations: impor-tance, controversy, understanding and prognosis. Fish and Fisheries 2:293–327.
Rudstam, L. G., R. C. Lathrop, and S. R. Carpenter. 1993. The rise and fall ofa dominant planktivore: direct and indirect effects on zooplankton. Ecology74:303–319.
Scott, W. B. 1951. Fluctuations in abundance of the Lake Erie Cisco (Leucichthysartedi) population. Royal Ontario Museum of Zoology Contributions 32.
Scott, W. B., and E. J. Crossman. 1973. Freshwater fishes of Canada. FisheriesResearch Board of Canada Bulletin 184.
Dow
nloa
ded
by [
Ben
jam
in R
ook]
at 1
6:01
22
Nov
embe
r 20
13

LAKE SUPERIOR CISCO RECRUITMENT 1257
Selgeby, J. H., W. R. MacCallum, and D. V. Swedberg. 1978. Predation byRainbow Smelt (Osmerus mordax) on Lake Herring (Coregonus artedii) inwestern Lake Superior. Journal of the Fisheries Research Board of Canada35:1457–1463.
Smith, S. H. 1956. Life history of Lake Herring of Green Bay, Lake Michigan.U.S. Fish and Wildlife Service Fishery Bulletin 57:87–138.
Smith, S. H. 1995. Early changes in the fish community of Lake Ontario. GreatLakes Fishery Commission Technical Report 60.
Stockwell, J. D., M. P. Ebener, J. A. Black, O. T. Gorman, T. R. Hrabik, R.E. Kinnunen, W. P. Mattes, J. K. Oyadomari, S. T. Schram, D. R. Schreiner,M. J. Seider, S. P. Sitar, and D. L. Yule. 2009. A synthesis of Cisco recoveryin Lake Superior: implications for native fish rehabilitation in the LaurentianGreat Lakes. North American Journal of Fisheries Management 29:626–652.
Stockwell, J. D., D. L. Yule, O. T. Gorman, E. J. Isaac, and S. A. Moore. 2006.Evaluation of bottom trawls as compared to acoustics to assess adult LakeHerring (Coregonus artedi) abundance in Lake Superior. Journal of GreatLakes Research 32:280–292.
Sundby, S., B. Ellertsen, and P. Fossum. 1994. Encounter rates between first-feeding cod larvae and their prey during moderate to strong turbulent mixing.ICES Marine Science Symposia 198:393–405.
Swenson, W. A., and B. Heist. 1981. Optimizing yield from western LakeSuperior commercial fisheries through smelt stock assessment. University ofWisconsin, Sea Grant Institute, Final Report R/LR-8, Madison.
Taylor, W. W., M. A. Smale, and M. H. Freeberg. 1987. Biotic and abiotic deter-minants of Lake Whitefish (Coregonus clupeaformis) recruitment in north-eastern Lake Michigan. Canadian Journal of Fisheries and Aquatic Sciences44(Supplement 2):313–323.
Toneys, M. L., and D. W. Coble. 1979. Size-related, first winter mortality offreshwater fishes. Transactions of the American Fisheries Society 108:415–419.
Wells, L., and A. L. McLain. 1973. Lake Michigan: man’s effects on native fishstocks and other biota. Great Lakes Fishery Commission Technical Report20.
Wilkinson, L., L. Engelman, and R. Marcantonio. 2004. Correlations, sim-ilarities, and distance measures. Pages 123–156 in L. Wilkinson, editor.SYSTAT R© 11 Statistics 1. SYSTAT R© Software, Point Richmond, Califor-nia.
Yule, D. L., D. R. Schreiner, P. A. Addison, M. J. Seider, L. M. Evrard, S. A.Geving, and H. R. Quinlan. 2012. Repeat surveys of spawning Cisco (Core-gonus artedi) in western Lake Superior: timing, distribution and compositionof spawning stocks. Advances in Limnology 63:65–87.
Dow
nloa
ded
by [
Ben
jam
in R
ook]
at 1
6:01
22
Nov
embe
r 20
13
Copyright © 2022 FDOKUMEN