Laterality, heart rate and EEG as measurements of animal ...
Upload
eastangliaCategory
view
0download
0
and Mark R. BoyettZhangWang, Mahesh Nirmalan, Ulrik Wisloff, Victor A. Maltsev, Edward G. Lakatta, Henggui
Oliver Monfredi, Alexey E. Lyashkov, Anne-Berit Johnsen, Shin Inada, Heiko Schneider, RuoxiBetween Heart Rate Variability and Heart Rate
Biophysical Characterization of the Underappreciated and Important Relationship
Print ISSN: 0194-911X. Online ISSN: 1524-4563 Copyright © 2014 American Heart Association, Inc. All rights reserved.
is published by the American Heart Association, 7272 Greenville Avenue, Dallas, TX 75231Hypertension published online September 15, 2014;Hypertension.
http://hyper.ahajournals.org/content/early/2014/09/15/HYPERTENSIONAHA.114.03782World Wide Web at:
The online version of this article, along with updated information and services, is located on the
http://hyper.ahajournals.org/content/suppl/2014/09/15/HYPERTENSIONAHA.114.03782.DC1.htmlData Supplement (unedited) at:
http://hyper.ahajournals.org//subscriptions/
is online at: Hypertension Information about subscribing to Subscriptions:
http://www.lww.com/reprints Information about reprints can be found online at: Reprints:
document. Permissions and Rights Question and Answer this process is available in the
click Request Permissions in the middle column of the Web page under Services. Further information aboutOffice. Once the online version of the published article for which permission is being requested is located,
can be obtained via RightsLink, a service of the Copyright Clearance Center, not the EditorialHypertensionin Requests for permissions to reproduce figures, tables, or portions of articles originally publishedPermissions:
at University of Manchester (man) / England on November 13, 2014http://hyper.ahajournals.org/Downloaded from at University of Manchester (man) / England on November 13, 2014http://hyper.ahajournals.org/Downloaded from at University of Manchester (man) / England on November 13, 2014http://hyper.ahajournals.org/Downloaded from at University of Manchester (man) / England on November 13, 2014http://hyper.ahajournals.org/Downloaded from at University of Manchester (man) / England on November 13, 2014http://hyper.ahajournals.org/Downloaded from at University of Manchester (man) / England on November 13, 2014http://hyper.ahajournals.org/Downloaded from at University of Manchester (man) / England on November 13, 2014http://hyper.ahajournals.org/Downloaded from at University of Manchester (man) / England on November 13, 2014http://hyper.ahajournals.org/Downloaded from at University of Manchester (man) / England on November 13, 2014http://hyper.ahajournals.org/Downloaded from at University of Manchester (man) / England on November 13, 2014http://hyper.ahajournals.org/Downloaded from at University of Manchester (man) / England on November 13, 2014http://hyper.ahajournals.org/Downloaded from at University of Manchester (man) / England on November 13, 2014http://hyper.ahajournals.org/Downloaded from at University of Manchester (man) / England on November 13, 2014http://hyper.ahajournals.org/Downloaded from at University of Manchester (man) / England on November 13, 2014http://hyper.ahajournals.org/Downloaded from at University of Manchester (man) / England on November 13, 2014http://hyper.ahajournals.org/Downloaded from at University of Manchester (man) / England on November 13, 2014http://hyper.ahajournals.org/Downloaded from at University of Manchester (man) / England on November 13, 2014http://hyper.ahajournals.org/Downloaded from at University of Manchester (man) / England on November 13, 2014http://hyper.ahajournals.org/Downloaded from
1
Early scientists thought that the heart beat was metronomic until in 1733, Reverend Stephen Hales1 made the observa-
tion that the pulse rate varied with respiration. In the 1960s, advances in ECG recording allowed quantification of beat-to-beat variation in to R-wave interval (R-R interval) dubbed heart rate (HR) variability (HRV).2 Thereafter, an explosion of inves-tigation into HRV occurred—PubMed currently lists >17 000 HRV-related articles. Diverse parameters describing different characteristics of HRV have been proposed.3 In the general population, having a low HRV is associated with increased morbidity and mortality from various causes, not all cardiac.4 For example, Dekker et al5 demonstrated that decreased HRV was a predictor of death from all causes, including cancer. There is ample evidence too of changes in HRV that occur in response to disease, both cardiac and noncardiac. For example, decreased HRV is correlated to higher morbidity and mortal-ity in patients following myocardial infarction.6 In addition to ischemic heart disease, significant changes in HRV are also documented in many other common conditions, including
heart failure, hypertension, before arrhythmia onset, left ven-tricular hypertrophy, hypertrophic cardiomyopathy, and in noncardiac conditions, including sepsis, fetal distress, diabe-tes mellitus, stroke, depression, and obstructive airways dis-ease (for review, see Billman2). HRV was heralded as a useful noninvasive method for predicting clinical risk in these diverse disease states.
Underlying HRV is thought to be fluctuating behavior in the limbs of the cardiac autonomic nervous system. Before the advent of HRV, the ability of scientists and physicians to noninvasively estimate cardiac autonomic innervation was limited. A significant literature concerning HRV from bench to bedside continues to be produced today.
In this study, we have investigated HRV in a variety of spe-cies and cardiac preparations. Our results argue that, rather than being a pure marker of cardiac autonomic nervous sys-tem activity, HRV is primarily dependent on HR, with HRV increasing when the R-R interval increases (ie, when HR slows) and decreasing when the R-R interval decreases (ie,
Abstract—Heart rate (HR) variability (HRV; beat-to-beat changes in the R-wave to R-wave interval) has attracted considerable attention during the past 30+ years (PubMed currently lists >17 000 publications). Clinically, a decrease in HRV is correlated to higher morbidity and mortality in diverse conditions, from heart disease to fetal distress. It is usually attributed to fluctuation in cardiac autonomic nerve activity. We calculated HRV parameters from a variety of cardiac preparations (including humans, living animals, Langendorff-perfused heart, and single sinoatrial nodal cell) in diverse species, combining this with data from previously published articles. We show that regardless of conditions, there is a universal exponential decay-like relationship between HRV and HR. Using 2 biophysical models, we develop a theory for this and confirm that HRV is primarily dependent on HR and cannot be used in any simple way to assess autonomic nerve activity to the heart. We suggest that the correlation between a change in HRV and altered morbidity and mortality is substantially attributable to the concurrent change in HR. This calls for re-evaluation of the findings from many articles that have not adjusted properly or at all for HR differences when comparing HRV in multiple circumstances. (Hypertension. 2014;64:00-00.) Online Data Supplement
Key Words: autonomic nervous system ion channels physiology sinoatrial node
Received May 1, 2014; first decision May 21, 2014; revision accepted August 14, 2014.From the Institute of Cardiovascular Sciences, University of Manchester, Manchester, United Kingdom (O.M., H.S., M.N., M.R.B.); Laboratory of
Cardiovascular Science, National Institute on Aging—Intramural Research Program, National Institutes of Health, Baltimore, MD (O.M., A.E.L., V.A.M., E.G.L.); K.G. Jebsen Center of Exercise in Medicine at Department of Circulation and Medical Imaging, Norwegian University of Science and Technology, Trondheim, Norway (A.-B.J., U.W.); Laboratory of Biomedical Sciences and Information Management, National Cerebral and Cardiovascular Center, Osaka, Japan (S.I.); and Biological Physics Group, University of Manchester, Manchester, United Kingdom (R.W., H.Z.).
The online-only Data Supplement is available with this article at http://hyper.ahajournals.org/lookup/suppl/doi:10.1161/HYPERTENSIONAHA. 114.03782/-/DC1.
Correspondence to Oliver Monfredi, Institute of Cardiovascular Sciences, Core Technology Facility, University of Manchester, 46 Grafton St, Manchester M13 9NT, United Kingdom. E-mail [email protected]
Biophysical Characterization of the Underappreciated and Important Relationship Between Heart Rate Variability
and Heart RateOliver Monfredi, Alexey E. Lyashkov, Anne-Berit Johnsen, Shin Inada, Heiko Schneider,
Ruoxi Wang, Mahesh Nirmalan, Ulrik Wisloff, Victor A. Maltsev, Edward G. Lakatta, Henggui Zhang, Mark R. Boyett
© 2014 American Heart Association, Inc.
Hypertension is available at http://hyper.ahajournals.org DOI: 10.1161/HYPERTENSIONAHA.114.03782
Original Article
at University of Manchester (man) / England on November 13, 2014http://hyper.ahajournals.org/Downloaded from

2 Hypertension December 2014
when HR quickens). This lends weight to the theory that the correlation between a decrease in HRV and higher morbidity and mortality is the consequence of the concurrent increase in HR. It follows that observed differences in HRV between ≥2 scenarios should, therefore, always take into account the HR present when HRV was measured, otherwise conclusions drawn may be flawed.
MethodsExperiments performed for this study focused on 3 different cardiac preparations: the conscious in vivo human and rat, isolated denervated Langendorff-perfused heart (rabbit, rat), and isolated sinoatrial node cell (SANC, rabbit). The species used in each of these situations var-ied, as did the experimental conditions used, and these are described in the online-only Data Supplement. Human studies were approved by the local ethics committee at the Manchester Royal Infirmary, and subjects gave their informed consent. Studies on the rat in vivo were approved by the Norwegian Council for Animal Research; the protocol used had the ID number 1980 and was performed in accor-dance with the Guide for the Care and Use of Laboratory Animals by the European Commission Directive 86/609/ECC. Studies on the Langendorff-perfused rabbit and rat heart were performed in accor-dance with the Animals (Scientific Procedures) Act 1986 from the UK Home Office, with animals being euthanized using approved Schedule 1 procedures. Studies on the isolated SANC from the rabbit were conducted in accordance with the National Institutes of Health Guide for the Care and Use of Laboratory Animals.
HRV AnalysisContinuous recordings of single-channel ECG data from the con-scious human or rat and the isolated rabbit and rat Langendorff-perfused heart and spontaneous action potentials recorded from the isolated rabbit SANC were subjected to HRV analysis in multiple domains along identical lines, as detailed in the online-only Data Supplement. Stationary time epochs of 2·5 minutes (150 s) were used. Because of the varying HRs in different species, the number of data points differed among species. We repeated the data analysis with a fixed number of data points (500 heart beats) and did not observe significant differences in the results compared with the analysis using fixed time epochs of 2.5 minutes (data not shown). For simplicity, only the SD of normal beat to normal beat intervals (SDNN) and root mean square of successive differences (RMSSD) are presented as parameters reflecting HRV herein.
Computer ModelingThe deterministic ordinary differential equation model for the electro-physiology of a rabbit central SANC by Zhang et al7 was implemented in this study for the advanced computer modeling. Further details of the model are given in the online-only Data Supplement.
ResultsWe measured baseline HRV in the conscious human (n=11) and rat (n=11), isolated denervated Langendorff-perfused heart from the rabbit (n=58) and rat (n=8), and isolated dener-vated rabbit SANC (n=67). Figure 1A to 1E shows tacho-grams for the different preparations, demonstrating marked differences in HRV under baseline conditions; the data are summarized in Figure 1F to 1H. Corresponding power spectra and total power summary data are shown in Figure S1 in the online-only Data Supplement. HRV as a result of fluctuation in autonomic nerve activity is expected to be present in the conscious animal, but absent in the isolated denervated prepa-rations; however, the pattern of HRV did not conform to this assumption. As expected, HRV in terms of SDNN, RMSSD, and total power was high in the conscious human (Figure 1A,
1G, and 1H and Figure S1) and low in the isolated denervated preparations (Figure 1B–1D, 1G, and 1H and Figure S1). However, in the conscious rat with an intact autonomic ner-vous system, HRV was also low (Figure 1E, 1G, and 1H and Figure S1). The baseline cycle length (CL; same as R-R or NN interval) also varied widely between preparations (Figure 1F). The preparation with the longest CL was the conscious human (mean±SEM, 839±50 ms). The Langendorff-perfused rab-bit heart (428±10 ms) and rabbit SANC (327±7 ms) had the next-longest CLs, followed by the Langendorff-perfused rat heart (229±8 ms). The preparation with the shortest CL was the conscious rat (161±4 ms). Below we argue that HRV is strongly dependent on CL: the shorter the CL, the less the HRV. This explains the low HRV in the conscious rat, which had the shortest CL (Figure 1E and 1F). However, there is not a perfect correspondence between HRV and CL: the HRV in the 2 Langendorff heart preparations is lower than expected on the basis of CL alone. We re-examine the differences in baseline HRV in the 5 preparations in Figure 5A.
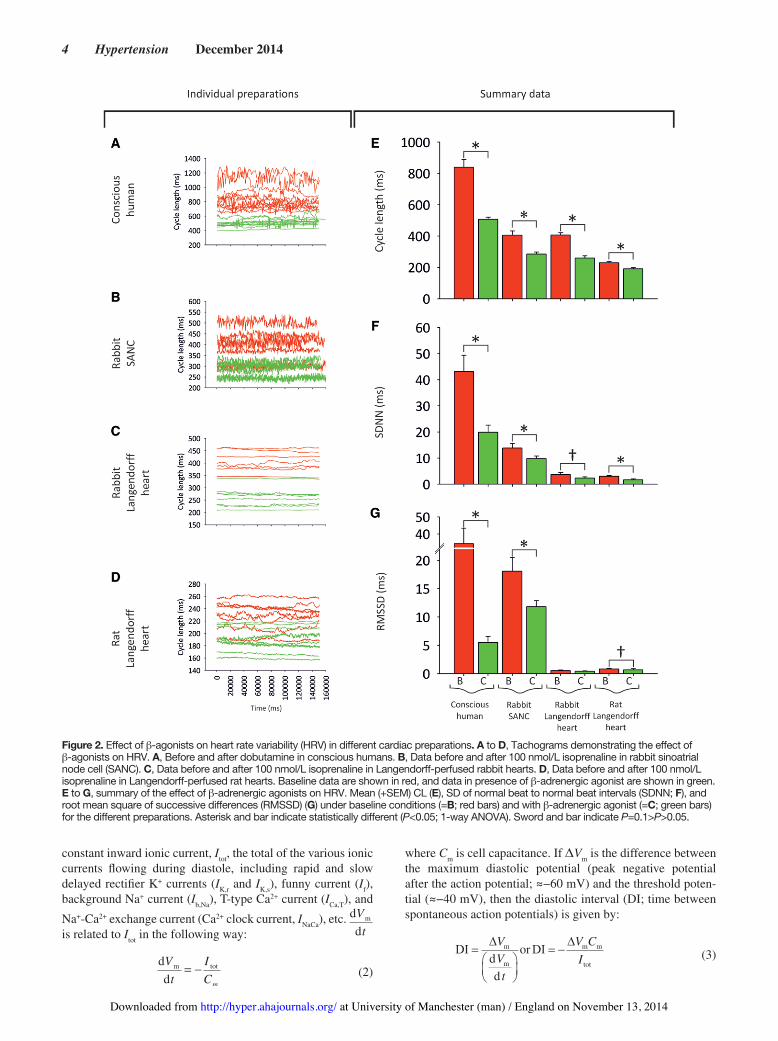
Despite clear interpreparation differences in HRV, β-adrenergic stimulation has the same effect on HRV in the conscious animal, isolated denervated heart, and iso-lated denervated SANC: Figure 2A shows the effect of the β-adrenergic agonist, dobutamine, on the CL and HRV in the conscious human (n=11). As expected, dobutamine caused a dramatic decrease in the CL (Figure 2A and 2E) and along with it a decrease in measured parameters of HRV (Figure 2F and 2G). The effect of β-adrenergic stimulation (using isoprena-line as the agonist) was also investigated in the rabbit SANC (Figure 2B) and in the Langendorff-perfused rabbit (Figure 2C) and rat (Figure 2D) heart. β-Adrenergic stimulation had a simi-lar effect on CL, causing it to significantly shorten in all prepa-rations studied (Figure 2E). It also had a similar effect on HRV, causing it to decrease in all preparations studied (Figure 2F and 2G). Could the decrease in HRV in all preparations simply be accounted for by the decrease in CL?
Relationship Between HRV and HRFigure 3A summarizes all data obtained from the conscious human and rat, the Langendorff-perfused rabbit and rat heart, and the rabbit SANC: SDNN is used as the param-eter of HRV and is plotted against HR. Figure 3B shows the same data, but only up to HRs of 240 bpm. Figure 3A and 3B also shows data from many other studies, includ-ing data from the healthy conscious human, athletically trained conscious human, conscious human exposed to autonomic blockade, conscious human with heart failure, conscious human with hypertrophic cardiomyopathy, con-scious human with myocardial infarction, conscious human heart transplant recipient, conscious mouse (wild type and transgenic), and rabbit SANC (control and exposed to ace-tylcholine)—see online-only Data Supplement for details of studies included. Despite the fact that the SDNN (along with other HRV parameters) will have been measured in dif-ferent ways (over different sampling time periods, for exam-ple) and that the data are from different species, different preparations, different disease states, different conditions, and different laboratories, all the data are clustered and approximately fall along a common exponential decay-like
at University of Manchester (man) / England on November 13, 2014http://hyper.ahajournals.org/Downloaded from

Monfredi et al Heart Rate Variability and Heart Rate 3
curve: there is an exponential decay-like decrease in SDNN when HR increases (Figure 3A and 3B). Figure S2 shows that subgroups of the data in Figure 3A and 3B show the same relationship between HRV and HR as the whole data (Figure 3A and 3B). Figure 3C shows a semilogarithmic plot of the same data: the natural logarithm of the SDNN is plotted against the HR and there is a linear relationship, as is expected for an exponential decay-like process; it can be calculated from this linear relationship that for every 10 bpm increase in HR, logn(SDNN) decreases by 0.169 ms (SEE=0.41; R2=0.68). It follows that the SDNN at a given HR is given by the following:
SDNN SDNNreference
58.8=−
−( )
reference eHR HR
(1)
where SDNN reference is the SDNN at a reference HR, HRreference.
A Simple Mathematical Model of the Relationship Between HRV and HRIn the sinoatrial node, the membrane depolarizes throughout diastole (the pacemaker potential). If the pacemaker poten-tial is monophasic, the rate of change of membrane poten-
tial, dd
mVt
, is roughly constant. This is driven by a roughly
Figure 1. Differences in heart rate variability (HRV) among different cardiac preparations (baseline conditions). A to E, Tachograms (150-s stationary epochs) from (A) conscious human (n=11), (B) Langendorff-perfused rabbit heart (n=58), (C) rabbit sinoatrial node cell (SANC; n=67), (D) Langendorff-perfused rat heart (n=8), (E) conscious rat (n=11). Individual experiments are plotted in unique colours. F to H, Summary of baseline differences in cycle length (CL) and HRV among cardiac preparations. Mean (+SEM) CL (F), SD of normal beat to normal beat intervals (SDNN; G), and root mean square of successive differences (RMSSD) (H) for different preparations. Asterisk and letters atop bars demonstrate statistically significant differences from other lettered bars (P<0.05; 1-way ANOVA).
at University of Manchester (man) / England on November 13, 2014http://hyper.ahajournals.org/Downloaded from
4 Hypertension December 2014
constant inward ionic current, Itot, the total of the various ionic currents flowing during diastole, including rapid and slow delayed rectifier K+ currents (IK,r and IK,s), funny current (If), background Na+ current (Ib,Na), T-type Ca2+ current (ICa,T), and
Na+-Ca2+ exchange current (Ca2+ clock current, INaCa), etc. dd
mVt
is related to Itot in the following way:
dd
m totVt
ICm
= −
(2)
where Cm is cell capacitance. If ∆Vm is the difference between the maximum diastolic potential (peak negative potential after the action potential; ≈−60 mV) and the threshold poten-tial (≈−40 mV), then the diastolic interval (DI; time between spontaneous action potentials) is given by:
DI DI=⎛⎝⎜
⎞⎠⎟
= −∆ ∆VVt
V CI
m
m
m m
totdd
or
(3)
Figure 2. Effect of β-agonists on heart rate variability (HRV) in different cardiac preparations. A to D, Tachograms demonstrating the effect of β-agonists on HRV. A, Before and after dobutamine in conscious humans. B, Data before and after 100 nmol/L isoprenaline in rabbit sinoatrial node cell (SANC). C, Data before and after 100 nmol/L isoprenaline in Langendorff-perfused rabbit hearts. D, Data before and after 100 nmol/L isoprenaline in Langendorff-perfused rat hearts. Baseline data are shown in red, and data in presence of β-adrenergic agonist are shown in green. E to G, summary of the effect of β-adrenergic agonists on HRV. Mean (+SEM) CL (E), SD of normal beat to normal beat intervals (SDNN; F), and root mean square of successive differences (RMSSD) (G) under baseline conditions (=B; red bars) and with β-adrenergic agonist (=C; green bars) for the different preparations. Asterisk and bar indicate statistically different (P<0.05; 1-way ANOVA). Sword and bar indicate P=0.1>P>0.05.
at University of Manchester (man) / England on November 13, 2014http://hyper.ahajournals.org/Downloaded from

Monfredi et al Heart Rate Variability and Heart Rate 5
Consider a fluctuating perturbing force that results in HRV (perhaps a change in autonomic nerve activity in the con-scious animal, some unknown process in the isolated heart, or a fluctuation in the Ca2+ clock in the isolated SANC). This results in a fluctuating ionic current, Iper (perhaps acetylcho-line-activated K+ current, IK,ACh, or INaCa; the nature of Iper is speculated on further in the online-only Data Supplement), across the SANC membrane. During diastole (ie, the pace-
maker potential), this will change dd
mVt
. The change in dd
mVt
,
that is, ∆ dd
mVt
, is given by:
∆ dd
m per
m
Vt
I
C= − (4)
If one assumes that Itot and Iper are constant throughout the pacemaker potential, the rate of change of membrane potential
during the pacemaker potential will now be dd
dd
m mVt
Vt
+ ∆ , in
other words − −IC
I
Ctot
m
per
m
, or −⎛⎝⎜
⎞⎠⎟
+I I
Ctot per
m
. This will result in a
change in DI (∆DI):
∆ ∆ ∆ ∆ ∆DI DI= −+
= −+
⎛
⎝⎜
V CI
V CI I
V CI I I
m m
tot
m m
tot perm m
tot tot per
or1 1
⎜⎜⎞
⎠⎟⎟
(5)
Because CL = DI + APD, (6)
where APD is action potential duration, there will be a change in CL (∆CL) which will be the same as the change in DI, that is, ∆CL=∆DI (assuming APD is constant). Iper fluctuates from beat to beat (thus explaining HRV). If it is assumed that during a single DI the amplitude of Iper is sufficient to change the CL by 1 SD, then (from Equations 5 and 6):
SDNN = − −+
⎛
⎝⎜⎜
⎞
⎠⎟⎟∆V C
I I Im mtot tot per
1 1
(7)
An increase in HR (decrease in CL) is achieved by an increase in Itot (from 30 to 100 bpm, calculation using Equations 3 and 6 shows that Itot will increase ≈4·2 times, from −0.22 to −0.91 pA). Equation 6 shows that as the HR increases (ie, as
Itot increases), the SDNN decreases, because 1 1
I I Itot tot per
−+
⎛
⎝⎜
⎞
⎠⎟
will tend to zero. Equation 7 was solved numerically assuming that ∆Vm=20 mV, Cm=20 pF, and Iper=0.085 pA. HR was calcu-lated from the CL given by Equations 3, 5, and 6 (APD assumed to be 160 ms). The solid line in Figure 3A and 3B shows the calculated relationship between the SDNN and HR based on
Figure 3. Relationship between heart rate variability (HRV; SD of normal beat to normal beat intervals [SDNN]) and heart rate: comparison of theory and experiment. A, Relationship between SDNN and heart rate. Data from experiments undertaken in this article and elsewhere, and our mathematical models are plotted. Basic key under A; for detailed key, see online-only Data Supplement. B, Relationship between SDNN and heart rate (heart rate range, 40–240 bpm only). C, Relationship between logn(SDNN) and heart rate (same data as A). Black line shows that for every 10 bpm increase in heart rate, logn(SDNN) decreases by 0.17 ms.
at University of Manchester (man) / England on November 13, 2014http://hyper.ahajournals.org/Downloaded from

6 Hypertension December 2014
this model. It is a steep exponential decay-like relationship and the line goes through the majority of the experimentally mea-sured points. This suggests that HR is a major determinant of the changes in HRV in the clinical and experimental studies.
The model highlights 2 reasons for the decrease in SDNN at high HRs. These reasons are robust and model independent.
First, a perturbing influence will produce a change in dd
mVt
that
is likely to be roughly constant at all rates, and a change in slope of the pacemaker potential will obviously have a greater effect on the DI at longer baseline DIs. Second, the relation-ship between DI (SDNN is a DI) and HR is nonlinear and hyperbolic, because the 2 are inversely related. This acts to steepen the relationship between SDNN and HR.
Figure S3 shows the effect of Iper on the calculated relation-ship between HRV in terms of SDNN and HR: an increase in Iper effectively shifts the curve to higher HRs.
Relationship Between HRV and HR as Determined by a Biophysically Detailed ModelTo confirm the dependence of HRV on HR, simulations were per-formed using a biophysically detailed model of the sinoatrial node action potential. The model of a rabbit central SANC (with Cm=20 pF) from Zhang et al7 was used. Figure 4Ai shows simulated pace-maker action potentials with no perturbing current (red traces), and with a perturbing current (green traces). The maximum Iper was 20 pA, but the average value of Iper was 0.132 pA, similar to the value of Iper used in the simple model. Figure 4Aii shows the corresponding tachogram. The pacemaker rate of the model was modulated by changing the modeled acetylcholine concen-tration (0–0.04 μmol/L). The maximum amplitude of Iper (20 pA) was kept constant. The pacemaker rate was fastest in Figure 4A (acetylcholine concentration, 0 μmol/L) and slowest in Figure 4C (acetylcholine concentration, 0.04 μmol/L). In the absence of ace-tylcholine, when the pacemaker rate was high, the perturbing cur-rent produced a small beat-to-beat change in the CL (Figure 4Ai). When the pacemaker rate was slowed by acetylcholine, the identi-cal perturbing current produced a greater beat-to-beat change in CL (Figure 4Ci). The tachograms from the simulations confirm that the HRV was greater at the slower HRs (Figure 4A–4Cii). The calculated SDNN from the model is plotted against the HR in Figure 4D. The data from Figure 4 are shown in Figure 3A as gray squares. It is clear that they fall comfortably within the scatter of clinical and experimental data points.
A Detailed Analysis of Changes in HRV in Different Preparations at Baseline and With β-Adrenergic StimulationWith the above considerations in mind, we were able to pro-duce curves of expected change in SDNN with HR (shown as the green lines in Figure 5) and compare these with experimen-tally observed changes in HRV, to determine whether an exper-imentally observed difference in HRV (in terms of SDNN) between 2 experimental conditions can be explained simply by the difference in HR. Figure 5A shows the relationship between SDNN and HR in several different experimental preparations: the conscious human and rat, Langendorff-perfused rabbit and rat heart, and rabbit SANC (same data as shown in Figure 1).
The green line demonstrates the expected change in SDNN with HR (based on a decrease in logn(SDNN) of 0.169 ms for every 10 bpm increase in HR, as calculated from Figure 3C), arbitrarily using data for the conscious human as the starting point (thus explaining why the line passes exactly through the conscious human data point; the choice of starting point makes no difference to the analysis). It is apparent that the decrease in HRV in the rabbit SANC, Langendorff-perfused rat heart, and conscious rat can be largely accounted for by the higher HR in these preparations (the data points lie above the green line). However, the decrease in HRV in the Langendorff-perfused rabbit heart may not be completely accounted for by the higher HR in this preparation (the point lies below the green line).
Figure 5B to 5E shows a similar analysis of the effect of β-stimulation on HRV in the conscious human (Figure 5B), rabbit SANC (Figure 5C), and Langendorff-perfused rab-bit (Figure 5D) and rat (Figure 5E) heart. In each case, the decrease in HRV seen following exposure to catecholamine can be completely explained by the increase in HR (the dobu-tamine/isoprenaline points lie on or above the green lines). Such an understanding of the expected change in HRV where HR is different between experimental preparations or condi-tions is essential when trying to determine whether there is an HR-independent difference in HRV between ≥2 situations.
Figure 5 is a graphical method of correcting for changes in HR. It is also possible to correct for HR numerically:
cSDNNSDNN
=e 58.8−
HR
(8)
where cSDNN is the corrected SDNN (at an HR of 0 bpm). Figure S4 shows that it is possible to eliminate the HR depen-dence of the HRV data in Figure 3 using this correction factor. Equation 8 can be rewritten to give corrected SDNNref at any reference HR (HRref):
SDNNSDNN
ref
.eref
= −( )HR HR
58 8
(9)
DiscussionWe have demonstrated in detail that substantial HRV exists in isolated cardiac preparations without autonomic con-nections. This HRV exists under baseline conditions and is modified by drugs that modify beating rate, including expo-sure to a β-adrenergic agonist. We have shown that regardless of species, preparation, conditions, method of determina-tion, and laboratory, there is a unique exponential decay-like relationship between HRV (as measured by the SDNN) and HR (Figure 3). This is true both in the healthy and diseased heart. Using mathematical modeling, we propose a biophysi-cal explanation for the relationship between HRV and HR: at high HRs, the ratio of the perturbing current, Iper (regardless of its nature), to the intrinsic ionic current, Itot, driving the pace-maker potential becomes vanishingly small and the effect of Iper becomes negligible. This can be stated in another way: Iper will change the slope of the pacemaker potential by roughly the same amount regardless of rate; the effect of this change will be smaller the higher the HR. As such, HRV is primar-ily dependent on HR and cannot be used in any simple way
at University of Manchester (man) / England on November 13, 2014http://hyper.ahajournals.org/Downloaded from

Monfredi et al Heart Rate Variability and Heart Rate 7
to assess autonomic nerve activity to the heart. Although our analysis has focused on SDNN, our arguments are germane to many commonly used methods to measure HRV.
Earlier Indications of a Relationship Between HRV and HRIt has long been suspected that HR has a significant effect on HRV. Mangin et al8 studied this relationship in conscious
rats, showing that SDNN, RMSSD, and the sum of low- and high-frequency power are all significantly correlated with CL. Coumel et al9 also demonstrated a significant relation-ship between SDNN and HR (correlation coefficient, 0.79). Neither of these studies quantitatively established the impact of HR on HRV. Zaza and Lombardi,10 however, did. Using iso-lated rabbit SANCs and modifying HR using acetylcholine, they were able to demonstrate that the relationship between
Figure 4. Relationship between heart rate variability (HRV) and heart rate predicted by a biophysically detailed model. Computed action potentials from a sinoatrial node cell (SANC) model with (green) and without (red) a maximum 20-pA perturbing current (Iper) at fast (top, eg, Ai) to slow (bottom, eg, Ci) rates, and corresponding tachograms (Aii–Cii). Rate was varied by altering ACh-activated K+ current (IK,ACh). D, Relationship between SD of normal beat to normal beat intervals (SDNN) and heart rate in this model.
at University of Manchester (man) / England on November 13, 2014http://hyper.ahajournals.org/Downloaded from

8 Hypertension December 2014
concentration of acetylcholine and CL was not linear, nor was the relationship between CL and diastolic depolarization rate.10 This hinted at a strong rate dependency of several com-monly used indices of HRV, including SDNN. Despite this article being published >10 years ago, there continues to be a marked underappreciation of this relationship. Our work aims to further clarify the importance of this and the need to make allowances for it.
Zaza and and Lombardi10 used model data to calculate that logn(SDNN) decreases by 0.17 ms for every 10 bpm increase in HR. Similarly, Tsuji et al11,12 used 2-hour snapshots of ambulatory cardiac monitoring to define that logn(SDNN) decreased by 0.16 ms for every 10 bpm increase in HR. In our study, logn(SDNN) decreased by 0.169 ms for every 10 bpm increase in HR (Figure 3B). The similarity of these numbers
demonstrates the highly conserved relationship between HRV and HR. Similarly, our simple model predicts that logn(SDNN) decreases by 0.24 ms per 10 beat/min increase in HR (Figure 3A and 3B, solid line).
Sacha and Pluta13 have pointed out that the variation in CL (R-R interval) for a given variation in HR is greater at slower HRs, because of the inverse relationship between HR and CL, and suggested a correction procedure, which could eliminate this effect. We agree that this is one reason why SDNN varies with HR, as stated above it acts to steepen the relationship between SDNN and HR. However, the primary reason why SDNN varies with HR is the nonlinear relation-ship between the change in CL (∆CL) and CL (for a given Iper): the correction procedure from Sacha and Pluta13 does not take this into account.
Figure 5. Application of a correcting factor facilitates clarification of whether changes in heart rate variability (HRV) are attributable to heart rate differences alone. Analysis of baseline differences in HRV among different preparations (A); analysis of changes in HRV after administration of β-agonists to different preparations (B–E). SD of normal beat to normal beat intervals (SDNN) is plotted against heart rate. Predicted effect of heart rate on SDNN is plotted (green lines) using calculated correcting factor from Figure 3C. Conscious human data (A) or baseline data (B–E) are arbitrarily used as starting point from which to calculate the effect of heart rate on SDNN.
at University of Manchester (man) / England on November 13, 2014http://hyper.ahajournals.org/Downloaded from
Monfredi et al Heart Rate Variability and Heart Rate 9
Multiple nonlinear methods for the interpretation of HRV have been developed during the past several years (eg, approx-imate entropy),14 yet their take-up has been limited. It remains unclear whether these do indeed give a true HR-independent means with which to assess HRV.
Can HRV Be Corrected for the Effect of HR?Previously, several authors have attempted to correct for the effect of HR on HRV by normalizing HRV parameters by simply dividing them by the HR at that point in time (eg, Hayano et al15). Such linear corrections are inadequate to cor-rect the nonlinear relationship between HRV and HR. This is demonstrated by Figure S5. In the power spectrum of HRV, the high-frequency band is said to represent parasympathetic activity, the low-frequency (at least in part) sympathetic activ-ity.3 Via the mechanisms proposed in the present study, HR is expected to affect both frequency components equally. Some investigators argue that the ratio of the high-frequency to low-frequency components is the best measure of autonomic nerve activity to the heart,10 and undoubtedly the mechanisms pro-posed in the present study are not expected to affect this ratio. However, for independent reasons, the validity of this ratio has been challenged.16
Tsuji et al11,12 used a good method. They studied HRV (SDNN) in 736 human subjects enrolled in the Framingham study, finding that HRV was correlated with the HR (in the manner that can be explained by the present study). However, they12 showed that age was an independent factor determining HRV, with HRV being lower in older subjects for a given HR. They were able to separate age from HR, because of the large number of subjects investigated. If it is assumed that HRV is primarily the result of fluctuations in autonomic nerve activity in the conscious human (see above), the study of Tsuji et al12 suggests a decrease in autonomic nerve activity with age.
Figure 5 shows a graphical method of separating an inde-pendent factor from the effect of HR. For example, Figure 5A suggests that HRV in Langendorff-perfused rabbit hearts (compared with the conscious human) is lower than can be accounted for by the higher HR, suggesting that Iper in the Langendorff-perfused rabbit heart is lower than in the con-scious human. This is not unexpected: there is no fluctuat-ing autonomic nerve activity in Langendorff-perfused rabbit hearts.
Finally, the easiest method to correct for HR is to use Equation 8 as shown by Figure S4.
Relationship Between HRV and Morbidity and MortalityThe higher morbidity and mortality associated with decreased HRV has been presumed to be the consequence of autonomic imbalance (sympathetic excess, parasympathetic withdrawal, even bilateral autonomic withdrawal).2,3 This must now be reinterpreted. We argue that HRV is a nonlinear measure of HR and, therefore, the higher morbidity and mortality associ-ated with a decrease in HRV is likely to be the result of the concurrent increase in HR. Of course, the autonomic nervous system has a role to play in HR control, although it is not the sole factor. That HR itself is an important mediator of risk is
established and has been borne out by the fact that a high HR is correlated with adverse outcomes.17 Indeed, HR-lowering drugs (β-blockers18 and ivabradine19) are known to ameliorate morbidity and mortality in diverse cardiovascular diseases. Although it is possible that β-blockers have some effect on the autonomic nervous system in addition to their bradycardic action, the same could not be said for the pure HR lowerer ivabradine.
PerspectivesHRV is widely used as a measure of autonomic tone to the heart as well as patient morbidity and mortality, and there are >17 000 articles on the topic. We have demonstrated that regardless of the cardiac preparation (from human to rabbit isolated sinus node myocyte) and presence or absence of dis-ease or physiological modification, HRV is inextricably linked to HR in an exponential manner: the lower the HR, the greater the HRV. We have illustrated and explained this relationship with 2 independent biophysical models. Our findings have significant implications for the many studies that have been and continue to be produced in which either no account is taken of the HR at which HRV is calculated, or in which the effect of HR has been improperly corrected for. Future studies concerning HRV should rigorously and openly correct for dif-ferences in HR before drawing conclusions.
Sources of FundingGrants were received from British Cardiovascular Society (O. Monfredi) and British Heart Foundation (RG/11/18/29257) (M.R. Boyett). This research was supported in part by the Intramural Research Program of the National Institutes of Health, National Institute on Aging. Other grants were received from the Engineering and Physical Science Research Council UK (EP/J00958X/1; EP/I029826/1) (H. Zhang) and the K.G. Jebson Foundation (A.-B. Johnsen and U. Wisloff).
DisclosuresNone.
References 1. Hales S. Statistical Essays: Concerning Haemastaticks; or, an Account
of Some Hydraulick and Hydrostatical Experiments Made on the Blood and Blood-Vessels of Animals. London, United Kingdom: W. Innys & R. Manby; 1733.
2. Billman GE. Heart rate variability - a historical perspective. Front Physiol. 2011;2:86.
3. Heart rate variability. Standards of measurement, physiological interpreta-tion, and clinical use. Task Force of the European Society of Cardiology and the North American Society of Pacing and Electrophysiology. Eur Heart J. 1996;17:354–381.
4. Dekker JM, Crow RS, Folsom AR, Hannan PJ, Liao D, Swenne CA, Schouten EG. Low heart rate variability in a 2-minute rhythm strip pre-dicts risk of coronary heart disease and mortality from several causes: the ARIC Study. Atherosclerosis Risk In Communities. Circulation. 2000;102:1239–1244.
5. Dekker JM, Schouten EG, Klootwijk P, Pool J, Swenne CA, Kromhout D. Heart rate variability from short electrocardiographic recordings predicts mortality from all causes in middle-aged and elderly men. The Zutphen Study. Am J Epidemiol. 1997;145:899–908.
6. Kleiger RE, Miller JP, Bigger JT Jr, Moss AJ. Decreased heart rate vari-ability and its association with increased mortality after acute myocardial infarction. Am J Cardiol. 1987;59:256–262.
7. Zhang H, Holden AV, Kodama I, Honjo H, Lei M, Varghese T, Boyett MR. Mathematical models of action potentials in the periphery and center of the rabbit sinoatrial node. Am J Physiol Heart Circ Physiol. 2000;279:H397–H421.
at University of Manchester (man) / England on November 13, 2014http://hyper.ahajournals.org/Downloaded from

10 Hypertension December 2014
8. Mangin L, Swynghedauw B, Benis A, Thibault N, Lerebours G, Carré F. Relationships between heart rate and heart rate variability: study in con-scious rats. J Cardiovasc Pharmacol. 1998;32:601–607.
9. Coumel P, Maison-Blanche P, Catuli D. Heart rate and heart rate variability in normal young adults. J Cardiovasc Electrophysiol. 1994;5:899–911.
10. Zaza A, Lombardi F. Autonomic indexes based on the analysis of heart rate variability: a view from the sinus node. Cardiovasc Res. 2001;50:434–442.
11. Tsuji H, Venditti FJ Jr, Manders ES, Evans JC, Larson MG, Feldman CL, Levy D. Reduced heart rate variability and mortality risk in an elderly cohort. The Framingham Heart Study. Circulation. 1994;90:878–883.
12. Tsuji H, Venditti FJ Jr, Manders ES, Evans JC, Larson MG, Feldman CL, Levy D. Determinants of heart rate variability. J Am Coll Cardiol. 1996;28:1539–1546.
13. Sacha J, Pluta W. Alterations of an average heart rate change heart rate variability due to mathematical reasons. Int J Cardiol. 2008;128:444–447.
14. Huikuri HV, Perkiömäki JS, Maestri R, Pinna GD. Clinical impact of eval-uation of cardiovascular control by novel methods of heart rate dynamics. Philos Trans A Math Phys Eng Sci. 2009;367:1223–1238.
15. Hayano J, Sakakibara Y, Yamada A, Yamada M, Mukai S, Fujinami T, Yokoyama K, Watanabe Y, Takata K. Accuracy of assessment of car-diac vagal tone by heart rate variability in normal subjects. Am J Cardiol. 1991;67:199–204.
16. Heathers JA. Sympathovagal balance from heart rate variability: an obitu-ary. Exp Physiol. 2012;97:556.
17. Tardif JC. Heart rate as a treatable cardiovascular risk factor. Br Med Bull. 2009;90:71–84.
18. Bristow MR. Treatment of chronic heart failure with β-adrenergic recep-tor antagonists: a convergence of receptor pharmacology and clinical car-diology. Circ Res. 2011;109:1176–1194.
19. Swedberg K, Komajda M, Böhm M, Borer JS, Ford I, Dubost-Brama A, Lerebours G, Tavazzi L; SHIFT Investigators. Ivabradine and outcomes in chronic heart failure (SHIFT): a randomised placebo-controlled study. Lancet. 2010;376:875–885.
What Is New?A unique relationship exists between heart rate variability (HRV) and heart rate across diverse cardiac preparations, both innervated and de-nervated, from the living animal all the way down to the fundamental building block of automaticity, the sinoatrial node cell. This relationship is independent of the conditions or duration over which HRV is recorded and persists even when drugs or gene modification are used to affect cellular processes.We have modeled this relationship using diverse biophysical models of differing complexity.We have suggested how to adequately correct for the phenomenon.
What Is Relevant?Our findings are significant because many articles have previously been published using HRV data that are not corrected for heart rate. Articles continue to be published apace with this fundamental flaw, and yet with simple correction, the effect of heart rate could be removed and true differences in HRV revealed. This has ramifications for the handling of blood pressure variability data.
Summary
HRV data should always adequately take into the account the heart rate at which they were measured.
Novelty and Significance
at University of Manchester (man) / England on November 13, 2014http://hyper.ahajournals.org/Downloaded from

1
ONLINE DATA SUPPLEMENT for article entitled:
BIOPHYSICAL CHARACTERISATION OF THE UNDER‐APPRECIATED AND IMPORTANT
RELATIONSHIP BETWEEN HEART RATE VARIABILITY AND HEART RATE
Short title: Heart rate variability and heart rate
Oliver Monfredi MD PhD1,2*, Alexey E Lyashkov PhD2, Anne‐Berit Johnsen3, Shin Inada PhD4, Heiko
Schneider MD1, Ruoxi Wang5, Mahesh Nirmalan MD1,Ulrik Wisloff PhD3, Victor A Maltsev PhD2,
Edward G Lakatta MD2, Henggui Zhang PhD5, Mark R Boyett PhD1
1Institute of Cardiovascular Sciences, University of Manchester, 46 Grafton Street, Manchester
M13 9NT, UK
2Laboratory of Cardiovascular Science, National Institute on Aging ‐ Intramural Research Program,
National Institutes of Health, Baltimore, Maryland, USA
3K.G. Jebsen Center of Exercise in Medicine at Department of Circulation and Medical Imaging,
Norwegian University of Science and Technology, Trondheim, Norway
4Laboratory of Biomedical Sciences and Information Management, National Cerebral and
Cardiovascular Center, 5‐7‐1 Fujishiro‐dai, Suita, Osaka 565‐8565, Japan
5Biological Physics Group, University of Manchester, Oxford Road, Manchester, M13 9PL, UK *Address for correspondence: Dr. Oliver Monfredi, Institute of Cardiovascular Sciences, Core
Technology Facility, University of Manchester, 46 Grafton Street, Manchester, M13 9NT,
UK
Email: [email protected]
Tel: +44 161 2751194
Fax: +44 161 2751183

2
Supplementary Methods Experiments performed for this study focussed upon three different cardiac preparations: conscious animals, isolated denervated Langendorff‐perfused hearts, and isolated sinoatrial node cells. The species employed in each of these situations varied, as did the experimental conditions used. Conscious human study Male and female patients (mean age, 58∙2 years, n=11, 55% male) attending the Manchester Heart Centre (Manchester Royal Infirmary, Oxford Road, Manchester, UK) for out‐patient dobutamine stress echocardiography to aid in their pre‐operative assessment were recruited to the study. Ethical approval for the study had been granted by the local ethics committee. All experiments were performed between 09:00 and 12:00 hours to minimise interference from circadian factors. Patients in the supine position were exposed to an incremental infusion of dobutamine every 3 min, beginning (after a period of baseline ECG recording) with 5 µg/kg/min, progressing through 10, 20, 30, and reaching a peak at 40 µg/kg/min. The target was an 85% increase in heart rate based on their maximum predicted heart rate by age and sex. Patients were given information regarding the study prior to undergoing the test, and were advised not to drink alcohol or caffeinated beverages for 24 hours leading up to the test. Those patients taking β‐blocking medication were advised to discontinue this 72 hours prior to the day of the test. Patients indicated their consent by signing a hospital‐approved consent form. Adhesive electrodes were placed on the right and left shoulders and left leg of the patient, and were connected to a Finapres Finometer ECG module (Finapres Medical Systems, Amsterdam, Netherlands). This was connected to a CED 1401 analogue to digital converter (Cambridge Electronic Design, Cambridge, UK) sampling the signal at 1000 Hz, which in turn was connected to a personal computer, where Spike2 software (Cambridge Electronic Design) made continuous recordings of the ECG data in the form of .cxd files. These were exported directly into LabChart Pro software (AD Instruments, BellaVista, NSW, Australia) and full analysis of HRV was made after the ECG signal had been subjectively checked for stationarity. Conscious rat study Three‐month old Sprague‐Dawley male rats (n=11) were fitted with intra‐abdominal ETA‐F20 biopotential transmitters (DSI, St Paul, MN, USA; weight 3∙9 g, volume 1∙9 ml) under isoflurane general anaesthesia whilst spontaneous respiration continued. The two flexible electrodes emanating from the transmitter box (helices of stainless steel wire covered by insulating silicone tubing) were implanted subcutaneously in the pre‐cordial region of the rat, one rostrally and one caudally. Dissolvable sutures were used to close the operated site. Rats were allowed one week of recovery before first recordings were made. The rats were not handled excessively, or treated differently to prior to the insertion of telemetry devices. ECG recordings at baseline were made by placing the plastic housing of the rat’s cage onto an RPC‐1 PhysioTel receiver (DSI, St Paul, MN, USA), which in turn was remotely connected to a Data Exchange Matrix (DSI, St Paul, MN, USA) to facilitate multiple simultaneous recordings from several rats. All telemetry data were recorded in the morning hours, between 09:00‐11:00. The data was passed to a personal computer for storage and offline analysis, which was performed by LabChart Pro software. The transmitters could be turned on and off via the use of a magnetic switch to conserve battery life for the periods of recording only. The first 150 s of stationary data were selected for analysis of HRV data. Langendorff‐perfused rabbit and rat heart study Three‐month old male New Zealand white rabbits (n=58) were sacrificed by lethal injection of 2‐3 ml 20% sodium pentobarbital into a pre‐anaesthetised (with EMLA cream: 25 mg/g lidocaine, 25

3
mg/g prilocaine, AstraZeneca, Alderley Park, Cheshire, UK) dorsal ear vein, in accordance with the requirements set out in the Animals (Scientific Procedures) Act 1986. The heart was immediately removed, and placed into 250 ml ice cold Tyrode’s solution (containing, in mM, 120 NaCl, 4 KCl, 1∙3 MgSO4*7H2O, 1∙2 NaH2PO4*2H20, 1∙2 CaCl2, 25∙2 NaHCO3, 5∙8 glucose), containing 1000 units heparin sodium (LEO Pharma, Buckinghamshire, UK) to prevent coronary thrombosis prior to the re‐establishment of coronary flow upon connecting the Langendorff perfusion rig. Following removal of the heart, the aorta was flushed retrogradely with 25‐50 ml ice‐cold heparin‐containing Tyrode’s solution. It was then rapidly transferred (immersed in ice cold heparinised Tyrode’s solution) to the electrophysiology rig, where curved forceps were used to mount it onto a custom‐designed steel cannula through which was passing a constant flow of Tyrode’s solution (not containing heparin; equilibrated with 95% O2/5% CO2; 20 ml/min via a peristaltic pump ‐ Minipuls3, Gilson, Middleton, WI, USA). The Tyrode’s solution was maintained at a constant temperature of 37±0∙4°C by heat exchanging glassware plumbed into a water bath (constant temperature of the solution was verified at the superior end of the heat exchanging column by a temperature monitoring system (Space Labs, Washington DC, USA).
Hearts generally recovered spontaneous beating within 2 min. Any heart that failed to re‐establish spontaneous beating within 5 min was discarded. Following re‐establishment of regular beating, a stabilisation period of 20 min was allowed. Spring‐loaded ECG electrodes (Harvard Apparatus) were positioned over the surface of the right atrium and on the free wall of the left ventricle. Obvious vascular structures were avoided during positioning of the electrodes. The ECG electrodes, along with the ground electrode, were connected to a head‐stage (Digitimer, Welwyn Garden City, UK), and then via a filter/amplifier (Digitimer) to an analogue‐to‐digital converter (CED 1401), and finally to a personal computer where Spike2 software was used to record the signal. Online filtering and amplification of the signal was performed at frequencies of D.C. for the low pass filter, and 1 kHz for the high pass filter. Further offline analysis was achieved using LabChart Pro software. Following the 20 min recovery period, a period of 500 s of baseline ECG recording was made. Thereafter, the effect of several chronotropically active drugs, isoprenaline (100 nM, n=8), carbachol (2x10‐7 M, n=9) and caesium chloride (2mM, n=8), was studied by switching a three‐way tap to facilitate access to a second water‐jacketed reservoir. The drug was allowed 10 min to achieve its effect on the heart, following which time a further 500 s of ECG recording was performed.
The basic procedure outlined above in the rabbit is almost identical to the Langendorff‐perfusion experiments performed on the rat. Three‐month old Wistar rats (n=8) were killed by stunning and cervical dislocation in accordance with the Animals and Scientific Procedures Act (1986). Following an identical procedure for removal of the heart, it was flushed with 20 ml of ice cold heparinised Tyrode’s solution before transfer to the Langendorff perfusion rig, where the flow rate had been reduced to 10 ml/min through a smaller metal cannula designed especially for the rat aorta. The procedure for testing the effects of chronotropically active drugs were identical to those described above (n=8 for isoprenaline). Isolated rabbit sinoatrial node cell study Studies in isolated SANC from rabbits were conducted in accordance with the National Institutes of Health Guide for the Care and Use of Laboratory Animals. The isolation and preparation of sinoatrial node cells has been described elsewhere1 and identical techniques were used in this study. Three‐month old New Zealand white rabbits were sacrificed by approved methods. The sinoatrial node was dissected free from the rest of the heart and subjected to triple enzymatic digestion, yielding a concentrated sinoatrial node cell‐containing solution. 15‐50 µl (depending on cell yield of the individual isolation) of the sinoatrial node cell‐containing solution was pipetted into the centre of a custom‐built chamber (capacity, 400 µl) attached to the stage of a Zeiss

4
Axiovert 100 inverted microscope (Carl Zeiss, Inc., Germany) containing Ca2+‐containing HEPES‐based cell perfusion buffer (containing, in mM, 140 NaCl, 5 HEPES, 0∙33 NaH2PO4*H2O, 5∙4 KCl, 5∙5 glucose, 0∙5 MgCl2*6H2O, 50 taurine) by a dropper pipette – at this point, circulation of the cell perfusion buffer and temperature regulating equipment were switched off.
Sinoatrial node cells were added from a Gilson pipette, and allowed to settle to the bottom of the chamber for 20 min. Following this, circulation of the HEPES buffer was commenced at a low rate (1‐2 ml/min) using a gravity driven perfusion system. A dual thermoregulation system was activated (Analog TC2BIP 2/3Ch Bipolar Temperature Controller; Cell Micro Controls, Norfolk, VA, USA) that incorporated a thin‐film, transparent ITO (indium‐tin‐oxide) plate heater of the glass onto which the cells settled, and a pre‐heating coil surrounding the entry tube for the fluid prior to its entrance into the chamber. Both of the heaters were controlled thermostatically by a thermistor located within the bath itself. This setup allowed strict maintenance of the HEPES based buffer solution at 35r0∙1°C. Upon commencement of circulation of the buffer and the heating of the chamber, the sinoatrial node cells began to spontaneously contract.
Borosilicate glass micro‐pipettes (World Precision Instruments, Sarasota FL, USA) were generated (diameter, ~2 µm, confirmed by visual inspection under a microscope; typical resistance, 3‐5 MΩ) using a horizontally‐loading micro‐pipette puller (Sutter Instruments, Novato, CA, USA), and were filled with high K+ concentration fluid containing ATP (containing, in mM, 120 potassium gluconate, 5 NaCl, 5 MgATP, 5 HEPES, 20 KCl), and 35‐50 µmol/l β‐escin (Sigma Aldrich, St Louis MO, USA) as the pore‐forming active ingredient. An electronically operated micromanipulator (EXFO Life Sciences, Ontario, Canada) was used to guide the micro‐pipette to the chosen cell under direct vision, initially using a 10x objective lens, switching to a 40x or 63x objective lens for the final approach to the cell. Action potentials were recorded from healthy and spontaneously beating cells (n=67) using an Axopatch‐200 B patch‐clamp amplifier (Axon Instruments, Foster City, CA). Action potential measurements were performed in a standard zero‐current‐clamp (fast) mode using a gap‐free acquisition protocol with a sampling interval of 0∙1 ms. Recordings were only made from cells with acceptable electrophysiological parameters of a maximum diastolic potential more negative than ‐50 mV and a peak potential of >20 mV. Action potential signals were recorded as ‘.abf’ files on the hard drive of the personal computer for further analysis.
The effect of several perfusates, isoprenaline (100 nM, n=6), carbachol (1x10‐7 M, n=4), caesium chloride (2mM, n=9), zatebradine (20 µM, n=4) and ryanodine (3 µM, n=23), was investigated on the spontaneous beating of the isolated rabbit sinoatrial node cells. These substances were made up to the desired concentration in the cell perfusion buffer (containing, in mM, 140 NaCl, 5 HEPES, 0∙33 NaH2PO4*H2O, 5∙4 KCl, 5∙5 glucose, 0∙5 MgCl2*6H2O, 1∙8 CaCl2; pH corrected to 7∙35 using 1 M NaOH) and directly added to the chamber via a separate gravity driven perfusion system at an identical rate to the baseline perfusate. Switching between the two was achieved via a simple three‐way tap.
Action potentials were recorded and stored on a personal computer. Each individually patched cell was allowed 20 min to undergo β‐escin‐induced membrane perforation, i.e. to achieve acceptable electrophysiological parameters. If perforation was not achieved during this time, the cell was discarded. Once perforation was achieved, baseline recording was immediately commenced. The period of baseline recording was 5 min. If there was a substantial change in beating rate or morphological appearance of the cell during this period sufficient to suggest that the patching process had damaged the cell, then the cell was discarded. If, however, beating rate and cellular appearance remained stable, the experiment was stored for offline analysis. When other substances were added, following the 5 min period of baseline recording, the perfusate was switched from the HEPES‐based cell perfusion buffer, to the isoprenaline/carbachol/caesium/zatebradin/ryanodine‐containing HEPES‐based cell perfusion

5
buffer. This was allowed to run in over the following 5 min. Following this, a further 5 min period of recording was commenced to demonstrate the effects of the intervention on variability. Only cells with an initial cycle length of <500 ms in the baseline period of recording were further analysed. From the 5 min baseline and 5 min isoprenaline records, a 2∙5 min (or 150 s) segment of action potential data was objectively selected on the basis of stationarity, lack of ectopic or artefactual beats and quality of recording. No attention was paid to the actual interbeat intervals making up this selected segment during the process of its selection; indeed such parameters had not been calculated at this stage. For the analysis of HRV, the .abf files were directly imported into LabChart Pro software. HRV analysis Continuous recordings of single channel ECG data from the conscious human or rat and the isolated Langendorff‐perfused rabbit and rat heart or spontaneous action potentials recorded from the isolated rabbit sinoatrial node cell were subjected to HRV analysis along identical lines. Time epochs of 2.5 min/150 s were chosen for HRV analysis on the basis of subjective stationarity. A stationary time series is “one whose statistical properties such as mean, variance, autocorrelation, etc. are all constant over time”.2 For the purposes of HRV tachograms, stationarity refers to a series of RR intervals without trend, but with constant variance over time, in addition to a constant autocorrelation structure over time and no periodic fluctuations. Strict rules for data pre‐processing were employed in order that meaningful HRV data could be obtained, without over‐processing of the signal and therefore loss of data characteristics. HRV parameters were calculated in the time‐domain – we calculated the standard deviation of normal to normal beats (SDNN; i.e. the standard deviation of cycle length between normal, not ectopic, beats), standard error of the mean, normalised standard deviation, and root‐mean‐square of the successive differences (RMSSD). HRV parameters were also calculated in the frequency domain (total power present within the signal at all frequencies; power in very‐low‐frequency/low‐frequency/high‐frequency bands; low‐frequency to high‐frequency power ratio) and the non‐linear domain (Poincaré plots), enabling a broad‐based appreciation of the HRV present within the recorded signals. For simplicity, only SDNN and total power are presented as the time‐ and frequency‐domain parameters reflecting HRV in figures. Computer modelling The Zhang et al.3 deterministic ordinary differential equation (ODE) model for the electrophysiology of a rabbit central sinoatrial node cell was implemented in this study. This model incorporates the concentration‐dependent chronotropic effects of the ACh‐activated K+ current ( IK ,ACh ) and the actions of ACh on the conductance and kinetics of the L‐type Ca
2+ current ( ICa ,L )
and the funny current ( I f ).4 In general, the equation governing the time‐dependent change in
membrane potential ( mV ) with the effect of ACh is:
)( ,AChKtotm
m IIdtdVC , [1]
where Cm is the cell capacitance, t is time and Itot the total ionic current in a sinoatrial node cell. Full details of equations and parameters of the Zhang et al. models of sinoatrial node cells and the actions of ACh are documented in our previous studies3, 4 and working codes in C are available on request. Fluctuations in cycle length (HRV) were simulated by including a stochastic perturbing current in Equation [1]:

6
))(( , tIIIdtdV
C perAChKtotm
m [ , [2]
where Iper is the maximum amplitude of the perturbing current (20 pA), and ξ(t) is a random fluctuation term (‐1≤ξ(t)≤+1) and was generated by the intrinsic function rand() of the C complier with uniform deviates. Equations [7] and [8] were numerically integrated by the fourth‐order Runge‐Kutta method with a time step of 0∙2 ms, which was sufficiently small for stable solutions. Supplementary Discussion Speculating on the nature of Iper Our arguments are independent of the nature of Iper, and we have not explored its nature in this study. In the conscious animal, there is no reason to believe that Iper does not represent fluctuations in autonomic nerve activity to the heart. Although there is no evidence to reject this, there is also no evidence to confirm it either. Although autonomic blockade abolishes HRV in the conscious human,5‐7 it also increases heart rate, and the abolition of HRV could be significantly contributed to by the increase in heart rate. Further work is required to resolve this. Ideally, autonomic tone should be directly measured by electrodes.
In the isolated sinoatrial node cell, the considerable HRV cannot be the result of fluctuations in autonomic nerve activity. Instead evidence from our own group suggests that it is intrinsic to the sinoatrial node cell.8 According to the coupled clock theory, the heart rate is set via mutual entrainment of the Ca2+ and membrane clock pacemaker mechanisms.9, 10 This concept has been tested via perturbations of the Ca2+ clock using cyclopiazonic acid and the membrane clock with ivabradine.11 In the isolated sinoatrial node cell, HRV has been shown to be the result of beat‐to‐beat fluctuations in the Ca2+ clock.8 In the present study, we either modelled Iper as a constant current during the pacemaker potential (simple model) or as a randomly fluctuating current during the pacemaker potential (biophysically‐detailed model), but both approaches predicted a similar relationship between SDNN and heart rate (see Fig. 3A, solid line and Fig. 4D). Nevertheless, it is not known which approach most closely represents reality when HRV is generated by fluctuations in autonomic tone or the Ca2+ clock. In the case of the Ca2+ clock, the amplitude of the associated current (Iper=INaCa) is increased during the late phase of the pacemaker potential shortly before the action potential upstroke.12 A crucial parameter defining CL duration is the phase of Ca2+ release, rather than its amplitude.8 Thus, the increase in Ca2+ release amplitude and INaCa occurring during the late phase of the pacemaker potential may not necessarily generate substantial CL fluctuations. These ideas are in line with those of Jalife et al.13 who showed that the CL is more influenced by a current perturbation if it is applied in the so‐called “1:1 entrainment zone” (∼20% of the CL before an excitation, i.e. the late phase of the pacemaker potential). These complexities, however, do not negate the central conclusion of this study ‐ regardless of whether Iper is constant or fluctuating and whether it preferentially occurs during one part of the pacemaker potential, the effect of Iper on CL is expected to be less at high heart rates when Itot during the pacemaker potential is greater.
In rabbit sinoatrial node cells, Bogdanov et al.12 showed that fluctuations in the rate of diastolic depolarization were larger after the application of the E‐adrenergic agonist, isoprenaline. Computer simulations suggested that the fluctuations in INaCa during the latter part of the diastolic depolarization substantially increase.12 This result is not inconsistent with the finding that E‐adrenergic agonist decreases HRV (Fig. 2), a finding that has also been reported previously.14 The data from Bogdanov et al.12 suggests that Iper increases with E‐adrenergic agonist. However, the fact that E‐adrenergic agonist decreases HRV in the conscious human, Langendorff‐perfused rabbit and rat heart and rabbit sinoatrial node cell (Fig. 2) means that this effect is masked by the direct effect of heart rate on HRV.

7
In isolated denervated Langendorff‐perfused hearts, HRV cannot of course be the result of fluctuations in autonomic nerve activity to the heart. Although there are parasympathetic ganglia in the heart and consequently intact postganglionic nerve fibres (as well as sympathetic nerve endings), it is well established that there is no residual nerve activity that could lead to significant HRV. Computer simulations show that a group of electrically‐coupled sinoatrial node cells (each showing independent stochastic variation in beating rate) shows less HRV than the individual uncoupled sinoatrial node cells – see Fig. S6. This phenomenon of decreasing variability with increasing cell coupling has been recognized for some time,15 though not modelled as we have done here. In keeping with this, the HRV exhibited by the Langendorff‐perfused rabbit heart is less than that demonstrated by the isolated rabbit sinoatrial node cell in a way that cannot be explained by the difference in CL (Fig. 1). The nature of Iper in the isolated Langendorff‐perfused heart is not known and warrants further study. Limitations of the study The simple model provides a general explanation of the dependence of HRV on heart rate. However, it depends on some simplifying assumptions. It depends on Itot (as well as Iper) being roughly constant throughout the pacemaker potential ‐ Itot will vary in response to the Iper‐induced change in dVm/dt. However, the model is still valid if the membrane conductance during the pacemaker potential is roughly constant. To prevent the substantial decrease in SDNN at high heart rates, there would have to be a substantially lower conductance during the pacemaker potential at high heart rates, and there is no reason for this – at high heart rates, although activation of some ionic currents will be less, residual activation of IK,r and IK,s will be greater. The simple model assumes action potential duration of a SANC to be constant at different rates. This is not an unreasonable assumption because the sinoatrial node does not show large rate‐dependent changes in action potential duration unlike Purkinje fibres and ventricular muscle. In addition, in the biophysically detailed model the action potential duration is allowed to change and still HRV depends on heart rate in a similar manner to that predicted by the simple model.
In the biophysically detailed model, we modelled the effect of a randomly fluctuating perturbing current, Iper. In the future, it would be of interest to model fluctuating autonomic tone and analyse the power spectra. Detailed key for Fig. 3 HRV data was taken from the following papers, in addition to our own: Gehrmann et al.16; Uechi et al.17; Laude et al.18; Bissonette et al.19; Wu et al.20; Ecker et al.21; Zaza et al.22; Radaelli et al.23; Beckers et al.24; Ramaekers et al.25; Seals et al.26; Sacknoff et al.27; Tsuji et al.28; Casolo et al.29; Claria et al.30; Al‐Ani et al 31; Craft et al.5; Aubert et al.32; Abildstrom et al.33; Jensen‐Urstad et al.34
References
1. Vinogradova TM, Zhou YY, Bogdanov KY, Yang D, Kuschel M, Cheng H, Xiao RP. Sinoatrial node pacemaker activity requires ca2+/calmodulin‐dependent protein kinase ii activation. Circ Res. 2000;87:760‐767.
2. Forecasting ‐ duke university. 2005 3. Zhang H, Holden AV, Kodama I, Honjo H, Lei M, Varghese T, Boyett MR. Mathematical models of
action potentials in the periphery and center of the rabbit sinoatrial node. Am J Physiol Heart Circ Physiol. 2000;279:H397‐421.
4. Zhang H, Holden AV, Noble D, Boyett MR. Analysis of the chronotropic effect of acetylcholine on sinoatrial node cells. J Cardiovasc Electrophysiol. 2002;13:465‐474.

8
5. Craft N, Schwartz JB. Effects of age on intrinsic heart rate, heart rate variability, and av conduction in healthy humans. Am J Physiol (Heart Circ Physiol). 1995;268:H1441‐H1452.
6. Diedrich A, Jordan J, Shannon JR, Robertson D, Biaggioni I. Modulation of qt interval during autonomic nervous system blockade in humans. Circulation. 2002;106:2238‐2243.
7. Pomeranz B, Macaulay RJ, Caudill MA, Kutz I, Adam D, Gordon D, Kilborn KM, Barger AC, Shannon DC, Cohen RJ, et al. Assessment of autonomic function in humans by heart rate spectral analysis. Am J Physiol (Heart Circ Physiol). 1985;248:H151‐153.
8. Monfredi O, Maltseva LA, Spurgeon HA, Boyett MR, Lakatta EG, Maltsev VA. Beat‐to‐beat variation in periodicity of local calcium releases contributes to intrinsic variations of spontaneous cycle length in isolated single sinoatrial node cells. PLoS One. 2013;8:e67247.
9. Maltsev VA, Lakatta EG. Synergism of coupled subsarcolemmal ca2+ clocks and sarcolemmal voltage clocks confers robust and flexible pacemaker function in a novel pacemaker cell model. Am J Physiol (Heart Circ Physiol). 2009;296:H594‐615.
10. Lakatta EG, Maltsev VA, Vinogradova TM. A coupled system of intracellular ca2+ clocks and surface membrane voltage clocks controls the timekeeping mechanism of the heart’s pacemaker. Circ Res. 2010;106:659‐673.
11. Yaniv Y, Sirenko S, Ziman BD, Spurgeon HA, Maltsev VA, Lakatta EG. New evidence for coupled clock regulation of the normal automaticity of sinoatrial nodal pacemaker cells: Bradycardic effects of ivabradine are linked to suppression of intracellular ca2+ cycling. J Mol Cell Cardiol. 2013;62:80‐89.
12. Bogdanov KY, Maltsev VA, Vinogradova TM, Lyashkov AE, Spurgeon HA, Stern MD, Lakatta EG. Membrane potential fluctuations resulting from submembrane ca2+ releases in rabbit sinoatrial nodal cells impart an exponential phase to the late diastolic depolarization that controls their chronotropic state. Circ Res. 2006;99:979‐987.
13. Anumonwo JM, Delmar M, Vinet A, Michaels DC, Jalife J. Phase resetting and entrainment of pacemaker activity in single sinus nodal cells. Circ Res. 1991;68:1138‐1153.
14. Ahmed MW, Kadish AH, Parker MA, Goldberger JJ. Effect of physiologic and pharmacologic adrenergic stimulation on heart rate variability. J Am Coll Cardiol. 1994;24:1082‐1090.
15. Jongsma HJ, Tsjernina L, de Bruijne J. The establishment of regular beating in populations of pacemaker heart cells. A study with tissue‐cultured rat heart cells. J Mol Cell Cardiol. 1983;15:123‐133.
16. Gehrmann J, Hammer PE, Maguire CT, Wakimoto H, Triedman JK, Berul CI. Phenotypic screening for heart rate variability in the mouse. Am J Physiol (Heart Circ Physiol). 2000;279:H733‐740.
17. Uechi M, Asai K, Osaka M, Smith A, Sato N, Wagner TE, Ishikawa Y, Hayakawa H, Vatner DE, Shannon RP, Homcy CJ, Vatner SF. Depressed heart rate variability and arterial baroreflex in conscious transgenic mice with overexpression of cardiac gsalpha. Circ Res. 1998;82:416‐423.
18. Laude D, Baudrie V, Elghozi JL. Effects of atropine on the time and frequency domain estimates of blood pressure and heart rate variability in mice. Clinical and experimental pharmacology & physiology. 2008;35:454‐457.
19. Bissonnette JM, Knopp SJ, Maylie J, Thong T. Autonomic cardiovascular control in methyl‐cpg‐binding protein 2 (mecp2) deficient mice. Auton Neurosci. 2007;136:82‐89.
20. Wu TW, Ono K, Murakami M, Iijima T. Involvement of voltage‐dependent ca2+ channel E3 subunit in the autonomic control of heart rate variability. Pharmacology. 2006;76:170‐179.
21. Ecker PM, Lin CC, Powers J, Kobilka BK, Dubin AM, Bernstein D. Effect of targeted deletions of beta1‐ and beta2‐adrenergic‐receptor subtypes on heart rate variability. Am J Physiol Heart Circ Physiol. 2006;290:H192‐199.
22. Zaza A, Lombardi F. Autonomic indexes based on the analysis of heart rate variability: A view from the sinus node. Cardiovasc Res. 2001;50:434‐442.
23. Radaelli A, Valle F, Falcone C, Calciati A, Leuzzi S, Martinelli L, Goggi C, Vigano M, Finardi G, Bernardi L. Determinants of heart rate variability in heart transplanted subjects during physical exercise. Eur Heart J. 1996;17:462‐471.
24. Beckers F, Ramaekers D, Speijer G, Ector H, Vanhaecke J, Verheyden B, Van Cleemput J, Droogne W, Van de Werf F, Aubert AE. Different evolutions in heart rate variability after heart transplantation: 10‐year follow‐up. Transplantation. 2004;78:1523‐1531.

9
25. Ramaekers D, Ector H, Vanhaecke J, van Cleemput J, van de Werf F. Heart rate variability after cardiac transplantation in humans. Pacing Clin Electrophysiol. 1996;19:2112‐2119.
26. Seals DR, Chase PB. Influence of physical training on heart rate variability and baroreflex circulatory control. J Appl Physiol. 1989;66:1886‐1895.
27. Sacknoff DM, Gleim GW, Stachenfeld N, Coplan NL. Effect of athletic training on heart rate variability. Am Heart J. 1994;127:1275‐1278.
28. Tsuji H, Venditti FJ, Jr., Manders ES, Evans JC, Larson MG, Feldman CL, Levy D. Reduced heart rate variability and mortality risk in an elderly cohort. The framingham heart study. Circulation. 1994;90:878‐883.
29. Casolo G, Balli E, Taddei T, Amuhasi J, Gori C. Decreased spontaneous heart rate variability in congestive heart failure. Am J Cardiol. 1989;64:1162‐1167.
30. Claria F, Vallverdu M, Baranowski R, Chojnowska L, Caminal P. Heart rate variability analysis based on time‐frequency representation and entropies in hypertrophic cardiomyopathy patients. Physiol Meas. 2008;29:401‐416.
31. al‐Ani M, Munir SM, White M, Townend J, Coote JH. Changes in r‐r variability before and after endurance training measured by power spectral analysis and by the effect of isometric muscle contraction. Eur J Appl Physiol Occup Physiol. 1996;74:397‐403.
32. Aubert AE, Seps B, Beckers F. Heart rate variability in athletes. Sports Med. 2003;33:889‐919. 33. Abildstrom SZ, Jensen BT, Agner E, Torp‐Pedersen C, Nyvad OLE, Wachtell K, Ottesen MM, Kanters
JK, Group BS. Heart rate versus heart rate variability in risk prediction after myocardial infarction. J Cardiovasc Electrophysiol. 2003;14:168‐173.
34. Jensen‐Urstad K, Storck N, Bouvier F, Ericson M, Lindbland LE, Jensen‐Urstad M. Heart rate variability in healthy subjects is related to age and gender. Acta Physiologica Scandinavica. 1997;160:235‐241.
35. Kurata Y, Matsuda H, Hisatome I, Shibamoto T. Regional difference in dynamical property of sinoatrial node pacemaking: Role of na+ channel current. Biophys J. 2008;95:951‐977.

Fig. S1. A‐Edifferencesconscious conscious preparatiopreparatio
E: Power sps in power phuman; B: rrat. F: summons. * = staton(s) are sta
ectra undepresent at frabbit Langemary data tistically signatistically sig
r baseline cfrequenciesendorff heao demonstrnificant diffgnificant fro
10
conditions fs up to 0.5 Hart; C:Rabbirate differeerence on 1om the starr
rom all fiveHz. Note dift SANC; D: rnces in mea1‐way ANOVred bar.
species stuferences in rat Langendan total powVA. Letters
udied to shoy‐axis scaledorff heart; wer betweeatop bar re
ow es. A: E:
en eflect which

Fig.exp
. S2. Relationshponential decay
hip between HRy‐like relationsh
RV (SDNN) and ip is observed i
heart rate in din every case.
11
ifferent preparations. Data shown for differeent species. Nottice that the sam
me

12
Fig. S3. Effect of the amplitude of the perturbing current (Iper) on the relationship between HRV (SDNN) and heart rate as predicted by the simple model.

Fig. S4. Corelationshiis an increaheart rate.
rrection of ip between ase in HRV a. There is a
SDNN for huncorrecteas heart ratflat relation
heart rate bed HRV (SDNte decreasenship betwe
13
by dividing tNN) and heas. Bottom, een HRV an
the SDNN bart rate. Samrelationshipd heart rate
by .
me data as p between ce.
(equationshown in Ficorrected H
n 8). Top, ig. 3. There HRV and

14
Fig. S5. Figure to show the effect of simple normalisation (dividing the HRV parameter, in this case SDNN, by the heart rate at which it was measured). Top panel shows raw data taken from our simple model in red. Bottom panel shows the effect of simple normalisation on this data – there is persistence of a large effect of heart rate on HRV, especially at heart rates <100.

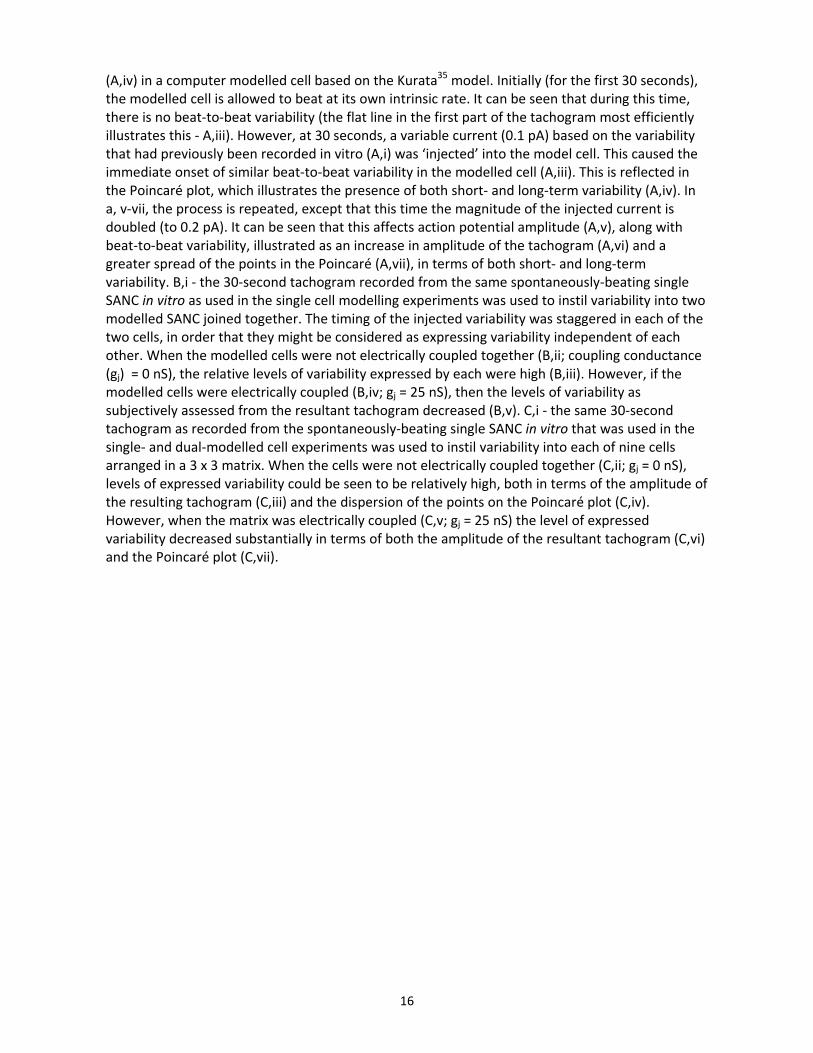
Fig. S6. Revariability from a singresults frombeating sinvariable bepotential d
sults of thebetween cgle isolated m a nine SAngle isolatedeating was idata (A,ii), t
e computer ardiac prepSANC; B, p
ANC matrix. d SANC in vinstilled intohe resultan
modelling parations ofertains to rA,i ‐ a 30‐sitro was useo the modet beat‐to‐b
15
experimenf differing cesults fromecond tached as the 'melled cells. Aeat tachogr
ts investigacomplexity.m two SANC ogram recomodel variabA,ii‐iv ‐ a oneram (A,iii) a
ating the dif. A, pertainsjoined togeorded from bility', and te‐minute rend the ensu
fferences ins to modelleether; C, pea spontanethis patternecording of uing Poinca
n ed results rtains to ously‐n of raw action re plot
16
(A,iv) in a computer modelled cell based on the Kurata35 model. Initially (for the first 30 seconds), the modelled cell is allowed to beat at its own intrinsic rate. It can be seen that during this time, there is no beat‐to‐beat variability (the flat line in the first part of the tachogram most efficiently illustrates this ‐ A,iii). However, at 30 seconds, a variable current (0.1 pA) based on the variability that had previously been recorded in vitro (A,i) was ‘injected’ into the model cell. This caused the immediate onset of similar beat‐to‐beat variability in the modelled cell (A,iii). This is reflected in the Poincaré plot, which illustrates the presence of both short‐ and long‐term variability (A,iv). In a, v‐vii, the process is repeated, except that this time the magnitude of the injected current is doubled (to 0.2 pA). It can be seen that this affects action potential amplitude (A,v), along with beat‐to‐beat variability, illustrated as an increase in amplitude of the tachogram (A,vi) and a greater spread of the points in the Poincaré (A,vii), in terms of both short‐ and long‐term variability. B,i ‐ the 30‐second tachogram recorded from the same spontaneously‐beating single SANC in vitro as used in the single cell modelling experiments was used to instil variability into two modelled SANC joined together. The timing of the injected variability was staggered in each of the two cells, in order that they might be considered as expressing variability independent of each other. When the modelled cells were not electrically coupled together (B,ii; coupling conductance (gj) = 0 nS), the relative levels of variability expressed by each were high (B,iii). However, if the modelled cells were electrically coupled (B,iv; gj = 25 nS), then the levels of variability as subjectively assessed from the resultant tachogram decreased (B,v). C,i ‐ the same 30‐second tachogram as recorded from the spontaneously‐beating single SANC in vitro that was used in the single‐ and dual‐modelled cell experiments was used to instil variability into each of nine cells arranged in a 3 x 3 matrix. When the cells were not electrically coupled together (C,ii; gj = 0 nS), levels of expressed variability could be seen to be relatively high, both in terms of the amplitude of the resulting tachogram (C,iii) and the dispersion of the points on the Poincaré plot (C,iv). However, when the matrix was electrically coupled (C,v; gj = 25 nS) the level of expressed variability decreased substantially in terms of both the amplitude of the resultant tachogram (C,vi) and the Poincaré plot (C,vii).
Copyright © 2022 FDOKUMEN