
Biohydrogen production in an outdoor panel photobioreactor on dark fermentation effluent of molasses
9
Biohydrogen production in an outdoor panel photobioreactor on dark fermentation effluent of molasses Sevler Gokce Avcioglu a , Ebru Ozgur a, *, Inci Eroglu a , Meral Yucel b , Ufuk Gunduz b a Department of Chemical Engineering, Middle East Technical University, Ankara 06531, Turkey b Department of Biological Sciences, Middle East Technical University, Ankara 06531, Turkey article info Article history: Received 7 October 2010 Received in revised form 9 December 2010 Accepted 12 December 2010 Available online 26 January 2011 Keywords: Photofermentation Biohydrogen Molasses Photobioreactor Global solar radiation abstract Hydrogen is regarded as an ideal energy carrier if it is produced from renewable resources such as biomass. Sequential operation of dark and photofermentation allows a highly efficient production of hydrogen from biomass, as maximal conversion of the energy in the carbohydrates to hydrogen can be achieved. In this study photofermentative hydrogen production was carried out in a solar panel photobioreactor by Rhodobacter capsulatus wild type (DSM 1710) and Rhodobacter capsulatus hup (YO3) strain on the molasses dark fermentation effluents which were obtained using an extreme thermophile Caldicellusir- uptor saccharolyticus in the dark fermentation step. Continuous hydrogen production on the molasses dark fermentation effluents was achieved up to 55 days with R. capsulatus wild type and 75 days with R. capsulatus hup in outdoor conditions during summer 2009, in Ankara Turkey. The maximum hydrogen yield obtained using R. capsulatus hup- was 78% (of the theoretical maximum) and the maximum hydrogen productivity was 0.67 mmol H 2 / L c .h. The maximum hydrogen productivity and yield of the wild type strain on the molasses dark fermentation effluents were 0.50 mmol H 2 /L c .h and 50%, respectively. The changes in climatic conditions, particularly daily global solar radiation, affected the hydrogen productivity and yield. Copyright ª 2011, Hydrogen Energy Publications, LLC. Published by Elsevier Ltd. All rights reserved. 1. Introduction Provision of the energy demand, depletion of the common energy resources and the global climate change that emerged with increasing fossil-based CO 2 emission constitute the main challenges of mankind in this century. From this point of view, hydrogen will become more and more important in the coming decades. As the end product of hydrogen on combustion is mainly water, hydrogen is invaluable as clean, renewable and harmless energy carrier of the future [1]. Furthermore, it has higher energy content (142 MJ/kg) compared to natural gas (28 MJ/kg) [2]. There are several methods to produce hydrogen from both renewable and non-renewable resources. Among non- renewable resources the most common methods to produce hydrogen are steam methane reforming, partial oxidation of hydrocarbons, coal gasification and biomass gasification [3]. However, all non-renewable hydrogen production technologies also increase CO 2 emissions and face with the exhaustion of resources. Obviously, hydrogen can be an ideal energy carrier if it is produced from renewable resources. Hence, electrolysis combined with photovoltaics, wind power, hydropower, and biological hydrogen production from biomass as clean hydrogen production technologies form an alternative to the non-renewable. Biological hydrogen is produced via direct photolysis by using microalgae and cyanobacteria, photofermentation through photosynthetic purple bacteria, and dark fermentation * Corresponding author. Tel.: þ90 312 2102696; fax: þ90 312 2102600. E-mail address: [email protected] (E. Ozgur). Available at www.sciencedirect.com journal homepage: www.elsevier.com/locate/he international journal of hydrogen energy 36 (2011) 11360 e11368 0360-3199/$ e see front matter Copyright ª 2011, Hydrogen Energy Publications, LLC. Published by Elsevier Ltd. All rights reserved. doi:10.1016/j.ijhydene.2010.12.046
Transcript of Biohydrogen production in an outdoor panel photobioreactor on dark fermentation effluent of molasses

i n t e rn a t i o n a l j o u r n a l o f h y d r o g e n en e r g y 3 6 ( 2 0 1 1 ) 1 1 3 6 0e1 1 3 6 8
Avai lab le at www.sc iencedi rect .com
journa l homepage : www.e lsev ie r . com/ loca te /he
Biohydrogen production in an outdoor panel photobioreactoron dark fermentation effluent of molasses
Sevler Gokce Avcioglu a, Ebru Ozgur a,*, Inci Eroglu a, Meral Yucel b, Ufuk Gunduz b
aDepartment of Chemical Engineering, Middle East Technical University, Ankara 06531, TurkeybDepartment of Biological Sciences, Middle East Technical University, Ankara 06531, Turkey
a r t i c l e i n f o
Article history:
Received 7 October 2010
Received in revised form
9 December 2010
Accepted 12 December 2010
Available online 26 January 2011
Keywords:
Photofermentation
Biohydrogen
Molasses
Photobioreactor
Global solar radiation
* Corresponding author. Tel.: þ90 312 210269E-mail address: [email protected] (E
0360-3199/$ e see front matter Copyright ªdoi:10.1016/j.ijhydene.2010.12.046
a b s t r a c t
Hydrogen is regarded as an ideal energy carrier if it is produced from renewable resources
such as biomass. Sequential operation of dark and photofermentation allows a highly
efficient production of hydrogen from biomass, as maximal conversion of the energy in the
carbohydrates to hydrogen can be achieved. In this study photofermentative hydrogen
production was carried out in a solar panel photobioreactor by Rhodobacter capsulatus wild
type (DSM 1710) and Rhodobacter capsulatus hup� (YO3) strain on the molasses dark
fermentation effluents which were obtained using an extreme thermophile Caldicellusir-
uptor saccharolyticus in the dark fermentation step. Continuous hydrogen production on the
molasses dark fermentation effluents was achieved up to 55 days with R. capsulatus wild
type and 75 days with R. capsulatus hup� in outdoor conditions during summer 2009, in
Ankara Turkey. The maximum hydrogen yield obtained using R. capsulatus hup- was 78%
(of the theoretical maximum) and the maximum hydrogen productivity was 0.67 mmol H2/
Lc.h. The maximum hydrogen productivity and yield of the wild type strain on the
molasses dark fermentation effluents were 0.50 mmol H2/Lc.h and 50%, respectively. The
changes in climatic conditions, particularly daily global solar radiation, affected the
hydrogen productivity and yield.
Copyright ª 2011, Hydrogen Energy Publications, LLC. Published by Elsevier Ltd. All rights
reserved.
1. Introduction renewable resources the most common methods to produce
Provision of the energy demand, depletion of the common
energy resources and the global climate change that emerged
with increasing fossil-based CO2 emission constitute the main
challenges ofmankind in this century. From this point of view,
hydrogenwill becomemore andmore important in the coming
decades. As the end product of hydrogen on combustion is
mainly water, hydrogen is invaluable as clean, renewable and
harmless energy carrier of the future [1]. Furthermore, it has
higher energy content (142 MJ/kg) compared to natural gas
(28 MJ/kg) [2].
There are several methods to produce hydrogen from
both renewable and non-renewable resources. Among non-
6; fax: þ90 312 2102600.. Ozgur).2011, Hydrogen Energy P
hydrogen are steam methane reforming, partial oxidation of
hydrocarbons, coal gasification and biomass gasification [3].
However, all non-renewable hydrogen production technologies
also increase CO2 emissions and face with the exhaustion of
resources. Obviously, hydrogen can be an ideal energy carrier if
it is produced from renewable resources. Hence, electrolysis
combined with photovoltaics, wind power, hydropower, and
biological hydrogen production from biomass as clean
hydrogen production technologies form an alternative to the
non-renewable.
Biological hydrogen is produced via direct photolysis by
using microalgae and cyanobacteria, photofermentation
throughphotosynthetic purple bacteria, anddark fermentation
ublications, LLC. Published by Elsevier Ltd. All rights reserved.
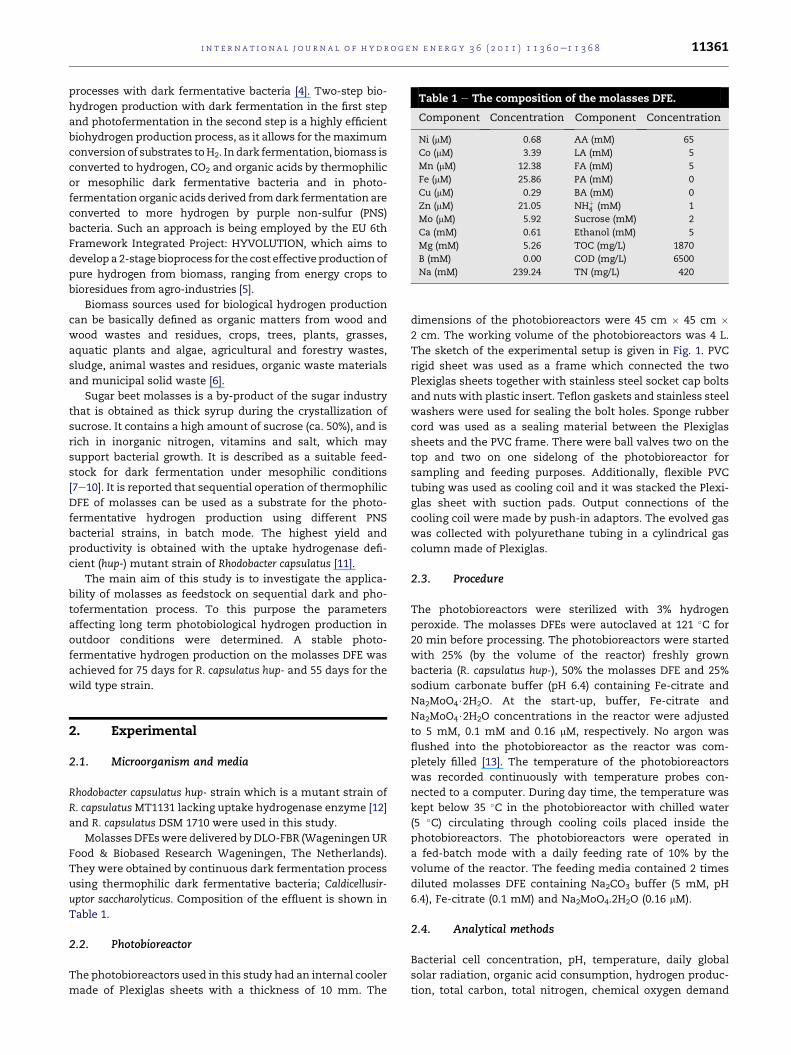
Table 1 e The composition of the molasses DFE.
Component Concentration Component Concentration
Ni (mM) 0.68 AA (mM) 65
Co (mM) 3.39 LA (mM) 5
Mn (mM) 12.38 FA (mM) 5
Fe (mM) 25.86 PA (mM) 0
Cu (mM) 0.29 BA (mM) 0
Zn (mM) 21.05 NHþ4 (mM) 1
Mo (mM) 5.92 Sucrose (mM) 2
Ca (mM) 0.61 Ethanol (mM) 5
Mg (mM) 5.26 TOC (mg/L) 1870
B (mM) 0.00 COD (mg/L) 6500
Na (mM) 239.24 TN (mg/L) 420
i n t e r n a t i o n a l j o u r n a l o f h y d r o g e n en e r g y 3 6 ( 2 0 1 1 ) 1 1 3 6 0e1 1 3 6 8 11361
processes with dark fermentative bacteria [4]. Two-step bio-
hydrogen production with dark fermentation in the first step
and photofermentation in the second step is a highly efficient
biohydrogen production process, as it allows for themaximum
conversion of substrates toH2. Indark fermentation, biomass is
converted to hydrogen, CO2 and organic acids by thermophilic
or mesophilic dark fermentative bacteria and in photo-
fermentation organic acids derived fromdark fermentation are
converted to more hydrogen by purple non-sulfur (PNS)
bacteria. Such an approach is being employed by the EU 6th
Framework Integrated Project: HYVOLUTION, which aims to
develop a 2-stage bioprocess for the cost effective production of
pure hydrogen from biomass, ranging from energy crops to
bioresidues from agro-industries [5].
Biomass sources used for biological hydrogen production
can be basically defined as organic matters from wood and
wood wastes and residues, crops, trees, plants, grasses,
aquatic plants and algae, agricultural and forestry wastes,
sludge, animal wastes and residues, organic waste materials
and municipal solid waste [6].
Sugar beet molasses is a by-product of the sugar industry
that is obtained as thick syrup during the crystallization of
sucrose. It contains a high amount of sucrose (ca. 50%), and is
rich in inorganic nitrogen, vitamins and salt, which may
support bacterial growth. It is described as a suitable feed-
stock for dark fermentation under mesophilic conditions
[7e10]. It is reported that sequential operation of thermophilic
DFE of molasses can be used as a substrate for the photo-
fermentative hydrogen production using different PNS
bacterial strains, in batch mode. The highest yield and
productivity is obtained with the uptake hydrogenase defi-
cient (hup-) mutant strain of Rhodobacter capsulatus [11].
The main aim of this study is to investigate the applica-
bility of molasses as feedstock on sequential dark and pho-
tofermentation process. To this purpose the parameters
affecting long term photobiological hydrogen production in
outdoor conditions were determined. A stable photo-
fermentative hydrogen production on the molasses DFE was
achieved for 75 days for R. capsulatus hup- and 55 days for the
wild type strain.
2. Experimental
2.1. Microorganism and media
Rhodobacter capsulatus hup- strain which is a mutant strain of
R. capsulatus MT1131 lacking uptake hydrogenase enzyme [12]
and R. capsulatus DSM 1710 were used in this study.
Molasses DFEswere delivered by DLO-FBR (WageningenUR
Food & Biobased Research Wageningen, The Netherlands).
They were obtained by continuous dark fermentation process
using thermophilic dark fermentative bacteria; Caldicellusir-
uptor saccharolyticus. Composition of the effluent is shown in
Table 1.
2.2. Photobioreactor
The photobioreactors used in this study had an internal cooler
made of Plexiglas sheets with a thickness of 10 mm. The
dimensions of the photobioreactors were 45 cm � 45 cm �2 cm. The working volume of the photobioreactors was 4 L.
The sketch of the experimental setup is given in Fig. 1. PVC
rigid sheet was used as a frame which connected the two
Plexiglas sheets together with stainless steel socket cap bolts
and nuts with plastic insert. Teflon gaskets and stainless steel
washers were used for sealing the bolt holes. Sponge rubber
cord was used as a sealing material between the Plexiglas
sheets and the PVC frame. There were ball valves two on the
top and two on one sidelong of the photobioreactor for
sampling and feeding purposes. Additionally, flexible PVC
tubing was used as cooling coil and it was stacked the Plexi-
glas sheet with suction pads. Output connections of the
cooling coil were made by push-in adaptors. The evolved gas
was collected with polyurethane tubing in a cylindrical gas
column made of Plexiglas.
2.3. Procedure
The photobioreactors were sterilized with 3% hydrogen
peroxide. The molasses DFEs were autoclaved at 121 �C for
20 min before processing. The photobioreactors were started
with 25% (by the volume of the reactor) freshly grown
bacteria (R. capsulatus hup-), 50% the molasses DFE and 25%
sodium carbonate buffer (pH 6.4) containing Fe-citrate and
Na2MoO4$2H2O. At the start-up, buffer, Fe-citrate and
Na2MoO4$2H2O concentrations in the reactor were adjusted
to 5 mM, 0.1 mM and 0.16 mM, respectively. No argon was
flushed into the photobioreactor as the reactor was com-
pletely filled [13]. The temperature of the photobioreactors
was recorded continuously with temperature probes con-
nected to a computer. During day time, the temperature was
kept below 35 �C in the photobioreactor with chilled water
(5 �C) circulating through cooling coils placed inside the
photobioreactors. The photobioreactors were operated in
a fed-batch mode with a daily feeding rate of 10% by the
volume of the reactor. The feeding media contained 2 times
diluted molasses DFE containing Na2CO3 buffer (5 mM, pH
6.4), Fe-citrate (0.1 mM) and Na2MoO4.2H2O (0.16 mM).
2.4. Analytical methods
Bacterial cell concentration, pH, temperature, daily global
solar radiation, organic acid consumption, hydrogen produc-
tion, total carbon, total nitrogen, chemical oxygen demand

Fig. 1 e A sketch of the experimental setup.
i n t e rn a t i o n a l j o u r n a l o f h y d r o g e n en e r g y 3 6 ( 2 0 1 1 ) 1 1 3 6 0e1 1 3 6 811362
and NH4þ were measured during the experiments. The bacte-
rial cell concentration was measured with Shimadzu UV-1201
spectrophotometer. An optical density of 1 at 660 nm corre-
sponds to a cell density of 0.47 g dry cell weight/Lc for R. cap-
sulatus hup� [12] and 0.54 g dry cell weight/Lc for R. capsulatus
DSM 1710 [14]. Total carbon, total nitrogen, chemical oxygen
demand and ammonia analysis were carried out spectro-
photometrically using Hach-Lange TOC, TNT, COD and
NH4eN kit (DR/2400 HacheLange Spectrophotometer,
Germany). The pH was measured with a pH-meter (Met-
tlereToledo); temperature was monitored with a temperature
probe (Elimko E680 Universal Data Loggers/Scanners, Turkey)
plunged into the photobioreactors. A cooler (Pnoso, PSS Series
Process Water Cooler, Turkey) was used to cool the chilled
water circulating through PVC tube inserted into the photo-
bioreactor (Fig. 1). The organic acid analyses were done via
high performance liquid chromatography (Shimadzu 10A
series) equipped with a UV detector (Shimadzu FCV-10AT)
with absorbance set at 210 nm and Alltech IOA-1000 organic
acid column (300 mm � 7.8 mm). H2SO4 (0.085 M) was used as
the mobile phase pumped at a flow rate of 0.4 ml/min using
a low gradient pump (Shimadzu LC-10AT). The oven temper-
ature was kept constant at 66 �C and 10 ml of samples were
analyzed. Produced gas was analyzed using thermal conduc-
tivity detector by gas chromatography (Agilent Technologies
6890N) using Supelco Carboxen 1010 column. The oven,
injector and detector temperatures were 140, 160 and 170 �C,respectively. Argon gas was used as a carrier gas at a flow rate
of 25 ml/min. Global total solar radiation data for Ankara
region related to the experimental period were taken from the
National Meteorology Institute of Turkey. All measurements
were done in the samples taken before feeding.
Molar hydrogen productivity QH2was estimated by
dividing cumulative molar hydrogen produced ðNH2 Þ by the
working volume of the photobioreactor (VPBR) and the total
illumination time (t) as shown in Eq. (1), below. Daily hydrogen
produced ðNH2 Þ was corrected for the pressure and tempera-
ture recorded at measuring day and time.
QH2¼ ��VH2
=22:4�� PH2
� �273=TH2
���ðVPBR � tÞ (1)
where, VH2is the volume of the evolved hydrogen; PH2
is the
pressure of the evolved hydrogen, which was assumed to be
equivalent to the barometric pressure, i.e. 0.9 atm in Ankara,
Turkey; TH2is the temperature of the evolved hydrogen; VPBR is
the working volume of the photobioreactor; t is the illumina-
tion time during the experimental period.
The molar yield (%YN) of the photofermentation process
was calculated as the percent ratio of the cumulative moles of
hydrogen which was produced ððNH2 ÞexpÞ to the theoretical
moles of hydrogen that can be produced from utilized organic
acids (acetic and lactic acid) ððNH2 ÞtheoÞ as given below;
%YN ¼ �NH2ðexpÞ=NH2ðtheoÞ�� 100 (2)
The stoichiometric equations for the calculation of the
theoretical moles of hydrogen by converting utilized acetic
and lactic acid are given below:
Acetic Acid : C2H4O2 þ 2H2O/4H2 þ 2CO2 (3)
Lactic Acid : C3H6O3 þ 3H2O/6H2 þ 3CO2 (4)
The moles of utilized acetic acid ðNutAA Þ and lactic acid
ðNutLA Þ were estimated as shown in Eqs. (5) and (6),
respectively.
NutAA ¼ CPBRAA� VPBR þ
n� CF �
Xni
CPBRAA
!� VF (5)
NutLA ¼ CPBRLA � VPBR þ n� CF �
Xni
CPBRLA
!� VF (6)

i n t e r n a t i o n a l j o u r n a l o f h y d r o g e n en e r g y 3 6 ( 2 0 1 1 ) 1 1 3 6 0e1 1 3 6 8 11363
where CPBRAAand CPBRLA
are the acetic and lactic acid concen-
trations in the photobioreactor at the end of batch phase, VPBR
is the working volume of the photobioreactor; CF is the acetic/
lactic acid concentration in the feeding media; VF is the
volume of the feeding media; n is the number of days that
acetic and lactic acid were fed; and CPBRAA and CPBRLA are the
concentrations of acetic and lactic acid that was removed
before feeding.
Acetate conversion efficiency (% hAA) for the continuous
operation was calculated by dividing the moles of acetic acid
utilized ðNutAA Þ to that was fed to the photobioreactor ðNinAAÞ
(Eq. (7)).
%hAA ¼ NutAA=NinAA� 100 (7)
3. Results and discussions
3.1. Growth and hydrogen production
Variations in the daily hydrogen production and cell concen-
tration in outdoor continuous photobioreactor run by R. capsu-
latus hup- are shown in Fig. 2. After the inoculation, thebiomass
concentration was 0.16 gdcw/Lc. The continuous feeding was
started on the 11th day where the biomass concentration
reached to 0.45 gdcw/Lc. The cell concentration in the photo-
bioreactor increased till 23th day then it stabilized around
0.9 gdcw/Lc. The hydrogen production started on the 5th day.
Daily hydrogenproduction varied from0.7 to 2.1 L/daybetween
11 and 40th days of the experiment. After 40th day daily
hydrogen production decreased and between 41th and 75th
days it varied from 0.2 to 1.0 L/day. Themaximumproductivity
(0.67 mmol H2/Lc.h) and molar yield (78%) were obtained
between 11 and 40th days. Hydrogen productivity decreased to
0.38 mmol H2/Lc.h and molar yield was 42% of the theoretical
maximum between 41th and 75th days. The produced gas was
90e95% H2, the rest being CO2. The overall acetate conversion
efficiency for continuous operation was 77%.
Fig. 2 e Growth and hydrogen production in outdoor continuous
DFE. Starting date of the experiment was 30.07.09. Feeding was
Fig. 3 illustrates variations in the daily hydrogen production
and biomass in outdoor continuous photobioreactor run by R.
capsulatus DSM 1710. The initial biomass concentration was
0.3 gdcw/Lc. The continuous feedingwas started on the 6th day
where the biomass concentration reached to 0.7 gdcw/Lc. The
cell concentration in thephotobioreactor increased to 1.0 gdcw/
Lc till 18th day then it gradually decreased to 0.7 gdcw/Lcbetween 18th and 49th day. After 49th day cell concentration
started to increase and reached to 0.9 gdcw/Lc at the end of the
experiment. The hydrogen production started on the 5th day.
The hydrogen productivity was 0.22 mmol H2/Lc.h and molar
yield was 10% that were obtained in the first 5 days. Hydrogen
productivity increased to 0.50 mmol H2/Lc.h and molar yield
was 50% of the theoretical maximum between 6th and 41st
days. After 41st day the hydrogen productivity and yield were
0.28mmolH2/Lc.h and 36%, respectively. The produced gaswas
90e95% H2, the rest being CO2. The overall acetate conversion
efficiency for continuous operation was also 77%.
Uptake hydrogenase is a membrane metalloprotein which
physiologically function as H2-uptake hydrogenase. In PNS
bacteria the uptake hydrogenases, mostly belonging to Class I
of [NiFe]hydrogenases, catalyze the conversion of molecular
hydrogen into proton and electron, whereby decreasing the
efficiency of hydrogen production. Deletion of the gene was
shown to improve hydrogen production in several PNS bacteria
including R. capsulatus, R. sphaeroides, Rhodospirillum rubrum
[12,19,20]. In this study, the uptake hydrogenase deficient
strain of R. capsulatus resulted in higher hydrogen productivity
and higher yield which is in agreement with the previous
results obtained in batch cultures on molasses DFE [15].
3.2. Organic acid consumption
In Fig. 4 organic acid concentrations in the photobioreactor
run by R. capsulatus hup- are depicted. The photobioreactor
was started to be fed with 10% daily feeding rate at the 11th
day. During the batch operation 30% of acetate that was
initially fed was consumed. After feeding started the acetate
photobioreactor run by R. capsulatus hup- on the molasses
started at 11th day.

Fig. 3 e Growth and hydrogen production in outdoor continuous photobioreactor run by R. capsulatus DSM 1710 on the
molasses DFE. Starting date of the experiment was 17.08.09. Feeding was started at 6th day.
i n t e rn a t i o n a l j o u r n a l o f h y d r o g e n en e r g y 3 6 ( 2 0 1 1 ) 1 1 3 6 0e1 1 3 6 811364
concentration in the photobioreactor continued to decrease
due to simultaneous hydrogen production and biomass
growth in following 14 days. The acetate concentration in the
photobioreactor continued to decrease even after the feeding
started. After 40th day, acetate accumulated in the photo-
bioreactor and at 75th day its concentration reached to 12mM.
Lactic acid was completely consumed throughout the exper-
iment. Propionic and butyric acid formation was negligible.
However, formic acidwas produced in a considerable amount.
It reached to its maximum value (28 mM) at 26th day and
gradually decreased to 16 mM at 75th day.
The variation in the organic acid concentrations in the
photobioreactor run by R. capsulatus DSM 1710 is illustrated in
Fig. 5. Theacetatewhichwas initially fed to thephotobioreactor
Fig. 4 e Organic acid consumption in outdoor continuous photo
Starting date of the experiment was 30.07.09. Feeding was star
was consumedby 93% in thebatch period. At the 6thday before
feeding started its concentration was 2.7 mM. After 16th day
acetate in the photobioreactor started to accumulate in the
photobioreactor.At theendof theexperiment its concentration
was 10 mM. Lactic acid was completely consumed throughout
the experiment. Propionic and butyric acid formation was
negligible. There was a considerable amount of formic acid
production in this photobioreactor, too. Its concentration
reached to 26 mM at the 19th day. After 25th day its concen-
tration decreased gradually and reached to 14mMat the end of
the experiment.
Differences in consumption of acetate in the batch phase
correlate well with biomass accumulation trends of both
bacteria. R. capsulatus hup-, which exhibited a longer lag phase
bioreactor runs by R. capsulatus hup- on the molasses DFE.
ted at 11th day.

Fig. 5 e Organic acid consumption in outdoor continuous photobioreactor runs by R. capsulatus DSM 1710 on the molasses
DFE. Starting date of the experiment was 17.08.09. Feeding was started at 6th day.
i n t e r n a t i o n a l j o u r n a l o f h y d r o g e n en e r g y 3 6 ( 2 0 1 1 ) 1 1 3 6 0e1 1 3 6 8 11365
of growth, consumed less acetate during batch operation,
while thewild type R. capsulatus, which grew faster, consumed
more acetate during the same period. During fed-batch oper-
ation, biomass was stabilized and acetate was consumed
mainly for hydrogen production. As hydrogen productivity
decreased towards the end of the operation, acetate accu-
mulated. Formate was produced simultaneously with the
increase in biomass, for both strains.
3.3. Impact of solar radiation on hydrogen production
The daily global solar radiation versus daily hydrogen
production in the photobioreactors R. capsulatus hup- and
R. capsulatusDSM 1710 are shown in Figs. 6 and 7, respectively.
Fig. 6 e Daily global solar radiation energy versus daily hydrogen
R. capsulatus hup- on the molasses DFE. Starting date of the exp
The daily global solar radiation energy decreased from 7000 to
1700 Wh/m2 during the experiments. A direct relation
between the hydrogen production and daily global solar
radiation energy was observed for both reactors. As the daily
global solar radiation decreases daily hydrogen production
also decreases.
3.4. Temperature variation in the photobioreactors
The temperature in the photobioreactors was controlled with
chilled water circulating through the internal coil. The photo-
bioreactor temperature was controlled around 35 �C by
running the cooler for 9 h in day-time in the photobioreactor
run by R. capsulatus hup- for 55 days and in the photobioreactor
production in outdoor continuous photobioreactor runs by
eriment was 30.07.09. Feeding was started at 11th day.

Fig. 7 e Daily global solar radiation energy versus daily hydrogen production in outdoor continuous photobioreactor runs by
R. capsulatus DSM 1710 on the molasses DFE. Starting date of the experiment was 17.08.09. Feeding was started at 6th day.
i n t e rn a t i o n a l j o u r n a l o f h y d r o g e n en e r g y 3 6 ( 2 0 1 1 ) 1 1 3 6 0e1 1 3 6 811366
run by R. capsulatus DSM 1710 for 35 days. After 55th day of
photobioreactor run by R. capsulatus hup- and 35th day of
photobioreactor run by R. capsulatus DSM 1710 the photo-
bioreactors were not cooled because of the low air tempera-
ture. Hence, there were fleeting temperature increases above
45 �C in the photobioreactors in several days. The cell
concentration in the photobioreactors was not affected
significantly from these temperature increases. However,
hydrogen productivity and yield decreased. At the same
period, the temperature of the photobioreactors decreased
below 10 �C during nights, due to seasonal reasons. It may be
one of the reasons causing a decrease in hydrogen productivity
and acetate consumption. Extreme temperature variations
were reported to decrease the hydrogen production signifi-
cantly, in batch cultures of R. capsulatus [18]. The optimum
temperature for hydrogen production by R. capsulatus is 30 �C.Hence, in outdoor experiments a control for minimum and
maximum temperature is required during day and night.
3.5. Evaluation of the maximum productivity and yields
Table 2 summarizes TOC, TN, COD and NHþ4 values in the feed
at the first day and in the effluent at the last day of experiments
Table 2 e TOC, TN, COD and NHD4 concentration in the
feed and in the effluent of photobioreactor.
R. capsulatus hup- R. capsulatus DSM 1710
Component Feed Effluent Effluent
TOC (mg/L) 1870 1200 1830
TN (mg/L) 420 42 129
C/N 5 29 14
COD (mg/L) 6500 4890 5880
NHþ4 (mg/L) 1 0.6 0.0
in the photobioreactors. The total organic carbon (TOC) and the
total nitrogen (TN) in the photobioreactors reduced due to
cellular activity. The C/N ratio increased during operation
which is critical for hydrogen production by photosynthetic
bacteria [16]. That might be due to a higher consumption rate
of nitrogen sources present in themolasses DFE such as amino
acids and ammonia. The optimum C/N ratio is suggested as 20
in continuous operations by R. capsulatus hup- [17]. Ammonia
present in the molasses DFE was utilized completely and no
ammonia inhibitionwas observed. In batch operation theDFEs
with low ammonia content are essential for the high hydrogen
productivity since the ammonia is the strong inhibitor of the
nitrogenase enzyme [15].
Table 3 summarizes the productivities, and yields in the
photobioreactors. The maximum hydrogen yield achieved
with R. capsulatus hup- was 78% (of the theoretical maximum)
in continuous operation which was much higher than the
yield obtained by R. capsulatus DSM 1710 (50% of theoretical
maximum) at the same operating conditions. The maximum
hydrogen productivity of R. capsulatus hup- on the molasses
DFE was 0.67 mmol H2/Lc.h which is higher than the produc-
tivity of the wild type strain (0.50 mmol H2/Lc.h).
Table 3 e Maximum molar hydrogen productivity andyields.
Microorganism Process Maximumhydrogen
productivityðQH2
Þmmol H2/(Lc.h)
MaximumMolarYield
(YN) (%)
R. capsulatus
hup-
Batch [15] 1.37 58
Continuous 0.67 78
R. capsulatus
DSM 1710
Batch [15] 0.75 20
Continuous 0.50 50

i n t e r n a t i o n a l j o u r n a l o f h y d r o g e n en e r g y 3 6 ( 2 0 1 1 ) 1 1 3 6 0e1 1 3 6 8 11367
A promising outcome of the continuous operations is that
the yields obtained in continuous cultures of both R. capsulatus
hup- and R. capsulatus DSM 1710 are higher than that obtained
in batch cultures (Table 3).
4. Conclusions
In this study photobiological hydrogen production on dark
fermentor effluent of molasses was achieved at a high rate
and productivity using R. capsulatus hup- and R. capsulatusDSM
1710. The biomass concentration remained stable for 2
months of operation. Hydrogen productivity and yield are
higher at high light intensity; they decrease with decreasing
light intensity due to seasonal changes.
This study showed that, the molasses DFE can be used as
a substrate for long term photofermentative hydrogen produc-
tion in outdoor conditions. During summer the maximum
temperature should not be higher than 38 �C. The temperature
was effectively controlled by placing internal cooling coil into
the panel reactor. For stable operation, controlling the
maximum temperature during the day and the minimum
temperature during the night is strongly recommended.
Acknowledgements
This study was supported by Hyvolution the EU 6th Frame-
work Integrated Project 019825: Non-thermal production of
pure hydrogen from biomass. We thank to Dr. Truus de Vrije
fromWageningen UR, Food and Biobased Research group, The
Netherlands for supplying molasses DFE. We acknowledge
Kerime Guney from Department of Chemical Engineering and
Tamay S‚ eker from Central Laboratory of Middle East Tech-
nical University, Ankara, Turkey, for carrying out elemental
and organic acid analysis.
Symbols
C Concentration, (mM)
Lc Liter culture
N Number of moles, (mole)
n number of days
P Pressure, (atm)
PBR Photobioreactor
PNS Purple non-sulfur bacteria
QH2Molar productivity of hydrogen, (moleH2/Lc.h)
R Rhodobacter
V Volume, (L)
T Temperature, (�C),t Time, (h)
Y Yield (%)
Greek letters
h Efficiency (%)
Subscript
c Culture
exp Experimental
F Feed
i Initial
theo Theoretical
ut Utilized
Abbreviations
AA Acetic acid
BA Butyric acid
C/N Carbon to Nitrogen Ratio
COD Chemical oxygen demand, (mg/L)
DFE Dark Fermentor Effluent
FA Formic acid
GC Gas Chromatography
hup- Uptake hydrogenase deficient (mutant)
HPLC High Performance Liquid Chromatography
LA Lactic acid
PA Propionic acid
TN Total nitrogen, (mg/L)
TOC Total organic carbon, (mg/L)
r e f e r e n c e s
[1] Das D, Veziroglu TN. Hydrogen production by biologicalprocesses: a survey of literature. Int J Hydrogen Energy 2001;26:13e28.
[2] Hawkins S, Joffe D. Technological characterization ofhydrogen production technologies. UKSHEC social scienceworking paper No. 25. London: Policy Studies Institute,http://www.psi.org.uk/ukshec/publications.htm; 2005[accessed 20. 08. 09].
[3] Pilavachi PA, Chatzipanagi AI, Spyropoulou AI. Evaluation ofhydrogen production methods using the analytic hierarchyprocess. Int J Hydrogen Energy 2009;34:5294e303.
[4] Nath K, Das D. Biohydrogen production as a potential energyresource-present state of art. J Sci Ind Res 2004;63:729e38.
[5] Claassen PAM, Vrije T. Non-thermal production of purehydrogen from biomass: hyvolution. Int J Hydrogen Energy2006;31:1416e23.
[6] Muradov NZ, Veziroglu TN. “Green” path from fossil-based tohydrogen economy: an overview of carbon-neutraltechnologies. Int J Hydrogen Energy 2008;33:6804e39.
[7] Li JZ, Zheng GC, He JG, Chang S, Qin Z. Hydrogen-producingcapability of anaerobic activated sludge in three types offermentations in a continuous stirred-tank reactor.Biotechnol Adv 2009;27:573e7.
[8] Guo WQ, Ren NQ, Wang XJ, Xiang WS, Meng ZH, Ding J.Biohydrogen production from ethanol-type fermentation ofmolasses in an expanded granular sludge bed (EGSB) reactor.Int J Hydrogen Energy 2008;33:4981e8.
[9] Ren N, Li J, Li B, Wang Y, Liu S. Biohydrogen production frommolasses by anaerobic fermentation with a pilot-scalebioreactor system. Int J Hydrogen Energy 2006;31:2147e57.
[10] Ren NQ, Xing DF, Rittmann BE, Zhao LH, Xie TH, Zhao X.Microbial community structure of ethanol type fermentationin bio-hydrogen production. Environ Microbiol 2007;9:1112e25.
[11] Ozgur E, Afsar N, Vrije T, Yucel M, Gunduz U, Classen PAM,et al. Potential use of thermophilic dark fermentationeffluents in photofermentative hydrogen production byRhodobacter capsulatus. J Cleaner Prod 2010;18:S23e8.
[12] Ozturk Y, Yucel M, Daldal F, Mandacı S, Gunduz U, Turker L,et al. Hydrogen production by using Rhodobacter capsulatusmutants with genetically modified electron transfer chains.Int J Hydrogen Energy 2006;31:1545e52.
i n t e rn a t i o n a l j o u r n a l o f h y d r o g e n en e r g y 3 6 ( 2 0 1 1 ) 1 1 3 6 0e1 1 3 6 811368
[13] Uyar B, Eroglu I, Yucel M, Gunduz U, Turker L. Effect of lightintensity, wavelength and illumination protocol on hydrogenproduction in photobioreactors. Int J Hydrogen Energy 2007;32:4670e7.
[14] Uyar B. Hydrogen production by microorganisms on solarbioreactors. Ankara, Turkey: Middle East TechnicalUniversity; 2008, Ph. D. thesis in Biotechnology.
[15] Ozgur E, Mars AE, Peksel B, Louwerse A, Yucel M, Gunduz U,et al. Biohydrogen production from beet molasses bysequential dark and photofermentation. Int J HydrogenEnergy 2010;35:511e7.
[16] Eroglu I, Aslan K, Gunduz U, Yucel M, Turker L. Substrateconsumption rates for hydrogen production by Rhodobactersphaeroides in a column photobioreactor. J Biotechnol 1999;70:103e13.
[17] Androga DD. Biological hydrogen production on acetate incontinuous panel photobioreactors using Rhodobactercapsulatus. Turkey: Chemical Engineering Department ofMiddleEastTechnicalUniversity; 2009,MasterofSciencethesis.
[18] Ozgur E, Uyar B, Ozturk Y, Yucel M, Gunduz U, Eroglu I.Biohydrogen production by Rhodobacter capsulatus on acetateat fluctuating temperatures. Resour Conserv Recy 2010;54:310e4.
[19] Kars G, Gunduz U, Rakhely G, Yucel M, Eroglu I, Kovacs KL.Improved hydrogen production by uptake hydrogenasedeficient mutant strain of Rhodobacter sphaeroides O.U.001. IntJ Hydrogen Energy 2008;33:3056e60.
[20] Kern M, Klipp W, Klemme HJ. Increased nitrogenase-dependent H2 photoproduction by hupmutants ofRhodospirillum rubrum. Appl EnvironMicrob1994;60(6):1768e74.