Improvement of biohydrogen production and intensification of biogas formation
i n t e r n a t i o n a l j o u r n a l o f h y d r o g e n en e r g y 3 6 ( 2 0 1 1 ) 1 4 0 4 9e1 4 0 5 8
Avai lab le a t www.sc iencedi rec t .com
journa l homepage : www.e lsev ier . com/ loca te /he
Market and patent analysis of commercializing biohydrogentechnology
Wen-Hsiang Lai a,*, Hsiang-Yi Chen a, Feng-Yuan Chang b, Chueh-Cheng Wu c,Chiu-Yue Lin b, Sy-Ruen Huang c
aGraduate Institute of Management of Technology, Feng Chia University, Taichung 40724, TaiwanbResearch Center for Energy and Resource, Feng Chia University, Taichung, TaiwancCollege of Information and Electrical Engineering, Feng Chia University, Taichung, Taiwan
a r t i c l e i n f o
Article history:
Received 23 January 2011
Received in revised form
22 March 2011
Accepted 23 March 2011
Available online 17 May 2011
Keywords:
Biohydrogen
Fuel cell
Hydrogen energy
Patent analysis
Technology commercialization
* Corresponding author.E-mail address: [email protected] (W.-H.
0360-3199/$ e see front matter Copyright ªdoi:10.1016/j.ijhydene.2011.03.155
a b s t r a c t
In the face of world-wide energy price fluctuation, energy supply security, and the energy
crisis, it becomes an urgent issue to search for alternative methods for energy generation
and to close the gap between the supply and demand of global energy. The current method
of energy supply in Taiwan is through a centralized electronic power system, which is
generated by a few large electronic power plants. Hydrogen fuel cell (HFC) has a charac-
teristic of de-centralized electronic power supply system, which provides electronic power
more reliably, efficiently and economically. Based on the output of Taiwan’s sewage,
sludge, kitchen waste and biohydrogen technology, the preliminary market for bio-
hydrogen fuel cell (BHFC) is positioning itself toward the supply of public electronic power
within the housing communities. Based on the patent analysis of BHFC, this study finds
that Taiwan pays more attention to the front-end manufacturing of raw materials and
emphasizes the development of biohydrogen technology, while America and Japan mainly
pay more attentions to rear-end product application and emphasize the application of
hydrogen and fuel cells by integrating industrial opinions. Based on the market analysis of
BHFC, this study finds that the product attributes, consumers’ characteristics and external
variables strongly influence consumer’s purchase intention of biohydrogen technology
products.
Copyright ª 2011, Hydrogen Energy Publications, LLC. Published by Elsevier Ltd. All rights
reserved.
1. Introduction electric power, and it accounts for only 1% of the total
The usage of fossil energy has resulted in the public issue of
environmental pollution. This environment protection
concept forces human beings to rethink the usage of renew-
able energy and warrants serious consideration of renewable
energy equipment, construction environment, investment
costs, economy and enforcement use. Currently, the largest
renewable energy used in Taiwan is the traditional hydro-
Lai).2011, Hydrogen Energy P
domestic energy generation. Since the air pollution in Taiwan
is rapidly increasing [10], in order to promote Taiwan’s
hydrogen and fuel cell industries, an improvement program is
projected by the government to stimulate the development of
the hydrogen and fuel cell industries, with a goal to generate
an output valued at 4 billion NTD in 2011 and 13 billion NTD in
2016 and a potential output value approaching 100 billion NTD
in 2020. The current hydrogen market share of Taiwan is
ublications, LLC. Published by Elsevier Ltd. All rights reserved.

Table 1 e The biohydrogen technology and hydrogen production rate in Japan, Europe, China, and Taiwan.
Country Microorganism Immobilized cells Material sources Hydrogen generation rate
(L/h/L) (L/d/L)
Japan Rhodobacter spheroid Alginate Tofu water waste 0.051 1.2
Japan E. aerogenes HO-39 Porous glass beads Glucose 0.929 22.3
Japan E. aerogenes HY-2 Granular sludge Glucose 1.42 34.1
Europe E. aerogenes NCIMB 10102 Synthetic foam Starch 0.250 6.0
China Sludge Suspended bacteria Sugar water 0.23 5.5
Taiwan Sewage Sludge Granular sludge/immobilized cell Sucrose 14.1 338.4
Activated carbon 7.35 176.4
Source: RCER, FCU.
i n t e rn a t i o n a l j o u r n a l o f h y d r o g e n en e r g y 3 6 ( 2 0 1 1 ) 1 4 0 4 9e1 4 0 5 814050
about 5% of the world market. The output value in the distri-
bution of hydrogen production and operation is expected to
reach 5 billion NTD in 2020. Under the government’s plan, it is
foreseeable that Taiwan’s technology and industrial scale of
the hydrogen and fuel cell industry will occupy an important
position in the world market.
Dunn [2] (p. 236) addresses that “the most important
consequence of a hydrogen economy may be the replacement
of the 20th-century hydrocarbon society”. The preliminary
time frame of hydrogen energy development set by advanced
countries aims to reach a goal of starting production in
hydrogen technology development from 2010 to 2020, and
completing the systematic transformation of hydrogen energy
by 2050. Although hydrogen technology development and
application in Taiwan is behind the curvewhen comparedwith
other advanced countries, it still has the potential for making
a breakthrough in the technology by adopting biological
production of hydrogen (biohydrogen) technology develop-
ment. Feng Chia University (FCU) in Taiwan has achieved
outstanding results in hydrogen fermentation development of
granular sludge/immobilized cell systems in the fields of bio-
hydrogen technology and fuel cell system [11,12]. Even though
there are barriers of biohydrogen commercialization, such as
synthesizing hydrogen at sufficient rates to power sufficient-
sized fuel cells to work practically and purifying the bio-
hydrogen produced by biomass fermentation to eliminate
carbon dioxide (CO2), water vapor, and possible amounts of
hydrogen sulfide (H2S) [6e8] and [3] address that the bio-
hydrogenenergy technology is assessed tobe themost practical
potential technology, and therefore makes it highly possible to
enhance the future development of hydrogen energy.
1 Petroleum reserves 2.7 trillion barrels, which can supplyapproximately 30e50 years; natural gas reserves 5450 trillioncubic feet, which can supply approximately 40e60 years; coalreserves 1.1 trillion short tons, which can supply approximately180e200 years.
2. Market analysis of commercializingbiohydrogen technology
2.1. Introduction of energy technology and marketstatus
Nowadays general energy usage in the world, such as petro-
leum, natural gas, and coal, are non-renewable energy
resources. Since these non-renewable energy resources are
limited, people are constantly looking for new renewable
energy sources and technology in order to prevent any energy
shortage. According to the American Energy Information
Administration (EIA) estimation, it is possible that the non-
renewable energies will be exhausted after 30e50 years1.
Due to the shortage of non-renewable energy resources, the
growing demand of renewable energy and the urgency of
environmental protection become the major driving forces to
improve the development and commercialization of hydrogen
energy and fuel cell technology. However, since the hydrogen
energy is a fairly new and renewable energy, it not only faces
the competition of other renewable energies, but also needs to
overcome the obstacles on both the supply and demand sides.
2.2. Biohydrogen technology
Biohydrogen is considered as one of the key sustainable power
supplies in the world and is regarded as the versatile fuel of the
future and the potential replacement for fossil fuels [5]. Many
biomass studies have been focusing on the hydrogen genera-
tion since the discovery that the generated heat value of
hydrogen is 231 BTU/mol (244 kJ/mol), which averages more
than other hydrocarbon fuels. The fact that hydrogen is clean
and highly efficient has also contributed to promoting the
hydrogen energy to be themost potential substituted energy to
replace the current usage of fossil fuel. The present stage of
hydrogen energy generation is mainly in the restructuring of
industrial by-product, methanol, or natural gas. Since approx-
imately 96% of hydrogen energies are manufactured by
non-renewable materials, the development of biohydrogen
technology accords with the concepts of environment protec-
tion, economic efficiency and sustainable energy consumption.
In order to generate biohydrogen, the biodegradation and
bio-transformation methods used in the biohydrogen genera-
tion usually involve the bacteria of anaerobic bacteria, photo-
synthetic bacteria .etc. in order to transfer organic material
matter into hydrogen. If the transformation of organic degra-
dationofwastewaterorotherwastebiomaterialscanobtainthe
goalofenergygeneration, thenthisenergygenerationmethod is
completely consistent with the principles of environmental
protection, economic efficiency and resource recycling [1].
Based on FCU’s experimental results of biohydrogen, the tech-
nology has reached the model-factoring stage. The rate of bio-
hydrogengeneration isalso in the leadpositionwhencompared
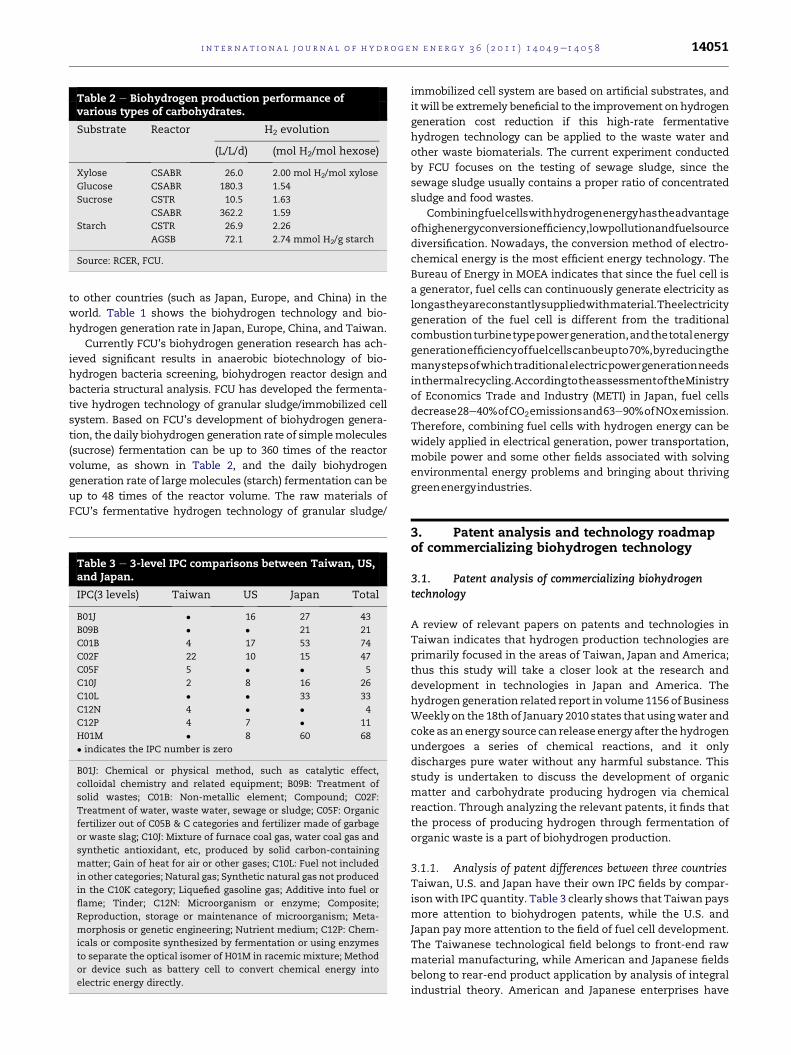
Table 2 e Biohydrogen production performance ofvarious types of carbohydrates.
Substrate Reactor H2 evolution
(L/L/d) (mol H2/mol hexose)
Xylose CSABR 26.0 2.00 mol H2/mol xylose
Glucose CSABR 180.3 1.54
Sucrose CSTR 10.5 1.63
CSABR 362.2 1.59
Starch CSTR 26.9 2.26
AGSB 72.1 2.74 mmol H2/g starch
Source: RCER, FCU.
i n t e r n a t i o n a l j o u r n a l o f h y d r o g e n en e r g y 3 6 ( 2 0 1 1 ) 1 4 0 4 9e1 4 0 5 8 14051
to other countries (such as Japan, Europe, and China) in the
world. Table 1 shows the biohydrogen technology and bio-
hydrogen generation rate in Japan, Europe, China, and Taiwan.
Currently FCU’s biohydrogen generation research has ach-
ieved significant results in anaerobic biotechnology of bio-
hydrogen bacteria screening, biohydrogen reactor design and
bacteria structural analysis. FCU has developed the fermenta-
tive hydrogen technology of granular sludge/immobilized cell
system. Based on FCU’s development of biohydrogen genera-
tion, the daily biohydrogen generation rate of simplemolecules
(sucrose) fermentation can be up to 360 times of the reactor
volume, as shown in Table 2, and the daily biohydrogen
generation rate of largemolecules (starch) fermentation can be
up to 48 times of the reactor volume. The raw materials of
FCU’s fermentative hydrogen technology of granular sludge/
Table 3 e 3-level IPC comparisons between Taiwan, US,and Japan.
IPC(3 levels) Taiwan US Japan Total
B01J � 16 27 43
B09B � � 21 21
C01B 4 17 53 74
C02F 22 10 15 47
C05F 5 � � 5
C10J 2 8 16 26
C10L � � 33 33
C12N 4 � � 4
C12P 4 7 � 11
H01M � 8 60 68
� indicates the IPC number is zero
B01J: Chemical or physical method, such as catalytic effect,
colloidal chemistry and related equipment; B09B: Treatment of
solid wastes; C01B: Non-metallic element; Compound; C02F:
Treatment of water, waste water, sewage or sludge; C05F: Organic
fertilizer out of C05B & C categories and fertilizer made of garbage
or waste slag; C10J: Mixture of furnace coal gas, water coal gas and
synthetic antioxidant, etc, produced by solid carbon-containing
matter; Gain of heat for air or other gases; C10L: Fuel not included
in other categories; Natural gas; Synthetic natural gas not produced
in the C10K category; Liquefied gasoline gas; Additive into fuel or
flame; Tinder; C12N: Microorganism or enzyme; Composite;
Reproduction, storage or maintenance of microorganism; Meta-
morphosis or genetic engineering; Nutrient medium; C12P: Chem-
icals or composite synthesized by fermentation or using enzymes
to separate the optical isomer of H01M in racemic mixture; Method
or device such as battery cell to convert chemical energy into
electric energy directly.
immobilized cell system are based on artificial substrates, and
it will be extremely beneficial to the improvement on hydrogen
generation cost reduction if this high-rate fermentative
hydrogen technology can be applied to the waste water and
other waste biomaterials. The current experiment conducted
by FCU focuses on the testing of sewage sludge, since the
sewage sludge usually contains a proper ratio of concentrated
sludge and food wastes.
Combiningfuelcellswithhydrogenenergyhastheadvantage
ofhighenergyconversionefficiency,lowpollutionandfuelsource
diversification. Nowadays, the conversion method of electro-
chemical energy is the most efficient energy technology. The
Bureau of Energy in MOEA indicates that since the fuel cell is
a generator, fuel cells can continuously generate electricity as
longastheyareconstantlysuppliedwithmaterial.Theelectricity
generation of the fuel cell is different from the traditional
combustionturbinetypepowergeneration,andthetotalenergy
generationefficiencyoffuelcellscanbeupto70%,byreducingthe
manystepsofwhichtraditionalelectricpowergenerationneeds
inthermalrecycling.AccordingtotheassessmentoftheMinistry
of Economics Trade and Industry (METI) in Japan, fuel cells
decrease28e40%ofCO2emissionsand63e90%ofNOxemission.
Therefore, combining fuel cells with hydrogen energy can be
widely applied in electrical generation, power transportation,
mobile power and some other fields associated with solving
environmental energy problems and bringing about thriving
greenenergyindustries.
3. Patent analysis and technology roadmapof commercializing biohydrogen technology
3.1. Patent analysis of commercializing biohydrogentechnology
A review of relevant papers on patents and technologies in
Taiwan indicates that hydrogen production technologies are
primarily focused in the areas of Taiwan, Japan and America;
thus this study will take a closer look at the research and
development in technologies in Japan and America. The
hydrogen generation related report in volume 1156 of Business
Weekly on the 18th of January 2010 states that usingwater and
coke as an energy source can release energy after thehydrogen
undergoes a series of chemical reactions, and it only
discharges pure water without any harmful substance. This
study is undertaken to discuss the development of organic
matter and carbohydrate producing hydrogen via chemical
reaction. Through analyzing the relevant patents, it finds that
the process of producing hydrogen through fermentation of
organic waste is a part of biohydrogen production.
3.1.1. Analysis of patent differences between three countriesTaiwan, U.S. and Japan have their own IPC fields by compar-
isonwith IPC quantity. Table 3 clearly shows that Taiwan pays
more attention to biohydrogen patents, while the U.S. and
Japan pay more attention to the field of fuel cell development.
The Taiwanese technological field belongs to front-end raw
material manufacturing, while American and Japanese fields
belong to rear-end product application by analysis of integral
industrial theory. American and Japanese enterprises have
Fig. 1 e IPC distributions of Taiwan, U.S. and Japan (before 1999).
i n t e rn a t i o n a l j o u r n a l o f h y d r o g e n en e r g y 3 6 ( 2 0 1 1 ) 1 4 0 4 9e1 4 0 5 814052
the potential of becoming partners to commercialize bio-
hydrogen technologies.
As shown in Fig. 1, Taiwan, U.S. and Japan have begun to
research alternate energy sources. The meeting held by the
OPEC member countries in Hague to discuss a production
reduction protocol to reduce the gasoline has caused the oil
prices to increase dramatically since 1999. As shown in Fig. 2,
the number of patents has increased greatly since 2000 due to
the triple oil prices induced by the violent confrontations
between Israel and Palestine, as well as the tense situations
occurring in the Middle East.
Fig. 2 e IPC distributions of Taiwa
This study compares the variations of Taiwan, Japan and
the U.S. during the entire patent development process by
utilizing the above technology life cycle (TLC) chart. According
to the TLC, Japan starts the patent development in 1983, while
the U.S. begins in 1974, which is the year after the global oil
crisis, and Taiwan launches in 1995. Taiwan and Japan have
similar developmental modes during the initial development
period due to a high technological threshold of energy substi-
tution. Both show no significant development during the
exploration stage, until the 5th year of patent development,
where the average patent development outcome reaches 24
n, U.S. and Japan (after 2000).
Initial technical period
Polic
y
Renewable Energy Statute Draft Renewable Energy Statute
Research & development plan of anaerobe biohydrogen
plasma reconstruction & gas production technology 1970
2005 to 2008
1972solar energy gas production technology
1997biomass energy reconstruction & gas production technology
2000 separated assisting reconstruction & gas production technology
2005gas production technology of plasma bio-diesel oil
Middle technical period
In 2001 June in 2009
AFC PEMFC PAFC
MCFC SOFC
hydrogen power October in 2009
2004 portable fuel cell
2002electric hydrogen locomotive
Micro fuel cell 2000
2001 Hydrogen vehicle
at the end of 2002 1,000W fuel cell power generation
2003hydrogen station
April in 2004hydrogen village & highway
Future objective
the 20th century 2005 2010
gas production technology of anaerobe (waste/waste water)
2008
To promote hydrogen station, highway and village development in Taiwan
Tec
hnol
ogy
2015
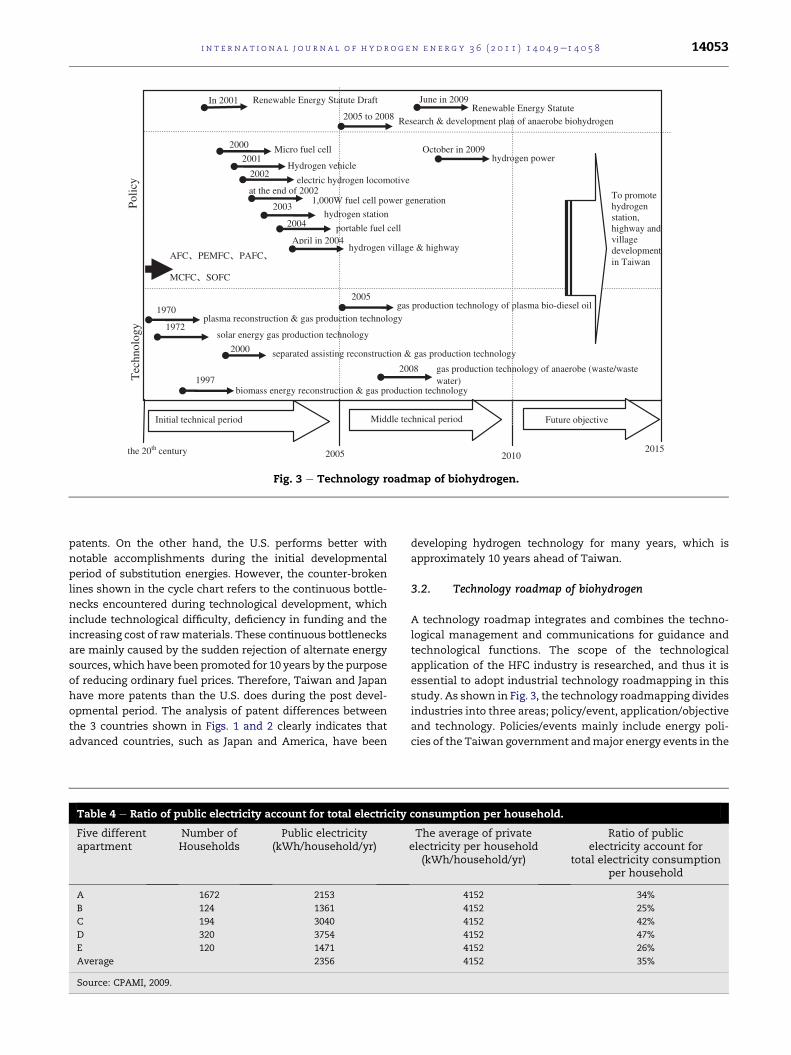
Fig. 3 e Technology roadmap of biohydrogen.
i n t e r n a t i o n a l j o u r n a l o f h y d r o g e n en e r g y 3 6 ( 2 0 1 1 ) 1 4 0 4 9e1 4 0 5 8 14053
patents. On the other hand, the U.S. performs better with
notable accomplishments during the initial developmental
period of substitution energies. However, the counter-broken
lines shown in the cycle chart refers to the continuous bottle-
necks encountered during technological development, which
include technological difficulty, deficiency in funding and the
increasing cost of rawmaterials. These continuous bottlenecks
are mainly caused by the sudden rejection of alternate energy
sources, which have been promoted for 10 years by the purpose
of reducing ordinary fuel prices. Therefore, Taiwan and Japan
have more patents than the U.S. does during the post devel-
opmental period. The analysis of patent differences between
the 3 countries shown in Figs. 1 and 2 clearly indicates that
advanced countries, such as Japan and America, have been
Table 4 e Ratio of public electricity account for total electricity
Five differentapartment
Number ofHouseholds
Public electricity(kWh/household/yr)
A 1672 2153
B 124 1361
C 194 3040
D 320 3754
E 120 1471
Average 2356
Source: CPAMI, 2009.
developing hydrogen technology for many years, which is
approximately 10 years ahead of Taiwan.
3.2. Technology roadmap of biohydrogen
A technology roadmap integrates and combines the techno-
logical management and communications for guidance and
technological functions. The scope of the technological
application of the HFC industry is researched, and thus it is
essential to adopt industrial technology roadmapping in this
study. As shown in Fig. 3, the technology roadmapping divides
industries into three areas; policy/event, application/objective
and technology. Policies/events mainly include energy poli-
cies of the Taiwan government andmajor energy events in the
consumption per household.
The average of privateelectricity per household
(kWh/household/yr)
Ratio of publicelectricity account for
total electricity consumptionper household
4152 34%
4152 25%
4152 42%
4152 47%
4152 26%
4152 35%
Table 5 e Explanations of applied parameters.
Explanations Mathematic symbols and units
Daily kitchen garbage per household K, (kg/day)
Addition proportion of the molecule (sucrose) a, 0 < a
(For example: a ¼ 0.5, which means the proportion of molecule
and sewage is 1:1/a ¼ 1:2, i.e. if 1 molecule unit is added,
2 units of sewage should be put into the reaction.)
The rate of hydrogen production b, (L/L/day means how many liters of hydrogen can be
generated from each liter of substrates every day.)
Daily sewage per household W, (L/day)
Daily biohydrogen production per household H, (L H2/household/day)
Conversion power of hydrogen to electrical energy
(by quoting the data of the MF-UTH series fuel cell
produced by M-FIELD Energy Ltd.)
1 kWh/d ¼ 750 L H2/day
(which indicates that 1 kWh of electricity consumes 750 L
of hydrogen)
Electricity production per household Ed, (kWh/household/day)
Annual electricity production per household Ey, (kWh/household/yr)
i n t e rn a t i o n a l j o u r n a l o f h y d r o g e n en e r g y 3 6 ( 2 0 1 1 ) 1 4 0 4 9e1 4 0 5 814054
world. Applications/objectives can be decomposed for fuel cell
usages in hydrogen and those products used in HFC. Tech-
nology layer refers to the analysis process of hydrogen
production technology. Fig. 3 shows the technology roadmap
of biohydrogen.
In Fig. 3 the technology aspect includes four states within
the initial technical period: plasma reconstruction and
hydrogen production technology (in 1970), solar energy
hydrogen production technology (in 1972), biomass recon-
struction and hydrogen production technology (in 1997), as
well as separated assisting reconstruction and hydrogen
production technology (in 2000). These four states together
promote an industrial plan with the government policy.
Taiwan’s government proposes the draft of “Renewable
Energy Act” in 2001 for environmental energy resources and
protections. However, it is not ratified and formally issued by
Legislature until June of 2009.
From the analysis of patent quantity, it is also clear that as
Taiwan develops hydrogen production technology, America
and Japan are applying fuel cells to the application products. A
collaborative relationship may exist between Japan and
Taiwan for their similar landform and resources. For instance,
the Japanese government subsidizes small power generation
units of 1 kWe5 kW, and Taiwan’s government follows up
with research on the small biohydrogen power generation
units. The raw materials used for anaerobe hydrogen
production technology in FCU vary from green algae to
drained waste and waste water for recovery and re-utilization
Table 6 e Substitution values of reaction parameters.
Parameters Substitution data
Daily kitchen garbage per household (K) 0.2805 (kg/day)
Additional proportion of the molecule
(sucrose) (a)
0.1
Daily sewage per household (W) 671 (L/day)
Reaction rate of hydrogen
production including that
from the molecule (sucrose) (b1)
362.2(L/L/day)
Reaction rate of hydrogen production
from the sewage only (b2)
0.02(L/L/day)
during the current phase. The biohydrogen technology system
is not only a technology but also a tool for supporting
renewable energy development in the future.
3.3. An example of future biohydrogen generation vs.waste biomaterials in Taichung city, Taiwan
According to the statistical report from the Taiwan Environ-
mental Protection Administration (EPA), the total population
in Taichung city is approximately 1,061,000 and produced
311,718 tons of garbage in 2008, and 53.49% of the total garbage
in Taichung is collected from the recycling of food wastes and
other recyclable waste material (food waste is 12.46%).
Therefore, the average amount of garbage produced per day
per person is 0.864 (kg), and the average amount of food waste
per day per person is 0.1002 (kg).
On the other hand, the sewage treatment plants deal with
living wastewater, which includes sprinkler irrigation water,
toilet water, industrial cooling water, agricultural irrigation
water, sewage sludge used in composting, run off and mate-
rials used in the building industry. There are two sewage
treatment plants, “Fu Tien” and “Li Ming”, in Taichung City,
and the total volume of sewage treatment is 76,000 cubic
meters/day (CMD). However, the domestic sewage effluence
discharged is difficult to estimate. Therefore, this study cites
the data from the research report “The amount of domestic
sewage and pollution in Taiwan” from the Taiwan Construc-
tion and Planning Agency Ministry of the Interior (CPAMI) and
uses 240 lpcd as the average volume of sewage a person
Table 7 e Ratio of biohydrogen electricity generation.
Number ofhouseholds
Public electricityconsumption
(kWh/household/yr)
Ratio of biohydrogenelectricity generation
ðEy=PE� 100%Þ1672 2153 25.56%
124 1361 40.44%
194 3040 18.11%
320 3754 14.66%
120 1471 37.42%
Table 8 e Regression analysis of product attributes and consumer’s purchase intention.
Operation factors b T value Significant F test Adjusted R2 Significant
Comparative advantage 0.225*** 3.393 0.001*** 25.439 0.322*** 0.000***
Complexity 0.407*** 6.139 0.000***
Observability 0.344*** 5.181 0.000***
Note:***P < 0.001;**P < 0.01;*P < 0.05.
i n t e r n a t i o n a l j o u r n a l o f h y d r o g e n en e r g y 3 6 ( 2 0 1 1 ) 1 4 0 4 9e1 4 0 5 8 14055
produced daily in calculation. Apartment complexes are one
of the typical types of households in Taiwan, and the average
annual electricity consumption in each apartment complex
is approximately 4152 kWh, and the public electricity
consumption is approximately 35%. Therefore the average
household share of public electricity consumption is
2356 kWh/household/yr, and it varies with the amount of
public facilities and the frequency of usage, as shown in Table
4.
With the base of average per-capita daily sewage and
kitchen garbage in the Taiwan area and the common elec-
tricity consumption data in the Zhong-Ji Community as the
evaluation criteria, this study applies the experimental results
of fermentative hydrogen generation from biomass to esti-
mating energy released from the high-rate biohydrogen
production in an anaerobic atmosphere experiment by FCU
and the application can be utilized in a very common elec-
trical consumption. The equations of hydrogen generation,
daily electricity consumption per-capita, and annual elec-
tricity generation per household are shown below as equation
(1), equation (2), and equation (3). Table 5 defines the applied
parameters in the equations.
K��1þ a
a
�� b1 þ
�W � K
a
�� b2 ¼ H (1)
Ed ¼ H750
(2)
Ey ¼ Ed � 365 (3)
Household is used as the base unit to estimate the electricity
consumption in the community, and currently there are about
379,351 households in Taichung City. According to Table 5, the
data can be processed and calculated as the substitution data
listed in Table 6.
When the data in Table 6 are applied to the equations
(1)e(3), the target values are derived as follows:
Table 9 e Regression analysis of consumer characteristics and
Operation factors b T value
Acceptance of financial risk 0.003 0.039
Experience 0.443*** 6.538
Acceptance of social risk 0.333*** 4.920
Acceptance of psychological risk 0.058 0.858
Acceptance of physical risk 0.063 0.923
Level of acceptance of curiosity 0.095 1.398
Level of interest 0.032 0.470
Note:***P < 0.001;**P < 0.01;*P < 0.05.
H ¼ 1130:976ðLH2=household=dayÞ (4)
Ed ¼ 1:508ðkWh=household=dayÞ (5)
Ey ¼ 550:4039 ðkWh=household=yrÞ (6)
The data in equations (4)e(6) are analyzed with the
substitution proportion of biomass hydrogen production
releasing energy in order to supply common electricity
consumption, which was provided from Zhong-Ji Commu-
nity. The results are shown in Table 7, and it can be concluded
that the power supply percentage of biohydrogen used in
different communities can be as much as 40.44%. Therefore,
kitchen garbage and waste water can be utilized in bio-
hydrogen technologies for power generation so as to reduce
dependency on nuclear power generation and promote
environmental protection.
4. New product market survey
The developmental value of a new product is ultimately
determined by a consumer’s perception. This study adopts the
analysis of new product adaptation proposed by [4] to explore
the consumer acceptance of the BHFC product. The study
investigates several innovative technology-intensive product
categories and examines the perceived product characteris-
tics, environmental variables and consumer characteristics
on the impact level of purchase intentions. This model is then
used as the base structure for the design of the consumer
acceptance questionnaire survey.
This study adopts a progressive approach. First, it inter-
prets the field survey data from an industrial analysis for
the quantitative research through theoretical literature,
knowledge review, and proposed theory model, and then
designs a quantitative questionnaire. Second, it adopts the
consumer’s purchase intention.
Significant F test Adjusted R2 Significant
0.969 10.102 0.293*** 0.000***
0.000***
0.000***
0.392
0.358
0.164
0.639
Table 10 e Regression analysis of external environment and consumer’s purchase intention.
Operation factors b T value Significant F test Adjusted R2 Significant
Government policy 0.605* 10.349 0.000* 47.119 0.473*** 0.000***
Price 0.256* 4.374 0.000*
Time 0.227* 3.888 0.000*
Note:***P < 0.001;**P < 0.01;*P < 0.05.
i n t e rn a t i o n a l j o u r n a l o f h y d r o g e n en e r g y 3 6 ( 2 0 1 1 ) 1 4 0 4 9e1 4 0 5 814056
quantitative survey methodology to explore the market
acceptance of the BHFC product, current market status and
marketing recommendations.
4.1. Questionnaire samples
BHFC product is a renewable energy product, and the future
plan is to implement this product in newly constructed
apartments and community architectures, as it is related to
urban planning and community development. To ensure the
questionnaires reach specific and appropriate groups, it is
specially designed for Zhong-Ji Community, which is in the
Taichung City Community Planning interactive network and
constructed by the Department of Urban Development of
TaichungCity. 300 questionnaires aremailed to the randomly-
selected residents in Zhong-Ji Community, and 170 responses
are received, which constitutes a 56.67% response rate. Out of
the 170 questionnaires returned, 155 are valid, which consti-
tutes a validity rate of 91.18%.
4.2. Data analysis
4.2.1. Descriptive statisticsThe returned questionnaires show a gender ratio of 52%
female and 48% male, and most of the respondents are
between 25 to 29 years old and 40e44 years old. As for the
educational background, more than 80% of the test subjects
possess a bachelor degree or above. The occupations of the test
subjects include researchers, teachers, lawyers, and accoun-
tants, which make up nearly 24.5% of the subjects in the
survey. The majority of the test subjects have a monthly
income of NTD$30,001-$40,000, which is slightly above the
average income in Taiwan. More than 80% of the test subjects
recycle kitchen waste on a regular basis, which demonstrates
that most of the households in Zhong-Jin Community are
aware of the concept of environmental protection and are
practicing certain activities in support of it.
4.2.2. Regression4.2.2.1. The empirical analysis of the relationship betweenproduct’s attributes and consumer’s purchase intention. From the
consumer’s point of view, the perceived product’s attributes
Table 11 e Summary of hypothesis testing.
Hypothese
H1:The consumer’s perceived product attributes will have a positive im
H2:Consumer characteristics will have a positive impact on purchase in
H3:External environmental variable will have positive impact on purch
can be categorized into factors of “Comparative advantage”,
“Complexity” and “Observability”. This study finds that signif-
icant correlations exist between the factors: “Comparative
advantage” (P < 0.001), “Complexity” (P < 0.001) and “Observ-
ability” (P < 0.001), as shown in Table 8. Also, there is a positive
impact of consumer’s perception on a product’s attributes
toward the purchase intention. This study indicates a signifi-
cant regression between the relationships of “Complexity”,
“Observability” and “Comparative advantage” regarding
a product’s attributes, which affect a consumer’s purchase
intention.
4.2.2.2. The empirical analysis on the relationship betweenconsumer characteristics and purchase intention. Consumer’s
perceived product attributes can be categorized into factors of
“Acceptance of financial risk”, “Experience”, “Acceptance of
social risk”, “Acceptance of psychological risk”, “Acceptance
of physical risk”, “Level of acceptance of curiosity” and “Level
of interest”. This study finds that significant correlations exist
only between the factors of “Experience” (P < 0.001) and
“Acceptance of social risk” (P < 0.001), as shown in Table 9.
Also, this study finds a significant regression in the relation-
ship between consumer characteristics and consumer’s
purchase intention.
4.2.2.3. The empirical analysis on the relationship between theexternal environment and consumer’s purchase intention. Theattributes of consumer’s perceived product can be categorized
into factors of “Government policy”, “Price” and “Time”. This
study finds significant correlations between factors of
“Government policy” (P < 0.05), “Price” (P < 0.05) and “Time”
(P < 0.05), as shown in Table 10. This study also indicates
a significant regression in the relationship between external
environment and consumer’s purchase intention.
The empirical analysis result shows that regarding the
attributes of consumer’s perceived product, the product’s
“Complexity”, “Observability” and “Comparative advantage”
have a significant impact on the consumer’s purchase inten-
tion; and consumer characteristics of “Experiences” and
“Social risk” have a direct impact on consumer’s purchase
intention; and regarding the external environment variable,
the consumers consider that “Price”, “Time” and “Policy” have
Verification results
pact on purchase intention. Support
tention. Partially support
ase intention. Support
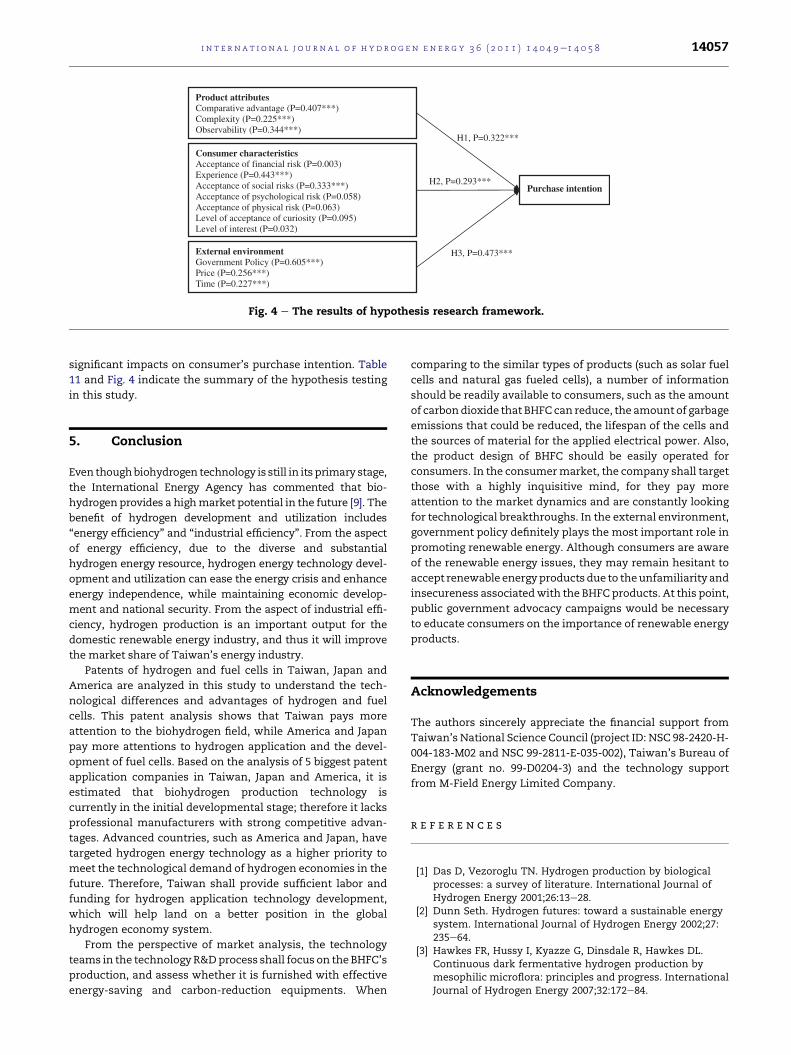
Product attributes Comparative advantage (P=0.407***) Complexity (P=0.225***) Observability (P=0.344***)
Consumer characteristics Acceptance of financial risk (P=0.003) Experience (P=0.443***) Acceptance of social risks (P=0.333***) Acceptance of psychological risk (P=0.058) Acceptance of physical risk (P=0.063) Level of acceptance of curiosity (P=0.095) Level of interest (P=0.032)
External environment Government Policy (P=0.605***) Price (P=0.256***) Time (P=0.227***)
Purchase intention
H1, P=0.322***
H2, P=0.293***
H3, P=0.473***
Fig. 4 e The results of hypothesis research framework.
i n t e r n a t i o n a l j o u r n a l o f h y d r o g e n en e r g y 3 6 ( 2 0 1 1 ) 1 4 0 4 9e1 4 0 5 8 14057
significant impacts on consumer’s purchase intention. Table
11 and Fig. 4 indicate the summary of the hypothesis testing
in this study.
5. Conclusion
Even thoughbiohydrogen technology is still in its primary stage,
the International Energy Agency has commented that bio-
hydrogen provides a highmarket potential in the future [9]. The
benefit of hydrogen development and utilization includes
“energy efficiency” and “industrial efficiency”. From the aspect
of energy efficiency, due to the diverse and substantial
hydrogen energy resource, hydrogen energy technology devel-
opment and utilization can ease the energy crisis and enhance
energy independence, while maintaining economic develop-
ment and national security. From the aspect of industrial effi-
ciency, hydrogen production is an important output for the
domestic renewable energy industry, and thus it will improve
the market share of Taiwan’s energy industry.
Patents of hydrogen and fuel cells in Taiwan, Japan and
America are analyzed in this study to understand the tech-
nological differences and advantages of hydrogen and fuel
cells. This patent analysis shows that Taiwan pays more
attention to the biohydrogen field, while America and Japan
pay more attentions to hydrogen application and the devel-
opment of fuel cells. Based on the analysis of 5 biggest patent
application companies in Taiwan, Japan and America, it is
estimated that biohydrogen production technology is
currently in the initial developmental stage; therefore it lacks
professional manufacturers with strong competitive advan-
tages. Advanced countries, such as America and Japan, have
targeted hydrogen energy technology as a higher priority to
meet the technological demand of hydrogen economies in the
future. Therefore, Taiwan shall provide sufficient labor and
funding for hydrogen application technology development,
which will help land on a better position in the global
hydrogen economy system.
From the perspective of market analysis, the technology
teams in the technologyR&Dprocess shall focus on the BHFC’s
production, and assess whether it is furnished with effective
energy-saving and carbon-reduction equipments. When
comparing to the similar types of products (such as solar fuel
cells and natural gas fueled cells), a number of information
should be readily available to consumers, such as the amount
of carbondioxide that BHFC can reduce, the amount of garbage
emissions that could be reduced, the lifespan of the cells and
the sources of material for the applied electrical power. Also,
the product design of BHFC should be easily operated for
consumers. In the consumermarket, the company shall target
those with a highly inquisitive mind, for they pay more
attention to the market dynamics and are constantly looking
for technological breakthroughs. In the external environment,
government policy definitely plays the most important role in
promoting renewable energy. Although consumers are aware
of the renewable energy issues, they may remain hesitant to
accept renewable energyproducts due to theunfamiliarity and
insecureness associatedwith the BHFC products. At this point,
public government advocacy campaigns would be necessary
to educate consumers on the importance of renewable energy
products.
Acknowledgements
The authors sincerely appreciate the financial support from
Taiwan’s National Science Council (project ID: NSC 98-2420-H-
004-183-M02 and NSC 99-2811-E-035-002), Taiwan’s Bureau of
Energy (grant no. 99-D0204-3) and the technology support
from M-Field Energy Limited Company.
r e f e r e n c e s
[1] Das D, Vezoroglu TN. Hydrogen production by biologicalprocesses: a survey of literature. International Journal ofHydrogen Energy 2001;26:13e28.
[2] Dunn Seth. Hydrogen futures: toward a sustainable energysystem. International Journal of Hydrogen Energy 2002;27:235e64.
[3] Hawkes FR, Hussy I, Kyazze G, Dinsdale R, Hawkes DL.Continuous dark fermentative hydrogen production bymesophilic microflora: principles and progress. InternationalJournal of Hydrogen Energy 2007;32:172e84.

i n t e rn a t i o n a l j o u r n a l o f h y d r o g e n en e r g y 3 6 ( 2 0 1 1 ) 1 4 0 4 9e1 4 0 5 814058
[4] Holak SL. Determinants of innovative durables adoption anempirical study with implications for early productscreening. Journal of Product Innovation Management 1988;5:50e69.
[5] Kotay SM, Das D. Biohydrogen as a renewable energyresourcedprospects and potentials. International Journal ofHydrogen Energy 2008;33:258e63.
[6] Levin DB, Pitt L, Love M. Biohydrogen production: prospectsand limitations to practical application. International Journalof Hydrogen Energy 2004;29(2):173e85.
[7] Levin DB, Carere CR, Cicek N, Sparling R. Challenges forbiohydrogen production via direct lignocellulosefermentation. International Journal of Hydrogen Energy 2009;34:7390e403.
[8] Li C, Fang HHP. Fermentative hydrogen production fromwastewater and solid wastes by mixed cultures. Critical
Reviews in Environmental Science and Technology 2007;37:1e39.
[9] Maniatis K. Pathways for the production of bio-hydrogen:opportunities and challenges. In: Towards hydrogen, 3. Paris:IEA; March 2003.
[10] Tso C, Chang SY. A viable niche marketdfuel cell scooters inTaiwan. International Journal of Hydrogen Energy 2003;28:757e62.
[11] Wang CH, Chang JS. Continuous biohydrogen productionfrom starch with granulated mixed bacterial microflora.Energy Fuels 2008;22(1):93e7.
[12] Wu SY, Hung CH, Lin CN, Chen HW, Lee AS, Chang JS.Fermentative hydrogen production and bacterial communitystructure in high-rate anaerobic bioreactors containingsilicone-immobilized and self-flocculated sludge.Biotechnology and Bioengineering 2005;93:934e46.
Copyright © 2022 FDOKUMEN


![Ulllted States Patent [19] [11] Patent Number: 6,138,671](https://static.fdokumen.com/doc/165x107/6317fbc571e3f2062906ff7d/ulllted-states-patent-19-11-patent-number-6138671.jpg)