
Photoparameters in Photofermentative Biohydrogen Production
52
PLEASE SCROLL DOWN FOR ARTICLE This article was downloaded by: [Khandan, Nirmala][New Mexico State University] On: 18 January 2011 Access details: Access Details: [subscription number 930398361] Publisher Taylor & Francis Informa Ltd Registered in England and Wales Registered Number: 1072954 Registered office: Mortimer House, 37- 41 Mortimer Street, London W1T 3JH, UK Critical Reviews in Environmental Science and Technology Publication details, including instructions for authors and subscription information: http://www.informaworld.com/smpp/title~content=t713606375 Photoparameters in Photofermentative Biohydrogen Production Venkataramana Gadhamshetty a ; Anoop Sukumaran b ; Nagamany Nirmalakhandan b a Civil and Environmental Engineering, Rensselaer Polytechnic Institute, Troy, NY, USA b Civil Engineering Department, New Mexico State University, Las Cruces, New Mexico Online publication date: 18 January 2011 To cite this Article Gadhamshetty, Venkataramana , Sukumaran, Anoop and Nirmalakhandan, Nagamany(2011) 'Photoparameters in Photofermentative Biohydrogen Production', Critical Reviews in Environmental Science and Technology, 41: 1, 1 — 51 To link to this Article: DOI: 10.1080/10643380802502011 URL: http://dx.doi.org/10.1080/10643380802502011 Full terms and conditions of use: http://www.informaworld.com/terms-and-conditions-of-access.pdf This article may be used for research, teaching and private study purposes. Any substantial or systematic reproduction, re-distribution, re-selling, loan or sub-licensing, systematic supply or distribution in any form to anyone is expressly forbidden. The publisher does not give any warranty express or implied or make any representation that the contents will be complete or accurate or up to date. The accuracy of any instructions, formulae and drug doses should be independently verified with primary sources. The publisher shall not be liable for any loss, actions, claims, proceedings, demand or costs or damages whatsoever or howsoever caused arising directly or indirectly in connection with or arising out of the use of this material.
Transcript of Photoparameters in Photofermentative Biohydrogen Production

PLEASE SCROLL DOWN FOR ARTICLE
This article was downloaded by: [Khandan, Nirmala][New Mexico State University]On: 18 January 2011Access details: Access Details: [subscription number 930398361]Publisher Taylor & FrancisInforma Ltd Registered in England and Wales Registered Number: 1072954 Registered office: Mortimer House, 37-41 Mortimer Street, London W1T 3JH, UK
Critical Reviews in Environmental Science and TechnologyPublication details, including instructions for authors and subscription information:http://www.informaworld.com/smpp/title~content=t713606375
Photoparameters in Photofermentative Biohydrogen ProductionVenkataramana Gadhamshettya; Anoop Sukumaranb; Nagamany Nirmalakhandanb
a Civil and Environmental Engineering, Rensselaer Polytechnic Institute, Troy, NY, USA b CivilEngineering Department, New Mexico State University, Las Cruces, New Mexico
Online publication date: 18 January 2011
To cite this Article Gadhamshetty, Venkataramana , Sukumaran, Anoop and Nirmalakhandan, Nagamany(2011)'Photoparameters in Photofermentative Biohydrogen Production', Critical Reviews in Environmental Science andTechnology, 41: 1, 1 — 51To link to this Article: DOI: 10.1080/10643380802502011URL: http://dx.doi.org/10.1080/10643380802502011
Full terms and conditions of use: http://www.informaworld.com/terms-and-conditions-of-access.pdf
This article may be used for research, teaching and private study purposes. Any substantial orsystematic reproduction, re-distribution, re-selling, loan or sub-licensing, systematic supply ordistribution in any form to anyone is expressly forbidden.
The publisher does not give any warranty express or implied or make any representation that the contentswill be complete or accurate or up to date. The accuracy of any instructions, formulae and drug dosesshould be independently verified with primary sources. The publisher shall not be liable for any loss,actions, claims, proceedings, demand or costs or damages whatsoever or howsoever caused arising directlyor indirectly in connection with or arising out of the use of this material.
Critical Reviews in Environmental Science and Technology, 41:1–51, 2011Copyright © Taylor & Francis Group, LLCISSN: 1064-3389 print / 1547-6537 onlineDOI: 10.1080/10643380802502011
Review:Photoparameters in Photofermentative
Biohydrogen Production
VENKATARAMANA GADHAMSHETTY,1 ANOOP SUKUMARAN,2
and NAGAMANY NIRMALAKHANDAN2
1Civil and Environmental Engineering, Rensselaer Polytechnic Institute, Troy, NY, USA2Civil Engineering Department, New Mexico State University, Las Cruces, New Mexico
Research on hydrogen production by photofermentation has gainedrenewed interest in recent times because of its potential to generatehydrogen from renewable sources in a sustainable manner for useas an alternate energy carrier. Photofermentative bacteria use ni-trogenase enzyme in the presence of adenosine triphosphate (ATP)and reducing power for hydrogen production in photobioreactors(PBRs). Depending on the pigments present in the bacteria, anoptimal combination of photoparameters such as light source, in-tensity, duration, and wavelength have to be maintained in PBRsfor efficient light-to-hydrogen conversion. In this article, over 130literature reports on photoparameters are reviewed to aid in opti-mal design and operation of photobioreactors. This review includesa discussion of mathematical models reported in the literature topredict light attenuation and photochemical efficiencies of photo-bioreactors. As part of this study, models for predicting hydrogenevolution and predicting photochemical efficiency as a function oflight wavelength and quantum requirement were developed andvalidated using a range of experimental data compiled from theliterature. A case study is presented to illustrate how literature datacould be used to size solar-based PBRs for hydrogen production.Based on this case study, it is concluded that major technologicalbreakthroughs are required to reduce the current cost for biohydro-gen production by solar-powered PBRs.
Address correspondence to Nagamany Nirmalakhandan, Professor, Civil Engineering De-partment, New Mexico State University, Las Cruces, NM 88003. E-mail: [email protected]
1
Downloaded By: [Khandan, Nirmala][New Mexico State University] At: 20:31 18 January 2011
2 V. Gadhamshetty et al.
KEY WORDS: biohydrogen, light attenuation, light intensity, mod-eling, photofermentation
INTRODUCTION
Hydrogen has emerged as the most promising energy carrier of the futurebecause it is a clean, recyclable, and efficient fuel. The calorific value ofhydrogen (H2) on mass basis is 2.4 times greater than that of methane and2.75 times greater than that of the most energetic hydrocarbon fuels. As afuel, hydrogen does not evolve greenhouse gases in combustion and can beconverted directly to electricity via fuel cells at higher overall efficiencies thancurrent fuel-to-energy conversion technologies, with only water as the end-product. These benefits of hydrogen as a fuel have been well demonstratedin the space program over several decades, albeit at a high cost of hydrogen.
Currently, H2 is produced via chemical and thermochemical methods,which are not sustainable because they consume nonrenewable feedstocksand/or are driven directly or indirectly by fossil fuels. Alternatively, hydro-gen can also be produced from renewable feedstocks using non-fossil energysources: for example, through electrolysis of water by electricity generatedby photovoltaics. But none of the currently available renewable H2 produc-tion technologies can deliver hydrogen at an affordable cost (Benemann,2000). As such, interest in hydrogen generation by natural and biochemi-cal pathways such as biophotolysis, photosynthesis, or anaerobic fermen-tation has grown recently. Hydrogen production by biological means—“biohydrogen”—has been reported to be feasible under laboratory condi-tions and potentially an economically viable and sustainable approach (Das& Veziroglu, 2001).
The reasons for the interest in biological processes for producing hydro-gen include their ability to utilize waste streams as feedstock whereby thewaste is stabilized at the same time; utilize renewable biomass as feedstock;produce other by-products of commercial value; and utilize solar energyas the driving force. Further, biological processes for hydrogen productiontypically require lower net energy input. Biohydrogen is also considereda CO2-neutral energy carrier (Vijayaraghavan, Mohd, & Mohd, 2006). Yet,biohydrogen production economics may not be expected to compete withthat of the other nonbiological methods, unless the benefits of simultaneouswaste treatment, value-added by-products, minimal environmental impacts,and sustainability are taken into account. Biological processes can also be-come attractive if they can generate hydrogen at a high enough purity levelto be fed directly into internal combustion engines or fuel cells (Rocha,Barbosa, & Wijffels, 2001).
Downloaded By: [Khandan, Nirmala][New Mexico State University] At: 20:31 18 January 2011
Photoparameters in Photofermentative Biohydrogen Production 3
Historical Perspective
The earliest report of microbial H2 evolution dates back to 1886 when“pond scum”—a culture of cyanobacteria—produced pure H2 gas immedi-ately upon being placed in a container. Hydrogen evolution by fermentativebacteria has been reported as early as 1930. Since the discovery of algae thatcould generate hydrogen anaerobically in the presence of light (Gaffron &Rubin, 1942), photosynthetic production of hydrogen from organic substrateshas been studied by several researchers. The ability of green microalgae toproduce hydrogen under light was reported in the 1990s (Benemann, 1998;Greenbaum, 1998). Benemann and Takahashi have advanced the cause ofphotobiological hydrogen production since the early 1970s. Their PhD dis-sertations anticipated the production of hydrogen using sunlight and marinemicroorganisms. With the publication of the first papers on photosyntheticprocess to produce hydrogen (Benemann, Berenson, Kaplan, & Kamen,1973; Benemann & Weare, 1974), and the presentations at early meetingson hydrogen, such as the Hydrogen Economy at the University of Miami in1974, research in this area began to grow across the world. Although takingvery different paths over the past three decades, most studies now agree onthe need and opportunities for research and development in photobiologi-cal hydrogen production (Benemann, 1977; Koku, Eroglu, Gunduz, Yucel,& Turker, 2002; Rocha et al., 2001; Sasikala, Ramana, & Rao, 1991a).
Though the first evidence of hydrogen production by phototrophic bac-teria appeared in 1949 (Gest & Kamen, 1949), the use of hydrogen as analternative fuel and its production from renewable sources was not takenseriously until the first energy crisis of the 1970s. But, the interest wanedin the following decades, when the price and availability of fossil fuels be-came more favorable. It was only in the 1990s that the energy potential ofhydrogen began to be discussed by statesmen of influential countries of theworld, including the United States of America (Benemann, 1996, 1998) andJapan (Mitsugi, Haram, & Kenzo, 1998).
Bioprocess for Hydrogen Generation
Most applied research reports have identified three bioprocesses as viable forhydrogen production: (a) biophotolysis by cyanobateria; (b) photofermenta-tion by anoxygenic phototrophic bacteria; and (c) fermentation by anaerobicbacteria (also referred to as dark fermentation).
BIOPHOTOLYSIS
Under anaerobic conditions, microalgae and cyanobacteria carry out oxy-genic photosynthesis to decompose water directly into H2 and O2 with theaid of sunlight (or artificial light) according to the equation:
2H2O → 2H2 + O2 (1)
Downloaded By: [Khandan, Nirmala][New Mexico State University] At: 20:31 18 January 2011

4 V. Gadhamshetty et al.
Algae use photosystem I (PSI) and photosystem II (PSII) in series to applysolar energy for decomposing water into hydrogen. Reaction centers for PSIand PSII show strong absorption at 680 and 700 nm, respectively, allowinglight absorption in the visible range. Light energy absorbed by the PSI isused for both oxidation of the reaction center and generation of reducingpower to convert NADP+ to NADPH. Excellent reviews on biophotolysisare available in the literature (Akkerman, Janssen, Rocha, & Wijffels, 2002;Benemann, 1998; Rocha et al., 2001; Sakurai & Masukawa, 2007). Becausethe end-product of H2 utilization in the energy conversion process is water,this process is considered sustainable.
However, the rate of reaction (1) is low because a large free energy hasto be overcome (�G0 = +1,498 kJ/mol). As such, its large-scale applicationis hindered by high cost of photobioreactors and low light-to-hydrogen con-version efficiencies (Benemann, 1998, 2000). Separation of H2 from oxygenproduced by the process can further add to the costs. Equation (1) is fur-ther catalyzed by oxygen-sensitive hydrogenase enzyme, requiring energy-intensive measures to maintain low oxygen partial pressures.
PHOTOFERMENTATION
Anoxygenic photoheterotrophic bacteria can convert organic substrates toH2 under light according to the equation:
C202H4 + 2H20 + Light → 2C02 + 4H2 (2)
Because carbon dioxide produced by reaction (2) is derived from biomass,there are no net CO2 emissions to the atmosphere, apart from CO2 emit-ted from the consequence of energy use for producing the original biomass(Akkerman et al., 2002). Other merits of this process include moderate energyneeds (�G0 = 75.2 kJ/mol), high theoretical yield of H2, and the ability tostabilize organic waste streams. Demerits include low light-to-hydrogen con-version efficiency (∼10%) resulting from the inefficient nitrogenase enzymeand low light intensities at which photosynthesis saturates (Benemann, 1998).
DARK FERMENTATION
Anaerobic heterotrophic bacteria can utilize organic substrates to producehydrogen but without requiring any light—dark fermentation—according tothe equation (�G0 = −206.3 kJ/mol):
C6O6H12 + 4H2O → 2CH3COO− + 2HCO3− + 2H+ + 4H2 (3)
Reaction (3) is carried out via dark fermentation for energy production inthe absence of external electron acceptors. This reaction is an incompleteoxidation–reduction reaction and therefore results in unoxidized metabolites.A consequence is that the production of ATP by fermentation is less efficient
Downloaded By: [Khandan, Nirmala][New Mexico State University] At: 20:31 18 January 2011

Photoparameters in Photofermentative Biohydrogen Production 5
than oxidative phosphorylation, where pyruvate is fully oxidized to carbondioxide. Fermentation produces two ATP molecules per molecule of glucosecompared to 38 by aerobic respiration (Dickinson, 1999). Strict anaerobesuse hydrogenase enzymes to dispose of excess electrons for production ofhydrogen (Gray & Gest, 1965). These anaerobes lack a cytochrome systemfor oxidative phosphorylation and can generate only whole numbers ofATP by substrate-level phosphorylation during fermentation (Gray & Gest,1965). Hydrogen-forming fermentations need 10 to 12 kcal/mol in orderto be coupled with the synthesis of ATP. The free energy change of just6 kcal/mol is why anaerobes cannot mediate the degradation of organicmatter completely to carbon dioxide and hydrogen (Gray & Gest, 1965). Forexample, a low yield of 4 mol of H2 is obtained from glucose via fermentation(Logan, Oh, Kim, & Van Ginkel, 2002).
Therefore, though anaerobic fermentation has the highest conversionrate among the three bioprocesses, the yield is low and the conversion is notcomplete due to formation of volatile fatty acids. Of the three bioprocesses,photofermentative H2 production has the highest potential to be realizedin the near future due to its relatively high production rate and metabolicversatility in carbon sources as the feed (Zhu, Wakayama, Asada, & Miyake,2001). This review focuses on this process.
Microbial Species for Photofermentation
Photofermentative H2 production is attractive because it is simple in opera-tion, stable, energy efficient, and renewable. A distinct feature of this processis its ability to recover and concentrate renewable energy from high-water-content organic resources such as waste effluents and sludges, from whichenergy cannot be economically recovered by combustion. The feasibility ofphotofermentation can be enhanced if appropriate microbial species that canutilize low-cost feedstocks or waste streams as feedstock can be employedand if useful by-products such as poly hydroxy butyrates can be harvestedalong with hydrogen (Barbosa, Rocha, Tramper, & Wijffels, 2001; Khatipov,Miyake, Miyake, & Asada, 1998).
Purple non-sulfur (PNS) bacteria have been shown to be a promis-ing species to generate hydrogen at adequate production rates (Koku,Eroglu, Gunduz, Yucel, & Turker, 2003). PNS bacteria produce hydrogenby photofermentation under anaerobic conditions in the presence of opti-mum illumination, suitable nutrients and stressful concentrations of nitrogensources, and in the absence of nitrogen gas (Rocha et al., 2001). Hydro-gen production using PNS bacteria can be a sustainable approach becauseof its ability to utilize unused resources as substrates and stabilize envi-ronmental contaminants, simultaneously producing clean energy. Further, itcan be driven by solar energy with minimal artificial light supplements, thus
Downloaded By: [Khandan, Nirmala][New Mexico State University] At: 20:31 18 January 2011
6 V. Gadhamshetty et al.
conserving fossil fuel reserves and eliminating direct and indirect greenhousegas emissions (Wakayama & Miyake, 2001).
Light Requirements for Photofermentation
Photofermentative bacteria use nitrogenase enzyme (J. Miyake, Mao, &Kawamura, 1984) to catalyze both nitrogen fixation and hydrogen produc-tion as shown in reaction (4). Hydrogen production is also proportional tonitrogenase activity (J. S. Kim, Ito, & Takahashi, 1980).
N2 + 8H+ + 8e− + 16ATP → 2NH3 + H2gas + 16ADP + 6Pi (4)
Photofermentation of organic substrates for hydrogen production mediatedby nitrogenase enzyme is an endothermic reaction requiring external energyto overcome the positive free energy barrier (�G0 = 75 k J). Photoparame-ters such as mixing-induced light/dark cycles (Janssen, 2002), light intensity(Koku et al., 2003), and light attenuation (Cornet, Dussap, & Dubertret,1992; Katsuda, Fuji, Takata, Ooshima, & Katoh, 2002; J. Miyake, Masato, &Yasuo, 1999) are therefore more significant than the biological parametersin photofermentative hydrogen production.
Two measures commonly used to evaluate photobioreactors (PBRs) arephotochemical efficiency (PE) and hydrogen yield (HY), defined as follows(Koku et al., 2002):
PE (%) =(
�GoH2
RH2
I A
)100% (5)
HY = (MH2/Ms )actual
(MH2/Ms )theoretical(6)
where �G0HII is standard Gibbs free energy of hydrogen (kJ/mol); RHII is
hydrogen production rate under standard conditions (mol/s); I is light in-tensity (kW/m2); A is irradiated area (m2); MHII is hydrogen produced (mol);and Ms is substrate used (mol).
Because hydrogen yield is dependent on PE, PE is the most importantfactor for optimum hydrogen production (Akkerman et al., 2002). As men-tioned earlier, low PE is the main hurdle to hydrogen production in PBRsdue to the larger surface areas necessary to capture sufficient light. Hydrogenproduction rate (RHII) that affects PE in Eq. (5) depends on photoparameterssuch as quality and quantity of light and biological factors such as pigmentcomposition and quantum requirements of PNS strains. As such, qualitativeand quantitative understanding of such factors is important to optimize PEin PBRs.
The maximum PE of photofermentative H2 production with current PBRsis limited to 10% (Akkerman et al., 2003) due to problems of light attenuation,
Downloaded By: [Khandan, Nirmala][New Mexico State University] At: 20:31 18 January 2011
Photoparameters in Photofermentative Biohydrogen Production 7
light saturation, and ineffective light utilization (Janssen, 2002). Photochemi-cal efficiency may be further reduced when proper quality (wavelength) andquantity of light (intensity) are not provided for the growth of PNS bacteria(Barbosa et al., 2001). Efficient PBR design is therefore essential to overcomethese shortcomings (Rocha et al., 2001). Light selection based on light re-quirements of specific PNS bacteria is the first step in designing PBRs. Thesecond step involves accommodation of light attenuation problems in PBRs.Both these steps require a good understanding of light utilization capacityof PNS bacteria and the fate of light in PBRs.
Review papers provide a good starting point to gain an appreciationof the current state-of-the-art relating to biohydrogen production. Gobel(1978) and M. Miyake et al. (1998) have reviewed the influence of pig-ments on hydrogen production. Kommareddy and Anderson (2003) and J.Miyake and Kawamura (1987) have reviewed the selection of artificial lightand energy content at particular wavelength, and Warthmann, Pfennig, andCypionka (1993) have reviewed quantum requirements of various cultures.M. Miyake et al.; J. Miyake, Tomizuka, and Kamibayashi (1982); Wakayamaet al. (2000); Wakayama, Nakada, Adada, and Miyake (2000); and Wakayamaand Miyake (2000, 2001, 2002) have reviewed the effects of light cycles onphotofermentation. Rocha et al. (2001) have studied the effects of light in-tensity on hydrogen production, while Rocha et al., M. Miyake et al. (1998),and Akkerman et al. (2002) have reviewed the photochemical efficiency ofPBRs. E. Eroglu, Eroglu, Gunduz, Yucel, and Turker (2002) and I. Eroglu,Aslan, Gunduz, Yucel, and Turker (1998, 1999) have reported the effectsof substrate consumption rates and light intensity on hydrogen production.However, a comprehensive review on the light-related parameters relatingto biohydrogen production by PNS bacteria has not yet been presented. Thisreview attempts to fill this gap.
The objectives of this article are to:
1. compile and review photoparameters relevant to hydrogen production inPBRs;
2. integrate experimental data and mathematical models reported in theliterature to develop profiles of photoparameters such as light attenuation,light wavelength, etc., and their impact on the performance of PBRs;
3. integrate experimental data and mathematical models reported in the lit-erature to analyze and rationalize the effects of light intensity on hydrogenproduction.
PURPLE NON-SULFUR BACTERIA AND PHOTOFERMENTATION
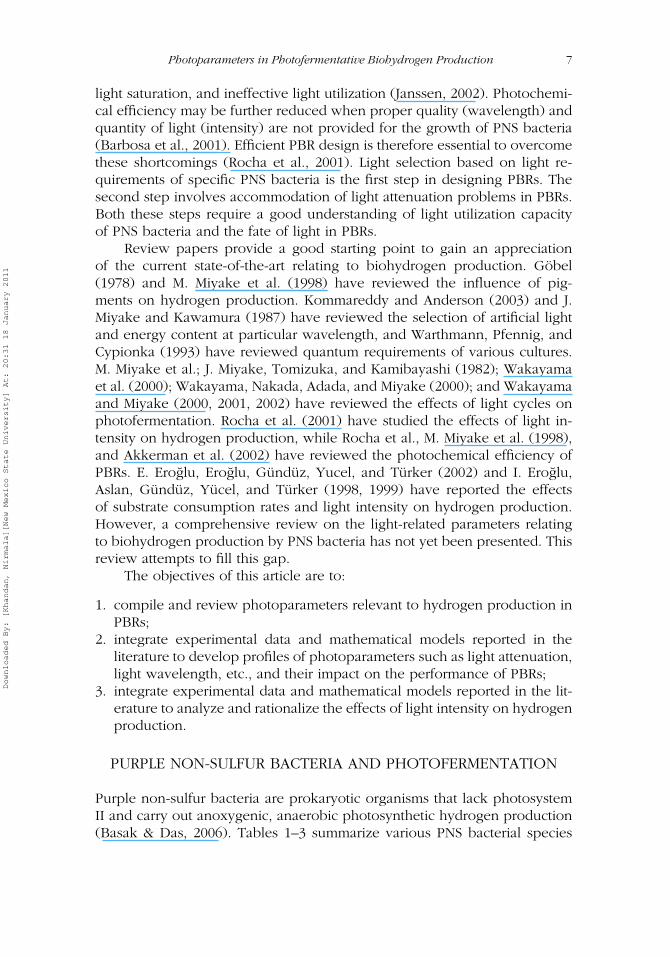
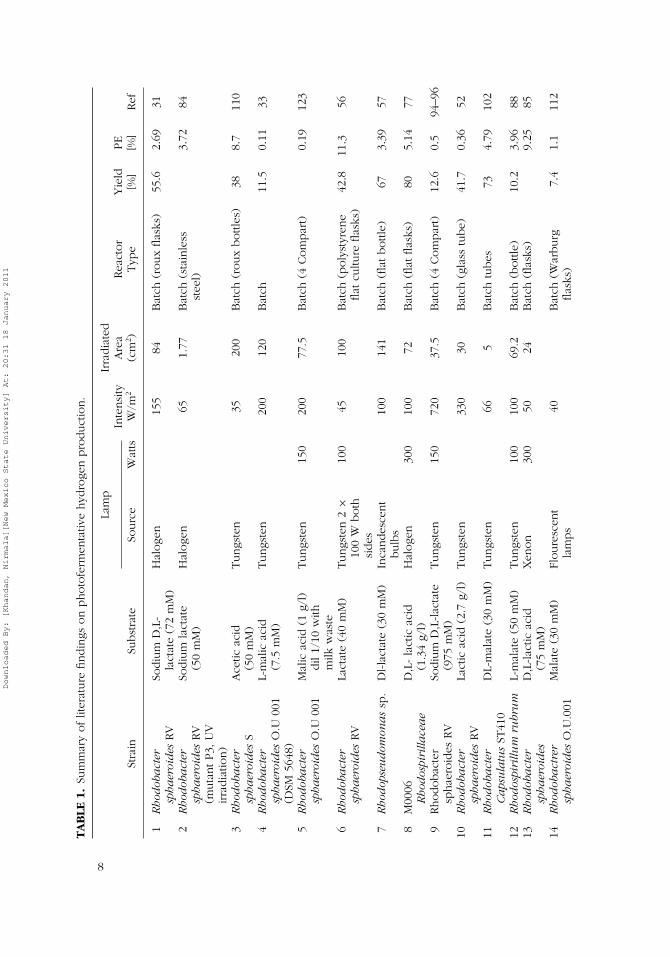
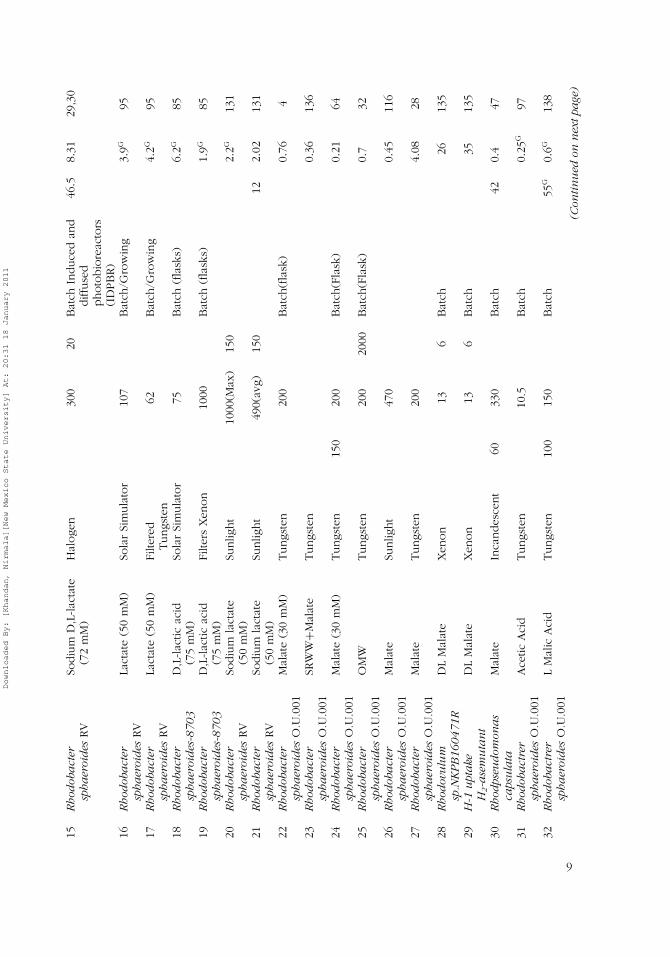
Purple non-sulfur bacteria are prokaryotic organisms that lack photosystemII and carry out anoxygenic, anaerobic photosynthetic hydrogen production(Basak & Das, 2006). Tables 1–3 summarize various PNS bacterial species
Downloaded By: [Khandan, Nirmala][New Mexico State University] At: 20:31 18 January 2011
TA
BLE
1.
Sum
mar
yoflit
erat
ure
findin
gson
photo
ferm
enta
tive
hyd
roge
npro
duct
ion.
Lam
pIr
radia
ted
Inte
nsi
tyA
rea
Rea
ctor
Yie
ldPE
Stra
inSu
bst
rate
Sourc
eW
atts
W/m
2(c
m2 )
Typ
e[%
][%
]Ref
1R
hod
oba
cter
sph
aer
oid
esRV
Sodiu
mD
,L-
lact
ate
(72
mM
)H
aloge
n15
584
Bat
ch(r
oux
flas
ks)
55.6
2.69
31
2R
hod
oba
cter
sph
aer
oid
esRV
(muta
ntP3,
UV
irra
dia
tion)
Sodiu
mla
ctat
e(5
0m
M)
Hal
oge
n65
1.77
Bat
ch(s
tain
less
stee
l)3.
7284
3R
hod
oba
cter
sph
aer
oid
esS
Ace
ticac
id(5
0m
M)
Tungs
ten
3520
0B
atch
(roux
bottle
s)38
8.7
110
4R
hod
oba
cter
sph
aer
oid
esO
.U00
1(D
SM56
48)
L-m
alic
acid
(7.5
mM
)Tungs
ten
200
120
Bat
ch11
.50.
1133
5R
hod
oba
cter
sph
aer
oid
esO
.U00
1M
alic
acid
(1g/
l)dil
1/10
with
milk
was
te
Tungs
ten
150
200
77.5
Bat
ch(4
Com
par
t)0.
1912
3
6R
hod
oba
cter
sph
aer
oid
esRV
Lact
ate
(40
mM
)Tungs
ten
2×
100
Wboth
sides
100
4510
0B
atch
(poly
styr
ene
flat
cultu
reflas
ks)
42.8
11.3
56
7R
hod
opse
ud
omon
as
sp.
Dl-la
ctat
e(3
0m
M)
Inca
ndes
cent
bulb
s10
014
1B
atch
(flat
bottle
)67
3.39
57
8M
0006
Rh
odos
piri
llace
ae
D,L
-la
ctic
acid
(1.3
4g/
l)H
aloge
n30
010
072
Bat
ch(fl
atflas
ks)
805.
1477
9Rhodobac
ter
sphae
roid
esRV
Sodiu
mD
,L-lac
tate
(975
mM
)Tungs
ten
150
720
37.5
Bat
ch(4
Com
par
t)12
.60.
594
–96
10R
hod
oba
cter
sph
aer
oid
esRV
Lact
icac
id(2
.7g/
l)Tungs
ten
330
30B
atch
(gla
sstu
be)
41.7
0.36
52
11R
hod
oba
cter
Ca
psu
latu
sST
410
DL-
mal
ate
(30
mM
)Tungs
ten
665
Bat
chtu
bes
734.
7910
2
12R
hod
ospi
rillu
mru
bru
mL-
mal
ate
(50
mM
)Tungs
ten
100
100
69.2
Bat
ch(b
ottle
)10
.23.
9688
13R
hod
oba
cter
sph
aer
oid
esD
,L-lac
ticac
id(7
5m
M)
Xen
on
300
5024
Bat
ch(fl
asks
)9.
2585
14R
hod
oba
ctre
rsp
ha
eroi
des
O.U
.001
Mal
ate
(30
mM
)Fl
oure
scen
tla
mps
40B
atch
(War
burg
flas
ks)
7.4
1.1
112
8
Downloaded By: [Khandan, Nirmala][New Mexico State University] At: 20:31 18 January 2011
15R
hod
oba
cter
sph
aer
oid
esRV
Sodiu
mD
,L-lac
tate
(72
mM
)H
aloge
n30
020
Bat
chIn
duce
dan
ddiffu
sed
photo
bio
reac
tors
(ID
PB
R)
46.5
8.31
29,3
0
16R
hod
oba
cter
sph
aer
oid
esRV
Lact
ate
(50
mM
)So
lar
Sim
ula
tor
107
Bat
ch/G
row
ing
3.9G
95
17R
hod
oba
cter
sph
aer
oid
esRV
Lact
ate
(50
mM
)Fi
ltere
dTungs
ten
62B
atch
/Gro
win
g4.
2G95
18R
hod
oba
cter
sph
aer
oid
es-8
70
3D
,L-lac
ticac
id(7
5m
M)
Sola
rSi
mula
tor
75B
atch
(flas
ks)
6.2G
85
19R
hod
oba
cter
sph
aer
oid
es-8
70
3D
,L-lac
ticac
id(7
5m
M)
Filte
rsX
enon
1000
Bat
ch(fl
asks
)1.
9G85
20R
hod
oba
cter
sph
aer
oid
esRV
Sodiu
mla
ctat
e(5
0m
M)
Sunlig
ht
1000
(Max
)15
02.
2G13
1
21R
hod
oba
cter
sph
aer
oid
esRV
Sodiu
mla
ctat
e(5
0m
M)
Sunlig
ht
490(
avg)
150
122.
0213
1
22R
hod
oba
cter
sph
aer
oid
esO
.U.0
01M
alat
e(3
0m
M)
Tungs
ten
200
Bat
ch(fl
ask)
0.76
4
23R
hod
oba
cter
sph
aer
oid
esO
.U.0
01SR
WW
+Mal
ate
Tungs
ten
0.36
136
24R
hod
oba
cter
sph
aer
oid
esO
.U.0
01M
alat
e(3
0m
M)
Tungs
ten
150
200
Bat
ch(F
lask
)0.
2164
25R
hod
oba
cter
sph
aer
oid
esO
.U.0
01O
MW
Tungs
ten
200
2000
Bat
ch(F
lask
)0.
732
26R
hod
oba
cter
sph
aer
oid
esO
.U.0
01M
alat
eSu
nlig
ht
470
0.45
116
27R
hod
oba
cter
sph
aer
oid
esO
.U.0
01M
alat
eTungs
ten
200
4.08
28
28R
hod
ovu
lum
sp.N
KP
B1
60
47
1R
DL
Mal
ate
Xen
on
136
Bat
ch26
135
29H
-1u
pta
keH
2-a
sem
uta
nt
DL
Mal
ate
Xen
on
136
Bat
ch35
135
30R
hod
pseu
dom
ona
sca
psu
lata
Mal
ate
Inca
ndes
cent
6033
0B
atch
420.
447
31R
hod
oba
ctre
rsp
ha
eroi
des
O.U
.001
Ace
ticA
cid
Tungs
ten
10.5
Bat
ch0.
25G
97
32R
hod
oba
ctre
rsp
ha
eroi
des
O.U
.001
LM
alic
Aci
dTungs
ten
100
150
Bat
ch55
G0.
6G13
8
(Con
tin
ued
onn
ext
page
)
9
Downloaded By: [Khandan, Nirmala][New Mexico State University] At: 20:31 18 January 2011
TA
BLE
1.
(Con
tin
ued
)
Lam
pIr
radia
ted
Inte
nsi
tyA
rea
Rea
ctor
Yie
ldPE
Stra
inSu
bst
rate
Sourc
eW
atts
W/m
2(c
m2 )
Typ
e[%
][%
]Ref
33R
hod
oba
ctre
rsp
ha
eroi
des
O.U
.001
Mal
ate
Tungs
ten
150
40B
atch
68G
0.54
G12
5
34R
hod
oba
cter
sph
aer
oid
esRV
Sodiu
mla
ctat
e(5
0m
M)
Hal
oge
n60
070
Bat
ch0.
1G13
2
35R
hod
oba
cter
sph
aer
oid
esRV
MTP4
Sodim
D,L
-lac
tate
(50
mM
)Tungs
ten
150
500
66B
atch
1.64
G66
36R
hod
oba
cter
sph
aer
oid
esRV
MTP4
Sodim
D,L
-lac
tate
(50
mM
)Tungs
ten
150
500
66B
atch
2G66
37R
hod
oba
cter
sph
aer
oid
esRV
sodiu
mla
ctat
e(5
0m
M)
Hal
oge
n10
0070
Bat
ch1.
6G13
0
38R
hod
oba
cter
sph
aer
oid
esRV
sodiu
mla
ctat
e(5
0m
M)
Sola
rCel
ls50
0015
9O
utd
oor
Roux
flas
k1.
1G13
0
39R
hod
ovu
lum
sp.N
KPB
1604
71R
L-M
alat
e(3
0m
M)
Xen
on
18.5
250
Bat
ch4.
6G78
40R
hod
pseu
dom
ona
ssp
Lact
ate
(50
mM
)H
aloge
n/
Tungs
ten
145
Bat
ch0.
4G6
41R
hod
pseu
dom
ona
ssp
Mal
ate
(15
mM
)H
aloge
n/
Tungs
ten
145
Bat
ch0G
6
42R
hod
pseu
dom
ona
ssp
Buty
rate
(27
mM
)H
aloge
n/
Tungs
ten
145
Bat
ch0.
3G6
43R
hod
pseu
dom
ona
ssp
Ace
tate
(27
mM
)H
aloge
n/
Tungs
ten
145
Bat
ch0.
9G6
44R
hod
pseu
dom
ona
sPal
ust
ris
Lact
ate
(50
mM
)H
aloge
n/
Tungs
ten
102
Bat
ch0.
5G6
45R
hod
pseu
dom
ona
sPal
ust
ris
Mal
ate
(15
mM
)H
aloge
n/
Tungs
ten
102
Bat
ch0.
3G6
46R
hod
pseu
dom
ona
sPal
ust
ris
Buty
rate
(27
mM
)H
aloge
n/
Tungs
ten
102
Bat
ch6
47R
hod
pseu
dom
ona
sPal
ust
ris
Ace
tate
(27
mM
)H
aloge
n/
Tungs
ten
102
Bat
ch0.
1G6
48R
hod
ospi
rillu
mru
bru
mM
alat
e(1
5m
M)
Inca
ndes
cent
12B
atch
23.5
134
Note
s:10
0lu
x=
1W
/m2 ;
4.7
µm
ol/
m2 .se
c=
1W
/m2 ;
G-G
iven
inlit
erat
ure
.O
MW
:O
live
mill
was
tew
ater
;SR
WW
:Su
garc
ane
resi
due
was
tew
ater
.
10
Downloaded By: [Khandan, Nirmala][New Mexico State University] At: 20:31 18 January 2011
TA
BLE
2.
Rel
atio
nsh
ipbet
wee
nphoto
chem
ical
effici
ency
,quan
tum
requirem
ents
,an
dw
avel
engt
h.
Wav
elen
gth
Ener
gyQ
RQ
H2,
Exp
erim
enta
lCal
cula
ted
Stra
inλ,nm
E,M
Jm
ole
sPE
(%)
PE
(%)
Lam
pSo
urc
eRef
.
1Sy
nec
hoc
occu
s38
00.
315
25.2
3.5
3.6
Fluore
scen
ttu
be
692
Ma
stig
ocla
du
s38
00.
315
20.0
2.7
4.6
Floure
scen
ttu
be
903
R.s
pha
eroi
eds
RV
400
0.30
08.
07.
912
.1So
lar
Sim
ula
tor
854
Gre
enPla
ntTyp
e42
20.
284
9.0
11.6
11.3
Sunlig
ht
145
Gre
enPla
ntTyp
e44
00.
272
8.0
1313
.3Su
nlig
ht
146
Photo
volta
icsi
lico
sola
rce
lls55
00.
218
12.6
1510
.6So
lar
Cel
ls13
47
Rh
odop
seu
dom
ona
sR
V55
20.
217
15.0
8.4
8.9
Monoch
rom
atic
38
Ch
lore
llam
oew
usi
i56
00.
214
4.5
2430
.1M
onoch
rom
atic
459
R.r
ubr
um
812
0.14
88.
623
.522
.8M
onoch
rom
atic
134
10R
hod
opse
ud
omon
as
860
0.13
911
.019
18.9
Monoch
rom
atic
311
R.s
pha
eroi
eds
850
0.14
117
.010
12.1
Monoch
rom
atic
9412
C.V
ibri
ofor
me
870
0.13
87.
516
.528
.1M
onoch
rom
atic
134
11
Downloaded By: [Khandan, Nirmala][New Mexico State University] At: 20:31 18 January 2011
TA
BLE
3.
Effec
tsoflig
ht/
dar
kcy
cles
on
photo
chem
ical
effici
ency
(PE).
Lam
pLi
ghtCyc
le
Sourc
eW
atts
W/m
2Su
bst
rate
Stra
inContin
uous
light-
dar
kEffi
cien
cy%
Ref
.
1Tungs
ten
150
150–
250
Mal
icA
cid
R.
sph
aer
oid
esO
.U.
00
1(D
SM5864)
Contin
uous
0.21
C64
2Tungs
ten
150
150–
250
Mal
icA
cid
R.
sph
aer
oid
esO
.U.
00
1(D
SM5864)
14
–10
0.62
C64
3H
aloge
n60
0La
ctat
eR
.sp
ha
eroi
des
RV
Contin
uous
113
24
Hal
oge
n60
0La
ctat
eR
.sp
ha
eroi
des
RV
12
12
h0.
9513
25
Hal
oge
n12
00La
ctat
eR
.sp
ha
eroi
des
RV
12
12
h0.
7313
26
Hal
oge
n60
0La
ctat
eR
.sp
ha
eroi
des
RV
30
30
min
113
27
Hal
oge
n12
00La
ctat
eR
.sp
ha
eroi
des
RV
30
30
min
0.15
132
8Tungs
ten
150
150–
250
Mal
ate
R.
sph
aer
oid
esO
.U.
00
1(D
SM5864)
Contin
uous
0.54
125
9Tungs
ten
150
150–
250
Mal
ate
R.
sph
aer
oid
esO
.U.
00
1(D
SM5864)
Initi
ally
Contin
uous
14
–10
0.53
125
10Tungs
ten
150
150–
251
Mal
ate
R.
sph
aer
oid
esO
.U.
00
1(D
SM5864)
14
–10
0.81
125
11Tungs
ten
150
150–
252
Mal
ate
R.
sph
aer
oid
esO
.U.
00
1(D
SM5864)
14
–10
0.66
125
12Tungs
ten
150
150–
253
Mal
ate
R.
sph
aer
oid
esO
.U.
00
1(D
SM5864)
10
hd
ark
-co
nti
nu
ous
0.42
125
13Tungs
ten
150
150–
254
Mal
ate
R.
sph
aer
oid
esO
.U.
00
1(D
SM5864)
24
hd
ark
0.27
125
14Fl
oure
scen
t40
Mal
ate
R.
sph
aer
oid
esO
.U.
00
1(D
SM5864)
10
14
111
15Tungs
ten
200
Mal
ate
R.
sph
aer
oid
esO
.U.
00
1(D
SM5864)
1014
0.76
C4
Note
s:C,Cal
cula
ted.
12
Downloaded By: [Khandan, Nirmala][New Mexico State University] At: 20:31 18 January 2011

Photoparameters in Photofermentative Biohydrogen Production 13
that have been used in photofermentation H2 production studies. Aspectsrelating to their light conversion machinery, light absorption range, and light-to-hydrogen conversion are briefly discussed next.
Light Conversion Machinery of PNS Bacteria
A common feature of PNS bacteria is the presence of extensive intracyto-plasmic chromatophores membranes, the site of the cellular componentsinvolved in the light-dependent energy transduction. These components in-clude the photochemical reaction center (RC), pigments (bacteriochlorophyll,carotenoids, keto carotenoids, etc.), and the chromophore–protein aggregate(light-harvesting antenna; LH). Though hundreds of pigment molecules jointo form LH complex for light absorption, RC uses a specialized molecule fortransformation of light energy into chemical energy.
Two classes of the LH antenna identified based on absorption maximaare B890 (LHI) and B800-850 (LHII). LH antennae have been well studied inRhodospirillum rubrum, Rhodobacter sphaeroides, and Rhodobacter capsu-latus. Whereas Rhodospirillum rubrum and Rhodopseudomonas viridis haveonly B890, Rhodobacter capsulatus can increase the size of the photosyn-thetic unit by addition of B800-850 at low light intensity (Collins & Rem-sen, 1991; Hillmer & Gest, 1977). Rhodobacter sphaeroides is the most com-monly used hydrogen-producing PNS bacteria (J. Miyake & Kawamura, 1987;Nakada, Asada, Arai, & Miyake, 1995; Tsygankov, Hirata, Miyake, Asada, &Miyake, 1994) that consists of both LHI and LHII complexes.
Light Absorption Range of PNS Bacteria
PNS bacteria absorb light at longer wavelengths to yield less energy forphotosynthesis and require electron donors such as organic substrates thatare more reduced than water. PNS bacteria absorb light outside the visiblespectrum and hence do not contribute to the color of organisms, whichthus appear reddish brown instead of green (Collins & Remsen, 1991). Majorpeaks of absorption for these bacteria in the infrared region of 800–900 nmare due to bchl; minor peaks of absorption in the visible range of 450–600 nm(Ko & Noike, 2002; Nakada, Nishikada, Asada, & Miyake, 1999; Nogi, Akiba,& Horikoshi, 1985) are due to mixture of bacteriochlorophyll (bchl) andcarotenoids. Selection of appropriate light-source-emitting light energy inthe desired frequency is therefore necessary to mitigate loss in PE (J. Miyake& Kawamura, 1987). This aspect is elaborated in a later section.
Light-to-Hydrogen Conversion by PNS Bacteria
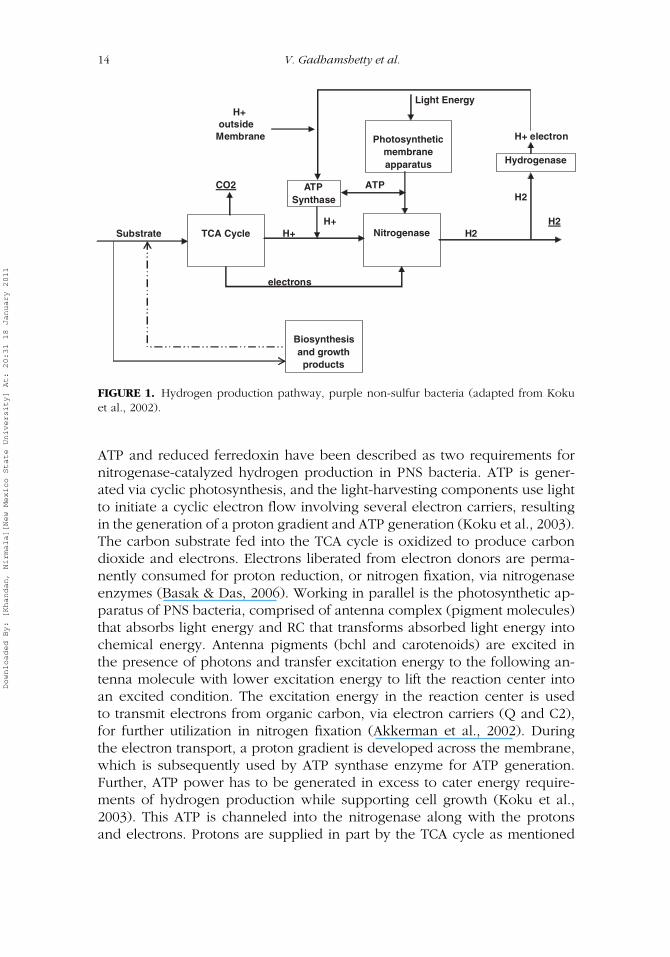
The overall scheme of hydrogen production in photosynthetic bacteria,described by Koku et al. (2002), is depicted in Figure 1. Generation of
Downloaded By: [Khandan, Nirmala][New Mexico State University] At: 20:31 18 January 2011
14 V. Gadhamshetty et al.
Light EnergyH+
outsidenortcele+HenarbmeM
CO2 ATPH2
2H+H2H+HetartsbuS
electrons
TCA Cycle Nitrogenase
Biosynthesisand growth products
ATP Synthase
Photosynthetic membrane apparatus Hydrogenase
FIGURE 1. Hydrogen production pathway, purple non-sulfur bacteria (adapted from Kokuet al., 2002).
ATP and reduced ferredoxin have been described as two requirements fornitrogenase-catalyzed hydrogen production in PNS bacteria. ATP is gener-ated via cyclic photosynthesis, and the light-harvesting components use lightto initiate a cyclic electron flow involving several electron carriers, resultingin the generation of a proton gradient and ATP generation (Koku et al., 2003).The carbon substrate fed into the TCA cycle is oxidized to produce carbondioxide and electrons. Electrons liberated from electron donors are perma-nently consumed for proton reduction, or nitrogen fixation, via nitrogenaseenzymes (Basak & Das, 2006). Working in parallel is the photosynthetic ap-paratus of PNS bacteria, comprised of antenna complex (pigment molecules)that absorbs light energy and RC that transforms absorbed light energy intochemical energy. Antenna pigments (bchl and carotenoids) are excited inthe presence of photons and transfer excitation energy to the following an-tenna molecule with lower excitation energy to lift the reaction center intoan excited condition. The excitation energy in the reaction center is usedto transmit electrons from organic carbon, via electron carriers (Q and C2),for further utilization in nitrogen fixation (Akkerman et al., 2002). Duringthe electron transport, a proton gradient is developed across the membrane,which is subsequently used by ATP synthase enzyme for ATP generation.Further, ATP power has to be generated in excess to cater energy require-ments of hydrogen production while supporting cell growth (Koku et al.,2003). This ATP is channeled into the nitrogenase along with the protonsand electrons. Protons are supplied in part by the TCA cycle as mentioned
Downloaded By: [Khandan, Nirmala][New Mexico State University] At: 20:31 18 January 2011
Photoparameters in Photofermentative Biohydrogen Production 15
and the remaining by the action of ATP synthase working as a part of thephotosynthetic apparatus. The transfer of electrons from the TCA cycle tothe nitrogenase is accomplished by consecutive oxidation/reduction of elec-tron carriers. These carriers are nicotinamide adenine dinucleotide (NAD)and ferredoxin (Fd). Finally, the nitrogenase mediates nitrogen fixation andproton reduction for hydrogen formation (El-Shishtawy, Kitajima, Otsuka,Kawsasaki, & Morimoto, 1998). However, the process of energy transportfrom a photon toward an RC and its subsequent storage is associated withheat loss and contributes to reduction in PE. Though this loss in PE is in-herent in photofermentation processes, other light attenuation factors can bemitigated with proper reactor design, as suggested in later sections.
Most laboratory-scale studies on PNS bacteria have used artificial lampsto serve as the energy source (Table 1). Because only a part of this lightenergy is used for biological activity requirements and subsequent hydro-gen evolution, the process is only 7–9% efficient, and the remaining energy(∼90%) is dissipated as heat. The efficiency is further reduced when lightdeteriorates due to a shading effect and improper reactor design, translatinginto high costs of PBRs and their operation. Development of low-cost PBRsand optimization of PE are major challenges (Akkerman et al., 2006) thatdemand a better understanding of the photoparameters. Photoparametersand their impacts on photofermentative H2 production are reviewed in thefollowing sections. The utility value of mathematical models in providingpreliminary estimates of these parameters is presented next. Finally, a link isestablished between artificial light sources and solar light to extend lab-scalephotofermentation results to real-world applications.
LIGHT SOURCE
Light is the main source of energy for PNS bacteria to photoferment organicsubstrates into hydrogen. Light propagates as a wave and as discrete packetscalled photons. The energy of a photon is quantified in terms of quanta asgiven by Einstein’s equation:
E = hc
λ(7)
where E is the energy of a photon (quanta); h is Planck’s constant (6.626 ×10⁻³⁴ Js); c is the speed of light (2.998 × 10⁸ ms−1); and λ is the wavelengthof the light (nm).
Energy is inversely proportional to the light wavelength, and the lightsource determines the corresponding energy and photochemical efficienciesof PBRs. Unlike algae, PNS bacteria are capable of utilizing longer wave-lengths (500–950 nm), making photofermentation reactions advantageous
Downloaded By: [Khandan, Nirmala][New Mexico State University] At: 20:31 18 January 2011
16 V. Gadhamshetty et al.
(Ike, Toda, Hirata, & Miyamoto, 1997; Larkum, 1997; MacKay & Walker, 2003;Spring & Deaton, 2003) when artificial light sources are employed in PBRs(Akkerman et al., 2002; Nogi et al., 1985). Light absorption and subsequentlight-to-hydrogen conversion by PNS bacteria depends on pigments presentin the organism (Koku et al., 2002).
Pigment Composition of PNS Bacteria
Pigment composition in PNS bacteria influences the selection of spectrumand intensity of the light source used in PBRs. Two major pigment groups inPNS bacteria are bacteriochlorophyll (bchl) and carotenoid. The bchl contentof each group of PNS bacteria ensures a discrete niche for that group in thespectrum. Each type of bulk bacteriochlorophyll shows some variation inits absorption spectrum according to the degree of bchl–bchl, bchl–protein,and bchl–carotenoid interaction. Thus, bchl exhibits varying intensities ofshort-wavelength (B800), medium-wavelength (B820 or B850), and long-wavelength (B870 or B890) bands in different organisms. Carotenoids areusually red, orange, or yellow pigments and absorb light in the violet, blue,and blue-green region of visible light.
Hydrogen production by photosynthetic bacteria depends on the spec-tral distribution, because the bacteria utilize the specific light wavelengthsfor photosynthesis (Nakada, Nishikata, Asada, & Miyake, 1998). For exam-ple, the energy associated with photons at a wavelength of 810–900 nm isthe energy level required by bchla to initiate photosynthesis (Gobel, 1978).Similarly, wavelengths of 460–540 nm are required by carotenoids presentin PNS bacteria (Gobel; Ko & Noike, 2002). However, light of longer wave-lengths (>860 nm) absorbed by PNS bacteria has a more conspicuous effecton hydrogen evolution than that of shorter wavelengths (<500 nm) absorbedby carotenoids (Nogi et al., 1985). This has implicit implications on improvedeconomics of hydrogen production due to lower energy requirements asso-ciated with longer light wavelength, when artificial lights are employed inPBRs. Further, PNS bacteria can use the near-infrared (700–950 nm) regionof the solar spectrum to increase the energy content of photosyntheticallyactive radiation (PAR) by about 50%, or nearly double the photons of thesolar irradiance converted (Akkerman et al., 2002). Solar–hydrogen energyconversion efficiencies can be greatly enhanced by using the assortment ofgreen algae (400–700 nm) and PNS bacteria (450–600, 700–950 nm) in PBRs.The importance of the wavelength at which solar radiation is absorbed byPNS bacteria is discussed in a later section.
Selection of Light Source for PNS Bacteria
Preliminary knowledge of the pigment composition is therefore a startingpoint in the selection of the light source. As pointed out in the previoussection, selected lamp source should exhibit major emission spectra in the
Downloaded By: [Khandan, Nirmala][New Mexico State University] At: 20:31 18 January 2011

Photoparameters in Photofermentative Biohydrogen Production 17
wavelength range of 800–900 nm and minor emission in the range of 450–600 nm. Though light-emitting diodes (LEDs) can be designed to emit light atdesired wavelengths (Kommareddy and Anderson, 2003); halogen, tungsten,and xenon (HTX) lamps emit light at wavelength above 800 nm (Nogi et al.,1985; Rocha et al., 2001; Sasikala, Ramana, Rao, & Kovaks, 1993). HTXlamps are therefore more favorable than flourescent lamps and grow lightsbecause the latter emit light in the wavelength range of 400–700 nm, whichis inappropriate for growth of PNS bacteria. This argument is corroboratedin Table 1, where it can be seen that a majority of researchers have usedeither HTX lamps or solar simulators. Though PE values of 8.3 to 26% havebeen reported for HTX lamps (Table 1), PE values of ∼6% obtained withsolar simulators show promise for sunlight applications.
Other artificial light sources used in photofermentation include neontubes, metal halide lamps, and LEDs. The efficiency of converting electricityinto light also varies with different light sources. Light sources with descend-ing order of efficiency are LEDs, grow flux/fluorescent lights, and incan-descent/halogen lamps. Though utilization of sunlight delivers sustainablehydrogen production in PBRs (Rocha et al., 2001), it is important to rec-oncile the limitation posed by diurnal variation of solar illumination whensunlight is used as the sole energy input to the PBR. Geographical locationand seasonal patterns also determine the average duration when the light in-tensity is high enough to support photofermentative hydrogen production. Inthe absence of light energy, PNS bacteria metabolize the cell components toobtain maintenance energy, reducing cell density. Furthermore, prolongedbad weather often leads to total process failure when only solar light en-ergy is used for cultivation (Ogbonna, Soejima, & Tanaka, 1999). Likewise,Uyar, Eroglu, Gunduz, and Turker (2007) stated that solar radiation cannotbe assured, indefinitely, at preset value (270 W/m2) due to the variations inclimatic conditions, demanding artificial lights as back-up. Ogbonna et al.stated that elimination of artificial light leads to reduced productivity andcomplete failure of PBRs, when the photosynthetic process is rendered in-active during absence of natural sunshine, for example, during the night.Development of an illumination system integrating solar and artificial lightsources is therefore necessary, having implications on the need for furtherartificial light–based photofermentative hydrogen research.
The success of solar PBRs can therefore be achieved by gradual andsmoother transition from artificial light–based PBRs to outdoor sunlight.Though several decades of lab-scale research may be required to bring solar-based PBR technology from its current state of infancy to maturity, the utilityof artificial lamp–based PBRs is amplified when by-products of photofer-mentation such as thermoplastics (polyhydroxy butyrates), herbicides, andproteins becomes invaluable in the near future (Rocha et al., 2001). Arti-ficial light–supplemented PBR may also be advantageous when operateddownstream to biohydrogen production and fuel cells. Toward this goal,
Downloaded By: [Khandan, Nirmala][New Mexico State University] At: 20:31 18 January 2011
18 V. Gadhamshetty et al.
artificial lights capable of simulating sunlight are commonly used for hydro-gen production in PBRs.
Halogen bulbs used with a wavelength-selective dichroic mirror simulatesunlight by eliminating the infrared spectrum. The emission spectra of theinfrared light–omitted tungsten lamp also simulate sunlight (Nakada et al.,1999). Nogi et al. (1985) reported that a metal halide lamp emits light similarto solar radiation. A comprehensive review on the selection of light sourceand the energy associated at different wavelength by different lamps sourceshas been provided by Kommareddy and Anderson (2003).
Quantum Requirement and Light Wavelength for PNS Bacteria
The term quantum requirement (QRHII) is used to correlate the light energyrequirement of PNS bacteria for hydrogen production. Quantum requirementcan be determined experimentally or theoretically. Details of theoretical cal-culations of QRHII can be found in the literature (Akkerman et al., 2002;El-Kahlout et al., 2002; Warthmann et al., 1993). For example, reaction (8)mediated by nitrogenase enzyme shows that two electrons and 4 mol ofATP, obtained from reduced ferredoxin and light source, respectively, arerequired for H+ reduction to H2.
2H+ + 2Fdred + 4ATP → H2 + 2FdOX + 4ADP + 4Pi (8)
Quantum requirement (QRHII) can now be defined as photons requirementin the PNS strain for electron transport (ET) and ATP generation (ATPG)via translocation of protons to produce a mole of hydrogen. Variability inQRHII between different PNS strains is due to associated uncertainty in bothET and ATPG processes and depends on the physiological efficiency of thespecific PNS strain. For example, it can be due to excitonic interactions andcouplings to the protein motions, as well as the lack of a crystal structure ofLHI and dissimilarities in the nature of the electronic states participating inenergy transfer in different PNS strains (Damjanovic, Ritz, & Schulten, 1999).
Quantum requirement has been reported to be species dependent(Benemann, 1998) possibly due to differences in exceptional characteristicsof PNS strains; for example, Rhodospirillum exhibit phototaxis to maximizelight absorption by reversing direction when swimming through light/darkboundary, causing them to be trapped on the light side of the boundary(Sackett, Armitage, Sherwood, & Pitta, 1997). Though phototaxis behaviordoes not provide a drain on electron transport, the complexity of intercon-nection between photobehavior, metabolic activity, and sensory pathwaysof phototrophic species, stated to be less understood, can have implica-tions on its influence on quantum requirement. For example, a mini reviewprovided by Armitage and Hellingwerf (2003) provides the ground to de-fine the influence of phototaxis on quantum requirements for hydrogenproduction in PNS bacteria. Based on pigment composition of PNS bacteria,
Downloaded By: [Khandan, Nirmala][New Mexico State University] At: 20:31 18 January 2011
Photoparameters in Photofermentative Biohydrogen Production 19
light absorption varies with wavelength of spectrum. This light absorptiongenerates a signal via electron transport, feeding into a canonical chemotaxissignal transduction pathway, which obviously affects metabolism and elec-tron transport in PNS bacteria and therefore exerts influence on quantumrequirement, based on the definition of QRHII provided earlier. Size and du-ration of such light-induced behavior further varies with preference of PNSbacteria toward light intensity and carbon substrates. Excellent reviews oflight-harvesting machinery in PNS strains can be found in Hu and Schulten(1997) and Damjanovic et al. (1999).
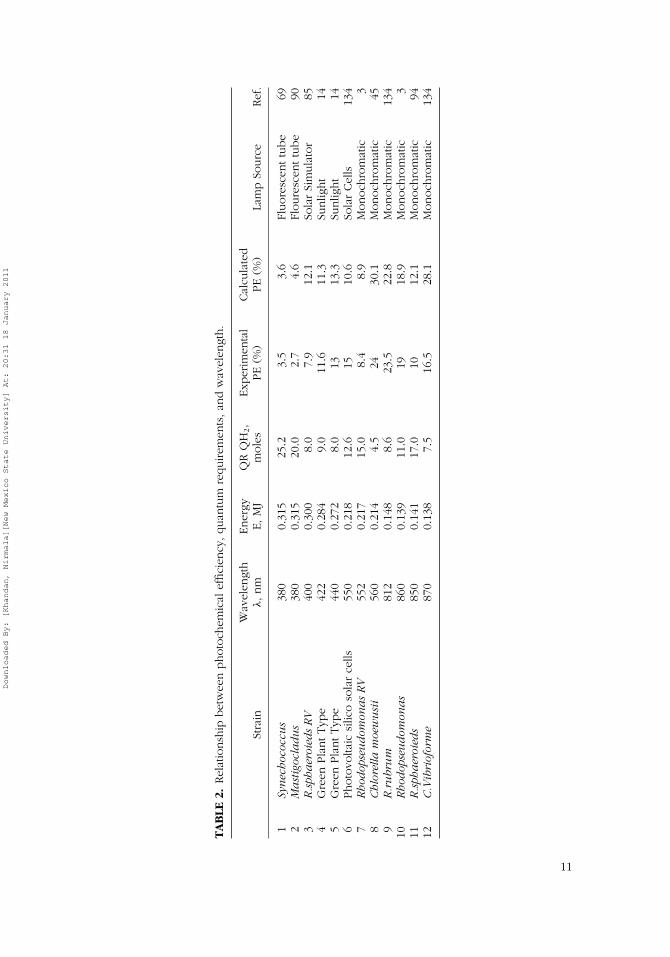
The large range of experimental and theoretical values reported in theliterature demonstrates the variability of QRHII across different PNS strains;QRHII varies between 4 and 15 as shown in Table 2 (Benemann, 1998).Table 2 further shows the dependence of QRHII on wavelength; for example,QRHII of Rhodospirillum rubrum is 6.6 photons per mole of H2; QRHII forRhodopseudomonas species is estimated as 15 photons per mole of H2 at522 nm and as 11 photons per mole at 860 nm. Most researchers carried outcalculations of QRHII at wavelengths of 522 and 860 nm because pigmentcomposition in the PNS bacteria supports maximum hydrogen production atsimilar wavelengths (Nogi et al., 1985).
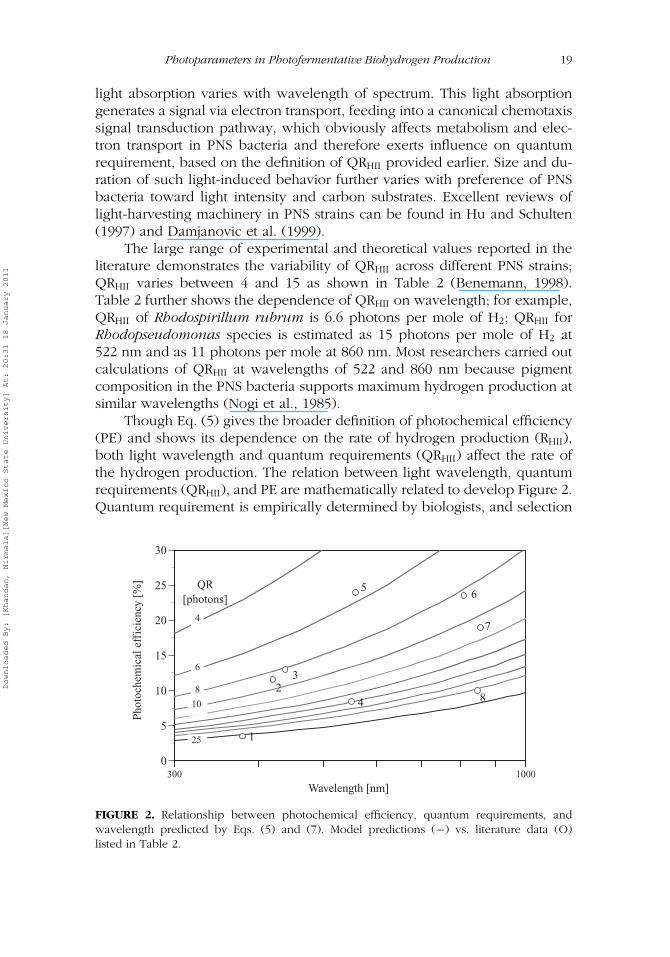
Though Eq. (5) gives the broader definition of photochemical efficiency(PE) and shows its dependence on the rate of hydrogen production (RHII),both light wavelength and quantum requirements (QRHII) affect the rate ofthe hydrogen production. The relation between light wavelength, quantumrequirements (QRHII), and PE are mathematically related to develop Figure 2.Quantum requirement is empirically determined by biologists, and selection
Pho
toch
emic
al e
ffic
ienc
y [%
]
0
5
10
15
20
25
30
300 1000
Wavelength [nm]
QR[photons]
1
23
4
56
7
8
4
6
8
10
25
FIGURE 2. Relationship between photochemical efficiency, quantum requirements, andwavelength predicted by Eqs. (5) and (7). Model predictions (−) vs. literature data (O)listed in Table 2.
Downloaded By: [Khandan, Nirmala][New Mexico State University] At: 20:31 18 January 2011
20 V. Gadhamshetty et al.
of PNS strain and light wavelength in PBRs determines PEs of a specificPBR. After compiling QR values of PNS species (Akkerman et al., 2002), Eq.(7) was used to calculate energy content of light at particular wavelength(Warthman et al., 1999) and generate PE values using experimental resultsfrom the literature.
Figure 2 clearly shows the potential of improving photochemical effi-ciencies of PBRs using light at higher wavelengths and PNS bacterial strainswith lower quantum requirements. To validate this statement, experimentaldata for six different PNS strains varying in QRHII under wavelengths rangingfrom 380 to 870 nm (Table 2) are superimposed on the modeled curves inFigure 2. The quality of fit between the theoretical and experimental valueswas statistically significant (r2 = 0.94, p = 7.01E-05, F = 94).
As discussed before, quantum requirement (QRHII) is a bacteria-specificparameter (Ku & Edwards, 1982) and is beyond engineering control; how-ever, selection of bacterial strain and light source may improve photochem-ical efficiencies (Figure 2). For example, for Rhodopseudomonas species,PE has been estimated as 10 and 20% when light source was optimized atselected wavelengths of 522 and 860 nm, respectively (Table 2). Light wave-length is also important because light wavelengths shorter than the cell diam-eter are reported to be frequently reflected by the PNS strains, resulting in ahigher light extinction, whereas light wavelength greater than the cell diam-eter could occasionally pass through the PNS strains without reflection (Kat-suda et al., 2002). Even under optimal light intensity values of 100–250 W/m2,photochemical efficiencies were reported to be less than 1% when unopti-mized halogen/tungsten lamps were used in the experiments (Table 1).
Though one may argue that the utility of Figure 2 is limited in solarPBRs because of our inability to control wavelengths of sunlight, solar PBRscan be oriented and located to receive sunlight during sunrise and sunsetto ensure adequate red and infrared light (Uyar et al., 2007). Furthermore,artificial lamps cannot be eliminated completely due to uncertainty in solarillumination (Ogbonna et al., 1999).
It is promising to realize that PE values of 9–11% obtained with so-lar simulators are already equivalent to those obtained with HTX lamps(Table 1). Solar technology advances adapted in PNS-based PBRs shouldfurther enhance solar conversions; for example, optical fibers can be used toconcentrate solar radiation to desired wavelengths. Such solar technologiesare discussed in a later section.
LIGHT CYCLES
Light distribution inside a PBR is never homogenous due to shading effect(Cornet, Dussap, & Gros, 1998) causing light intensity to decline from theilluminated surface to the center. Due to the effect of light/dark (L/D) cycles,
Downloaded By: [Khandan, Nirmala][New Mexico State University] At: 20:31 18 January 2011
Photoparameters in Photofermentative Biohydrogen Production 21
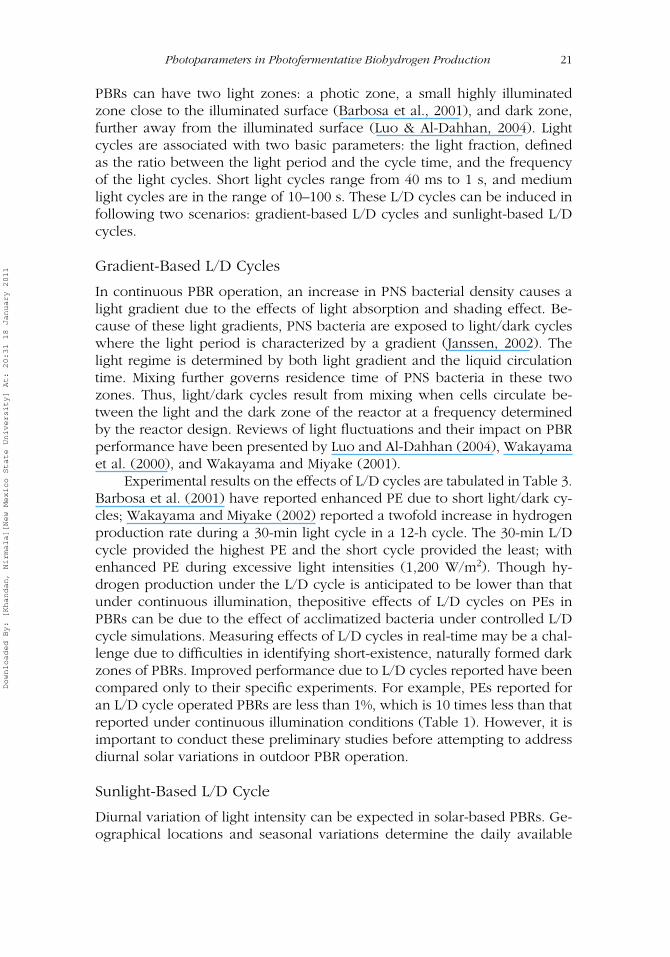
PBRs can have two light zones: a photic zone, a small highly illuminatedzone close to the illuminated surface (Barbosa et al., 2001), and dark zone,further away from the illuminated surface (Luo & Al-Dahhan, 2004). Lightcycles are associated with two basic parameters: the light fraction, definedas the ratio between the light period and the cycle time, and the frequencyof the light cycles. Short light cycles range from 40 ms to 1 s, and mediumlight cycles are in the range of 10–100 s. These L/D cycles can be induced infollowing two scenarios: gradient-based L/D cycles and sunlight-based L/Dcycles.
Gradient-Based L/D Cycles
In continuous PBR operation, an increase in PNS bacterial density causes alight gradient due to the effects of light absorption and shading effect. Be-cause of these light gradients, PNS bacteria are exposed to light/dark cycleswhere the light period is characterized by a gradient (Janssen, 2002). Thelight regime is determined by both light gradient and the liquid circulationtime. Mixing further governs residence time of PNS bacteria in these twozones. Thus, light/dark cycles result from mixing when cells circulate be-tween the light and the dark zone of the reactor at a frequency determinedby the reactor design. Reviews of light fluctuations and their impact on PBRperformance have been presented by Luo and Al-Dahhan (2004), Wakayamaet al. (2000), and Wakayama and Miyake (2001).
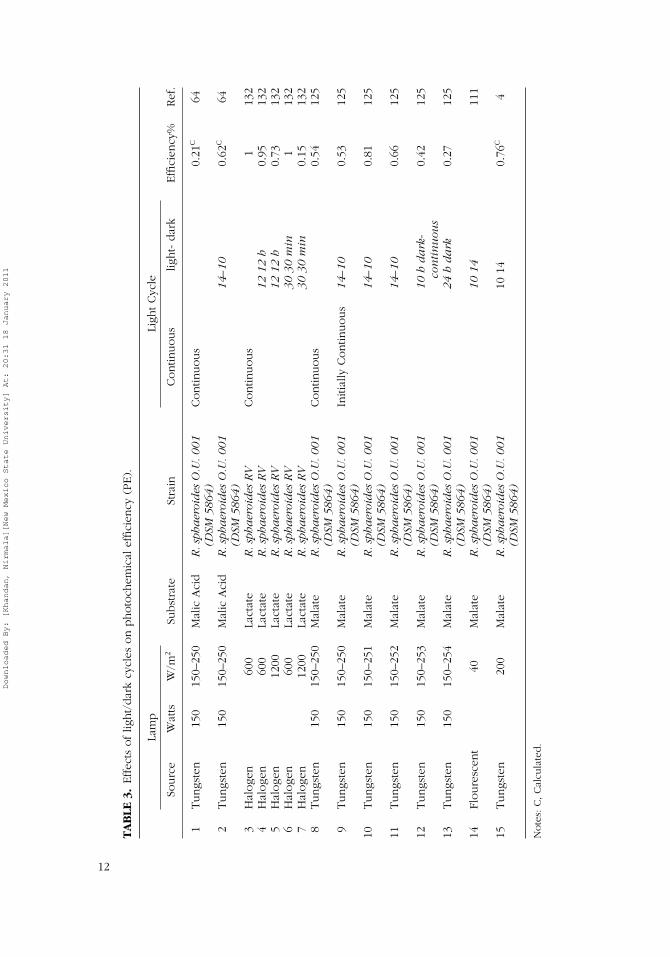
Experimental results on the effects of L/D cycles are tabulated in Table 3.Barbosa et al. (2001) have reported enhanced PE due to short light/dark cy-cles; Wakayama and Miyake (2002) reported a twofold increase in hydrogenproduction rate during a 30-min light cycle in a 12-h cycle. The 30-min L/Dcycle provided the highest PE and the short cycle provided the least; withenhanced PE during excessive light intensities (1,200 W/m2). Though hy-drogen production under the L/D cycle is anticipated to be lower than thatunder continuous illumination, thepositive effects of L/D cycles on PEs inPBRs can be due to the effect of acclimatized bacteria under controlled L/Dcycle simulations. Measuring effects of L/D cycles in real-time may be a chal-lenge due to difficulties in identifying short-existence, naturally formed darkzones of PBRs. Improved performance due to L/D cycles reported have beencompared only to their specific experiments. For example, PEs reported foran L/D cycle operated PBRs are less than 1%, which is 10 times less than thatreported under continuous illumination conditions (Table 1). However, it isimportant to conduct these preliminary studies before attempting to addressdiurnal solar variations in outdoor PBR operation.
Sunlight-Based L/D Cycle
Diurnal variation of light intensity can be expected in solar-based PBRs. Ge-ographical locations and seasonal variations determine the daily available
Downloaded By: [Khandan, Nirmala][New Mexico State University] At: 20:31 18 January 2011

22 V. Gadhamshetty et al.
sunlight in PBRs. Prolonged bad weather, for example, can lead to low solarradiation and corresponding failure of PBRs. When light intensity is unavail-able in solar-based PBRs on cloudy days, cell metabolism will be diverted tomaintenance functions, reducing cell growth. For example, a cell density re-duction of 17% has been reported during the cultivation of Chlorella in PBRs(Ogbonna et al., 1996). The resulting thin culture decreases the economicfeasibility of PBRs due to lower PEs and hydrogen production (El-Shishtawy,Kawasaki, & Morimoto, 1997). This finding corroborates our previous reporton the dependence of hydrogen production on both cell growth rate andinstantaneous cell density (Gadhamshetty, Sukumaran, Nirmalakhandan, &Myint, 2008). This aspect is further discussed in the following section.
Accommodation of diurnal variation is therefore necessary to maintainoptimal PEs in solar-based PBRs. This can be achieved by combining solarand artificial light with an automatic switch to shift to artificial light during lowsolar illumination. However, it will be advantageous if PNS bacteria are capa-ble of producing hydrogen in solar-based PBRs with minimum requirementsfor light supplements. Meyer, Kelley, and Vignais (1978), for example, havereported the merits of unsupplemented L/D-based solar PBRs due to the ben-eficial effects of L/D cycle on increased cell concentration and nitrogenaseenzyme. Koku et al. (2003) pursued this research further using 14-h/10-hL/D cycles to yield slightly higher hydrogen production rates, improved cellconcentrations, and substantial substrate consumption compared to continu-ous illumination. This demonstrates some promise for hydrogen productioncapability of PNS strains under natural outdoor illumination (Koku et al.).Similar results have been confirmed in 12-h L/D-based PBRs (Wakayama &Miyake, 2001; Wakayama et al., 2000).
LIGHT INTENSITY
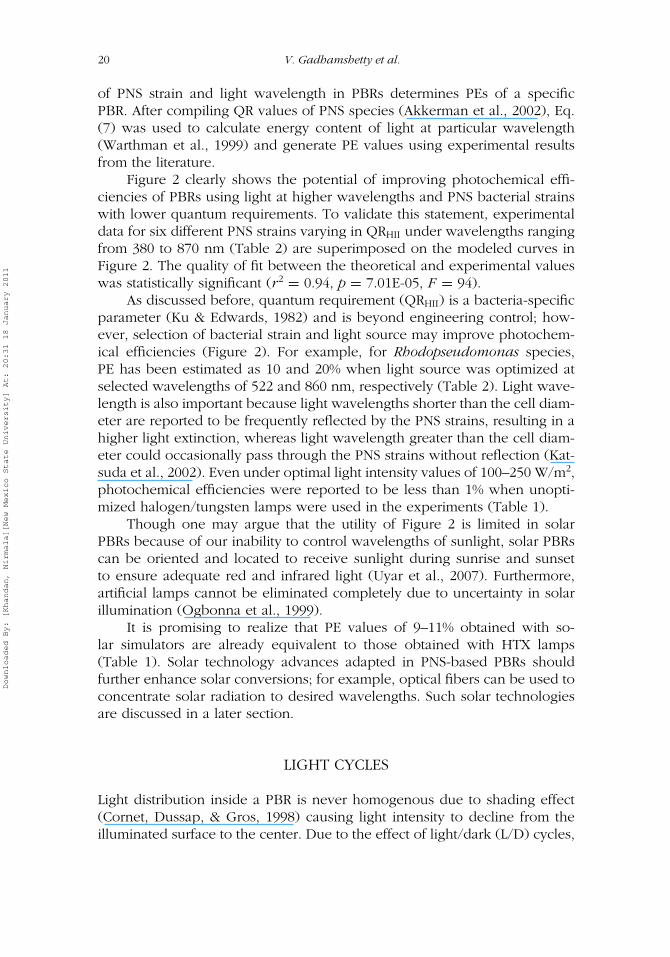
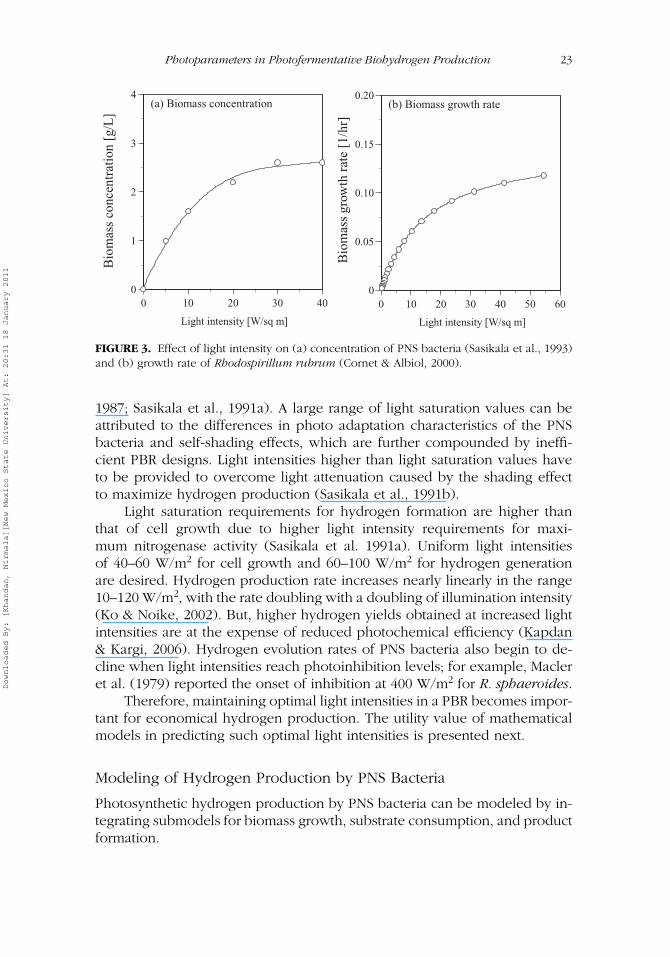
Light intensity, defined as number of photons available for photofermenta-tion process, is one of the most important parameters affecting the perfor-mance of PBRs. The effect of light intensity on the growth of PNS bacteriashown in Figure 3a (Sasikala et al., 1993) indicates that minimal light inten-sities are required to initiate cell growth of PNS bacteria, and cell growthincreases with increase in light intensity, until light intensities reach satura-tion values. It has been demonstrated that both growth and hydrogen evolu-tion increase proportionally with an increase in light intensity until they aresaturated at 65 to 120 W/m2 (Sasikala et al.). The growth rate of Rhodospir-illlum rubrum as a function of light intensity is shown in Figure 3b (Cornet& Albiol, 2000). A similar response of Rhodopseudomonas to sunlight hasbeen demonstrated by M. S. Kim, Ahn, and Yoon (2004). Light saturationvalues reported in the literature range from 50 to 200 W/m2 for Rhodobac-ter sphaeroides (Macler, Pelroy, & Bassham, 1979; J. Miyake & Kawamura,
Downloaded By: [Khandan, Nirmala][New Mexico State University] At: 20:31 18 January 2011
Photoparameters in Photofermentative Biohydrogen Production 23
0
1
2
3
4
0 10 20 30 40
Light intensity [W/sq m]
0
0.05
0.10
0.15
0.20
0 10 20 30 40 50 60
Light intensity [W/sq m]
(a) Biomass concentration (b) Biomass growth rateB
iom
ass
conc
entr
atio
n [g
/L]
Bio
mas
s gr
owth
rat
e [1
/hr]
FIGURE 3. Effect of light intensity on (a) concentration of PNS bacteria (Sasikala et al., 1993)and (b) growth rate of Rhodospirillum rubrum (Cornet & Albiol, 2000).
1987; Sasikala et al., 1991a). A large range of light saturation values can beattributed to the differences in photo adaptation characteristics of the PNSbacteria and self-shading effects, which are further compounded by ineffi-cient PBR designs. Light intensities higher than light saturation values haveto be provided to overcome light attenuation caused by the shading effectto maximize hydrogen production (Sasikala et al., 1991b).
Light saturation requirements for hydrogen formation are higher thanthat of cell growth due to higher light intensity requirements for maxi-mum nitrogenase activity (Sasikala et al. 1991a). Uniform light intensitiesof 40–60 W/m2 for cell growth and 60–100 W/m2 for hydrogen generationare desired. Hydrogen production rate increases nearly linearly in the range10–120 W/m2, with the rate doubling with a doubling of illumination intensity(Ko & Noike, 2002). But, higher hydrogen yields obtained at increased lightintensities are at the expense of reduced photochemical efficiency (Kapdan& Kargi, 2006). Hydrogen evolution rates of PNS bacteria also begin to de-cline when light intensities reach photoinhibition levels; for example, Macleret al. (1979) reported the onset of inhibition at 400 W/m2 for R. sphaeroides.
Therefore, maintaining optimal light intensities in a PBR becomes impor-tant for economical hydrogen production. The utility value of mathematicalmodels in predicting such optimal light intensities is presented next.
Modeling of Hydrogen Production by PNS Bacteria
Photosynthetic hydrogen production by PNS bacteria can be modeled by in-tegrating submodels for biomass growth, substrate consumption, and productformation.
Downloaded By: [Khandan, Nirmala][New Mexico State University] At: 20:31 18 January 2011
24 V. Gadhamshetty et al.
BIOMASS GROWTH MODEL
Biomass growth under substrate-limited conditions can in general be de-scribed by the classical Monod equation:
dCx
dt= µCx (9)
In the case of PBRs, it has been observed that cell growth rate can be in-hibited by the following: (a) higher substrate levels that may cause inhibition(Sasikala et al. 1991a) due to osmotic stress, for example; (b) higher biomassconcentrations that may cause inhibition of growth rate due to reductionof light intensity inside the reactor, self-shading, and limiting substrate diffu-sion, all of which, in turn, can reduce the rate of hydrogen evolution (Kojima& Lin, 2004; Sasikala, Ramana, & Rao, 1991b); and (c) excess light, whichmay cause a decline in biomass growth (Suh & Lee, 2003) due to surplus ofabsorbed light energy, resulting in damage and degradation of the reactioncenter involved in the photosynthetic process (Zonneved, 1998).
Therefore, the specific growth rate term µ in the classical Monod equa-tion has been modified to account for the above factors (Gadhamshetty et al.,2008) as:
µ = µmCs
Ks + Cs + C 2s
Kxi
(1 − Cx
Cxm
)(I
Ks I + I + K I I 2
)(10)
The three terms on the right-hand side of Eq. (10) account for substrateinhibition, biomass inhibition, and light inhibition, respectively.
SUBSTRATE CONSUMPTION MODEL
The substrate consumption rate has been modeled by a modified form ofthe Luedeking-Piret equation (Wang et al., 2006):
dCs
dt= −
(1
YXS
dCx
dt+ 1
YP S
dC p
dt+ µS XCx
)(11)
where the three terms on the right-hand side of the above equation quantifythe uptake for cell growth, the uptake for product formation, and the uptakefor maintenance, respectively. The above equation is modified to includeauto-inhibition by substrate according to Zhang, Zhang, and Chen (1998):
dCs
dt= −
(1
YXS
dCx
dt+ 1
YP S
dC p
dt+ µS XCx
)(Cs
K S A + Cs
)(12)
Downloaded By: [Khandan, Nirmala][New Mexico State University] At: 20:31 18 January 2011
Photoparameters in Photofermentative Biohydrogen Production 25
PRODUCT FORMATION MODEL
The kinetic expression for product formation is based on the Luedeking-Piret equation. According to this model, product formation depends on bothgrowth rate and instantaneous biomass concentration in a linear manner(Leudeking & Piret, 1959). Type of substrate and its concentration are im-portant factors in hydrogen evolution rates (Sasikala et al., 1993), becauseinhibitory levels of substrate concentration can result in decreased hydrogenproduction (Hirayama, Uya, Yamada, & Moriwaki, 1986). Similarly, higherlight intensities can also reduce the hydrogen evolution rates (Macler et al.,1979). Therefore, inhibition effects of substrate, product, and light inten-sity are added to obtain the modified form of the Luedeking-Piret equation(Zhang et al., 1998):
dC p
dt=(
YP XdCx
dt+ µP XCx
)(Cs
K P S + Cs + C 2s
K Pi
)(I
K P I + I + I 2K pI
)
×(
1 − C p
C pm
)(13)
The above modeling frame has been calibrated and validated using batchexperimental results from the literature with malate as a model substrate andRhodobacter sphaeroides as a model biomass (Gadhamshetty et al., 2008).Temporal hydrogen evolution as well as cell growth predicted by this modelagreed well with the experimentally measured data obtained from literaturereports, with statistically significant correlation coefficients exceeding 0.9.
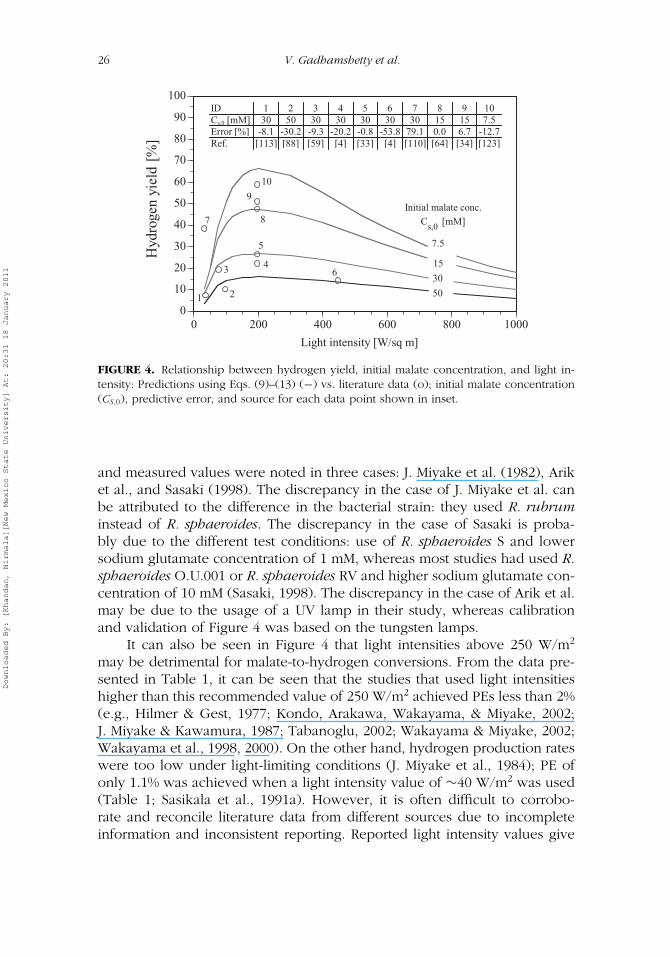
Simulations of hydrogen yield as a function of light intensity and initialmalate concentration (as defined by Eq. (6)) are presented in Figure 4.Optimal light intensities were identified based on the model simulations atfour different initial malate concentration values of 7.5, 15, 30, and 50 mM,each at light intensities ranging from 30 to 1,000 W/m2.
Figure 4 indicates that a light saturation value of at least 50 W/m2 isrequired to trigger malate to hydrogen conversions by R. sphaeroides. How-ever, light intensities above light saturation values are required under practi-cal conditions to overcome the problem of light attenuation, and higher lightintensities up to 250 W/m2 have been shown to improve hydrogen yield.Light intensities above 250 W/m2 have a negative effect on hydrogen yieldas observed by Arik et al. (1996). These simulations indicate that optimallight intensity for maximum hydrogen yield from malate by Rhodobactersphaeroides is 150–250 W/m2, which is similar to the experimentally deter-mined range reported in the literature (Arik et al.; Koku et al., 2003; Nogiet al., 1985). Literature data from 10 different studies (Table 1) are superim-posed in Figure 4 to demonstrate the validity of the Eqs. (9)–(13) in describingphotofermentation by R. sphaeroides. Discrepancies between the predicted
Downloaded By: [Khandan, Nirmala][New Mexico State University] At: 20:31 18 January 2011
26 V. Gadhamshetty et al.
0
10
20
30
40
50
60
70
80
90
100
0 200 400 600 800 1000
Light intensity [W/sq m]
1 2
3 4
5
6
Initial malate conc.
Cs,0
[mM]
7.5
15
30
50
7 8
9
10
ID 1 2 3 4 5 6 7 8 9 10Cs,0 [mM] 30 50 30 30 30 30 30 15 15 7.5Error [%] -8.1 -30.2 -9.3 -20.2 -0.8 -53.8 79.1 0.0 6.7 -12.7Ref. [113] [88] [59] [4] [33] [4] [110] [64] [34] [123]
Hyd
roge
n yi
eld
[%]
FIGURE 4. Relationship between hydrogen yield, initial malate concentration, and light in-tensity: Predictions using Eqs. (9)–(13) (−) vs. literature data (o); initial malate concentration(CS ,0), predictive error, and source for each data point shown in inset.
and measured values were noted in three cases: J. Miyake et al. (1982), Ariket al., and Sasaki (1998). The discrepancy in the case of J. Miyake et al. canbe attributed to the difference in the bacterial strain: they used R. rubruminstead of R. sphaeroides. The discrepancy in the case of Sasaki is proba-bly due to the different test conditions: use of R. sphaeroides S and lowersodium glutamate concentration of 1 mM, whereas most studies had used R.sphaeroides O.U.001 or R. sphaeroides RV and higher sodium glutamate con-centration of 10 mM (Sasaki, 1998). The discrepancy in the case of Arik et al.may be due to the usage of a UV lamp in their study, whereas calibrationand validation of Figure 4 was based on the tungsten lamps.
It can also be seen in Figure 4 that light intensities above 250 W/m2
may be detrimental for malate-to-hydrogen conversions. From the data pre-sented in Table 1, it can be seen that the studies that used light intensitieshigher than this recommended value of 250 W/m2 achieved PEs less than 2%(e.g., Hilmer & Gest, 1977; Kondo, Arakawa, Wakayama, & Miyake, 2002;J. Miyake & Kawamura, 1987; Tabanoglu, 2002; Wakayama & Miyake, 2002;Wakayama et al., 1998, 2000). On the other hand, hydrogen production rateswere too low under light-limiting conditions (J. Miyake et al., 1984); PE ofonly 1.1% was achieved when a light intensity value of ∼40 W/m2 was used(Table 1; Sasikala et al., 1991a). However, it is often difficult to corrobo-rate and reconcile literature data from different sources due to incompleteinformation and inconsistent reporting. Reported light intensity values give
Downloaded By: [Khandan, Nirmala][New Mexico State University] At: 20:31 18 January 2011
Photoparameters in Photofermentative Biohydrogen Production 27
information only on incident light intensity of reactor surface and not spa-tial light distribution and light homogeneity in PBRs. Actual photochemicalefficiencies in PBRs are affected by localized average light intensity values,which are rarely measured in lab-scale studies. Understanding of light atten-uation with variable cell density in PBRs is therefore necessary to interpretincident light intensity values correctly (see the following section).
Other mathematical models to simulate the dependence of hydrogenproduction on light intensity were well reviewed by Grima, Acien Fernandez,Camacho, and Chist (1999). The impact of light intensity on photochemicalefficiencies is further discussed in a later section.
LIGHT ATTENUATION
Light attenuation is a major problem affecting light distribution in PBRs(Kondo et al., 2002). Light attenuates in PBRs mainly due to the shadingeffect caused by absorption of light by pigments (Cornet et al., 1992), sus-pended medium (Katsuda et al., 2002), scattering of light by cells (Pottieret al., 2005), and entrained air bubbles (Hoekema, Bijmans, Janssen, Tram-per, & Wijffels, 2002). This problem is further compounded by cell growthpreventing the incident light from penetrating the reactor (J. Miyake et al.,1999) as the culture becomes dense or as the depth of the reactor increases(Kondo, Wakayama, & Miyake, 2006). Insufficient light energy results inreduction of PE.
Light is rapidly attenuated in dense bacterial mass cultures, causing thecells to acclimatize to a low-light environment. These cells subsequently ac-cumulate a large number of bchl molecules in the photochemical apparatusand have a large bchl antenna size in association with their photosystem.This evolutionary trait drives bacteria to absorb as many photons as possible,resulting in low hydrogen per pigment productivity, because the rate of pho-ton absorption by bchl antenna far exceeds the rate at which photosynthesiscan utilize them. This overexcitation dissipates 80% of absorbed photonsas heat, reducing PEs to unacceptably low levels (Kondo et al., 2006). Ap-proaches suggested in the literaturee to mitigate light attenuation problem inPBRs include reduction of antenna size and modification of light-harvestingcomplexes (Kondo et al., 2006).
Reduction of antenna size has implications on the development of strainswith truncated light-harvested bchl antenna size (Polle, Niyogi, & Melis,2001). Cells with lower pigment composition reduce light attenuation inPBR, improving the total efficiency of the reactor (J. Miyake et al., 1999).For example, Kondo et al. (2006) have isolated MTP4, a reduced-pigmentmutant of Rhodobacter sphaeroides RV, to improve the spatial distribution oflight.
Downloaded By: [Khandan, Nirmala][New Mexico State University] At: 20:31 18 January 2011
28 V. Gadhamshetty et al.
Modification of LH complexes has been attempted by genetic manip-ulation or mutation (Kondo et al., 2006). Alteration of the LHI/LHII ratioinduces the change of the energy pathway from LH pigments to the photo-synthetic RC. The change in the amount of bacteriochlorophylls affects thelight penetration profile and hydrogen production in PBRs. For example,when Vasilyeva et al. (1999) altered the LHI/LHII ratio, a 1.5-fold increase inhydrogen production was noted.
Though genetic engineering techniques are emerging to optimize pig-ment composition, PBRs can be engineered to provide optimum light inten-sity throughout the reactor to achieve higher PE. Kondo et al. (2002), forinstance, have realized quasi-exponential decline of light illumination withincrease in penetration depth of the reactor. This motivated them to engi-neer a double-layered bioreactor to accommodate two different bacteria toproduce hydrogen at conditions of optimum illumination as well as reducedillumination. Optical fibers have been used to provide homogenous lightenergy throughout the reactor (El-Shishtawy, Kawasaki, & Morimoto, 1998).
Other engineering manipulations include the use of a highsurface–volume ratio and internal illumination and mixing (Koku et al., 2002)which are discussed in a later section. For example, mixing can maintain lowhydrogen partial pressure in liquid and distribute the cells within the cul-ture, aiding the homogenous exposure of the microorganisms to light andsubstrate. Mechanical mixing, sparging, and natural mixing are some of thetechniques suggested in the literature (Otsuki, Uchiyama, Fujiki, & Fuku-naga, 1998). Mixing was often accomplished using inert gases such as argon(Hoekema et al. 2002). Installation of baffles can help mixing and reducelight path to improve biomass productivity in flat-panel airlift PBRs, as sug-gested by Degen, Uebele, Retze, Schmid Staiger, and Trosch (2001). Otheradvanced reactor designs are discussed in a later section.
Though research efforts are expected to bring down the cost of suchtechniques, PBRs have to be operated under optimum cell concentrations.As explained in the following section, validated models can predict thefate of light irradiance as a function of cell concentration and penetrationdepth.
Modeling of Light Attenuation in Photobioreactors
Modeling of light attenuation can aid in better understanding of light dis-tribution within PBRs (Nakada et al., 1995), in the evaluation of alternativedesigns for optimizing photoparameters, and in scale-up of PBRs. Some ofthe models suggested in the literature to describe light distribution insidePBRs and to predict the availability of light energy for cell growth and hy-drogen production are summarized next (Cornet et al., 1998; Suh & Lee,2003; Tredici & Zitelli, 1998).
Downloaded By: [Khandan, Nirmala][New Mexico State University] At: 20:31 18 January 2011
Photoparameters in Photofermentative Biohydrogen Production 29
LAMBERT-BEER MODEL
A simple one-dimensional model that assumes constant light absorption pro-portional to length of light path and biomass concentration is as follows:
I
I0= 10−ε(C )C xL (14)
where ε(c) is the extinction coefficient at cell concentration C (m2/g); I0
is incident light intensity at the reactor surface (W/m2); I is incident lightintensity at light path length L (W/m2); and Cx is cell concentration (g/L).
Multidimensional models have been reported to incorporate light-scattering effects in all directions (Aiba, 1982; Cornet et al. 1992; Cornet,Dussap, & Gros, 1995; Yokota, Yashima, Takigawa, & Takahashi, 1991). Cor-net et al. (1995) have assumed one-dimensional approximation in a two-fluxmodel to describe light transfer for various PBR geometries; Aiba and Cornet,Dussap, and Gros (1994) have used radiative transfer theory for modeling oflight transfer; Acien Fernandez, Garcıa Camacho, Sanchez Perez, FernandezSevilla, and Molina Grima (1997) have proposed a model to estimate averageirradiance inside a tubular photobioreactor.
MODIFIED BEER-LAMBERT MODEL
Katsuda et al. (2002) have incorporated Rose and Lloyd’s hypothesis in Beer-Lambert’s law to predict light attenuation at any cell concentration (Cx):
I = L 20
(L + L 0)2.� I0λ
· 10−ε(C )Cx L (15)
where L0 is the distance between the light source and the illuminated surface(mm) and λ is the wavelength of the light source (nm).
Models such as the above can be used to predict light attenuation inPBRs as a function of light attenuation distance (L0). Once a bacterial strainis selected, the extinction coefficient, ε(C) can be measured at a single con-centration over different wavelengths. This extinction coefficient can thenbe used to predict light attenuation for different concentrations and differentlamp sources. We have used Eq. (15) to derive a plot of light attenuation forvarious cell concentrations with a xenon lamp as light source and Rhodobac-ter capsulatus as bacterial strain in Figure 5a and with a halogen lamp inFigure 5b (Katsuda et al., 2002).
RADIANT LIGHT TRANSFER MODEL
This model is based on the Schuster assumptions (Cornet & Albiol, 2000)and incorporates a scattering effect into the model using the Schuster massabsorption coefficient, Ea, and Schuster scattering coefficient, Es. Light atten-uation in this model thus depends on optical thickness, L, of the medium;
Downloaded By: [Khandan, Nirmala][New Mexico State University] At: 20:31 18 January 2011

30 V. Gadhamshetty et al.
0
10
20
30
40
0 10 20 30 40 50
Light path length [mm]
Biomass conc.[kg/cu m]
0
0.17
0.51.2
0
10
20
30
40
0 10 20 30 40 50
Light path length [mm]
Biomass conc.[kg/cu m]
0
0.17
0.5
0.85
pmalnegolaH)b(pmalnoneX)a(L
ight
inte
nsit
y [m
W/s
q m
]
FIGURE 5. Light attenuation in PBRs at different biomass concentrations: (a) xenon lamp:predictions by Eq. (15) (−) vs. literature data (o) from Katsuda et al. (2002); (b) halogen lamp:predictions by Eq. (15) (−) vs. literature data (o) from Katsuda et al. (2002).
light attenuation distance, z; and cell concentration, Cx.
I�I0
= 2(1 + α)e−δ(Z−1) − (1 − α)eδ(Z−1)
(1 + α)2eδ − (1 − α)2e−δ(16)
α =(
Ea
Ea + E S
)1/2
(17)
δ = (Ea + E S)1/2 αC X L t (18)
where I� is mean radiant light energy (W/m2); I0 is incident radiant lightflux (W/m2); Ea, Es are mean Schuster mass absorption and scattering co-efficient (m2/kg dry mass); Lt is optical thickness of the medium (m); z islight attenuation distance (m); Z is dimensionless distance (z/L); and Cx isbiomass concentration in the culture medium (g/L)
Schuster coefficients depend on the type of PNS strain and can bedetermined as suggested by Cornet and Albiol (2000). The above equationscan then be used in preliminary estimation of light attenuation as a functionof normalized radiant energy for different values of optical thickness, Z, andlight attenuation length, L. Plots generated in this manner for Rhodospirillumrubrum in a rectangular photobioreactor are shown in Figure 6 (Cornet et al.,2000). This approach can be extended for any PBR geometry (Cornet, Marty,& Gros, 1997) such as cylindrical reactors (Cornet, Favier-Teodorescu, &Dussap, 2003).
Downloaded By: [Khandan, Nirmala][New Mexico State University] At: 20:31 18 January 2011
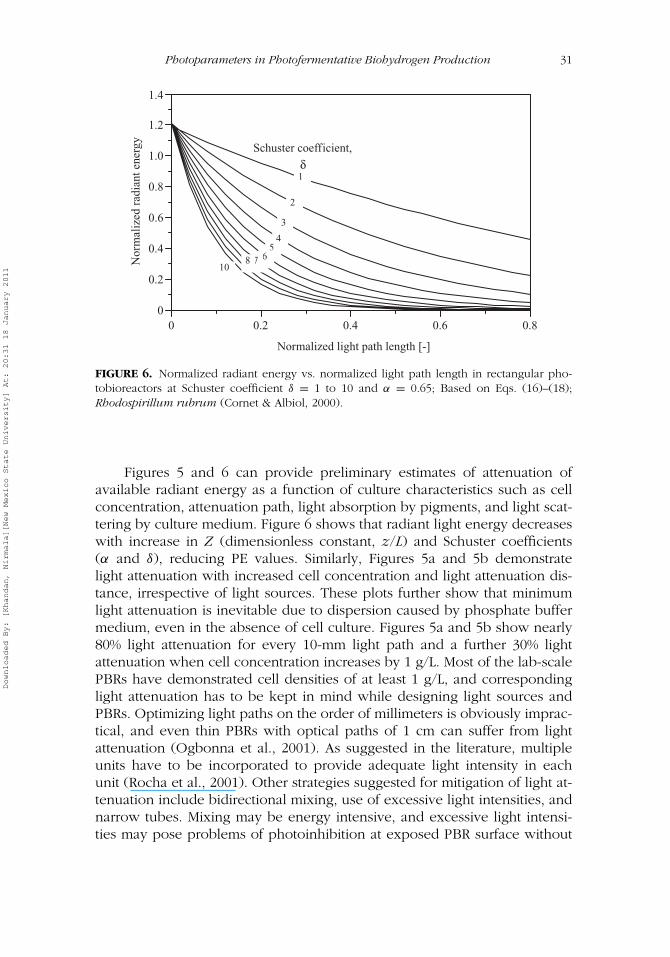
Photoparameters in Photofermentative Biohydrogen Production 31
0
0.2
0.4
0.6
0.8
1.0
1.2
1.4
0 0.2 0.4 0.6 0.8
Nor
mal
ized
rad
iant
ene
rgy
Normalized light path length [-]
1
2
3
4
10
5678
Schuster coefficient,
δ
FIGURE 6. Normalized radiant energy vs. normalized light path length in rectangular pho-tobioreactors at Schuster coefficient δ = 1 to 10 and α = 0.65; Based on Eqs. (16)–(18);Rhodospirillum rubrum (Cornet & Albiol, 2000).
Figures 5 and 6 can provide preliminary estimates of attenuation ofavailable radiant energy as a function of culture characteristics such as cellconcentration, attenuation path, light absorption by pigments, and light scat-tering by culture medium. Figure 6 shows that radiant light energy decreaseswith increase in Z (dimensionless constant, z/L) and Schuster coefficients(α and δ), reducing PE values. Similarly, Figures 5a and 5b demonstratelight attenuation with increased cell concentration and light attenuation dis-tance, irrespective of light sources. These plots further show that minimumlight attenuation is inevitable due to dispersion caused by phosphate buffermedium, even in the absence of cell culture. Figures 5a and 5b show nearly80% light attenuation for every 10-mm light path and a further 30% lightattenuation when cell concentration increases by 1 g/L. Most of the lab-scalePBRs have demonstrated cell densities of at least 1 g/L, and correspondinglight attenuation has to be kept in mind while designing light sources andPBRs. Optimizing light paths on the order of millimeters is obviously imprac-tical, and even thin PBRs with optical paths of 1 cm can suffer from lightattenuation (Ogbonna et al., 2001). As suggested in the literature, multipleunits have to be incorporated to provide adequate light intensity in eachunit (Rocha et al., 2001). Other strategies suggested for mitigation of light at-tenuation include bidirectional mixing, use of excessive light intensities, andnarrow tubes. Mixing may be energy intensive, and excessive light intensi-ties may pose problems of photoinhibition at exposed PBR surface without
Downloaded By: [Khandan, Nirmala][New Mexico State University] At: 20:31 18 January 2011
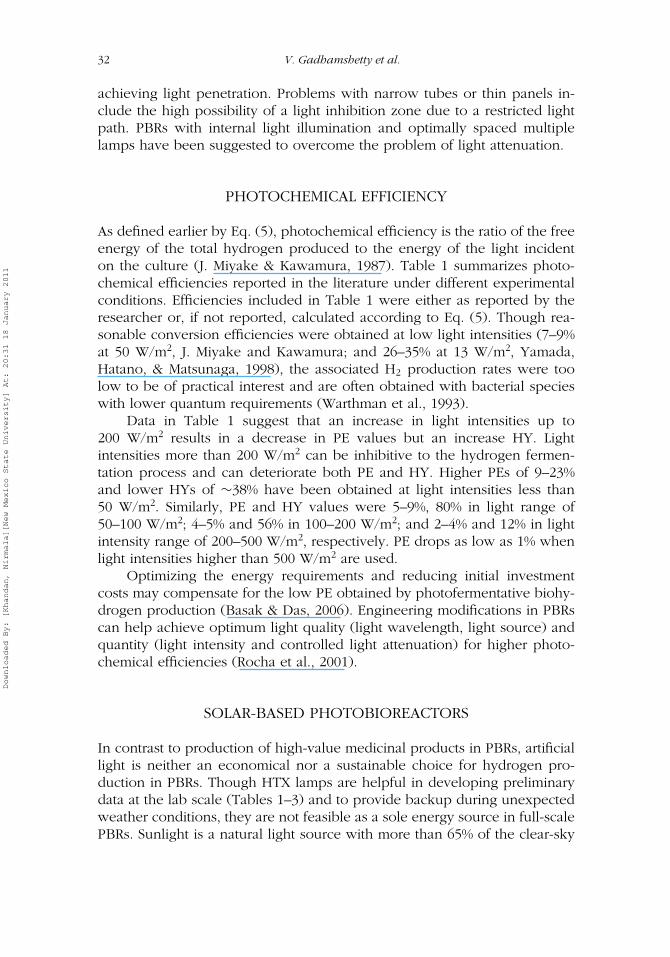
32 V. Gadhamshetty et al.
achieving light penetration. Problems with narrow tubes or thin panels in-clude the high possibility of a light inhibition zone due to a restricted lightpath. PBRs with internal light illumination and optimally spaced multiplelamps have been suggested to overcome the problem of light attenuation.
PHOTOCHEMICAL EFFICIENCY
As defined earlier by Eq. (5), photochemical efficiency is the ratio of the freeenergy of the total hydrogen produced to the energy of the light incidenton the culture (J. Miyake & Kawamura, 1987). Table 1 summarizes photo-chemical efficiencies reported in the literature under different experimentalconditions. Efficiencies included in Table 1 were either as reported by theresearcher or, if not reported, calculated according to Eq. (5). Though rea-sonable conversion efficiencies were obtained at low light intensities (7–9%at 50 W/m2, J. Miyake and Kawamura; and 26–35% at 13 W/m2, Yamada,Hatano, & Matsunaga, 1998), the associated H2 production rates were toolow to be of practical interest and are often obtained with bacterial specieswith lower quantum requirements (Warthman et al., 1993).
Data in Table 1 suggest that an increase in light intensities up to200 W/m2 results in a decrease in PE values but an increase HY. Lightintensities more than 200 W/m2 can be inhibitive to the hydrogen fermen-tation process and can deteriorate both PE and HY. Higher PEs of 9–23%and lower HYs of ∼38% have been obtained at light intensities less than50 W/m2. Similarly, PE and HY values were 5–9%, 80% in light range of50–100 W/m2; 4–5% and 56% in 100–200 W/m2; and 2–4% and 12% in lightintensity range of 200–500 W/m2, respectively. PE drops as low as 1% whenlight intensities higher than 500 W/m2 are used.
Optimizing the energy requirements and reducing initial investmentcosts may compensate for the low PE obtained by photofermentative biohy-drogen production (Basak & Das, 2006). Engineering modifications in PBRscan help achieve optimum light quality (light wavelength, light source) andquantity (light intensity and controlled light attenuation) for higher photo-chemical efficiencies (Rocha et al., 2001).
SOLAR-BASED PHOTOBIOREACTORS
In contrast to production of high-value medicinal products in PBRs, artificiallight is neither an economical nor a sustainable choice for hydrogen pro-duction in PBRs. Though HTX lamps are helpful in developing preliminarydata at the lab scale (Tables 1–3) and to provide backup during unexpectedweather conditions, they are not feasible as a sole energy source in full-scalePBRs. Sunlight is a natural light source with more than 65% of the clear-sky
Downloaded By: [Khandan, Nirmala][New Mexico State University] At: 20:31 18 January 2011
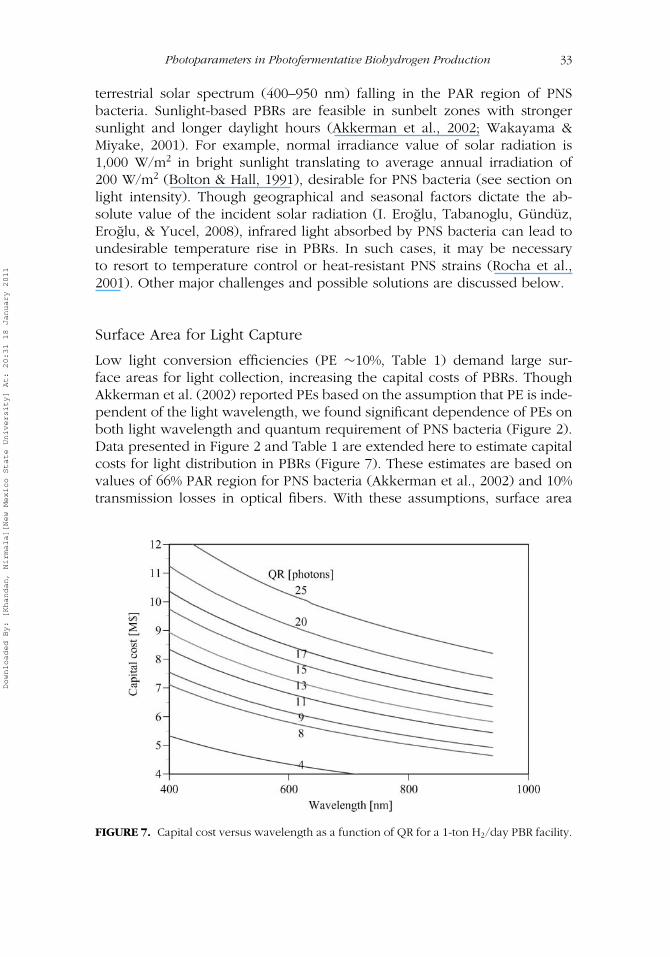
Photoparameters in Photofermentative Biohydrogen Production 33
terrestrial solar spectrum (400–950 nm) falling in the PAR region of PNSbacteria. Sunlight-based PBRs are feasible in sunbelt zones with strongersunlight and longer daylight hours (Akkerman et al., 2002; Wakayama &Miyake, 2001). For example, normal irradiance value of solar radiation is1,000 W/m2 in bright sunlight translating to average annual irradiation of200 W/m2 (Bolton & Hall, 1991), desirable for PNS bacteria (see section onlight intensity). Though geographical and seasonal factors dictate the ab-solute value of the incident solar radiation (I. Eroglu, Tabanoglu, Gunduz,Eroglu, & Yucel, 2008), infrared light absorbed by PNS bacteria can lead toundesirable temperature rise in PBRs. In such cases, it may be necessaryto resort to temperature control or heat-resistant PNS strains (Rocha et al.,2001). Other major challenges and possible solutions are discussed below.
Surface Area for Light Capture
Low light conversion efficiencies (PE ∼10%, Table 1) demand large sur-face areas for light collection, increasing the capital costs of PBRs. ThoughAkkerman et al. (2002) reported PEs based on the assumption that PE is inde-pendent of the light wavelength, we found significant dependence of PEs onboth light wavelength and quantum requirement of PNS bacteria (Figure 2).Data presented in Figure 2 and Table 1 are extended here to estimate capitalcosts for light distribution in PBRs (Figure 7). These estimates are based onvalues of 66% PAR region for PNS bacteria (Akkerman et al., 2002) and 10%transmission losses in optical fibers. With these assumptions, surface area
FIGURE 7. Capital cost versus wavelength as a function of QR for a 1-ton H2/day PBR facility.
Downloaded By: [Khandan, Nirmala][New Mexico State University] At: 20:31 18 January 2011

34 V. Gadhamshetty et al.
requirements for production of 1 ton of hydrogen/day are estimated at 47Ha, solar radiation of 25 MJ/m2/day, and with PE value of 10%, respectively.
Currently, optical fibers are estimated to cost ∼$US1,700/m2, whichtranslates to more than $2,000M for ton H2/day. However, cost of opticalfibers is expected to decrease by at least 100-fold in the near future, whenproduced in large quantities. Janssen (2002) has suggested that a reasonablecost for optical fibers under large-scale production would be ∼$0.05/m. As-suming this cost, relationships between capital costs for producing 1 ton ofhydrogen/day, QR, and light source wavelength are shown in Figure 7. Itcan be seen from Figure 7 that capital investments can be drastically de-creased when PNS strains with lower quantum requirements are used withlight sources at higher wavelengths. Assuming the life span of optical fibersto be 10 years, hydrogen cost will have to be ∼$7/kg to justify a payback pe-riod of about 4.3 years. Yet, cost competitiveness of the biological hydrogenis solely dependent on political factors. With the cost of fossil fuels increas-ing dramatically and regulatory controls on environmental quality tightening,PBRs can become increasingly cost effective in the future.
Though the premise of Figure 7 on optimization of light wavelengthpertains to artificial light, we reiterate that these plots can be applied tosunlight applicaton in PBRs due to the research finding (Uyar et al., 2007)that orientation and geometry of PBRs can be manipulated to ensure light ofdesired wavelengths such as infrared light. Technological advances in opticalsystems to shift sunlight to a range of 650–800 nm were also suggested inthe literature. For example, I. Eroglu et al. (2008) have recently reportedthat the wavelength of light can be manipulated in outdoor PBRs usingtransparent cooling jackets filled with laser dye to transform the absorbedwavelengths into longer ones to improve PE in PBRs. Thoughcompellingreasons to pursue further research on artificial light was discussed previously,state-of-the-art L/D cycle technology has not matured enough to continuehydrogen production under dark conditions in the absence of sunlight toeliminate artificial lamps completely.
Collection of Solar Radiation
The performance of conventional optical systems is hindered by their in-ability to deliver prescribed solar intensities and flux distributions, reducingsolar collection efficiency to ∼10–20% (Table 1). A major breakthrough isrequired to improve the cost effectiveness of current state-of-the-art solarcollection technology. Solar collection techniques employ lenses, parabolicmirrors, and light-tracking sensors to concentrate and collect the solar lightvia optical fibers for distribution in PBRs. Less than 20% light attenuationis reported during light transmission by optical fibers (Janssen, 2002). Gor-don (2002) has suggested the following alternate nonimaging optical designsto improve solar collection: (a) stationary mirrored troughs placed around
Downloaded By: [Khandan, Nirmala][New Mexico State University] At: 20:31 18 January 2011
Photoparameters in Photofermentative Biohydrogen Production 35
standard reactor shapes, to replace expensive reactors with inexpensive re-flectors; and (b) dual-axis tracking solar fiber-optic mini-dish concentratorsto collect, concentrate, and transport sunlight via contoured polymeric lightextractors for uniform sunlight distribution in PBRs.
These technologies are ready to be deployed in real-world applications.For example, several approaches for concentrating sunlight have alreadybeen demonstrated in the field of photovoltaics. Examples include acryliclenses that can concentrate sunlight by a factor of 21,000; silicone Fresnellenses that can concentrate sunlight by a factor of 8,000; and stretched lensmini-modules capable of achieving 27% concentration efficiency and main-taining temperature of 25◦C by air-cooling (M. O’Neill, McDanal Jaster, 2002;M. J. O’Neill, 2000). Ogbonna et al. (1999) have developed acrylic protectedsolar light collectors (surface area of 864 cm2) with 12 Fresnel lenses (105mm diameter) equipped with a light-tracking device to capture nearly 38% ofdesired solar radiation. The National Renewable Energy Laboratory (NREL;NCPV, 2001), for example, has been actively developing solar collection tech-nologies for commercial use. Such technologies hold promise for applicationin PBRs to fulfill the promise of hydrogen production from sunlight.
Light Redistribution
The light regime inside a PBR can be categorized as either a photic zoneof intense sunlight at the PBR surface or a dark zone in the interior of thereactor. Figure 5 can be used as a preliminary aid to study light gradientin PBRs caused by higher cell densities (as discussed prevously). The lightgradient will eventually lead to the L/D cycles and affect PE. However,shading effects due to high cell density can also be advantageous whenbrighter sunlight intensities are encountered (discussed later). Irrespective oflight source, engineering has to play a key role in developing efficient PBRdesigns to ensure adequate light quantity and quality throughout the PBR.
Recognizing that light redistribution in PBRs is a major engineeringchallenge, considerable research has been done in the past two decadesto address this problem. Mori (1985) suggested a vertical bubble columnwith a large number of glass fibers fixed axially. Ogbonna et al. (1999)replaced the fibers with a few solid transparent bars (glass or quartz) andused a stirred-tank reactor. Though these designs show promise in lab-scalestudies, fiber requirements for large-scale hydrogen production may be costprohibitive now. Janssen (2002) has proposed a rectangular airlift PBR with alarge number of light-redistributing plates fixed a few centimeters from oneanother.
A combination of light-receiving face and reflection sheets for effectivelight transfer was proposed in novel PBR design proposed by El-Shishtawyet al. (1997). Tsygankov et al. (1998); Tsygankov, Laurinavichene, andGogotov (1994); and Tsygankov, Hirata, Miyake, Asada, and Miyake (1994)
Downloaded By: [Khandan, Nirmala][New Mexico State University] At: 20:31 18 January 2011
36 V. Gadhamshetty et al.
developed a PBR consisting of three concentric glass cylinders where lightsources were directly placed into the bioreactor to mitigate light attenuation.Continuous-flow operation can also be a manipulative strategy to control celldensity and corresponding light attenuation (Fascetti & Todini, 1995). A com-bination of continuous-flow PBR with hollow fiber was found to improvephotohydrogen production (Markov, Bazin, & Hall, 1995). Nakada, Nishikata,Asada, and Miyake (1996) trapped the cells of Rhodobacter sphaeroides ina two-layer gel to investigate the distribution of pigment, cell growth, andlight penetration in the gels. J. Miyake et al. (1999) constructed a sunlightcollecting system and simulated sunlight illumination pattern by using halo-gen lamp as the light source to enhance the irradiation area, cell concen-tration, and surface-to-volume ratio in the bioreactor. Extensive reviews onother PBR design advances are provided elsewhere (Acien Fernandez et al.,1997; Akkerman et al., 2002; Gordon, 2002; Janssen, 2002; Miron, Camacho,Gomez, Molina Grima, & Chisti, 2000; Rocha et al., 2001; Tredici & Zitelli,1997).
Light Saturation
One of the major problems in the application of solar energy for hydrogenproduction in PBRs includes the light saturation effect. As discussed earlier,saturation values for PNS bacteria vary between 150 and 250 W/m2, and inci-dent solar radiation can be as high as 450 W/m2 (Gordon, 2002) at meridiantransit. For example, average solar radiation in southern New Mexico caneasily reach 1,000 W/m2 on a typical summer day. These low saturation val-ues have implications on reduced solar conversion efficiencies wasting mostof the irradiance as fluorescence and heat.
Equation (19) expresses effective fraction (Es) of utilizable absorbedphotons as a function of the input light intensity (I0) and the saturationintensity (Is):
ηs = IS
I0
(ln
[I0IS
]+ 1
)(19)
The saturation light intensity depends on the photosynthetic apparatus ofPNS bacteria (Sasikala et al., 1993). Light utilization efficiency at low irradi-ances (I0/Is # 1) comes very close to 100%, whereas, when the irradianceapproaches full sunlight (I0/Is > 20), the efficiency of light utilization dropsto less than 20%, the remainder being wasted as fluorescence and heat(Goldman, 1979). Overabundance of excitation energy can further damagethe photosynthetic apparatus, causing photoinhibition (Melis, 1999; Melis,Neidhardt, & Benemann, 1999). The following recommendations have beensuggested to minimize photoinhibition.
Downloaded By: [Khandan, Nirmala][New Mexico State University] At: 20:31 18 January 2011
Photoparameters in Photofermentative Biohydrogen Production 37
SUNLIGHT DILUTION
Sunlight dilution is a technique used in algal PBRs that dates back to the mid-1950s (Burlew, 1953; Myers, 1955; Tamiya, 1957). Kok (1953) was among thefirst to improve the efficiency of sunlight absorption at higher intensities byproviding light in turbulent-induced flashes separated by sufficiently longperiods of darkness. However, there has been disagreement on the ability ofstirring technique in simulating flash light pattern (Tredici & Zittelli, 1998).Another approach for reducing the sunlight intensity involves spatial dilutionof light where incident solar radiation is distributed on a greater PBR surface.Cones made out of silver papers, plastic, and glass have been used to achievespatial distribution (Evenari, Mayer, & Gottesman, 1953; Terry & Raymond,1985). Suspended particles of a phosphorescent substance (copper-activatedZn-Cd-S-phosphor) have also been used to absorb and reradiate light indark zones to achieve limited success (Tamiya). Recent innovations of lightdistribution such as a combination of optical fibers and quartz or acrylicrods (Mori et al., 1989) were discussed in a previous section. Wakayamaand Miyake (2002) have recently proposed shade bands for light dispersionto improve PE by 15-fold. Though artificial light sources can be selected atdesirable intensities, it is important to reconcile process inefficiencies posedby sunlight dilution techniques in PBRs where a large proportion of sun-light is not utilized. In such cases, the dispersed light could be utilized ifother energy conversion devices such as solar cells are operated in paral-lel with PBRs (Wakayama & Miyake). Also, realizing the little control wehave over sunlight, biologists have embraced genetic manipulations tech-niques to deal with problems of light saturation, as discussed in a latersection.
HIGH CELL DENSITIES
The self-shading effect of high cell densities in PBRs can lead to progressivelight gradients as the depth of the PBR increases from the photic zone tothe dark zones. Though light attenuation is a serious problem with artifi-cial lights, utilization of sunlight nullifies the disadvantages of both brightsunlight intensities and typical light attenuation problems. If advanced solartechnologies are used to concentrate solar light to desired I0, cell density canbe adjusted to engineer PBRs for brighter light intensities. Figure 5 showsthat cell densities of 0.17 and 0.5 g/L can be used to achieve light attenua-tion of 15 and 33%, 45 and 87% at lab-scale PBR depths of 4 and 10 mm,respectively. These preliminary results can be used as a starting point to op-timize PBR conditions under bright solar light. However, genetic engineeringtechniques may have to be used to solve the disadvantage of shade-adaptedPNS bacteria due to decreased light-saturation capacities.
Downloaded By: [Khandan, Nirmala][New Mexico State University] At: 20:31 18 January 2011

38 V. Gadhamshetty et al.
GENETIC MANIPULATIONS
Reduced antenna size and pigment composition as well as manipulationsof nitrogenase and hydrogenase enzymes (Ooshima et al., 1998) have beenfound to solve problems of low light saturation, low PEs, photoinhibition,hydrogen uptake under dark conditions, and sensitivity of PNS strains to oxy-gen levels (Ogbonna et al., 1999). Cultivation of PNS bacteria with higherlight saturation values can be an alternative solution. Kondo et al. (2002),for example, observed a 50% increase in hydrogen production when pig-ment composition in the mutant (R. sphaeroides RV) strain was reduced by50%. Similar results were obtained when chlorophyll content and size werereduced in green algae (Melis, 1999). However, care has to be taken withreduction of pigment composition because certain pigments offer protectionfrom photo oxidation (Koku et al., 2003). Other strategies for genetic modifi-cations of PNS bacteria include modifications to remove hydrogenase activityand repression of PHB synthesis (Koku et al., 2003). Metabolic engineeringhas been suggested for maximizing hydrogen production by redirecting re-ducing equivalents to nitrogenase enzyme (Vignais, Billoud, & Meyer, 2001).Cocultivation of algae (400–700 nm) and PNS bacteria (700–950 nm) can alsohelp increase PE.
Case Study
Application of the principles discussed in this article to estimate the area re-quirements and preliminary capital cost for a 1-ton H2/day fiber optic–basedPBR facility is illustrated here. The analysis was based on solar data for asite close to Albuquerque, New Mexico. Profiles of daily temperature andmonthly solar irradiance at this site are presented in Figure 8. Figure 8ashows that ambient temperature is lower than the desired temperature of25◦C over 85% of the year; as such, considerable heating requirements haveto be considered for solar-based PBRs at this site (Bolton, 1991). Because thedifference between desired temperature and ambient temperature is less than20◦C, waste heat sources may be used at this site for sustainable tempera-ture control (Gadhamshetty, Khandan, Myint, & Ricketts, 2005). For example,thermal heat can be trapped either from incomplete solar photonic processor a deliberate solar thermal process to satisfy the heating requirements(Bolton, 1991). The daily solar radiation at this site ranges from 1,000 to1,400 MJ/m2/day (Figure 8b).
The approach proposed by Akkerman et al. (2002) was used to calculatesurface area requirements for sunlight collection. Cost of PBR was basedon future cost of optical fibers (=$0.05/m). Other operating costs (such asmixing, temperature controls, etc.) were assumed to be 10% of the capitalcost of optical fibers. The area requirement and the cost of production at
Downloaded By: [Khandan, Nirmala][New Mexico State University] At: 20:31 18 January 2011
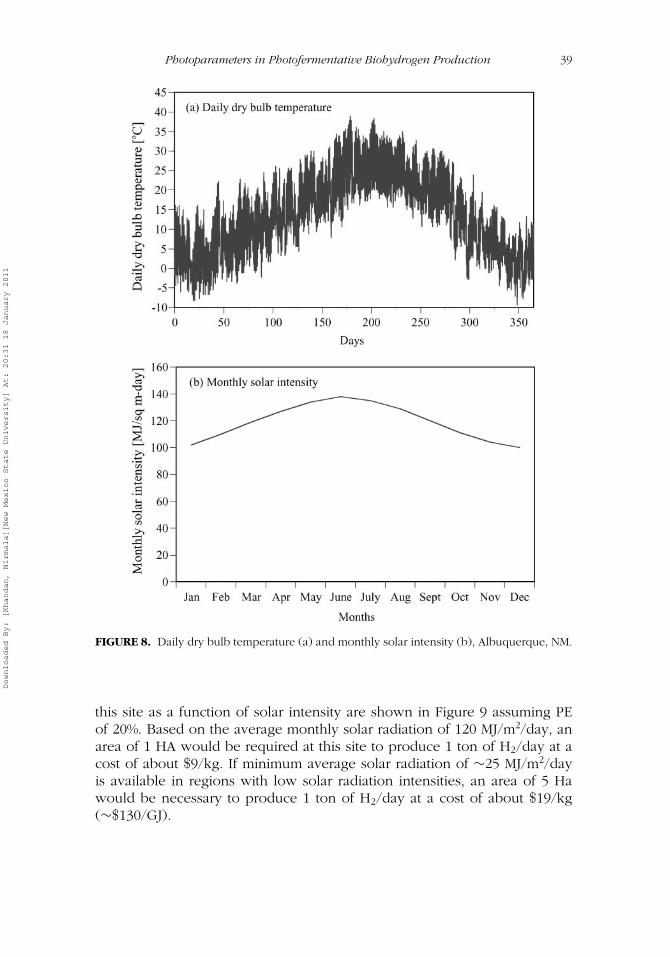
Photoparameters in Photofermentative Biohydrogen Production 39
FIGURE 8. Daily dry bulb temperature (a) and monthly solar intensity (b), Albuquerque, NM.
this site as a function of solar intensity are shown in Figure 9 assuming PEof 20%. Based on the average monthly solar radiation of 120 MJ/m2/day, anarea of 1 HA would be required at this site to produce 1 ton of H2/day at acost of about $9/kg. If minimum average solar radiation of ∼25 MJ/m2/dayis available in regions with low solar radiation intensities, an area of 5 Hawould be necessary to produce 1 ton of H2/day at a cost of about $19/kg(∼$130/GJ).
Downloaded By: [Khandan, Nirmala][New Mexico State University] At: 20:31 18 January 2011
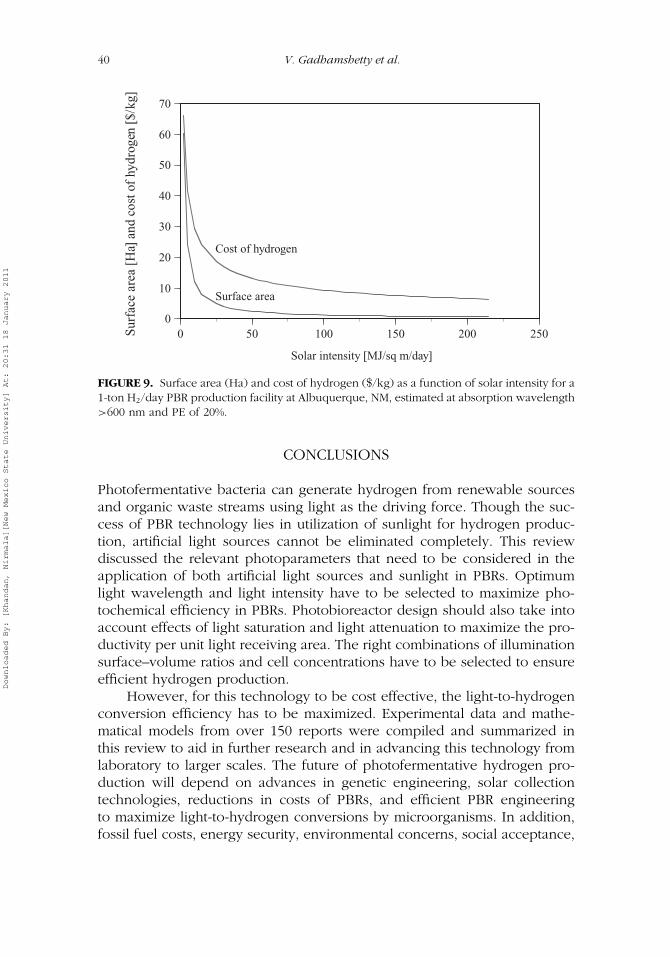
40 V. Gadhamshetty et al.
0
10
20
30
40
50
60
70
0 50 100 150 200 250
Solar intensity [MJ/sq m/day]
Cost of hydrogen
Surface area
Sur
face
are
a [H
a] a
nd c
ost o
fhy
drog
en [
$/kg
]
FIGURE 9. Surface area (Ha) and cost of hydrogen ($/kg) as a function of solar intensity for a1-ton H2/day PBR production facility at Albuquerque, NM, estimated at absorption wavelength>600 nm and PE of 20%.
CONCLUSIONS
Photofermentative bacteria can generate hydrogen from renewable sourcesand organic waste streams using light as the driving force. Though the suc-cess of PBR technology lies in utilization of sunlight for hydrogen produc-tion, artificial light sources cannot be eliminated completely. This reviewdiscussed the relevant photoparameters that need to be considered in theapplication of both artificial light sources and sunlight in PBRs. Optimumlight wavelength and light intensity have to be selected to maximize pho-tochemical efficiency in PBRs. Photobioreactor design should also take intoaccount effects of light saturation and light attenuation to maximize the pro-ductivity per unit light receiving area. The right combinations of illuminationsurface–volume ratios and cell concentrations have to be selected to ensureefficient hydrogen production.
However, for this technology to be cost effective, the light-to-hydrogenconversion efficiency has to be maximized. Experimental data and mathe-matical models from over 150 reports were compiled and summarized inthis review to aid in further research and in advancing this technology fromlaboratory to larger scales. The future of photofermentative hydrogen pro-duction will depend on advances in genetic engineering, solar collectiontechnologies, reductions in costs of PBRs, and efficient PBR engineeringto maximize light-to-hydrogen conversions by microorganisms. In addition,fossil fuel costs, energy security, environmental concerns, social acceptance,
Downloaded By: [Khandan, Nirmala][New Mexico State University] At: 20:31 18 January 2011
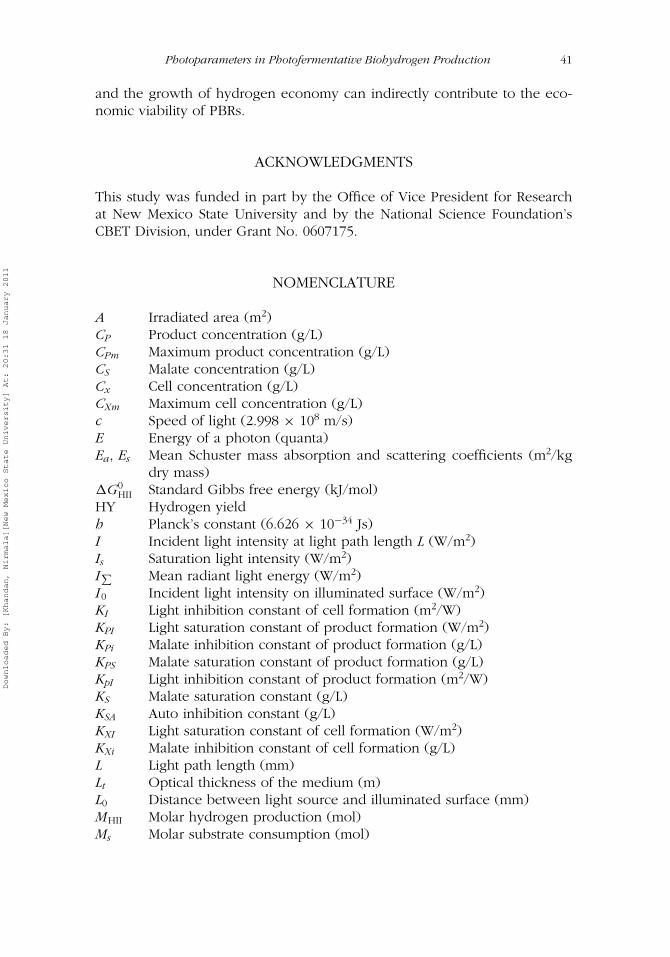
Photoparameters in Photofermentative Biohydrogen Production 41
and the growth of hydrogen economy can indirectly contribute to the eco-nomic viability of PBRs.
ACKNOWLEDGMENTS
This study was funded in part by the Office of Vice President for Researchat New Mexico State University and by the National Science Foundation’sCBET Division, under Grant No. 0607175.
NOMENCLATURE
A Irradiated area (m2)CP Product concentration (g/L)CPm Maximum product concentration (g/L)CS Malate concentration (g/L)Cx Cell concentration (g/L)CXm Maximum cell concentration (g/L)c Speed of light (2.998 × 10⁸ m/s)E Energy of a photon (quanta)Ea, Es Mean Schuster mass absorption and scattering coefficients (m2/kg
dry mass)�G0
HII Standard Gibbs free energy (kJ/mol)HY Hydrogen yieldh Planck’s constant (6.626 × 10⁻³⁴ Js)I Incident light intensity at light path length L (W/m2)Is Saturation light intensity (W/m2)I∑ Mean radiant light energy (W/m2)I0 Incident light intensity on illuminated surface (W/m2)KI Light inhibition constant of cell formation (m2/W)KPI Light saturation constant of product formation (W/m2)KPi Malate inhibition constant of product formation (g/L)KPS Malate saturation constant of product formation (g/L)KpI Light inhibition constant of product formation (m2/W)KS Malate saturation constant (g/L)KSA Auto inhibition constant (g/L)KXI Light saturation constant of cell formation (W/m2)KXi Malate inhibition constant of cell formation (g/L)L Light path length (mm)Lt Optical thickness of the medium (m)L0 Distance between light source and illuminated surface (mm)MHII Molar hydrogen production (mol)Ms Molar substrate consumption (mol)
Downloaded By: [Khandan, Nirmala][New Mexico State University] At: 20:31 18 January 2011

42 V. Gadhamshetty et al.
PE Photochemical efficiency (%)RHII Molar hydrogen production rate under standard conditions (mol/s)t Elapsed time (h)YPS Yield coefficient of products on malate (g/g)YPX Yield coefficient of product formation due to cell growth (g/g)YXS Yield coefficient of cells on malate (g/g)Z Dimensionless abscissa (z/L)Z Light attenuation distance (m)
Greek Letters
ε(c) Extinction coefficient at cell concentration, C (m2/g)ηs Effective fraction of utilizable light intensityλ Wavelength of the light (nm)µ Specific growth rate (1/h)µm Maximum specific growth rate (1/h)µPX Specific formation rate of the product (1/h)µSX Substrate consumption rate constant (1/h)
REFERENCES
Acien Fernandez, F.G., Garcıa Camacho, F., Sanchez Perez, J.A., Fernandez Sevilla,J.M., and Molina Grima, E. (1997). A model for light distribution and averagesolar irradiance inside outdoor tubular photobioreactors for the microalgal massculture. Biotechnology and Bioengineering, 55, 701–714.
Aiba, S. (1982). Growth kinetics of photosynthetic microorganisms. Advances inBiochemical Engineering, 23, 85–156.
Akkerman, I., Janssen, M., Rocha, J., and Wijffels, R.H. (2002). Photobiological hydro-gen production: Photochemical efficiency and bioreactor design. InternationalJournal of Hydrogen Energy, 27, 1195–1208.
Arik, T., Gunduz, U., Yucel, M., Turker, L., Sediroglu, V., and Eroglu, I. ( June, 1996).Photoproduction of hydrogen by Rhodobacter sphaeroides O.U.001. Paper pre-sented at the 11th World Hydrogen Energy Conference, Stuttgart, Germany, 3:2407–2416.
Armitage, J.P., and Hellingwerf, K.J. (2003). Light-induced behavioral responses(“phototaxis”) in prokaryotes. Photosynthesis Research, 76, 145–155.
Barbosa, M.J., Rocha, J.M.S., Tramper, J., and Wijffels, R.H. (2001). Acetate as acarbon source for hydrogen production by photosynthetic bacteria. Journal ofBiotechnology, 85, 25–33.
Basak, N., and Das, D. (2006). The prospect of purple non-sulfur (PNS) bacteria forhydrogen production: The present state of the art. World Journal of MicrobialBiotechnology, 23(1), 31–42.
Benemann, J.R. (1977). Hydrogen and methane production through microbial pho-tosynthesis. In R. Buvet (Ed.), Living systems as energy converters (pp. 285–298).Amsterdam, The Netherlands: Elsevier/North-Holland Biomedical Press.
Downloaded By: [Khandan, Nirmala][New Mexico State University] At: 20:31 18 January 2011
Photoparameters in Photofermentative Biohydrogen Production 43
Benemann, J.R. (1996). Hydrogen biotechnology: Progress and prospects. NatureBiotechnology, 14, 1101–1103.
Benemann, J.R. (1998). The technology of biohydrogen. In O. Zaborsky (Ed.), Bio-hydrogen (pp. 19–30). New York, NY: Plenum Press.
Benemann, J.R. (2000). Hydrogen production by microalgae. Journal of AppliedPhycology, 12, 291–300.
Benemann, J.R., Berenson, J.A., Kaplan, N.O., and Kamen, M.D. (1973). Hydrogenevolution by a chloroplast-ferredoxin-hydrogenase system. Proceedings of theNational Academy of Sciences USA, 70, 2317–2320.
Benemann, J.R., and Weare, N.M. (1974). Hydrogen evolution by nitrogen fixingAnabaena cylindrica cultures. Science, 184, 1917–1918.
Bolton, J.R., and Hall, D.O. (1991). The maximum efficiency of photosynthesis.Photochemistry and Photobiology, 53, 545–548.
Burlew, J.S. (1953). Current status of the large-scale culture of algae. In J.S. Burlew(Ed.), Algal culture from laboratory to pilot plant (Carnegie Institution of Wash-ington Publication No. 600, pp. 3–23). Washington, DC: Carnegie Institution.
Collins, M.L., and Remsen, C.C. (1991). The purple phototrophic bacteria. In J. F.Stolz (Ed.), Structure of phototrophic prokaryotes (pp. 49–77). Boca Raton, FL:CRC Press.
Cornet, J.F., and Albiol, J. (2000). Modeling photoheterotrophic growth kinet-ics of Rhodospirillum rubrum in rectangular photobioreactors. BiotechnologyProgress, 16, 199–207.
Cornet, J.F., Dussap, C.G., and Dubertret, G. (1992). A structured model for simula-tion of cultures of the cyanobacterium Spirulina platensis in photobioreactors,I. Coupling between light transfer and growth kinetics. Biotechnology and Bio-engineering, 40, 817–825.
Cornet, J.-F., Dussap, C.-G., and Gros, J.-B. (1994). Conversion of radiant light energyin photobioreactors. AIChE Journal, 40(6), 1055–1066.
Cornet, J.F., Dussap, C.G., and Gros, J.B. (1995). A simplified monodimensionalapproach for modeling coupling between radiant light transfer and growthkinetics in photobioreactors. Chemical Engineering Science, 50, 1489–1500.
Cornet, J.-F., Dussap, C.-G., and Gros, J.-B. (1998). Kinetics and energetics of photo-synthetic micro-organisms in photobioreactors: Application to Spirulina growth.Advances in Biochemical Engineering/Biotechnology, 59, 155–224.
Cornet, J.-F., Favier-Teodorescu, L., and Dussap, C.-G. (2003). Modelling stabilityof photoheterotrophic continuous cultures in photobioreactors. BiotechnologyProgress, 19, 1216–1227.
Cornet, J.-F., Marty, A., and Gros, J.-B. (1997). Revised technique for the determina-tion of mean incident light fluxes on photobioreactors. Biotechnology Progress,13, 408–415.
Damjanovic, A., Ritz, T., and Schulten, K. (1999). Excitation energy trapping by thereaction center of Rhodobacter sphaeroides. Theoretical Biophysics, 77, 139–151.
Das, D., and Veziroglu, T.N. (2001). Hydrogen production by biological processes:A survey of the literature. International Journal of Hydrogen Energy, 26, 13–28.
Degen, J., Uebele, A., Retze, A., Schmid Staiger, U., and Trosch, W. (2001). A novelairlift photobioreactor with baffles for improved light utilization through theflashing light effect. Journal of Biotechnology, 92(2), 89–94.
Downloaded By: [Khandan, Nirmala][New Mexico State University] At: 20:31 18 January 2011

44 V. Gadhamshetty et al.
Dickinson, J.R. (1999). Carbon metabolism. In J. R. Dickinson & M. Schweizer (Eds.),The metabolism and molecular physiology of Saccharomyces cerevisiae (pp.23–55). Philadelphia, PA: Taylor & Francis.
El-Kahlout, K., Yucel, M., Zabut, B., Turker, L., Gunduz, U., and Eroglu, I.(2002). Effect of bacteriorhodopsin on hydrogen gas production by Rhodobactersphaeroides O.U.001 in a photobioreactor. Unpublished master’s thesis, MiddleEast Technical University, Ankara, Turkey.
El-Shishtawy, R.M.A., Kawasaki, S., and Morimoto, M. (1997). Biological H2 pro-duction using a novel light-induced and diffused photoreactor. BiotechnologyTechniques, 11(6), 403–409.
El-Shishtawy, R.M.A., Kawasaki, S., and Morimoto, M. (1998). Cylindrical-type in-duced and diffused photobioreactors: A novel photoreactor for large-scale hy-drogen production. In O. R. Zaborsky (Ed.), Biohydrogen (pp. 353–358). Lon-don, UK: Plenum Press.
El-Shishtawy, R.M.A., Kitajima, Y., Otsuka, S., Kawasaki, S., and Morimoto, M. (1998).Study on the behavior of production and uptake of photobiohydrogen by pho-tosynthetic bacterium Rhodobacter sphaeroides RV. In O. R. Zaborsky (Ed.),Biohydrogen (pp. 117–122). London, UK: Plenum Press.
Eroglu, E., Eroglu, I., Gunduz, A., Yucel, M., and Turker, L. (2002). Biological hy-drogen production from olive mill waste water by Rhodobacter sphaeroidesO.U. 001. Paper presented at the International conference on EnvironmentalProblems of Mediterranean Region, Nicosa, North Cyprus.
Eroglu, I., Aslan, K., Gunduz, U., Yucel, M., and Turker, L. (1998). Contin-uous hydrogen production by Rhodobacter sphaeroides OU 001. In O.R. Zaborsky (Ed.), Biohydrogen (pp. 143–149). New York, NY: PlenumPress.
Eroglu, I., Aslan, K., Gunduz, U., Yucel, M., and Turker, L. (1999). Substrate con-sumption rates for hydrogen production by Rhodobacter sphaeroides in a col-umn photobioreactor. Journal of Biotechnology, 70, 103–113.
Eroglu, I., Tabanoglu, A., Gunduz, U., Eroglu, E., and Yucel, M. (2008). Hydrogenproduction by Rhodobacter sphaeroides O.U.001 in a flat plate solar bioreactor.International Journal of Hydrogen Energy, 33(2), 531–541.
Evenari, M., Mayer, A.M., and Gottesman, E. (1953). Experiments on culture ofalgae in Israel. In J. S. Burlew (Ed.), Algal culture from laboratory to pilotplant (Carnegie Institution of Washington Publication No. 600, pp. 197–203).Washington, DC: Carnegie Institution.
Fascetti, E., and Todini, O. (1995). Rhodobacter sphaeroides RV cultivation and hy-drogen production in a one- and two-stage chemostat. Applied Microbiologyand Biotechnology, 44, 300–305.
Gadhamshetty, V., Khandan, N.N., Myint, M., and Ricketts, C. (2005). Improving air-cooled condenser performance in combined cycle power plants, ASCE. Journalof Energy Engineering, 132(2), 81–88.
Gadhamshetty, V., Sukumaran, A., Nirmalakhandan, N., and Myint, M. (2008).Photofermentation of malate for biohydrogen production—A modeling ap-proach. International Journal of Hydrogen Energy, 33(9), 2138–2146.
Gaffron, H., and Rubin, J. (1942). Fermentative and photochemical production ofhydrogen in algae. Journal of General Physiology, 26, 219–240.
Downloaded By: [Khandan, Nirmala][New Mexico State University] At: 20:31 18 January 2011

Photoparameters in Photofermentative Biohydrogen Production 45
Gest, H., and Kamen, M.D. (1949). Photoproduction of molecular hydrogen byRhodospirillum rubrum. Science, 109, 558–559.
Gobel, F. (1978). Quantum efficiencies of growth. In R. K. Clayton & W. R. Sistrom(Eds.), Photosynthetic bacteria (pp. 907–925). New York, NY: Plenum Press.
Goldman, J.C. (1979). Outdoor algal mass cultures—II. Photosynthetic yield limita-tions. Water Resources, 11, 119–136.
Gordon, J.M. (2002). Tailoring optical systems to optimized photobioreactors. Inter-national Journal of Hydrogen Energy, 27, 1175–1184.
Greenbaum, E. (1998). Energetic efficiency of hydrogen photoevolution by algalwater splitting. Journal of Biophysics, 54, 365–368.
Grima, E.M., Acien Fernandez, F.G., Camacho, F.G., and Chist, Y. (1999). Photo-bioreactors: Light regime, mass transfer, and scale up. Journal of Biotechnology,1–3, 231–247.
Hillmer, P., and Gest, H. (1977). Hydrogen metabolism in the photosynthetic bac-terium Rhodopseudomonas capsulata: Hydrogen production by growing cul-tures. Journal of Bacteriology, 129, 724–731.
Hirayama, O., Uya, K., Yamada, H., and Moriwaki, K. (1986). Photoproduction ofhydrogen by immobilized cells of a photosynthetic bacterium, Rhodospirillumrubrum G-9 BM. Agricultural & Biological Chemistry, 50, 891–897.
Hoekema, S., Bijmans, M., Janssen, M., Tramper, J., and Wijffels, R.H. (2002). A pneu-matically agitated flat-panel photobioreactor with gas re-circulation: Anaerobicphotoheterotrophic cultivation of a purple non-sulfur bacterium. InternationalJournal of Hydrogen Energy, 27, 1331–1338.
Hu, X., and Schulten, K. (1997). How nature harvests sunlight. Physics Today, 50,28–34.
Hungate, R.E. (1974). Potentials and limitations of microbial methanogenesis. ASMNews, 40, 833–838.
Ike, A., Toda, N., Hirata, K., and Miyamoto, K. (1997). Hydrogen photoproductionfrom CO2-fixing microalgal biomass: Application of lactic acid fermentationby Lactobacillus amylovorus. Journal of Fermentation Bioengineering, 84(5),428–461.
Janssen, M. (2002). Cultivation of microalgae: Effect of light/dark cycles on biomassyield. Unpublished Master’s thesis, Wageningen University, Wageningen, TheNetherlands.
Kapdan, I.K., and Kargi, F. (2006). Bio-hydrogen production from waste materials.Enzyme and Microbial Technology, 38, 569–582.
Katsuda, T., Fuji, N., Takata, N., Ooshima, H., and Katoh, S. (2002). Light attenuationin suspension of the purple bacterium Rhodobacter capsulatus and the greenalga Chlamydomonas reinhardtii. Journal of Chemical Engineering of Japan,35, 428–435.
Khatipov, E., Miyake, M., Miyake, J., and Asada, Y. (1998). Polyhydroxybutyrateaccumulation and hydrogen evolution by Rhodobacter sphaeroides as a functionof nitrogen availability. In O. R. Zaborsky (Ed.), Biohydrogen (pp. 157–161).London, UK: Plenum Press.
Kim, J.S., Ito, K., and Takahashi, H. (1980). The relationship between nitrogenaseactivity and hydrogen evolution in Rhodopseudomonas palustris. Agricultural& Biological Chemistry, 44, 827–833.
Downloaded By: [Khandan, Nirmala][New Mexico State University] At: 20:31 18 January 2011
46 V. Gadhamshetty et al.
Kim, J.S., Ito, K., and Takahashi, H. (1981). Production of molecular hydrogen byRhodopseudomonas sp. Journal of Fermentation Technolology, 59, 185–190.
Kim, M.S., Ahn, J.H., and Yoon, Y.S. (2004). Photo-biological hydrogen productionby the uptake hydrogenase and PHB synthase deficient mutant of Rhodobactersphaeroides. In J. Miyake, Y. Igarashi, & M. Rogner (Eds.), Biohydrogen III (pp.45–55). London, UK: Elsevier.
Ko, I.B., and Noike, T. (2002). Use of blue optical filters for suppression of growth inalgae in hydrogen producing non-axenic cultures of Rhodobacter sphaeroidesRV. International Journal of Hydrogen Energy, 27, 1297–1302.
Kojima, E., and Lin, B. (2004). Effect of partial shading on photoproduction ofhydrogen by Chlorella. Journal of Bioscience and Bioengineering, 97(5), 317–321.
Kok, B. (1953). Experiments on photosynthesis by Chlorella in flashing light. In J. S.Burlew (Ed.), Algal culture from laboratory to pilot plant (Carnegie Institutionof Washington Publication No. 600, pp. 63–75). Washington, DC: CarnegieInstitution.
Koku, H., Eroglu, I., Gunduz, U., Yucel, M., and Turker, L. (2002). Aspects of themetabolism of hydrogen production by Rhodobacter sphaeroides. InternationalJournal of Hydrogen Energy, 27, 1315–1329.
Koku, H., Eroglu, I., Gunduz, U., Yucel, M., and Turker, L. (2003). Kinetics ofbiological hydrogen production by the photosynthetic bacterium Rhodobactersphaeroides O.U. 001. International Journal of Hydrogen Energy, 28, 381–388.
Kommareddy, A., and Anderson, G. ( July, 2003). Study of light as a parameter in thegrowth of algae in photo-bio reactor. Paper presented at the Agricultural Societyof Agricultural Engineers, Las Vegas, NV.
Kondo, T., Arakawa, M., Wakayama, T., and Miyake, J. (2002). Hydrogen productionby combining two types of photosynthetic bacteria with different characteristics.International Journal of Hydrogen Energy, 27, 1303–1308.
Kondo, T., Wakayama, T., and Miyake, J. (2006). Efficient hydrogen productionusing a multi-layered photobioreactor and a photosynthetic bacterium mutantwith reduced pigment. International Journal of Hydrogen Energy, 31(11), 1522–1526.
Ku, S.B., and Edwards, G.E. (1982). Quantum requirement of photosynthetic bacteriaand plants. In O. Zaborsky (Ed.), CRC handbook of biosolar resources: Vol. 1.Part I fundamental principles (pp. 37–54). Cleveland, OH: CRC Press.
Kumazawa, S., and Mitsui, A. (1994). Efficient hydrogen photoproduction by syn-chronously grown cells of a marine cyanobacterium, Synechococcus sp. MiamiBG 043511, under high cell density conditions. Biotechnology and Bioengineer-ing, 44, 854–858.
Larkum, A. (1997). Nature’s light—Harvesting kaleidoscope. Retrieved fromhttp://www.physics.usyd.edu.au/light/ch6.html
Logan, B.E., Oh, S.E., Kim, I.S., and Van Ginkel, S. (2002). Biological hydrogenproduction measured in batch anaerobic respirometers. Environmental ScienceTechnology, 36(11), 2530–2535.
Luedeking, R., and Piret, E.L. (1959). A kinetic study of the lactic acid fermenta-tion. Journal of Biochemical and Microbiological Technology Engineering, 1,393–412.
Downloaded By: [Khandan, Nirmala][New Mexico State University] At: 20:31 18 January 2011
Photoparameters in Photofermentative Biohydrogen Production 47
Luo, H.P., and Al-Dahhan, H. (2004). Analyzing and modeling of photobioreactorsby combining first principles of physiology and hydrodynamics. Biotechnologyand Bioengineering, 85(4), 382–393.
MacKay, J., and Walker, A. (2003). Photosynthesis. Retrieved from http://science.pvec.ednet.ns.ca/ibbiology12/Photosynthesis%20Notes.pdf
Macler, B.A., Pelroy, R.A., and Bassham, J.A. (1979). Hydrogen formation in nearlystoichiometric amounts from glucose by a Rhodopseudomonas sphaeroides mu-tant. Journal of Bacteriology, 138, 446–452.
Markov, S.A., Bazin, M.J., and Hall, D.O. (1995). Hydrogen photoproduction andcarbon dioxide uptake by immobilized Anabaena variabilis in a hollow-fiberphotobioreactor. Enzyme and Microbial Technology, 17, 306–310.
Matsumoto, M., Yoza, B., Radway, J.C., and Zaborsky, O.R. (1998). Photosyntheticbacteria of Hawaii: Potential for hydrogen production. In O. R. Zaborsky (Ed.),Biohydrogen (pp. 163–166). London, UK: Plenum Press.
Matsunaga, T., Hatano, T., Yamada, A., and Matsumoto, M. (2000). Microaerobichydrogen production by photosynthetic bacteria in a double-phase bioreactor.Biotechnology and Bioengineering, 68(6), 647–651.
Melis, A. (1999). Photosystem-II damage and repair cycle in chloroplasts: Whatmodulates the rate of photodamage in vivo? Trends in Plant Science, 4, 130–135.
Melis, A., Neidhardt, J., and Benemann, J.R. (1999). Dunaliella salina (Chlorophyta)with small chlorophyll antenna sizes exhibit higher photosynthetic productiv-ities and photon use efficiencies than normally pigmented cells. Journal ofApplied Phycology, 10, 515–525.
Meyer, J., Kelley, B.C., and Vignais, P.M. (1978). Effect of light nitrogenase functionand synthesis in Rhodopseudomonas capsulata. Journal of Bacteriology, 136,201–208.
Miron, A.S., Camacho, G.F., Gomez, C.A., Molina Grima, E., and Chisti, Y. (2000).Bubble column and airlift photobioreactors for algal culture. AIChE Journal, 46,1872–1887.
Mitsugi, C., Haram, A., and Kenzo, F. (1998). WE-NET: Japanese Hydrogen Program.International Journal of Hydrogen Energy, 23, 159–165.
Miyake, J. (1998). The science of biohydrogen. In O. Zaborsky (Ed.), Biohydrogen(pp. 7–18). New York, NY: Plenum Press.
Miyake, J., and Kawamura, S. (1987). Efficiency of light energy conversion to hy-drogen by the photosynthetic bacteria Rhodobacter sphaeroides. InternationalJournal of Hydrogen Energy, 12, 147–149.
Miyake, J., Mao, X.Y., and Kawamura, S. (1984). Photoproduction of hydrogen fromglucose by a co-culture of a photosynthetic bacterium and Clostridium bu-tyricum. Journal of Fermentation Technology, 62, 531–535.
Miyake, J., Masato, M., and Yasuo, A. (1999). Biotechnological hydrogen production:Research for efficient light energy conversion. Biotechnology, 70, 89–101.
Miyake, J., Tomizuka, N., and Kamibayashi, A. (1982). Prolonged photohydrogenproduction by Rhodospirillum rubrum. Journal of Fermentation Technology,60(3), 199–203.
Miyake, M., Sekine, M., Vasilieva, L.G., Nakada, E., Wakayama, T., Asada, Y.,and Miyake, J. (1998). Improvement of bacterial light-dependent hydrogen
Downloaded By: [Khandan, Nirmala][New Mexico State University] At: 20:31 18 January 2011
48 V. Gadhamshetty et al.
production by altering the photosynthetic pigment ration. In O. Zaborsky (Ed.),Biohydrogen (pp. 81–86). New York, NY: Plenum Press.
Miyamoto, K., Benemann, J.R., and Hallenbeck, P.C. (1979). Solar energy conversionby nitrogen limited cultures of Anabaena cylindrical. Journal of FermentationTechnology, 57, 287–293.
Mori, K. (1985). Photoautotrophic bioreactor using visible solar rays condensed byFresnel lenses and transmitted through optical fibers. Biotechnology & Bioengi-neering Symposium, 15, 331–345.
Myers, J. (1955). Algae as an energy converter. In Proceedings of the World Sympo-sium on Applied Solar Energy (pp. 227–230). Menlo Park, CA: Stanford ResearchInstitute.
Nakada, E., Asada, Y., Arai, T., and Miyake, J. (1995). Light penetration into cellsuspensions of photosynthetic bacteria and relation to hydrogen production.Journal of Fermentation Bioengineering, 80, 53–57.
Nakada, E., Nishikata, S., Asada, Y., and Miyake, J. (1996). Hydrogen production bygel immobilized of Rhodobacter sphaeroides of cells pigments and hydrogenevolution. Journal of Marine Biotechnology, 4, 38–42.
Nakada, E., Nishikata, S., Asada, Y., and Miyake, J. (1998). Light penetration andwavelength effect on photosynthetic bacteria culture for hydrogen production.In O. Zaborsky (Ed.), Biohydrogen (pp. 345–398). New York, NY: PlenumPublishing.
Nakada, E., Nishikada, S., Asada, Y., and Miyake, J. (1999). Photosynthetic bac-terial hydrogen production combined with fuel cell. International Journal ofHydrogen Energy, 24, 1053–1057.
Nath, K., Kumar, A., and Das, D. (2005). Hydrogen production by Rhodobactersphaeroides strain O.U.001 using spent media of Enterobacter cloacae strainDM11. Applied Microbiology and Biotechnology, 66, 533–541.
Nogi, Y., Akiba, T., and Horikoshi, K. (1985). Wavelength dependence of photopro-duction of hydrogen by Rhodopseudomonas rutila. Agricultural & BiologicalChemistry, 49, 35–38.
Ogbonna, J.C., Soejima, T., and Tanaka, H. (1999). An integrated solar and artificiallight system for internal illumination of photobioreactors. Journal of Biotechnol-ogy, 70, 189–297.
O’Neill, M., McDanal, A.J., Cotal, H.L., Sudharsanan, R., Krut, D.D., Ermer, J. H.,Karam, N. H., and Lillington, D. R. (September, 2002). Development of terres-trial concentrator modules using high-efficiency multi-junction solar cells. Paperpresented at the 29th IEEE-PVSC, Anchorage, AK, USA.
O’Neill, M.J. (2000). U.S. Patent No. 6,031,179. Washington, DC: U.S. Patent andTrademark Office.
O’Neil, M.J., and McDanal, A.J. (2001). The development of a new high-efficiency concentrator module using multi-junction cells. Paper presented atthe 2001 NCPV Program Review Meeting. Retrieved from http://www.nrel.gov/pv/highperformancepv/pdfs/papers/10.pdf-92.9KB-NREL. U.S. DOE Lake-wood, Colorado, USA.
Ooshima, H., Takakuwa, S., Katsuda, T., Okuda, M., Shirasawa, T., Azuma, M.,and Kato, J. (1998). Production of hydrogen by a hydrogenase deficient mu-tant of Rhodobacter capsulatus. Journal of Fermentation Bioengineering, 85(5),470–474.
Downloaded By: [Khandan, Nirmala][New Mexico State University] At: 20:31 18 January 2011

Photoparameters in Photofermentative Biohydrogen Production 49
Otsuki, T., Uchiyama, S., Fujiki, K., and Fukunaga, S. (1998). Hydrogen production bya floating-type photobioreactor. In O. R. Zaborsky, J. R. Benemann, J. Miyake,& A. S. Pietro (Eds.), BioHydrogen (pp. 369–374). New York, NY: PlenumPublishing.
Polle, J.E.W., Niyogi, K.K., and Melis, A. (2001). Absence of lutein, violaxanthin andneoxanthin affects the functional chlorophyll antenna size of photosystem-IIbut not that of photosystem-I in the green alga Chlamydomonas reinhardtii.Plant and Cell Physiology, 42, 482–491.
Pottier, L., Pruvost, J., Deremetz, J., Cornet, J.-F., Legrand, J., and Dussap, C.G. (2005).A fully predictive model for one-dimensional light attenuation by Chlamy-domonas reinhardtii in a torus photobioreactor. Biotechnology and Bioengi-neering, 91, 569–582.
Rocha, J.S., Barbosa, M.J., and Wijffels, R.H. (2001). Hydrogen production by photo-synthetic bacteria: Culture media, yields and efficiencies. In J. Miyake, T. Mat-sunaga, & A. S. Pietro (Eds.), Biohydrogen II, an approach to environmentallyacceptable technology (pp. 3–25). Oxford, UK: Pergamon/Elsevier.
Sackett, M.J., Armitage, J.P., Sherwood, E.E., and Pitta, P.P. (1997). Photoresponsesof the purple nonsulfur bacteria Rhodospirillum centenum and Rhodobactersphaeroides. Journal of Bacteriology, 179, 6764–6768.
Sakurai, H., and Masukawa, H. (2007). Promoting R&D in photobiological hydrogenproduction utilizing mariculture-raised cyanobacteria. Marine Biotechnology, 9,128–145.
Sasaki, K. (1998). Hydrogen and 5-aminolevulinic acid production by photosyntheticbacteria. In O. R. Zaborsky (Ed.), Biohydrogen (pp. 133–142). New York, NY:Plenum Press.
Sasikala, K., Ramana, Ch.V., and Rao, P.R. (1991a). Environmental regulation foroptimal biomass yields and photo production of hydrogen by Rhodobactersphaeroides O.U.001. International Journal of Hydrogen Energy, 16, 597–601.
Sasikala, K., Ramana, Ch.V., and Rao, P.R. (1991b). Photoproduction of hydrogenfrom waste water of lactic acid fermentation plant by a purple non-sulfur pho-tosynthetic bacterium, Rhodobacter sphaeroides O.U.001. Indian Journal of Ex-perimental Biology, 29, 74–75.
Sasikala, K., Ramana, C.H.V., Rao, P.R., and Kovaks, K.L. (1993). Anoxygenic pho-totrophic bacteria: Physiology and advances in hydrogen production technol-ogy. Advances in Applied Microbiology, 38, 211–295.
Spring, J., and Deaton, E. (2003). Photosynthesis. Retrieved from http://www.ucs.louisiana.edu/∼jhs0431/102/2-25/2-25.PDF
Suh, I.S., and Lee, S.B. (2003). A light distribution model for an internally radiatingphotobioreactor. Biotechnology and Bioengineering, 82, 180–189.
Tabanoglu, A. (2002). Hydrogen production by Rhodobacter sphaeroides in a so-lar bioreactor. Unpublished master’s thesis, Middle East Technical University,Ankara, Turkey.
Tamiya, H. (1957). Mass culture of algae. Annual Review of Plant Physiology, 8,309–334.
Terry, K.L., and Raymond, L.P. (1985). System design for the autotrophic productionof microalgae. Enzyme and Microbial Technology, 7, 474–487.
Tredici, M.R., and Zitelli, G.Ch. (1998). Efficiency of sunlight utilization: Tubularversus flat photobioreactors. Biotechnology and Bioengineering, 57, 187–197.
Downloaded By: [Khandan, Nirmala][New Mexico State University] At: 20:31 18 January 2011
50 V. Gadhamshetty et al.
Tsygankov, A.A., Fedorov, A.S., Laurinavichene, T.V., Gogotov, I.N., Rao, K.K., andHall, D.O. (1998). Actual and potential rates of hydrogen photoproduction bycontinuous culture of the purple nonsulphur bacterium Rhodobac. Applied Mi-crobiology and Biotechnology, 49, 102–107.
Tsygankov, A.A., Hirata, Y., Miyake, M., Asada, Y., and Miyake, J. (1994). Photo-bioreactor with photosynthetic bacteria immobilized on porous glass for hydro-gen photoproduction. Journal of Fermentation and Bioengineering, 77, 575–578.
Tsygankov, A.A., Laurinavichene, T.V., and Gogotov, I.N. (1994). Laboratory scalephotobioreactor. Biotechnology Techniques, 8, 575–578.
Turkarslan, S., Yigit, D.O., Aslan, K., Eroglu, I., and Gunduz, U. (1998). Photobio-logical hydrogen production by Rhodobacter sphaeroides O.U.001 by utilizationof waste water from milk industry. In O. Zaborsky (Ed.), Biohydrogen (pp.151–156). New York, NY: Plenum Press.
Uyar, B., Eroglu, I., Gunduz, U., and Turker, L. (2007). Effect of light intensity, wave-length and illumination protocol on hydrogen production in photobioreactors.International Journal of Hydrogen Energy, 32, 4670–4677.
Vasilyeva, L., Miyake, M., Khatipov, E., Wakayama, T., Sekine, M., Hara, M., andMiyake, J. (1999). Enhanced hydrogen production by a mutant of Rhodobactersphaeroides having an altered light-harvesting system. Journal of Bioscience andBioengineering, 87, 619–624.
Vignais, P.M., Billoud, B., and Meyer, J. (2001). Classification and phylogeny ofhydrogenases. FEMS Microbiology Reviews, 25, 455–501.
Vijayaraghavan, K., Mohd, S., and Mohd, A. (2006). Trends in bio-hydrogengeneration—A review. Environmental Sciences, 3(4), 255–271.
Wakayama, T., and Miyake, J. (2001). Hydrogen from biomass. In J. Miyake, T. Mat-sunaga, & A. S. Pietro (Eds.), Biohydrogen II, An approach to environmentallyacceptable technology (pp. 41–51). Oxford, UK: Pergamon/Elsevier.
Wakayama, T., and Miyake, J. (2002). Light shade bands for the improvement of solarhydrogen production efficiency by Rhodobacter sphaeroides RV. InternationalJournal of Hydrogen Energy, 27, 1495–1500.
Wakayama, T., Nakada, E., Adada, Y., and Miyake, J. (2000). Effect of light/dark cy-cles on bacterial hydrogen production by Rhodobacter sphaeroides RV. AppliedBiochemistry and Biotechnology, 84–86, 431–440.
Wakayama, T., Toriyama, A., Kawasugi, T., Arai, T., Asada, Y., and Miyake, J.(1998). Photohydrogen production using photosynthetic bacterium Rhodobac-ter sphaeroides RV: Simulation of the light cycle of natural sunlight using anartificial source. In O. Zaborsky (Ed.), Biohydrogen (pp. 375–455). New York,NY: Plenum Press.
Wang, X., Xu, P., Yuan, Y., Liu, C., Zhang, D., Yang, Z., and Ma, C. (2006). Modelingfor Gellan gum production by Sphingomomas paucimobilis ATCC 31461 in asimplified medium. Applied Environmental Microbiology, 72(5), 3367–3374.
Warthmann, R., Pfennig, N., and Cypionka, H. (1993). The quantum requirement forH2 production by anoxygenic phototrophic bacteria. Applied Microbiology andBiotechnology, 39, 358–362.
Yamada, A., Hatano, T., and Matsunaga, T. (1998). Conversion efficiencies of lightenergy to hydrogen by a novel Rhodovulum sp. and its uptake-hydrogenase
Downloaded By: [Khandan, Nirmala][New Mexico State University] At: 20:31 18 January 2011

Photoparameters in Photofermentative Biohydrogen Production 51
mutant. In O. Zaborsky (Ed.), Biohydrogen (pp. 167–237). New York, NY:Plenum Press.
Yigit, M., Gunduz, U., Eroglu, E., Yucel, M., and Turker, L. (2000). Photoproductionof hydrogen from sugar refinery waste water by Rhodobacter sphaeroides O.U.001. International Journal of Hydrogen Energy, 25, 1035–1041.
Yokota, T., Yashima, K., Takigawa, T., and Takahashi, K. (1991). A new randomwalk model for assessment of light energy absorption by photosynthetic mi-croorganisms. Journal of Chemical Engineering of Japan, 24, 558–562.
Zabut, B., El-Kahlout, K., Yucel, M., Gunduz, U., Turker, L., and Eroglu, I.( June, 2005). Hydrogen gas production by coupled systems of Rhodobactersphaeroides O.U.001 and Halobacterium salinarum in a photobioreactor. Pa-per presented at the International Hydrogen Energy Congress and Exhibition,Istanbul, Turkey.
Zhang, X.W., Zhang, Y.M., and Chen, F. (1998). Kinetic models for phycocyaninproduction by high cell density mixotrophic culture of the microalgae Spirulinaplatensis. Journal of Industrial Microbiology & Biotechnology, 21(6), 283–288.
Zhu, H., Wakayama, T., Asada, Y., and Miyake, J. (2001). Hydrogen productionby four cultures with participation by anoxygenic phototrophic bacterium andanaerobic bacterium in the presence of NH4+. International Journal of Hydro-gen Energy, 26, 1149–1154.
Zonneved, C. (1998). Photoinhibition as affected by photoacclimation of phytoplank-ton: A model approach. Journal of Theoretical Biology, 193, 115–123.
Downloaded By: [Khandan, Nirmala][New Mexico State University] At: 20:31 18 January 2011