Biogeochemical cycle of nitrogen in a tropical mangrove ecosystem, east coast of India
11
Biogeochemical cycle of nitrogen in a tropical mangrove ecosystem, east coast of India Raghab Ray, Natasha Majumder, Subhajit Das, Chumki Chowdhury, Tapan Kumar Jana ⁎ Department of Marine Science, University of Calcutta, 35, B.C. Road, Kolkata 700019 India abstract article info Article history: Received 23 September 2013 Received in revised form 28 March 2014 Accepted 11 April 2014 Available online xxxx Keywords: Box model Nitrogen Biomass Mangrove Sundarban Like many coastal systems, nitrogen is the critical limiting factor for mangrove net production. This study used a box model approach to assess the nitrogen budget in the Sundarban mangrove ecosystem, which acts as a sink for atmospheric nitrogen in terms of NO x , NH 3 ,N 2 , and water column dissolved inorganic nitrogen. The coupling of biosphere and atmosphere in terms of atmospheric NO x and NH 3 uptake showed that up- take of ammonia (130 × 10 6 mol yr −1 ) was about six fold as large as that of NO x, (22 × 10 6 mol yr −1 ). The nitrogen stored by the processes such as plant uptake of NO x , NH 3 from the atmosphere, nitrogen fixation (5 × 10 9 mol yr −1 ), and sediment water exchange (8 × 10 6 mol yr −1 ) was about two times as large as that of recycled nitrogen from litter (3 × 10 9 mol yr −1 ), and could account 74% of the nitrogen re- quired for mangrove net production. Most of the nitrogen was conserved in the living biomass (living bio- mass: 118 × 10 3 mol ha −1 versus soil: 3 × 10 3 mol ha −1 ). The loss of nitrogen was 23% of the total amount that was conserved from the external sources in the Sundarban mangrove system. Thus, the coastal ecosys- tem like Sundarban mangroves could retain only 0.2% (8 × 10 6 mol) of the annual river flux of nitrogen to the coastal waters and nitrogen is generally conserved within the system. © 2014 Elsevier B.V. All rights reserved. 1. Introduction Mangroves dominate the majority of the world's tropical and subtropical coastline, forming 15 million ha of forest worldwide and accounting for 0.7% of the tropical forest area (Giri et al. 2011) that provide habitat for rich biodiversity (FAO, 2004). They act as nurseries for commercially important aquatic organisms that contribute to coastal, estuarine and deep-sea fisheries that serve important economic and ecological functions (Ronnback, 1999; Mumby et al. 2004), as habitat for resident and migratory birds, and as sink for atmo- spheric carbon dioxide and riverine nutrient. Mangroves trap sedi- ment resulting in land accretion (Pernetta, 1993), which protects coasts from physical damage of the shoreline due to tidal waves, erosion, hurricanes, and tsunamis (Mitch and Gosselink, 1993). Mangrove biogeochemistry focuses on the large, slow moving chem- ical reservoirs and their smaller but more active exchange or cycling either driven by biological activity in the mangrove reservoirs. These cycles of elements falls into two groups: 1) atmospheric gasses con- taining C, N, O, and S and 2) sediment derived elements such as P and Fe. Deforestation of more than half of the world's original mangrove habitats (Kelleher et al. 1995; Spalding et al. 1997) occurred with about 70% of that loss in the last 20 years (Valiela et al. 2001). Their destruction by human perturbations such as over-harvesting for timber and fuel-wood (Hussein, 1995), clearing for aquaculture and agriculture (Terchunian et al. 1986; Primavera, 1997), sewage release and pollution, damming of rivers to alter salinity levels in the mangrove water (Wolanski, 1992), etc. makes them vulnerable for changes of the biogeochemical processes and the composition of the large reservoirs (the biosphere, the hydrosphere, the atmo- sphere, and the geosphere) particularly with respect to nitrogen (Thorsten and José, 2001). The primary production in some coastal systems is nitrogen limited (Howarth, 1988; Howarth and Marino, 2006) and microbial rather than chemical processes govern the mangrove nitrogen cycle (Alongi et al. 1992). The Indian Sundarban mangrove is the largest delta on the globe (world ' s heritage site, www.unesco.org/en/list/452) and covers about 2.8% of the global mangrove area (15 × 10 4 km 2 ). The change of atmospheric composition could depend on the feedback from the biogeochemical processes. Biosphere–atmosphere coupling in the Sundarban mangrove ecosystem occurs through 1) the biophysical path- way in terms of partitioning incoming radiation (Ganguly et al. 2008), 2) and the biogeochemical pathway of carbon in association with the ex- change of atmospheric CO 2 (Biswas et al. 2004) and CH 4 (Biswas et al. 2007; Dutta et al. 2013). In general, mangroves are highly productive, fixing (15–46 × 10 12 mol yr −1 ) and storing (3 × 10 14 mol) large amount of carbon (Twilley et al. 1986; Gattuso et al. 1998; Alongi, 2009), and in Marine Chemistry xxx (2014) xxx–xxx ⁎ Corresponding author. Tel.:+91 9433859588; fax: +91 3324614849. E-mail address: [email protected] (T.K. Jana). MARCHE-03102; No of Pages 11 http://dx.doi.org/10.1016/j.marchem.2014.04.007 0304-4203/© 2014 Elsevier B.V. All rights reserved. Contents lists available at ScienceDirect Marine Chemistry journal homepage: www.elsevier.com/locate/marchem Please cite this article as: Ray, R., et al., Biogeochemical cycle of nitrogen in a tropical mangrove ecosystem, east coast of India, Mar. Chem. (2014), http://dx.doi.org/10.1016/j.marchem.2014.04.007
Transcript of Biogeochemical cycle of nitrogen in a tropical mangrove ecosystem, east coast of India
Marine Chemistry xxx (2014) xxx–xxx
MARCHE-03102; No of Pages 11
Contents lists available at ScienceDirect
Marine Chemistry
j ourna l homepage: www.e lsev ie r .com/ locate /marchem
Biogeochemical cycle of nitrogen in a tropical mangrove ecosystem,east coast of India
Raghab Ray, Natasha Majumder, Subhajit Das, Chumki Chowdhury, Tapan Kumar Jana ⁎Department of Marine Science, University of Calcutta, 35, B.C. Road, Kolkata 700019 India
⁎ Corresponding author. Tel.:+91 9433859588; fax: +E-mail address: [email protected] (T.K. Jana).
http://dx.doi.org/10.1016/j.marchem.2014.04.0070304-4203/© 2014 Elsevier B.V. All rights reserved.
Please cite this article as: Ray, R., et al., Biogeohttp://dx.doi.org/10.1016/j.marchem.2014.0
a b s t r a c t
a r t i c l e i n f oArticle history:Received 23 September 2013Received in revised form 28 March 2014Accepted 11 April 2014Available online xxxx
Keywords:Box modelNitrogenBiomassMangroveSundarban
Like many coastal systems, nitrogen is the critical limiting factor for mangrove net production. This studyused a box model approach to assess the nitrogen budget in the Sundarban mangrove ecosystem, whichacts as a sink for atmospheric nitrogen in terms of NOx, NH3, N2, and water column dissolved inorganic nitrogen.The coupling of biosphere and atmosphere in terms of atmospheric NOx and NH3 uptake showed that up-take of ammonia (130 × 106 mol yr−1) was about six fold as large as that of NOx, (22 × 106 mol yr−1).The nitrogen stored by the processes such as plant uptake of NOx, NH3 from the atmosphere, nitrogenfixation (5 × 10⁹ mol yr−1), and sediment water exchange (8 × 10⁶ mol yr−1) was about two times aslarge as that of recycled nitrogen from litter (3 × 10⁹ mol yr−1), and could account 74% of the nitrogen re-quired for mangrove net production. Most of the nitrogen was conserved in the living biomass (living bio-mass: 118 × 103 mol ha−1 versus soil: 3 × 10³ mol ha−1). The loss of nitrogen was 23% of the total amountthat was conserved from the external sources in the Sundarban mangrove system. Thus, the coastal ecosys-tem like Sundarban mangroves could retain only 0.2% (8 × 10⁶ mol) of the annual river flux of nitrogen tothe coastal waters and nitrogen is generally conserved within the system.
© 2014 Elsevier B.V. All rights reserved.
1. Introduction
Mangroves dominate the majority of the world's tropical andsubtropical coastline, forming 15 million ha of forest worldwide andaccounting for 0.7% of the tropical forest area (Giri et al. 2011) thatprovide habitat for rich biodiversity (FAO, 2004). They act as nurseriesfor commercially important aquatic organisms that contribute tocoastal, estuarine and deep-sea fisheries that serve important economicand ecological functions (Ronnback, 1999; Mumby et al. 2004),as habitat for resident and migratory birds, and as sink for atmo-spheric carbon dioxide and riverine nutrient. Mangroves trap sedi-ment resulting in land accretion (Pernetta, 1993), which protectscoasts from physical damage of the shoreline due to tidal waves,erosion, hurricanes, and tsunamis (Mitch and Gosselink, 1993).Mangrove biogeochemistry focuses on the large, slowmoving chem-ical reservoirs and their smaller but more active exchange or cyclingeither driven by biological activity in the mangrove reservoirs. Thesecycles of elements falls into two groups: 1) atmospheric gasses con-taining C, N, O, and S and 2) sediment derived elements such as P andFe. Deforestation of more than half of the world's original mangrovehabitats (Kelleher et al. 1995; Spalding et al. 1997) occurred with
91 3324614849.
chemical cycle of nitrogen in4.007
about 70% of that loss in the last 20 years (Valiela et al. 2001).Their destruction by human perturbations such as over-harvestingfor timber and fuel-wood (Hussein, 1995), clearing for aquacultureand agriculture (Terchunian et al. 1986; Primavera, 1997), sewagerelease and pollution, damming of rivers to alter salinity levels inthe mangrove water (Wolanski, 1992), etc. makes them vulnerablefor changes of the biogeochemical processes and the compositionof the large reservoirs (the biosphere, the hydrosphere, the atmo-sphere, and the geosphere) particularly with respect to nitrogen(Thorsten and José, 2001). The primary production in some coastalsystems is nitrogen limited (Howarth, 1988; Howarth and Marino,2006) and microbial rather than chemical processes govern themangrove nitrogen cycle (Alongi et al. 1992).
The Indian Sundarban mangrove is the largest delta on the globe(world's heritage site, www.unesco.org/en/list/452) and covers about2.8% of the global mangrove area (15 × 104 km2). The change ofatmospheric composition could depend on the feedback from thebiogeochemical processes. Biosphere–atmosphere coupling in theSundarbanmangrove ecosystemoccurs through 1) the biophysical path-way in terms of partitioning incoming radiation (Ganguly et al. 2008),2) and the biogeochemical pathway of carbon in associationwith the ex-change of atmospheric CO2 (Biswas et al. 2004) and CH4 (Biswas et al.2007; Dutta et al. 2013). In general, mangroves are highly productive,fixing (15–46 × 1012mol yr−1) and storing (3 × 10¹⁴ mol) large amountof carbon (Twilley et al. 1986; Gattuso et al. 1998; Alongi, 2009), and in
a tropical mangrove ecosystem, east coast of India,Mar. Chem. (2014),
2 R. Ray et al. / Marine Chemistry xxx (2014) xxx–xxx
particular, the Sundarbanmangrove forest acts as a sink for atmosphericCO2 (about 25 × 1010 mol yr−1) and is potentially sensitive towards theinter-annual increasing atmospheric CO2 (Ray et al., 2013). Ganguly et al.(2011) showed that the biogeochemical cycle of carbon at the land–ocean boundary, NE coast of India along with the micrometeorologicalfactors played an important role on seasonal variation of atmosphericCO2 concentration.
The vast majority of nutrients in mangrove forests are stored in soil.However,manymangrove soils have extremely lownutrient concentra-tions (Alongi et al. 1992; Lovelock et al. 2005), suggesting highlyefficient recycling of nutrients, which are regenerated by mangrovelitter decomposition (Holguin et al. 2001).
The availability of nitrogen (N) in mangrove ecosystems dependson a complex pattern of bacterial activity within the thin oxic(oxygen-containing) and the anoxic zone of mangrove mud. Nitrogenwas found to limit the growth of Avicennia marina in South Africa(Naidoo, 2009) and New Zealand (Lovelock et al. 2007). High litterfall in the Sundarban (Ray et al. 2011) and its degradation and re-mineralization could be one of the major sources of nitrogen (Ramoset al., 2007) apart from anthropogenic inputs due to proximity ofSundarban to human inhabitation, aquaculture farms, waste dischargefrom Industries adjacent to Haldia port and domestic sewagedischarge-points of Kolkata mega city. The recycled N released inthe sediment could substantially contribute to the nitrogen require-ment of mangroves. Plants showed uptake of both NOx and NH3
(Takahashi et al. 2005; Eller and Sparks, 2006; Sutton et al. 1995;Schjoerring et al. 1998), and Biswas et al. (2005) and Ganguly et al.(2009) observed that mangrove plants use atmospheric NH3 and NOx
as a N source depending on the micrometeorological conditions.Mangrove could provide important ecosystem service in recyclingdifferent forms of atmospheric and aquatic nitrogen, thereby protecting
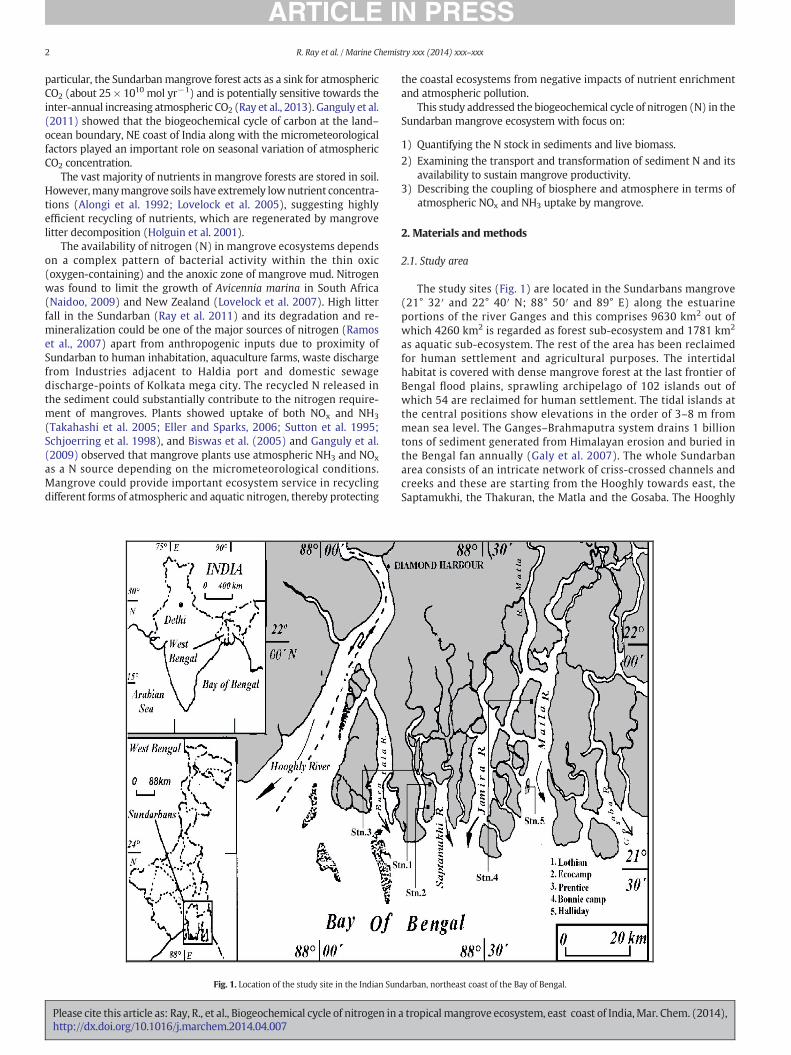
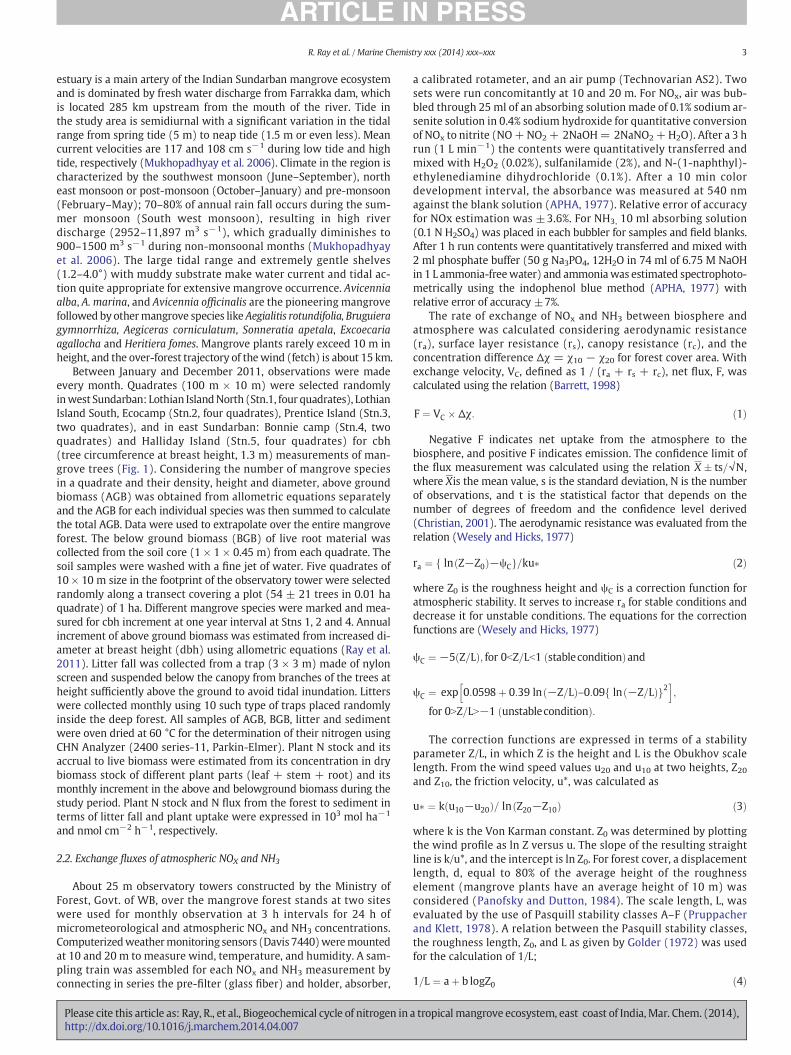
Fig. 1. Location of the study site in the Indian Sun
Please cite this article as: Ray, R., et al., Biogeochemical cycle of nitrogen inhttp://dx.doi.org/10.1016/j.marchem.2014.04.007
the coastal ecosystems from negative impacts of nutrient enrichmentand atmospheric pollution.
This study addressed the biogeochemical cycle of nitrogen (N) in theSundarban mangrove ecosystem with focus on:
1) Quantifying the N stock in sediments and live biomass.
2) Examining the transport and transformation of sediment N and itsavailability to sustain mangrove productivity.
3) Describing the coupling of biosphere and atmosphere in terms ofatmospheric NOx and NH3 uptake by mangrove.
2. Materials and methods
2.1. Study area
The study sites (Fig. 1) are located in the Sundarbans mangrove(21° 32′ and 22° 40′ N; 88° 50′ and 89° E) along the estuarineportions of the river Ganges and this comprises 9630 km2 out ofwhich 4260 km2 is regarded as forest sub-ecosystem and 1781 km2
as aquatic sub-ecosystem. The rest of the area has been reclaimedfor human settlement and agricultural purposes. The intertidalhabitat is covered with dense mangrove forest at the last frontier ofBengal flood plains, sprawling archipelago of 102 islands out ofwhich 54 are reclaimed for human settlement. The tidal islands atthe central positions show elevations in the order of 3–8 m frommean sea level. The Ganges–Brahmaputra system drains 1 billiontons of sediment generated from Himalayan erosion and buried inthe Bengal fan annually (Galy et al. 2007). The whole Sundarbanarea consists of an intricate network of criss-crossed channels andcreeks and these are starting from the Hooghly towards east, theSaptamukhi, the Thakuran, the Matla and the Gosaba. The Hooghly
darban, northeast coast of the Bay of Bengal.
a tropical mangrove ecosystem, east coast of India,Mar. Chem. (2014),
3R. Ray et al. / Marine Chemistry xxx (2014) xxx–xxx
estuary is a main artery of the Indian Sundarban mangrove ecosystemand is dominated by fresh water discharge from Farrakka dam, whichis located 285 km upstream from the mouth of the river. Tide inthe study area is semidiurnal with a significant variation in the tidalrange from spring tide (5 m) to neap tide (1.5 m or even less). Meancurrent velocities are 117 and 108 cm s−1 during low tide and hightide, respectively (Mukhopadhyay et al. 2006). Climate in the region ischaracterized by the southwest monsoon (June–September), northeast monsoon or post-monsoon (October–January) and pre-monsoon(February–May); 70–80% of annual rain fall occurs during the sum-mer monsoon (South west monsoon), resulting in high riverdischarge (2952–11,897 m3 s−1), which gradually diminishes to900–1500 m3 s−1 during non-monsoonal months (Mukhopadhyayet al. 2006). The large tidal range and extremely gentle shelves(1.2–4.0°) with muddy substrate make water current and tidal ac-tion quite appropriate for extensive mangrove occurrence. Avicenniaalba, A. marina, and Avicennia officinalis are the pioneering mangrovefollowed byothermangrove species like Aegialitis rotundifolia, Bruguieragymnorrhiza, Aegiceras corniculatum, Sonneratia apetala, Excoecariaagallocha and Heritiera fomes. Mangrove plants rarely exceed 10 m inheight, and the over-forest trajectory of thewind (fetch) is about 15 km.
Between January and December 2011, observations were madeevery month. Quadrates (100 m × 10 m) were selected randomlyinwest Sundarban: Lothian IslandNorth (Stn.1, four quadrates), LothianIsland South, Ecocamp (Stn.2, four quadrates), Prentice Island (Stn.3,two quadrates), and in east Sundarban: Bonnie camp (Stn.4, twoquadrates) and Halliday Island (Stn.5, four quadrates) for cbh(tree circumference at breast height, 1.3 m) measurements of man-grove trees (Fig. 1). Considering the number of mangrove speciesin a quadrate and their density, height and diameter, above groundbiomass (AGB) was obtained from allometric equations separatelyand the AGB for each individual species was then summed to calculatethe total AGB. Data were used to extrapolate over the entire mangroveforest. The below ground biomass (BGB) of live root material wascollected from the soil core (1 × 1 × 0.45 m) from each quadrate. Thesoil samples were washed with a fine jet of water. Five quadrates of10 × 10 m size in the footprint of the observatory tower were selectedrandomly along a transect covering a plot (54 ± 21 trees in 0.01 haquadrate) of 1 ha. Different mangrove species were marked and mea-sured for cbh increment at one year interval at Stns 1, 2 and 4. Annualincrement of above ground biomass was estimated from increased di-ameter at breast height (dbh) using allometric equations (Ray et al.2011). Litter fall was collected from a trap (3 × 3 m) made of nylonscreen and suspended below the canopy from branches of the trees atheight sufficiently above the ground to avoid tidal inundation. Litterswere collected monthly using 10 such type of traps placed randomlyinside the deep forest. All samples of AGB, BGB, litter and sedimentwere oven dried at 60 °C for the determination of their nitrogen usingCHN Analyzer (2400 series-11, Parkin-Elmer). Plant N stock and itsaccrual to live biomass were estimated from its concentration in drybiomass stock of different plant parts (leaf + stem + root) and itsmonthly increment in the above and belowground biomass during thestudy period. Plant N stock and N flux from the forest to sediment interms of litter fall and plant uptake were expressed in 103 mol ha−1
and nmol cm−2 h−1, respectively.
2.2. Exchange fluxes of atmospheric NOX and NH3
About 25 m observatory towers constructed by the Ministry ofForest, Govt. of WB, over the mangrove forest stands at two siteswere used for monthly observation at 3 h intervals for 24 h ofmicrometeorological and atmospheric NOx and NH3 concentrations.Computerizedweathermonitoring sensors (Davis 7440)weremountedat 10 and 20 m to measure wind, temperature, and humidity. A sam-pling train was assembled for each NOx and NH3 measurement byconnecting in series the pre-filter (glass fiber) and holder, absorber,
Please cite this article as: Ray, R., et al., Biogeochemical cycle of nitrogen inhttp://dx.doi.org/10.1016/j.marchem.2014.04.007
a calibrated rotameter, and an air pump (Technovarian AS2). Twosets were run concomitantly at 10 and 20 m. For NOx, air was bub-bled through 25 ml of an absorbing solution made of 0.1% sodium ar-senite solution in 0.4% sodium hydroxide for quantitative conversionof NOx to nitrite (NO+NO2+ 2NaOH= 2NaNO2+H2O). After a 3 hrun (1 L min−1) the contents were quantitatively transferred andmixed with H2O2 (0.02%), sulfanilamide (2%), and N-(1-naphthyl)-ethylenediamine dihydrochloride (0.1%). After a 10 min colordevelopment interval, the absorbance was measured at 540 nmagainst the blank solution (APHA, 1977). Relative error of accuracyfor NOx estimation was ±3.6%. For NH3, 10 ml absorbing solution(0.1 N H2SO4) was placed in each bubbler for samples and field blanks.After 1 h run contents were quantitatively transferred and mixed with2 ml phosphate buffer (50 g Na3PO4, 12H2O in 74 ml of 6.75 M NaOHin 1 L ammonia-freewater) and ammoniawas estimated spectrophoto-metrically using the indophenol blue method (APHA, 1977) withrelative error of accuracy ±7%.
The rate of exchange of NOx and NH3 between biosphere andatmosphere was calculated considering aerodynamic resistance(ra), surface layer resistance (rs), canopy resistance (rc), and theconcentration difference Δχ = χ10 − χ20 for forest cover area. Withexchange velocity, VC, defined as 1 / (ra + rs + rc), net flux, F, wascalculated using the relation (Barrett, 1998)
F ¼ VC � Δχ: ð1Þ
Negative F indicates net uptake from the atmosphere to thebiosphere, and positive F indicates emission. The confidence limit ofthe flux measurement was calculated using the relation X � ts=√N,where Xis the mean value, s is the standard deviation, N is the numberof observations, and t is the statistical factor that depends on thenumber of degrees of freedom and the confidence level derived(Christian, 2001). The aerodynamic resistance was evaluated from therelation (Wesely and Hicks, 1977)
ra ¼ ln Z−Z0ð Þ−ψCf g=ku� ð2Þ
where Z0 is the roughness height and ψC is a correction function foratmospheric stability. It serves to increase ra for stable conditions anddecrease it for unstable conditions. The equations for the correctionfunctions are (Wesely and Hicks, 1977)
ψC ¼ −5 Z=Lð Þ; for 0bZ=Lb1 stableconditionð Þand
ψC ¼ exp 0:0598þ 0:39 ln −Z=Lð Þ–0:09 ln −Z=Lð Þf g2h i
;
for 0NZ=LN−1 unstableconditionð Þ:
The correction functions are expressed in terms of a stabilityparameter Z/L, in which Z is the height and L is the Obukhov scalelength. From the wind speed values u20 and u10 at two heights, Z20and Z10, the friction velocity, u*, was calculated as
u� ¼ k u10−u20ð Þ= ln Z20−Z10ð Þ ð3Þ
where k is the Von Karman constant. Z0 was determined by plottingthe wind profile as ln Z versus u. The slope of the resulting straightline is k/u*, and the intercept is ln Z0. For forest cover, a displacementlength, d, equal to 80% of the average height of the roughnesselement (mangrove plants have an average height of 10 m) wasconsidered (Panofsky and Dutton, 1984). The scale length, L, wasevaluated by the use of Pasquill stability classes A–F (Pruppacherand Klett, 1978). A relation between the Pasquill stability classes,the roughness length, Z0, and L as given by Golder (1972) was usedfor the calculation of 1/L;
1=L ¼ aþ b logZ0 ð4Þ
a tropical mangrove ecosystem, east coast of India,Mar. Chem. (2014),
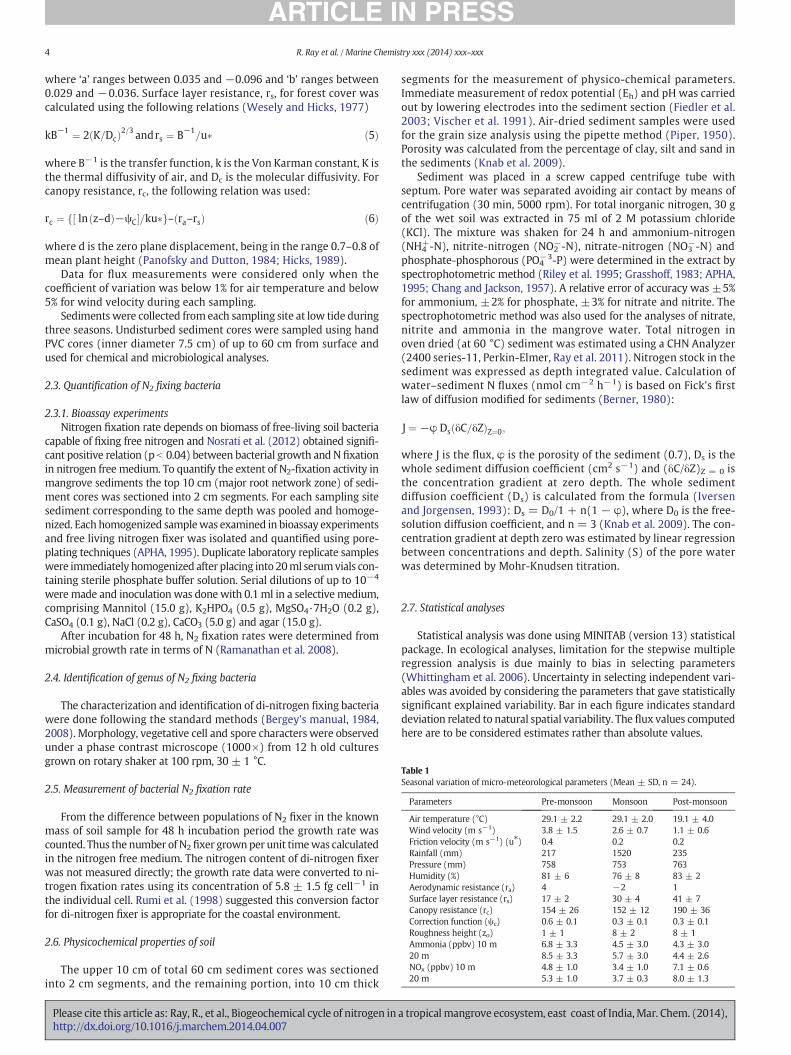
Table 1Seasonal variation of micro-meteorological parameters (Mean ± SD, n = 24).
Parameters Pre-monsoon Monsoon Post-monsoon
Air temperature (°C) 29.1 ± 2.2 29.1 ± 2.0 19.1 ± 4.0Wind velocity (m s−1) 3.8 ± 1.5 2.6 ± 0.7 1.1 ± 0.6Friction velocity (m s−1) (u⁎) 0.4 0.2 0.2Rainfall (mm) 217 1520 235Pressure (mm) 758 753 763Humidity (%) 81 ± 6 76 ± 8 83 ± 2Aerodynamic resistance (ra) 4 −2 1Surface layer resistance (rs) 17 ± 2 30 ± 4 41 ± 7Canopy resistance (rc) 154 ± 26 152 ± 12 190 ± 36Correction function (ψc) 0.6 ± 0.1 0.3 ± 0.1 0.3 ± 0.1Roughness height (zo) 1 ± 1 8 ± 2 8 ± 1Ammonia (ppbv) 10 m 6.8 ± 3.3 4.5 ± 3.0 4.3 ± 3.020 m 8.5 ± 3.3 5.7 ± 3.0 4.4 ± 2.6NOx (ppbv) 10 m 4.8 ± 1.0 3.4 ± 1.0 7.1 ± 0.620 m 5.3 ± 1.0 3.7 ± 0.3 8.0 ± 1.3
4 R. Ray et al. / Marine Chemistry xxx (2014) xxx–xxx
where ‘a’ ranges between 0.035 and −0.096 and ‘b’ ranges between0.029 and −0.036. Surface layer resistance, rs, for forest cover wascalculated using the following relations (Wesely and Hicks, 1977)
kB−1 ¼ 2 K=Dcð Þ2=3 andrs ¼ B−1=u� ð5Þ
where B−1 is the transfer function, k is the Von Karman constant, K isthe thermal diffusivity of air, and Dc is the molecular diffusivity. Forcanopy resistance, rc, the following relation was used:
rc ¼ ln z–dð Þ−ψC½ �=ku�f g– ra–rsð Þ ð6Þ
where d is the zero plane displacement, being in the range 0.7–0.8 ofmean plant height (Panofsky and Dutton, 1984; Hicks, 1989).
Data for flux measurements were considered only when thecoefficient of variation was below 1% for air temperature and below5% for wind velocity during each sampling.
Sediments were collected from each sampling site at low tide duringthree seasons. Undisturbed sediment cores were sampled using handPVC cores (inner diameter 7.5 cm) of up to 60 cm from surface andused for chemical and microbiological analyses.
2.3. Quantification of N2 fixing bacteria
2.3.1. Bioassay experimentsNitrogen fixation rate depends on biomass of free-living soil bacteria
capable of fixing free nitrogen and Nosrati et al. (2012) obtained signifi-cant positive relation (p b 0.04) between bacterial growth and N fixationin nitrogen free medium. To quantify the extent of N2-fixation activity inmangrove sediments the top 10 cm (major root network zone) of sedi-ment cores was sectioned into 2 cm segments. For each sampling sitesediment corresponding to the same depth was pooled and homoge-nized. Each homogenized samplewas examined in bioassay experimentsand free living nitrogen fixer was isolated and quantified using pore-plating techniques (APHA, 1995). Duplicate laboratory replicate sampleswere immediately homogenized after placing into 20ml serumvials con-taining sterile phosphate buffer solution. Serial dilutions of up to 10−4
weremade and inoculation was done with 0.1 ml in a selective medium,comprising Mannitol (15.0 g), K2HPO4 (0.5 g), MgSO4·7H2O (0.2 g),CaSO4 (0.1 g), NaCl (0.2 g), CaCO3 (5.0 g) and agar (15.0 g).
After incubation for 48 h, N2 fixation rates were determined frommicrobial growth rate in terms of N (Ramanathan et al. 2008).
2.4. Identification of genus of N2 fixing bacteria
The characterization and identification of di-nitrogen fixing bacteriawere done following the standard methods (Bergey's manual, 1984,2008). Morphology, vegetative cell and spore characters were observedunder a phase contrast microscope (1000×) from 12 h old culturesgrown on rotary shaker at 100 rpm, 30 ± 1 °C.
2.5. Measurement of bacterial N2 fixation rate
From the difference between populations of N2 fixer in the knownmass of soil sample for 48 h incubation period the growth rate wascounted. Thus the number of N2fixer grownper unit timewas calculatedin the nitrogen free medium. The nitrogen content of di-nitrogen fixerwas not measured directly; the growth rate data were converted to ni-trogen fixation rates using its concentration of 5.8 ± 1.5 fg cell−1 inthe individual cell. Rumi et al. (1998) suggested this conversion factorfor di-nitrogen fixer is appropriate for the coastal environment.
2.6. Physicochemical properties of soil
The upper 10 cm of total 60 cm sediment cores was sectionedinto 2 cm segments, and the remaining portion, into 10 cm thick
Please cite this article as: Ray, R., et al., Biogeochemical cycle of nitrogen inhttp://dx.doi.org/10.1016/j.marchem.2014.04.007
segments for the measurement of physico-chemical parameters.Immediate measurement of redox potential (Eh) and pH was carriedout by lowering electrodes into the sediment section (Fiedler et al.2003; Vischer et al. 1991). Air-dried sediment samples were usedfor the grain size analysis using the pipette method (Piper, 1950).Porosity was calculated from the percentage of clay, silt and sand inthe sediments (Knab et al. 2009).
Sediment was placed in a screw capped centrifuge tube withseptum. Pore water was separated avoiding air contact by means ofcentrifugation (30 min, 5000 rpm). For total inorganic nitrogen, 30 gof the wet soil was extracted in 75 ml of 2 M potassium chloride(KCl). The mixture was shaken for 24 h and ammonium-nitrogen(NH4
+-N), nitrite-nitrogen (NO2−-N), nitrate-nitrogen (NO3
−-N) andphosphate-phosphorous (PO4
−3-P) were determined in the extract byspectrophotometric method (Riley et al. 1995; Grasshoff, 1983; APHA,1995; Chang and Jackson, 1957). A relative error of accuracy was ±5%for ammonium, ±2% for phosphate, ±3% for nitrate and nitrite. Thespectrophotometric method was also used for the analyses of nitrate,nitrite and ammonia in the mangrove water. Total nitrogen inoven dried (at 60 °C) sediment was estimated using a CHN Analyzer(2400 series-11, Perkin-Elmer, Ray et al. 2011). Nitrogen stock in thesediment was expressed as depth integrated value. Calculation ofwater–sediment N fluxes (nmol cm−2 h−1) is based on Fick's firstlaw of diffusion modified for sediments (Berner, 1980):
J ¼ −φ Ds δC=δZð ÞZ¼0;
where J is the flux, φ is the porosity of the sediment (0.7), Ds is thewhole sediment diffusion coefficient (cm2 s−1) and (δC/δZ)Z = 0 isthe concentration gradient at zero depth. The whole sedimentdiffusion coefficient (Ds) is calculated from the formula (Iversenand Jorgensen, 1993): Ds = D0/1 + n(1 − φ), where D0 is the free-solution diffusion coefficient, and n = 3 (Knab et al. 2009). The con-centration gradient at depth zero was estimated by linear regressionbetween concentrations and depth. Salinity (S) of the pore waterwas determined by Mohr-Knudsen titration.
2.7. Statistical analyses
Statistical analysis was done using MINITAB (version 13) statisticalpackage. In ecological analyses, limitation for the stepwise multipleregression analysis is due mainly to bias in selecting parameters(Whittingham et al. 2006). Uncertainty in selecting independent vari-ables was avoided by considering the parameters that gave statisticallysignificant explained variability. Bar in each figure indicates standarddeviation related to natural spatial variability. The flux values computedhere are to be considered estimates rather than absolute values.
a tropical mangrove ecosystem, east coast of India,Mar. Chem. (2014),
5R. Ray et al. / Marine Chemistry xxx (2014) xxx–xxx
3. Results
3.1. Micrometeorological and soil properties
Intra-annual changes in micrometeorological parameters were ob-served due to differential temperature and pressure in different seasons(Table 1) as a result of themovement of the Inter-tropical ConvergenceZone in this part of the world. The seasonal variation showed the mini-mum mean temperature, wind velocity and maximum mean pressurein the winter (post-monsoon). The maximum values of temperatureand wind velocity occurred during the pre-monsoon and monsoon.Major rainfall occurred in the monsoon, when 77% of annual rainfall(1973 mm) was recorded.
Analyses of sand silt and clay in mangrove sediments (0–60 cmdepth) depict sediment dominated by silt, which contributes 72–87%.Geologically the area is the result of extensive fluvio-marine depositsof the river Ganges and the Bay of Bengal and the character of thesediment is silty clay (Table 2). Rajkumar et al. (2012) reported thedominant association of kaolinite with subordinate amount of quartz,illite and chlorite in the clay minerals in the Sundarban mangrove coresediment. The adsorption capabilities result from a net negative chargeon the structure of minerals, high surface area and high porosity (Alkanet al. 2004).
Salinity varied seasonally with a maximum of 30 during the pre-monsoon and a minimum of 19 during the monsoon (Table 2).One set of representative pattern of all stations depicting down-coreEh, organic carbon and nutrients profile is given in Fig. 2. The depthprofile of Eh indicated the occurrence of an oxic layer between 0 and5 cm. A general decrease of both organic carbon and negative Eh withdepth showed anaerobic condition. Total organic carbon in sedimentsexhibited a greater concentration in the post-monsoon compared toother times of the year. Down-core nutrient profiles exhibited an over-all decreasing trendwith depth. Ammonium concentration in sedimentcolumnwas steadily decreased from surface level of 237±99nmol g−1
to 189 ± 89 nmol g−1 at 60 cm depth. Similar to ammonium,decrease of 14% surface nitrate (14 ± 5 nmol g−1) and 1% surfacenitrite (2.8 ± 1.5 nmol g−1) concentrations was recorded in thesediment column at 60 cmdepth. Inorganic nitrogen exhibited seasonalfluctuation with an annual mean of 190 ± 50 nmol g−1 and 26% ofcoefficient of variance (CV) in the sediment, and 5 ± 0.1 μmol L−1
and 2% of coefficient of variance in pore water. The correspondingannual mean inorganic phosphate concentration was found to be
Table 2Seasonal variation of physico-chemical properties of mangrove sediment column(0–60 cm) (dry weight basis, nmol g−1) and pore water nutrients (μmol L−1)
(mean ± SD, n = 48).
Soil properties Pre-monsoon Monsoon Post-monsoon
Soil temperature (°C) 17.8 ± 6.6 24.4 ± 2.9 13.0 ± 5.7pH 8.2 ± 0.1 8.2 ± 0.2 8.3 ± 0.2Salinity (psu) 30.0 ± 2.5 19.0 ± 1.2 20.5 ± 1.5Eh (mv) −45.5 ± 119.0 −78.4 ± 59.0 −70.6 ± 66.0NO2-N (nmol g−1) 3 ± 1 4 ± 1 2 ± 1NO2-N (nmol L−1) 200 ± 10 320 ± 1400 100 ± 10NO3-N (nmol g−1) 13 ± 1 3.0 ± 0.1 15.0 ± 0.7NO3-N (μmol L−1) 1.9 ± 1.1 2.6 ± 3.2 1.0 ± 0.7NH4-N (nmol g−1) 194 ± 67 127 ± 40 310 ± 57NH4-N (μmol L−1) 2.8 ± 0.6 2.1 ± 1.7 4.0 ± 1.1PO4-P (nmol g−1) 11 ± 4 29 ± 9 7 ± 3PO4-P (μmol L−1) 1.1 ± 0.3 1.6 ± 0.1 0.8 ± 0.1Org-C (%) 0.9 ± 0.1 0.8 ± 0.1 1.1 ± 0.2Sediment textureSand (%) 6 5 16Silt (%) 80 87 72Clay (%) 14 8 12
Porosity 0.7 0.7 0.7Diffusion constant (cm2 s−1) 9 × 10⁻⁶ 9 × 10⁻⁶ 9 × 10⁻⁶
Please cite this article as: Ray, R., et al., Biogeochemical cycle of nitrogen inhttp://dx.doi.org/10.1016/j.marchem.2014.04.007
16 ± 12 nmol g−1 and 75% CV in the sediment, and 1.2 ± 0.4 μmolL−1 and 33% CV in pore water.
In the sediment ammonium concentration was found about 12–18times more abundant than nitrate and nitrite. The similar pattern wasobserved in the pore-water, in which ammonium was about 1.3–3.6fold more abundant than nitrite and nitrate during the pre- and post-monsoon. However, nitrate and nitrite were more abundant thanammonium during the monsoon in the pore water. The mean nitrate,nitrite and ammonium concentrations in the mangrove tidal waterwere found to be 14.5 ± 1.5, 1.6 ± 0.5 and 5.3 ± 0.6 μmol L−1, respec-tively. In contrast to sediment, in the mangrove tidal water nitrate andnitrite concentrations were about three fold higher than ammonium.
3.2. Nitrogen content in above and below ground biomass (AGB-N, BGB-N)and soil
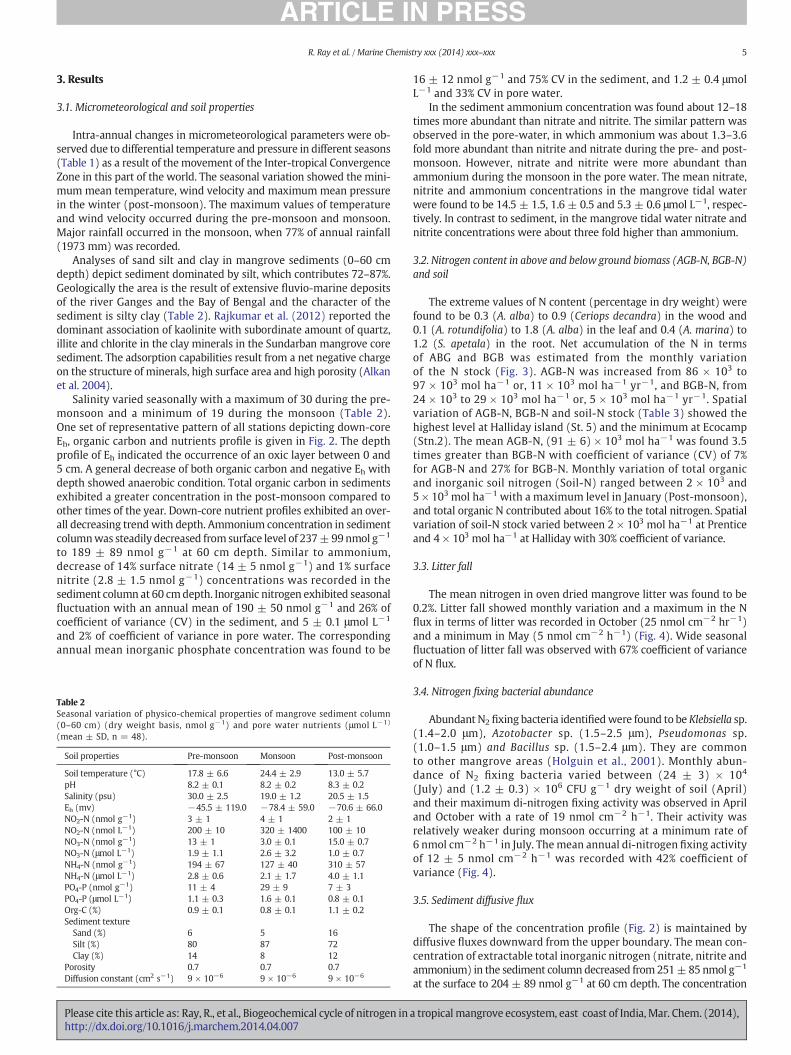
The extreme values of N content (percentage in dry weight) werefound to be 0.3 (A. alba) to 0.9 (Ceriops decandra) in the wood and0.1 (A. rotundifolia) to 1.8 (A. alba) in the leaf and 0.4 (A. marina) to1.2 (S. apetala) in the root. Net accumulation of the N in termsof ABG and BGB was estimated from the monthly variationof the N stock (Fig. 3). AGB-N was increased from 86 × 103 to97 × 103 mol ha−1 or, 11 × 103 mol ha−1 yr−1, and BGB-N, from24 × 103 to 29 × 103 mol ha−1 or, 5 × 10³ mol ha−1 yr−1. Spatialvariation of AGB-N, BGB-N and soil-N stock (Table 3) showed thehighest level at Halliday island (St. 5) and the minimum at Ecocamp(Stn.2). The mean AGB-N, (91 ± 6) × 103 mol ha−1 was found 3.5times greater than BGB-N with coefficient of variance (CV) of 7%for AGB-N and 27% for BGB-N. Monthly variation of total organicand inorganic soil nitrogen (Soil-N) ranged between 2 × 10³ and5 × 103 mol ha−1 with a maximum level in January (Post-monsoon),and total organic N contributed about 16% to the total nitrogen. Spatialvariation of soil-N stock varied between 2 × 10³ mol ha−1 at Prenticeand 4 × 10³ mol ha−1 at Halliday with 30% coefficient of variance.
3.3. Litter fall
The mean nitrogen in oven dried mangrove litter was found to be0.2%. Litter fall showed monthly variation and a maximum in the Nflux in terms of litter was recorded in October (25 nmol cm−2 hr−1)and a minimum in May (5 nmol cm−2 h−1) (Fig. 4). Wide seasonalfluctuation of litter fall was observed with 67% coefficient of varianceof N flux.
3.4. Nitrogen fixing bacterial abundance
Abundant N2 fixing bacteria identifiedwere found to be Klebsiella sp.(1.4–2.0 μm), Azotobacter sp. (1.5–2.5 μm), Pseudomonas sp.(1.0–1.5 μm) and Bacillus sp. (1.5–2.4 μm). They are commonto other mangrove areas (Holguin et al., 2001). Monthly abun-dance of N2 fixing bacteria varied between (24 ± 3) × 104
(July) and (1.2 ± 0.3) × 106 CFU g−1 dry weight of soil (April)and their maximum di-nitrogen fixing activity was observed in Apriland October with a rate of 19 nmol cm−2 h−1. Their activity wasrelatively weaker during monsoon occurring at a minimum rate of6 nmol cm−2 h−1 in July. Themean annual di-nitrogen fixing activityof 12 ± 5 nmol cm−2 h−1 was recorded with 42% coefficient ofvariance (Fig. 4).
3.5. Sediment diffusive flux
The shape of the concentration profile (Fig. 2) is maintained bydiffusive fluxes downward from the upper boundary. The mean con-centration of extractable total inorganic nitrogen (nitrate, nitrite andammonium) in the sediment column decreased from 251±85 nmol g−1
at the surface to 204 ± 89 nmol g−1 at 60 cm depth. The concentration
a tropical mangrove ecosystem, east coast of India,Mar. Chem. (2014),
Fig. 2. Down core seasonal variation of nitrate-N, ammonia-N, nitrite-N, organic-C (n mol g−1DW (soil dry weight) and Eh profile.
Fig. 3. Monthly variation of nitrogen stock in the above ground biomass (AGB-N), belowground biomass (BGB-N) and Soil (Soil-N).
6 R. Ray et al. / Marine Chemistry xxx (2014) xxx–xxx
Please cite this article as: Ray, R., et al., Biogeochemical cycle of nitrogen inhttp://dx.doi.org/10.1016/j.marchem.2014.04.007
gradient (dc/dz) is negative, concentration decreases with depth,indicating that the diffusive flux φ Ds (δC/δZ) is directed downward(the flux value is positive). In the growing sediment column withaccumulation rate of 0.4–0.7 g cm−2 yr−1 (Banerjee et al. 2011),
Table 3Spatial variation of plant-N (AGB-N and BGB-N), total soil-N (organic and inorganic)(103 mol ha−1) and total inorganic nitrogen, NO3
−, NO2−, NH4
+ (TIN, nmol g−1 soil) stock.
Station AGB-N BGB-N Soil-N TIN
Lothian(n = 48)
91 ± 4 27 ± 2 3 ± 1 226 ± 94
Ecocamp(n = 48)
85 ± 3 19 ± 1 2 ± 1 258 ± 50
Prentice(n = 24)
96 ± 4 20 ± 1 2 ± 1 208 ± 76
Bonnie camp(n = 24)
86 ± 4 35 ± 2 3 ± 1 285 ± 70
Halliday(n = 48)
97 ± 6 30 ± 2 4 ± 1 287 ± 79
a tropical mangrove ecosystem, east coast of India,Mar. Chem. (2014),
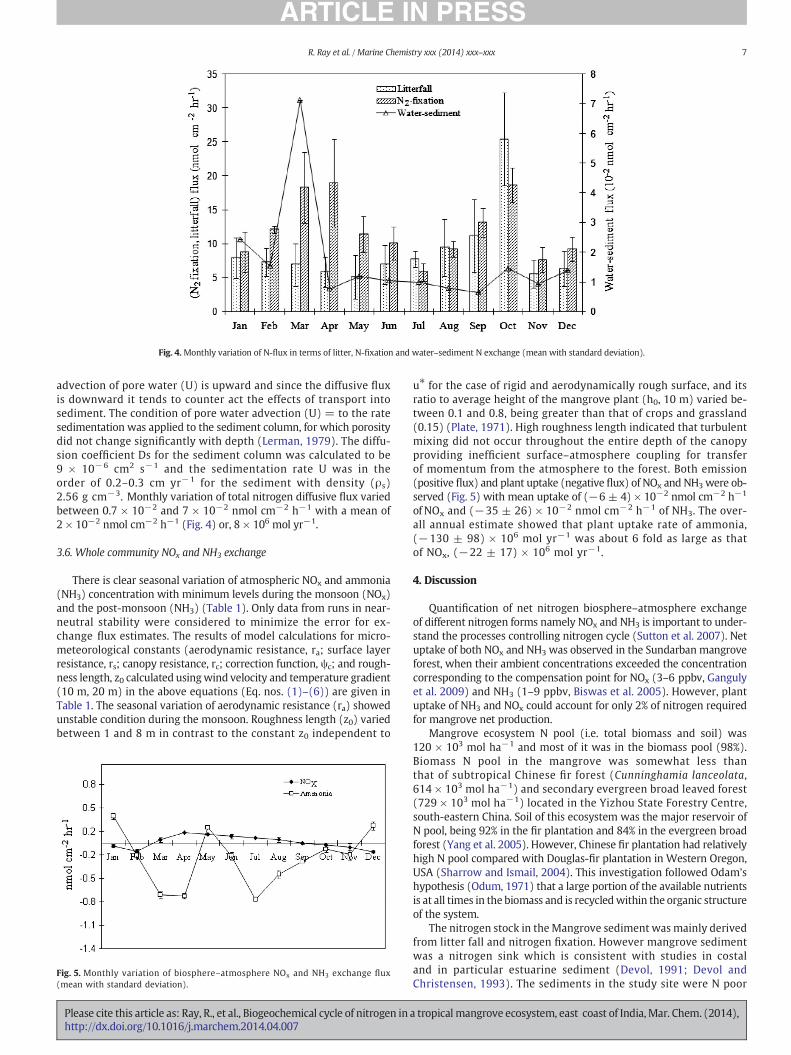
Fig. 4.Monthly variation of N-flux in terms of litter, N-fixation and water–sediment N exchange (mean with standard deviation).
7R. Ray et al. / Marine Chemistry xxx (2014) xxx–xxx
advection of pore water (U) is upward and since the diffusive fluxis downward it tends to counter act the effects of transport intosediment. The condition of pore water advection (U) = to the ratesedimentation was applied to the sediment column, for which porositydid not change significantly with depth (Lerman, 1979). The diffu-sion coefficient Ds for the sediment column was calculated to be9 × 10−6 cm2 s−1 and the sedimentation rate U was in theorder of 0.2–0.3 cm yr−1 for the sediment with density (ρs)2.56 g cm−3. Monthly variation of total nitrogen diffusive flux variedbetween 0.7 × 10⁻² and 7 × 10⁻² nmol cm−2 h−1 with a mean of2 × 10−2 nmol cm−2 h−1 (Fig. 4) or, 8 × 10⁶ mol yr−1.
3.6. Whole community NOx and NH3 exchange
There is clear seasonal variation of atmospheric NOx and ammonia(NH3) concentration with minimum levels during the monsoon (NOx)and the post-monsoon (NH3) (Table 1). Only data from runs in near-neutral stability were considered to minimize the error for ex-change flux estimates. The results of model calculations for micro-meteorological constants (aerodynamic resistance, ra; surface layerresistance, rs; canopy resistance, rc; correction function, ψc; and rough-ness length, z0 calculated usingwind velocity and temperature gradient(10 m, 20 m) in the above equations (Eq. nos. (1)–(6)) are given inTable 1. The seasonal variation of aerodynamic resistance (ra) showedunstable condition during the monsoon. Roughness length (z0) variedbetween 1 and 8 m in contrast to the constant z0 independent to
Fig. 5. Monthly variation of biosphere–atmosphere NOx and NH3 exchange flux(mean with standard deviation).
Please cite this article as: Ray, R., et al., Biogeochemical cycle of nitrogen inhttp://dx.doi.org/10.1016/j.marchem.2014.04.007
u⁎ for the case of rigid and aerodynamically rough surface, and itsratio to average height of the mangrove plant (h0, 10 m) varied be-tween 0.1 and 0.8, being greater than that of crops and grassland(0.15) (Plate, 1971). High roughness length indicated that turbulentmixing did not occur throughout the entire depth of the canopyproviding inefficient surface–atmosphere coupling for transferof momentum from the atmosphere to the forest. Both emission(positive flux) and plant uptake (negative flux) of NOx and NH3were ob-served (Fig. 5) with mean uptake of (−6 ± 4) × 10−2 nmol cm−2 h−1
of NOx and (−35 ± 26) × 10−2 nmol cm−2 h−1 of NH3. The over-all annual estimate showed that plant uptake rate of ammonia,(−130 ± 98) × 106 mol yr−1 was about 6 fold as large as thatof NOx, (−22 ± 17) × 106 mol yr−1.
4. Discussion
Quantification of net nitrogen biosphere–atmosphere exchangeof different nitrogen forms namely NOx and NH3 is important to under-stand the processes controlling nitrogen cycle (Sutton et al. 2007). Netuptake of both NOx and NH3 was observed in the Sundarban mangroveforest, when their ambient concentrations exceeded the concentrationcorresponding to the compensation point for NOx (3–6 ppbv, Gangulyet al. 2009) and NH3 (1–9 ppbv, Biswas et al. 2005). However, plantuptake of NH3 and NOx could account for only 2% of nitrogen requiredfor mangrove net production.
Mangrove ecosystem N pool (i.e. total biomass and soil) was120 × 103 mol ha−1 and most of it was in the biomass pool (98%).Biomass N pool in the mangrove was somewhat less thanthat of subtropical Chinese fir forest (Cunninghamia lanceolata,614 × 103 mol ha−1) and secondary evergreen broad leaved forest(729 × 103 mol ha−1) located in the Yizhou State Forestry Centre,south-eastern China. Soil of this ecosystem was the major reservoir ofN pool, being 92% in the fir plantation and 84% in the evergreen broadforest (Yang et al. 2005). However, Chinese fir plantation had relativelyhigh N pool compared with Douglas-fir plantation in Western Oregon,USA (Sharrow and Ismail, 2004). This investigation followed Odam'shypothesis (Odum, 1971) that a large portion of the available nutrientsis at all times in the biomass and is recycledwithin the organic structureof the system.
The nitrogen stock in the Mangrove sediment was mainly derivedfrom litter fall and nitrogen fixation. However mangrove sedimentwas a nitrogen sink which is consistent with studies in costaland in particular estuarine sediment (Devol, 1991; Devol andChristensen, 1993). The sediments in the study site were N poor
a tropical mangrove ecosystem, east coast of India,Mar. Chem. (2014),

Fig. 6. Correlation between extractable total inorganic nitrogen (TIN) versus organiccarbon (OC).
8 R. Ray et al. / Marine Chemistry xxx (2014) xxx–xxx
(208 ± 76 nmol g−1 at Prentice, 226 ± 94 nmol g−1 at Lothian,258 ± 50 nmol g−1 at Ecocamp, 285 ± 70 nmol g−1 at Bonniecamp and 287 ± 79 nmol g−1 at Halliday), and were lower thanthose ofmeanmarine (34 μmol g−1, Bowen, 1979) and othermangrovesediment (Australian, 307–521 nmol g−1, Boto and Welligton, 1984).Significant positive correlation (Fig. 6, p b 0.05) was observed betweentotal inorganic nitrogen and organic carbon in sediments, indicating Ndynamics could be mainly regulated by in situ processes. Bala KrishnaPrasad and Ramanathan (2008) suggested that high concentration oftotal nitrogen and its weak correlation with organic carbon in thePichavaram mangrove sediment could be due to ex situ sources inaddition to in situ processes.
The addition of N by litter decomposition and N2 fixationoccurred almost in equal magnitude, 3 × 10⁹ mol yr−1 versus5 × 109 mol yr−1. The mean nitrogen fixing activity (12 nmol cm−2 h−1)in the present study was found to be closer to the maximum range foundfor other mangrove systems of the world (0–18 nmol cm−2 h−1, Alongi,2009). Increase in abundance of N2fixing bacteria during April andOctobermight be related to labile organic carbon derived from phytoplank-ton. Biswas et al. (2010) showed enhanced phytoplankton produc-tion during autumn (October) and spring (March/April) time. Inother mangrove studies, occurrence of N2 fixation was documentedin mangrove soils (Holguin et al. 2001), in contrast to denitrificationrates, which was a negligible part of the N budget (Rivera-Monroyand Twilley, 1996; Kristensen et al. 1998).
The sensitivity test of N2 fixing bacteria was found to be negative toanaerobic condition and H2S, and positive to catalase test. Nosrati et al.(2012) suggested that in Azotobacter sp. the carbon source regulates theformation of alginate capsules which protect it from the inactivation ofdi-nitrogenase reductase activity by oxygen transfer in to the cell underaerobic condition.
Ammonium was the major constituent of total inorganic nitrogen.Since the acid-base pair, NH4
+–NH3, has pKa value of about 9.3, the
Table 4Multiple regression analysis with a stepwise variable selection. Dependent variable:ammonium (NH4-N), independent variables: organic carbon (Org-C), nitrate (NO3-N)and nitrite (NO2-N) for anoxic and oxic zone.
Anoxic zone
Equations R2 (%) P N
NH4-N = 654 − 499 Org-C 53 0.002 15NH4-N = 702 − 486 Org-C − 4 NO3-N 55 0.009 15NH4-N = 643 − 492 Org-C − 2.6 NO3-N + 18 NO2-N 58 0.021 15
Oxic zoneNH4-N = 631 − 349 Org-C 31 0.251 15NH4-N = 306 − 252 Org-C + 16.6 NO3-N 98 0.003 15NH4-N = 24 − 372 Org-C + 26.8 NO3-N + 67 NO2-N 99 0.017 15
Please cite this article as: Ray, R., et al., Biogeochemical cycle of nitrogen inhttp://dx.doi.org/10.1016/j.marchem.2014.04.007
ammonium ion is the dominant species at the pore water pH 8.2–8.3.The distribution coefficient (K = Cs/C) of ammonium between sedi-ment (Cs) and pore-water (C) was found to be 62–82, indicating allthe exchange sites of the mangrove sediment are presumably takenby NH4
+ ion. The down core ammonium profile exhibited progressivedecrease from the post-monsoon to the pre-monsoon followed byfurther decrease during the monsoon. Ammonium concentration wasfound to be greater in the surface sediment than that of nitrate andnitrite in contrast to mangrovewater, and occurrence of in situ process-es like denitrification and anammox activity could be responsible for itsdown core decrease. However, the major loss of nitrogen from thesediment was found to be due to root uptake. Removal of nitrogenfrom the mangrove sediment by nitrification, denitrification andanammox activity might occur in the form of N2 and oxides of nitrogen.The significance of the response of the ammonium versus organiccarbon, nitrate and nitrite was tested by stepwise multiple regressionanalysis (Table 4). Significant correlation was obtained betweenammonium and independent variables tested (Org-C, NO3
− and NO2−)
with 99% explained variability in the aerobic zone. Linear term Org-Cwas negative and nitrate (NO3
−) and nitrite (NO2−) were positive with
respect to ammonium, indicating that ammonium, nitrate and nitritewere from a common source of labile organic carbon in the aerobiccondition. However, the situation was different for anaerobic condition.Linear term Org-C and NO3
− were negative with 58% explained variabil-ity of ammonium, indicating that apart from the anaerobic processes toproduce both ammonium and nitrite from the substrate Org-C andnitrate, root uptake of ammonium might be an important factor aswell. Org-C could explain 53% variation of ammonium in the anaerobiczone, and the corresponding value was 31% in the aerobic zone.Nedwell et al. (1994) suggested that organic nitrogen derived fromlitter and roots could support high rates of ammonification, resultingin the high concentration of ammonium in mangrove soil. Further,low levels of nitrate and nitrite compared to those in other marinesediment (Alongi et al. 1992; Clarke, 1985) and ammonia being themost abundant form of nitrogen indicated that the formation of nitratefrom ammonia by nitrification could be an additional process other thanits supply from thewater. Rivera-Monroy and Twilley (1996) suggestedthat the lower rates of denitrification could be due to limited supply ofnitrate from the water to the sediment and low nitrification rates.
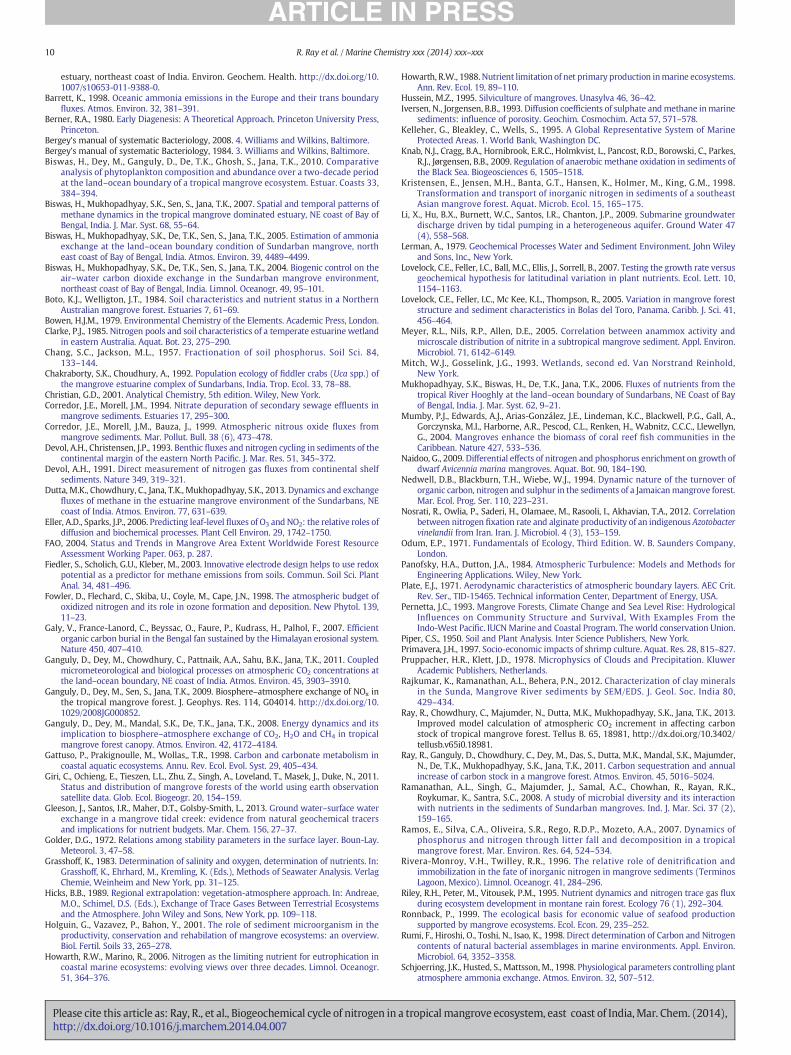
One common approach to quantify the loss of nitrogen uses thestable N isotope ratio in combination with the N2 gas flux. Gas chro-matography techniques were used in the mangrove ecosystem(Meyer et al. 2005; Alongi et al. 2004; Corredor et al. 1999). Toestimate the total loss of N from the soil it requires consideration ofthe soil emission of NOx (Williams et al. 1988; Fowler et al. 1998;Ganguly et al. 2009) and advective N flux apart from thoseabovementioned processes. In this study, the total loss of N wasestimated using a mass based box model approach. A box modelplot gives a summary representation of N stocks and fluxes for themangrove ecosystem (Fig. 7). The total N flux to the sediment aftersumming up all sources of N to the sediment was 8 × 10⁹ mol yr−1.The total sink of N due to plant up take was 7 × 10⁹ mol yr−1. There-fore, the remaining sinks of N by other processes such as denitrifica-tion, anammox activity, advective transport or tidal exchange werefound to be 1 × 10⁹ mol yr−1 which corresponds to 14% of the plant up-take of the Sundarbanmangrove system (4264 km2), and in terms of arearate of loss of Nwas 3 nmol cm−2 h−1 similar to the rate of loss observedfor other mangroves (0–46 nmol cm−2 h−1, mean 6 nmol cm−2 h−1,Alongi, 2009; 2.5–5 nmol cm−2 h−1, Corredor and Morell, 1994; 17–175 nmol cm−2 h−1, Nedwell et al. 1994) due to denitrificationand anammox activity.
The ratio Ds/dz for the 60 cm sediment column (dz) wasfound to be 4.8 cm yr−1 which is greater than pore water advection(U = 0.2–0.3 cm yr−1), indicating that diffusive flux could be pre-dominant in comparison to the advective flux in the sediment.Even though the gentle shelves (1.2–4.0°) of the study area could
a tropical mangrove ecosystem, east coast of India,Mar. Chem. (2014),
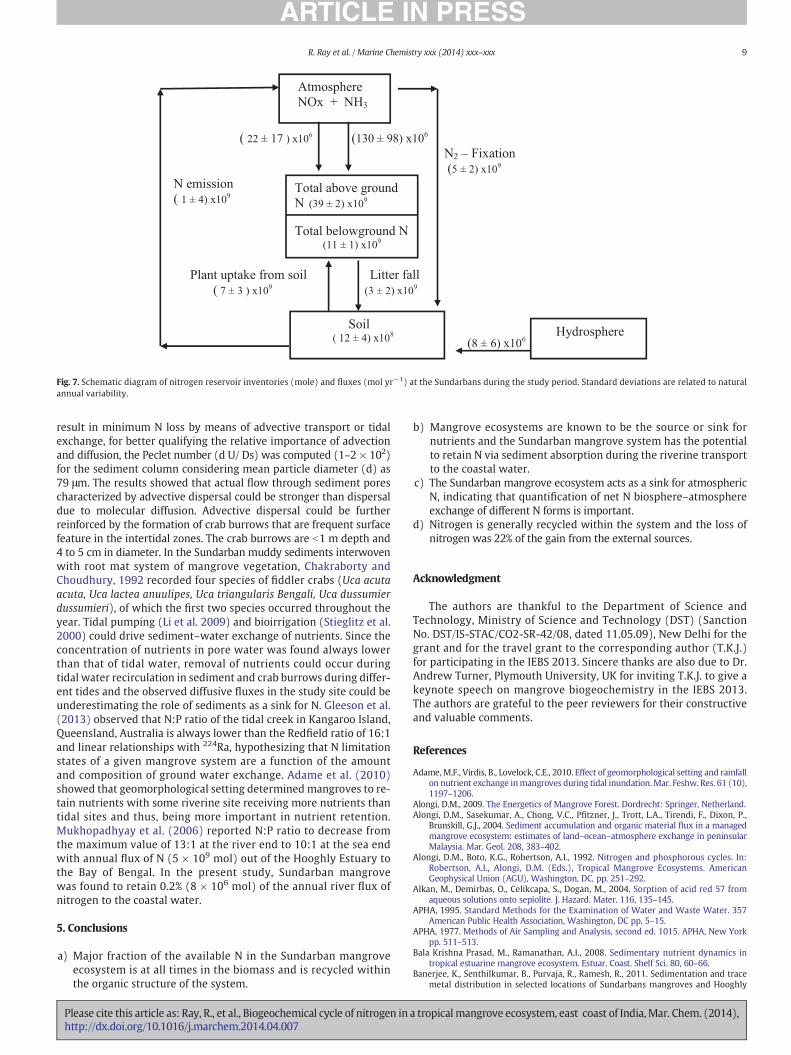
Fig. 7. Schematic diagram of nitrogen reservoir inventories (mole) and fluxes (mol yr−1) at the Sundarbans during the study period. Standard deviations are related to naturalannual variability.
9R. Ray et al. / Marine Chemistry xxx (2014) xxx–xxx
result in minimum N loss by means of advective transport or tidalexchange, for better qualifying the relative importance of advectionand diffusion, the Peclet number (d U/ Ds) was computed (1–2 × 10²)for the sediment column considering mean particle diameter (d) as79 μm. The results showed that actual flow through sediment porescharacterized by advective dispersal could be stronger than dispersaldue to molecular diffusion. Advective dispersal could be furtherreinforced by the formation of crab burrows that are frequent surfacefeature in the intertidal zones. The crab burrows are b1 m depth and4 to 5 cm in diameter. In the Sundarban muddy sediments interwovenwith root mat system of mangrove vegetation, Chakraborty andChoudhury, 1992 recorded four species of fiddler crabs (Uca acutaacuta, Uca lactea anuulipes, Uca triangularis Bengali, Uca dussumierdussumieri), of which the first two species occurred throughout theyear. Tidal pumping (Li et al. 2009) and bioirrigation (Stieglitz et al.2000) could drive sediment–water exchange of nutrients. Since theconcentration of nutrients in pore water was found always lowerthan that of tidal water, removal of nutrients could occur duringtidal water recirculation in sediment and crab burrows during differ-ent tides and the observed diffusive fluxes in the study site could beunderestimating the role of sediments as a sink for N. Gleeson et al.(2013) observed that N:P ratio of the tidal creek in Kangaroo Island,Queensland, Australia is always lower than the Redfield ratio of 16:1and linear relationships with 224Ra, hypothesizing that N limitationstates of a given mangrove system are a function of the amountand composition of ground water exchange. Adame et al. (2010)showed that geomorphological setting determined mangroves to re-tain nutrients with some riverine site receiving more nutrients thantidal sites and thus, being more important in nutrient retention.Mukhopadhyay et al. (2006) reported N:P ratio to decrease fromthe maximum value of 13:1 at the river end to 10:1 at the sea endwith annual flux of N (5 × 10⁹ mol) out of the Hooghly Estuary tothe Bay of Bengal. In the present study, Sundarban mangrovewas found to retain 0.2% (8 × 10⁶ mol) of the annual river flux ofnitrogen to the coastal water.
5. Conclusions
a) Major fraction of the available N in the Sundarban mangroveecosystem is at all times in the biomass and is recycled withinthe organic structure of the system.
Please cite this article as: Ray, R., et al., Biogeochemical cycle of nitrogen inhttp://dx.doi.org/10.1016/j.marchem.2014.04.007
b) Mangrove ecosystems are known to be the source or sink fornutrients and the Sundarban mangrove system has the potentialto retain N via sediment absorption during the riverine transportto the coastal water.
c) The Sundarban mangrove ecosystem acts as a sink for atmosphericN, indicating that quantification of net N biosphere–atmosphereexchange of different N forms is important.
d) Nitrogen is generally recycled within the system and the loss ofnitrogen was 22% of the gain from the external sources.
Acknowledgment
The authors are thankful to the Department of Science andTechnology, Ministry of Science and Technology (DST) (SanctionNo. DST/IS-STAC/CO2-SR-42/08, dated 11.05.09), New Delhi for thegrant and for the travel grant to the corresponding author (T.K.J.)for participating in the IEBS 2013. Sincere thanks are also due to Dr.Andrew Turner, Plymouth University, UK for inviting T.K.J. to give akeynote speech on mangrove biogeochemistry in the IEBS 2013.The authors are grateful to the peer reviewers for their constructiveand valuable comments.
References
Adame,M.F., Virdis, B., Lovelock, C.E., 2010. Effect of geomorphological setting and rainfallon nutrient exchange inmangroves during tidal inundation.Mar. Feshw. Res. 61 (10),1197–1206.
Alongi, D.M., 2009. The Energetics of Mangrove Forest. Dordrecht: Springer, Netherland.Alongi, D.M., Sasekumar, A., Chong, V.C., Pfitzner, J., Trott, L.A., Tirendi, F., Dixon, P.,
Brunskill, G.J., 2004. Sediment accumulation and organic material flux in a managedmangrove ecosystem: estimates of land–ocean–atmosphere exchange in peninsularMalaysia. Mar. Geol. 208, 383–402.
Alongi, D.M., Boto, K.G., Robertson, A.I., 1992. Nitrogen and phosphorous cycles. In:Robertson, A.I., Alongi, D.M. (Eds.), Tropical Mangrove Ecosystems. AmericanGeophysical Union (AGU), Washington, DC, pp. 251–292.
Alkan, M., Demirbas, O., Celikcapa, S., Dogan, M., 2004. Sorption of acid red 57 fromaqueous solutions onto sepiolite. J. Hazard. Mater. 116, 135–145.
APHA, 1995. Standard Methods for the Examination of Water and Waste Water. 357American Public Health Association, Washington, DC pp. 5–15.
APHA, 1977. Methods of Air Sampling and Analysis, second ed. 1015. APHA, New Yorkpp. 511–513.
Bala Krishna Prasad, M., Ramanathan, A.I., 2008. Sedimentary nutrient dynamics intropical estuarine mangrove ecosystem. Estuar. Coast. Shelf Sci. 80, 60–66.
Banerjee, K., Senthilkumar, B., Purvaja, R., Ramesh, R., 2011. Sedimentation and tracemetal distribution in selected locations of Sundarbans mangroves and Hooghly
a tropical mangrove ecosystem, east coast of India,Mar. Chem. (2014),
10 R. Ray et al. / Marine Chemistry xxx (2014) xxx–xxx
estuary, northeast coast of India. Environ. Geochem. Health. http://dx.doi.org/10.1007/s10653-011-9388-0.
Barrett, K., 1998. Oceanic ammonia emissions in the Europe and their trans boundaryfluxes. Atmos. Environ. 32, 381–391.
Berner, R.A., 1980. Early Diagenesis: A Theoretical Approach. Princeton University Press,Princeton.
Bergey's manual of systematic Bacteriology, 2008. 4. Williams and Wilkins, Baltimore.Bergey's manual of systematic Bacteriology, 1984. 3. Williams and Wilkins, Baltimore.Biswas, H., Dey, M., Ganguly, D., De, T.K., Ghosh, S., Jana, T.K., 2010. Comparative
analysis of phytoplankton composition and abundance over a two-decade periodat the land–ocean boundary of a tropical mangrove ecosystem. Estuar. Coasts 33,384–394.
Biswas, H., Mukhopadhyay, S.K., Sen, S., Jana, T.K., 2007. Spatial and temporal patterns ofmethane dynamics in the tropical mangrove dominated estuary, NE coast of Bay ofBengal, India. J. Mar. Syst. 68, 55–64.
Biswas, H., Mukhopadhyay, S.K., De, T.K., Sen, S., Jana, T.K., 2005. Estimation of ammoniaexchange at the land–ocean boundary condition of Sundarban mangrove, northeast coast of Bay of Bengal, India. Atmos. Environ. 39, 4489–4499.
Biswas, H., Mukhopadhyay, S.K., De, T.K., Sen, S., Jana, T.K., 2004. Biogenic control on theair–water carbon dioxide exchange in the Sundarban mangrove environment,northeast coast of Bay of Bengal, India. Limnol. Oceanogr. 49, 95–101.
Boto, K.J., Welligton, J.T., 1984. Soil characteristics and nutrient status in a NorthernAustralian mangrove forest. Estuaries 7, 61–69.
Bowen, H.J.M., 1979. Environmental Chemistry of the Elements. Academic Press, London.Clarke, P.J., 1985. Nitrogen pools and soil characteristics of a temperate estuarine wetland
in eastern Australia. Aquat. Bot. 23, 275–290.Chang, S.C., Jackson, M.L., 1957. Fractionation of soil phosphorus. Soil Sci. 84,
133–144.Chakraborty, S.K., Choudhury, A., 1992. Population ecology of fiddler crabs (Uca spp.) of
the mangrove estuarine complex of Sundarbans, India. Trop. Ecol. 33, 78–88.Christian, G.D., 2001. Analytical Chemistry, 5th edition. Wiley, New York.Corredor, J.E., Morell, J.M., 1994. Nitrate depuration of secondary sewage effluents in
mangrove sediments. Estuaries 17, 295–300.Corredor, J.E., Morell, J.M., Bauza, J., 1999. Atmospheric nitrous oxide fluxes from
mangrove sediments. Mar. Pollut. Bull. 38 (6), 473–478.Devol, A.H., Christensen, J.P., 1993. Benthic fluxes and nitrogen cycling in sediments of the
continental margin of the eastern North Pacific. J. Mar. Res. 51, 345–372.Devol, A.H., 1991. Direct measurement of nitrogen gas fluxes from continental shelf
sediments. Nature 349, 319–321.Dutta, M.K., Chowdhury, C., Jana, T.K., Mukhopadhyay, S.K., 2013. Dynamics and exchange
fluxes of methane in the estuarine mangrove environment of the Sundarbans, NEcoast of India. Atmos. Environ. 77, 631–639.
Eller, A.D., Sparks, J.P., 2006. Predicting leaf-level fluxes of O3 and NO2: the relative roles ofdiffusion and biochemical processes. Plant Cell Environ. 29, 1742–1750.
FAO, 2004. Status and Trends in Mangrove Area Extent Worldwide Forest ResourceAssessment Working Paper. 063, p. 287.
Fiedler, S., Scholich, G.U., Kleber, M., 2003. Innovative electrode design helps to use redoxpotential as a predictor for methane emissions from soils. Commun. Soil Sci. PlantAnal. 34, 481–496.
Fowler, D., Flechard, C., Skiba, U., Coyle, M., Cape, J.N., 1998. The atmospheric budget ofoxidized nitrogen and its role in ozone formation and deposition. New Phytol. 139,11–23.
Galy, V., France-Lanord, C., Beyssac, O., Faure, P., Kudrass, H., Palhol, F., 2007. Efficientorganic carbon burial in the Bengal fan sustained by the Himalayan erosional system.Nature 450, 407–410.
Ganguly, D., Dey, M., Chowdhury, C., Pattnaik, A.A., Sahu, B.K., Jana, T.K., 2011. Coupledmicrometeorological and biological processes on atmospheric CO2 concentrations atthe land–ocean boundary, NE coast of India. Atmos. Environ. 45, 3903–3910.
Ganguly, D., Dey, M., Sen, S., Jana, T.K., 2009. Biosphere–atmosphere exchange of NOx inthe tropical mangrove forest. J. Geophys. Res. 114, G04014. http://dx.doi.org/10.1029/2008JG000852.
Ganguly, D., Dey, M., Mandal, S.K., De, T.K., Jana, T.K., 2008. Energy dynamics and itsimplication to biosphere–atmosphere exchange of CO2, H2O and CH4 in tropicalmangrove forest canopy. Atmos. Environ. 42, 4172–4184.
Gattuso, P., Prakignoulle, M., Wollas,, T.R., 1998. Carbon and carbonate metabolism incoastal aquatic ecosystems. Annu. Rev. Ecol. Evol. Syst. 29, 405–434.
Giri, C., Ochieng, E., Tieszen, L.L., Zhu, Z., Singh, A., Loveland, T., Masek, J., Duke, N., 2011.Status and distribution of mangrove forests of the world using earth observationsatellite data. Glob. Ecol. Biogeogr. 20, 154–159.
Gleeson, J., Santos, I.R., Maher, D.T., Golsby-Smith, L., 2013. Ground water–surface waterexchange in a mangrove tidal creek: evidence from natural geochemical tracersand implications for nutrient budgets. Mar. Chem. 156, 27–37.
Golder, D.G., 1972. Relations among stability parameters in the surface layer. Boun-Lay.Meteorol. 3, 47–58.
Grasshoff, K., 1983. Determination of salinity and oxygen, determination of nutrients. In:Grasshoff, K., Ehrhard, M., Kremling, K. (Eds.), Methods of Seawater Analysis. VerlagChemie, Weinheim and New York, pp. 31–125.
Hicks, B.B., 1989. Regional extrapolation: vegetation-atmosphere approach. In: Andreae,M.O., Schimel, D.S. (Eds.), Exchange of Trace Gases Between Terrestrial Ecosystemsand the Atmosphere. John Wiley and Sons, New York, pp. 109–118.
Holguin, G., Vazavez, P., Bahon, Y., 2001. The role of sediment microorganism in theproductivity, conservation and rehabilation of mangrove ecosystems: an overview.Biol. Fertil. Soils 33, 265–278.
Howarth, R.W., Marino, R., 2006. Nitrogen as the limiting nutrient for eutrophication incoastal marine ecosystems: evolving views over three decades. Limnol. Oceanogr.51, 364–376.
Please cite this article as: Ray, R., et al., Biogeochemical cycle of nitrogen inhttp://dx.doi.org/10.1016/j.marchem.2014.04.007
Howarth, R.W., 1988. Nutrient limitation of net primary production inmarine ecosystems.Ann. Rev. Ecol. 19, 89–110.
Hussein, M.Z., 1995. Silviculture of mangroves. Unasylva 46, 36–42.Iversen, N., Jorgensen, B.B., 1993. Diffusion coefficients of sulphate andmethane inmarine
sediments: influence of porosity. Geochim. Cosmochim. Acta 57, 571–578.Kelleher, G., Bleakley, C., Wells, S., 1995. A Global Representative System of Marine
Protected Areas. 1. World Bank, Washington DC.Knab, N.J., Cragg, B.A., Hornibrook, E.R.C., Holmkvist, L., Pancost, R.D., Borowski, C., Parkes,
R.J., Jørgensen, B.B., 2009. Regulation of anaerobic methane oxidation in sediments ofthe Black Sea. Biogeosciences 6, 1505–1518.
Kristensen, E., Jensen, M.H., Banta, G.T., Hansen, K., Holmer, M., King, G.M., 1998.Transformation and transport of inorganic nitrogen in sediments of a southeastAsian mangrove forest. Aquat. Microb. Ecol. 15, 165–175.
Li, X., Hu, B.X., Burnett, W.C., Santos, I.R., Chanton, J.P., 2009. Submarine groundwaterdischarge driven by tidal pumping in a heterogeneous aquifer. Ground Water 47(4), 558–568.
Lerman, A., 1979. Geochemical Processes Water and Sediment Environment. John Wileyand Sons, Inc., New York.
Lovelock, C.E., Feller, I.C., Ball, M.C., Ellis, J., Sorrell, B., 2007. Testing the growth rate versusgeochemical hypothesis for latitudinal variation in plant nutrients. Ecol. Lett. 10,1154–1163.
Lovelock, C.E., Feller, I.C., Mc Kee, K.L., Thompson, R., 2005. Variation in mangrove foreststructure and sediment characteristics in Bolas del Toro, Panama. Caribb. J. Sci. 41,456–464.
Meyer, R.L., Nils, R.P., Allen, D.E., 2005. Correlation between anammox activity andmicroscale distribution of nitrite in a subtropical mangrove sediment. Appl. Environ.Microbiol. 71, 6142–6149.
Mitch, W.J., Gosselink, J.G., 1993. Wetlands, second ed. Van Norstrand Reinhold,New York.
Mukhopadhyay, S.K., Biswas, H., De, T.K., Jana, T.K., 2006. Fluxes of nutrients from thetropical River Hooghly at the land–ocean boundary of Sundarbans, NE Coast of Bayof Bengal, India. J. Mar. Syst. 62, 9–21.
Mumby, P.J., Edwards, A.J., Arias-González, J.E., Lindeman, K.C., Blackwell, P.G., Gall, A.,Gorczynska, M.I., Harborne, A.R., Pescod, C.L., Renken, H., Wabnitz, C.C.C., Llewellyn,G., 2004. Mangroves enhance the biomass of coral reef fish communities in theCaribbean. Nature 427, 533–536.
Naidoo, G., 2009. Differential effects of nitrogen and phosphorus enrichment on growth ofdwarf Avicennia marina mangroves. Aquat. Bot. 90, 184–190.
Nedwell, D.B., Blackburn, T.H., Wiebe, W.J., 1994. Dynamic nature of the turnover oforganic carbon, nitrogen and sulphur in the sediments of a Jamaicanmangrove forest.Mar. Ecol. Prog. Ser. 110, 223–231.
Nosrati, R., Owlia, P., Saderi, H., Olamaee, M., Rasooli, I., Akhavian, T.A., 2012. Correlationbetween nitrogen fixation rate and alginate productivity of an indigenous Azotobactervinelandii from Iran. Iran. J. Microbiol. 4 (3), 153–159.
Odum, E.P., 1971. Fundamentals of Ecology, Third Edition. W. B. Saunders Company,London.
Panofsky, H.A., Dutton, J.A., 1984. Atmospheric Turbulence: Models and Methods forEngineering Applications. Wiley, New York.
Plate, E.J., 1971. Aerodynamic characteristics of atmospheric boundary layers. AEC Crit.Rev. Ser., TID-15465. Technical information Center, Department of Energy, USA.
Pernetta, J.C., 1993. Mangrove Forests, Climate Change and Sea Level Rise: HydrologicalInfluences on Community Structure and Survival, With Examples From theIndo-West Pacific. IUCNMarine and Coastal Program. The world conservation Union.
Piper, C.S., 1950. Soil and Plant Analysis. Inter Science Publishers, New York.Primavera, J.H., 1997. Socio-economic impacts of shrimp culture. Aquat. Res. 28, 815–827.Pruppacher, H.R., Klett, J.D., 1978. Microphysics of Clouds and Precipitation. Kluwer
Academic Publishers, Netherlands.Rajkumar, K., Ramanathan, A.L., Behera, P.N., 2012. Characterization of clay minerals
in the Sunda, Mangrove River sediments by SEM/EDS. J. Geol. Soc. India 80,429–434.
Ray, R., Chowdhury, C., Majumder, N., Dutta, M.K., Mukhopadhyay, S.K., Jana, T.K., 2013.Improved model calculation of atmospheric CO2 increment in affecting carbonstock of tropical mangrove forest. Tellus B. 65, 18981, http://dx.doi.org/10.3402/tellusb.v65i0.18981.
Ray, R., Ganguly, D., Chowdhury, C., Dey, M., Das, S., Dutta, M.K., Mandal, S.K., Majumder,N., De, T.K., Mukhopadhyay, S.K., Jana, T.K., 2011. Carbon sequestration and annualincrease of carbon stock in a mangrove forest. Atmos. Environ. 45, 5016–5024.
Ramanathan, A.L., Singh, G., Majumder, J., Samal, A.C., Chowhan, R., Rayan, R.K.,Roykumar, K., Santra, S.C., 2008. A study of microbial diversity and its interactionwith nutrients in the sediments of Sundarban mangroves. Ind. J. Mar. Sci. 37 (2),159–165.
Ramos, E., Silva, C.A., Oliveira, S.R., Rego, R.D.P., Mozeto, A.A., 2007. Dynamics ofphosphorus and nitrogen through litter fall and decomposition in a tropicalmangrove forest. Mar. Environ. Res. 64, 524–534.
Rivera-Monroy, V.H., Twilley, R.R., 1996. The relative role of denitrification andimmobilization in the fate of inorganic nitrogen in mangrove sediments (TerminosLagoon, Mexico). Limnol. Oceanogr. 41, 284–296.
Riley, R.H., Peter, M., Vitousek, P.M., 1995. Nutrient dynamics and nitrogen trace gas fluxduring ecosystem development in montane rain forest. Ecology 76 (1), 292–304.
Ronnback, P., 1999. The ecological basis for economic value of seafood productionsupported by mangrove ecosystems. Ecol. Econ. 29, 235–252.
Rumi, F., Hiroshi, O., Toshi, N., Isao, K., 1998. Direct determination of Carbon and Nitrogencontents of natural bacterial assemblages in marine environments. Appl. Environ.Microbiol. 64, 3352–3358.
Schjoerring, J.K., Husted, S., Mattsson, M., 1998. Physiological parameters controlling plantatmosphere ammonia exchange. Atmos. Environ. 32, 507–512.
a tropical mangrove ecosystem, east coast of India,Mar. Chem. (2014),
11R. Ray et al. / Marine Chemistry xxx (2014) xxx–xxx
Sharrow, S.H., Ismail, S., 2004. Carbon and nitrogen storage in agroforests, tree plantations,and pastures in western Oregon, USA. Agrofor. Syst. 60, 123–130.
Spalding, M., Blasco, F., Field, C., 1997. World Mangrove Atlas. International Society forMangrove Ecosystems, Okinawa.
Stieglitz, T., Ridd, P., Muller, P., 2000. Passive irrigation and functional morphology ofcrustacean burrows in a tropical mangrove swamp. Hydrobiologia 421, 69–76.
Sutton, M.A., Schjorring, J.K., Wyers, G.P., 1995. Plant atmosphere exchange of ammonia.Physiol. Trans. Roy. Soc. Lond. Ser. A 351, 261–278.
Sutton, M.A., Nemitz, E., Erisman, J.W., Beier, C., Butterbach Bahl, K., Cellier, P., de Vries,W.,Cotrufo, F., Skiba, U., Di Marco, C., Jones, S., Laville, P., Soussana, J.F., Loubet, B., Twigg,M., Famulari, D.,Whitehead, J., Gallagher,M.W., Neftel, A., Flechard, C.R., Herrmann, B.,Calanca, P.L., Schjoerring, J.K., Daemmgen, U., Horvath, L., Tang, Y.S., Emmett, B.A.,Tietema, A., Peñuelas, J., Kesik, M., Brueggemann, N., Pilegaard, K., Vesala, T.,Campbell, C.L., Olesen, J.E., Dragosits, U., Theobald, M.R., Levy, P., Mobbs, D.C., Milne,R., Viovy, N., Vuichard, N., Smith, J.U., Smith, P., Bergamaschi, P., Fowler, D., Reis, S.,2007. Challenges in quantifying biosphere–atmosphere exchange of nitrogen species.Environ. Pollut. 150, 125–139. http://dx.doi.org/10.1016/j.envpol.2007.04.014.
Takahashi, M., Higaki, A., Nohno, M., Kamada, M., Okamura, Y., Matsui, K., Kitani, S.,Morikawa, H., 2005. Differential assimilation of nitrogen dioxide by 70 taxa ofroadside trees at an urban pollution level. Chemosphere 61, 633–639.
Terchunian, A., Klemas, V., Alvarez, A., Vasconez, B., Guerro, L., 1986. Mangrove map-ping in Ecuador: the impact of shrimp pond construction. Environ. Manag. 10,345–350.
Please cite this article as: Ray, R., et al., Biogeochemical cycle of nitrogen inhttp://dx.doi.org/10.1016/j.marchem.2014.04.007
Thorsten, D., José, L.R., 2001. Do mangroves rather than rivers provide nutrients tocoastal environments south of the Amazon River? Evidence from long-term fluxmeasurements. Mar. Ecol. Prog. Ser. 213, 67–77.
Twilley, R.R., Lugo, A.E., Patterson-Zucca, C., 1986. Litter production and turnover in basinmangrove forests in southwest Florida. Ecology 67, 670–683.
Valiela, I., Bowen, J.L., York, J.K., 2001. Mangrove forests: one of the world's threatenedmajor tropical environments. Bioscience 51, 807–815.
Vischer, P.T., Beukema, J., van Gemerden, H., 1991. In situ characterization of sediments:measurements of oxygen and sulfideprofileswith a novel combinedneedle electrode.Limnol. Oceanogr. 36, 1476–1480.
Whittingham, M.J., Stephens, P.A., Bradbury, R.B., Freckleton, R.P., 2006. Why do we stilluse stepwise modeling in ecology and behavior? J. Anim. Ecol. 75, 1182–1189.
Williams, E.J., Parrish, D.D., Buhr, M.P., Fehsenfeld, F.C., Fall, R., 1988. Measurement of soilNOx emissions in central Pennsylvania. J. Geophys. Res. 93, 9539–9546. http://dx.doi.org/10.1029/JD093iD08p09539.
Wesely, M.L., Hicks, B.B., 1977. Some factors that affect the deposition rates of sulfurdioxide and similar gases on vegetation. J. Air Pollut. Control Assoc. 27, 1110–1116.
Wolanski, E., 1992. Hydrodynamics of tropical coastal marine systems. In: Connell,D., Hawker, D. (Eds.), Pollution in Tropical Aquatic Systems. CRC, Boca Raton,pp. 3–27.
Yang, Y.S., Guo, J., Chen, G., Xie, J., Gao, R., Li, Z., Jin, Z., 2005. Carbon and nitrogen pools inChinese fir and evergreen broadleaved forests and changes associated with fellingand burning in mid-subtropical China. Forest Ecol. Manag. 216, 216–226.
a tropical mangrove ecosystem, east coast of India,Mar. Chem. (2014),