A modelling study of a non-concerted hydrolytic cycloaddition reaction by the catalytic antibody H11

Bioresource Technology 186 (2015) 261–269
Contents lists available at ScienceDirect
Bioresource Technology
journal homepage: www.elsevier .com/locate /bior tech
Biogas production from brewery spent grain enhancedby bioaugmentation with hydrolytic anaerobic bacteria
http://dx.doi.org/10.1016/j.biortech.2015.03.0290960-8524/� 2015 Elsevier Ltd. All rights reserved.
⇑ Corresponding author. Tel./fax: +386 13203 849.E-mail address: [email protected] (R. Marinšek Logar).
Maša Cater a, Lijana Fanedl a, Špela Malovrh b, Romana Marinšek Logar a,⇑a Division of Microbiology and Microbial Biotechnology, Department of Animal Science, Biotechnical Faculty, University of Ljubljana, Groblje 3, 1230 Domzale, Sloveniab Division of Animal Breeding Sciences, Department of Animal Science, Biotechnical Faculty, University of Ljubljana, Groblje 3, 1230 Domzale, Slovenia
h i g h l i g h t s
� The impact of bioaugmentation on methane production from spent grain was examined.� Methane production elevated for 17.8% with P. xylanivorans Mz5T bioaugmentation.� Bioaugmentation enhances the hydrolysis of brewery spent grain.� Changes in bacterial and archaeal communities were detected during biogas process.� Bioaugmentation enables successful biogas production from brewery spent grain.
a r t i c l e i n f o
Article history:Received 10 January 2015Received in revised form 4 March 2015Accepted 5 March 2015Available online 20 March 2015
Keywords:Brewery spent grainLignocelluloseBiogas productionBioaugmentationHydrolytic bacteria
a b s t r a c t
Lignocellulosic substrates are widely available but not easily applied in biogas production due to theirpoor anaerobic degradation. The effect of bioaugmentation by anaerobic hydrolytic bacteria on biogasproduction was determined by the biochemical methane potential assay. Microbial biomass from fullscale upflow anaerobic sludge blanket reactor treating brewery wastewater was a source of activemicroorganisms and brewery spent grain a model lignocellulosic substrate. Ruminococcus flavefaciens007C, Pseudobutyrivibrio xylanivorans Mz5T, Fibrobacter succinogenes S85 and Clostridium cellulovoransas pure and mixed cultures were used to enhance the lignocellulose degradation and elevate the biogasproduction. P. xylanivorans Mz5T was the most successful in elevating methane production (+17.8%),followed by the coculture of P. xylanivorans Mz5T and F. succinogenes S85 (+6.9%) and the coculture ofC. cellulovorans and F. succinogenes S85 (+4.9%). Changes in microbial community structure were detectedby fingerprinting techniques.
� 2015 Elsevier Ltd. All rights reserved.
1. Introduction
To reduce organic wastes, greenhouse gas emissions and to pro-duce methane as an alternative energy source, anaerobic digestionof continuously generated organic waste is an excellent choice andan environmentally friendly technology. Energy crops, harvestingresidues, manure, household waste, wood industry waste andbrewery waste are examples of potentially useful lignocellulosicsubstrates (LCS). Lignocellulose is the most abundant renewableresource in the world, widely available and cheap, but itshydrolysis is usually incomplete due to its complex structure.
Cellulose and hemicellulose solubilization is the rate-limitingstep in the anaerobic digestion of LCS used for biogas production.Lignin degradation is poor, toxic digestion intermediates are
produced and crystalline cellulose is very structurally stable.Therefore the biogas production is frequently not efficient enoughwithout additional substrate treatment before or during the biogasproduction process. Physico-chemical pretreatments, whichproved to be effective in particle size reduction, crystallinestructure disruption and enhancing anaerobic digestion of LCS(Hendriks and Zeeman, 2009), demand high energy inputs andapplication of aggressive chemicals and are environmentallyunfriendly and economically unsuitable. There have been manyattempts to enhance lignocellulose biodegradability by biologicalmeans where anaerobic bacteria, wood degrading fungi, actinomy-cetes or enzymes that selectively degrade lignin, cellulose andhemicellulose are added (Cater et al., 2014).
In cellulolytic rumen bacteria, highly active cellulolytic andhemicellulolytic enzymes are combined in extracellular multien-zyme complexes, cellulosomes (Fontes and Gilbert, 2010). Rumenbacteria are often used as an inoculum for biogas reactors for
262 M. Cater et al. / Bioresource Technology 186 (2015) 261–269
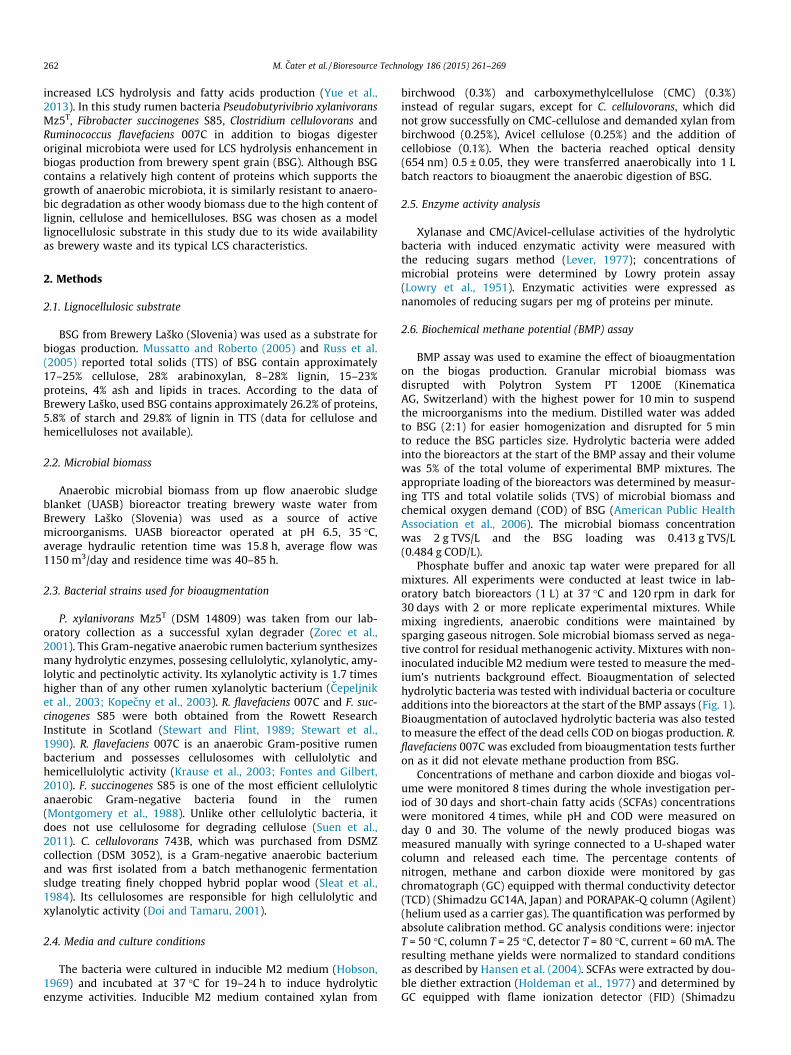
increased LCS hydrolysis and fatty acids production (Yue et al.,2013). In this study rumen bacteria Pseudobutyrivibrio xylanivoransMz5T, Fibrobacter succinogenes S85, Clostridium cellulovorans andRuminococcus flavefaciens 007C in addition to biogas digesteroriginal microbiota were used for LCS hydrolysis enhancement inbiogas production from brewery spent grain (BSG). Although BSGcontains a relatively high content of proteins which supports thegrowth of anaerobic microbiota, it is similarly resistant to anaero-bic degradation as other woody biomass due to the high content oflignin, cellulose and hemicelluloses. BSG was chosen as a modellignocellulosic substrate in this study due to its wide availabilityas brewery waste and its typical LCS characteristics.
2. Methods
2.1. Lignocellulosic substrate
BSG from Brewery Laško (Slovenia) was used as a substrate forbiogas production. Mussatto and Roberto (2005) and Russ et al.(2005) reported total solids (TTS) of BSG contain approximately17–25% cellulose, 28% arabinoxylan, 8–28% lignin, 15–23%proteins, 4% ash and lipids in traces. According to the data ofBrewery Laško, used BSG contains approximately 26.2% of proteins,5.8% of starch and 29.8% of lignin in TTS (data for cellulose andhemicelluloses not available).
2.2. Microbial biomass
Anaerobic microbial biomass from up flow anaerobic sludgeblanket (UASB) bioreactor treating brewery waste water fromBrewery Laško (Slovenia) was used as a source of activemicroorganisms. UASB bioreactor operated at pH 6.5, 35 �C,average hydraulic retention time was 15.8 h, average flow was1150 m3/day and residence time was 40–85 h.
2.3. Bacterial strains used for bioaugmentation
P. xylanivorans Mz5T (DSM 14809) was taken from our lab-oratory collection as a successful xylan degrader (Zorec et al.,2001). This Gram-negative anaerobic rumen bacterium synthesizesmany hydrolytic enzymes, possesing cellulolytic, xylanolytic, amy-lolytic and pectinolytic activity. Its xylanolytic activity is 1.7 timeshigher than of any other rumen xylanolytic bacterium (Cepeljniket al., 2003; Kopecny et al., 2003). R. flavefaciens 007C and F. suc-cinogenes S85 were both obtained from the Rowett ResearchInstitute in Scotland (Stewart and Flint, 1989; Stewart et al.,1990). R. flavefaciens 007C is an anaerobic Gram-positive rumenbacterium and possesses cellulosomes with cellulolytic andhemicellulolytic activity (Krause et al., 2003; Fontes and Gilbert,2010). F. succinogenes S85 is one of the most efficient cellulolyticanaerobic Gram-negative bacteria found in the rumen(Montgomery et al., 1988). Unlike other cellulolytic bacteria, itdoes not use cellulosome for degrading cellulose (Suen et al.,2011). C. cellulovorans 743B, which was purchased from DSMZcollection (DSM 3052), is a Gram-negative anaerobic bacteriumand was first isolated from a batch methanogenic fermentationsludge treating finely chopped hybrid poplar wood (Sleat et al.,1984). Its cellulosomes are responsible for high cellulolytic andxylanolytic activity (Doi and Tamaru, 2001).
2.4. Media and culture conditions
The bacteria were cultured in inducible M2 medium (Hobson,1969) and incubated at 37 �C for 19–24 h to induce hydrolyticenzyme activities. Inducible M2 medium contained xylan from
birchwood (0.3%) and carboxymethylcellulose (CMC) (0.3%)instead of regular sugars, except for C. cellulovorans, which didnot grow successfully on CMC-cellulose and demanded xylan frombirchwood (0.25%), Avicel cellulose (0.25%) and the addition ofcellobiose (0.1%). When the bacteria reached optical density(654 nm) 0.5 ± 0.05, they were transferred anaerobically into 1 Lbatch reactors to bioaugment the anaerobic digestion of BSG.
2.5. Enzyme activity analysis
Xylanase and CMC/Avicel-cellulase activities of the hydrolyticbacteria with induced enzymatic activity were measured withthe reducing sugars method (Lever, 1977); concentrations ofmicrobial proteins were determined by Lowry protein assay(Lowry et al., 1951). Enzymatic activities were expressed asnanomoles of reducing sugars per mg of proteins per minute.
2.6. Biochemical methane potential (BMP) assay
BMP assay was used to examine the effect of bioaugmentationon the biogas production. Granular microbial biomass wasdisrupted with Polytron System PT 1200E (KinematicaAG, Switzerland) with the highest power for 10 min to suspendthe microorganisms into the medium. Distilled water was addedto BSG (2:1) for easier homogenization and disrupted for 5 minto reduce the BSG particles size. Hydrolytic bacteria were addedinto the bioreactors at the start of the BMP assay and their volumewas 5% of the total volume of experimental BMP mixtures. Theappropriate loading of the bioreactors was determined by measur-ing TTS and total volatile solids (TVS) of microbial biomass andchemical oxygen demand (COD) of BSG (American Public HealthAssociation et al., 2006). The microbial biomass concentrationwas 2 g TVS/L and the BSG loading was 0.413 g TVS/L(0.484 g COD/L).
Phosphate buffer and anoxic tap water were prepared for allmixtures. All experiments were conducted at least twice in lab-oratory batch bioreactors (1 L) at 37 �C and 120 rpm in dark for30 days with 2 or more replicate experimental mixtures. Whilemixing ingredients, anaerobic conditions were maintained bysparging gaseous nitrogen. Sole microbial biomass served as nega-tive control for residual methanogenic activity. Mixtures with non-inoculated inducible M2 medium were tested to measure the med-ium’s nutrients background effect. Bioaugmentation of selectedhydrolytic bacteria was tested with individual bacteria or cocultureadditions into the bioreactors at the start of the BMP assays (Fig. 1).Bioaugmentation of autoclaved hydrolytic bacteria was also testedto measure the effect of the dead cells COD on biogas production. R.flavefaciens 007C was excluded from bioaugmentation tests furtheron as it did not elevate methane production from BSG.
Concentrations of methane and carbon dioxide and biogas vol-ume were monitored 8 times during the whole investigation per-iod of 30 days and short-chain fatty acids (SCFAs) concentrationswere monitored 4 times, while pH and COD were measured onday 0 and 30. The volume of the newly produced biogas wasmeasured manually with syringe connected to a U-shaped watercolumn and released each time. The percentage contents ofnitrogen, methane and carbon dioxide were monitored by gaschromatograph (GC) equipped with thermal conductivity detector(TCD) (Shimadzu GC14A, Japan) and PORAPAK-Q column (Agilent)(helium used as a carrier gas). The quantification was performed byabsolute calibration method. GC analysis conditions were: injectorT = 50 �C, column T = 25 �C, detector T = 80 �C, current = 60 mA. Theresulting methane yields were normalized to standard conditionsas described by Hansen et al. (2004). SCFAs were extracted by dou-ble diether extraction (Holdeman et al., 1977) and determined byGC equipped with flame ionization detector (FID) (Shimadzu

Fig. 1. Experimental set-up for BMP assays. NC – negative control, Stand. – standard bioreactor, BSG – brewery spent grain, medium 1 – medium containing xylan and CMCcellulose, medium 2 – medium containing xylan, Avicel cellulose and cellobiose, M – P. xylanivorans Mz5T, C – C. cellulovorans, F – F. succinogenes S85, R – R. flavefaciens 007C.
M. Cater et al. / Bioresource Technology 186 (2015) 261–269 263
GC14A, Japan) and DB-WAXetr column (Agilent). GC analysis con-ditions were: injector T = 160 �C, detector T = 210 �C, initialT = 90 �C, initial time = 4 min, final T = 160 �C, final time = 2 min, Tprogram = 15 �C/min. Helium was used as a carrier gas and quan-tification was performed by an internal standard method (crotonicacid, 100 mg/ml).
2.7. Analyses of microbial community shifts
Terminal restriction fragment length polymorphism (T-RFLP)was applied to study the changes in the microbial compositionon day 0 and day 30. T-RFLP is one of the most powerfulfingerprinting techniques, because it allows high samplethroughput, precise fragment length determination and providesmore comprehensive examination of the microbial communitycomposition. Additional analysis of denaturing gradient gelelectrophoresis (DGGE) profiles was used only to sharpen up theunderstanding of bioaugmentation. Dynamics of the bacterialcommunity in the bioaugmented bioreactors with P. xylanivoransMz5T or C. cellulovorans individually were tracked by DGGE onday 3, 6 and 10 to gain more knowledge about their persistencein the bioreactors during the first days of BMP assays.
Samples were first centrifuged at 3200 rpm for 5 min; theprecipitated biomass was dried at 45 �C over night and frozen forfurther analyses. Total genomic DNA was extracted from 150 mgof dried samples using PowerSoil DNA Isolation Kit (MO-BIOLaboratories, Inc., Carlsbad, USA) according to the manufacturer’sinstructions. DNA from pure cultures of bacteria forbioaugmentation was extracted separately by a common methodusing proteinase K, CTAB/NaCl and phenol/chloroform.
2.8. T-RFLP
Primers used in PCR amplification of bacterial 16S rRNA genewere fD1 (Weisburg et al., 1991) and 926r (Muyzer et al., 1993);
and 109f (Großkopf et al., 1998) and 915r (Peng et al., 2008) forarchaeal 16S rRNA gene. Both forward primers were labeled atthe 50 end with the dye 6-carboxyfluorescein. The PCR protocolwas as follows: initial denaturation at 95 �C for 5 min, 30 cyclesof denaturation at 95 �C for 30 s, annealing at 55 �C for 30 s(bacteria) or at 52 �C for 45 s (archaea) and elongation at 72 �Cfor 1 min, followed by a final extension at 72 �C for 7 min.Amplicons were purified using High Pure PCR ProductPurification Kit (Roche, Switzerland) and quantified using aNanoVue-Plus spectrophotometer (GE Healthcare, UK). Screeningfor appropriate restriction endonuclease was made using HhaI(Thermo Fisher Scientific Inc., USA), BsuRI (HaeIII) (Fermentas,Canada) and MspI (Thermo Fisher Scientific Inc., USA). BsuRI waschosen for further analysis, producing the highest numbers andbest size distribution of the terminal restriction fragments(T-RFs). Amounts of 300 ng of purified PCR products were digestedat 37 �C for 16 h. The restriction enzyme was then inactivated byincubation at 85 �C for 20 min. DNA fragments were purified withthe same kit as mentioned before and 5 ll was mixed with 8 llHiDi formamide and 0,5 ll GeneScan ROX-500 internal sizestandard (Applied Biosystems, USA), and denaturated for 5 min at95 �C. T-RFs were separated by capillary gel electrophoresis onan ABI PRISM 3130xl Genetic Analyser (Applied Biosystems, USA)and electropherograms were analyzed by BioNumerics software5.1 (Applied Maths, Belgium). Pearson’s correlation coefficientwith UPGMA clustering method (Unweighted Pair-Group Methodwith Arithmetic Mean) was used to derive general similarity ofcommunity profiles. The significance of clusters was determinedusing the cluster cut-off tool in BioNumerics.
2.9. DGGE
For PCR amplification of bacterial DNA the primers used wereHDA1 with GC clamps and HDA2 (Walter et al., 2000). The PCR pro-tocol was as follows: initial denaturation at 95 �C for 2 min, 30

Table 1Bacterial cellulolytic and xylanolytic enzyme activities at OD654nm = 0.5.
Bacteria/enzyme activity Xylanase activity(nmol/mg/min)
CMC-cellulase activity(nmol/mg/min)
Avicel-cellulase activity(nmol/mg/min)
Protein concentration(mg/ml)
R. flavefaciens 007C 78.6 4.05 – 6.4P. xylanivorans Mz5T 71.8 1.6 – 6.2F. succinogenes S85 77.6 0.9 – 6.4C. cellulovorans 1.0 1.7 21.6 6.6
Table 2BMP assay results showing the average elevation values of net methane production per g CODinitial for individually added bacteria and bacteria added in cocultures; andparameter estimates for final net methane production per g CODinitial and methane production rate with standard errors (SEE) for experimental mixtures. Legend: BSG – breweryspent grain, medium 1 – medium containing xylan and CMC cellulose, medium 2 – medium containing xylan, Avicel cellulose and cellobiose, M – P. xylanivorans Mz5T, C – C.cellulovorans, F – F. succinogenes S85, R – R. flavefaciens 007C.
Bioreactor Average net methane productionelevation per g CODinitial (%)
Final net methane productionper g CODinitial in ml (K)
SEE Methane productionrate in ml/day (r)
SEE
BSG + medium 1 – 221.84 7.839 0.2262 0.02143BSG + medium 2 – 242.81 7.850 0.2184 0.01865P. xylanivorans Mz5T 17.8 261.31 7.875 0.2084 0.01717F. succinogenes S85 1.9 226.20 7.862 0.2132 0.02010C. cellulovorans 3.9 252.36 7.845 0.2221 0.01917R. flavefaciens 007C �5.6 – – – –M + R �4.2 – – – –M + F 6.9 237.16 7.939 0.1901 0.01702M + C �2.5 226.45 7.874 0.2081 0.01956C + F 4.2 242.01 7.843 0.2230 0.01999
264 M. Cater et al. / Bioresource Technology 186 (2015) 261–269
cycles of denaturation at 95 �C for 30 s, annealing at 58 �C for 30 sand elongation at 72 �C for 30 s, followed by extension at 72 �C. AllPCR products were checked in a 1% agarose gel electrophoresis andthen separated on acrylamide gel with 30–65% denaturing gradient(100% corresponded to 7 M urea and 40% formamide (vol/vol)).DGGE was performed on a DCode universal mutation detectionsystem (Bio-Rad, USA) in 1� TAE buffer at 60 �C for 16 h 30 minat 75 V, 70 mA and 5 W. The gels were stained in a SYBR GoldNucleic Acid Gel Stain (Thermo Fisher Scientific Inc., USA) solutionfor 45 min. Under UV light fluorescing bands were excised byChemi Genius (Syngene, UK) and visualized with computerprogram Gene Snap (Syngene, UK). Gels were normalized to theoutside and middle lane ladder, which was generated in our lab-oratory with equal-volume mixtures of PCR products from 16SrRNA gene of 10 pure cultures, and analyzed by Bio Numerics soft-ware 5.1.
2.10. Statistical analysis
To determine the significance of differences in methaneproduction per g CODinitial of two noninoculated media with BSGand different combinations of added hydrolytic bacteria, the non-linear mixed models methodology was used (Ratkowsky, 1990).The procedure NLMIXED with the Newton–Raphson ridgeoptimization method in statistical package SAS/STAT (SAS Inst.Inc., 2008) was applied. Due to preliminary analyses and practi-cally no lag phase in methane production, the negative exponentialcurve was chosen to describe cumulative methane production perg CODinitial over time. The following statistical model was used:yijk ¼ Ki � ð1� e�ri�tijk Þ þ uij þ eijk, where yijk is observation at timetijk, Ki and ri are curve parameters – final production and produc-tion rate, respectively, e(�) is exponential function, uij is randomsample effect which covers individual variation of four repetitions,while eijk is residual term. Normal distribution was assumed forrandom sample effect and residuals. Maximum likelihoodestimates of the parameters for final production and productionrate were pairwise compared between experimental mixtures.
3. Results and discussion
3.1. Cellulolytic and xylanolytic enzyme activities of applied bacteria
R. flavefaciens 007C and F. succinogenes S85 exhibited thehighest xylanolytic activity among the four tested hydrolytic bac-teria (78.6 and 77.6 nmol/mg/min, respectively) (Table 1). Thehighest CMC-cellulolytic activity was expressed by R. flavefaciens007C (4.05 nmol/mg/min). C. cellulovorans expressed a lowxylanolytic and CMC-cellulolytic activity, but was more successfulin degrading Avicel cellulose (21.6 nmol/mg/min). Comparinghydrolytic bacteria used, the protein concentrations were similarwhat indicates that a comparable quantity of bacterial biomasswas added to BMP assay in all experimental sets.
3.2. Methane production enhancement
The microbial biomass contained approximately 63 g/L of TTSand 55 g/L of TVS, while BSG contained approximately 78 g/L ofTTS, 76 g/L of TVS and 73 gCOD/L (disrupted mixture of 50 g BSGand 90 ml distilled water). The highest elevation of net methaneproduction per g CODinitial has been detected in the experimentalmixtures bioaugmented with P. xylanivorans Mz5T (17.8%), fol-lowed by the coculture of P. xylanivorans Mz5T and F. succinogenesS85 (6.9%) and the coculture of C. cellulovorans and F. succinogenesS85 (4.2%) (Table 2). Bioaugmentation with C. cellulovoransindividually resulted in 3.9% and with F. succinogenes S85 individu-ally in 1.9% elevation of methane production per g CODinitial.Bacteria from genus Clostridium have been proven before toincrease the BMP of LCS as Peng et al. (2014) increased methaneproduction by bioaugmenting wheat straw with C. cellulolyticumand Lü et al. (2013) enhanced methane production frommicroalgae by 17–24% with Clostridium thermocellum. In contraryto F. succinogenes S85 and R. flavefaciens 007C, C. cellulovoransand P. xylanivorans Mz5T both produce hydrogen, apart fromcarbon dioxide and other metabolites (Sleat et al., 1984; Stewartand Flint, 1989; Kopecny et al., 2003; Fontes and Gilbert, 2010),
5556575859606162
Ave
rage
met
hane
con
tent
(%
) on
day
30 o
f BM
P as
say
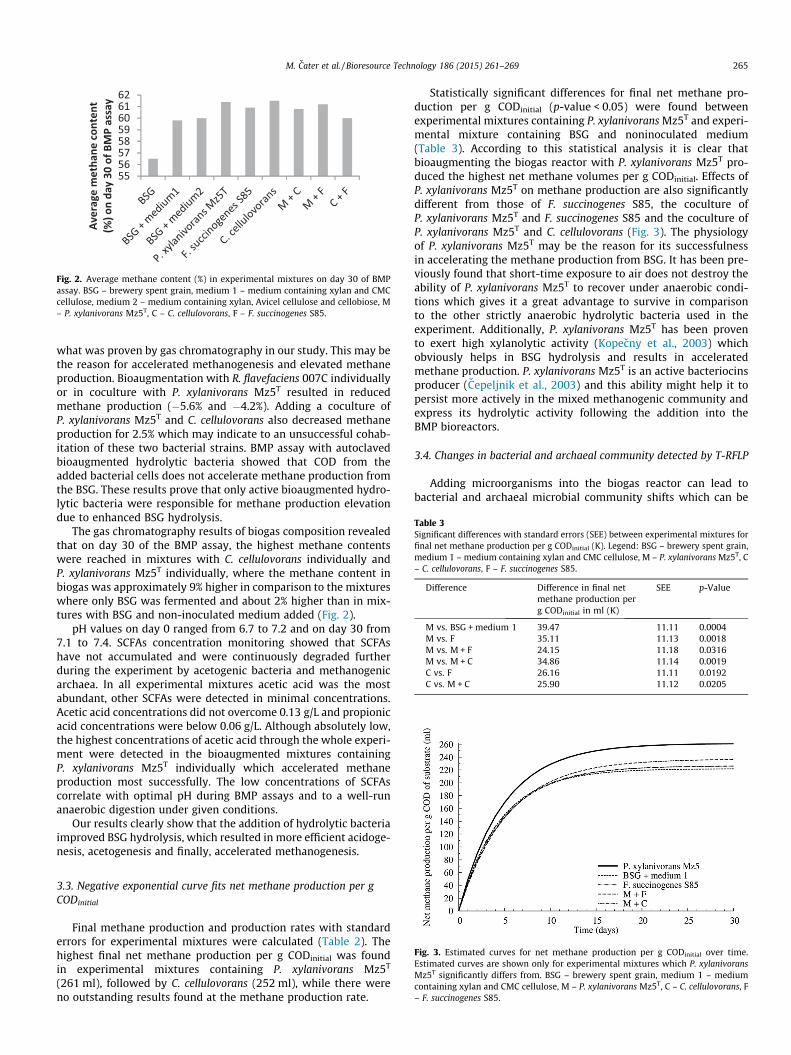
Fig. 2. Average methane content (%) in experimental mixtures on day 30 of BMPassay. BSG – brewery spent grain, medium 1 – medium containing xylan and CMCcellulose, medium 2 – medium containing xylan, Avicel cellulose and cellobiose, M– P. xylanivorans Mz5T, C – C. cellulovorans, F – F. succinogenes S85.
Table 3Significant differences with standard errors (SEE) between experimental mixtures forfinal net methane production per g CODinitial (K). Legend: BSG – brewery spent grain,medium 1 – medium containing xylan and CMC cellulose, M – P. xylanivorans Mz5T, C– C. cellulovorans, F – F. succinogenes S85.
Difference Difference in final netmethane production perg CODinitial in ml (K)
SEE p-Value
M vs. BSG + medium 1 39.47 11.11 0.0004M vs. F 35.11 11.13 0.0018M vs. M + F 24.15 11.18 0.0316M vs. M + C 34.86 11.14 0.0019C vs. F 26.16 11.11 0.0192C vs. M + C 25.90 11.12 0.0205
M. Cater et al. / Bioresource Technology 186 (2015) 261–269 265
what was proven by gas chromatography in our study. This may bethe reason for accelerated methanogenesis and elevated methaneproduction. Bioaugmentation with R. flavefaciens 007C individuallyor in coculture with P. xylanivorans Mz5T resulted in reducedmethane production (�5.6% and �4.2%). Adding a coculture ofP. xylanivorans Mz5T and C. cellulovorans also decreased methaneproduction for 2.5% which may indicate to an unsuccessful cohab-itation of these two bacterial strains. BMP assay with autoclavedbioaugmented hydrolytic bacteria showed that COD from theadded bacterial cells does not accelerate methane production fromthe BSG. These results prove that only active bioaugmented hydro-lytic bacteria were responsible for methane production elevationdue to enhanced BSG hydrolysis.
The gas chromatography results of biogas composition revealedthat on day 30 of the BMP assay, the highest methane contentswere reached in mixtures with C. cellulovorans individually andP. xylanivorans Mz5T individually, where the methane content inbiogas was approximately 9% higher in comparison to the mixtureswhere only BSG was fermented and about 2% higher than in mix-tures with BSG and non-inoculated medium added (Fig. 2).
pH values on day 0 ranged from 6.7 to 7.2 and on day 30 from7.1 to 7.4. SCFAs concentration monitoring showed that SCFAshave not accumulated and were continuously degraded furtherduring the experiment by acetogenic bacteria and methanogenicarchaea. In all experimental mixtures acetic acid was the mostabundant, other SCFAs were detected in minimal concentrations.Acetic acid concentrations did not overcome 0.13 g/L and propionicacid concentrations were below 0.06 g/L. Although absolutely low,the highest concentrations of acetic acid through the whole experi-ment were detected in the bioaugmented mixtures containingP. xylanivorans Mz5T individually which accelerated methaneproduction most successfully. The low concentrations of SCFAscorrelate with optimal pH during BMP assays and to a well-runanaerobic digestion under given conditions.
Our results clearly show that the addition of hydrolytic bacteriaimproved BSG hydrolysis, which resulted in more efficient acidoge-nesis, acetogenesis and finally, accelerated methanogenesis.
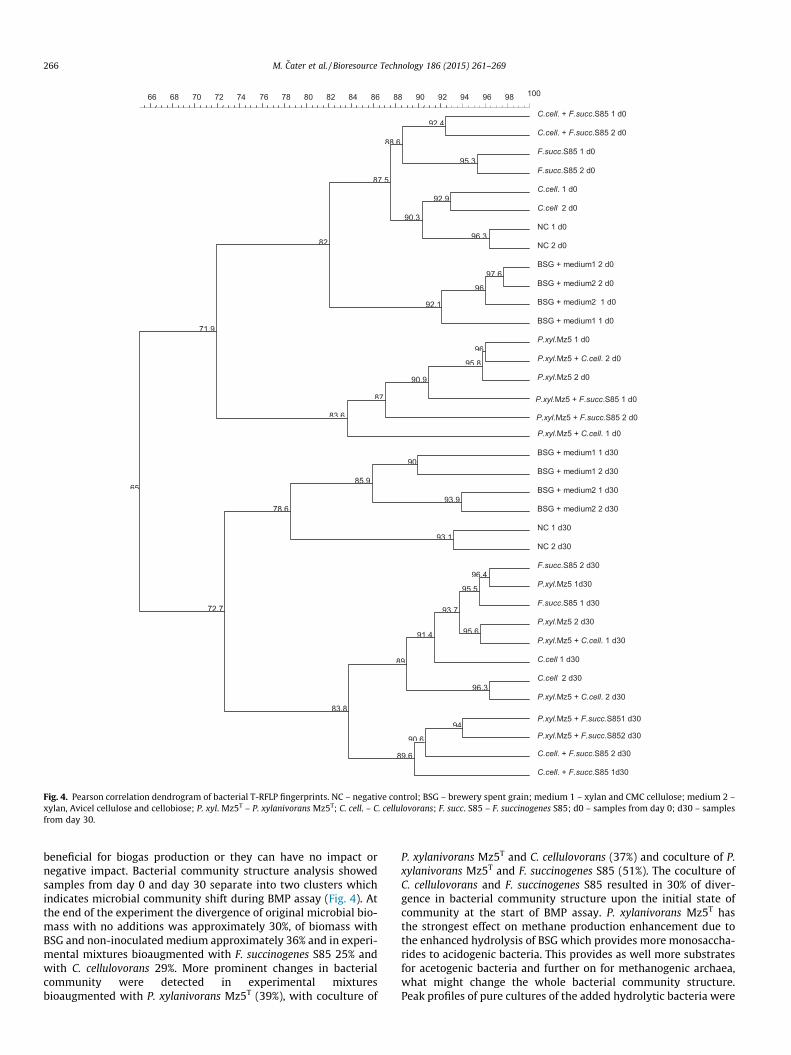
Fig. 3. Estimated curves for net methane production per g CODinitial over time.Estimated curves are shown only for experimental mixtures which P. xylanivoransMz5T significantly differs from. BSG – brewery spent grain, medium 1 – mediumcontaining xylan and CMC cellulose, M – P. xylanivorans Mz5T, C – C. cellulovorans, F– F. succinogenes S85.
3.3. Negative exponential curve fits net methane production per gCODinitial
Final methane production and production rates with standarderrors for experimental mixtures were calculated (Table 2). Thehighest final net methane production per g CODinitial was foundin experimental mixtures containing P. xylanivorans Mz5T
(261 ml), followed by C. cellulovorans (252 ml), while there wereno outstanding results found at the methane production rate.
Statistically significant differences for final net methane pro-duction per g CODinitial (p-value < 0.05) were found betweenexperimental mixtures containing P. xylanivorans Mz5T and experi-mental mixture containing BSG and noninoculated medium(Table 3). According to this statistical analysis it is clear thatbioaugmenting the biogas reactor with P. xylanivorans Mz5T pro-duced the highest net methane volumes per g CODinitial. Effects ofP. xylanivorans Mz5T on methane production are also significantlydifferent from those of F. succinogenes S85, the coculture ofP. xylanivorans Mz5T and F. succinogenes S85 and the coculture ofP. xylanivorans Mz5T and C. cellulovorans (Fig. 3). The physiologyof P. xylanivorans Mz5T may be the reason for its successfulnessin accelerating the methane production from BSG. It has been pre-viously found that short-time exposure to air does not destroy theability of P. xylanivorans Mz5T to recover under anaerobic condi-tions which gives it a great advantage to survive in comparisonto the other strictly anaerobic hydrolytic bacteria used in theexperiment. Additionally, P. xylanivorans Mz5T has been provento exert high xylanolytic activity (Kopecny et al., 2003) whichobviously helps in BSG hydrolysis and results in acceleratedmethane production. P. xylanivorans Mz5T is an active bacteriocinsproducer (Cepeljnik et al., 2003) and this ability might help it topersist more actively in the mixed methanogenic community andexpress its hydrolytic activity following the addition into theBMP bioreactors.
3.4. Changes in bacterial and archaeal community detected by T-RFLP
Adding microorganisms into the biogas reactor can lead tobacterial and archaeal microbial community shifts which can be
65
P.xyl.Mz5 + F.succ.S85 1 d0
P.xyl.Mz5 + F.succ.S85 2 d0
P.xyl.Mz5 + F.succ.S851 d30
P.xyl.Mz5 + F.succ.S852 d30
1009896949290888684828078767472706866
92.4
95.3
88.6
92.9
96.3
90.3
87.5
97.6
96
92.1
82
96
95.8
90.9
87
83.6
71.9
90
93.9
85.9
93.1
78.6
96.4
95.5
95.6
93.7
91.4
96.3
89
94
90.6
89.6
83.8
72.7
C.cell. + F.succ.S85 1 d0
C.cell. + F.succ.S85 2 d0
F.succ.S85 1 d0
F.succ.S85 2 d0
C.cell. 1 d0
C.cell 2 d0
NC 1 d0
NC 2 d0
BSG + medium1 2 d0
BSG + medium2 2 d0
BSG + medium2 1 d0
BSG + medium1 1 d0
P.xyl.Mz5 1 d0
P.xyl.Mz5 + C.cell. 2 d0
P.xyl.Mz5 2 d0
P.xyl.Mz5 + C.cell. 1 d0
BSG + medium1 1 d30
BSG + medium1 2 d30
BSG + medium2 1 d30
BSG + medium2 2 d30
NC 1 d30
NC 2 d30
F.succ.S85 2 d30
P.xyl.Mz5 1d30
F.succ.S85 1 d30
P.xyl.Mz5 2 d30
P.xyl.Mz5 + C.cell. 1 d30
C.cell 1 d30
C.cell 2 d30
P.xyl.Mz5 + C.cell. 2 d30
C.cell. + F.succ.S85 2 d30
C.cell. + F.succ.S85 1d30
Fig. 4. Pearson correlation dendrogram of bacterial T-RFLP fingerprints. NC – negative control; BSG – brewery spent grain; medium 1 – xylan and CMC cellulose; medium 2 –xylan, Avicel cellulose and cellobiose; P. xyl. Mz5T – P. xylanivorans Mz5T; C. cell. – C. cellulovorans; F. succ. S85 – F. succinogenes S85; d0 – samples from day 0; d30 – samplesfrom day 30.
266 M. Cater et al. / Bioresource Technology 186 (2015) 261–269
beneficial for biogas production or they can have no impact ornegative impact. Bacterial community structure analysis showedsamples from day 0 and day 30 separate into two clusters whichindicates microbial community shift during BMP assay (Fig. 4). Atthe end of the experiment the divergence of original microbial bio-mass with no additions was approximately 30%, of biomass withBSG and non-inoculated medium approximately 36% and in experi-mental mixtures bioaugmented with F. succinogenes S85 25% andwith C. cellulovorans 29%. More prominent changes in bacterialcommunity were detected in experimental mixturesbioaugmented with P. xylanivorans Mz5T (39%), with coculture of
P. xylanivorans Mz5T and C. cellulovorans (37%) and coculture of P.xylanivorans Mz5T and F. succinogenes S85 (51%). The coculture ofC. cellulovorans and F. succinogenes S85 resulted in 30% of diver-gence in bacterial community structure upon the initial state ofcommunity at the start of BMP assay. P. xylanivorans Mz5T hasthe strongest effect on methane production enhancement due tothe enhanced hydrolysis of BSG which provides more monosaccha-rides to acidogenic bacteria. This provides as well more substratesfor acetogenic bacteria and further on for methanogenic archaea,what might change the whole bacterial community structure.Peak profiles of pure cultures of the added hydrolytic bacteria were

55.7
F. succ. S85 2 d30
F. succ. S85 1 d30
BSG+medium1 1 d0
BSG+medium1 2 d0
F. succ. S85 1 d0
BSG+medium2 1 d0
BSG+medium2 2 d0
F. succ. S85 2 d0
1009590858075706560
99.398.4
99.298.6
98.6
96.7
96.1
97.6
98.1
96.6
97.9
96.2
93.3
98.7
99
98.4
98.1
97.7
99.2
97.4
97.8
96.1
99.799.3
98.5
98.2
97.8
9998.5
98.3
96.9
94.9
79.6
90.3
P.xyl. Mz5 1 d30
P.xyl. Mz5 2 d30
NC 1 d30
NC 2 d30
NC 1 d0
NC 2 d0
C. cell. 1 d0
P.xyl. Mz5 2 d0
P.xyl. Mz5 1 d0
C. cell. 2 d0
C. cell. 1 d30
C. cell.+F. succ. S85 1 d30
C. cell.+F. succ. S85 2 d30
P.xyl. Mz5+C. cell. 2 d30
P.xyl. Mz5+C. cell. 1 d30
P.xyl. Mz5+F. succ. S85 1 d30
P.xyl. Mz5+F. succ. S85 2 d30
BSG+medium2 2 d30
BSG+medium2 1 d30
C. cell.+F. succ S85 1 d0
C. cell.+F. succ S85 2 d0
P.xyl. Mz5+C. cell 2 d0
BSG+medium1 1 d30
BSG+medium1 2 d30
P.xyl. Mz5+F. succ. S85 1 d0
P.xyl. Mz5+F. succ. S85 2 d0
P.xyl. Mz5+C. cell 1 d0
C. cell. 2 d30
Fig. 5. Pearson correlation dendrogram of archaeal T-RFLP fingerprints. NC – negative control; BSG- brewery spent grain; medium 1 – xylan and CMC cellulose; medium 2 –xylan, Avicel cellulose and cellobiose; P. xyl. Mz5T – P. xylanivorans Mz5T; C. cell. – C. cellulovorans; F. succ. S85 – F. succinogenes S85; d0 – samples from day 0; d30 – samplesfrom day 30.
M. Cater et al. / Bioresource Technology 186 (2015) 261–269 267
located using PCR products of extracted DNA, digested by BsuRI. Asthe T-RFLP profiles of 16S rRNA amplicons of pure cultures resultedin few peaks, we analyzed the samples also with DGGE techniqueto monitor the presence of the added bacteria during BMP assay.
Archaeal community structure analysis results also divided intotwo clusters for day 0 and day 30 (Fig. 5). The divergence wasapproximately 20% in most of the samples, except for mixtureswhere C. cellulovorans was added. This correlates to the fact thatarchaeal community in methanogenic sludge is much smallerand less diverse than bacterial (Zakrzewski et al., 2012). Archaealcommunity does not change that much as bacteria during biogasproduction process as archaea conduct only the last step of biogasprocess, methanogenesis, and grow slowly due to the less energyflux being available (Cord-Ruwisch et al., 1988). Bacterial commu-nity is much richer and flexible as it is responsible for hydrolysis ofthe substrate, acidogenesis and acetogenesis; and communitystructure modifications are possible due to the substrate or process
conditions changes. Interestingly, there was approximately 50%divergence in archaeal community structure in the mixtures withadded C. cellulovorans. The reason for this may lie in the higherconcentrations of hydrogen, carbon dioxide and acetic acid pro-duced by C. cellulovorans (Sleat et al., 1984). The homoacetogenicpathway for acetic acid production by acetogenic bacteria maybe accelerated (Nie et al., 2007) which can affect archaeal com-munity, especially the acetoclastic methanogenic archaea.
3.5. The persistence of P. xylanivorans Mz5T and F. succinogenes S85 inmicrobial community during the BMP assay as detected by DGGE
Bands of pure cultures of the added hydrolytic bacteria werelocated using PCR products of extracted DNA. They were used tomonitor their presence in the experimental mixtures on day 0and 30. The DGGE biases made following of C. cellulovoransimpossible as the position of the band of the pure culture was
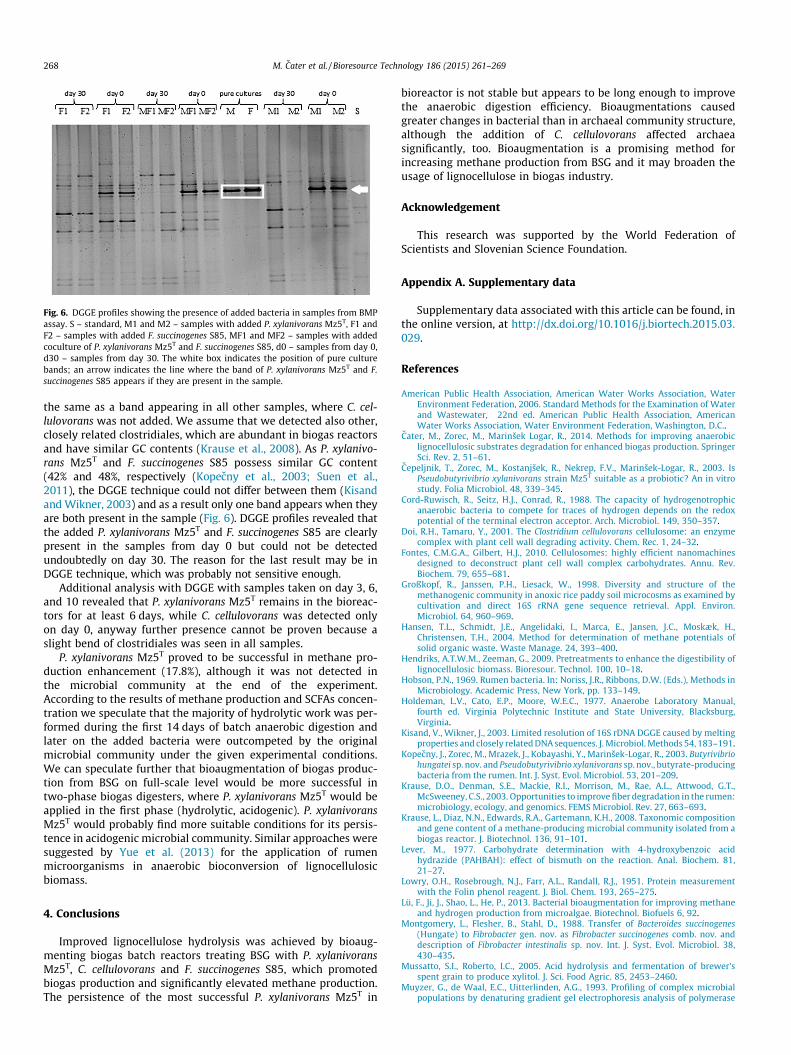
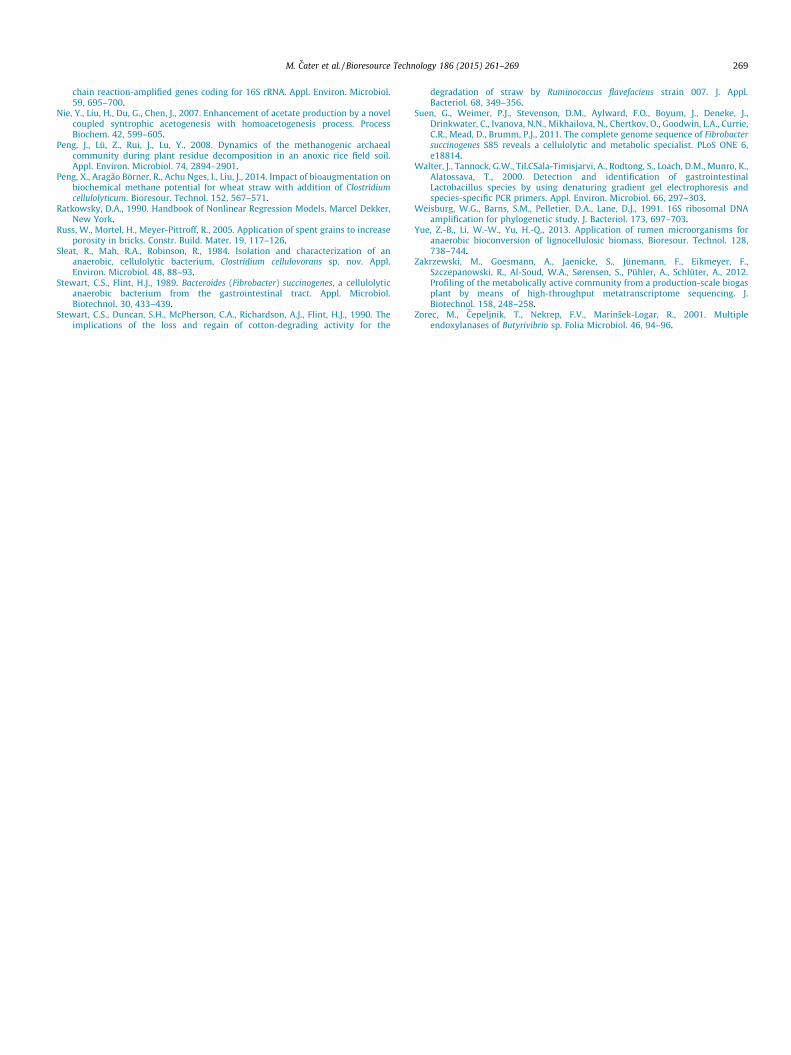
Fig. 6. DGGE profiles showing the presence of added bacteria in samples from BMPassay. S – standard, M1 and M2 – samples with added P. xylanivorans Mz5T, F1 andF2 – samples with added F. succinogenes S85, MF1 and MF2 – samples with addedcoculture of P. xylanivorans Mz5T and F. succinogenes S85, d0 – samples from day 0,d30 – samples from day 30. The white box indicates the position of pure culturebands; an arrow indicates the line where the band of P. xylanivorans Mz5T and F.succinogenes S85 appears if they are present in the sample.
268 M. Cater et al. / Bioresource Technology 186 (2015) 261–269
the same as a band appearing in all other samples, where C. cel-lulovorans was not added. We assume that we detected also other,closely related clostridiales, which are abundant in biogas reactorsand have similar GC contents (Krause et al., 2008). As P. xylanivo-rans Mz5T and F. succinogenes S85 possess similar GC content(42% and 48%, respectively (Kopecny et al., 2003; Suen et al.,2011), the DGGE technique could not differ between them (Kisandand Wikner, 2003) and as a result only one band appears when theyare both present in the sample (Fig. 6). DGGE profiles revealed thatthe added P. xylanivorans Mz5T and F. succinogenes S85 are clearlypresent in the samples from day 0 but could not be detectedundoubtedly on day 30. The reason for the last result may be inDGGE technique, which was probably not sensitive enough.
Additional analysis with DGGE with samples taken on day 3, 6,and 10 revealed that P. xylanivorans Mz5T remains in the bioreac-tors for at least 6 days, while C. cellulovorans was detected onlyon day 0, anyway further presence cannot be proven because aslight bend of clostridiales was seen in all samples.
P. xylanivorans Mz5T proved to be successful in methane pro-duction enhancement (17.8%), although it was not detected inthe microbial community at the end of the experiment.According to the results of methane production and SCFAs concen-tration we speculate that the majority of hydrolytic work was per-formed during the first 14 days of batch anaerobic digestion andlater on the added bacteria were outcompeted by the originalmicrobial community under the given experimental conditions.We can speculate further that bioaugmentation of biogas produc-tion from BSG on full-scale level would be more successful intwo-phase biogas digesters, where P. xylanivorans Mz5T would beapplied in the first phase (hydrolytic, acidogenic). P. xylanivoransMz5T would probably find more suitable conditions for its persis-tence in acidogenic microbial community. Similar approaches weresuggested by Yue et al. (2013) for the application of rumenmicroorganisms in anaerobic bioconversion of lignocellulosicbiomass.
4. Conclusions
Improved lignocellulose hydrolysis was achieved by bioaug-menting biogas batch reactors treating BSG with P. xylanivoransMz5T, C. cellulovorans and F. succinogenes S85, which promotedbiogas production and significantly elevated methane production.The persistence of the most successful P. xylanivorans Mz5T in
bioreactor is not stable but appears to be long enough to improvethe anaerobic digestion efficiency. Bioaugmentations causedgreater changes in bacterial than in archaeal community structure,although the addition of C. cellulovorans affected archaeasignificantly, too. Bioaugmentation is a promising method forincreasing methane production from BSG and it may broaden theusage of lignocellulose in biogas industry.
Acknowledgement
This research was supported by the World Federation ofScientists and Slovenian Science Foundation.
Appendix A. Supplementary data
Supplementary data associated with this article can be found, inthe online version, at http://dx.doi.org/10.1016/j.biortech.2015.03.029.
References
American Public Health Association, American Water Works Association, WaterEnvironment Federation, 2006. Standard Methods for the Examination of Waterand Wastewater, 22nd ed. American Public Health Association, AmericanWater Works Association, Water Environment Federation, Washington, D.C..
Cater, M., Zorec, M., Marinšek Logar, R., 2014. Methods for improving anaerobiclignocellulosic substrates degradation for enhanced biogas production. SpringerSci. Rev. 2, 51–61.
Cepeljnik, T., Zorec, M., Kostanjšek, R., Nekrep, F.V., Marinšek-Logar, R., 2003. IsPseudobutyrivibrio xylanivorans strain Mz5T suitable as a probiotic? An in vitrostudy. Folia Microbiol. 48, 339–345.
Cord-Ruwisch, R., Seitz, H.J., Conrad, R., 1988. The capacity of hydrogenotrophicanaerobic bacteria to compete for traces of hydrogen depends on the redoxpotential of the terminal electron acceptor. Arch. Microbiol. 149, 350–357.
Doi, R.H., Tamaru, Y., 2001. The Clostridium cellulovorans cellulosome: an enzymecomplex with plant cell wall degrading activity. Chem. Rec. 1, 24–32.
Fontes, C.M.G.A., Gilbert, H.J., 2010. Cellulosomes: highly efficient nanomachinesdesigned to deconstruct plant cell wall complex carbohydrates. Annu. Rev.Biochem. 79, 655–681.
Großkopf, R., Janssen, P.H., Liesack, W., 1998. Diversity and structure of themethanogenic community in anoxic rice paddy soil microcosms as examined bycultivation and direct 16S rRNA gene sequence retrieval. Appl. Environ.Microbiol. 64, 960–969.
Hansen, T.L., Schmidt, J.E., Angelidaki, I., Marca, E., Jansen, J.C., Moskæk, H.,Christensen, T.H., 2004. Method for determination of methane potentials ofsolid organic waste. Waste Manage. 24, 393–400.
Hendriks, A.T.W.M., Zeeman, G., 2009. Pretreatments to enhance the digestibility oflignocellulosic biomass. Bioresour. Technol. 100, 10–18.
Hobson, P.N., 1969. Rumen bacteria. In: Noriss, J.R., Ribbons, D.W. (Eds.), Methods inMicrobiology. Academic Press, New York, pp. 133–149.
Holdeman, L.V., Cato, E.P., Moore, W.E.C., 1977. Anaerobe Laboratory Manual,fourth ed. Virginia Polytechnic Institute and State University, Blacksburg,Virginia.
Kisand, V., Wikner, J., 2003. Limited resolution of 16S rDNA DGGE caused by meltingproperties and closely related DNA sequences. J. Microbiol. Methods 54, 183–191.
Kopecny, J., Zorec, M., Mrazek, J., Kobayashi, Y., Marinšek-Logar, R., 2003. Butyrivibriohungatei sp. nov. and Pseudobutyrivibrio xylanivorans sp. nov., butyrate-producingbacteria from the rumen. Int. J. Syst. Evol. Microbiol. 53, 201–209.
Krause, D.O., Denman, S.E., Mackie, R.I., Morrison, M., Rae, A.L., Attwood, G.T.,McSweeney, C.S., 2003. Opportunities to improve fiber degradation in the rumen:microbiology, ecology, and genomics. FEMS Microbiol. Rev. 27, 663–693.
Krause, L., Diaz, N.N., Edwards, R.A., Gartemann, K.H., 2008. Taxonomic compositionand gene content of a methane-producing microbial community isolated from abiogas reactor. J. Biotechnol. 136, 91–101.
Lever, M., 1977. Carbohydrate determination with 4-hydroxybenzoic acidhydrazide (PAHBAH): effect of bismuth on the reaction. Anal. Biochem. 81,21–27.
Lowry, O.H., Rosebrough, N.J., Farr, A.L., Randall, R.J., 1951. Protein measurementwith the Folin phenol reagent. J. Biol. Chem. 193, 265–275.
Lü, F., Ji, J., Shao, L., He, P., 2013. Bacterial bioaugmentation for improving methaneand hydrogen production from microalgae. Biotechnol. Biofuels 6, 92.
Montgomery, L., Flesher, B., Stahl, D., 1988. Transfer of Bacteroides succinogenes(Hungate) to Fibrobacter gen. nov. as Fibrobacter succinogenes comb. nov. anddescription of Fibrobacter intestinalis sp. nov. Int. J. Syst. Evol. Microbiol. 38,430–435.
Mussatto, S.I., Roberto, I.C., 2005. Acid hydrolysis and fermentation of brewer’sspent grain to produce xylitol. J. Sci. Food Agric. 85, 2453–2460.
Muyzer, G., de Waal, E.C., Uitterlinden, A.G., 1993. Profiling of complex microbialpopulations by denaturing gradient gel electrophoresis analysis of polymerase
M. Cater et al. / Bioresource Technology 186 (2015) 261–269 269
chain reaction-amplified genes coding for 16S rRNA. Appl. Environ. Microbiol.59, 695–700.
Nie, Y., Liu, H., Du, G., Chen, J., 2007. Enhancement of acetate production by a novelcoupled syntrophic acetogenesis with homoacetogenesis process. ProcessBiochem. 42, 599–605.
Peng, J., Lü, Z., Rui, J., Lu, Y., 2008. Dynamics of the methanogenic archaealcommunity during plant residue decomposition in an anoxic rice field soil.Appl. Environ. Microbiol. 74, 2894–2901.
Peng, X., Aragão Börner, R., Achu Nges, I., Liu, J., 2014. Impact of bioaugmentation onbiochemical methane potential for wheat straw with addition of Clostridiumcellulolyticum. Bioresour. Technol. 152, 567–571.
Ratkowsky, D.A., 1990. Handbook of Nonlinear Regression Models. Marcel Dekker,New York.
Russ, W., Mortel, H., Meyer-Pittroff, R., 2005. Application of spent grains to increaseporosity in bricks. Constr. Build. Mater. 19, 117–126.
Sleat, R., Mah, R.A., Robinson, R., 1984. Isolation and characterization of ananaerobic, cellulolytic bacterium, Clostridium cellulovorans sp. nov. Appl.Environ. Microbiol. 48, 88–93.
Stewart, C.S., Flint, H.J., 1989. Bacteroides (Fibrobacter) succinogenes, a cellulolyticanaerobic bacterium from the gastrointestinal tract. Appl. Microbiol.Biotechnol. 30, 433–439.
Stewart, C.S., Duncan, S.H., McPherson, C.A., Richardson, A.J., Flint, H.J., 1990. Theimplications of the loss and regain of cotton-degrading activity for the
degradation of straw by Ruminococcus flavefaciens strain 007. J. Appl.Bacteriol. 68, 349–356.
Suen, G., Weimer, P.J., Stevenson, D.M., Aylward, F.O., Boyum, J., Deneke, J.,Drinkwater, C., Ivanova, N.N., Mikhailova, N., Chertkov, O., Goodwin, L.A., Currie,C.R., Mead, D., Brumm, P.J., 2011. The complete genome sequence of Fibrobactersuccinogenes S85 reveals a cellulolytic and metabolic specialist. PLoS ONE 6,e18814.
Walter, J., Tannock, G.W., TiLCSala-Timisjarvi, A., Rodtong, S., Loach, D.M., Munro, K.,Alatossava, T., 2000. Detection and identification of gastrointestinalLactobacillus species by using denaturing gradient gel electrophoresis andspecies-specific PCR primers. Appl. Environ. Microbiol. 66, 297–303.
Weisburg, W.G., Barns, S.M., Pelletier, D.A., Lane, D.J., 1991. 16S ribosomal DNAamplification for phylogenetic study. J. Bacteriol. 173, 697–703.
Yue, Z.-B., Li, W.-W., Yu, H.-Q., 2013. Application of rumen microorganisms foranaerobic bioconversion of lignocellulosic biomass. Bioresour. Technol. 128,738–744.
Zakrzewski, M., Goesmann, A., Jaenicke, S., Jünemann, F., Eikmeyer, F.,Szczepanowski, R., Al-Soud, W.A., Sørensen, S., Pühler, A., Schlüter, A., 2012.Profiling of the metabolically active community from a production-scale biogasplant by means of high-throughput metatranscriptome sequencing. J.Biotechnol. 158, 248–258.
Zorec, M., Cepeljnik, T., Nekrep, F.V., Marinšek-Logar, R., 2001. Multipleendoxylanases of Butyrivibrio sp. Folia Microbiol. 46, 94–96.
Copyright © 2022 FDOKUMEN