An Introduction to Murree Brewery
22
-
Upload
independent -
Category
Documents
-
view
2 -
download
0
Transcript of An Introduction to Murree Brewery


An Introduction to Murree Brewery Murree Brewery is the maker of Pakistan's premier beer brand Murree Beer. Its products are only legally available in Pakistan owing to a prohibition on the exportation of alcohol from Pakistan. The brewery has two manufacturing units located in Rawalpindi and Hattar(North-West Frontier Province).The Murree Brewery produces a wide variety of Beer's, Liquor's and nonalcoholic products. Our Premium products include Murree's Millennium Beer, Murree's Classic Beer, Lite Export Pills, Eight and Twelve years old Single Malt Whiskies, Vintage with ablend of a Scotch Grain Whisky, Silver TopGin, Bolskaya Vodka and Doctor's Brandy.
“Murree Brewery, an ISO 14001 Certified Company”
HistoryConsequent to the British annexation of the Punjab in 1849 from Sikh rule, and more so after 1857 when the British Crown formally extended its sovereignty over India, a structured administration commenced in the Punjab. To meet the beer requirements of British personnel (mainlyarmy), the Murree Brewery was established in 1860 and incorporated a year later at Ghora Galli, located in the Pir Punjal range of the Western Himalayas at an elevation of 6000' above sea level, near the resort town of Murree.
Between 1885 & 1890 the Company established Breweries in Rawalpindi & Quetta & acquired an interest in the Oticumand (South India) & Norailiya (Ceylon) breweries. A distillery was also established in theabove period in Rawalpindi next to the Brewery. The Murree Brewery at Ghora Galli was therefore among the first modern beer breweries

established in Asia. Murree Beer proved to be very popular among the British troopers who were largely barracked in the 'Galis' of these hills. The virtues of beer brewed from barley malt & hops as a light alcoholic beverage were not lost on the local population who rapidly became avid consumers. By the turn of the 20 century, the name "Murree" was famous for its beer in keg and bottle in the bars, beer halls and army messes of British India. Murree Beer was first awarded a medal for product excellence at the Philadelphia Exhibition in 1876,followed by numerous awards over the past140 years. In 1935, a massiveearthquake totally demolished the Quetta brewery as well as substantial part of Quetta town, killing thousands of persons, including a number of our employees. At Ghora Galli (Murree), the scarcity of water became an emerging problem. By the 1920s, brewing was mostly transferred to the Rawalpindi brewery but malting continuedat Ghora Galli till the 1940s, when this property was sold. This historic brewery built in Gothic style architecture was burnt during the partition riots of 1947/48.Park Lodge a handsome residential property was purchased by the company from Mrs. H. Whymper in 1888. Itwas the principal residence and head office of the company till 1959, when it was taken over by the Government of Pakistan to house the office of the President of Pakistan. It remains an office of the Head of State of Pakistan from 1960 till the present day. Two English families were closely connected with the founding of the original brewery. Edward Dyer was the first General Manager of the company. He was also the founder of Dyer Meaken breweries, Simla hills. Edward Whymper, a member of this family was the first person to climb Matterhorn Mountain in 1865.The Rawalpindi brewery is blessed with deep aquifers of good water. A railway siding was extended to the premises in the 19th century, which is now derelict. Under the presentprohibition law, only non-Muslims and foreigners are permitted to consume alcohol. Notwithstanding the consequent reduction in demand, the Company decided as policy to concentrate on product excellence. Itwas decided to modernize the plants. A Ziemann (German) brew house wasinstalled in 1967, 'Saladin' Box Maltings in 1971. Also in the late sixties, it was decided to embark on an ambitious long-term program tomature Malt Whiskies. Over the past four decades white oak casks and vats have been procured from North America, Australia and Spain Our

two underground cellars now hold over half a million liters of Malt Whisky for varying periods of maturation up to 12 years under controlled temperature conditions. Another wave of modernization was undertaken in the 1990s. New beer canning and modern bottle filling facility from Holstein and Kappert (Germany) was installed. Two units of alcohol rectification columns for producing extra neutral grade of potable alcohol from Molasses were procured from France and Italy, respectively, to give our Vodkas and Gins a qualitative edge. Also in this period, the beer fermentation capacities were renewed. It is pertinent to point out that our basic beer fermentation system installed in the1930s was then at the cutting edge of this technology.Known at the time as the Nathan system, it incorporates fermentation and the lagering of beer in a single double jacketed vessel. A variation of this system is now in extensive use worldwide. Tops Food and Beverages a division of the Company was established in1969. It processes fruits and markets fruit juices and allied food products. Two manufacturing units are located in Rawalpindi and Hattar (NWFP) respectively. A Tetra Pak packaging facility was added in 2001. The Hattar plant was installed in 1992.
Vision & Mission Statements
VISION STATEMENT
Our office is in the market
MISSION STATEMENT
We the people of Murree Brewery Co. make personal commitment to first understand our customers requirement then to meet & exceed their expectations, by performing the correct tasks on time and every time through:
Continuous improvement
Alignment of our Mission & goals
Responsibility and respect of our jobs and each other
Educating one another

Corporate Profiles Company Name: Murree Brewery Company Limited
Ticker: MURE
Exchanges: KAR
2010 Sales: Not Available
Major Industry: Food & Beverages
Sub Industry: Brewers
Country: PAKISTAN
Employees: 261
Murree Brewery Company Limited is a Pakistan-based company. The Company is principally engaged in the manufacturing of Pakistan made foreign liquor (PMFL) including alcoholic beer, non-alcoholic beer (NAB), non-alcoholic products (NAP), which includes juices in tetra packs in Rawalpindi and food products, juices, glass bottles and jars in Hattar. Murree Brewery Company Limited operates in three divisions:liquor division, which includes PMFL, alcoholic beer, NAB, Big Apple, Lemonade, Cindy and Malt -79; tops division, which includes food products and juices, and glass division, which includes glass bottles and jars.
Products & Services
Management Officials

How to Buy…? Under the laws of Pakistan Muslims are prohibited from consuming alcoholic drinks. Non-Muslims and foreigners require consumption permit issued by Provincial Governments and Islamabad (Capital Territory). However in most cases a Liquor retailer will assist you inobtaining a permit.
Murree Brewery Company Limited - Price Analysis Snapshot This Report features up to a ten-year record of the equity Price history for Murree Brewery Company Limited. Tabular results include the High, Low and Closing price for the quarter. There is also a calculation of percentage change in price for both Quarterly and Annual periods. Price values are adjusted for stock splits and dividends. Murree Brewery Company Limited is a Pakistan-based company.The Company is principally engaged in the manufacturing of Pakistan made foreign liquor (PMFL) including alcoholic beer, non-alcoholic beer (NAB), non-alcoholic products (NAP), which includes juices in tetra packs in Rawalpindi and food products, juices, glass bottles andjars in Hattar. Murree Brewery Company Limited operates in three divisions: liquor division, which includes PMFL, alcoholic beer, NAB, Big Apple, Lemonade, Cindy and Malt -79; tops division, which includesfood products and juices, and glass division, which includes glass bottles and jars.
Popular Culture References
The brewery was photographed and filmed by Michael Palin on his tours of the Himalaya and is featured in his DVD and book, Himalaya

(book)/Himalaya with Michael Palin, documentary 2004. Palin stated theproducts of the Murree Brewery saved his life while traveling around Pakistan, which, as a Islamic State forbids the consumption of alcohol.
Recent Changes in Murree Brewery
In 1977 the Murree Brewery suffered a significant setback when Zulfiqar Ali Bhutto imposed a total prohibition in Pakistan, to appease Islamic elements of the electorate. Subsequently the government of General Zia-ul-Haq amended this law, requiring anyone wishing to consume alcohol to present credentials demonstrating that they were non-Muslim. The small Christian, Hindu and Parsi communitieswere not large enough to support the enterprise, and production had tobe scaled back. However, gradual relaxation of the prohibition laws has allowed Murree to introduce variations of Murree beer, vodka, gin and whisky. Today, all Murree products are readily available in legal liquor shops that operate openly in Karachi in places like Zamzama andDefence. It is also available in the interior of Sindh. Although the consumption of alcohol in public is still nominally banned, it is becoming increasingly available in clubs and high-class restaurants. Murree Beer was initially being produced in Austria for European markets andwas available in various Pakistani and Indian restaurants, an enterprise which has since ceased since 2004. The current CEO, Isphanyar Bhandara has announced plans to pursue co-brewing with Fosters, but this is still in development.
The Murree Brewery is one of the oldest public companies of the sub-continent. Its shares were traded on the Calcutta Stock Exchange as early as 1902, and is now the oldest continuing enterprise of Pakistan and among the top 25 performing public companies by the Karachi Stock Exchange. Murree's biggest competitor is the Quetta Distillery, and its products have to increasingly vie with smuggled brands from the West and India.
BOARD OF DIRECTORS
Chairman: Mr. Khurram Muzaffar

Chief Executive: Mr. Isphanyar M. Bhandara
Ch. Mueen Afzal
Mr. Aamir
H. Sherazi
Mrs. Goshi
M. Bhandara
Lt. Gen. ® Zarrar Azim
Mr. Usman Khalid Waheed
PRINCIPAL OFFICERS:
Company Secretary: Mr. M. Zaffar IqbalChief
Financial Officer: Mr. Ejaz Muhammad
General Manager: Mr. Mohammad Javed
Business Manager: Mr. A. W. K. Sherwani
Acting General Manager: Mr. Talat Yaqoob Awan
AUDIT COMMITTEE
Mr. Khurram Muzaffar (Chairman)
Ch. Mueen Afzal (Member)
Mrs. Goshi M. Bhandara (Member)
AUDITORS PRINCIPAL BANKERS
M/s KPMG Taseer Hadi & Co. Bank Alfalah Ltd, Rawalpindi
Chartered Accountants Standard Chartered Bank
The Bank of Khyber, Hattar.
Allied Bank Ltd, Lahore / Gujranwala

Profitability AnalysisThe company's revenue of Rs. 4.422 billion for the period under reviewwas 11% higher compared to the corresponding period last year. Major reasons attributed to this increase were robust growth in data segmentand commencement of EVDO operations in major cities. Direct costs increased by 9.7% from Rs. 3.34 billion to 3.67 billion in 1HFY’10. The
increase in direct cost was mainly due to higher depreciation charges,network maintenance and excessive fuel consumption resulting from power outages across the country.
Liquidity Analysis
Finance cost more than doubled from Rs. 169.022 million to Rs. 377.353million. Due to the high direct cost and high finance, cost, there was a loss after taxation of Rs. 407.151 million for the period under review. This translated into a Loss per Share of Rs 0 47 as compared to LPS of Rs. 0.26in 1HFY09.Winding up of the subsidiary "World call Telecommunications Lanka (Pvt.) Limited" is in process. The subsidiary has been accounted for as discontinued operations. Lossfor 1 discontinued operation was Rs. 5.869million.There was an increase in current assets from Rs. 4.1 FY09 to Rs. 4.847billion in 1HFY10 mainly due to the] trade debts. Current maturities of non-current liabilities by 21% while trade and other payables increased by81%; increasing the current liabilities by 46% from Rs. 5.309 bill Rs.7.731 billion in 1HFY10.
Asset Management Analysis
The company recorded a 62% increase in its revenue from Rs. 5196 million to Rs. 8408 million in FY-09. This increase was mainly contributed by the LDI Long Distance and International segment where the company was successfully able to strengthen its operations and attract healthy volumes of traffic. Direct Costs increased from Rs. 3807 million to 7037 million due to the higher ATC rates that

prevailed during the year as compared to the previous year as well as higher depreciation charges of Rs. 1110 million which increased due tosignificant enhancement in infrastructure and equipment. Even though the company managed to make an operating profit of Rs. 15.36 million as compared to an operating loss of Rs. 302.55 million the profit was eroded by the high depreciation costs and high finance costs leading to a net loss of Rs. 490.82 million for FY09. The gross margin decreased from 19.23% to 16.31% while net profit margin improved from -6.93% « to 5.84% in FY09. Return on Asset and return on equity also deteriorated from their previous levels to -2.24% and - 4.25%. If the financial costs are controlled, the profitability of the company can be improved. The liquidity position of the company has been deteriorating over the years. The current ratio dropped from 1.15 to 0.80 in FY-09. Current assets increased from Rs. 3427.9 million to Rs.4262.1 million in FY09, an increase of 24%. Major increase was t seenin trade debts from Rs. 975.89 million to2116.74 million. Current liabilities showed an increase of 78% from Rs.2980.2 million to 5309.98 million in FY09. Large portion non-current liabilities maturedthis year amounting to Running finance also increased toRs. 1046 million payables increased to Rs. 2239 million. The company should take measures to improve its liquidity as it has already entered danger zone. The asset management of MURREE BREWERY has improved over the Days Sales Outstanding and Days Inventory outstanding hail showed a decline to 8 days and 67 days respectively, reducing the operating cycle. Total asset turnover increased from 21% in FY-08 to 37% in FY09. This can be attributed to the sharp rise in revenue. Sales to equity increased from0.34 to 0.74. The increased turnover ratios show that the company is efficiently using its assets and equity to generate the revenue. The debt management ratios indicate that the company is mostly financed through equity financing. Debt to asset ratio has slightly increased to 0.28 inFY09. Debt to equity has increased over the year to 0.55 where as long term debt to equity has declined to 0.30 implying that long-term debt has decreased as compared to last year. TIE ratio has improved to0.03 from -1.85 in FY08. It shows that the company is still not in a position to cover its high finance costs. Measures should be taken to control these costs.

Debt Management Analysis
The decline in profitability of the company in FY09 took its toll on Earnings per Share, resulting in a 63% drop in EPS, bringing it down to Rs. -0.51 for the year. The company's stock performance has not been very impressive for the year, as depicted in the graph. The stockremained below the KSE 100Index for the larger part of the year.
Future Outlook Analysis
Telecom has become a highly competitive sector and the strategy of thecompany plays a very important role in the success of that company. MURREE BREWERY is focusing on increasing the share of data services inits product portfolio. With the growing popularity of cable and advertisement business segment; it also has plans to add nearly 30% new house passes to its network in the coming year. Furthermore, the intense competition in the voice market along with profits attrition due to price wars has negatively affected the sets segment. Mobile substitution factor has put downward pressures on revenues and margins. Steps need to be taken to win customers justly loyalty and ensure steady streams of revenue from existing customers. Implementation of various USF projects will also be r the accomplishedby the year-end.
Analysis of Financial Statements by Ratio Technique
Ratios Analysis
The ratios analysis is one of the most powerful tools of financial management. Though ratios are simple to calculate and easy to understand, they suffer from serious limitations.
1) Limitations of financial statements: Ratios are based only on theinformation which has been recorded in the financial statements. Financial statements themselves are subject to several limitations. Thus ratios derived, there from, are also subject to

those limitations. For example, non-financial changes though important for the business are not relevant by the financial statements. Financial statements are affected to a very great extent by accounting conventions and concepts. Personal judgment plays a great part in determining the figures for financial statements. Comparative study required: Ratios are useful in judging the efficiency of the business only when they are compared with past results of the business. However, such a comparison only provide glimpse of the past performance and forecasts for future may not prove correct since several other factors like market conditions, management policies, etc. may affect the future operations
2) Ratios alone are not adequate: Ratios are only indicators; they cannot be taken as final regarding good or bad financial positionof the business. Other things have also to be seen.
3) Problems of price level changes: A change in price level can affect the validity of ratios calculated for different time periods. In such a case the ratio analysis may not clearly indicate the trend in solvency and profitability of the company. The financial statements, therefore, be adjusted keeping in view the price level changes if a meaningful comparison is to be made through accounting ratios.
4) Lack of adequate standard: No fixed standard can be laid down for ideal ratios. There are no well accepted standards or rule ofthumb for all ratios which can be accepted as norm. It renders interpretation of the ratios difficult
5) Limited use of single ratios: A single ratio, usually, does not convey much of a sense. To make a better interpretation, a numberof ratios have to be calculated which is likely to confuse the analyst than help him in making any good decision.
6) Personal bias: Ratios are only means of financial analysis and not an end in itself. Ratios have to interpret and different people may interpret the same ratio in different way.
7) Incomparable: Not only industries differ in their nature, but also the firms of the similar business widely differ in their size and accounting procedures etc. It makes comparison of ratiosdifficult and misleading.

CURRENT RATIO:
Current ratio may be defined as the relationship between current assets and current liabilities. This ratio is also known as "working capital ratio". It is a measure of general liquidity and is most widely used to make the analysis for short term financial position or liquidity of a firm. It is calculated by dividing the total of the current assets by total of the current liabilities.
[Current Ratio = Current Assets / Current Liabilities]
Limitations of Current Ratio
This ratio is measure of liquidity and should be used very carefully because it suffers from many limitations. It is, therefore, suggested that it should not be used as the sole index of short term solvency.
1) It is crude ratio because it measures only the quantity and not thequality of the current assets.
2) Even if the ratio is favorable, the firm may be in financial trouble, because of more stock and work in process which is not easily convertible into cash, and, therefore firm may have less cash to pay off current liabilities.
3) Valuation of current assets and window dressing is another problem.This ratio can be very easily manipulated by overvaluing the current assets. An equal increase in both current assets and current liabilities would decrease the ratio and similarly equal decrease in current assets and current liabilities would increase current ratio. The MURREE BREWERY current ratio is continuously decreasing from2006 to 2009 and it is near to become insolvent the favorable current ratiois2:1. And now in current position company is not able to fulfill its current liabilities. Company’s trade debts are also continuously increasing from 2006 to 2009. It means company is investing more on trade debtor’s and company current liabilities dramatically increases in 2009 which is also a cause of unfavorable current ratio.
STOCK / INVENTORY TURNOVER RATIO
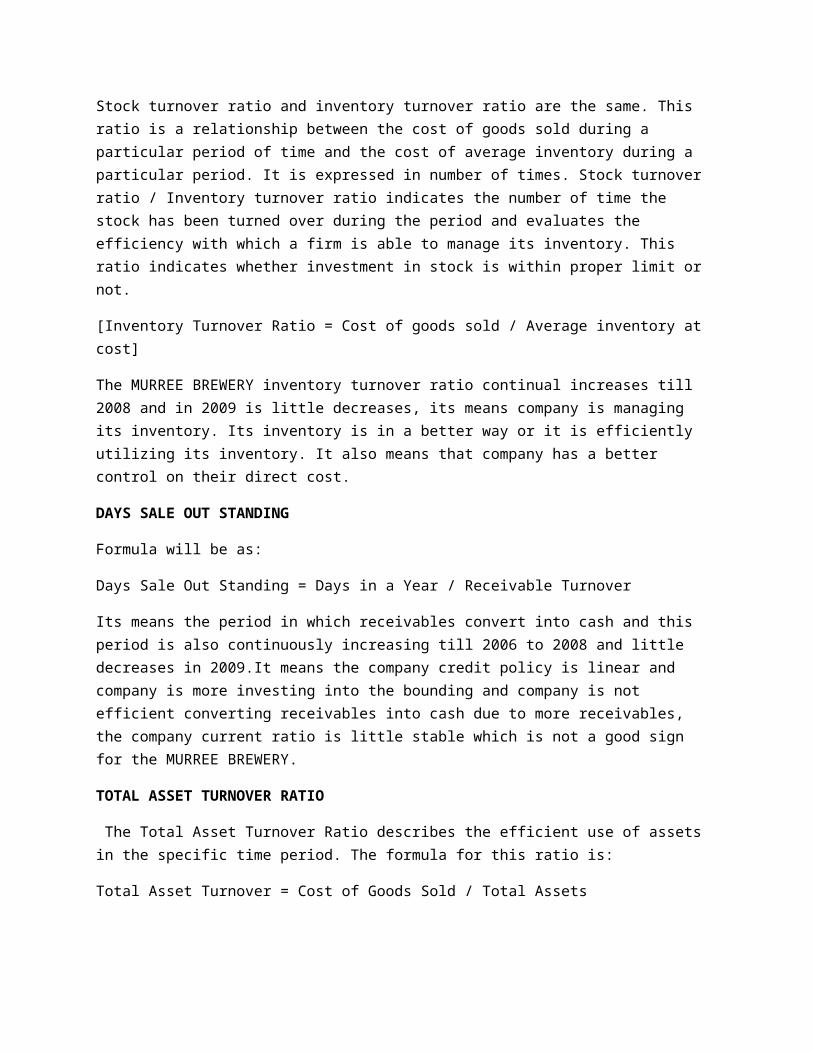
Stock turnover ratio and inventory turnover ratio are the same. This ratio is a relationship between the cost of goods sold during a particular period of time and the cost of average inventory during a particular period. It is expressed in number of times. Stock turnover ratio / Inventory turnover ratio indicates the number of time the stock has been turned over during the period and evaluates the efficiency with which a firm is able to manage its inventory. This ratio indicates whether investment in stock is within proper limit or not.
[Inventory Turnover Ratio = Cost of goods sold / Average inventory at cost]
The MURREE BREWERY inventory turnover ratio continual increases till 2008 and in 2009 is little decreases, its means company is managing its inventory. Its inventory is in a better way or it is efficiently utilizing its inventory. It also means that company has a better control on their direct cost.
DAYS SALE OUT STANDING
Formula will be as:
Days Sale Out Standing = Days in a Year / Receivable Turnover
Its means the period in which receivables convert into cash and this period is also continuously increasing till 2006 to 2008 and little decreases in 2009.It means the company credit policy is linear and company is more investing into the bounding and company is not efficient converting receivables into cash due to more receivables, the company current ratio is little stable which is not a good sign for the MURREE BREWERY.
TOTAL ASSET TURNOVER RATIO
The Total Asset Turnover Ratio describes the efficient use of assets in the specific time period. The formula for this ratio is:
Total Asset Turnover = Cost of Goods Sold / Total Assets

The MURREE BREWERY total assets turnover is continuously decreasing from 2006 to 2008 and a significant improvement happen in 2009, the improvement in this ratio is happen due to the company’s revenues or sales increasing very firstly in 2009 on important factors in this ratio is also this that company fix assets are also significantly increasing year to year.
SALES TO EQUITY RATIO
The Sales to Equity-Ratio explains the sales turnover with respect tothe Shareholder’s Equity. Formula will be as:
Sales to Equity Turnover = Net Credit Sales / Shareholder’s Equity
The MURREE BREWERY sales to equity ratio have a little fluctuation from 2006 to 2008 but it’s rapidly increases in 2009. The main factor in this ratio is that the company sales have little fluctuations in 2006 to 2008 but sales in increasing very fastly in 2009. So, this ratio also improves in 2009.
GROSS PROFIT MARGIN
Gross profit ratio (GP ratio) is the ratio of gross profit to net sales expressed as a percentage. It expresses the relationship betweengross profit and sales. Following formula is used to calculate gross profit ratios:
[Gross Profit Ratio = (Gross profit / Net sales) × 100]
The MURREE BREWERY Gross Profit Margin significantly decreases in2008 & 2009. It main reason is that company direct cost increases greatly in2009. The sales also an increase in 2009but the %age increases in direct cost was very high then %age increase in sale. So, as a result gross profit margin became unfavorable in 2008 and 2009.
NET PROFIT MARGIN
Net profit ratio is the ratio of net profit (after taxes) to net sales. It is expressed as percentage.

[Net Profit Ratio = (Net profit / Net sales) × 100]
The MURREE BREWERY net profit margin shows a very bad picture company’s net profits decreases in 2006 and 2009. It shows also in 2008 & 2009 due to following reasons:
1) Company have no control on their finance cost
2) Company have no control on their operating cost
3) Increases in other expenses are also contributing in unfavorable net profit margin
RETURN ON ASSETS (ROA)
The Return on Assets describes the return that we get on our assets. Formula for this ratio is as:
ROA = Total Assets / Shareholder’s Equity
The MURREE BREWERY return on asset ratio is also having a bad pictureand which is sharing loss in 2008 and 2009. Its means MURREEBREWERY management is not effective in generating profit with available assets. The main reason behind unfavorable return on asset is this that although the company total assets increases year by year but due to heavy loss in 2008 and 2009. The company this position is unfavorable by nature.
RETURN ON EQUITY (ROE)
In real sense, ordinary shareholders are the real owners of the company. They assume the highest risk in the company. (Preference shareholders have a preference over ordinary shareholders in the payment of dividend as well as capital. Preference shareholders get a fixed rate of dividend irrespective of the quantum of profits of the company). The rate of dividends varies with the availability of profits in case of ordinary shares only. Thus ordinary shareholders are more interested in the profitability of a company and the performance of a company should be judged on the basis of return on equity capital of the company. Return on equity capital which is the

relationship between profits of a company and its equity can be calculated as follows:
Return on Equity Capital = [(Net profit after tax − Preference dividend) /Equity share capital] × 100
In ROE (return on equity) ratio company response towards its shareholder’s wealth is also bad company is unable to give dividend totheir shareholders in 2008 & 2009. And, loss is showing in 2008 & 2009is also in current position company’s shareholders are facing loss on their investment.
DEBT TO TOTAL ASSET RATIO
This ratio describes the debt burden on the firm’s assets. Formula will be as:
Debt to Total Asset Ratio = Total Debt / Total Assets
The MURREE BREWERY debt to total asset ratio indicates that the company’s less portion is financed from total debt and it is mostly financed through shareholder’s equity and this ratio is constant in 2006 and 2007 and then this ratio increases little fastly in 2008 & 2009.
DEBT TO EQUITY RATIO
This ratio explains the total debt burden on the shareholder’s equity.
Formula will be as:
Debt to Equity Ratio = Long –Term Debt / Shareholder’s Equity
The MURREE BREWERY debt to equity ratio remains constant in 2006 and2007 then it’s fastly increases in 2008 and 2009. This happen because company long-term debts decreases in 2009 which mean management of MURREE BREWERY handle their long-term finance very well in 2009. This ratio also indicates that the new company is more depending on their shareholder’s equity rather than long-term debt.
TIME INTEREST EARNED RATIO

Interest coverage ratio is also known as debt service ratio or debt service coverage ratio. This ratio relates the fixed interest charges to the income earned by the business. It indicates whether the business has earned sufficient profits to pay periodically the interest charges. It is calculated by using the following formula.
[Interest Coverage Ratio = Net Profit before Interest and Tax (EBIT) /Fixed Interest Charges]
The MURREE BREWERY’s time to interest earned ratio decreases in 2007then its shows loss in 2008 and its shows very little improvement in 2009 as compare to the 2008 loss. This ratio is overall indicates that company at this time is not in a position to cover its interest expenses.
EARNING PER SHARE (EPS)
Earnings per share ratio (EPS Ratio) are a small variation of return on equity capital ratio and are calculated by dividing the net profit after taxes and preference dividend by the total number of equity shares. The formula of earnings per share is:
[Earnings per share (EPS) Ratio = (Net profit after tax–Preference dividend) / No. of equity shares (common shares)]
Company MUREB Symbol
Company NameMurree BreweryCompany Ltd Company Name
Sector Beverages SectorAvg EPS Rs 22.36 Average of past year end EPS'sSector Average Rs 16.58 Sector average of the above
Avg EPS FV Rs 166.38Fair Value (DCF) based on average of pastyear-end EPS's
EPS Rs 35.58 Last four quarters EPSSector Average Rs 36.02 Sector average of the above
EPS FV Rs 264.73Fair Value (DCF) based on last four quarters EPS
Current Price Rs 314.99 Last closing stock price

Updated December 2013 Data Month/Year
Div Rs 6.00Total dividend paid during last four quarters
Sector Average Rs 5.33 Sector average of the above
Div FV Rs 44.64Fair value (DD) based on total dividend paid during last four quarters
Avg Div Rs 4.45Average of yearly dividends paid (including currently paid ones)
Sector Average Rs 4.42 Sector average of the above
Avg Div FV Rs 33.11Fair value (DD) based on Average of yearly dividends paid (including current)
Avg Rs 130.73Fair value (averaged of other fair values)
Upside -58.50%Upside potential (in percentage) based onthe above Average.
Div Yield 1.90% Dividend yieldSector Average 1.24% Sector average of the aboveBook Value Rs 249.12 Book ValueSector Average Rs 196.07 Sector average of the above
FV FCF/S Rs 151.37Fair Value based on free cash flow per share
Outstanding Shares 23,053,026 Number of Outstanding SharesCurrent Assets Rs 2,745.00 Currency in Millions of Pakistan RupeesTotal Liabilities Rs 909.00 Currency in Millions of Pakistan RupeesNCAV/S Rs 79.64 Net Current Asset Value / ShareNNWC/S Rs 56.88 Net Net Working Capital / ShareTotal Assets Rs 6,652.00 Currency in Millions of Pakistan RupeesQuarter June 2013 Financial Report QuarterCfO Rs 770.00 Cash from Operations (Millions of Rs)FCF/S Rs 20.34 Free Cash Flow per ShareFCF/S Sector Avg 12.65 Sector Average FCF/SP/FCF 15.48 Price over free cash flowP/FCF Sector Avg 64.96 Sector Average P/FCFP/E 8.85 Price over earnings ratio

P/E Sector Avg 11.91 Sector Average P/EP/B 1.26 Price over book value ratioP/B Sector Avg 2.37 Sector Average P/BPR 16.86 Payout Ratio (in %)PR Sector Avg 21.99 Sector average Payout Ratio (in %)D/E Ratio 15.83 Debt / Equity ratio (%)Sector D/E Ratio 50.77 Sector Debt / Equity ratio (%)Price PerformanceLast Trade Date 29/11/2013Last Trade Price Rs 314.993 Months Avg Rs 312.646 Months Avg Rs 310.519 Months Avg Rs 264.5512 Months Avg Rs 236.52Score -6 cumulative +ve's, -ve's from above all
Buy Scale -3Range -5 to +5 (based on 5 different complex analysis)
Share Price: -High 191.9 197.9 119.45 99 -Low 86 105.03 57.1 70.26
Months Reported: N0.2007 2008 2009 2010 2011 2012 201312 12 12 12 9 9
PER SHARE -Profit (Rs) 17.31 16.42 16.45 21.85 17.36 15.06Dividend -Cash (Rs) 5 5 5 5 -Bonus (Rs) 1 1 1 2
-Right (Rs) 0 0 0 0
-Prem (Rs) 0 0 0 0
YIELD 8.08 5.58 6.08 14.58
Book Value (per share) 78.8 84.5 89.7 99.7 96.8 110.6

Capital Paid Up (mil) 108.4 119.3 131.2 144.3 173.2 190.5
Retained Earnings (mil) 746.5 889.2 1046.1 1294.5 1502.9 1917.2
Chairman : Khurram Muzaffar CEO Name: Isphanyar Bhandara CEO Cost: Rs. 2.955 (mil) p.a. Group: NA Industry: Food-Brewery Address: Pindi/Lahore Employees: NA Telephone: 051-35567041 Auditor: KPMG Taseer Hadi
Key Company DataFace Value10Year Of Listing1971Year EndingJUNWeb Sitewww.murreebrewery.comLast Closing976.95Last Updated8/15/2014