
An Introduction to
27
An Introduction to Spectr,ometric Methods pectrometric methods are a large group of analyt- ical methods that are based on atomic and molecular spectroscopy. Spectroscopy is a general term for the sci- ence that deals with the interactions of various types of radiation with matter. Historically, the interactions of interest were between electromagnetic radiation and matter, but now spectroscopy hqs been broadened to include interactions between maffer qnd other forms of energy. Examples include acoustic waves and beams of particles such as ions and electrons. Spectrometry and spectrometric methods refer to the measurement of the intensiA of radiation with a photoelectric transducer or other type of electronic device. The most widely used spectrometric methods are based on electromagnetic radiation, which is a type of energy that tqkes severql forms, the most readily recog- nizable being light and radiant heat. Less obvious manifestations include gamma rays and X-rays as well as ultraviolet, microwave and radio-frequency ra- diation. This chapter treats in a general way the interqc- tions of electromagnetic waves with qtomic and molec- 116 ular species. After this introduction, the next five chap- ters describe the various types of spectrometric methods employed by chemists for the identification and deter- minqtion of the elements present in various forms of matter. Chapters 13 through 21 then discuss the uses of spectrometry for structural determination of molecu- lar species and describe how these methods are used for their quantitativ e determination. 64 GENERAL PROPERTIES OF ELECTROMAGNETIC RADIATION Many of the properties of electromagnetic radiation are conveniently described by means of a classical sinu- soidal wave model, which embodies such parameters as wavelength, frequency, velocity, and amplitude. In con- trast to other wave phenomena, such as sound, electro- magnetic radiation requires no supporting medium for its transmission and thus passes readily through a vac- uum. The wave model fails to account for phenomena as- sociated with the absorption and emission of radiant en- ergy. To understand these processes, it is necessary to
-
Upload
khangminh22 -
Category
Documents
-
view
1 -
download
0
Transcript of An Introduction to

An Introduction toSpectr,ometric Methods
pectrometric methods are a large group of analyt-ical methods that are based on atomic and molecular
spectroscopy. Spectroscopy is a general term for the sci-
ence that deals with the interactions of various types ofradiation with matter. Historically, the interactions ofinterest were between electromagnetic radiation and
matter, but now spectroscopy hqs been broadened to
include interactions between maffer qnd other forms ofenergy. Examples include acoustic waves and beams ofparticles such as ions and electrons. Spectrometry and
spectrometric methods refer to the measurement of the
intensiA of radiation with a photoelectric transducer
or other type of electronic device.
The most widely used spectrometric methods are
based on electromagnetic radiation, which is a type ofenergy that tqkes severql forms, the most readily recog-
nizable being light and radiant heat. Less obvious
manifestations include gamma rays and X-rays as
well as ultraviolet, microwave and radio-frequency ra-
diation.
This chapter treats in a general way the interqc-
tions of electromagnetic waves with qtomic and molec-
116
ular species. After this introduction, the next five chap-
ters describe the various types of spectrometric methods
employed by chemists for the identification and deter-
minqtion of the elements present in various forms ofmatter. Chapters 13 through 21 then discuss the uses
of spectrometry for structural determination of molecu-
lar species and describe how these methods are used fortheir quantitativ e determination.
64 GENERAL PROPERTIES OFELECTROMAGNETIC RADIATION
Many of the properties of electromagnetic radiation are
conveniently described by means of a classical sinu-soidal wave model, which embodies such parameters as
wavelength, frequency, velocity, and amplitude. In con-trast to other wave phenomena, such as sound, electro-magnetic radiation requires no supporting medium forits transmission and thus passes readily through a vac-uum.
The wave model fails to account for phenomena as-
sociated with the absorption and emission of radiant en-
ergy. To understand these processes, it is necessary to

:', oke a partrcle model in which electromagnetic radia-
- il is viewed as a stream of discrete particles, or wave: =.-kets, of energy called photons where energy is pro-., mional to the frequency of the radiation. These dual.3\\.s of radiation as particles and as waves are not mu-
-- iI1r' exclusive but, rather, complementary. Indeed, the;\ e -particle duality is found to apply to the behavior- \treams of electrons, protons, and other elementary
:::ticles and is completely rationahzed by wave me-
- -: ;nlCS.
:B WAVE PROPERTIES OFELECTROMAGNETIC RADIATION
: r many purposes, electromagnetic radiation is conve---:ntly represented as electric and magnetic fields that
- ,dergo in-phase, sinusoidal oscillations at right angles
., each other and to the direction of propagation. Fig-
-.i 6-la is such a representation of a single ray of: - "rne-p olanzed electromagnetic radiation. The term
",trte polarized implies that all oscillations of either the
-=-c.--tric or the magnetic flelds lie within a single plane.. rgure 6-1b is a two-dimensional representation of the
=.ectric component of the ray in Figure 6-la. The elec-.:r.- fleld strength in Figure 6-1 is represented as a vec-":,r lvhose length is proportional to its magnitude. The::scissa of this plot is either time as the radiationr.r-SSeS a flxed point in space or distance when time is:ld constant. Throughout this chapter and most of the
::maining text, only the electric component of radiation
Electric field,
v
68 Wave Properties of Electromagnetic Radiation lL7
will be considered because the electric fleld is respon-sible for most of the phenomen a that are of interest tous, including transmission, reflection, refraction, and
absorption. Note, however, that the magnetic compo-nent of electromagnetic radiation is responsible for ab-
sorption of radio-frequency waves in nuclear magneticresonance.
68-1 Wave Parameters
In Figure 6-1b, the amplitude A of the sinusoidal waveis shown as the length of the electric vector at a max-imum in the wave. The time in seconds required forthe passage of successive maxima or minima througha flxed point in space is called the period, p, of theradiation. The frequency, y, is the number of oscil-lations of the fleld that occur per secondl and is equalto llp. Another parameter of interest is the wavelength,\, which is the linear distance between any two equiv-alent points on successive waves (e.g., successivemaxima or minim il.z Multiplication of the frequency incycles per second by the wavelength in meters per cy-
t The common unit of frequency is the reciprocal second (s-,), o,hertz (Hz), which corresponds to one cycle per second.
z The units commonly used for describing wavelength differ consid-erably in the various spectral regions. For example, the angstromunit, A (10-to ,.t), is convenient for X-ray and short ultraviolet ra-diation; the nanometer, nm (10-, -), is employed with visible andultraviolet radiation; the micrometer, mp (f O-0 m), is useful for theinfrared region. (The micrometer was called the micron tn the earlyliterature; the use of this term is discouraged.)
l- wavelen gth,,).
ltI
Amplitude--:'' (-)
C)iE;0()C)
r!
A
Time or distance
(b)
Directionof
propagatron
(a)
Figure 6-1. Representation of a beam of monochromatic, plane-polarized radiation:a1 electrical and magnetic fields at right angles to one another and direction of propaga-
:ion, O) two-dimensional representation of the electric vector.

118 Chapter 6 An Introduction to Spectrometric Methods
cle gives the velocity of propagation v; in meters persecond:
(6- 1)
rt is imporrant to ';"*::'rnurhe
frequency of a
beam of radiation is determined by the source and re-mains invariant. In contrast, the velocity of radiationdepends upon the composition of the medium throughwhich it passes. Thus, Equation 6-I implies that thewavelength of radiation is also dependent upon themedium. The subscript i rn Equation 6-l emphasizesthese dependencies.
In a vacuum, the velocity of radiation is indepen-dent of wavelength and is at its maximum. This veloc-ity, given the symbol c, has been determined to be2.99792 X 108 m/s. It is significant that the velocity ofradiation in air differs only slightly from c (about 0.037oless); thus, for either aur or vacuuffi, Equation 6-1 can bewritten to three signiflcant flgures as
c _ z\ _ 3.00 X 10⁸ m/s _ 3.00 X 1010 cm/s (6-2)
In any medium containing matter, propagation ofradiation is slowed by the interaction between the elec-tromagnetic fleld of the radiation and the bound elec-trons in the matter. Since the radiant frequency is in-vanant and flxed by the source, the wavelength mustdecrease as radiation passes from a vacuum to anothermedium (Equation 6-2). This effect is illustrated in Fig-ure 6-2 for a monochromatic beam of visible radiation.3
3 A monochromatic beam is a beam of radiation whose rays have iden-tical wavelengths. A polychromatic beam is made up of rays of dif-ferent wavelengths.
,1, = 500 nmv = 6.0 x LOra Hz
Note that the wavelength shortens nearly 200 rffi, ormore than 30Vo, as it passes into glass; a reverse changeoccurs as the radiation again enters air.
The wavenumber Z which is deflned as the recipro-cal of the wavelength in centimeters, is yet another wayof describing electromagnetic radiation. The unit for iis cm-1. Wavenumber is widely used in infrared spec-
troscopy. The wavenumber is a useful unit because, incontrast to wavelength, it is directly proportional to thefrequency, and thus the energy, of radiation. Thus, wemay write
i - ky (6-3)
where the proportionality constant k depends on themedium and is equal to the reciprocal of the velocity(Equation 6-1).
The power P of radiation is the energy of the beamthat reaches a given area per second, whereas the inten-sity 1 is the power per unit solid angle. These quantitiesare related to the square of the amplitude A (see Figure6-1). Although it is not strictly correct to do so, powerand intensity are often used synonymously.
68-2 The Electromagnetic Spectrum
As shown in Figure 6-3, the electromagnetic spectrumencompasses an enormous range of wavelengths and fre-quencies (and thus energies). In fact,the range is so greatthat a logarithmic scale is required. Figure 6-3 also de-picts qualitatively the major spectral regions. The divi-sions are based on the methods that are required to gener-ate and detect the various kinds of radiation. Severaloverlaps are evident. Note that the visible portion of thespectrum to which the human eye is sensitive is tiny
1. = 330 nmv =6.0 x 1014
= 500 nm
= 6.0 x IOra Hz)"
v
o0E
g
Distance
Figure 6-2 Effect of change of medium on a monochromatic beam of radiation.

68 Wave Properties of Electromagnetic Radiation tl9
3x10¹⁰ 3x10⁸ 3x10⁶ 3x10⁴ 3x10² 3x100 3x10⁴ 3x10-r Wavenumber,cm-l
7021 10le 1017 101s 1013 10ll 10e 107t'requencY, Hz
HX-ray Visible Microwave
Gamma ray Ultraviolet Infrared Radio
I I I I I I I I I I I I l_ | ._1. waverengrh,mt0-13 10-ll 10-e 10-7 10-s 10-3 10-l 101
Figure 6-3 Regions of the electromagnetic spectrum.
when compared with other spectral regions. It should ogy arises from the many common features of instru-also be noted that spectrochemical methods that employ ments for the three spectral regions and the similarities innot only visible but also ultraviolet and infrared radia- the way in which we view the interactions of the tlreetion are often called optical rnethods despite the fact that types of radiation with matter.the human eye is sensitive to neither of the latter two Table 6-1 lists the wavelength and frequencytypes of radiation. This somewhat ambiguous terminol- ranges for the regions of the spectrum that are important
TABLE 6-1 Common Spectroscopic MethodsBased on Electromagnetic Radiation
Usual UsualWavelength Wavenumber Type of
Type Spectroscopy Range* Range, cm-l Quantum Tiansition
Gamma-ray emission 0.005-1.4 A Nuclear
X-Ray absorption, emission, 0.1-100 A Inner electronfluorescence, and diffraction
Vacuumultravioletabsorption 10-180nm 1 x 10⁶to5 X 104 Bondingelectrons
Ultraviolet visible absorption, 180-780 nm 5 x ld to 1.3 x 10a Bonding electrons
emission, and fl uorescence
Infrared absorption and 0.78-300 pm 1.3 X 10⁴ to 3.3 x 101 Rotation/vibration ofRaman scattering molecules
Microwave absorption 0.75-3.75 mm 13-27 Rotation of molecules
Electron spin resonance 3 cm 0.33 Spin ofelectrons in amagnetic field
Nuclear magnetic resonance 0.6-10 m 1.7 x lO-2 to 1 x 10³ Spin of nuclei in a
magnetic fleld
*1 A : 10-10 nm : 10-8 cm
I nm : 10-9 m : 10-7 cm
1 Fm : 10-6 m : 10-4 cm
l2O Chapter 6 An Introduction to Spectrometric Methods
for analytical purposes and also gives the names of thevarious spectroscopic methods associated with each.
The last column of the table lists the types of nuclear,atomic, or molecular quantum transitions that serve as
the basis for the various spectroscopic techniques.
68-3 Mathematical Descriptionof a Wave
With time as a variable, the wave in Figure 6- 1b can be
described by the equation for a sine wave. That is,
y - A sin(c,r/ * 0) (6-4)
where y is the electric field, A is the amplitude or maxi-mum value for y, / is time, and 0 is the phase angle, a
term deflned in Section 2B-1, page 28. The angular ve-locity of the vector or is related to the frequency of theradiati ofi v by the equation
Substitution of this ,.r; *?i'rnro Equation 6-4yietds
y - A sin(2n"'vt * 0)
electrical fleld, as well as to several other types ofwaves, whereby atoms or molecules are displaced.When n electromagnetic waves differing in frequency,amplitude, and phase angle pass some point in space si-multaneously, the principle of supe{position and Equa-tion 6-5 permits us to write
y - A1 sin(2tvtt + 0r) * Az sin(2rv2t * 0) +' * An sin(2ri vnt * 0r) (6-6)
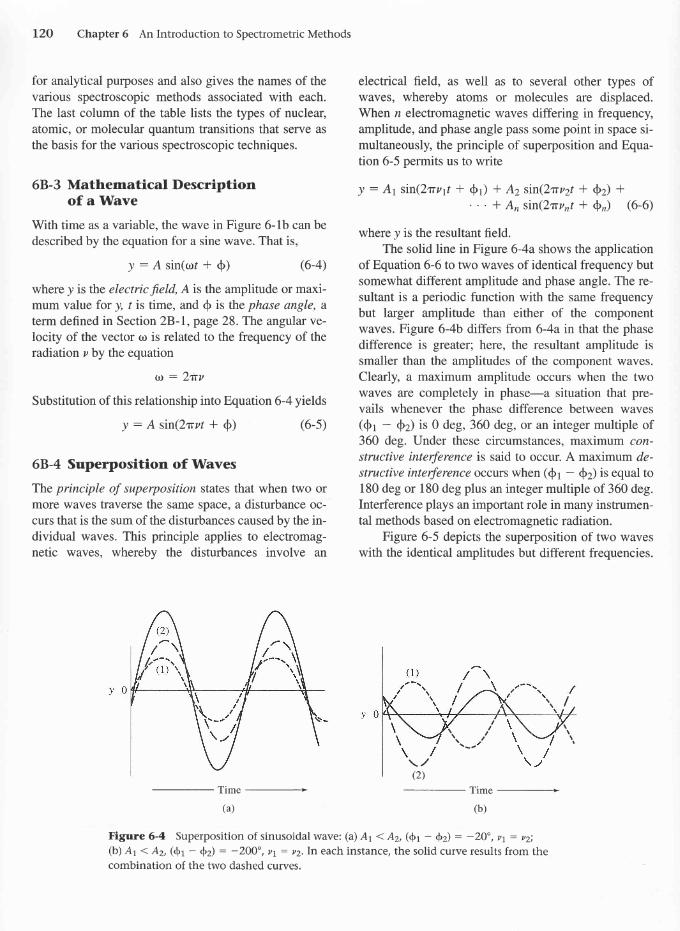
where y is the resultant fleld.The solid line in Figure 6-4a shows the application
of Equation 6-6 to two waves of identical frequency butsomewhat different amplitude and phase angle. The re-sultant is a periodic function with the same frequencybut larger amplitude than either of the componentwaves. Figure 6-4b differs from 6-4a in that the phase
difference is greater; here, the resultant amplitude issmaller than the amplitudes of the component waves.Clearly, a maximum amplitude occurs when the twowaves are completely in phase-a situation that pre-vails whenever the phase difference between waves(0r b) is 0 deg, 360 deg, or an integer multiple of360 deg. Under these circumstances, maximum con-structive interference is said to occur. A maximum de-
structive interference ocsrrs when (0r - 0z) is equal to180 deg or 180 deg plus an integer multiple of 360 deg.
Interference plays an important role in many instrumen-tal methods based on electromagnetic radiation.
Figure 6-5 depicts the superposition of two waveswith the identical amplitudes but different frequencies.
tl
(6-s)
6B-4 Superposition of Waves
The principle of superposition states that when two ormore waves traverse the same space, a disturbance oc-curs that is the sum of the disturbances caused by the in-dividual waves. This principle applies to electromag-netic waves, whereby the disturbances involve an
Time-(a)
ta -r'\,/
(2)
Time-(b)
\\\I
II,
\\
Figure 6-4 Superposition of sinusoidal wave: (a) A1 I A2, (0r - dz) : -2O", vr = vz;
(b) Ar < Az, (it - iz) = -200", y.t. : yz.In each instance, the solid curve results from thecombination of the two dashed curves.
\\\t

68 Wave Properties of Electromagnetic Radiation 121
(a)Wave 1
(b) wuu. 2
'+1
V2
Irl|*h*l
l*-I
(c)
The resulting wave is no longer sinusoidal but does ex-hibit a periodicity or beat. Note that the period of thebeat P6rs the reciprocal of the frequency differcnce A,y
between the two waves. That is,
P6 (6-7)
An important aspect of superposition is that a com-plex waveform can be broken down into simple compo-nents by a mathematical operation called the Fouriertransformation. Jean Fourier, afl early French mathe-matician (1768-1830), demonstrated that any periodicfunction, regardless of complexity, can be described bya sum of simple sine or cosine terms. For example, thesquare waveform widely encountered in electronics can
be described by an equation with the form
the sum of three sine waves that differ in amplitude inthe ratio of 5:3:1 and in frequency in the ratio of 1:3:5.Note that the resultant approximates the shape of a
square wave after including only three terms in Equa-tion 6-8. As shown by the solid line in Figure 6-6b, theresultant more closely approaches a square wave whennine waves are incorporated.
Decomposing a complex waveform into its sine orcosine components is tedious and time consuming whendone by hand. Efflcient software, however, makes itpractical to perform Fourier transformations on a rou-tine basis on a computer. The application of this tech-nique was mentioned in Section 5C -2 and will be con-sidered in the discussion of several types ofspectroscopy.
68-5 Diffraction of RadiationA11 types of electromagnetic radiation exhibit dffiac-tion, a process in which a parallel beam of radiation is
bent as it passes by a sharp barrier or through a naffowopening. Figurc 6-7 illustrates the process. Diffractionis a wave property, which can be observed not only forelectromagnetic radiation but also for mechanical or
/1y - A lsin 2rvt * ; sin"\3
1
, sin l}rrvt *
6rvt t1\1 ! stn Znrvt) (6-8)
where n takes values of 3,5,7,9,I1,13, and so forth. Agraphical representation of the summation process isshown in Figure 6-6. The solid curve in Figure 6-6a is
I
I _,Lv-'b
Figure 6-5 Superposition of tlvo waves of different frequencies but identical ampli-tudes: (a) wave 1 with a period of llvt b) wave 2 with a period of Llvz @z = 1.25 v);(c) combined n/ave pattern. Note that superposition of z1 and /2 produces a beat patternwitlr a period of LlAv where Ay : lr, - ,rl .
Av @z v)

L22 Chapter 6 An Introduction to Spectrometric Methods
! = A srn2tY
V--. Superposition of 3 sine wavesexperiment, performed first by Thomas Young in 1800,
in which the wave nature of light was unambiguouslydemonstrated. As shown in Figure 6-8a, aparallel beamof light is allowed to pass through a narrow slit A (or inYoung's experiment, a pinhole) whereupon it is dif-fracted and illuminates more or less equally two closelyspaced slits or pinholes B and C; the radiation emergingfrom these slits is then observed on the screen lying in aplane XY. If the radiation is monochromatic, a series ofdark and light images perpendicular to the plane of thepage is observed.
Figure 6-8b is a plot of the intensities of the bands
as a function of distance along the length of the screen.
If, as in this diagram, the slit widths approach the wave-length of radiation, the band intensities decrease onlygradually with increasing distances from the centralband. With wider slits, the decrease is much more pro-nounced.
In Figure 6-8a, the appearance of the central band E,
which lies in the shadow of the opaque material separat-
ing the two slits, is readily explained by noting that thepaths from B to E and C to E are identical. Thus, con-structive interference of the diffracted rays from the two
Wavegenerator
Wavemaxlma
(a)
Figure 6-7(a) xy >> \;
(b)
Propagation of waves through a slit:(b) xy - L.
/
/\/
\./(a)
Superposition of 9 sine waves
Figure 6-5 Superposition of sine waves to form a square
wave: (a) combination of three sine waves; (b) combinationof three, as in (a), and nine sine waves.
acoustical waves. For example, diffraction is readilydemonstrated in the laboratory by mechanically gener-
ating waves of constant frequency in a tank of waterand observing the wave crests before and after they pass
through a rectangular opening or slit. When the slit iswide relative to the wavelength (Figure 6-7 a), diffrac-tion is slight and difflcult to detect. On the other hand,when the wavelength and the slit opening are of thesame order of magnitude, as in Figure 6-7b, diffractionbecomes pronounced. Here, the slit behaves as a newsource from which waves radiate in a series of nearly180-deg arcs. Thus, the direction of the wave front ap-
pears to bend as a consequence of passing the two edges
of the slit.Diffraction is a consequence of interference. This
relationship is most easily understood by considering an
/--- !=A,(sin 2nvt+l sin6nvt
\ +| sin l}rvt)
/sin 10 nvt
\_A
5
aLt*
;\,rl ilu/\\\_
'l/l
!=A(sin2fivt+*sin6nvt' *..'. * I sin 3alvt)
17
Superposition of 3 sine waves
!=A(sin2rvt+l stn6rcvt

).-+ l'*-
Parallelbeam
Diffraction bya single slit
slits occurs, and an intense band is observed. With the aidof Figure 6-8c, the conditions for maximum constructiveinterference, which result in the other light bands, can be
derived. In Figure 6-8c, the angle of diffraction 0 is the
angle from the normal, formed by the dotted line extend-ing from a point O, halfway between the slits, to the pointof maximum intensity D. The solid lines BD and CD rep-resent the light paths from the slits B and C to this point.Ordinarily, the distance OE is enormous compared to thedistance between the slits BC. As a consequence, thelines BD, OD, and CD are, for all practical purposes, par-a11e1. Line BF is perpendicular to CD and forms the trian-gle BCE which is, to a close approximation, similar toDOE; consequently, the angle CBF is equal to the angleof diffraction 0. We may then write
CF:BCsin0Becaus e BC is so very small compared to OE, FD
closely approximates BD, and the distance CF is a good
(b) (c)
Figure 6-8 Diffraction of monochromatic radiation by slits.
68 Wave Properties of Electromagnetic Radiation I23
Dark
LightDiffractionby two slits
measure of the difference in path lengths of beams BDand CD. For the two beams to be in phase at D, it isnecessary that CF correspond to the wavelength of theradiation; that is,
\- CF:BC sin0
Reinforcement also occurs when the additionalpath length coffesponds to 2\, 3\, and so forth. ThuS, &more general expression for the light bands surroundingthe central band is
(a)
BoC
hU)
O
0)
od,n t,
n\ : BC sin 0 (6-e)
where n is an integer called the order of interference.The linear displacement DE of the diffracted beam
along the plane of the screen is a function of the dis-tance OE between the screen and the plane of the slits,as well as the spacing between the slits, and is given by
X+ Distance
-Y
DE:ODsin0

\24 Chapter 6 An Introduction to Spectrometric Methods
Substitution into Equation 6-9 gives
BC DE BC DEn\- (6- 10)
produce trains are random, the phase differences amongthe trains must also be variable. A wave train from slit Bmay arrive at a point on the screen in phase with a wavetrain from C so that constructive interference occurs; an
instant later, the trains may be totally out of phase at thesame point, and destructive interference occurs. Thus,the radiation at all points on the screen is governed bythe random phase variations among the wave trains;uniform illumination, which represents an average forthe trains, is the result.
There are sources that produce electromagnetic ra-
diation in the form of trains with essentially infinitelength and constant frequency. Examples include radio-frequency oscillators, microwave sources, and opticallasers. Various mechanical sources, such as a two-pronged vibrating tapper in a water-containing rippletank, produce a mechanical analog of coherent radia-tion. When two coherent sources are substituted for slitA tn the experiment shown in Figure 6-8a, a regular dif-fraction pattern is observed.
Diffraction patterns can be obtained from randomsources, such as tungsten fllaments, provided that an
arrangement similar to that shown in Figure 6-8a is em-ployed. Here, the very nalrow slitA assures that the radi-ation reaching B and C emanates from the same small re-gion of the source. Under this circumstance, the variouswave trains that exit from slits B and C have a constantset of frequencies and phase relationships to one anotherand are thus coherent. If the slit at A is widened so that alarger part of the source is sampled, the diffraction pat-
tern becomes less pronounced because the two beams
are only partially coherent. trf slit A is made sufflcientlywide, the incoherence may become great enough to pro-duce only a constant illumination across the screen.
6B-7 Transmission of RadiationIt is observed experimentally that the rate at which radi-ation is propagated through a transparent substance isless than its velocity in a vacuum and depends upon thekinds and concentrations of atoms, ions, or molecules inthe medium. It follows from these observations that theradratron must interact in some way with the matter. Be-cause a frequency change is not observed, however, theinteraction cannot involve a permanent energy transfer.
The refractive index of a medium is one measure ofits interaction with radiation and is defined by
Ei
Ei
[,,,E
E.
Ei
H
E:
E
E:
E,
Eil: ii:
L,I:: :
t_:
H
E
OD OE
Equation 6-10 permits the calculation of the wave-
length from the three measurable quantities.
E. EXAMPLE 6-lSuppose that the screen in Figure 6-8 is 2.00 m fromthe plane of the slits and that the slit spacing is 0.300
mm. What is the wavelength of radiation if the fourthband is located 15.4 mm from the central band?
Substituting into Equation 6-10 gives
0.300 mm X 15.4 mm4\- _ 0.00231 mm2.00mX 1000mm/m
\ - 5.78 X l0-4 mrn - 578 nm
6B'6 Coherent Radiation
In order to produce a diffraction pattern such as that
shown in Figure 6-8a, it is necess ary that the electro-magnetic waves that travel from slits B and C to anygiven point on the screen (such as D or E) have sharplydeflned phase differences that remain entirely constantwith time; that is, the radiation from slits B and C mustbe coherent. The conditions for coherence are that (1)
the two sources of radiation must have identical fre-quencies (or sets of frequencies) and (2) the phase rela-tionships between the two beams must remain constantwith time. The necessity for these requirements can be
demonstrated by illuminating the two slits in Figure6-8a with individual tungsten lamps. Under this circum-stance, the well-deflned light and dark patterns disap-pear and are replaced by a more or less uniform illumi-nation of the screen. This behavior is a consequence ofthe incoherent character of fllament sources (many
other sources of electromagnetic radiation are incoher-ent as well).
With incoherent sources, light is emitted by indi-vidual atoms or molecules, and the resulting beam is thesummation of countless individual events, each ofwhich lasts on the order of 1g-8 s. Thus , abeam of ra-diation from this type of source is not continuous but in-stead is composed of a series of wave trains that are a
few meters in length at most. Because the processes that
C'Ili :
-V;(6- 1 1)

rvhere T; is the refractive index at a specifled frequencyi. vi is the velocity of the radiation in the medium, and c
is its velocity in a vacuum. The refractive index of mostliquids lies between 1.3 and 1.8; itis 1.3 to 2.5 or highertor solids.a
The interaction involved in transmission can be as-
cribed to perio dtc polarization of the atomic and molec-ular species that make up the medium. Polarization inthis context means the temporary deformation of theeiectron clouds associated with atoms or molecules thatis brought about by the alternating electromagnetic fleld*rf the radiation. Provided that the radiation is not ab-
sorbed, the energy required for polarization is only mo-inentarily retained (10- 14 to 10- 1s s) by the species and
1s reemitted without alteration as the substance returns:,r its original state. Since there is no net energy change
in this process, the frequency of the emitted radiation is
unchanged, but the rate of its propagation is slowed by:he time that is required for retention and reemission to
'-)ccur. Thus, transmission through a medium can be,.re wed as a stepwise process that involves polarized-..:oms, ions, or molecules as intermediates.
Radiation from polarrzed particles should be emit-ted in all directions in a medium. If the particles are
small, however, it can be shown that destructive inter-:erence prevents the propagation of signiflcant amountsin any direction other than that of the original light path.Cn the other hand, if the medium contains large parti-:ies (such as polymer molecules or colloidal particles),::ris destructive interference is incomplete, and a por-t-,rr of the beam is scattered in all directions as a conse-
i uence of the interaction step. Scattering is consideredrn a later section of this chapter.
Since the velocity of radiation in matter is wave-
-:neth dependent and since c tn Equation 6-11 is inde-:,endent of this parameter, the refractive index of a sub-
llence must also change with wavelength. The variation-r refractive index of a substance with wavelength or-requency is called rts dispersion. The dispersion of a,". pical substance is shown in Figure 6-9. Clearly, the:elationship is complex; generally, however, dispersion:,lots exhibit two types of regions. In the normal disper-
i on region, there is a gradual increase in refractive-.idex with increasing frequency (or decreasing wave-
-,r,r a more complete discussion of refractometry, see S. Z. Lewin,rd N. Bauer, rn Treatise on Analytical Chemistry, I. M. Kolthoff and, I. Elving, Eds., Part I, Vol. 6, Chapter 70. New York: Interscience,_ !tr65.
6B Wave Properties of Electromagnetic Radiation 125
xo
o
O
0)il
1013
Infrared1014 101s
UltravioletFrequen cy , Hz
Figure 6-9 A typical dispersron curve.
length). Regions of anomalous dispersion are fre-quency ranges in which a sharp change in refractive in-dex is observed. Anomalous dispersion always occursat frequencies that correspond to the natural harmonicfrequency associated with some pafi of the molecule,atom, or ion of the substance. At such a frequency, per-manent energy transfer from the radiation to the sub-
stance occurs and absorption of the beam is observed.Absorption is discussed in a later section.
Dispersion curves are important when choosingmaterials for the optical components of instruments. Asubstance that exhibits normal dispersion over thewavelength region of interest is most suitable for themanufacture of lenses, for which a high and relativelyconstant refractive index is desirable. Chromatic aber-
rations (formation of colored images) are minimizedthrough the choice of such a material. In contrast, a sub-
stance with a rcfractive index that is not only large butalso highly frequency dependent is selected for the fab-rication of prisms. The applicable wavelength regionfor the prism thus approaches the anomalous dispersionregion for the material from which it is fabricated.
68-8 Refraction of RadiationWhen radiation passes at an angle through the interfacebetween two transparent media that have different den-sities, an abrupt change in direction, or refraction, ofthe beam is observed as a consequence of a differencein velocity of the radiation in the two media. When thebeam passes from a less dense to a more dense environ-
Normal dispersron
Anomalous dispersion

t26 Chapter 6 An Introduction to Spectrometric Methods
Figure 6-10 Refraction of light in passing from a less
dense medium M1 into a more dense medium M2, whereits velocity is lower.
ment, as in Figure 6-10, the bending is toward the nor-mal to the interface. Bending away from the normal oc-curs when the beam passes from a more dense to a less
dense medium.The extent of refraction is given by Snell's law:
6B-9 Reflection of RadiationWhen radiation crosses an interface between media thatdiffer in refractive index, reflection always occurs. Thefraction of radiation reflected becomes greater with in-creasing differences in refractive index. For a beam thatenters an interface at right angles, the fraction reflectedis given by
I, (nz n)zIs (nz + ry)z
(1.s0 1.00)2
(6- 1s)
where /6 is the intensity of the incident beam and 1, isthe reflected intensity; 11 and Tz are the refractive in-dexes of the two media.
sin0t Tz v1
sin02 Tr v2
*
[.,,.i
['Ei
Ui
Ei
Ei
H.
Ei
E:
Ei
H
E'
H
E
Ui
E
El
H
H
ftE
H
H.
H
H
Ei
Hi
H
H.
Ei
H.
H
E't,:!
ln:
Hirl !:
ti,
E'
Hi
Hi
EiI,iiti
E.
Ui
E:
Hi
E:
H.
IrtIs
Calculate the percent loss of intensity due to reflec-tion of a perpendicular beam of yellow light as itpasses through a glass cell that contains water. As-sume that for yellow radiation the refractive index ofglass is 1.50, of water is 1 .33, and of air is 1.00.
The total reflective loss will be the sum of thelosses occurring at each of the interfaces. For the firstinterface (air to glass), we can write
If Mr in Figure 6-10 is a vacuum, v; is equal to c, and 11;
is unity (see Equation 6-11); with rearrangement, Equa-tion 6-12 simplifles to
(6-t2)
(6- 13)
(6-t4)
_ 0.040(1.50 + 1.00)2
The refractive indexes of substance M2 can then be
computed from measurements of (0r)ur. and 02. Forconvenience, refractive indexes are usually rneasured
and reported with a:.r., rather than a vacuum, as the refer-ence. The refractive index is then
The beam intensity is reduced to (10 0.040 10) -0.960 10. Reflection loss at the glass-to-water inter-face is then given by
I12 (1.s0 1:Tz- 0.0036
0.960 10 (1.s0 + t3r2Ir2: 0.0035 10
The beam intensity is further reduced to (0.960 10
0.0035 1o) _ 0.957 Is. At the water-to-glass inter-face
(1.50 t3T2
, \ (sin 0r)uu.(12.1vac :
,rn e,
, \ (sin 0r)ui.(12)air\ 'H' *LL
sin 02
Most compilations of refractive indexes providedata in terms of Equation 6-14. Such data are readilyconverted to refractive indexes with vacuum as a refer-ence by multiplying by the refractive index of air rcIa-tive to a vacuum. That is,
Tvac _ 1.0002J \ui,
This conversion is seldom necessary.
and the beam intensity becomes 0.953 Io. Finally, thereflection at the second glass-to-air interface will be
Irt0951 Io
Irz
- 0.0036(1.50 + t3T2
_ 0.0035 10
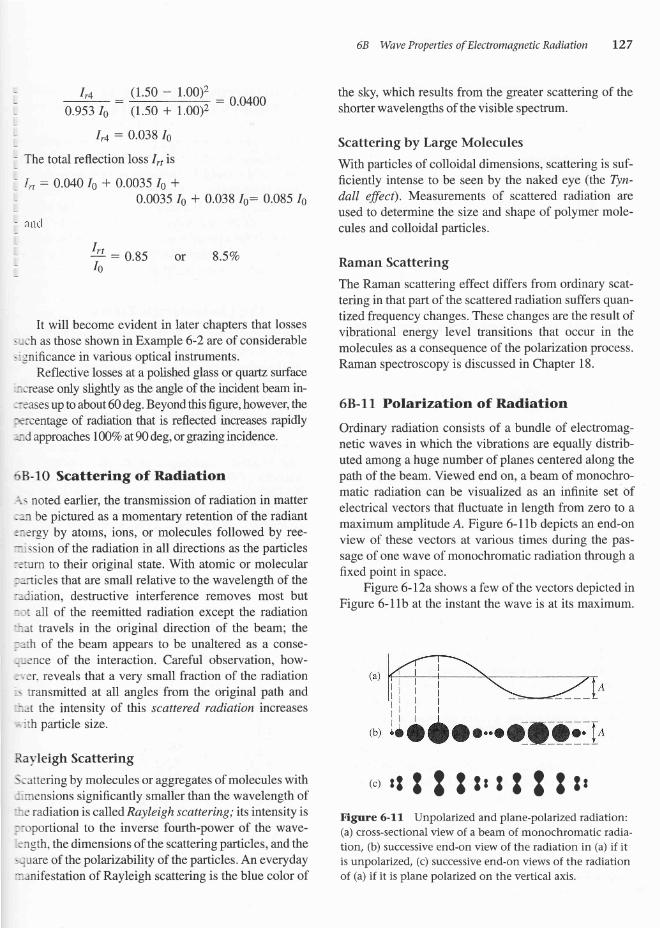
- 0 .953 ro (1.50 + 1.00)2
Ir4 : 0.038 1o
- The total reflection loss lrris-- I,t : 0.040 10 + 0.0035 1o *
0.0035 10 + 0.038 /o: 0.085 10
- and
68 Wave Properties of Electromagnetic Radiation L27
the sky, which results from the gre ater scattering of theshorter wavelengths of the visible spectrum.
Scattering by Large Molecules
With particles of colloidal dimensions, scattering is suf-flciently intense to be seen by the naked eye (the Tyn-
dall effict). Measurements of scattered radiation are
used to determine the size and shape of polymer mole-cules and colloidal particles.
Raman Scattering
The Raman scattering effect differs from ordinary scat-
tering in that part of the scattered radiation suffers quan-
trzedfrequency changes. These changes are the result ofvibrational energy level transitions that occur in the
molecules as a consequence of the polartzation process.
Raman spectroscopy is discussed in Chapter 18.
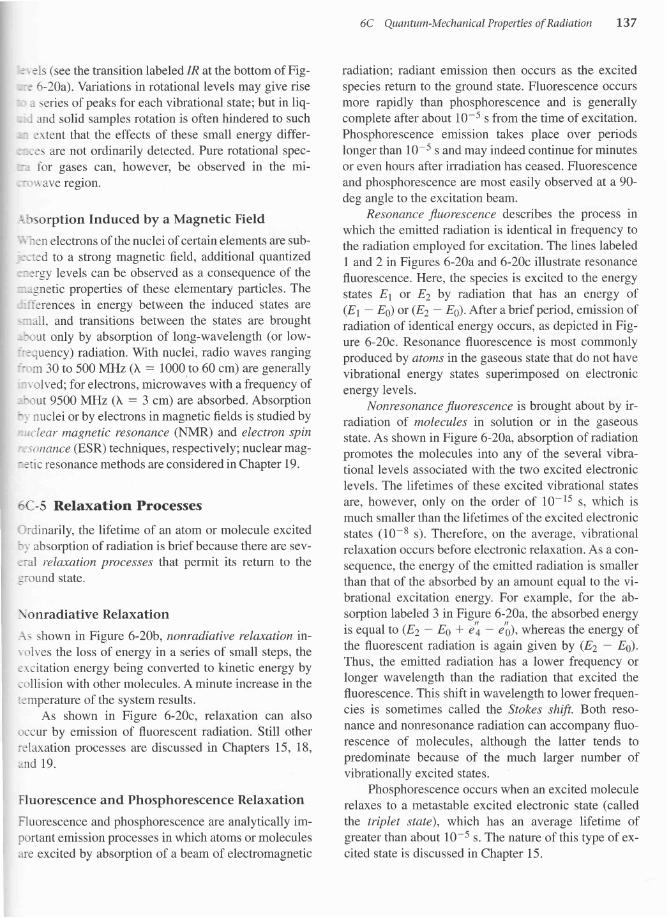
68-11 Polarization of Radiation
Ordinary radiation consists of a bundle of electromag-netic waves in which the vibrations are equally distrib-uted among a huge number of planes centered along thepath of the beam. Viewed end on, a beam of monochro-matic radiation can be visualized as an inf,nite set ofelectrical vectors that fluctuate in length from zero to amaximum amplitude A. Figurc 6-11b depicts an end-onview of these vectors at various times during the pas-
sage of one wave of monochromatic radiation through aflxed point in space.
Figure 6-l2a shows a few of the vectors depicted inFigure 6- 11b at the instant the wave is at its maximum.
(c)stt t ttrtt t ttrFigure 6-ll Unpolaized and plane-polarized radiation:(a) cross-sectional view of a beam of monochromatic radia-tion, (b) successive end-on view of the radiation in (a) if itis unpolarrzed, (c) successive end-on views of the radiationof (a) if it is plane polarized on the vertical axis.
r,4 ( 1.50 1.00)2 _ 0.0400
or 8.5%o
It will become evident in later chapters that losses, -ch as those shown in Example 6-2 are of considerable,; gnificance in various optical instruments.
Reflective losses at a polished glass or quaftz surface
.---rease only slightly as the angle of the incident beam in-::iases up to about 60 deg. Beyond this flgure, however, the
:e:centage of radiation that is reflected increases rapidly.:J approaches l00Vo at 90 deg, or grazing incidence.
bB-10 Scattering of Radiation*r.- Doted earlier, the transmission of radiation in matter: -,n be pictured as a momentary retention of the radiantr-ersy by atorns, ions, or molecules followed by ree-
:-- ssion of the radiation in all directions as the particles
=:urn to their original state. With atomic or molecular: rrticles that are small relative to the wavelength of the..liation, destructive interference removes most but
- I r: all of the reemitted radiation except the radiation.1r.t travels in the original direction of the beam; the: "rh of the beam appears to be unaltered as a conse-
- i3nce of the interaction. Careful observation, how-:., er. reveals that a very small fraction of the radiation> Iransmitted at all angles from the original path and
:- rt the intensity of this scattered radiation increases,, :th particle size.
R.avleigh Scattering
S.-.ittering by molecules or aggregates of molecules with
-:inensions signiflcantly smaller than the wavelength of.,ie radiation is calle d Rayleigh scattering,' its intensity isr-rrportional to the inverse fourth-power of the wave-;r eth, the dimensions of the scattering particles, and the-quare of the polartzability of the particles. An everyday:enifestation of Rayleigh scattering is the blue color of
I*," - 0.85Is

128 Chapter 6 An Introduction to Spectrometric Methods
Figure 6-1,2 (a) A few of the electrical vectors of a beamtraveling perpendicular to the page.
(b) The resolution of a vector in plane XY into two mutu-ally perpendicular components.(c) The resultant when all vectors are resolved (not toscale).
The vector in any one plane, say XY as depicted in Figure6-Ila, can be resolved into two mutually perpendicularcomponents AB and CD as shown in Figure 6-I2b.If thetwo components for all of the planes shown in Figure6-l2a are combined, the resultant has the appearance
shown in Figure 6-12c. Removal of one of the two resul-tant planes of vibration in Figure 6- lZc produces a beamthat is plane polarized. The resultant electric vector of aplane-p olarized beam then occupies a single plane inspace. Figure 6-IIc shows an end-on view of a beam ofplane-polanzed radiation aftq various time intervals.
Plane-p olarized electromagnetic radiation is pro-duced by certain radiant energy sources. For example,the radio waves emanating from an antenna and the mi-crowaves produced by a klystron tube are both planepolartzed. Visible and ultraviolet radiation from relax-ation of a single excited atom or molecule is also polar-ized, but the beam from such a source has no net polar-rzatron since it is made up of a multitude of individualwave trains produced by an enormous number of indi-vidual atomic or molecular events. The plane of polar-tzation of these individual waves is random so that theirindividual pol aizatrons cancel.
Polarized ultraviolet and visible radiation is pro-duced by pass age of radiation through media that selec-
tively absorb, reflect, or refract radiation that vibrates inonly one plane.
6C QUANTI]M.MECHANICALPROPERTIES OF RADIATION
When electromagnetic radiation is emitted or absorbed,
a permanent transfer of energy from the emitting objector to the absorbing medium occurs. In order to describethese phenomena, it is necessary to treat electromag-netic radiation not as a collection of waves but rather as
a stream of discrete particles called photon^s or quanta.
The need for a particle model for radiation became ap-
parent as a consequence of the discovery of the photo-electric effect in the late nineteenth century.
6C-L The Photoelectric Effect
The flrst observation of the photoelectric effect was
made in 1887 by Heinrich Hertz, who reported that asparkjumped more readily between two charged spheres
when their surfaces were illuminated with light. Be-tween the time of this observation and the theoretical ex-planation of the photoelectric effect by Einstein in 1905,
several important studies of the photoelectric effect wereperformed with what is now known as a vacuum photo-tube. Einstein's explanation of the photoelectric effectwas both simple and elegant but was far enough ahead ofits time that it was not generally accepted until 1916,
when Millikan's systematic studies had conf,rmed Ein-stein's theoretical conclusions in every detail.
Figure 6-13 is a schematic of vacuum phototubecircuit similar to the one used by Millikan to study the
Vacuum
Figure 6-13 Apparatus for studying the photoelectriceffect.
(a)
A
B
(b) (c)
Radiation

- roelectric effect. The surface of the large photo-':ir't5ls on the left usually is coated with an alkali: -al or one of its compounds, but other metals may be
::i. When monochromatic radiation impinges on the: - Iocathode, electrons are emitted from its surface
.1 a range of kinetic energies. As long as the voltage..rplied between the anode and the cathode is posi-
-. the electrons are swept from left to right through--- phototube to produce a current I in the circuit.i, :en the voltage across the phototube is adjusted so--r. the anode is slightly negative with respect to the
- :iode, the photoelectrons are repelled by the anode,
r the photocurrent decreases as expected. At thisurt in the experiment, however, some of the electrons
'-. .e sufflcient kinetic energy to overcome the negative:, .:ntial applied to the anode, and a cuffent is still ob-::r Efl.
This experiment may be repeated for phototubes:h different materials coated on the photocathode.- each experiment, the photocurrent is measured as
ir-rnction of the applied voltage, and the voltage Vs.,r hich the photocurrent becomes precisely zero is:ed. The negative voltage at which the photocur-
-:.ri is zero is called the stopping voltage. It coffe---''-'nds to the potential at which the most energetic: rctrons from the cathode are just repelled from the
--:rrrde. If we multiply the stopping voltage by the
-:rrr.-ge on the electrofr, € - -1.60 X 10⁻¹⁹ coulombs,,' have a rneasure of the kinetic energy in joules of
@Nu
Frequen cy , y
6C Quantum-Mechanical Properties of Radiation L29
the most energetic of the emitted electrons. Whenthis experiment is repeated for various frequenciesof monochromatic light, the following results are ob-served:
1,. When light of constant frequency is focused on theanode at low applied negative potential, the pho-tocurrent is directly proportional to the intensity ofthe incident radiation.
2. The magnitude of the stopping voltage depends onthe frequency of the radiation impinging on the pho-
tocathode.3. The stopping voltage depends on the chemical com-
position of the coating on the photocathode.4. The stopping voltage is independent of the intensity
of the incident radiation.
These observations suggest that electromagneticradiation is a form of energy that releases electronsfrom metallic surfaces and imparts to these electronssufflcient kinetic energy to cause them to travel to a
negatively charged electrode. Furthermore, the numberof photoelectrons released is proportional to the inten-sity of the incident beam.
The results of these experiments are shown in theplots of Figure 6-14,, rn which the maximum kinetic en-
ergy, or stopping energy tVo, of the photoelectrons isplotted against frequency for photocathode surfaces ofpotassiuffi, sodium, and copper. Other surfaces giveplots with identical slopes, h, but different intercepts, rrr.
Figure 6-14 Maximum kinetic energy ofphotoelectrons emitted from three metal sur-faces as a function of radiation frequency.
CI)K

In this equation, the slope h is the Planck constant,which is equal to 6.6254 x 10⁻³⁴ joule second, and theintercept t,l is the work function, a constant that is char-acteristic of the surface material. Approximately a
decade before Millikan's work that led to Equation6-16, Einstein had proposed the relationship betweenfrequency v of light and energy E as embodied by hisnow famous equation
E - hv (6-17)
By substituting Einstein's equation into Equation 6-16and rearranging, we obtain
E - hy: eVo + 0)
130 Chapter 6 An Introduction to Spectrometric Methods
The plots shown in Figure 6-14 are described by theequation
eVo: hv + tr)
EXAMPLE 6.3Calculate the energy of (a) a 5.3-A X-ray photon and(b) a 530-nm photon of visible radiation.
hcE-hv:-}'
(a) E- (6.63 x 10⁻³+ J . s) x (3.00 x 10s m/s)
5.30A x (10-10 n/A)
- 3.15 X 10⁻¹⁶ J
The energy of radiation in the X-ray region is com-monly expressed in electron volts, the energy ac-
quired by an electron that has been acceleratedthrough a potential of one volt. In the conversiontable inside the front cover of this book, we see that1J:6.24x 10¹⁸eV.
E - 3.t5 x 10-16 J x 6.24 x 1018 eV/J) -2.34 X 10³ eV
(b) E(6.63 x 10⁻³⁴ J .s) x (3.00 x 10⁸ m/s;
530 nm X (10-g m/nm)
_ 3.75 X 10⁻¹e J
Energy of radiation in the visible region is often ex-pressed in kJ/mol rather than kJ/photon to aid in thediscussion of the relationships between the energy ofabsorbed photons and the energy of chemical bonds.
E-3.75x10-rs J xphoton
(6.02 X 10²³ photons) I _a kJ
mol x 10-, T_ 226 kJ/mol
(6- 16)
(6- 18)
(6- 1e)
E
E
E
E
H
E
H
E
E
E
E
E
E
E
H
E
E
E
E
E
E
E
H
E
E
E
E
E
E
E
H
H
E
E
E
E
E
H
H
E
E
E
E
E
E
E
H
E
E
E]ir
This equation shows that the energy of an incomingphoton is equal to the kinetic energy of the ejected pho-toelectron plus the energy required to eject the photo-electron from the surface being irradiated.
The photoelectric effect cannot be explained by awave model but requires instead a quantum model inwhich radiation is viewed as a stream of discrete bun-dles of energy, or photons. For example, calculationsindicate that no single electron could acquire suffi-cient energy for ejection if the radiation striking thesurface is uniformly distributed over the face of theelectrode as it is in the wave model; nor could anyelectron accumulate enough energy rapidly enough toestablish the nearly instantaneous currents that are
observed. Thus, it is necessary to assume that theenergy is not uniformly distributed over the beamfront but rather is concentrated in packets, or bundlesof energy.
Equation 6- 18 can be recast in terms of wavelengthby substitution of Equati on 6-2. That is,
6C-2 Energry States of Chemical Species
The quantum theory was flrst proposed in 1900 by MaxPlanck, a German physicist, to explain the properties ofradiation emitted by heated bodies. The theory was laterextended to rationahze other types of emission and ab-
sorption processes. Two important postulates of quan-tum theory include:
L. Atoms, ions, and molecules can exist only in certaindiscrete states, characterrzed by definite amounts ofenergy. When a species changes its state, it absorbs
cE-h,:eVo 0)\
Note that although photon energy is directly propor-tional to frequency, it is a reciprocal function of wave-length.

or emits an amount of energy exactly equal to theenergy difference between the states.
2, When atoms, ions, or molecules absorb or emit radi-ation in making the transition from one energy state
to a second, the frequency u or the wavelength \ ofthe radiation is related to the energy difference be-
tween the states by the equation
6C Quantum-Mechanical Properties of Radiation 131
evident in the flgure: lines, bands, and a continubrm. Theline spectrum is made up of a series of sharp, well-de-flned peaks caused by excitation of individual atoms.
The band spectrum consists of several groups of linesso closely spaced that they are not completely resolved.The source of the bands consists of small molecules orradicals. Finally, the continuum portion of the spectrumis responsible for the increase in the background that isevident above about 350 nm. The line and band spectraare superimposed on this continuum. The source of thecontinuum is described on pag e 133.
Figure 6-16 is an X-ray emission spectrum produced
by bombarding a piece of molybdenum with an energeticstream of electrons. Note that in Figure 6-16, there isalso a line spectrum superimposed on a continuum. Thesource of the continuum is described in Section 12A-I.
Line Spectra
Line spectra in the ultraviolet and visible regions are
produced when the radiating species are individualatomic particles that are well separated, in a gas phase.
The individual particles in a gas behave independentlyof one another, and the spectrurn consists of a series ofsharp lines with widths of about 10-4 A. In Figure 6-15,lines for gas-phase sodium, potassium, strontium, and
calcium are identifled.The energy-level diagram in Figure 6-17 a shows
the source of two of the lines in a typical emission spec-
trum of an element. The horizontal line labeled Es cor-responds to the lowest, or ground-state, energy of theatom. The horizontal lines labeled E1 and E2 are twohigher-energy electronic levels of the species. For ex-ample, the single outer electron in the ground state Es
for a sodium atom is located in the 3s orbital. Energylevel E1 then represents the energy of the atom whenthis electron has been promoted to the 3p state by ab-
sorption of thermal, electrical, or radiant energy. Thepromotion is depicted by the shorter wavy arrow on theleft in Figure 6-17a. After perhaps 10-8 s, the atom re-turns to the ground state, emitting a photon whose fre-quency and wavelength are given by Equation 6-20.
v1 _ (h- Edlh
\1 -hcl(\-Eo)This emission process is illustrated by the shorterstraight arrow on the right in Figure 6- 17 a.
For the sodium atom, E2 in Figure 6-17 coffe-sponds to the more energetic 4p state; the resulting
(6-20)
where E1 is the energy of the higher state and Es theenergy of the lower state. The terms c and h are thespeed of light and the Planck constant, respectively.
For atoms or ions in the elemental state, the energyof any given state arises from the motion of electronsaround the positively charged nucleus. As a conse-quence the various energy states are called electronicstotes.In addition to having electronic states, moleculesalso have qtuantrzed vibrational states that are associ-ated with the energy of interatomic vibrations and quan-tized rotational states that arise from the rotation ofmolecules around their centers of gravity.
The lowest energy state of an atom or molecule is
rt\ ground state. Higher energy states are termed excitedstates. Generally at room temperature, chemical species
are in their ground state.
6C-3 Emission of RadiationElectromagnetic radiation is produced when excitedparticles (atoms, ions, or molecules) relax to lower en-er_sy levels by giving up their excess energy as photons.Ercitation can be brought about by a variety of means,
including (1) bombardment with electrons or other ele-rnentary particles, which generally leads to the emissionof X-radiation; (2) exposure to an electrical current ac
spark or the heat of a flame, an atc, or a furnace, whichproduces ultraviolet, visible, or infrared radiation; (3)
irradiation with a beam of electromagnetic radiation,u hich produces fluorescent radiation; an exothermicchemic al rcaction that produces chemiluminescence.
Radiation from an excited source is convenientlycharacteized by means of an emission spectrum, whtchusually takes the form of a plot of the relative power ofthe emitted radiation as a function of wavelength or fre-quency. Figure 6-15 illustrates a typical emission spec-trum, which was obtained by aspirating a brine solutioninto an oxyhydrogen flame. Three types of spectra are
hcE1 -Es:hv:T

t32 Chapter 6 An Introduction to Spectrometric Methods
350 37 5 400
Wavelength, nm
450 500 550 600
Figure 6-15 Emission spectrum of a brine obtained with an oxyhydrogen flame.(F. Homann and C. T. l. Alkemade, Chemical Analysis by Flame Photometry, 2nd ed., p.484. New York:
Interscience, 1963. With peflnission.)
tr
oBqo
(!O&
emittin g radlation \z appears at a shorter wavelength ora higher frequency. The line at about 330 nm in Figure6-15 results from this transition; the 3p-to-3s transitionprovides a line at about 590 nm.
X-Ray line spectra are also produced by electronictransitions. In this case, however, the electrons involvedare those in the innermost orbitals. Thus, in contrast toultraviolet and visible emissions, the X-ray spectrumfor an element is independent of its environment. Forexample, the emission spectrum for molybdenum is thesame regardless of whether the sample being excited ismolybdenum metal, solid molybdenum sulflde, gaseous
molybdenum hexafluoride, or an aqueous solution of an
anionic complex of the metal.
Band Spectra
Band spectra are often encountered in spectral sources
when gaseous radicals or small molecules are present.
For example, in Figure 6-15 bands for OH, MgOH, and
MgO are labeled and consist of a series of closelyspaced lines that are not fully resolved by the instru-ment used to obtain the spectrum. Bands arise from nu-merous qtanttzed vibrational levels that are superim-posed on the ground-state electronic energy level of a
molecule.Figure 6-llb is a partial energy-level diagram for a
molecule that shows its ground state Eg and two of itsseveral excited electronic states, E1 and Ez. Afew of the
Lines
B ands
MgOH bands
qqq\O -i N\Of- F F-f-Ca c.) CO CO
nN\oco
bo
Z
CO
ica-f,
ica$dz
s$
no\$$
z
c1@o\$dz
q\o\o-f,
l,n\o clrO 16$r-c$Z6
li
rn+!n$6i+\n=t
zF-
\o$tr
a
$s\n
L\J
U
ntnln .t
i=-f,tr)\n (,tbo
1"", l\ols lol-i lc.lln lnlo loI bol b{
JE IE
ao
II
I
I
lr-loorn
AI
a
@\o\nlu
z
o\oo\n
z
ca
CAca
c.i
CAcodz
c'lf-$CO
f-+sf,
n$$V
\NN$
U
Continuuma't
at- 't'

0.2 0.4 0.6 0.8 1.0
Wavelength, A
Figure 6-16 X-Ray emission spectrum of molybdenum::-etal.
:rany vibrational levels associated with the ground state
;re also shown. Vibrational levels associated with the:,-\ o excited states have been omitted because the life-rlnne of an excited vibrational state is brief compared..,, irh that of an electronically excited state (about 10-ls s
'. e rsus 1 0 - 8 s). A consequence of this tremendous differ--nce in lifetimes is that when an electron is excited to one
-,tr the higher vibrational levels of an electronic state, re-,eration to the lowest vibrational level of that state oc-; Ltrs before an electronic transition to the ground state: en occur. Therefore, the radiation produced by the elec-:ncal or thermal excitation of polyatomic species nearly
6C Quantum-Mechanical Properties of Radiation 133
always results from a transition from the lowest vibra-tional level of an excited electronic state to any of theseveral vibrational levels of the ground state.
The mechanism by which a vibrationally excitedspecies relaxes to the nearest electronic state involves a
transfer of its excess energy to other atoms in the sys-
tem through a series of collisions. As noted, this process
takes place at an enormous speed. Relaxation from one
electronic state to another can also occur by collisionaltransfer of energy, but the rate of this process is slowenough that relaxation by photon release is favored.
The energy-level diagram in Figure 6-I1b illus-trates the mechanism by which two radiation bands thatconsist of flve closely spaced lines are emitted by a
molecule excited by thermal or electrical energy. For areal molecule, the number of individual lines is muchlarger because in addition to the numerous vibrationalstates, a multitude of rotational states would be super-imposed on each. The differences in energy among therotational levels is perhaps an order of magnitudesmaller than that for vibrational states. Thus, areal mo-lecular band would be made up of many more lines thanwe have shown in Figure 6-Ilb, and these lines wouldbe much more closely spaced.
Continuum Spectra
As shown in Figure 6-18, truly continuum radiation isproduced when solids are heated to incandescence.Thermal radiation of this kind, which is called black-body radiation, is characteristic of the temperature of
Figure 6-17 Energy-level diagrams for (a) a sodiumatom showing the source of a line spectrum and (b) asimple molecule showing the source of a band spec-
trum.
ttTo To
,.J
.=1)
5
KB
35 kV
0
AtomicExcitation emission
MolecularExcitation emission
Ez 4P
Er 3p
-caCA 4
a
J21
0
(a)Thermal orelectrical
energy

Xenon arc
Carbon arc
Tungsten lamp
Nernst glower
4000 K
r34 Chapter 6 An Introduction to Spectrometric Methods
s00 1000 1s00 2000 2500
Wavelength, nm
Figure 6-18 Blackbody radiation curves.
3000
the emitting surface rather than the material of whichthat surface is composed. Blackbody radiation is pro-duced by the innumerable atomic and molecular oscilla-tions excited in the condensed solid by the thermal en-
ergy. Note that the energy peaks in Figure 6-18 shift toshorter wavelengths with increasing temperature. It isclear that very high temperatures are needed to cause athermally excited source to emit a substantial fractionof its energy as ultraviolet radiation.
As noted earlter, part of the continuum backgroundradiation exhibited in the flame spectrum shown in Fig-ure 6-15 is probably thermal emission from incandes-cent particles in the flame. Note that this background de-
creases rapidly as the ultraviolet region is approached.Heated solids are important sources of infrared,
visible, and longer-wavelength ultraviolet radiation foranalytical instruments.
6C-4 Absorption of Radiation
When radiation passes through a layer of solid, liquid,or gas, certain frequencies may be selectively removedby absorption, a process in which electromagnetic en-
ergy is transferred to the atoms, ions, or molecules com-posing the sample.Absorption promotes these particlesfrom their normal room temperature state, or ground
state, to one or more higher-energy excited states.
According to quantum theory, atoms, rnolecules, orions have only a limited number of discrete, energy lev-els; for absorption of radiation to occur, the energy ofthe exciting photon must exactly match the energy dif-ference between the ground state and one of the excitedstates of the absorbing species. Since these energy dif-ferences are unique for each species, a study of the fre-
quencies of absorbed radiation provides a means r-,i
charactertzing the constituents of a sample of matte:For this pu{pos a, 3 plot of absorbance as a function c,;
wavelength or frequency is experimentally determine;(absorbance, a measure of the decrease in radiar."
power, is deflned by Equation 6-32 in Section 6D-lTypical absorption spectra are shown in Figure 6-19.
Examination of the four plots in Figure 6-19 re-
veals that absorption spectra vary widely in appearance
some are made up of numerous sharp peaks, wherea'others consist of smooth continuous curves. In genera*
the nature of a spectrum is influenced by such variable'as the complexity, the physical state, and the environ-ment of the absorbing species. More fundamental, hor,- -
ever, are the differences between absorption spectra fc,r
atoms and those for molecules.
Atomic Absorption
The passage of polychromatic ultraviolet or visible radr-
ation through a medium that consists of monoatomi.particles, such as gaseous mercury or sodium, results i:
(a) Na vapor
589 590
(c) Benzene
hexane
h to3C)
oo..= t0'€0)&
C)()
Cd€oa
-o
0220 260 300 340
Wavelength, nm
Figure 6-19 Some typical ultraviolet absorption spectra.
Benzene vapor
in hexane
Biphenyl in

-: f,bsorption of but a few well-deflned frequencies (seer'
=:ure 6-I9a). The relative simplicity of such spectra is
- -.- to the small number of possible energy states for the
" - -trrbing particles. Excitation can occur only by an
- -.-tronic process in which one or more of the electrons' :he atom are raised to a higher energy level. For exam-
: :. sodium vapor exhibits two closely spaced, sharp ab-
:ption peaks in the yellow region of the visible spec---.:n (589.0 and 589.6 nm) as aresult of excitation of the: :lectron to two 3p states that differ only slightly in en-
= =). Several other narrow absorption lines, coffespond-- = to other allowed electronic transitions, are also ob-
,:rr, e d. For example, an ultraviolet peak at about 285 nm- . - ults from the excitation of the 3s electron in sodium to- -' excited 5p state, a process that requires signiflcantly
-:rater energy than does excitation to the 3p state (in-*. t. the peak at 285 nm is also a doublet; the energy dif-'r:3nce between the two peaks is so smaIl, however, that
-, rst instruments cannot resolve them).Ultraviolet and visible radiation has sufflcient en-
-:g) to cause transitions of the outermost or bonding-.;:trons only. X-Ray frequencies, on the other hand,
-:- several orders of magnitude more energetic (see Ex-
-::-p1e 6-3) and are capable of interacting with electrons:.rt are closest to the nuclei of atoms. Absorption peaks
:rt coffespond to electronic transitions of these inner-"t--
-rSt electrons are thus observed in the X-ray region.
\folecular Absorption
+bsorption spectra for polyatomic molecules, particu-:rlv in the condensed state, are considerably more
: rrnplex than atomic spectra because the number of en-rrg)' states of molecules is generally enormous when:,, 'mpared with the number of energy states for isolated:.orrS. The energy E, associated with the bands of a
.lrrlecule, is made up of three components. That is,
E - Eelectronic I Eviarational * Erotutional 6-21)
.,, here Eelectronic describes the electronic energy of the:'lolecule that arises from the energy states of its severalronding electrons. The second term on the right refers:c the total energy associated with the multitude of in-:eratomic vibrations that are present in molecular.pecies. Generally, a molecule has many more quan-irzed vibrational energy levels than it does electronic.er els. Finally, Erotational is the energy caused by various:otational motions within a molecule; again the numberof rotational states is much larger than the number of vi-brational states. Thus, for each electronic energy state
6C Quantum-Mechanical Properties of Radiation 135
of a molecule, several possible vibrational states nor-mally exist; and for each of these vibrational states, inturn, numerous rotational states are possible. As a con-sequence, the number of possible energy levels for a
molecule is normally orders of magnitude greater thanthe number of possible energy levels for an atomic par-ticle.
Figure 6-20 is a graphical representation of the en-
ergy levels associated with a few of the numerous elec-tronic and vibrational states of a molecule. The heavyline labeled Es represents the electronic energy of themolecule in its ground state (its state of lowest elec-tronic energy); the lines labeled E1 and E2represent theenergies of two excited electronic states. Several ofthe many vibrational energy levels (eg, e1, ., er) are
shown for each of these electronic states.
As can be seen in Figure 6-20, the energy differ-ence between the ground state and an electronically ex-cited state is large relative to the energy differences be-tween vibrational levels in a given electronic state(typically, the two differ by a factor of 10 to 100).
The affows in Figure 6-20a depict some of the tran-sitions that result from absorption of radiation. Visibleradiation causes excitation of an electron from Es to any
of the n vrbrational levels associated with E1 (only flveof the n vrbrational levels are shown in Figure 6-20).Potential absorption frequencies are then given by n
equations, each with the form
wherei - I,2,3,...n.Similarly, if the second electronic state has m
vibrational levels (four of which are shown), potentialabsorption frequencies for ultraviolet radiation aregiven by * equations such as
1ui- ^{n,
+ ,i - Eo)
1ui : =@, + r'i - Eo)n
h' o
(6-22)
(6-23)
wherei - 1,2,3,...m.Finally, os shown in Figure 6-20a, the less ener-
getic near- and mid-infrared radiation can only bringabout transitions among the k vibrational levels of theground state. Here, k potential absorption frequenciesare given by k equations, which may be formulated as
1ui : ,@i eo)
where i - 1,2,3,. . .k.
(6-24)

L36 Chapter 6 An Introduction to Spectrometric Methods
Although they are not shown, several rotational en-ergy levels are associated with each vibrational level inFigure 6-20. The energy difference between the rota-tional energy levels is small relative to the energy dif-ference between vibrational levels. Transitions betweena ground and an excited rotational state is brought aboutby radiation in the 0.01- to 1-cm range, which includesmicrowave and longer infrared radiation.
In contrast to atomic absorption spectra, whichconsist of a series of sharp, well-defined lines, molecu-lar spectrain the ultraviolet and visible regions are ordi-narily characterrzedby absorption regions that often en-
compass a substantial wavelength range (see Figure6-I9b, c). Molecular absorption also involves electronictransitions. As shown by Equations 6-23 and 6-24, how-ever, several closely spaced absorption lines will be as-
sociated with each electronic transition, owing to theexistence of numerous vibrational states. Furthermore,
ExcitedE2 electronic
state 2
ExcitedEr electronic
state 1
1
(c)
GroundEo electronic
state 1
as we have mentioned, many rotational energy levelsare associated with each vibrational state. As a conse-quence, the spectrum for a molecule ordinarily consistsof a series of closely spaced absorption lines that consti-tute an absorption band, such as those shown for ben-zene vapor in Figurc 6-19b. Unless a high-resolution in-strument is employed, the individual peaks may not be
detected, and the spectra will appear as broad smoothpeaks such as those shown in Figure 6-19c. Finally, inthe condensed state, and in the presence of solvent mol-ecules, the individual lines tend to broaden even furtherto give continuous spectra such as that shown in Figure6-I9d. Solvent effects are considered in later chapters.
Pure vibrational absorption is observed in the in-frared region, where the energy of radiation is insuffl-cient to cause electronic transitions. Such spectra ex-hibit naffow, closely spaced absorption peaks that resultfrom transitions among the various vibrational quantum
hSEIo
E]
AbsorptionNonradiative
relaxation
(b)
Fluorescence
(a)
Figure 6-20 Partial energy-level diagrams for a fluorescent organic molecule.
: :1s (see the transition labeled IR at the bottom of Fig-": 6-20a). Variations in rotational levels may give rise* series of peaks for each vibrational state; but in liq-* and solid samples rotation is often hindered to such- 3\tent that the effects of these small energy differ-
- - cs are not ordinarily detected. Pure rotational spec-
for gases can, however, be observed in the mi-- ' - ,r, ave reglon.
., Lrsorption Induced by a Magnetic Field
', :'.3n electrons of the nuclei of certain elements are sub-
;-ie d to a strong magnetic fleld, additional quantrzed
- :rgy levels can be observed as a consequence of the
-,rnetic properties of these elementary particles. The
- =erences in energy between the induced states are
.-r11. and transitions between the states are brought. : rut only by absorption of long-wavelength (or low-".qlrency) radiation. With nuclei, radio waves ranging-- ;n 30 to 500 MHz (\ : 1000 to 60 cm) are generally
, olved; for electrons, microwaves with a frequency of- ^ l-rt 9500 MHz (\ - 3 cm) are absorbed. Absorption
, -'[ear rnagnetic resonance (NMR) and electron spini t.t77 51rce (ESR) techniques, respectively; nuclear mag-
- =:ic resonance methods are considered in Chapter 19.
oC-5 Relaxation Processes
i i-dinarily, the lifetime of an atom or molecule excitedr ,, absorption of radiation is brief because there are sev-
.::1 relaxation processes that permit its return to the
- tt-r u rtd state.
\onradiative Relaxation-rS shown in Figurc 6-20b, nonradiative relaxation rn-. --,ives the loss of energy in a series of small steps, the.',citation energy being converted to kinetic energy by:,-'l1ision with other molecules. A minute increase in the:imperature of the system results.
As shown in Figure 6-20c, relaxation can also
-,..--cur by emission of fluorescent radiation. Still otherrelaxation processes are discussed in Chapters 15, 18,
:nd 19.
Fluorescence and Phosphorescence Relaxation
Fluorescence and phosphorescence are analytically im-cortant emission processes in which atoms or moleculeslre excited by absorption of a beam of electromagnetic
6C Quantum-Mechqnical Properties of Radiation I37
radiation; radiant emission then occurs as the excitedspecies return to the ground state. Fluorescence occursmore rapidly than phosphorescence and is generally
complete after about 10-s s from the time of excitation.Phosphorescence emission takes place over periods
longer than 10-s s and may indeed continue for minutes
or even hours after irradiation has ceased. Fluorescenceand phosphorescence are most easily observed at a 90-deg angle to the excitation beam.
Resonance fluorescence describes the process inwhich the emitted radiation is identical in frequency tothe radiation employed for excitation. The lines labeled
1 and 2 tn Figure s 6-20a and 6-20c illustrate resonance
fluorescence. Here, the species is excited to the energy
states E1 or E2 by radiation that has an energy of(h - Es) or (Ez - Ed. After a brief period, emission ofradiation of identical energy occurs, as depicted in Fig-ure 6-20c. Resonance fluorescence is most commonlyproduced by atoms in the gaseous state that do not have
vibrational energy states superimposed on electronicenergy levels.
Nonresonance fluorescence is brought about by ir-radiation of molecules in solution or in the gaseous
state. As shown in Figure 6-20a, absorption of radiationpromotes the molecules into any of the several vibra-tional levels associated with the two excited electroniclevels. The lifetimes of these excited vibrational states
are, however, only on the order of 10-15 s, which is
much smaller than the lifetimes of the excited electronicstates (10-s s). Therefore, on the average, vibrationalrelaxation occurs before electronic relaxation. As a con-sequence, the energy of the emitted radiation is smallerthan that of the absorbed by an amount equal to the vi-brational excitation energy. For example, for the ab-
sorption labeled 3 in Figure 6-20a, the absorbed energyis equalto (E2 - Es * u'4 - ,"d,whereas the energy ofthe fluorescent radiation is again given by (Ez Ed.Thus, the emitted radiation has a lower frequency orlonger wavelength than the radiation that excited thefluorescence. This shift in wavelength to lower frequen-cies is sometimes called the Stokes shift. Both reso-nance and nonresonance radiation can accomp any fluo-rescence of molecules, although the latter tends topredominate because of the much larger number ofvibrationally excited states.
Phosphorescence occurs when an excited moleculerelaxes to a metastable excited electronic state (calledthe triplet state), which has an average lifetime ofgreater than about 10-s s. The nature of this type of ex-cited state is discussed in Chapter 15.

138 Chapter 6 An Introduction to Spectrometric Methods
6C-6 The Uncertainty Principle
The uncertainty principle was flrst proposed in 1927 byWerner Heisenberg, who postulated that nature places
limits on the precision with which certain pairs of physi-cal measurements can be made. The uncertainty princi-ple, which has important and widespread implications ininstrumental anatrysis, is readily derived from the princi-ple of superposition, which was discussed in Section6B-4. Applications of this principle will be found in sev-
erullater chapters that deal with spectroscopic methods.S
Let us suppose that we wish to determine the fre-quency uy of a monochromatic beam of radiation bycomparing it with the output of a standard clock, whichis an oscillator that produces a light beam that has a pre-
cisely known frequency of v2. To detect and measure
the difference between the known and unknown fre-quencies, A/ : v1 v2, we allow the two beams to in-terfere as in Figure 6-5 and determine the time intervalfor a beat (A to B in Figure 6-5). The minimum time Ltrequired to make this measurement must be equal to orgreater than the period of one beat, which as shown inFigure 6-5, is equal to llLv. Therefore, the minimumtime for a measurement is given by
Lt > llLv
LtLv > I (6-2s)
Note that to determine Az withzerc uncertainty, an infl-nite measurement time is required. If the observationextends over a very short period, the uncertainty will be
large.Let us multiply both sides of Equation 6-25 by the
Planck constant to give
Lt'(hLv)- h
From Equation 6-lJ , it is apparent that
and
LE : hLy
Lt. LE: h (6-26)
Equati on 6-26 is one of several ways of formulating theHeisenberg uncertainty principle. The meaning inwords of this equation is as follows. If the energy E of aparticle or system of particles-photons, electrons, neu-
s A general essay on the uncertainty principle, including applica-tions, is given byL. S. Bartell, l. Chem.Ed., 1985, 62,792.
trons, or protons, for example-is measured for an ex-actly known period of time A{, then this energy is un-certain by at least hlLt. Therefore, the energy of a partr-cle can be known with zero uncertainty only if it is
observed for an inflnite period. For flnite periods, theenergy measurement can never be more precise thanhlLt. The practical consequences of this limitation willappear in several of the chapters that follow.
6D QUANTITATIVE ASPECTS OFSPECTROCHEMICALMEASUREMENTS
As shown in Table 6-2, spectrochemical methods fallinto four major categories. A11 four require the measure-ment of radi ant power n which is the energy of a beamof radiation that reaches a given areaper second. In mod-ern instruments, radiant power is determined with a radi-ation detector that converts radiant energy into an elec-trical signal S. Generally S is a voltage or a cuffent thatideally is directly proportional to radiant power. That is,
s - kP (6-21)
wherekisaconstant.Many detectors exhibit a small, constant response,
known as a dark current, Ln the absence of radiation. Inthose cases, the response is described by the relationship
s-kP+ka (6-28)
where fu is the dark current, which is generally smalland constant at least for short periods of time. Spectro-chemical instruments are usually equipped with a com-pensating circuit that reduce s ka to zero whenever mea-surements are made. With such instruments, Equation6-21 then applies.
6D-1 Emission, Luminescence,and Scattering Methods
As shown in column 3 of Table 6-2, in emission, lumines-cence, and scattering methods, the power of the radiationemitted by an analyte after excitation is ordinarily directlyproportional to the analyte concentration c (P, - kc).
Combining this equation with Equation6-28 gives
^s - k'c (6-2e)
where k' is a constant that can be evaluated by excitinganalyte radiation in one or more standards and by mea-suring S. An analogous relationship also applies forluminescence and scattering methods.

6D Quantitative Aspects of Spectrochemical Measurements 139
T {BLE 6-2 Maior Classes of Spectrochemical Methods
S --attering Scattered, Pr.
rbsorption Incident, Po, and transmitted, P
,bD-z Absorption Methods
.:qulre two power measurements: one before a beam:-.:S passed through the medium that contains the ana-
.,r.-' (Po) and the other after (P). Two terms, which are,. .Cely used in absorption spectrometry and are related
. -, the ratio of Pg and P, are transmittance and ab-, ','bance.
Transmittance
F- qure 6-21 depicts a beam of parallel radiation before
-"d after it has passed through a medium that has a
li.-kness of b cm and a concentration c of an absorbing
'r,ecies. As a consequence of interactions between the
rnotons and absorbing atoms or molecules, the power.: the beam is attenuated from Ps to P The transmit-
: -;itce T of the medium is then the fraction of incident:,rdiation transmitted by the medium:
lYpe of Methods
Atomic emission
Atomic and molecular fluorcscence,
phosphorescence, and chemiluminescence
Raman scattering, turbidimetry, and nephelometry
Atomic and molecular absorption
r 3SS
_ -- rllnescence
Radiant PowerMeasured
Emitted, P,
Luminescent, P7
ConcentrationRelationship
Pr: kc
P7: kc
Pr,: kc
P-los - - kc"Po
Transmittance is often expressed as a percentage or
voT-f r tooc,o (6-31)Ps
-\bsorbance
The absorbance A of a medium is deflned by the equa-
tron
Beer's Law
For monochromatic radiation, absorbance is directlyproportional to the path length b through the mediumand the concentration c of the absorbing species. These
relationships are given by
(6-33)
where a rs a proportionality constant called the absorp-
tivity. The magnitude of a will clearly depend upon the
units used for b and c. For solutions of an absorbingspecies, b rs often given in terms of centimeters and cin grams per liter. Absorptivity then has units ofL g-1 cm-1.
When the concentration in Equation 6-32 is ex-pressed in moles per liter and the cell length is in cen-timeters, the absorptivity is called the molar absorptiv-ity and is given the special symbol e. Thus, when b is incentimeters and c is in moles per liter,
A- ebc (6-34)
where e has the units L mol-1 cm-1.Equations 6-33 and 6-34 are expressions of Beer's
law, which serves as the basis for quantitative analyses
+fi+
PT--Ps
-PsA_ -1ogrcT: togi
(6-30)
DIDI0
\ote that, in contrast to transmittance, the absorbance
of a medium increases as attenuation of the beambecomes greater.
,,,ii::ii:ii:i:i
Absorbingsolution of
concentratron c
Figure 6-21 Attenuation of a
absorbing solution.
a _ rcepf
(6-32)
N ::,: :,;::: i:,::i :,
P0-)i,:..:i:::::i:::.:::..:,:::l,:::::.,.:1:PV J::: : :J: :
beam of radiation by an
ll)
6E Questions and Problems L4l
- - f I E f L L U E I H H f; T L & L & UlKUii L E T & g E TE E UH L;i H LK H H 6 U U & W HhL L L L L L L L L L L L
:,E QUESTIONS AND PROBLEMS
.j-1 Deflne(a) coherent radiation.(b) dispersion of a transparent substance.
(c) anomalous dispersion.(d) work function of a substance.(e) photoelectric effect.(f) ground state of a molecule.(g) electronic excitation.(h) blackbody radiation.(i) fluorescence.() phosphorescence.(k) resonance fluorescence.(1) photon.
(m) absorptivity.(n) wavenumber.(o) relaxation.(p) Stokes shift.
Calculate the frequency in hertz, the energy injoules, and the energy in electron voltsof an X-ray photon with a wavelength of 2.70 L.
o - 3 Calculate the frequency inhertz, the wavenumber, the energy in joules, and the energy inkJ/molassociatedwiththe5.Tl5 pmvibrationalabsorptionbandof analiphaticketone.
o-{ Calculate the wavelength and the energy in joules associated with an NMR signal at
220MHz.
o-5 Calculate the velocity, frequency, and wavelength of the sodium D line (\ : 589 nm)as light from this source passes through a species whose refractive index, 12, is 1.43.
l-6 When the D line of sodium light impinges an airldiamond interface at an angle of inci-dence of 30.0 deg, it is found that the angle of refraction is 1 1.9 deg. What is n2 for di-amond?
l- 7 What is the wavelength of a photon that has three times as much energy as that of aphoton whose wavelength is 500 nm?
r -8 The silver iodide bond energy is approximately 255 kJ/mol (AgI is one of the possible
active components in photogray sunglasses). What is the longest wavelength of lightthat is capable ofbreaking the bond in silver iodide?
o-9 Cesium is used extensively in photocells and in television cameras because it has thelowest ionization energy of all the stable elements.(a) What is the maximum kinetic energy of a photoelectron ejected from cesium by
500 nm light? Note that if the wavelength of the light used to irradiate the cesiumsurface becomes longer than 660 nm, no photoelectrons are emitted.
(b) Use the rest mass of the electron to calculate the velocity of the photoelectron in(a).
:- 10 The Wien displacement law for blackbody radiators states that the product of tempera-ture in kelvin and the wavelength of maximum emission is a constant k(k : T. \-*).

L42 Chapter 6 An Introduction of Spectrometric Methods
Calculate the wavelength of maximum emission for a Globar infrared source operatedat 1400 K. Use the data in Figure 6-18 for the Nernst glower for the evaluation of theconstant.
6-1L Calculate the wavelength of(a) thesodiumlineat589nminanaqueoussolutionthathasarefractiveindexof 1.35.(b) the output of a ruby laser at 694.3 when it is passing through a piece of quartz that
has a refractive index of 1.55.
6-'1.2 Calcdate the reflection loss when a beam of radiant passes through an empty quartz
cell assuming the refraction index of quartz is 1.55.
6-L3 Explain why the wave model for radiation cannot account for the photoelectric effect.
6-14 Convert the following absorbance data into percent transmrttance:(a) 0.375, b) 1.325, (c) 0.012.
6-15 Convert the following percent transmittance data into absorbance:(a) 33.6, (b) 92.t, (c) 1.75.
6-1"6 Calculate the percent transmittance of solutions with half the absorbance of those inProblem 6-14.
6-t7 Calculate the absorbance of solutions with half the percent transmittance of those inProblem 6-15.
6-18 A solution that was 4.14 x 10⁻³ M in X had a transmittance of 0.126 when measuredin a 2.00-cm cell. What concenffation of X would be required for the transmittance tobe increased by a factor of 3 when a 1.00-cm cell was used?
6-19 A compound had a molar absorptivity of 2.t7 X 103 L cm-l mol-l. What concentra-tion of the compound would be required to produce a solution that has a transmittanceof 8.427o in a 2.50-cm cell?

L4O Chapter 6 An Introduction to Spectrometric Methods
S olventce11
VadialI set
t--l
I
_tI
I
-l t-
tos
er
I+I
I
TI+I
/tteShu
IE
gm
lVo
b1
ag
)0(
:ial
hri10
t arrac
aphraet 10(
IIr-l
l1-l1l1-t;lpL_I
Tungsten Filterlamp
Sample Photoelectricdevice
by both atomic and molecular absorption measure-ments. Certain limitations to the applicability of Beer'slaw are encountered, and these limitations will be dis-cussed in detail in Section 138.
Measurement of Transmittanceand Absorbance
Figure 6-22 is a schematic of a simple instrument calleda photometer used for measuring the transmittance and
absorbance of aqueous solutions with a flltered beam ofvisible radiation. Here, the radiation from a tungstenbulb passes through a colored glass filter that restrictsthe radiation to a limited band of contiguous wave-lengths. The beam then passes through a variable di-aphragm that permits adjustment of the power of the ra-diation that reaches the transparent cell that contains thesample. A shutter can be imposed in front of the di-aphragm that completely blocks the beam. With theshutter open, the radiation impinges on a photoelectricdevice that converts the radiant energy of the beam to adc current that is detected and measured with a mi-croammeter. The output of the meter S is described byEquation 6-28. Note that the meter has a linear scale
that extends from 0 to 100.
In order to make such an instrument direct readingin percent transmittance, two preliminary adjustmentsare catried out, namely the 0%o T, or dark cltrrent, ad-
2.0 1.5 1.0 0.8 0.7
Figure 6-23 Readout
VoT
50
0.6 0.5 0.4 0.3
A
for an inexpensive photometer.
Figure 6-22 Single-beam photometer for ab-
sorption measurements in the visible region.
jwstment, andthe 100Vo T adjustment. The }Vo T adjust-ment is made with the detector screened from thesource by closing the mechanical shutter. Any smalldark current in the detector is nulled electrically untilthe needle of the detector reads zero.
The 1007o 7 adjustment is made with the shutteropen and with the solvent cell in the light path. Usually,the solvent is contained in a cell that is as nearly as pos-sible identical to the cell that contains the sample. The1007o Z adjustment with this instrument involves vary-ing the power of the beam by means of the variable di-aphragm; in some instruments, the same effect is real-tzed by varying the radiant output of the source
electrically. The radiant power that reaches the detectoris then varied until the meter reads exactly 100. Effec-tively, this procedure sets Po in Equation 6-31 at l00%o.
When the solvent is replaced by the cell that containsthe sample, the scale then indicates the percent trans-mittance directly, as shown by the equation
ror- |, tooro - lx W - PPs lpU%o
Obviously, an absorbance scale can also be scribed onthe readout device. As shown in Figure 6-23, such a
scale will be nonlinear unless the output is converted toa logarithmic function by suitable hardware or soft-ware.
cell
0.2 0.0s 0.00