An Introduction to Microeconomics - COPYRIGHTED MATERIAL
12
CHAPTER 1 1 An Introduction to Microeconomics Memorable Quote “Don’t measure yourself by what you have accomplished, but rather by what you should have accomplished with your ability.” —John Wooden, UCLA basketball coaching legend with an opportunity-cost-based perspective Why have health-care costs been rising? Will policies intended to provide universal health-care coverage brake such cost increases in the future? If the government requires employers to provide Social Security/pension support and health care for employees, who bears the cost of such a mandate? How did mortgage-backed securities and incen- tive systems contribute to the financial market meltdown of 2007–2009? Will financial market regulations passed by the U.S. government mitigate the likelihood of such down- turns in the future? Why are Americans getting fatter? Will issuing firms tradable permits to pollute be an effective way to deal with global warming? Should apparent monopolies such as Facebook, Microsoft, Google, and Apple be praised for their efficiency and prof- itability, or should they be subject to antitrust prosecution and broken up? What can be done to prevent future oil spill disasters such as the one involving British Petroleum in the Gulf of Mexico in 2010? Does government-provided unemployment insurance increase or decrease unemployment? Does the Internet promote competition or cartelization? Why do dry cleaners charge more to launder women’s blouses than men’s shirts? Should the federal minimum wage in the United States be raised from its present $7.25 per hour level? What will be the effects if the State of New York raises its minimum wage to $15 per hour? Are bans on cell phone calls by drivers warranted? As these questions suggest, there are many interesting issues that microeconomic theory can help us understand. This text presents the analytical techniques of microeconomics and shows how to apply them to explain and predict real-world phenomena. Learning Objectives • Convey the scope of microeconomic theory. • Explain why theory is essential to understanding and predicting real-world outcomes. • Distinguish between positive and normative analyses. • Differentiate between real and nominal prices. • Describe the basic assumptions economists make about market participants. • Introduce the concept of opportunity cost and explain how economic costs differ from accounting costs. • Show how a production possibility frontier graphically depicts the basic assumptions econo- mists make about market actors as well as the concept of opportunity cost. COPYRIGHTED MATERIAL
-
Upload
khangminh22 -
Category
Documents
-
view
0 -
download
0
Transcript of An Introduction to Microeconomics - COPYRIGHTED MATERIAL
CHAPTER 1
1
An Introduction to Microeconomics
Memorable Quote“Don’t measure yourself by what you have accomplished, but rather by what you should have accomplished with your ability.”
—John Wooden, UCLA basketball coaching legend with an opportunity-cost-based perspective
Why have health-care costs been rising? Will policies intended to provide universal health-care coverage brake such cost increases in the future? If the government requires employers to provide Social Security/pension support and health care for employees, who bears the cost of such a mandate? How did mortgage-backed securities and incen-tive systems contribute to the financial market meltdown of 2007–2009? Will financial market regulations passed by the U.S. government mitigate the likelihood of such down-turns in the future? Why are Americans getting fatter? Will issuing firms tradable permits to pollute be an effective way to deal with global warming? Should apparent monopolies such as Facebook, Microsoft, Google, and Apple be praised for their efficiency and prof-itability, or should they be subject to antitrust prosecution and broken up? What can be done to prevent future oil spill disasters such as the one involving British Petroleum in the Gulf of Mexico in 2010? Does government-provided unemployment insurance increase or decrease unemployment? Does the Internet promote competition or cartelization? Why do dry cleaners charge more to launder women’s blouses than men’s shirts? Should the federal minimum wage in the United States be raised from its present $7.25 per hour level? What will be the effects if the State of New York raises its minimum wage to $15 per hour? Are bans on cell phone calls by drivers warranted?
As these questions suggest, there are many interesting issues that microeconomic theory can help us understand. This text presents the analytical techniques of microeconomics and shows how to apply them to explain and predict real-world phenomena.
Learning Objectives
• Convey the scope of microeconomic theory.• Explain why theory is essential to understanding and predicting real-world outcomes.• Distinguish between positive and normative analyses.• Differentiate between real and nominal prices.• Describe the basic assumptions economists make about market participants.• Introduce the concept of opportunity cost and explain how economic costs differ from
accounting costs.• Show how a production possibility frontier graphically depicts the basic assumptions econo-
mists make about market actors as well as the concept of opportunity cost.
COPYRIG
HTED M
ATERIAL

2 Chapter One • An Introduct ion to Microeconomics •
This chapter introduces microeconomic theory by fi rst discussing its nature and the role of theory in general. The remainder of the chapter covers the basic assumptions economists make about market participants and the key concept of opportunity cost.
The Scope of Microeconomic Theory
The prefi x micro- in microeconomics comes from the Greek word mikros , meaning small. It contrasts with macroeconomics, the other branch of economic theory. Macroeconomicsdeals primarily with aggregates, such as the total amount of goods and services produced by society and the absolute level of prices, while microeconomics analyzes the behavior of “small” units: consumers, workers, savers, business managers, fi rms, individual industries and markets, and so on. Microeconomics, however, is not limited to “small” issues. Instead, it refl ects the fact that many “big” issues can best be understood by recognizing that they are composed of numerous smaller parts. Just as much of our knowledge of chemistry and physics is built on the study of molecules, atoms, and subatomic particles, much of our knowledge of economics is based on the study of individual behavior.
Individuals are the fundamental decision makers in any society. Their decisions, in aggregate, defi ne a society ’ s economic environment. Consumers decide how much of various goods to purchase, workers decide what jobs to take, and business owners decide how many workers to hire and how much output to produce. Microeconomics encompasses the factors that infl uence these choices and the way these innumerable small decisions merge to deter-mine the workings of the entire economy. Because prices have important eff ects on these individual decisions, microeconomics is frequently called price theory.
The Nature and Role of Theory
In disciplines from physics to political science, using a theory to make sense of a complex reality is essential. Facts do not always “speak for themselves.” In economics, facts may describe a historical episode, but facts can never explain why the episode occurred or how things would have been diff erent had, for example, the government pursued another policy. Moreover, facts can never demonstrate how, for instance, a change in agricultural price sup-ports will aff ect agricultural production next year. For purposes of explanation or prediction, we must employ a theory that shows how facts are related to one another.
Theory in economics, as in other sciences, is based on certain assumptions. For example, economists assume that fi rms strive to maximize profi t. Based on this assumption, the economic theory of the fi rm explains what mix of steel and plastic fi rms such as Toyota and General Motors (GM) employ in production as well as how many cars and trucks they produce. Theory also explains how Toyota ’ s and GM ’ s desired input mixes and fi nal output levels are aff ected by changes in, say, the price of steel or the price received per car sold.
Economic theory can be used to predict as well as to explain real-world outcomes. For instance, the basic supply–demand model (discussed in Chapter 2 ) can explain the eff ects observed in cities that have enacted rent control laws. It can also predict the eff ects should the federal government impose similar price ceilings on health-care services.
What Is a Good Theory? How do we know if a theory, whether it be in economics, physics, or political science, is a “good” theory? Basically, a theory is considered to be valid and useful if it successfully explains and predicts the phenomena that it is intended to explain and predict . In keeping
The Scope of Microeconomic Theory 1.1
macroeconomics the study of aggregate economic factors
microeconomics the study of the behavior of small economic units such as consumers and fi rms
price theory another term for microeconomics
The Nature and Role of Theory 1.2

• Posit ive versus Normative Analys is 3
with this litmus test, theories are continually stacked up against real-world data. Depending on how well a theory matches the data, the theory is maintained, refi ned, or sometimes even discarded (perhaps in favor of a competing explanation). The continual process of testing the-ories against real-world data is critical to the advancement of any science, not just economics.
In testing a theory, it is important to note that imperfection tends to be the norm. That is, “good” theories typically do not explain the observed data perfectly, nor are the assump-tions on which they are based entirely realistic. For example, consider the calorie theory , one accepted by millions of people. The calorie theory holds that a person ’ s weight depends on the number of calories consumed per day: the more calories ingested, the heavier the person will be.
The calorie theory predicts that to lose weight, a person should cut his or her calorie intake. Is this a valid and useful theory? Consider two criticisms: fi rst, the calorie theory is based on assumptions that are not completely realistic. That is, no one has ever seen a calorie, much less observed the human body convert it into weight. Second, the theory is not perfect. Reducing your calorie intake will not necessarily make you thin. Other factors, besides calories, infl uence a person ’ s weight: heredity, exercise, metabolism, ratio of fat to protein consumption, and so on.
Does this mean that people who count calories are wrong? Not at all. In fact, the calorie theory is quite useful for millions of weight watchers around the world. For them, the gen-eral relationship between calories and weight tends to hold and becomes even stronger once the calorie theory is refi ned to account for other factors such as heredity, exercise, metabo-lism, and so forth.
Such is the case with economics. While fi rms may not appear to maximize profi t (think about Tesla, Twitter, and Amazon in their start-up years), and refi nements accounting for special features of particular markets may be necessary (long-run versus short-run profi t-ability in industries where fi rms must make substantial up-front research and development investments), the economic theory of the fi rm based on the assumption of profi t maximi-zation successfully explains and predicts a wide range of real-world phenomena. Thus, the theory is useful to both business managers and public policymakers.
Positive versus Normative Analysis
Economic theory is a tool for understanding relationships in the economy. While it can explain the behavior of market actors, it cannot determine which public policies are desirable and which are not. Economics can help us evaluate the results of public policies, but it never, by itself, demonstrates whether the results are good or bad.
Consider the federal minimum wage—fi rst set in 1938 at $0.25 per hour and periodi-cally increased over the years (to $7.25 per hour by 2009). Evaluating the desirability of this policy requires three steps. First, one must determine the qualitative eff ects of the policy. For example, how does it aff ect the employment of workers by fi rms? Does it increase or decrease employment? Second, one must determine the magnitude of the eff ects. If the minimum wage leads to less employment, how much less? How many workers lose their jobs and how many retain their jobs at the higher wage rate? Finally, a judgment needs to be made as to whether the policy ’ s eff ects are desirable. Does the benefi t to workers who remain employed outweigh the costs to those workers whose jobs are cut?
The fi rst step involves identifying the qualitative nature of a policy ’ s consequences. This step is in the realm of positive analysis, assessing the expected, objective outcomes. The dis-tinguishing feature of positive analysis is that it deals with propositions that can be tested with respect to both their underlying logic and the empirical evidence. It deals with what is, or what might be, without deciding whether something is right or wrong, good or bad. Positive analysis is scientifi c because it draws on accepted rules of logic and evidence, of both a
Positive versus Normative Analysis 1.3
positive analysis assessment of expected, objective outcomes

4 Chapter One • An Introduct ion to Microeconomics •
qualitative and quantitative nature, that can be used to determine the truth or falsity of state-ments. Microeconomic theory is a form of positive analysis; it can be used, for example, to make the qualitative prediction that a minimum wage law will reduce employment.
If we want to resolve the question of desirability, however, identifying the qualitative nature of the eff ects is not suffi cient. We also need some idea of the size of the eff ects. It may matter a great deal whether the minimum wage causes 1 percent or 25 percent of unskilled workers to lose their jobs. Note that this step still involves positive analysis, but in quantitative rather than qualitative terms.
Knowing the consequences, both qualitative and quantitative, is still not suffi cient to determine whether a policy is desirable. A fi nal step is necessary: we must decide whether the consequences themselves are, on balance, desirable. To make this evaluation, each person must make a normative analysis, or value judgment. By nature, such a judg-ment is nonscientifi c. It cannot be proved right or wrong by facts, evidence, or logic. It stems from the value system of the person making the judgment. For example, a belief that it is desirable to raise the wages of the lowest-paid workers, even at the expense of others, falls into this category. People may agree that a particular policy has this eff ect, but some may hold that the outcome is desirable and others that it is not. Their value judgments diff er.
Microeconomic theory cannot demonstrate that a particular set of economic institu-tions or policies is desirable—and neither, for that matter, can any other scientifi c branch of knowledge. A belief that something is desirable requires a nonscientifi c judgment of what constitutes desirability , and that value judgment is the domain of normative analysis. None-theless, microeconomic theory can assist each of us in reaching such normative judgments by helping us determine the likely outcomes. In other words, microeconomics helps us take the fi rst two of the three steps necessary to evaluate real-world phenomena.
Market Analysis and Real versus Nominal Prices
Most of microeconomics involves the study of how individual markets function. Markets involve the interplay of all potential buyers and sellers of a particular commodity or service. Most economic issues concern the way particular markets function. For example, an econo-mist ’ s wages are likely to be higher than those of a gas station attendant but lower than those of a doctor. This situation refl ects the workings of the three labor markets.
To analyze markets, we concentrate on factors having the greatest infl uence on the decisions of buyers and sellers. Prices receive special attention. Prices result from market transactions, but they also strongly infl uence the behavior of buyers and sellers in every market.
In microeconomics, the term price always refers to the relative or real price of an item. The nominal price, or absolute price , by itself does not tell us how costly an item really is. Is a 10-cent cup of coff ee expensive? In 1900 it would have been outrageously expensive; today it would be a bargain. The problem with nominal prices is that a dollar is an elastic yardstick. The real price of a good refl ects its nominal price adjusted for the changing value of money . Table 1.1 clarifi es the distinction between real and nominal prices. Between 1983 and 2019, the price level, or average price of goods and services, rose by 153 percent according to the consumer price index (CPI). This can be determined by the facts that the CPI for all items was 253 in 2019 and 100 in the base year, 1983, so it rose by:
( ) /253 100 100 153 percent.
The CPI measures the change in nominal prices. Table 1.1 indicates that the nominal prices of some goods, such as college tuition, rose by much more than the average 153 percent, and the prices of others, like telephone services, rose less.
normative analysis a nonscientifi c value judgment
Market Analysis and Real versus Nominal Prices 1.4
markets the interplay of all potential buyers and sellers of a particular commodity or service
nominal price the absolute price, not adjusted for the changing value of money
real price the nominal price adjusted for the changing value of money

• Bas ic Assumptions about Market Part ic ipants 5
The last column in Table 1.1 lists the change in each item ’ s price compared with the change in the average of all prices. Although the nominal price of gasoline rose by 107 per-cent, the overall price level rose by 153 percent over the same period, so the real price of gasoline actually fell by 30 percent:
( ) /107 153 153 30 percent.
No matter how the nominal price changed between 1983 and 2013, an economist would say that the prices of the fi rst four individual items rose while the prices of the last four fell. The term price always refers to a real price. The prices we use in discussion and in various dia-grams refer to real prices, unless otherwise noted. But these prices are generally measured in dollar units. This practice is legitimate as long as we are using dollars of constant purchasing power —which is the same as measuring each price in comparison with the general price level.
Basic Assumptions about Market Participants
Economists make three basic assumptions about buyers and sellers. Let us address these in turn: goal orientation, rationality, and scarcity. First, market participants are presumed to be goal oriented—that is, interested in fulfi lling their own personal goals. For example, the Sultan of Brunei may desire an opulent personal jet and advanced medical care for his country ’ s people. Maverick entrepreneur Richard Branson has longed to cir-cumnavigate the globe in a hot air balloon while launching and growing successful ven-tures such as Virgin Records and Virgin Atlantic Airways. The late fi lm star Marilyn Monroe hoped for ever greater success on the screen and stage, an Academy Award, and children of her own.
Basic Assumptions about Market Participants 1.5
goal-oriented behavior the behavior of market participants interested in fulfi lling their own personal goals
Index of Nominal Prices in 2019 (1983 = 100)
Change in Real Prices, 1983–2019
All items 253 — Tobacco and smoking products 1088 +546% College tuition and fees 858 +395% Medical care services 528 +178% Residential rent 326 +48% Gasoline 207 −30% Apparel 126 −83% Telephone services 89 −107% Personal computers and peripheral
equipment 40 −139%
Nominal and Real Price Changes, 1983–2019 Table 1.1
Source: https://www.bls.gov/cpi, March 14, 2019.
Real versus Nominal Presidential Salaries
President Donald Trump was paid a government salary of $400,000 in 2019, or 16 times what President Abraham Lincoln earned 156 years prior. Yet, expressed in constant dollars, Lincoln ’ s salary of $25,000 in 1863 equates to
$702,778 in constant 2019 dollars (the CPI was 9 for 1863 versus 253 in 2019). While the salary paid to U.S. presidents has grown markedly in nominal terms over the last century and a half, it has declined in real terms.
APPLICATION 1 .1

6 Chapter One • An Introduct ion to Microeconomics •
The assumption of goal-oriented behavior often is taken to indicate that individuals are self-interested. This assumption, however, does not imply that market participants care solely about their own pocketbooks. As economists use this term, the behavior of Nobel Peace Prize winner Mother Teresa could accurately be described as goal oriented. Although Mother Teresa ’ s actions clearly indicated that she had little interest in worldly possessions, they did refl ect her own personal desire to help the poor of Calcutta. The assumption of goal-oriented behavior does not rule out altruistic goals.
The second assumption economists make about market participants is that they engage in rational behavior. For example, we presume that Toyota ’ s decision to build a factory in the United States is the outcome of a careful, deliberative process that weighs the expected benefi ts and costs. We presume an individual buys a new home based on knowledge of its market value and an honest appraisal of what he or she can aff ord.
The third, and most important, assumption made by economists about market partici-pants is that they confront scarce resources. For example, there is simply not enough time, money, or other resources for the typical consumer to satisfy all of his or her desires. Human beings have relatively limitless desires, and no matter how wealthy they become, resources will never be plentiful enough to ensure that all their desires can be fulfi lled.
If individuals rationally pursue their goals but have limited resources, choices must be made. Specifi cally, one must decide which goal to pursue and how far to pursue it. Microeco-nomics explores this process of making choices subject to resource constraints.
Opportunity Cost
Whenever you pursue one goal, you limit the extent to which your other goals can be satisfi ed with your scarce resources. For example, suppose that after getting your bachelor ’ s degree and working for a few years, you enroll in a full-time, two-year MBA program. What would the cost of this choice be? You would incur some explicit costs, such as tuition, books, and parking. The dollars spent on such items could have been devoted to the pursuit of other goals. You would also face implicit costs associated with your own use of time and other resources in the pursuit of a particular activity versus alternatives. For example, instead of going to business school, you could have continued working and making $40,000 per year. The $40,000 in annual forgone wages would be an implicit cost associated with pursuing an MBA. In other words, the time and eff ort devoted to pursuing the MBA instead could have been used to generate $40,000 in each of the two years that you attended graduate business school.
To understand why implicit costs matter, assume that, relative to the option of remaining at work, the MBA entails explicit costs (such as tuition) of $70,000 and will increase your postgraduate lifetime earnings by $60,000. In this case, you likely would not leave your job to pursue the MBA. The $60,000 increase in postgraduate earnings would be outweighed by the combined $70,000 in explicit costs and $80,000 in implicit costs of two years ’ lost wages.
The concepts of explicit and implicit costs also apply to the production side of a market. For fi rms making production decisions, explicit costs are those that are usually counted as costs in conventional accounting statements. They include payroll, raw materials, insurance, electricity, interest on debt, and so on. Implicit costs refl ect the fact that a fi rm ’ s resources can be allocated to other uses—Amazon, for example, can reallocate its resources from e-commerce to the provision of cloud computing services.
The sum of the explicit and implicit costs associated with using some resource in a particular way is defi ned to be the resource ’ s economic cost or opportunity cost . The concept of oppor-tunity cost forces us to recognize that costs are not just money payments but also sacrifi ced alternatives. Where more than two uses for a resource exist and the resource can be devoted to only one use at a time, the opportunity cost of using the resource in a particular way is the value of the resource in its best alternative use. So, if your options are business school, continuing to
rational behavior the behavior of market participants based on a careful, deliberative process that weighs expected benefi ts and costs
scarce resources insuffi cient time, money, or other resources for individuals to satisfy all their desires
Opportunity Cost 1.6
explicit costs money used in the pursuit of a goal that could otherwise have been spent on an alternative objective
implicit costs costs associated with an individual ’ s use of his or her own time and other resources in the pursuit of a particular activity versus alternatives
economic cost or opportunity cost the sum of explicit and implicit costs

• Opportunity Cost 7
work in your current job for $40,000 per year, and switching to a similarly demanding job that only pays $30,000 per year, you would take into account only the implicit cost of giving up your current job in determining the opportunity cost of pursuing the MBA.
Economic versus Accounting CostsBecause opportunity costs are not always readily apparent (especially their implicit compo-nents), they often are not accurately reflected in companies’ net income statements. For example, consider a family-run grocery store in downtown Tokyo whose owners acquired the property several generations ago for almost nothing. From an accounting perspective, the grocery store may appear to be generating positive net income: revenue exceeds the sum of accounting costs comprising payroll, electricity, insurance, wholesale grocery costs, and so on. Still, the grocery store may be losing money from an economic perspective once the opportunity cost of the land on which it sits is taken into account. That is, the land could be sold or rented to someone else. This choice will generate payments that are sacrificed when the family uses the land to run a grocery. These forgone earnings represent an opportunity cost—and this cost can be significant. For example, the value of just the Imperial Palace grounds situated in the heart of Tokyo has been estimated to exceed, in certain years, the total value of real estate in the state of California.
accounting costscosts reported in companies’ net income statements generated by accountants
The Benefits of Human versus Physical Capital
In a recent national poll, 65 percent of Americans said that they believe computers and robots will take over in a half century the work that people do now.1 While it is hard to estimate the benefits of what humans contribute, through their knowledge and skills, to an economy versus the ben-efits of physical assets such as technology, the studies that have been done along these lines suggest that the former are still much more substantial than the latter. For example, Korn Ferry, the global organizational consulting firm, esti-mates the value of human capital in the United States to be $244 trillion—nearly four times larger than the $62 tril-lion in value of physical assets. For the global economy,
human capital represents $1,215 trillion in value and is 2.33 times larger than the estimated $521 trillion in value of physical capital. Eighteenth-century economist Adam Smith first pointed out the benefits associated with human capital. If anything, the relative contribution of human capital has been growing in recent decades, largely due to investments in such capital through education and health care. While many pundits point to how robots and artificial intelligence will put humans out of work, the evidence sug-gests, to the contrary, that the skills and knowledge con-tributed by humans are likely to remain dominant drivers of the success of organizations and the wealth of nations. Indeed, the Latin origin of the word “capital” refers to the ideas that spring out of individuals’ heads as being the well-spring of progress—not bricks and mortar, financial instru-ments, or technology.
APPLICATION 1 .2
1This application is based on Adam Smith, “The Wealth of Nations (London: W. Strahan and T. Cadell, 1776); and https://www .kornferry.com/institute/the-trillion-dollar-difference.
APPLICATION 1 .3The Accounting and Economic Costs of SOX
In the wake of several high-profile corporate scandals such as Enron, Tyco, and Arthur Andersen, the U.S. Congress passed the Sarbanes-Oxley Act (SOX) in 2002. Signed into law soon thereafter by President Bush, SOX was intended
to enhance corporate governance by changing the rigor with which publicly traded companies reported their finances, communicated with shareholders, and governed themselves.

8 Chapter One • An Introduct ion to Microeconomics •
Sunk CostsAlthough opportunity costs may not be readily apparent, they should always be taken into account when making economic decisions. The opposite is the case for sunk costs—costs that have already been incurred and are beyond recovery. Even though sunk costs are usu-ally quite apparent, they need to be ignored when making economic decisions.
Consider the case of the Los Angeles Lakers, who negotiated a four-year, $153 million contract with LeBron James in 2018. Suppose that the contract involves a signing bonus of $33 million plus an annual salary of $30 million, should the Lakers exercise their option of playing James. Further suppose that, once the contract is signed, a player comparable in talent to James offers his services to the Lakers for $130 million over the next four years—annual payments of $32.5 million. What should the Lakers management do? The answer is stick with James. Once the $33 million signing bonus has been paid to James, it is a sunk cost. The opportunity cost of exercising the James option is thus $120 million (the remaining amount that must be paid to James) versus the $130 million it would cost to hire the comparable player.
sunk costscosts that have already been incurred and are beyond recovery
While well intentioned, the accounting costs to corpo-rations from complying with SOX have been substantial. Based on surveys of publicly traded firms by Korn Ferry, Foley & Larder, and A.R.C. Morgan, the annual accounting costs of complying with SOX range from $11 billion to $26 billion.
These accounting costs, however, pale in comparison to the economic costs of SOX, which have been estimated to be as high as $140 billion annually.2 Among these harder-to-measure but much more substantial costs are the fact that SOX diverts the attention of senior management from doing business. As the chief accounting officer of General Motors has noted: “The real cost isn’t the incremental dollars, it is having people that should be focused on the business focused instead on complying with the details of the [SOX]
rules.” SOX also exposes executives to greater litigation risks and stiffer penalties. As a result, CEOs are less likely to take riskier, entrepreneurial actions, consequently changing their business strategies and potentially reducing the value of their firms—and altering the future of the U.S. economy.
To gauge the economic costs associated with SOX, Pro-fessor Ivy Zhang of the University of Minnesota employed what is known as an “event-study” analysis focusing on the legislative events or “news” leading to the passage of SOX in July 2002. The analysis examined broad move-ments in the stock market and used well-known statistical techniques to isolate the impact of a particular factor—in this case, the Sarbanes-Oxley legislation. The anal-ysis indicated that, holding constant other factors, the cumulative abnormal return of the stock market stemming from the legislative events leading to the passage of SOX was significantly negative and translated into a loss of over 12 percent ($1.4 trillion) of the total market value ($11.3 tril-lion) of publicly traded firms in the United States.
2Ivy Zhang, “Economic Consequences of the Sarbanes-Oxley Act of 2002,” Journal of Accounting and Economics, 44, Nos. 1–2.
Why It Was Profitable to Demolish a Profitable Hong Kong Hotel
In 1995, the 26-story Hong Kong Hilton, the first five-star hotel in the central business district of Hong Kong, was smashed to rubble. The hotel was demol-ished despite the facts that accounting statements showed $25 million in profit being earned on $58 mil-lion in revenue in 1994; $16 million had recently been spent to rebuild the hotel’s lobby—more than the hotel cost to build in 1963; and the owner of the hotel had to
pay $125 million to Hilton’s parent company to break the last 20 years of the hotel’s management contract. Why did the demolition make sense? With the astronomi-cally high rental prices for office space in Hong Kong, property consultants estimated that an extra $70 million in rental income per year could be earned by construct-ing an office tower on the site historically occupied by the hotel.
APPLICATION 1 .4

• Product ion Poss ibi l i ty Front ier 9
Production Possibility Frontier
We can display in graphical form the basic economic assumptions about market actors as well as the concept of opportunity cost. Specifi cally, a production possibility frontier ( PPF ) depicts all the diff erent combinations of goods that a rational actor with certain personal goals can attain with a fi xed amount of resources. For example, suppose you are president of a university. By eff ectively employing the resources on your campus, such as the faculty and staff , classrooms, libraries, laboratories, dorms, cyclotron, and so on, you can produce two possible services: research and teaching.
Based on the resources at your disposal, assume that the diff erent combinations of research and teaching that your university can produce each year are represented by the PPFdepicted in Figure 1.1 . At one extreme, if your university were devoted solely to research, you could produce 1,000 units of research and 0 units of teaching (point A ) with your limited resources. At the other extreme, if classroom instruction were the overriding objective, your university could produce a maximum of 500 units of teaching and 0 units of research (point Z ). Of course, you need not be at either of the two extremes on your PPF . You also have the option of producing a mix of 500 units of research and 250 teaching units (point E ) or, for that matter, any point lying on or inside (such as Y ) the straight-line segment that we have drawn connecting endpoints A and Z of the PPF shown in Figure 1.1 .
How does a PPF such as the one shown in Figure 1.1 refl ect the three basic assumptions that we have made about market actors? Your desire as university president to encourage both research and teaching, if unlimited, would imply that you would like to be as far to the northeast as possible in the graph—generating an infi nite amount of both research and teaching. But scarce resources, represented by the boundary, segment AZ , of your PPF , keep you inside the PPF . Points such as U , beyond your PPF ’ s boundary, thus are unattain-able. Finally, rational behavior presumes that you will choose a point on the PPF boundary rather than inside the boundary. Why choose a mix of output involving 500 research and 50 teaching units (point Y ), when the same resources at your disposal can get you more of both research and teaching (such as at point C )? Rational behavior implies that you will select a point on the boundary (segment AZ ) of your PPF .
Although the three basic economic assumptions about market actors imply that you will be on the boundary of your PPF , you must still choose a specifi c combination of research and teaching on the boundary. The three basic assumptions (positive analysis) can place you only on the PPF boundary. Once on the boundary, a value judgment (normative analysis) is necessary to determine the “best” point for you along the boundary. For example, if you believe that a good university should focus solely on research, you will probably opt for point
Production Possibility Frontier 1.7
production possibility frontier ( PPF ) a depiction of all the diff erent combinations of goods that a rational actor with certain personal goals can attain with a fi xed amount of resources
1,000
900
800
500
50100
250 500 Teaching (T)0
A
B
C
E
1T Z
U
Research (R)
Y
2R
Productionpossibilityfrontier (PPF)
A Production Possibility Frontier ( PPF ) A PPF depicts the three basic assumptions made by economists about market participants (goal-oriented behavior, scarce resources, and rationality) as well as the concept of opportunity cost. With a nonsatiable desire for both research (R) and teaching (T), a university president would prefer to be as far to the northeast as possible on the graph. Scarce resources limit the president to any combination on or below the PPF boundary AZ . Rational behavior implies that the president will choose to be on the boundary as opposed to below it. Opportunity cost is reflected by the slope of the PPF .
Figure 1.1

10 Chapter One • An Introduct ion to Microeconomics •
A on the PPF boundary. If, instead, you believe that a university is distinguished exclusively by the quality of its classroom instruction, point Z is likely to be your selection.
Figure 1.1 also depicts the concept of opportunity cost. Consider the movement between points A and B on the boundary of the PPF . If you start off at point A with 0 teaching units and move to point B with 50 teaching units, 100 research units will have to be given up (from 1,000 research units at A to 900 at B ). Thus, if the three basic economic assumptions about market par-ticipants hold and you are forced to move along the PPF boundary, you confront a trade-off of 100 research units lost per 50 teaching units gained between points A and B . This trade-off is the opportunity cost of using your resources to increase the number of teaching units from 0 to 50. By expanding output of teaching from 0 to 50, you are implicitly giving up 100 units of research. The opportunity cost of each additional teaching unit gained between 0 and 50 teaching units is two research units. And, since the boundary of the PPF as we have drawn it is a straight line, this per-teaching-unit opportunity cost is constant over the entire AZ boundary of the depicted PPF .
Constant versus Increasing Per-Unit Opportunity Costs Constant per-unit opportunity costs occur only if the PPF boundary is a straight line. But the more typical PPF has a concave-shaped boundary bowed out from the origin, as in Figure 1.2 . With a concave-shaped PPF , the slope of the boundary AZ becomes steeper (that is, more negative) as one moves from point A , where the university is producing just research and no teaching, to point Z , where the reverse is true. The per-unit opportunity cost of producing additional teaching units, in terms of the research that must be given up, grows with the total output of teaching. For example, if you are producing 0 teaching units and want to expand output to one teaching unit, moving from point A to B in Figure 1.2 , you would have to drop one research unit. The fi rst teaching unit produced would have an opportunity cost of one research unit. When you are producing 499 teaching units, however, and want to expand teaching output by the same additional unit, the opportunity cost in terms of research that must be given up is much higher—100 research units must be given up to move from point Y to Z .
Why does the per-unit opportunity cost associated with expanding the output of any particular commodity typically increase in this way? The reason stems from diff erences in relative productivity across resources as related to various commodities. For example, some faculty are relatively better researchers, and others do better in the classroom. When a uni-versity is at point A , the per-unit opportunity cost of increasing teaching output is fairly low. There are bound to be some faculty who are not prolifi c researchers, but who are adept at teaching. Reallocating such faculty to increase teaching output will not involve much of a per-unit loss in terms of research (one research unit between points A and B ). By contrast, when one is already producing 499 units of teaching and contemplating increasing production to 500 (that is, moving from point Y to point Z ), one has to move more talented researchers full time into the classroom, a far more costly undertaking in terms of forgone research.
Teaching
AB
Z
Y100
1,000999
Research
0 1499
500
The Typical-Case PPF : Concave to the Origin With a concave PPF , the per-unit opportunity cost of an additional unit of teaching increases with the more teaching one produces. A one-teaching-unit increase between points A and B along the boundary of the PPF is associated with an opportunity cost equal to one research unit. A one-teaching-unit increase between points Y and Z carries with it an opportunity cost of 100 research units.
Figure 1.2
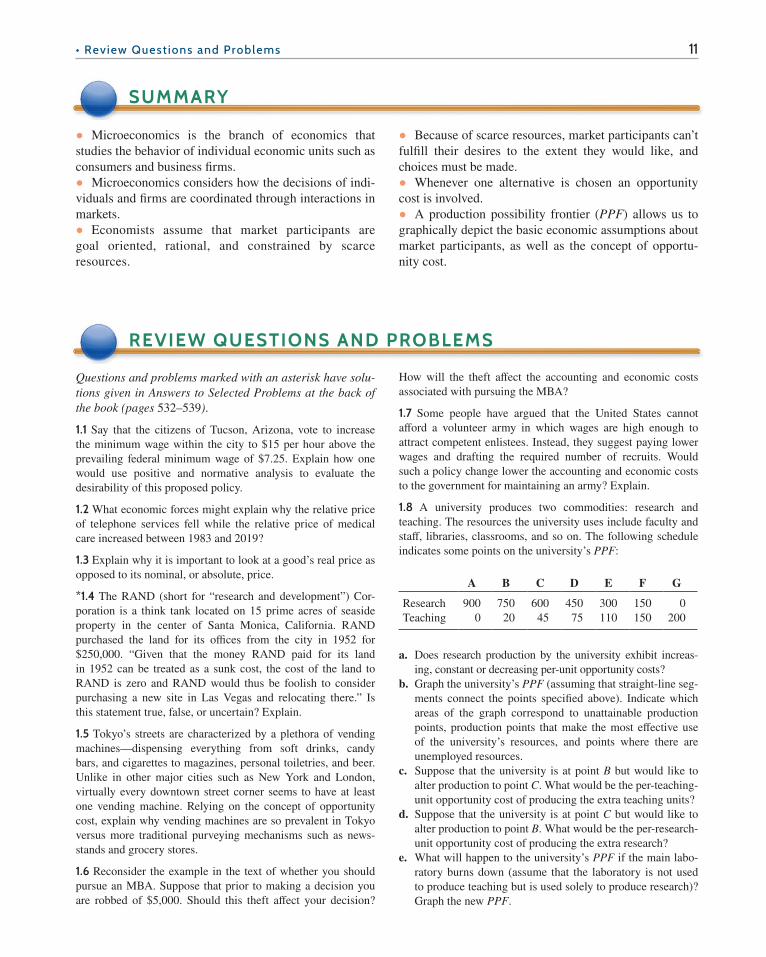
• Review Quest ions and Problems 11
• Microeconomics is the branch of economics that studies the behavior of individual economic units such as consumers and business firms.• Microeconomics considers how the decisions of indi-viduals and firms are coordinated through interactions in markets.• Economists assume that market participants are goal oriented, rational, and constrained by scarce resources.
• Because of scarce resources, market participants can’t fulfill their desires to the extent they would like, and choices must be made.• Whenever one alternative is chosen an opportunity cost is involved.• A production possibility frontier (PPF) allows us to graphically depict the basic economic assumptions about market participants, as well as the concept of opportu-nity cost.
Questions and problems marked with an asterisk have solu-tions given in Answers to Selected Problems at the back of the book (pages 532–539).
1.1 Say that the citizens of Tucson, Arizona, vote to increase the minimum wage within the city to $15 per hour above the prevailing federal minimum wage of $7.25. Explain how one would use positive and normative analysis to evaluate the desirability of this proposed policy.
1.2 What economic forces might explain why the relative price of telephone services fell while the relative price of medical care increased between 1983 and 2019?
1.3 Explain why it is important to look at a good’s real price as opposed to its nominal, or absolute, price.
*1.4 The RAND (short for “research and development”) Cor-poration is a think tank located on 15 prime acres of seaside property in the center of Santa Monica, California. RAND purchased the land for its offices from the city in 1952 for $250,000. “Given that the money RAND paid for its land in 1952 can be treated as a sunk cost, the cost of the land to RAND is zero and RAND would thus be foolish to consider purchasing a new site in Las Vegas and relocating there.” Is this statement true, false, or uncertain? Explain.
1.5 Tokyo’s streets are characterized by a plethora of vending machines—dispensing everything from soft drinks, candy bars, and cigarettes to magazines, personal toiletries, and beer. Unlike in other major cities such as New York and London, virtually every downtown street corner seems to have at least one vending machine. Relying on the concept of opportunity cost, explain why vending machines are so prevalent in Tokyo versus more traditional purveying mechanisms such as news-stands and grocery stores.
1.6 Reconsider the example in the text of whether you should pursue an MBA. Suppose that prior to making a decision you are robbed of $5,000. Should this theft affect your decision?
How will the theft affect the accounting and economic costs associated with pursuing the MBA?
1.7 Some people have argued that the United States cannot afford a volunteer army in which wages are high enough to attract competent enlistees. Instead, they suggest paying lower wages and drafting the required number of recruits. Would such a policy change lower the accounting and economic costs to the government for maintaining an army? Explain.
1.8 A university produces two commodities: research and teaching. The resources the university uses include faculty and staff, libraries, classrooms, and so on. The following schedule indicates some points on the university’s PPF:
A B C D E F G
Research 900 750 600 450 300 150 0Teaching 0 20 45 75 110 150 200
a. Does research production by the university exhibit increas-ing, constant or decreasing per-unit opportunity costs?
b. Graph the university’s PPF (assuming that straight-line seg-ments connect the points specified above). Indicate which areas of the graph correspond to unattainable production points, production points that make the most effective use of the university’s resources, and points where there are unemployed resources.
c. Suppose that the university is at point B but would like to alter production to point C. What would be the per-teaching-unit opportunity cost of producing the extra teaching units?
d. Suppose that the university is at point C but would like to alter production to point B. What would be the per-research-unit opportunity cost of producing the extra research?
e. What will happen to the university’s PPF if the main labo-ratory burns down (assume that the laboratory is not used to produce teaching but is used solely to produce research)? Graph the new PPF.
SUMMARY
REVIEW QUESTIONS AND PROBLEMS

12 Chapter One • An Introduct ion to Microeconomics •
f. What will happen to the PPF if all of the campus resources are cut in half? Graph the new PPF.
g. Suppose the university is at point F. The university president proposes to move the school to point B; she claims that B is a more desirable choice since the total output is 750 + 20 = 770 total units of output at B versus 150 + 150 = 300 output units at F. Is the president correct?
1.9 “Motorola and other backers sank more than $5 billion in the 1990s into the development of Iridium, a satellite commu-nications system to connect wireless telephone users anywhere on earth. Although the number of subscribers signing up for the service fell significantly below projections and operating costs vastly exceeded revenues, this was no reason for inves-tors to back out of the venture. Indeed, it would be foolish to back out given the large amount of money already invested in Iridium.” True, false, or uncertain? Explain.
1.10 A study by Professor Gerald Scully of the University of Texas finds that government-sponsored killing of its own people—an act that claimed the lives of 170 million people in the twentieth century (7.3 percent of the total population and four times as many individuals as killed by international and civil wars combined)—is less likely to occur the more pro-ductive is a country’s populace (as measured by real gross domestic product per capita). Explain why this is consistent with the concept of opportunity cost.
1.11 According to a recent study, the average adult American living in an urban area spends 41 hours per year sitting in
traffic. The estimated cost of the gridlock, according to the study, is substantial: $78 billion in burned gasoline (explicit costs) and wasted time (implicit costs). How should the estimated opportunity costs with the growing traffic grid-lock be adjusted if the study has not accounted for the fact that motorists can make cellular phone calls while driving? Explain.
1.12 In 2002, Pat Tillman turned down a contract offer of $3.6 million over three years from the Arizona Cardinals to enlist in the U.S. Army in the wake of the September 11 attacks on the United States. Tillman was killed by friendly fire in Afghani-stan in 2004. From an economic perspective, did Tillman make a rational decision by not signing with the Cardinals in 2002? Explain.
1.13 By any absolute or relative measure, mail order and online shopping has increased dramatically over the past few dec-aders. Explain why this might be the case on account of the growth of two-wage-earner families.
1.14 One of the questions prospective full-time MBA program applicants confront is whether they should pursue the degree soon after college or wait four to six years. Assume that 10 years after college, a full-time MBA graduate earns as much whether she pursued the business degree right after college or waited four to six years. From an opportunity cost perspective, why might enrolling for full-time MBA studies earlier rather than later in one’s career be advantageous? Explain.