![Ethene/norbornene copolymerization by [Me 2 Si(3- tert BuCp)(N tert Bu)]TiCl 2 /MAO-catalyst](https://static.fdokumen.com/doc/165x107/6312231a48b4e11f7d08cd0e/ethenenorbornene-copolymerization-by-me-2-si3-tert-bucpn-tert-buticl-2-mao-catalyst.jpg)
Ethene/norbornene copolymerization by [Me 2 Si(3- tert BuCp)(N tert Bu)]TiCl 2 /MAO-catalyst
Upload
independentCategory
view
2download
0
Journal of Contaminant Hydrology 156 (2014) 62–77
Contents lists available at ScienceDirect
Journal of Contaminant Hydrology
j ourna l homepage: www.e lsev ie r .com/ locate / jconhyd
Integration of stable carbon isotope, microbial community,dissolved hydrogen gas, and 2HH2O tracer data to assessbioaugmentation for chlorinated ethene degradation infractured rocks
Kinga M. Révész a,⁎, Barbara Sherwood Lollar b, Julie D. Kirshtein a, Claire R. Tiedeman d,Thomas E. Imbrigiotta c, Daniel J. Goode e, Allen M. Shapiro a, Mary A. Voytek f,Pierre J. Lacombe c, Eurybiades Busenberg a
a U.S. Geological Survey, National Center MS 430, 431, 432, 12201 Sunrise Valley Dr., Reston, VA 20192, United Statesb University of Toronto, Department of Geology, 22 Russell Str., Toronto, ON M5S 3B1, Canadac U.S. Geological Survey, New Jersey Water Science Center, West Trenton, NJ 08628, United Statesd U.S. Geological Survey, 345 Middlefield Rd. MS496, Menlo Park, CA 04025, United Statese U.S. Geological Survey, Pennsylvania Water Science Center, 770 Pennsylvania Dr., Exton, PA 19341, United Statesf NASA Headquarters, Room 3Y56, Washington, DC 20546, United States
a r t i c l e i n f o
E-mail address: [email protected] (K.M. Révész).
0169-7722/$ – see front matter © 2013 Published byhttp://dx.doi.org/10.1016/j.jconhyd.2013.10.004
a b s t r a c t
Article history:Received 1 June 2012Received in revised form 9 October 2013Accepted 18 October 2013Available online 2 November 2013
An in situ bioaugmentation (BA) experiment was conducted to understand processes controllingmicrobial dechlorination of trichloroethene (TCE) in groundwater at the Naval AirWarfare Center(NAWC),West Trenton, NJ. In the BA experiment, an electron donor (emulsified vegetable oil andsodium lactate) and a chloro-respiringmicrobial consortiumwere injected into a well in fracturedmudstone of Triassic age. Water enriched in 2H was also injected as a tracer of the BA solution, tomonitor advective transport processes. The changes in concentration and the δ13C of TCE,cis-dichloroethene (cis-DCE), and vinyl chloride (VC); the δ2H of water; changes in the abundanceof the microbial communities; and the concentration of dissolved H2 gas compared to pre- testconditions, provided multiple lines of evidence that enhanced biodegradation occurred in theinjection well and in two downgradient wells. For those wells where the biodegradation wasstimulated intensively, the sum of the molar chlorinated ethene (CE) concentrations in post-BAwater was higher than that of the sum of the pre-BA background molar CE concentrations. Theconcentration ratios of TCE/(cis-DCE + VC) indicated that the increase in molar CE concentrationmay result from additional TCE mobilized from the rock matrix in response to the oil injectionor due to desorption/diffusion. The stable carbon isotope mass-balance calculations show thatthe weighted average 13C isotope of the CEs was enriched for around a year compared to thebackground value in a two year monitoring period, an effective indication that dechlorination ofVC was occurring. Insights gained from this study can be applied to efforts to use BA in otherfractured rock systems. The study demonstrates that a BA approach can substantially enhance insitu bioremediation not only in fractures connected to the injection well, but also in the rockmatrix around thewell due to processes such as diffusion and desorption. Because the effect of theBA was intensive only in wells where an amendment was distributed during injection, it isnecessary to adequately distribute the amendments throughout the fractured rock to achievesubstantial bioremediation. The slowdown in BA effect after a year is due to some extend to thedecrease abundant of appropriate microbes, but more likely the decreased concentration ofelectron donor.
© 2013 Published by Elsevier B.V.
Keywords:TCEBioaugmentationMicrobial populationδ13CH2 electron donorδ2HH2O tracer
⁎ Corresponding author. Tel.: +1 703 648 5865; fax: +1 703 648 5274.
Elsevier B.V.
63K.M. Révész et al. / Journal of Contaminant Hydrology 156 (2014) 62–77
1. Introduction
Chlorinated solvents, such as trichloroethene (TCE), arewidespread groundwater contaminants (Leming et al., 2010;Moran et al., 2007; U.S. Department of Health Human Services,2005a) and suspected human carcinogens (U.S. Department ofHealth Human Services, 2005b). Because these contaminantsoccur as dense non-aqueous phase liquids (DNAPLs) at manysites, the effectiveness of conventional pump- and treat-remedial strategies is limited (Lacombe, 2011). A promisingstrategy for remediation is induced microbial reductivedehalogenation. Reductive dehalogenation or dechlorinationis the mechanism by which chlorinated compounds arebiodegraded into non-toxic constituents such as etheneand ethane. Bacteria execute this transformation pathwayas a co-metabolic process or, as in the case of halo-respiringbacteria, as an energy-generating process using the chlorinatedsolvents as terminal electron acceptors (McCarty, 1997). ForTCE, this process involves the sequential dechlorination of TCEto cis-DCE, followed by conversion of cis-DCE to VC, and finallyVC to ethene (C2H4) (Vogel and McCarty, 1985). The microor-ganisms that catalyze these reactions use these solvents aselectron acceptors andH2 as an electron donor under anaerobicconditions (e.g., Ballapragada et al., 1997; Middeldorp et al.,1999; Smatlak et al., 1996; Smith and de Voss, 2004). Reductivedechlorination is thought to be responsible for the naturalattenuation of chlorinated solvents at sites with suitableenvironmental conditions (U.S. EPA, 2008; Wiedemeier et al.,1999). If natural attenuation is not present, reductive dechlo-rination can be under certain circumstances be induced by insitu BA (Ibbinia et al., 2010; Morrill et al., 2009; Vogel andMcCarty, 1985). BA involves the introduction of a group ofnatural microbial strains or genetically engineered variant andfermentable electron donor substrates (e.g., lactate, emulsifiedvegetable oil) to support in situ H2 production, to treatcontaminated soil or water. Bradley et al. (2009) demonstratedan approach for evaluating the potential for reductive dechlo-rination in fractured-rock aquifers.
The ability to distinguish between changes in contami-nant concentration due to biodegradation and those dueto physical processes, such as groundwater transport andmixing, is essential for managing bioremediation efforts. Inaddition, VC and ethene are substantially more volatile andless prone to sorption by organic matter than TCE andcis-DCE, a further challenge to quantification and monitoring(Courbet et al., 2011; Fayolle-Guichard et al., 2012; Gossett,1987; Hunkeler et al., 1999, 2011). Approaches that can beused to attribute changes in contaminant concentrations tobiodegradation include compound specific stable carbonisotope analysis or CSIA (Borden, 2007a, 2007b; Chartrandet al., 2005; Slater et al., 2001), microbial community analysisformicrobes responsible for dechlorination, and analysis of H2
electron donor concentrations. We used all these approaches,and in addition we used a novel third integrated componentby incorporating a 2H2O (deuteratedwater) tracer to track thedowngradient movement of the BA amendments and to helpunderstand the transport processes close to the injectionwell.
CSIA can provide additional insight into the fate andtransformation of chlorinated solvents in the subsurface(Hunkeler et al., 1999; Meckenstock et al., 2004; SherwoodLollar et al., 2001; Slater et al., 2001). Transformation of
organic compounds by biological enzymatic processes cancause substantial shifts in the stable carbon isotopic com-position (δ13C values) of both reactants and products. Thisphenomenon occurs because of the stronger molecular bonds(with higher activation energies) formed by 13C in comparisonwith 12C and is referred to as kinetic isotope fractionation(Galimov, 1987). Molecules with 12C only are transformedat a slightly faster rate than those containing 13C, which resultsin enrichment of 13C (and less negative δ13C values) in theremaining parent compound and depletion of 13C (morenegative δ13C values) in the product. If a finite amount ofreactant is present and the reaction proceeds to completion,the isotopic composition of the product will be identical to thatof the initial reactant (Song et al., 2002). Physical, chemical, andbiological processes can also cause changes in the concentra-tion of these compounds in groundwater systems. Althoughfractionation can occur when physical processes reduceconcentrations to trace levels, under most field conditions,microbial degradation produces the largest changes in thecarbon isotopic composition of CE (U.S. EPA, 2008). Hence,monitoring carbon isotope values (δ13CCE) in addition to theirconcentrations has been shown to be a valuable tool to providedirect evidence of microbial dehalogenation (Sherwood Lollaret al., 2001; Slater et al., 2001).
Characterization of the microbial community is helpful inidentifying biodegradation because there are known micro-organisms involved in biological dehalogenation, and theirpresence or absence can serve as an indicator of biodegrada-tion potential. Many organisms have been identified ascontributors to dehalogenation in contaminated environ-ments, including certain iron-reducing Geobacteraceae(Duhamel and Edwards, 2006;). However, Dehalococcoidesbacteria are the known organisms capable of completedechlorination of TCE, cis-DCE, and VC to non- toxic ethene.If Dehalococcoides are absent from a site, incomplete dechlo-rination of TCE with concomitant accumulation of cis-1,2-DCE is typical. Even when Dehalococcoides are present,reductive dechlorination does not always continue to theformation of ethene because the dehalogenation activityof Dehalococcoides may be dependent on the metabolicactivities of other members of the microbial community. Forexample, the degradation of organics by fermenters andothers controls production of H2, the necessary electrondonor for Dehalococcoides. In addition, the metabolism ofmicrobial community members can remove products, drivedechlorination-dependent reactions, and contribute to creatingenvironmental conditions that favor effective dechlorination(e.g. maintaining proper Eh or pH). Incomplete dechlorinationcan lead to accumulation of cis-DCE and VC, which arehazardous compounds and, in the case of VC, a known humancarcinogen (McCarty, 1997).
A wide variety of electron donors sustain dechlorination.However, hydrogen serves as a direct electron donor for theprocess, whereas other more complex donors serve as aprecursor for hydrogen formation via fermentative metabo-lism. In a culture experiment where enough H2 was added toa substrate containing CEs, more ethene was produced thanVC and the original compound was completely transformed(DiStefano et al., 1992). When H2 was substantially withheldin the same culture experiment, residual CE was foundand the ethene production was insubstantial. Therefore, for

64 K.M. Révész et al. / Journal of Contaminant Hydrology 156 (2014) 62–77
bioremediation of relatively high concentrations of CE, electrondonor that produces a large H2 pool, and provides thenutritional requirements for the microbial community, shouldbe selected. Consequently, measurement of the H2 concentra-tion in the system can give significant insight into whether theconditions are favorable for reductive dechlorination.
In addition 2H2O groundwater tracers can be used (Beckerand Coplen, 2001) to track themovement of BA amendments.The advantages of using 2H-enrichedwater as a tracer include(1) no toxicity issues, (2) no concerns about fundamentalchanges in anion exchange or charge balance, and (3) noconcerns about density variations because 2H-enriched waterhas a density similar to that of groundwater. The 2H2O is atrue tracer of water movement without the drawback ofion-exchange driven transport lags that can affect Br− andother tracers.
In this paper, we present detailed, time series monitoringof changes during a BA field study in which the followingwere added: the dechlorinating mixed microbial consortiumKB-1®, which includes Dehalococcoides, and emulsified oilsubstrate (EOS®) mixed in lactate to produce electron donorH2 through fermentation. According to current (2013)knowledge, this paper is the first to use three multiple linesof evidence synergistically to identify and understand tran-sient processes occurring during a BA experiment in fracturedrocks. We simultaneously monitored the changes in concen-tration and stable carbon isotope of CEs, microbial abun-dances, electron donors, and tracer before and after BA wasinitiated.
2. Study site
This research was conducted at the former Naval AirWarfare Center (NAWC) site, which is a 0.24 km2 facility inWest Trenton, New Jersey (Fig. 1). The handling and disposalof TCE (used as a refrigerant for about 40 years) at the siteresulted in two source areas of TCE contamination (Goodeet al., 2007; Lacombe, 2000). Following decommissioning in
Fig. 1. The location of the In Situ Test Facility (ISTF) at the Naval Air Warfareinvestigations of the fate of chloroethenes in fractured rock and the removal capacitdipping beds (geologic strata), and the short axis points in the downdip direction.
1988, the Navy investigated and partially remediated the site.Soil was excavated from between buildings in the primarycontaminant area to a depth of 2 m to remove residual TCEand the excavation area was filled with fine gravel. Pumpingfrom bedrock wells began in 1995 to remove and treat con-taminated groundwater and limit TCE migration (Lacombe,2011). Although this pumping has been continuous since1995 and is still ongoing, several monitoring wells in theunderlying bedrock have shown consistently high concen-trations of dissolved TCE.
The hydrogeology and extent of TCE, cis-DCE, andVCplumeshave been previously described (Lacombe, 2000; Lacombe andBurton, 2010). Flow in unweathered mudstone is primarilyalong high-permeability fractures oriented parallel to bedding(Tiedeman et al., 2010). Bedrock cores revealed the presence ofDNAPL (dense non-aqueous phase liquid) TCE in one location atthe site (Goode et al., 2008). Because TCE has been detected ingroundwater at concentrations greater than 760 μmoles/L, itis likely that small, isolated pools of free-phase TCE continueto be distributed throughout the rock, resulting in locally highdissolved-phase concentrations. The persistently high concen-trations of TCE in fractures indicate that dissolved-phase TCElikely diffused into the primary pore spaces of the sedimentaryrock before the pump and treat system began operation, and isnow diffusing and desorbing from the rock matrix back intothe fractures. The permeability of the intact rock has manyorders of magnitude less than the permeability of the fractures(Tiedeman et al., 2010), and thus, groundwater advection doesnot occur in the primary pore spaces of the rock. Back diffusionand desorption are the likely sources of persistently highconcentrations of TCE detected at the NAWC pumping well 15BR (Figs. 1, 2) (Lacombe, 2011).
Natural biodegradation of CE is occurring throughout theNAWC site. Révész and Coplen (2009, 2010a, 2010b)) used,among other parameters, stable carbon isotope measurementof TCE and its daughter products to identify the presence ofnatural biodegradation of CEs at NAWC. Bradley et al. (2009)used measures of dissolved hydrogen gas and bacteria,
New Jersey
Center (NAWC) in West Trenton, NJ. The ISTF has been used for detailedy of BA. The long axis of the black T symbol is the direction of the strike of the
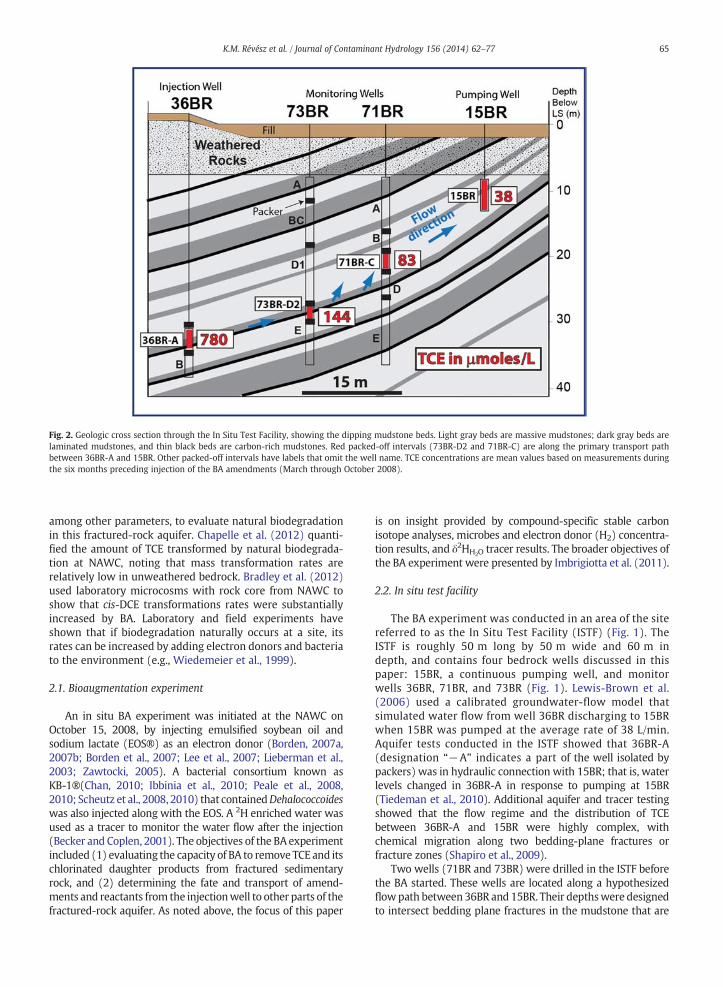
Fig. 2. Geologic cross section through the In Situ Test Facility, showing the dipping mudstone beds. Light gray beds are massive mudstones; dark gray beds arelaminated mudstones, and thin black beds are carbon-rich mudstones. Red packed-off intervals (73BR-D2 and 71BR-C) are along the primary transport pathbetween 36BR-A and 15BR. Other packed-off intervals have labels that omit the well name. TCE concentrations are mean values based on measurements duringthe six months preceding injection of the BA amendments (March through October 2008).
65K.M. Révész et al. / Journal of Contaminant Hydrology 156 (2014) 62–77
among other parameters, to evaluate natural biodegradationin this fractured-rock aquifer. Chapelle et al. (2012) quanti-fied the amount of TCE transformed by natural biodegrada-tion at NAWC, noting that mass transformation rates arerelatively low in unweathered bedrock. Bradley et al. (2012)used laboratory microcosms with rock core from NAWC toshow that cis-DCE transformations rates were substantiallyincreased by BA. Laboratory and field experiments haveshown that if biodegradation naturally occurs at a site, itsrates can be increased by adding electron donors and bacteriato the environment (e.g., Wiedemeier et al., 1999).
2.1. Bioaugmentation experiment
An in situ BA experiment was initiated at the NAWC onOctober 15, 2008, by injecting emulsified soybean oil andsodium lactate (EOS®) as an electron donor (Borden, 2007a,2007b; Borden et al., 2007; Lee et al., 2007; Lieberman et al.,2003; Zawtocki, 2005). A bacterial consortium known asKB-1®(Chan, 2010; Ibbinia et al., 2010; Peale et al., 2008,2010; Scheutz et al., 2008, 2010) that containedDehalococcoideswas also injected along with the EOS. A 2H enriched water wasused as a tracer to monitor the water flow after the injection(Becker and Coplen, 2001). The objectives of the BA experimentincluded (1) evaluating the capacity of BA to remove TCE and itschlorinated daughter products from fractured sedimentaryrock, and (2) determining the fate and transport of amend-ments and reactants from the injectionwell to other parts of thefractured-rock aquifer. As noted above, the focus of this paper
is on insight provided by compound-specific stable carbonisotope analyses, microbes and electron donor (H2) concentra-tion results, and δ2HH2O tracer results. The broader objectives ofthe BA experiment were presented by Imbrigiotta et al. (2011).
2.2. In situ test facility
The BA experiment was conducted in an area of the sitereferred to as the In Situ Test Facility (ISTF) (Fig. 1). TheISTF is roughly 50 m long by 50 m wide and 60 m indepth, and contains four bedrock wells discussed in thispaper: 15BR, a continuous pumping well, and monitorwells 36BR, 71BR, and 73BR (Fig. 1). Lewis-Brown et al.(2006) used a calibrated groundwater-flow model thatsimulated water flow from well 36BR discharging to 15BRwhen 15BR was pumped at the average rate of 38 L/min.Aquifer tests conducted in the ISTF showed that 36BR-A(designation “−A” indicates a part of the well isolated bypackers) was in hydraulic connection with 15BR; that is, waterlevels changed in 36BR-A in response to pumping at 15BR(Tiedeman et al., 2010). Additional aquifer and tracer testingshowed that the flow regime and the distribution of TCEbetween 36BR-A and 15BR were highly complex, withchemical migration along two bedding-plane fractures orfracture zones (Shapiro et al., 2009).
Two wells (71BR and 73BR) were drilled in the ISTF beforethe BA started. These wells are located along a hypothesizedflowpath between 36BR and 15BR. Their depthswere designedto intersect bedding plane fractures in the mudstone that are

66 K.M. Révész et al. / Journal of Contaminant Hydrology 156 (2014) 62–77
within the open intervals of both 36BR and 15BR (Fig. 2).Multilevel pneumatic packers were installed in 71BR and 73BRto divide each well into five vertically isolated intervals. Inaddition, packerswere installed in 36BR to isolate two intervals(Fig. 2).
The down-dip direction of the bedded mudstones isapproximately oriented from the open interval in 15BR tothat in 36BR (Fig. 2). The natural flow is driven by recharge atland surface, and groundwater discharges to drains andstreams on site and in the surrounding area. The flow systemhas not been in its natural (un-pumped) state for at least17 years; 15BR started pumping in 1995 at an average rate ofabout 38 L/min. Under pumping conditions, the dominantdirection of groundwater flow is up-dip from 36BR to 15BR(Fig. 2). Well 15BR is a shallow well that has a surface casingextending 7.9 m below land surface and an open interval thatis 4.6 m long. Monitoring well 36BR has a surface casingextending 31 m below land surface and a 7-m open interval.The concentration of TCE at 36BR-A was 640 μmoles/Lon October 15, 2008 (just before the BA amendmentswere injected), but historically it exceeded 760 μmoles/L.The relative hydraulic conductivities of the mudstones in thevicinity of each well are: 15BR N 71BR N 36BR N 73BR.
Before the BA experiment, a tracer test was conducted;bromide was injected in 36BR-A and its breakthrough wasmonitored at 15BR. The bromide concentration of theinjection solution was 3760 mg/L. The peak bromide con-centration in the water pumped from 15BR was approxi-mately 0.1 mg/L. The background bromide concentration wasapproximately 0.03 mg/L. The peak at 15BR occurred ap-proximately 7 days after the injection. This was followed byan elongated monotonically declining concentration thatextended for approximately 6 months after the injection(Shapiro et al., 2009). This dilution of the tracer in thepumped well was the result of the much larger volume ofgroundwater pulled into 15BR from up-dip and along-strikedirections in comparison to that entering 15BR from thedown-dip direction. Bromide concentrations in intervals of71BR and 73BR were measured about six months after tracerinjection. The concentration in monitoring intervals 73BR-D1,73BR-D2, and 73BR-E ranged from 2.40 to 9.90 mg/L, whichare two orders of magnitude greater than that of the ambientbromide concentration. The concentrations in monitoringintervals 71BR-C, 71BR-D, and 71BR-E were only slightlyabove the ambient bromide concentration (ranging between0.07 and 0.09 mg/L).
2.3. Injection of amendments
To obtain the injection fluid, groundwater was pumpedfrom 36BR-A using a peristaltic pump for approximately24 h. This groundwater was stored in two flexible bladderswith capacities of 380 L and 760 L, both of which werepurged with argon gas. Approximately 230 L of groundwaterwere pumped into the smaller bladder, and approximately490 L of groundwater were pumped into the larger bladder.The groundwater in the 380-L flexible bladder was leftuntreated because it was used to flush the well after injectingEOS® and KB-1® to minimize well fouling.
The BA experiment was conducted in cooperation withGeosyntec Consultants, Inc., using injection methods similar
to those used in 2005 at another location on the NAWC site(DeFlaun et al., 2006). Approximately 2.6 L of EOS®, whichcontained 59% soybean oil and 4% sodium lactate; 0.5 L of avitamin B-12 solution, which was introduced to stimulategrowth of the microbial communities; and 2 L of 2H-enrichedwater were pumped into the groundwater in the 760-Lflexible bladder to create the injection solution. Water in thisbladder was recirculated to mix the solution thoroughly.A peristaltic pump was used to inject approximately 60 L ofthe solution into 36BR-A. This was followed by injection ofapproximately 20 L of the KB-1® consortium. Argon gas wasused to force the KB-1® consortium through the tubingleading to the hydraulically isolated interval of 36BR-A.Following the injection of the KB-1®, approximately 380 Lof the solution containing EOS® was injected into the well,followed by injection of approximately 190 L of chase waterfrom the 380-L bladder (Shapiro et al., 2010; Zenker et al.,2000). This series of injections pushed or carried some ofthe amendments into the hydraulically connected 73BR-D2interval downgradient, and stratigraphically up-dip, from theinjection well. The injection solution and untreated waterwere injected at a rate of about 3 L/min, which is muchsmaller than that of the 29 L/min pumping rate at 15BR at thetime of injection.
3. Sample collection and analytical methods
Three bimonthly sampling rounds were conducted at15BR, 36BR-A, and in the different packer-isolated intervalsof 71BR and 73BR (Fig. 2) prior to the BA injection to establishbaseline conditions. In addition, samples were collected forselected parameters from 36BR-A following withdrawal of720 L of water to fill the bladders, but before the BA injection.Samples were also collected from selected wells the daybefore the injection of amendments, and during each of the14 days following injection. All wells and intervals also weresampled at 2, 4, 8, 20, 32, 44, 56, 74, 91, and 108 weekspost-injection.
3.1. δ13C values of chlorinated ethenes
Samples for determination of isotopic composition ofCEs (δ13CCE) were collected unfiltered as per standard VOCsamples in glass VOA sample vessels (head-space free) thatwere fitted with Teflon-coated septa and were preservedwith HCl. Samples were kept cold (4 °C) and were shippedto the University of Toronto Stable Isotope Laboratory foranalysis. CSIA was performed using the techniques detailedin Slater et al. (1999) and Sherwood Lollar et al. (2001).Sample collection followed QA/QC procedures as outlinedin U.S. EPA (2008). The analytical method involved a purge-and trap-Teledyne-Tekmar XPT concentrator coupled to anAgilent 5890 gas chromatograph (GC) and a Finnigan DeltaXP mass spectrometer via a combustion interface. TheGC was fitted with a 60 m × 0.25 mm GS-Q column witha temperature program of 35 °C for 3 min, increasing at10 °C/min to 90 °C, then increasing at 25 °C/min to 210 °C,and holding for 5 min. Depending on the concentration ofthe sample, 5 to 80 mL of groundwater was injected intothe purge- and trap-concentrator using a gas-tight syringe.The sample was purged for 11 min with a helium flow of
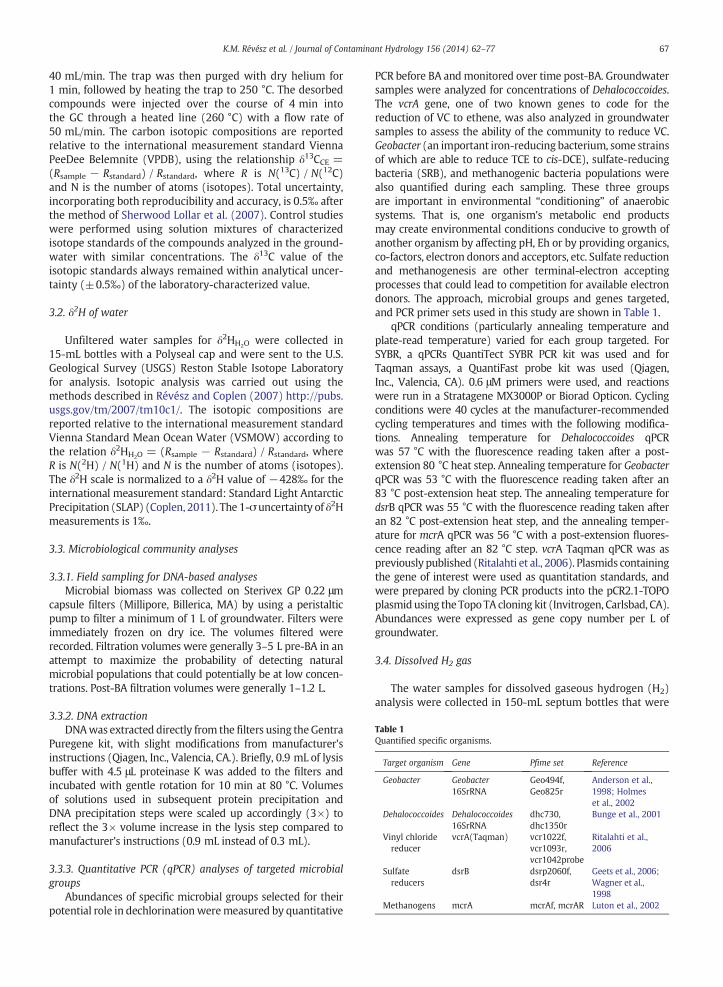
Table 1Quantified specific organisms.
Target organism Gene Pfime set Reference
Geobacter Geobacter16SrRNA
Geo494f,Geo825r
Anderson et al.,1998; Holmeset al., 2002
Dehalococcoides Dehalococcoides16SrRNA
dhc730,dhc1350r
Bunge et al., 2001
Vinyl chloridereducer
vcrA(Taqman) vcr1022f,vcr1093r,vcr1042probe
Ritalahti et al.,2006
Sulfatereducers
dsrB dsrp2060f,dsr4r
Geets et al., 2006;Wagner et al.,1998
Methanogens mcrA mcrAf, mcrAR Luton et al., 2002
67K.M. Révész et al. / Journal of Contaminant Hydrology 156 (2014) 62–77
40 mL/min. The trap was then purged with dry helium for1 min, followed by heating the trap to 250 °C. The desorbedcompounds were injected over the course of 4 min intothe GC through a heated line (260 °C) with a flow rate of50 mL/min. The carbon isotopic compositions are reportedrelative to the international measurement standard ViennaPeeDee Belemnite (VPDB), using the relationship δ13CCE =(Rsample − Rstandard) / Rstandard, where R is N(13C) / N(12C)and N is the number of atoms (isotopes). Total uncertainty,incorporating both reproducibility and accuracy, is 0.5‰ afterthe method of Sherwood Lollar et al. (2007). Control studieswere performed using solution mixtures of characterizedisotope standards of the compounds analyzed in the ground-water with similar concentrations. The δ13C value of theisotopic standards always remained within analytical uncer-tainty (±0.5‰) of the laboratory-characterized value.
3.2. δ2H of water
Unfiltered water samples for δ2HH2O were collected in15-mL bottles with a Polyseal cap and were sent to the U.S.Geological Survey (USGS) Reston Stable Isotope Laboratoryfor analysis. Isotopic analysis was carried out using themethods described in Révész and Coplen (2007) http://pubs.usgs.gov/tm/2007/tm10c1/. The isotopic compositions arereported relative to the international measurement standardVienna Standard Mean Ocean Water (VSMOW) according tothe relation δ2HH2O = (Rsample − Rstandard) / Rstandard, whereR is N(2H) / N(1H) and N is the number of atoms (isotopes).The δ2H scale is normalized to a δ2H value of −428‰ for theinternational measurement standard: Standard Light AntarcticPrecipitation (SLAP) (Coplen, 2011). The 1-σ uncertainty of δ2Hmeasurements is 1‰.
3.3. Microbiological community analyses
3.3.1. Field sampling for DNA-based analysesMicrobial biomass was collected on Sterivex GP 0.22 μm
capsule filters (Millipore, Billerica, MA) by using a peristalticpump to filter a minimum of 1 L of groundwater. Filters wereimmediately frozen on dry ice. The volumes filtered wererecorded. Filtration volumes were generally 3–5 L pre-BA in anattempt to maximize the probability of detecting naturalmicrobial populations that could potentially be at low concen-trations. Post-BA filtration volumes were generally 1–1.2 L.
3.3.2. DNA extractionDNAwas extracted directly from the filters using theGentra
Puregene kit, with slight modifications from manufacturer'sinstructions (Qiagen, Inc., Valencia, CA.). Briefly, 0.9 mL of lysisbuffer with 4.5 μL proteinase K was added to the filters andincubated with gentle rotation for 10 min at 80 °C. Volumesof solutions used in subsequent protein precipitation andDNA precipitation steps were scaled up accordingly (3×) toreflect the 3× volume increase in the lysis step compared tomanufacturer's instructions (0.9 mL instead of 0.3 mL).
3.3.3. Quantitative PCR (qPCR) analyses of targeted microbialgroups
Abundances of specific microbial groups selected for theirpotential role in dechlorinationweremeasured by quantitative
PCR before BA andmonitored over time post-BA. Groundwatersamples were analyzed for concentrations of Dehalococcoides.The vcrA gene, one of two known genes to code for thereduction of VC to ethene, was also analyzed in groundwatersamples to assess the ability of the community to reduce VC.Geobacter (an important iron-reducing bacterium, some strainsof which are able to reduce TCE to cis-DCE), sulfate-reducingbacteria (SRB), and methanogenic bacteria populations werealso quantified during each sampling. These three groupsare important in environmental “conditioning” of anaerobicsystems. That is, one organism's metabolic end productsmay create environmental conditions conducive to growth ofanother organism by affecting pH, Eh or by providing organics,co-factors, electron donors and acceptors, etc. Sulfate reductionand methanogenesis are other terminal-electron acceptingprocesses that could lead to competition for available electrondonors. The approach, microbial groups and genes targeted,and PCR primer sets used in this study are shown in Table 1.
qPCR conditions (particularly annealing temperature andplate-read temperature) varied for each group targeted. ForSYBR, a qPCRs QuantiTect SYBR PCR kit was used and forTaqman assays, a QuantiFast probe kit was used (Qiagen,Inc., Valencia, CA). 0.6 μM primers were used, and reactionswere run in a Stratagene MX3000P or Biorad Opticon. Cyclingconditions were 40 cycles at the manufacturer-recommendedcycling temperatures and times with the following modifica-tions. Annealing temperature for Dehalococcoides qPCRwas 57 °C with the fluorescence reading taken after a post-extension 80 °C heat step. Annealing temperature for GeobacterqPCR was 53 °C with the fluorescence reading taken after an83 °C post-extension heat step. The annealing temperature fordsrB qPCR was 55 °C with the fluorescence reading taken afteran 82 °C post-extension heat step, and the annealing temper-ature for mcrA qPCR was 56 °C with a post-extension fluores-cence reading after an 82 °C step. vcrA Taqman qPCR was aspreviously published (Ritalahti et al., 2006). Plasmids containingthe gene of interest were used as quantitation standards, andwere prepared by cloning PCR products into the pCR2.1-TOPOplasmidusing the Topo TA cloning kit (Invitrogen, Carlsbad, CA).Abundances were expressed as gene copy number per L ofgroundwater.
3.4. Dissolved H2 gas
The water samples for dissolved gaseous hydrogen (H2)analysis were collected in 150-mL septum bottles that were
Fig. 3. Carbon stable isotope of TCE before (black symbols) and after (redsymbols) BA injection in different well intervals (see Fig. 2). Labels show thesampling date when the BA reached that particular interval. (For interpre-tation of the references to color in this figure legend, the reader is referred tothe web version of this article.)
68 K.M. Révész et al. / Journal of Contaminant Hydrology 156 (2014) 62–77
filled with groundwater (ensuring no headspace). In thelaboratory, a 10-mL headspace was created by removingsome of the water through the septum with a needleconnected to a vacuum pump. The water was allowed toequilibrate overnight with the resulting headspace at roomtemperature before analysis. A long needle filled withdegassed water and connected to an on–off valve through anylon tube to a water reservoir was used to inject the watersample through the septum at the bottom of the bottle, andthen the valve was turned on. The degassed water slowlyentered the bottom of the bottle, increasing the pressure inthe headspace to one atmosphere. Another needle connectedto an on–off valve and a syringe was pushed through theseptum. The valve was opened and the gas in the headspacewas pushed/pulled into the syringe. Water slowly replacedthe gas in the headspace, allowing all the headspace gas to betransferred into the syringe. The valve was closed, the needlewas removed, and the gas was then injected through a watertrap into a gas chromatograph. The concentration of H2 wasmeasured with a thermal conductivity detector (TCD). Theprecision of the gas chromatograph results is ±10% for H2.However, H2 concentrations can change substantially duringstorage; therefore, the results should be considered qualita-tive rather than quantitative (Busenberg et al., 2000).
4. Results and discussion
4.1. δ13C and concentrations of chlorinated ethene
Before initiation of the BA experiment, the δ13C values ofTCE were measured in all intervals of the wells starting inMarch 2008, to determine baseline isotopic signatures. Forall wells, δ13C values ranged from −19.3 to −23.1‰ (Fig. 3black symbol, Supplementary Document 1), indicating that allsamples were somewhat enriched in 13C relative to publishedvalues for pure product TCE (−25–−32‰, Jendrzejewskiet al., 2001). This is consistent with natural biodegradationoccurring in the system prior to the BA. Post-BA, the largestchanges in δ13C of TCE were observed in the injection well36BR-A (10/24/2008); in 73BR-D2, to which the BA amend-ments were pushed (10/31/2008); and in 71BR-C with a7-month delay time (5/12/2008). There was no change in thepumping well 15BR (Fig. 3 red symbol). Note that only theδ13C values of TCE are shown on the graph.
The temporal history of concentration and δ13C changes forthe different CE compounds is shown for 36BR-A, 73BR-D2, and71BR-C in Fig. 4 and SupplementaryDocument 1. In the injectionwell (36BR-A, Fig. 4A), before BA, δ13CTCE values establisheda baseline value in this well of −19.8 to −21.8 (±0.5) ‰.After BA, δ13CTCE values showed substantial enrichment in 13C(δ13CTCE increased to −11‰), with a substantial concentrationdecrease that is consistent with the effects of biodegradation.Stable carbon isotopic compositions of cis-DCE and VC werealso consistent with the effects of enhanced rates of biodegra-dation as both compounds showed an initial depletion in 13C(consistent with a preferential rate of degradation of 12C ofTCE), followed by a trend of increasing enrichment of 13C incis-DCE and VC as each underwent biodegradation. In 73BR-D2(Fig. 4B), the concentrations and isotopes of TCE and itsdaughter products showed a similar pattern to that in theinjection well at around the first month after the BA injection;
however, after that, neither the concentration nor the carbonstable isotope changed drastically over the monitoring timeperiod. In 71BR-C (Fig. 4C), the concentrations and isotopesof TCE and its daughter products showed a similar pattern as73BR-D2; however, the effect of the BA was less pronouncedthan in well 73BR-D2.
The less pronounced effect of the BA over distance also isapparent from the truncated δ13CTCE data series in Fig. 4A,Band C. In 36BR-A TCE concentration became too low forisotope analysis a month after the injection; in 73BR-D2(18 m from the injection well), it became too low after ayear; and in 71BR-C (30 m from the injection well) the TCEconcentration was always high enough for isotopic analysis.This is even more striking if we consider that the originalconcentration of TCE was higher in 36BR-A (N600 μmol), lessin 73BR-D2 (b600) and even less in 71BR-C (around 100).
The cis-DCE molar concentration in 36BR-A measured3 weeks post-BA was close to 3 times higher than that ofthe TCE concentration measured just prior to the injection(Fig. 4A). In 73BR-D2 it was 1.5 times higher and in 71BR-C itwas little more than 1 time higher. A number of processesmight have contributed to the large ratios of cis-DCE to TCEat 36BR-A. First, the near-elimination of TCE from thisinterval and from hydraulically connected fractures producedlarge concentration gradients from the rock matrix towards36BR-A and towards these fractures. These gradients increasethe mobilization and back diffusion of TCE from the primaryporosity, and/or the desorption of TCE or less degraded TCEfrom rock matrix and fracture surfaces, producing TCE concen-tration increases in 36BR-A and in hydraulically connected

Fig. 4. CE concentrations and their δ13C values before and after BA, monitored for 32 months in (A) 36BR-A (injection well, the last pre-BA sample was collectedafter intensive pumping and just before BA injection), (B) 73BR-D2 (18 m downgradient of 36BR), and (C) 71BR-C (30 m downgradient of 36BR). Note that71BR-C concentration data are in different scales.
69K.M. Révész et al. / Journal of Contaminant Hydrology 156 (2014) 62–77
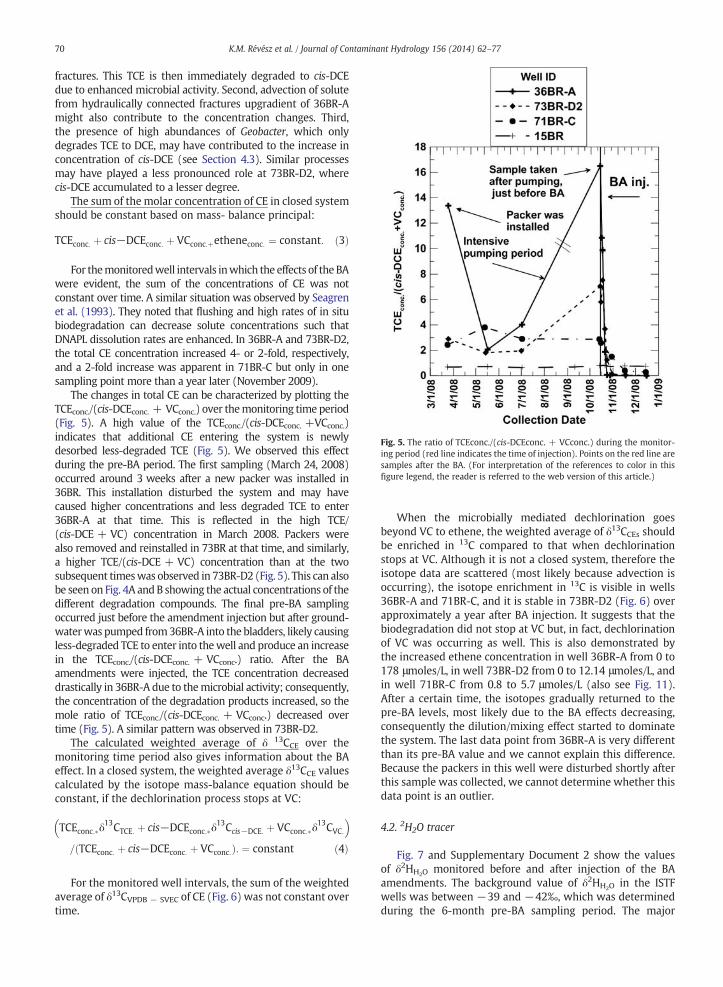
Fig. 5. The ratio of TCEconc./(cis-DCEconc. + VCconc.) during the monitor-ing period (red line indicates the time of injection). Points on the red line aresamples after the BA. (For interpretation of the references to color in thisfigure legend, the reader is referred to the web version of this article.)
70 K.M. Révész et al. / Journal of Contaminant Hydrology 156 (2014) 62–77
fractures. This TCE is then immediately degraded to cis-DCEdue to enhanced microbial activity. Second, advection of solutefrom hydraulically connected fractures upgradient of 36BR-Amight also contribute to the concentration changes. Third,the presence of high abundances of Geobacter, which onlydegrades TCE to DCE, may have contributed to the increase inconcentration of cis-DCE (see Section 4.3). Similar processesmay have played a less pronounced role at 73BR-D2, wherecis-DCE accumulated to a lesser degree.
The sum of the molar concentration of CE in closed systemshould be constant based on mass- balance principal:
TCEconc: þ cis−DCEconc: þ VCconc:þetheneconc: ¼ constant: ð3Þ
For themonitoredwell intervals inwhich the effects of the BAwere evident, the sum of the concentrations of CE was notconstant over time. A similar situation was observed by Seagrenet al. (1993). They noted that flushing and high rates of in situbiodegradation can decrease solute concentrations such thatDNAPL dissolution rates are enhanced. In 36BR-A and 73BR-D2,the total CE concentration increased 4- or 2-fold, respectively,and a 2-fold increase was apparent in 71BR-C but only in onesampling point more than a year later (November 2009).
The changes in total CE can be characterized by plotting theTCEconc./(cis-DCEconc. + VCconc.) over themonitoring time period(Fig. 5). A high value of the TCEconc./(cis-DCEconc. +VCconc.)indicates that additional CE entering the system is newlydesorbed less-degraded TCE (Fig. 5). We observed this effectduring the pre-BA period. The first sampling (March 24, 2008)occurred around 3 weeks after a new packer was installed in36BR. This installation disturbed the system and may havecaused higher concentrations and less degraded TCE to enter36BR-A at that time. This is reflected in the high TCE/(cis-DCE + VC) concentration in March 2008. Packers werealso removed and reinstalled in 73BR at that time, and similarly,a higher TCE/(cis-DCE + VC) concentration than at the twosubsequent timeswas observed in 73BR-D2 (Fig. 5). This can alsobe seen on Fig. 4A andB showing the actual concentrations of thedifferent degradation compounds. The final pre-BA samplingoccurred just before the amendment injection but after ground-waterwas pumped from36BR-A into the bladders, likely causingless-degraded TCE to enter into thewell and produce an increasein the TCEconc./(cis-DCEconc. + VCconc.) ratio. After the BAamendments were injected, the TCE concentration decreaseddrastically in 36BR-A due to themicrobial activity; consequently,the concentration of the degradation products increased, so themole ratio of TCEconc./(cis-DCEconc. + VCconc.) decreased overtime (Fig. 5). A similar pattern was observed in 73BR-D2.
The calculated weighted average of δ 13CCE over themonitoring time period also gives information about the BAeffect. In a closed system, the weighted average δ13CCE valuescalculated by the isotope mass-balance equation should beconstant, if the dechlorination process stops at VC:
TCEconc:�δ13CTCE: þ cis−DCEconc:�δ
13Ccis−DCE: þ VCconc:�δ13CVC:
� �
= TCEconc: þ cis−DCEconc: þ VCconc:ð Þ: ¼ constant ð4Þ
For the monitored well intervals, the sum of the weightedaverage of δ13CVPDB − SVEC of CE (Fig. 6) was not constant overtime.
When the microbially mediated dechlorination goesbeyond VC to ethene, the weighted average of δ13CCEs shouldbe enriched in 13C compared to that when dechlorinationstops at VC. Although it is not a closed system, therefore theisotope data are scattered (most likely because advection isoccurring), the isotope enrichment in 13C is visible in wells36BR-A and 71BR-C, and it is stable in 73BR-D2 (Fig. 6) overapproximately a year after BA injection. It suggests that thebiodegradation did not stop at VC but, in fact, dechlorinationof VC was occurring as well. This is also demonstrated bythe increased ethene concentration in well 36BR-A from 0 to178 μmoles/L, in well 73BR-D2 from 0 to 12.14 μmoles/L, andin well 71BR-C from 0.8 to 5.7 μmoles/L (also see Fig. 11).After a certain time, the isotopes gradually returned to thepre-BA levels, most likely due to the BA effects decreasing,consequently the dilution/mixing effect started to dominatethe system. The last data point from 36BR-A is very differentthan its pre-BA value and we cannot explain this difference.Because the packers in this well were disturbed shortly afterthis sample was collected, we cannot determine whether thisdata point is an outlier.
4.2. 2H2O tracer
Fig. 7 and Supplementary Document 2 show the valuesof δ2HH2O monitored before and after injection of the BAamendments. The background value of δ2HH2O in the ISTFwells was between −39 and −42‰, which was determinedduring the 6-month pre-BA sampling period. The major

Fig. 6. Weighted average δ13C value of CE over BA monitoring time.
Fig. 7. δ2HH2O tracer values monitored in wells.
71K.M. Révész et al. / Journal of Contaminant Hydrology 156 (2014) 62–77
changes occurred in the injection well (36BR-A, ~+2500‰)and in well 73BR-D2 (~+1400‰), with minor changesobserved in 71BR-C (+22.00‰) 3 months after injection.There was very little change in well 15BR in the δ2HH2O value(−40.27‰, standard deviation = 1.200‰) over the moni-toring period.
The δ2HH2O tracer data illustrate that the injection solutionwas transported from 36BR-A to both 73BR-D2 and 71BR-C.The large enrichment of δ2HH2O in 73BR-D2 immediatelyfollowing the initiation of the BA experiment indicates thatthe solution was pushed to this well interval during theinjection procedure (Fig. 7). In 71BR-C, the more gradual riseof δ2HH2O tracer concentrations and the peak at about twomonths after injection show the more delayed arrival of theinjectate (Fig. 7 and more evident in Fig. 8).
Normalized concentrations of both CE and δ2HH2O tracersare shown in Fig. 8. In 36BR-A the δ2HH2O decreased rapidlyafter its maximum, and then more gradually decreased,reaching its pre-BA level about two years after the injection.The CE concentration has a delayed peak, partly because ofthe intense dechlorination causing extra TCE to enter thewell by processes such as diffusion and desorption. However,after reaching the maximum concentration, it plateaus forabout a year and then declines. In 73BR-D2, the δ2HH2O tracerconcentrations after the maximum also gradually decreasedover two years. The CE concentration shows a similar patternto that observed in 36BR-A. In 71BR-C, the δ2HH2O normalizedconcentration changed similarly; however, the absolute con-centration change wasminimal (+20.00‰). The CE concentra-tion peaked about a year later. (For the absolute concentrationchanges in these wells see Supplementary document 1 and 2).
In summary, the δ2HH2O and CE data have some similar-ities, particularly in 36BR-A and 73BR-D2. The gradual declinein concentrations of the inert tracer δ2HH2O indicates the effectof advection at these wells. Considering this role of advectiontogether with the concentrations of total CE suggests that atthe beginning of the BA experiment, after injection of largeconcentrations of electron donor and of microbes capable ofdegrading CE, the dominant process affecting CE concentra-tions was biodegradation. However, the rate of degradationmust have slowed down over time and advection became thedominant process controlling CE concentration changes.
Because both the amendments and the CE have differenttransport properties than that of the deuterium tracer, theymay not havemigrated at the same rate as the tracer. Thereforethe concentration changes of CE over time (dCCE/dt) cannotbe quantified using the tracer data (dδ2H/dt), because thetransport of CE depends on different initial conditions, as wellas on different processes and properties compared with thetransport of δ2HH2O. The discussion of the effects of theseprocesses is beyond the scope of this paper. However, theelevated δ13C of TCE at 36BR-A, 73BR-D2, and 71BR-C clearlyshows that biodegradationwas enhanced at all these locations,compared with the degradation occurring prior to the BAexperiment (Fig. 3).
4.3. Microbial community and electron donor
Fig. 9 shows concentrations of microorganisms in the threewells where the deuterium tracer was detected (36BR-A,73BR-D2, and 71BR-C). The abundance of the microbial targetswas monitored to document any fluctuations in the popula-tions, which could be caused by natural variation, stimulationof the indigenous population engendered by the experiment(e.g. addition of EOS®), or the addition of the KB-1®. Theabundance of the targeted metabolic types of bacteria alsowas determined prior to the in situ BA experiment andprovided a baseline range for the indigenous populations.Typically, initial background ranges of each group are as
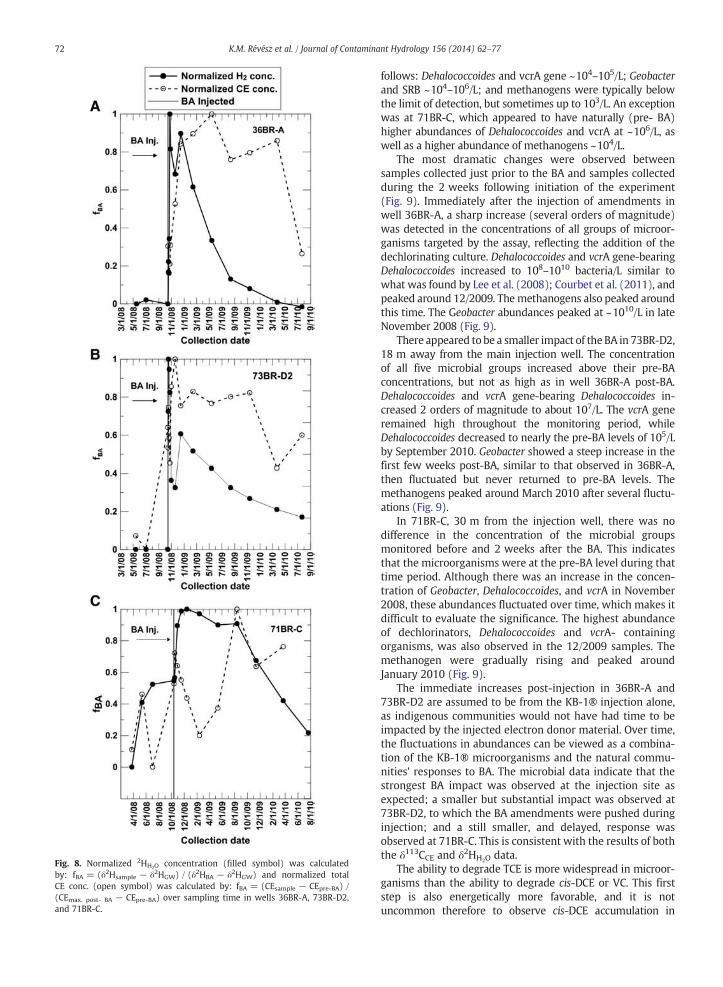
Fig. 8. Normalized 2HH2O concentration (filled symbol) was calculatedby: fBA = (δ2Hsample − δ2HGW) / (δ2HBA − δ2HGW) and normalized totalCE conc. (open symbol) was calculated by: fBA = (CEsample − CEpre-BA) /(CEmax. post- BA − CEpre-BA) over sampling time in wells 36BR-A, 73BR-D2,and 71BR-C.
72 K.M. Révész et al. / Journal of Contaminant Hydrology 156 (2014) 62–77
follows: Dehalococcoides and vcrA gene ~104–105/L; Geobacterand SRB ~104–106/L; and methanogens were typically belowthe limit of detection, but sometimes up to 103/L. An exceptionwas at 71BR-C, which appeared to have naturally (pre- BA)higher abundances of Dehalococcoides and vcrA at ~106/L, aswell as a higher abundance of methanogens ~104/L.
The most dramatic changes were observed betweensamples collected just prior to the BA and samples collectedduring the 2 weeks following initiation of the experiment(Fig. 9). Immediately after the injection of amendments inwell 36BR-A, a sharp increase (several orders of magnitude)was detected in the concentrations of all groups of microor-ganisms targeted by the assay, reflecting the addition of thedechlorinating culture. Dehalococcoides and vcrA gene-bearingDehalococcoides increased to 108–1010 bacteria/L similar towhat was found by Lee et al. (2008); Courbet et al. (2011), andpeaked around 12/2009. Themethanogens also peaked aroundthis time. The Geobacter abundances peaked at ~1010/L in lateNovember 2008 (Fig. 9).
There appeared to be a smaller impact of the BA in 73BR-D2,18 m away from the main injection well. The concentrationof all five microbial groups increased above their pre-BAconcentrations, but not as high as in well 36BR-A post-BA.Dehalococcoides and vcrA gene-bearing Dehalococcoides in-creased 2 orders of magnitude to about 107/L. The vcrA generemained high throughout the monitoring period, whileDehalococcoides decreased to nearly the pre-BA levels of 105/Lby September 2010. Geobacter showed a steep increase in thefirst few weeks post-BA, similar to that observed in 36BR-A,then fluctuated but never returned to pre-BA levels. Themethanogens peaked around March 2010 after several fluctu-ations (Fig. 9).
In 71BR-C, 30 m from the injection well, there was nodifference in the concentration of the microbial groupsmonitored before and 2 weeks after the BA. This indicatesthat the microorganisms were at the pre-BA level during thattime period. Although there was an increase in the concen-tration of Geobacter, Dehalococcoides, and vcrA in November2008, these abundances fluctuated over time, which makes itdifficult to evaluate the significance. The highest abundanceof dechlorinators, Dehalococcoides and vcrA- containingorganisms, was also observed in the 12/2009 samples. Themethanogen were gradually rising and peaked aroundJanuary 2010 (Fig. 9).
The immediate increases post-injection in 36BR-A and73BR-D2 are assumed to be from the KB-1® injection alone,as indigenous communities would not have had time to beimpacted by the injected electron donor material. Over time,the fluctuations in abundances can be viewed as a combina-tion of the KB-1® microorganisms and the natural commu-nities' responses to BA. The microbial data indicate that thestrongest BA impact was observed at the injection site asexpected; a smaller but substantial impact was observed at73BR-D2, to which the BA amendments were pushed duringinjection; and a still smaller, and delayed, response wasobserved at 71BR-C. This is consistent with the results of boththe δ113CCE and δ2HH2O data.
The ability to degrade TCE is more widespread in microor-ganisms than the ability to degrade cis-DCE or VC. This firststep is also energetically more favorable, and it is notuncommon therefore to observe cis-DCE accumulation in
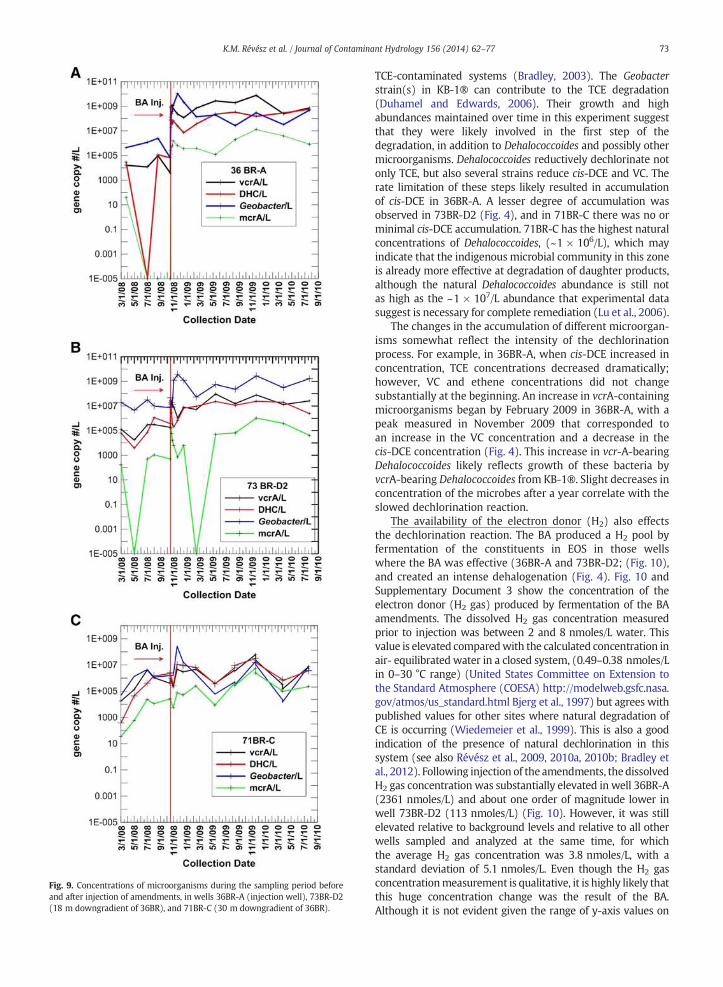
Fig. 9. Concentrations of microorganisms during the sampling period beforeand after injection of amendments, in wells 36BR-A (injection well), 73BR-D2(18 m downgradient of 36BR), and 71BR-C (30 m downgradient of 36BR).
73K.M. Révész et al. / Journal of Contaminant Hydrology 156 (2014) 62–77
TCE-contaminated systems (Bradley, 2003). The Geobacterstrain(s) in KB-1® can contribute to the TCE degradation(Duhamel and Edwards, 2006). Their growth and highabundances maintained over time in this experiment suggestthat they were likely involved in the first step of thedegradation, in addition to Dehalococcoides and possibly othermicroorganisms. Dehalococcoides reductively dechlorinate notonly TCE, but also several strains reduce cis-DCE and VC. Therate limitation of these steps likely resulted in accumulationof cis-DCE in 36BR-A. A lesser degree of accumulation wasobserved in 73BR-D2 (Fig. 4), and in 71BR-C there was no orminimal cis-DCE accumulation. 71BR-C has the highest naturalconcentrations of Dehalococcoides, (~1 × 10⁶/L), which mayindicate that the indigenous microbial community in this zoneis already more effective at degradation of daughter products,although the natural Dehalococcoides abundance is still notas high as the ~1 × 10⁷/L abundance that experimental datasuggest is necessary for complete remediation (Lu et al., 2006).
The changes in the accumulation of different microorgan-isms somewhat reflect the intensity of the dechlorinationprocess. For example, in 36BR-A, when cis-DCE increased inconcentration, TCE concentrations decreased dramatically;however, VC and ethene concentrations did not changesubstantially at the beginning. An increase in vcrA-containingmicroorganisms began by February 2009 in 36BR-A, with apeak measured in November 2009 that corresponded toan increase in the VC concentration and a decrease in thecis-DCE concentration (Fig. 4). This increase in vcr-A-bearingDehalococcoides likely reflects growth of these bacteria byvcrA-bearing Dehalococcoides from KB-1®. Slight decreases inconcentration of the microbes after a year correlate with theslowed dechlorination reaction.
The availability of the electron donor (H2) also effectsthe dechlorination reaction. The BA produced a H2 pool byfermentation of the constituents in EOS in those wellswhere the BA was effective (36BR-A and 73BR-D2; (Fig. 10),and created an intense dehalogenation (Fig. 4). Fig. 10 andSupplementary Document 3 show the concentration of theelectron donor (H2 gas) produced by fermentation of the BAamendments. The dissolved H2 gas concentration measuredprior to injection was between 2 and 8 nmoles/L water. Thisvalue is elevated comparedwith the calculated concentration inair- equilibrated water in a closed system, (0.49–0.38 nmoles/Lin 0–30 °C range) (United States Committee on Extension tothe Standard Atmosphere (COESA) http://modelweb.gsfc.nasa.gov/atmos/us_standard.html Bjerg et al., 1997) but agrees withpublished values for other sites where natural degradation ofCE is occurring (Wiedemeier et al., 1999). This is also a goodindication of the presence of natural dechlorination in thissystem (see also Révész et al., 2009, 2010a, 2010b; Bradley etal., 2012). Following injection of the amendments, thedissolvedH2 gas concentration was substantially elevated in well 36BR-A(2361 nmoles/L) and about one order of magnitude lower inwell 73BR-D2 (113 nmoles/L) (Fig. 10). However, it was stillelevated relative to background levels and relative to all otherwells sampled and analyzed at the same time, for whichthe average H2 gas concentration was 3.8 nmoles/L, with astandard deviation of 5.1 nmoles/L. Even though the H2 gasconcentrationmeasurement is qualitative, it is highly likely thatthis huge concentration change was the result of the BA.Although it is not evident given the range of y-axis values on
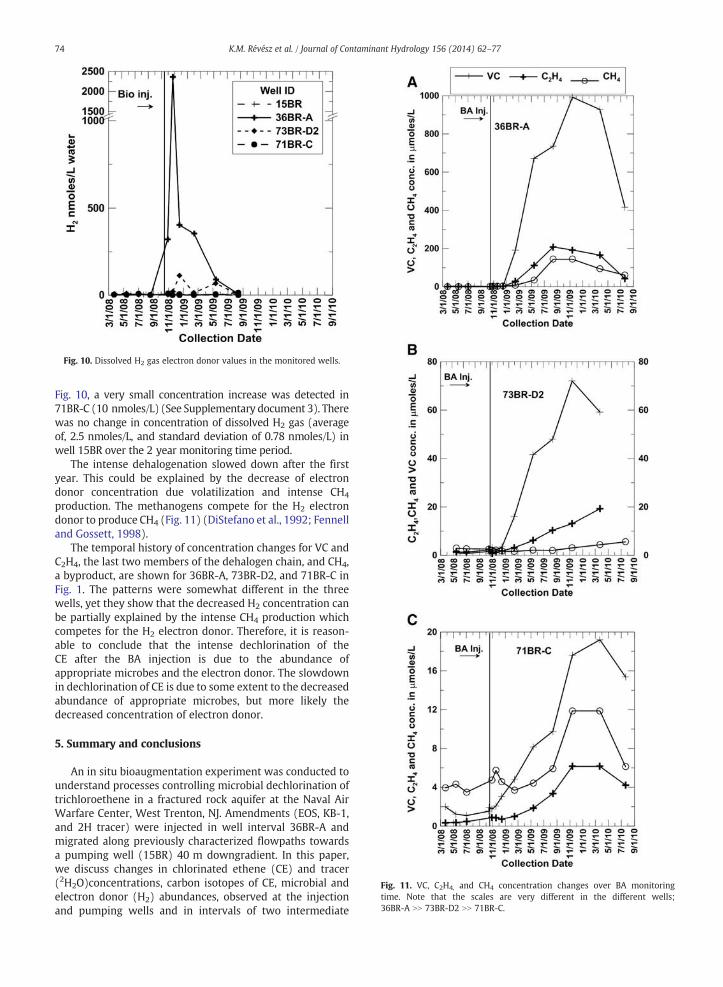
Fig. 10. Dissolved H2 gas electron donor values in the monitored wells.
Fig. 11. VC, C2H4, and CH4 concentration changes over BA monitoringtime. Note that the scales are very different in the different wells;36BR-A NN 73BR-D2 NN 71BR-C.
74 K.M. Révész et al. / Journal of Contaminant Hydrology 156 (2014) 62–77
Fig. 10, a very small concentration increase was detected in71BR-C (10 nmoles/L) (See Supplementary document 3). Therewas no change in concentration of dissolved H2 gas (averageof, 2.5 nmoles/L, and standard deviation of 0.78 nmoles/L) inwell 15BR over the 2 year monitoring time period.
The intense dehalogenation slowed down after the firstyear. This could be explained by the decrease of electrondonor concentration due volatilization and intense CH4
production. The methanogens compete for the H2 electrondonor to produce CH4 (Fig. 11) (DiStefano et al., 1992; Fennelland Gossett, 1998).
The temporal history of concentration changes for VC andC2H4, the last two members of the dehalogen chain, and CH4,a byproduct, are shown for 36BR-A, 73BR-D2, and 71BR-C inFig. 1. The patterns were somewhat different in the threewells, yet they show that the decreased H2 concentration canbe partially explained by the intense CH4 production whichcompetes for the H2 electron donor. Therefore, it is reason-able to conclude that the intense dechlorination of theCE after the BA injection is due to the abundance ofappropriate microbes and the electron donor. The slowdownin dechlorination of CE is due to some extent to the decreasedabundance of appropriate microbes, but more likely thedecreased concentration of electron donor.
5. Summary and conclusions
An in situ bioaugmentation experiment was conducted tounderstand processes controlling microbial dechlorination oftrichloroethene in a fractured rock aquifer at the Naval AirWarfare Center, West Trenton, NJ. Amendments (EOS, KB-1,and 2H tracer) were injected in well interval 36BR-A andmigrated along previously characterized flowpaths towardsa pumping well (15BR) 40 m downgradient. In this paper,we discuss changes in chlorinated ethene (CE) and tracer(2H2O)concentrations, carbon isotopes of CE, microbial andelectron donor (H2) abundances, observed at the injectionand pumping wells and in intervals of two intermediate
75K.M. Révész et al. / Journal of Contaminant Hydrology 156 (2014) 62–77
wells, 73BR (18 m downgradient from 36BR) and 71BR(30 m downgradient).
The carbon isotopes of TCE clearly show that enhancedbiodegradation occurred in wells 36BR-A, 73BR-D2, and71BR-C. The temporal history of δ13C changes of all thedifferent CE compounds indicates that the largest isotopechanges occurred in well 36BR-A, followed by 73BR-D2, andthe smallest but still measurable isotopic changes occurred inwell 71BR-C; there was no change in the pumping well, 15BR.These isotope changes correspond well with the concentra-tion changes of the different degradation products.
The sum of the post-BA molar CE concentrations wassubstantially higher than that of the sum of the pre-BA molarconcentrations in those wells where the BA was mosteffective. This could be explained by the mobilization of TCEfrom the rock matrix by, for example, diffusion and desorp-tion, into the wellbore due to the concentration gradientcreated after enhanced degradation of TCE following theintroduction of the amendments. The concentration ratiosof TCE/(cis-DCE + VC) indicate that the majority of theincreased CE concentration may be from surrounding, less-degraded TCE. This TCE may have originated in the rockmatrix and migrated into packed-off intervals of the boreholeby back diffusion or by other processes.
The δ13CCE calculated by isotopemass balancewas enrichedin 13C for a limited time, indicating that the dehalogenationprocess progressed past the dehalogenation of VC. This wasdemonstrated also by the increased ethene concentration inwell 36BR-A from 0 to 178 μmoles/L, in well 73BR-D2 from 0 to12.1 μmoles/L, and in well 71BR-C from 0.80 to 5.70 μmoles/L.
Breakthrough of the tracer (δ2HH2O) occurred atdowngradient wells 73BR-D2 and 71BR-C; there was nochange in the pumped well, 15BR. The concentration historyof the tracer in 36BR and 73BR-D2 indicates that advection isan important transport process affecting concentrations inthese wells. Although changes in the tracer concentrationsover time (dδ2H/dt) at these wells show some similarities tothe concentration changes of CE (dCCE/dt), dδ2H/dt cannot beused to quantify the dCCE/dt because the concentration of CEdepends on different parameters (absorption, degradation,etc.) than that of the δ2HH2O.
Increases in microbial abundances of Dehalococcoides,vcrA gene, and Geobacter were largest at 36BR-A (approxi-mately three orders of magnitude), followed by 73BR-D2.Well 71BR-C did not show any immediate increases, buta month after injection, we observed small increases inDehalococcoides, vcrA gene, and Geobacter, followed byfluctuations, including an increase in dechlorinators inDecember 2009. In 36BR-A and 73BR-D2 cis-DCE accumula-tion was observed because microorganisms that are capableof the first step in the degradation of TCE (such as Geobacter,which is in high concentration,) outpace the latter steps thatcan only be performed by Dehalococcoides.
The dissolved H2 gas, the electron donor produced byfermentation of EOS, and the microbial abundances substan-tially increased shortly after the injection of amendments,causing intensive dechlorination in both 36BR-A and 73BR-D2.The H2 concentration started to decrease and reached thepre-BA level over the monitoring period. The microbialconcentrations, however, never decreased to the pre-BA level.Therefore, we conclude that the lack of electron donor probably
was a major limiting factor on the effectiveness of the BA overtime. This hypothesis is supported by evidence for a methan-ogenic reaction, which competes for the same electron donor(H2), and coincides with the slowed BA effect.
The integrated use of multiple lines of evidence forbiodegradation was essential for monitoring remediation ofa complex fractured bedrock system. Long term generalconclusion regarding bioaugmentation in fractured rockhydrogeology can be drawn this study.
1) For understanding BA in a fractured-rock aquifer, it isessential to first rigorously characterize the flow pathalong which the BA will be monitored.
2) The effect of the BA was most pronounced in the injectionwell and in the first downgradient well to which theamendments were pushed during the injection proce-dure. Only a subtle effect was observed in the second welldowngradient (71BR-C). This suggests that the successof BA is highly dependent on the effectiveness of thedelivery of these amendments into the fractured rockenvironment. As this can be difficult to predict, thenecessity of multiple lines of monitoring evidence areeven more important.
3) Injection of BA amendments can substantially reduce CEconcentrations not only in the specific wells receiving theamendments and in fractures hydraulically connected tothese wells but also, as a result of concentration gradientsthat arise, can likely cause decreases in concentrations inthe rock matrix around these wells.
4) Availability of electron donors may have been a limitingfactor for intensive dehalogenation over time. This wasevident in the decrease in H2 concentration over time,which approached the original pre-BA levels after about1 year.
5) Because TCE degrades to VC, which is more toxic than TCE,the sum of CE and the weighted sum of 13C of CE needs tobe monitored to determine whether the dechlorinationhas progressed past the dehalogenation of VC.
6) Monitoring of the carbon stable isotope signaturesand concentrations of CE, the microbial population, andelectron-donor concentration during the pre- and post-BA periods is essential for comparative purposes and forestablishing the effectiveness of the BA.
Acknowledgments
We thank L. N. Plummer, T.B. Coplen and M. DeFlaun theirconstructive comments on this work. This project wassupported by the U.S. Department of Defense StrategicEnvironmental Research and Development Program (SERDPER-1555), the U.S. Navy, and the U.S. Geological Survey(USGS) Toxic Substances Hydrology Program. The CSIAresults were funded by the Natural Sciences and EngineeringResearch Council of Canada (NSERC) Discovery and StrategicGrants to Barbara Sherwood Lollar, and the hydrogen isotopestudies on water and dissolved gas were supported by theUSGS National Research Program. Any use of trade, product orfirm names is for descriptive purposes only and does notimply endorsement by the U.S. Government.
76 K.M. Révész et al. / Journal of Contaminant Hydrology 156 (2014) 62–77
Appendix A. Supplementary data
Supplementary data to this article can be found online athttp://dx.doi.org/10.1016/j.jconhyd.2013.10.004.
References
Anderson, R.T., et al., 1998. Anaerobic benzene oxidation in the Fe(III) reductionzone of petroleum-contaminated aquifers. Environ. Sci. Technol. 32,1222–1229.
Ballapragada, B.S., et al., 1997. Effect of hydrogen on reductive dechlorina-tion of chlorinated ethenes. Environ. Sci. Technol. 31, 1728–1734.
Becker, M.W., Coplen, T.B., 2001. Use of deuterated water as a conservativeartificial ground water tracer. Hydrogeol. J. 9, 512–516.
Bjerg, P.L., Jakobsen, R., Bay, H., Rasmussen, M., Albrechtsen, H.-J., Christensen,T.H., 1997. Effects of sampling well construction on H2 measurementsmade for characterization of redox conditions in a contaminated aquifer.Environ. Sci. Technol. 31, 3029–3031.
Borden, Robert, 2007a. Effective distribution of emulsified edible oil forenhanced anaerobic bioremediation. J. Contam. Hydrol. 94 (1–2), 1–12.
Borden, Robert, 2007b. Concurrent bioremediation of perchlorate and 1, 1,1-trichloroethane in an emulsified oil barrier. J. Contam. Hydrol. 94 (1–2),13–33.
Borden, R.C., Beckwith, W.J., Lieberman, M.T., Akladiss, N., Hill, S.R., 2007.Enhanced anaerobic bioremediation of a TCE source at the Tarheel ArmyMissile Plant using EOS. Remediat. J. 17 (3), 5–19.
Bradley, Paul, 2003. History and ecology of chloroethene biodegradation:a review. Biorem. J. 7 (2), 81–109.
Bradley, P.M., Lacombe, P.J., Imbrigiotta, T.E., Chapelle, F.H., Goode, D.J., 2009.Flowpath independent monitoring of reductive dechlorination potentialin a fractured rock aquifer. Ground Water Monit. Remediat. 29, 46–55.
Bradley, P.M., Journey, C.A., Kirshtein, J.D., Voytek, M.A., Lacombe, P.J.,Imbrigiotta, T.E., Chapelle, F.H., Tiedeman, C.R., Goode, D.J., 2012. Enhanceddichloroethene biodegradation in fractured rock under biostimulated andbioaugmented conditions. Remediat. J. 22, 21–32.
Bunge, S., Volger, H., Al-Fahti, Lechner, U., 2001. Absr. Annu. Meet. GermanSoc. Gen. Appl. Mirobiol. 64 (Abstract PSA17).
Busenberg, E., Plummer, N.L., Doughten, M.W., Widman, P.K., Bartholomay,R.C., 2000. Chemical and isotopic composition and gas concentrationsof ground water and surface water from selected sites at and nearthe Idaho National Engineering and Environmental Laboratory. Idaho1994–97, 51.
Chapelle, F.H., Lacombe, P.J., Bradley, P.M., 2012. Estimated trichloroethenetransformation rates due to naturally occurring biodegradation in afractured rock aquifer. Remediat. J. 22, 7–20.
Chartrand, M.G., Morrill, P.L., Sherwood Lollar, B., 2005. Stable isotopeevidence for biodegradation of chlorinated ethenes at a fracturedbedrock site. Environ. Sci. Technol. 39, 4848–4856.
Chan, W.W.M., 2010. Characterization of reductive dehalogenases in achlorinated ethene-degrading bioaugmentation culture (unpublishedmaster's thesis). University of Toronto.
Coplen, Tyler, 2011. Guidelines and recommended terms for expression ofstableisotope ratio and gas-ratio measurement results. Rapid Commun.Mass Spectrom. 25, 2538–2560.
Courbet, C., Rivière, A., Jeannottat, S., Rinaldi, S., Hunkeler, D., Bendjoudi, H.,De Marsily, G., 2011. Complementing approaches to demonstratechlorinated solvent biodegradation in a complex pollution plume. Massbalance, PCR and compound-specific stable isotope analysis. J. Contam.Hydrol. 126, 315–329.
DeFlaun, M.F., Drew, S., Dale, J., Lacombe, P., Schauble, P., 2006. Applicationof bioaugmentation for TCE DNAPL in fractured bedrock. In: Sass, B.M.(Ed.), Fifth International Conference on Remediation of Chlorinated andRecalcitrant Compounds, Monterey, California, May 22-25, Columbus,Ohio, Battelle Press, (CD ROM).
DiStefano, T.D., Gossett, J.M., Zinder, S.H., 1992. Hydrogen as an electrondonor for dechlorination of tetrachloroethene by an anaerobic mixedculture. Appl. Environ. Microbiol. 58, 3622–3629.
Duhamel, M., Edwards, E., 2006. Microbial composition of chlorinated ethene-degrading cultures dominated by Dehalococcoides. FEMS Microbiol. Ecol.58, 538–549.
Fayolle-Guichard, F., Durand, J., Cheucle, M., Rosell, M., Michelland, R.J., Tracol,J.P., Le Roux, F., Grundman, G., Atteia, O., Richnow, H.H., Dumestre, A., Benoit,Y., 2012. Study of an aquifer contaminated by ethyl-butyl ether (ETBE): sitecharacterization and on-site bioremediation. J. Hazard. Mater. 201–202,236–243.
Fennell, D.E., Gossett, J.M., 1998. 1998, Modeling the production of andcompetition for hydrogen in a dechlorinating culture. Environ. Sci. Technol.32 (16), 2450–2460.
Galimov, E.M., 1987. The Biological Fractionation of Isotopes. AcademicPress, Orlando, FL.
Geets, J.B., Diels, L., Springael, D., Vangronsveld, J., van der Lelie, D.,Vanbroekhoven, K., 2006. DsrB gene-based DGGE for community anddiversity surveys of sulfate-reducing bacteria. J. Microbiol. Methods 66(2), 194–205.
Goode, D.J., Tiedeman, C.R., Lacombe, P.J., Imbrigiotta, T.E., Shapiro, A.M.,Chapelle, F.H., 2007. Contamination in Fractured-Rock Aquifers—Research at the Former Naval Air Warfare Center, West Trenton, NewJersey. Fact Sheet 2007–3074, p. 2.
Goode, D.J., Imbrigiotta, T.E., Lacombe, P.J., Shapiro, A.M., Tiedeman, C.R.,2008. Distribution of Trichloroethene in a Fractured-Rock Aquifer:Detection of Pure Phase, Core Measurements, Diffusion Into Boreholes,and Implications for Pump-and-Treat Remediation. Abstract in Proc.Partners In Environmental Technology Technical Symposium andWorkshop, Washington, D.C., December 2-4.
Gossett, James, 1987. Measurement of Henry's law constant for C1 and C2chlorinated hydrocarbons. Environ. Sci. Technol. 21, 202–208.
Holmes, D.E., Finneran, K.T., O'Neil, R.A., Lovley, D.R., 2002. Enrichmentof members of the family Geobacteraceae associated with stimulationof dissimilatory metal reduction in uranium-contaminated aquifersediments. Appl. Environ. Microbiol. 68 (5), 2300–2306.
Hunkeler, D., Aravena, R., Butler, B., 1999. Monitoring microbial dechlorinationof tetrachloroethene (PCE) in groundwater using compound-specificstable carbon isotope ratios: microcosm and field studies. Environ. Sci.Technol. 33, 2733–2738.
Hunkeler, D.Y., Abe, Y., Broholm, M.M., Jeannottat, S., Westergaard, C., Jacobsen,C.S., Aravena, R., Bjerg, P.L., 2011. Assessing chlorinated ethene degradationin a large scale contaminant plume by dual carbon–chlorine isotopeanalysis and quantitative PCR. J. Contam. Hydrol. 119 (1–4), 69–79.
Ibbinia, J., Santharamb, S., Davis, L., Erickson, L., 2010. Laboratory and fieldscale bioremediation of tetrachloroethene (PCE) contaminated ground-water. Jordan J. Mech. Ind. Eng. 4 (1), 35–44.
Imbrigiotta, T.E., Drew, S.R., DeFlaun, M.F., Kirshtein, J.D., Voytek, M.A.,Goode, D.J., Tiedeman, C.R., Shapiro, A.M., Lacombe, P.J., 2011. Changes inChlorinated Ethene Concentrations, Geochemistry, and Microbiologydue to Bioaugmentation in a Fractured Sedimentary Rock Aquifer at theFormer NAWC, West Trenton, NJ, 2008–2011. Abstract in Proc. Partnersin Environmental Technology Technical Symposium and Workshop,Washington, D.C., November 29 - December 1.
Jendrzejewski, N., Eggenkamp, H.G.M., Colman, M.L., 2001. Characterizationof chlorinated hydrocarbons from chlorine and carbon isotopic compo-sitions: scope of application to environmental problems. Appl. Geochem.16 (9–10), 1021–1031.
Lacombe, Pierre, 2000. Hydrogeologic framework, water levels, andtrichloroethene contamination, Naval Air Warfare Center, West Trenton,New Jersey. U.S. Geological Survey Water- Resources InvestigationsReport, 98-4167, p. 139.
Lacombe, P.J., Burton, W.C., 2010. Hydrogeologic framework of fracturedsedimentary rock, Newark Basin, New Jersey. Ground Water Monit.Remediat. 30, 35–45.
Lacombe, Pierre, 2011. Mass of Chlorinated Volatile Organic CompoundsRemoved by Pump-and-Treat, Naval Air Warfare Center, West Trenton,New Jersey, 1996–2010. U.S. Geological Survey Scientific InvestigationsReport 2011–5003, p. 48.
Lieberman, M.T., Lindow, N.L., Borden, R.C., Birk, G.M., 2003. AnaerobicBiodegradation and Biotransformation Using Emulsified Edible Oil. In:Calabrese, E.J., Kostecki, P.T., Dragun, J. (Eds.), Contaminated soils,sediments and water: Science in the real World, 32, pp. 9.485–9.500.Chapter.
Lee, P.K.H., Macbeth, T.W., Sorenson Jr., K.S., Deeb, R.A., Varez-Cohen, L.,2008. Quantifying genes and transcripts to assess the in-situ physiologyof Dehalococcoides spp. in a thrichloroethene-contaminated groundwa-ter site. Appl. Environ. Microbiol. 74, 2718–2739.
Lee, I.S., Bae, J.H., McCarty, P.L., 2007. Comparison between acetate andhydrogen gas as electron donors and implications for reductivedehalogenation of PCE and TCE. Contam. Hydrol. 94, 76–85.
Leming, G., Hauschild, M.Z., Chambin, J., Binning, P.J., Bulle, C., Margni, M.,Bjerg, P.L., 2010. Environmental impacts of remediation of trichloroethene-contaminated site: life cycle assessment of remediation alternatives.Environ. Sci. Technol. 44, 9163–9169.
Lewis-Brown, J.C., Carleton, G.B., Imbrigiotta, T.E., 2006. Hydraulic andSolute-Transport Properties and Simulated Advective Transport ofContaminated Ground Water in a Fractured-Rock Aquifer at the NavalAir Warfare Center, West Trenton, New Jersey, 2003. U.S. GeologicalSurvey Scientific Investigations Report 2005-5049, p. 32.
77K.M. Révész et al. / Journal of Contaminant Hydrology 156 (2014) 62–77
Lu, X., Wilson, J.T., Kampbell, D.H., 2006. Relationship between DehalococcoidesDNA in ground water and rates of reductive dechlorination at field scale.Water Res. 40, 3131–3140.
Luton, P.E., Wayne, J.M., Sharp, R.J., Riley, P.W., 2002. The mcrA gene as analternative to 16S rRNA in the phylogenetic analysis of methanogenpopulations in landfill. Microbiology 148, 3521–3530.
McCarty, Perry, 1997. Breathing with chlorinated solvents. Science 276,1521–1522.
Meckenstock, R.U., Morasch, B., Griebler, C., Richnow, H.H., 2004. Stableisotope fractionation analysis as a tool to monitor biodegradation incontaminated aquifer. J. Contam. Hydrol. 75, 215–255.
Middeldorp, P.J.M., Maurice, L.G.C., Luijten, Bram A., van de Pas, Miriam H.A.,van Eekert, Servé W.M., Kengen, Gosse Schraa, Alfons, J.M., 1999. Stamsanaerobic microbial reductive dehalogenation of chlorinated ethenesbioremediation. Journal 3, 151–169.
Moran, M.J., Zogorski, J.S., Squillace, P.J., 2007. Chlorinated solvents ingroundwater in the United States. Environ. Sci. Technol. 41, 74–81.
Morrill, P.L., Sleep, B.E., Seepersad, D.J., McMaster, M.L., Hood, E.D., LeBron, C.,Major, D.W., Edwards, E.A., Sherwood Lollar, B., 2009. Variations inexpression of carbon isotope fractionation of chlorinated ethenes duringbiologically enhanced PCE dissolution close to a source zone. J. Contam.Hydrol. 110, 60–71.
Peale, J.G.D., Bakkom, E., Lakhwala, F., Mueller, J., Molin, J., 2008. TCE plumeremediation via ISCR-enhanced bioremediation utilizing EHC® and KB-1®. Remediat. J. 18 (4), 19–31.
Peale, J.G.D., Mueller, J., Molin, J., 2010. Successful ISCR enhanced bioremediationof a TCE DNAPL source utilizing EHC® and KB 1®. Remediat. J. 20 (3), 63–81.
Révész, K.M., Coplen, T.B., 2007. Determination of the δ(2H/1H) of water. RSILlab code 1574, chap. C1 of Révész, K.M., Coplen, T.B., eds., Methods of theReston Stable Isotope Laboratory. U.S. Geol. Surv. Tech. Meth. 10–C1, 27(http://pubs.usgs.gov/tm/2007/tm10c1/).
Révész, K., Shapiro, A.M., Tiedeman, C.R., Goode, D.J., 2009. Monitoring δ13C ofTCE to Evaluate Microbial Degradation, in a Fractured Sedimentary RockAquifer in New Jersey, USA. Abstract, at AIG -8 (Eight Applied IsotopeGeochemistry Symposium) La Malbaie, Quebec, Canada, August 30.
Révész, K.M., Shapiro, A.M., Imbrigiotta, T.E., 2010a. Estimating Rates of TCEDegradation and Other Processes Affecting the Fate of TCE in a FracturedSedimentary Rock Using Compound Specific Isotope Analysis. EGU (Europe-an Geosciences Union General Assembly), Vienna, Austria (May 2 – 7).
Révész, K.M., Shapiro, A.M., Tiedeman, C.R., Goode, D.J., Lacombe, P.J.,Imbrigiotta, T.E., 2010b. Monitoring Natural Biodegradation of TCE inFractured Sedimentary Rocks Using Delta 13C of TCE and its DegradationProducts: Estimating Isotopic Fractionation Factor Under Field Conditions.AGU (American Geophysical Union) Fall Meeting (December 13–17).
Ritalahti, K.M., Amos, B.K., Sung, Y., Wu, Q., Koenigsberg, S.S., Loffler, F.E.,2006. Quantitative PCR targeting 16S rRNA and reductive dehalogenasegenes simultaneously monitors multiple Dehalococcoides strains. Appl.Environ. Microbiol. 72, 2765–2774.
Scheutz, C., Durant, N., Dennis, P., Hansen,M.H., Jorgensen, T., Jakobsen, R., Bjerg,P.L., 2008. Concurrent ethene generation and growth of Dehalococcoidescontaining vinyl chloride reductive dehalogenase genes during an en-hanced reductive dechlorination field demonstration. Environ. Sci. Technol.42, 9302–9309.
Scheutz, C., Broholm, M., Durant, N., Bregtrupweeth, E., Jorgenson, T., Dennis,P., Jacobson, C., Cox, E., Chambon, J., Bjerg, P., 2010. Field evaluation ofbiological enhanced reductive dechlorination of chloroethenes in clayeytill. Environ. Sci. Technol. 44, 5134–5141.
Seagren, E.A., Rittman, B.E., Valocchi, A.J., 1993. Quantitative evaluation offlushing and biodegradation for enhancing in situ dissolution ofnonaqueous-phase liquids. J. Contam. Hydrol. 12, 103–132.
Shapiro, A.M., Tiedeman, C.R., Goode, D.J., Imbrigiotta, T.E., 2009. DesigningMonitoring Locations in Fractured Rock for Remediation Of Chloroethene
Contaminated Groundwater. Abstract in Proc. Partners in EnvironmentalTechnology Technical Symposium and Workshop, Washington, D.C.(December 1-3).
Shapiro, A.M., Goode, D.J., Tiedeman, C.R., Imbrigiotta, T.E., Lacombe, P.J.,2010. Evaluating the Removal of Trichloroethene From the Rock MatrixDuring Bioaugmentation in Fractured Rock. Proc. Partners in Environ-mental Technology Technical Symposium and Workshop, Washington,D.C. (November 30 - December 2).
Sherwood Lollar, B., Slater, G.F., Sleep, B., Witt, M., Klecka, G.M., Harkness, M.,Spivack, J., 2001. Stable carbon isotope evidence for intrinsic bioreme-diation of tetrachloroethene and trichloroethene at area 6, Dover AirforsBase. Environ. Sci. Technol. 35, 261–269.
Sherwood Lollar, B., Hirschorn, S.K., Chartrand, M.G., Lacrampe-Couloume,G., 2007. An approach for assessing total instrumental uncertainty incompound-specific carbon isotope analysis: implications for environ-mental remediation studies. Anal. Chem. 79, 3469–3475.
Slater, G.F., Dempster, H.D., Sherwood Lollar, B., Ahad, J., 1999. Headspaceanalysis: a new application for isotopic characterization of dissolvedorganic contaminants. Environ. Sci. Technol. 33, 190–194.
Slater, G.F., Sherwood Lollar, B., Sleep, B.E., Edwards, E.A., 2001. Variability incarbon isotope fractionation during biodegradation of chlorinated ethenesimplications for field applications. Environ. Sci. Technol. 35, 901–907.
Smatlak, C.R., Gossett, J.M., Zinder, S.H., 1996. Comparative kinetics ofhydrogen utilization for reductive dechlorination of tetrachloroetheneand methanogenesis in an anaerobic enrichment culture. Environ. Sci.Technol. 30, 2850–2858.
Smith, H., de Voss, V.M., 2004. Anaerobic microbial dehalogenation. Annu.Rev. Microbiol. 58, 43–73.
Song, D.L., Conrad, M.E., Sorenson, K.S., Alvarez-Cohen, L., 2002. Stablecarbon isotope fractionation during enhanced in situ biorenmediation oftrichloroethene. Environ. Sci. Technol. 36, 2262–2268.
Tiedeman, C.R., Lacombe, P.J., Goode, D.J., 2010. Multiple well-shutdowntests and site-scale flow simulation in fractured rocks. Ground Water 48(3), 401–415.
United States Committee on Extension to the Standard Atmosphere(COESA), D. http://modelweb.gsfc.nasa.gov/atmos/us_standard.html.
U.S. Department of Health Human Services, 2005a. CERCLA, Priority Listof Hazardous Substances. Agency for Toxic Substances and DiseaseRegistry, U.S. Department of Health and Human Services, Atlanta, GA.http://www.atsdr.cdc.gov/cercla/05list.htm.
U.S. Department of Health Human Services, 2005b. Report on Carcinogens,11th ed. U.S. Department of Health and Human Services, ResearchTriangle Park, NC. http://ntp.niehs.nih.gov/ntp/roc/toc11.html.
U.S. EPA, 2008. AGuide for AssessingBiodegradation andSource Identification ofOrganic Groundwater Contaminants Using CSIA. (600/R-08/148|December2008|www.epa.gov/ada).
Wagner, M., Roger, A.J., Flax, J.L., Brusseau, G.A., Stahl, D.A., 1998. Phylogenyof sulfite reductases supports an early origin of sulfate respiration. Appl.Environ. Microbiol. 180, 2975–2982.
Wiedemeier, T.H., Rifai, H.S., Newell, C.J., Wilson, J.T., 1999. Natural Attenuationof Fuels and Chlorinated Solvents. John Wiley and Sons Inc., New York.
Vogel, T.M., McCarty, P.L., 1985. Biotransformation of tetrachloroethylene totrichloroethylene, dichloroethylene, vinyl chloride, and carbon dioxideunder methanogenic conditions. Appl. Environ. Microbiol. 49, 1080–1083.
Zawtocki, 2005. Naturally cleaner groundwater-soybean based emulsion isproving to decontaminate groundwater more quickly than traditionalremediation methods. Mil. Eng. 97, 85–86.
Zenker, M.J., Borden, R.C., Barlaz, M.A., Lieberman, M.T., Lee, M.D., 2000.Insoluble Substrates for Reductive Dehalogenation in Permeable Reac-tive Barriers. In: Wickramanayake, G.B., Gvaskar, A.R., Alleman, B.C.,Magar, V.S. (Eds.), Bioremediation and Phytoremediation of Chlorinatedand Recalcitrant Compounds. Battle Press, pp. 47–53.
Copyright © 2022 FDOKUMEN